
A Remote Raman System and Its Applications for Planetary Material Studies
by
 , , and
Hongkun Qu
1, 
Zongcheng Ling
1,2,*,
Xiaobin Qi
1,
Yanqing Xin
1,
Changqing Liu
1 and
Haijun Cao
1
1
Shandong Key Laboratory of Optical Astronomy and Solar-Terrestrial Environment, School of Space Science and Physics, Institute of Space Sciences, Shandong University, Weihai 264209, China
2
Key Laboratory of Space Active Opto-Electronics Technology, Chinese Academy of Sciences, Shanghai 200083, China
*
Author to whom correspondence should be addressed.
Sensors 2021, 21(21), 6973; https://doi.org/10.3390/s21216973
Submission received: 12 September 2021
/
Revised: 4 October 2021
/
Accepted: 7 October 2021
/
Published: 21 October 2021
(This article belongs to the Section Remote Sensors)
Abstract
:A remote Raman prototype with a function of excitation energy adjusting for the purpose of obtaining a Raman signal with good signal-to-noise ratio (SNR), saving power consumption, and possibly avoiding destroying a target by high energy pulses, which may have applications for Chinese planetary explorations, has been setup and demonstrated for detecting different minerals. The system consists of a spectrograph equipped with a thermoelectrically cooled charge-coupled device (CCD) detector, a telescope with 150 mm diameter and 1500 mm focus length, and a compact 1064 nm Nd:YAG Q-switched laser with an electrical adjusted pulse energy from 0 to 200 mJ/pulse. A KTP crystal was used for second harmonic generation in a 1064 nm laser to generate a 532 nm laser, which is the source of Raman scatting. Different laser pulse energies and integration time were used to obtain distinguishable remote Raman spectra of various samples. Results show that observed remote Raman spectra at a distance of 4 m enable us to identify silicates, carbonates, sulfates, perchlorates, water/water ice, and organics that have been found or may exist on extraterrestrial planets. Detailed Raman spectral assignments of the measured planetary materials and the feasible applications of remote Raman system for planetary explorations are discussed.
1. Introduction
As a powerful spectroscopic analysis technique, Raman spectroscopy that has been applied into many geoscientific areas including mineralogy, gemology, planetary analyses and space exploration, astrobiology and biomineralization, cultural heritage and archaeometry, etc., can provide accurate and detailed molecular and structural information of Earth and planetary materials. Owing to its advantages in no sample preparations, quick and non-destructive analyses, unambiguous phase identifications, as well as low-mass and robust behaviors on the mineralogy and mineral chemistries of rock and soil samples, many Raman spectroscopic studies on returned samples [1], meteorites [2] and planetary analogues [3] have been reported.
However, almost all of these studies used traditional micro-Raman with a working distance of several centimeters or less. During planetary exploration, tools with long detective distance are desirable. In the early 1960s, remote Raman was developed and employed in the detection of gases. Kobayasi and Inaba successfully observed Raman features of SO2 and CO2 from an oil smoke plume using a remote Raman system at a distance of 20 m [4]. In 1992, Angel employed a remote Raman system to identify solid inorganics and organics such as NaNO3, NaNO2, and acetaminophen at a distance of ten meters [5]. To date, several Raman systems have been proposed for either in situ or remote detection on planetary surfaces for lander or rover exploration missions to the Moon, Mars, Venus, Europa, asteroids, etc. Remote Raman systems for planetary exploration have been established by several groups [6,7,8,9], especially by the Raman spectroscopy laboratory at the University of Hawai’i, which has a greatly improved remote Raman instrument for the application in planetary explorations [8,10,11,12,13,14,15,16,17,18,19].
Wiens et al. detailed and introduced the SuperCam Instrument Suite including remote Raman spectrometer from the aspect of optical description, mechanical and thermal description, electronics, software, operation, and model development and environmental testing [20]. They provided valuable experience on developments of a remote Raman spectrometer in the planetary science field. More importantly, the green-laser (532 nm) remote Raman system with a detecting distance of up to 12 m was employed on the SuperCam on Mars2020/NASA, which successfully landed on Mars and was used to detect olivine and brighter Raman-emitting minerals for the first time in space [21,22]. ExoMars/European Space Agency (ESA) is planning to deploy a series of complementary analytical instruments (Pasteur Payload) including the Raman laser spectrometer (RLS) [23], which holds a 532 nm continuous laser source (20 mW). RLS is designed for identifying ultramafic igneous rocks and for establishing the presence of carbon (inorganic/organic) on Mars with a 15 mm working distance. All of these demonstrate that Raman spectroscopy is a proven and trusted technology that can provide highly accurate analytical results and can be applied to planetary explorations.
Laser power is an adjustable parameter in a traditional Micro-Raman spectrometer. Using proper laser power would obtain Raman signals with good SNR, but could also protect samples from being destroyed by high laser energy. Furthermore, many dark materials need higher laser energy than bright materials to excite Raman scattering. Hence, a remote Raman system with a function of excitation energy adjusting will not only obtain Raman signals of both brightness and dark materials without burning them but also reduce power consumption, which is significant while designing missions for planetary exploration. However, a remote Raman system with a function of excitation energy adjusting has been seldomly discussed.
Based on these laboratory studies and practical planetary exploration applications related to Raman spectrometers, herein, we aim to build a remote Raman system with a function of excitation energy adjusting. During planetary explorations, using different pulse energies for different types of minerals will help obtain Raman signal with good SNR, save power consumption, and possibly avoid destroying the target by high energy pulses. Raman peaks may be shifted by the environment of exoplanets; the calibration targets (e.g., minerals, organics, and diamond) carried with the rover from Earth are necessary for remote Raman to calibrate on extraterrestrial planets. The system we built showed an ability of obtaining hydrous/anhydrous minerals, water/water ice, and organics Raman spectra of high quality, which are comparable to the remote Raman spectra obtained by other groups. China has developed several successful missions to the Moon (Chang’e 1–5) and has an ongoing mission to Mars [24] (Tianwen 1), and will have further deep space exploration missions (e.g., Chang’e 6–8). Hopefully, our remote Raman system will be a desired candidate tool for new discoveries of further Chinese planetary explorations.
2. Experimental Setup and Samples
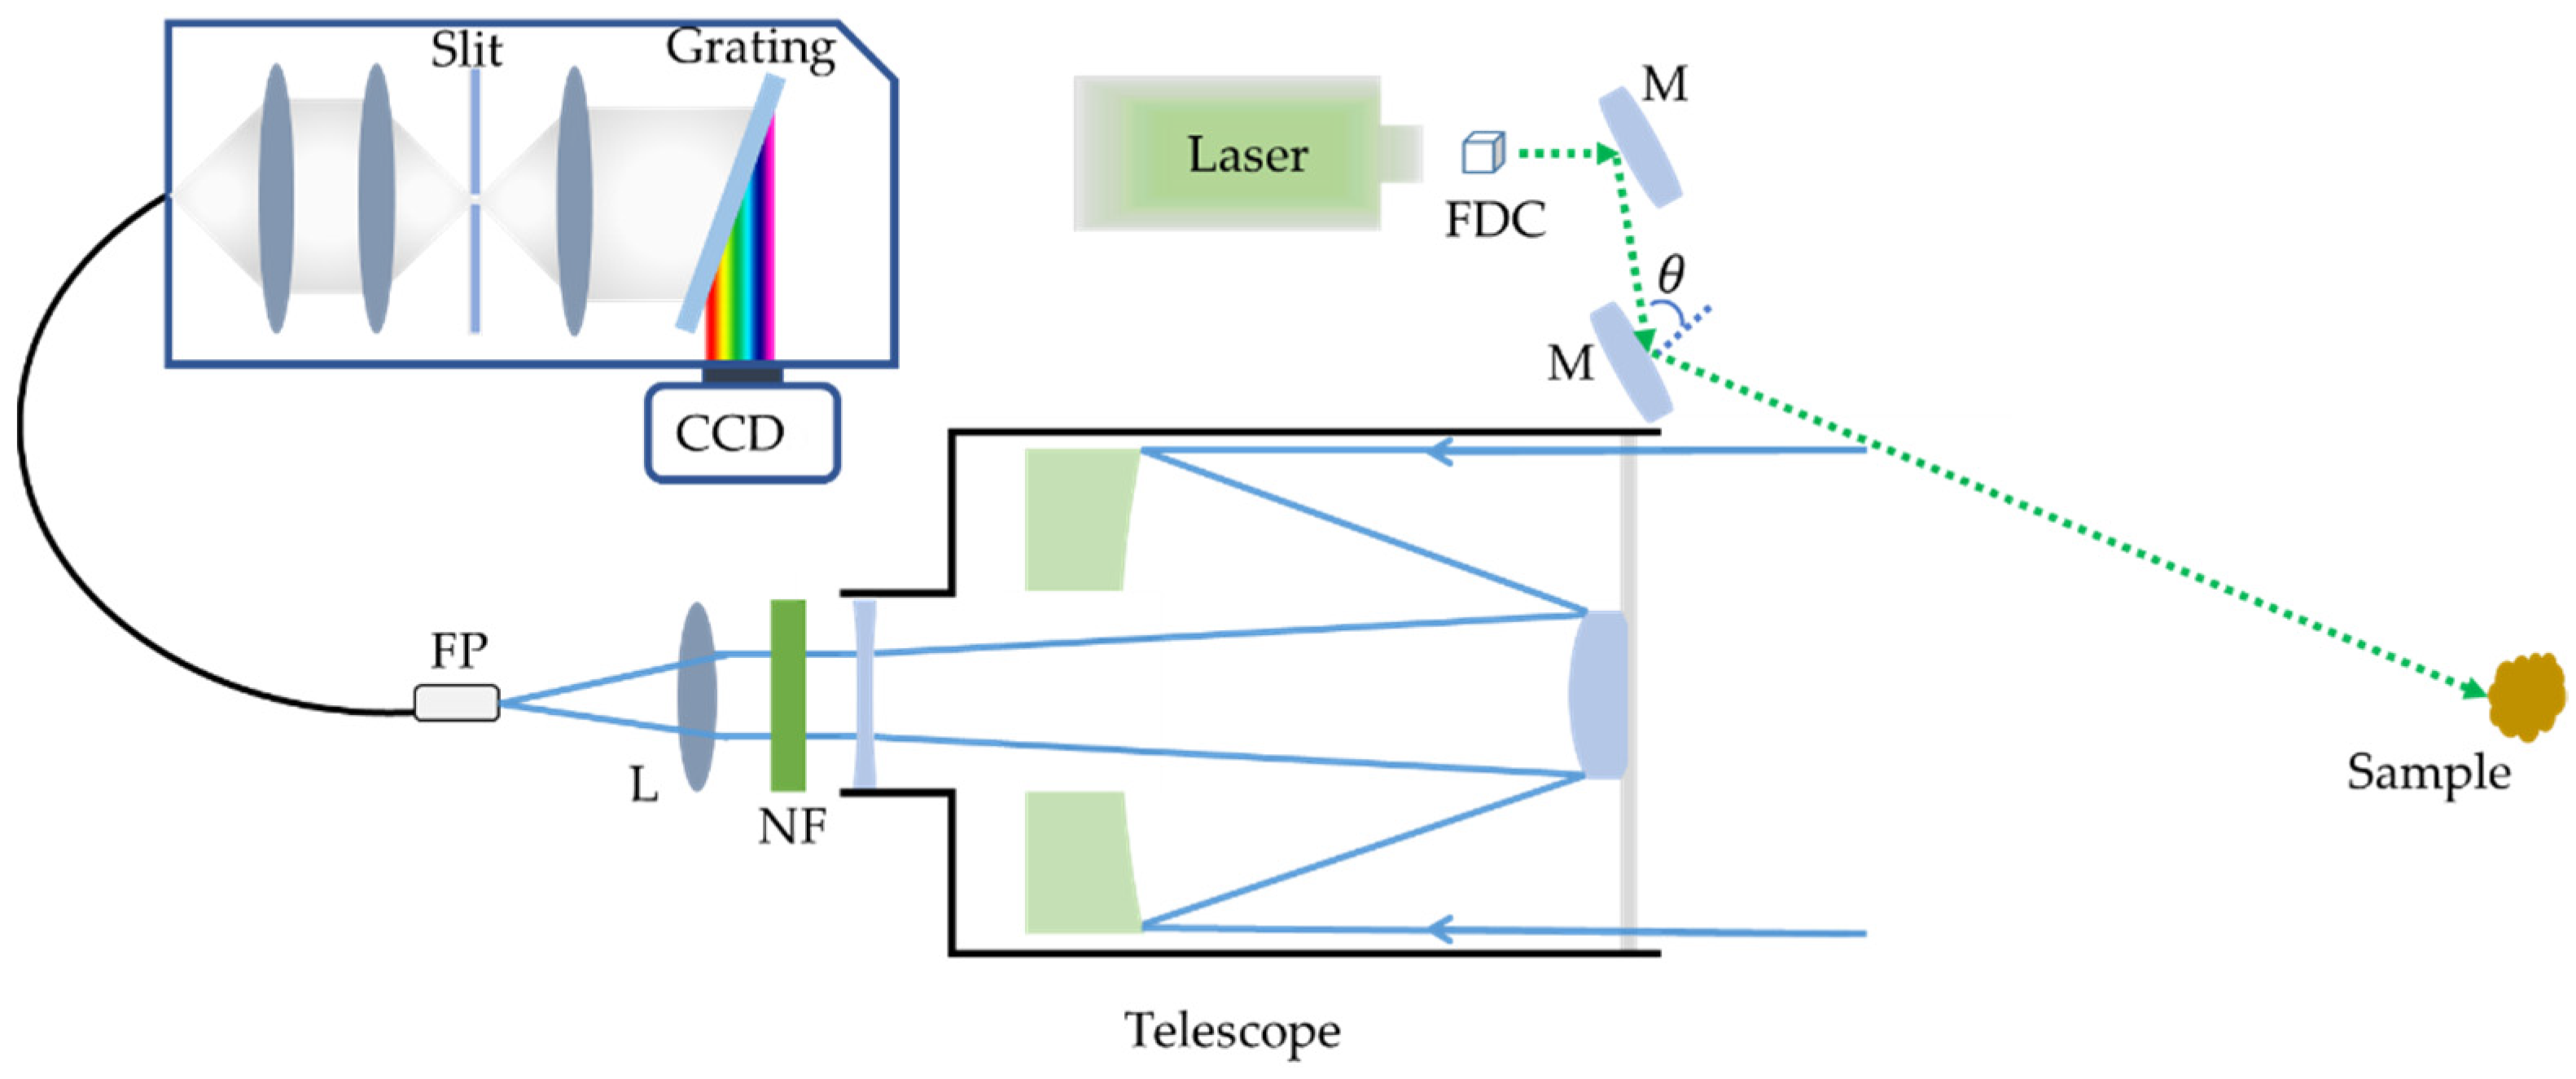
In this work, we built a remote Raman system in Shandong University using a compact Nd:YAG Q-switched laser source (Beamtech Optronics Co, Ltd. Company, Beijing, China. Dawa-200 Laser, 1064 nm, 0~200 mJ/pulse, 0~20 Hz, pulse width 9 ns, central laser spot divergence ~1 mrad, diameter ~6 mm), a spectrograph equipped with a CCD (Andor, DU416A-LDC-DD, Oxford Instruments Company, Oxford, UK) detector, and a telescope (CELESTRON NexStar 6SE, 150 mm diameter, 1500 mm focus length) shown in Figure 1. Commonly, shorter wavelength lasers will excite stronger Raman scattering because of the 1/λ4 increase in Raman scattering cross-sections; however, sample degradation or fluorescence may appear. Thus, 532 nm laser, which is generated by the second harmonic generation of 1064 nm laser using a frequency doubling crystal KTP (8 × 8 × 8 mm) with an exchange efficiency of 45–50%, was selected as the light source. The 532 nm green laser used in oblique geometry to excite Raman scattering was reflected onto samples by two 532 nm mirrors (45°). The oblique geometry delivers all the laser pulse power to the target and creates less near-field scattering at a short distance [10]. Laser spot diameter on samples, which is straight ahead of the telescope, is about 1.5 cm at a distance of 4 m. The laser energy on sample is about 0–65 mJ/pulse due to the energy loss caused by oblique geometry, which causes a larger angle of incidence (θ > 45°) shown in Figure 1.
When the laser hits the samples, Raman signal will be generated and collected by the telescope and then focused onto a fiber probe (FP) by the convex lens (L). The reflected 532 nm laser is removed by a 532 nm Notch filter (NF) fixed between the telescope and L. An optical fiber with 600 µm diameter core transferred the Raman signal into the spectrograph, in which two volume holographic gratings are employed. The spectral resolutions of the two volume holographic gratings with a 50 µm slit were 5.48 cm−1 in the wavelength region of 531–614 nm and 4.8 cm−1 in the wavelength region of 605–699 nm, respectively. Raman scattering was first focused to pass through a 50 µm slit by lens combination and then transmitted into a collimated beam by lens, finally irradiated on the volume holographic grating, which will disperse Raman scattering onto CCD. While conducting Raman scattering measurement, CCD worked in CW mode, which means the detector is “on” during the integration time. All of the Raman measurements were conducted in our lab at 4 m and 20 Hz with different pulse energies as well as different integration time in a dark environment for obtaining a better SNR.
With the purpose of testing the performance of this remote Raman system, we conducted a series of remote Raman measurements on minerals, analytical grade chemicals, deionized water, and water ice. Mineral samples (calcite, quartz, olivine, albite, K-feldspar) were collected by petrographic laboratory in Shandong University. No cutting or polishing was performed with these mineral samples. Analytical grade chemicals (e.g., epsomite (MgSO4·7H2O), KClO4, melanterite (FeSO4·7H2O), gypsum (CaSO4·2H2O), alunogen (Al2(SO4)3·18H2O), potassium nitrate (KNO3), potassium carbonate (K2CO3), NaClO4·H2O, Mg(ClO4)2·6H2O, L-Alanine, L-Phenylalanine, L-Glutamine and ethanol (C2H6O)) of analytical grade were purchased from the Sinopharm Chemical Reagent Beijing Co., Ltd. Rhomboclase (FeHSO4·4H2O) was synthesized using the method mentioned by Ling et al. [25]. We regarded these chemicals as pure samples. In order to obtain pure water ice, 70 mL deionized water held in a wide-mouth bottle of size 4.8 cm in diameter and 10.5 cm in height was placed into a freezer remaining at temperature around −20 °C for 2 h. No bubbles were found in water ice. All liquids and powder samples were measured through glass vials of size 2 cm in diameter and 5 cm in height with caps.
3. Results and Discussions
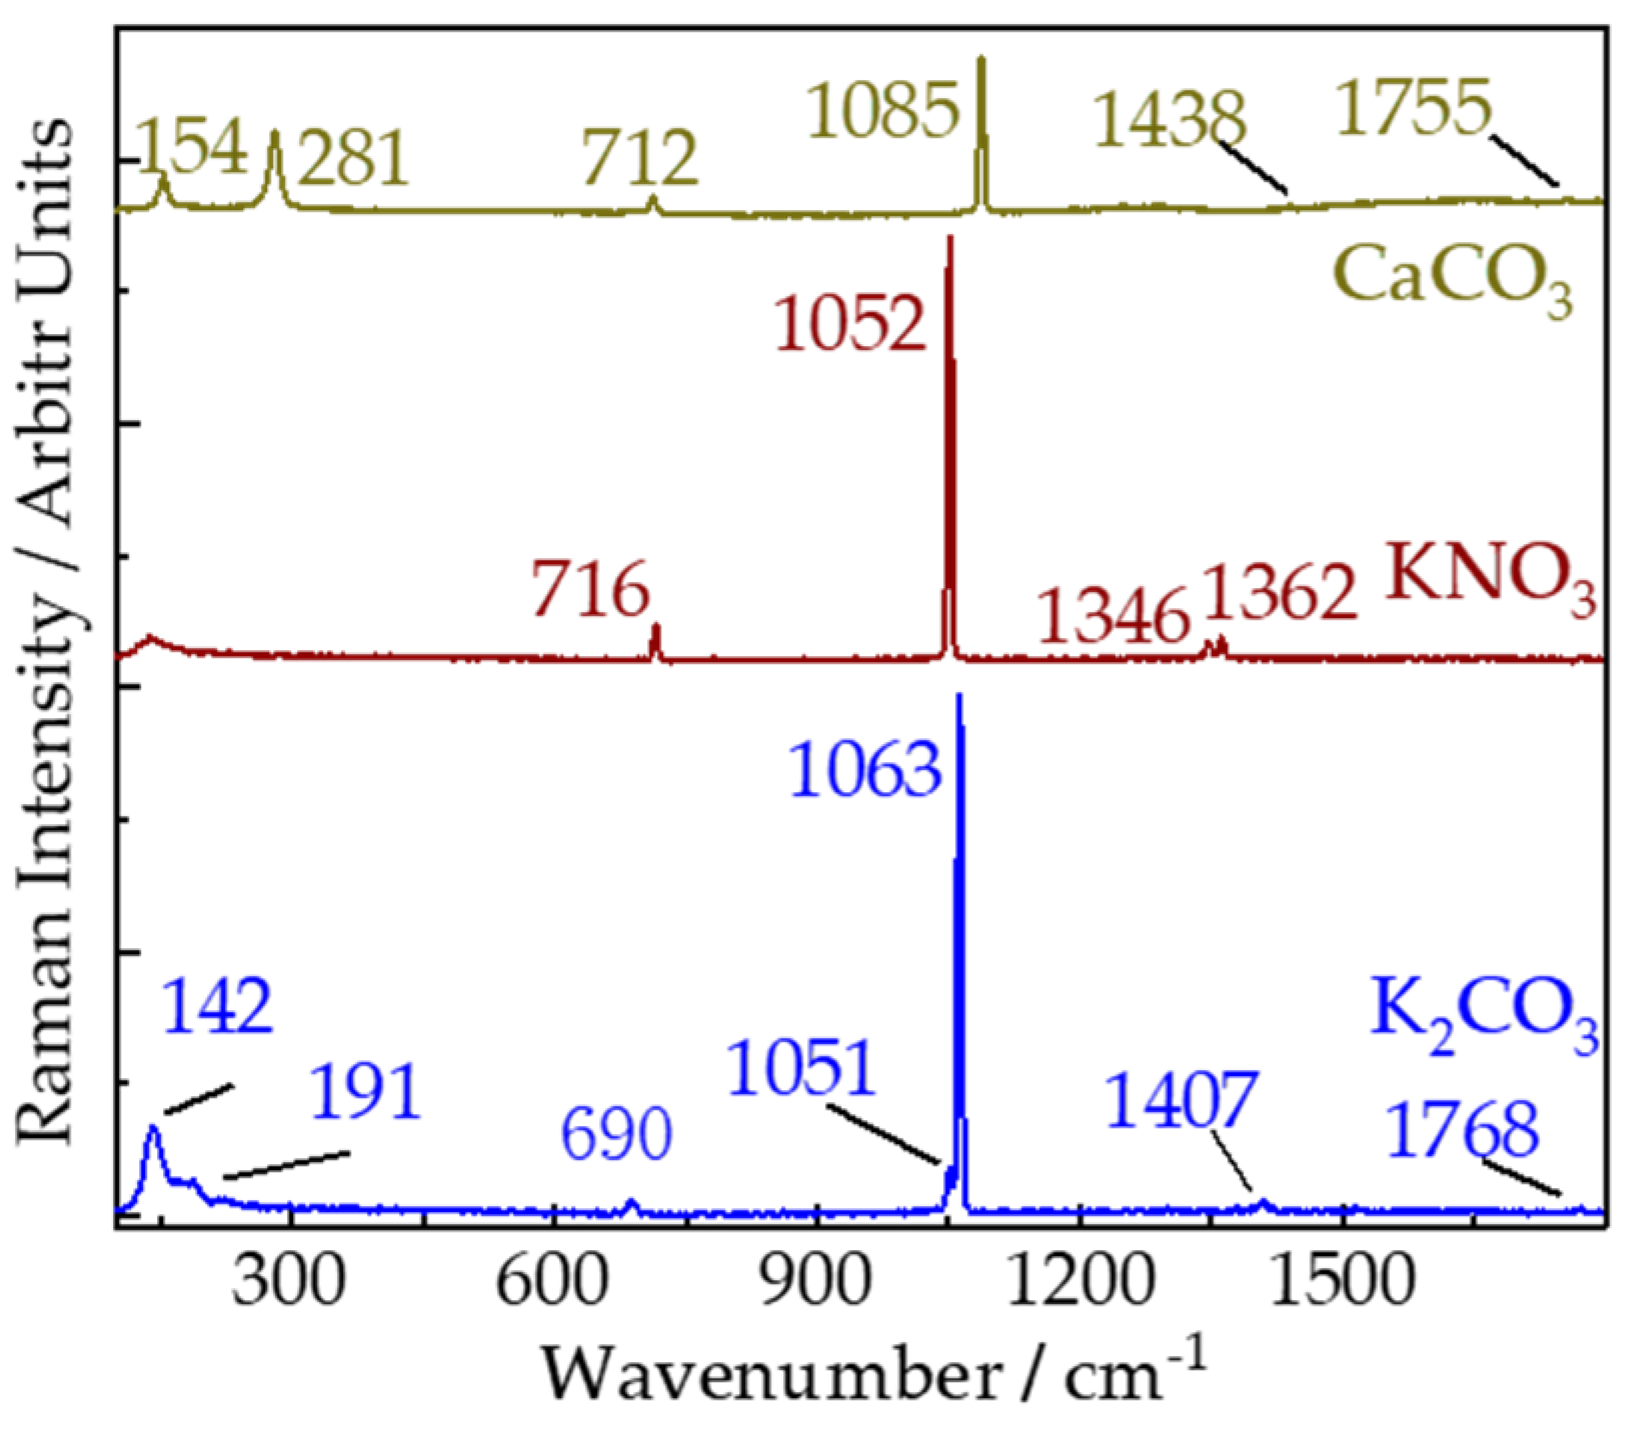
Figure 2 displays the remote Raman spectra of CaCO3, K2CO3, and KNO3 with 10 s integration time and 30 mJ/pulse laser (532 nm) incident to sample. According to previous works [26,27], Raman peaks of KNO3 in remote Raman spectrum can be identified as follows: the strongest Raman peaks 1052 cm−1 are assigned to ν1(Ag) mode of NO3−1; another Ag mode observed at 1362 cm−1 is assigned to ν3 mode of NO3−1; peak at 1346 cm−1 belongs to ν3 (B1g) mode of NO3−1; peak at 716 cm−1 is attributed to ν4 (Ag + B1g) mode of NO3−1. Raman peaks in wavenumber region of 190–150 cm−1 and 310–285 cm−1 are attributed to relative translations between the cations and anionic groups [28]. Peaks at 690 and 712 cm−1 are asymmetric bending mode of ν4 of K2CO3 and CaCO3, respectively. Symmetric stretching mode of ν1 are observed at 1063 cm−1 for K2CO3 and at 1085 cm−1 for CaCO3. Asymmetric stretching mode of ν1 are identified by peaks near 1407 and 1755 cm−1 in remote Raman spectra of K2CO3 and CaCO3 respectively. An amount of 1786 cm−1 in K2CO3 and 1755 cm−1 in CaCO3 are ν1 + ν4 modes. Detailed assignments of Raman spectra of KNO3, CaCO3 and K2CO3 are shown in Table 1. Based on these remote Raman spectra, we can distinguish carbonates with different cations with ease. For the same cation (e.g., K), nitrates and carbonates share similarities in number of Raman peaks and their positions, although the stretching modes (ν1, ν3) of Raman peak seems to be lower for NO3 (1052 cm−1 and 1362 cm−1) than that of CO3 (1063 cm−1 and 1407 cm−1).
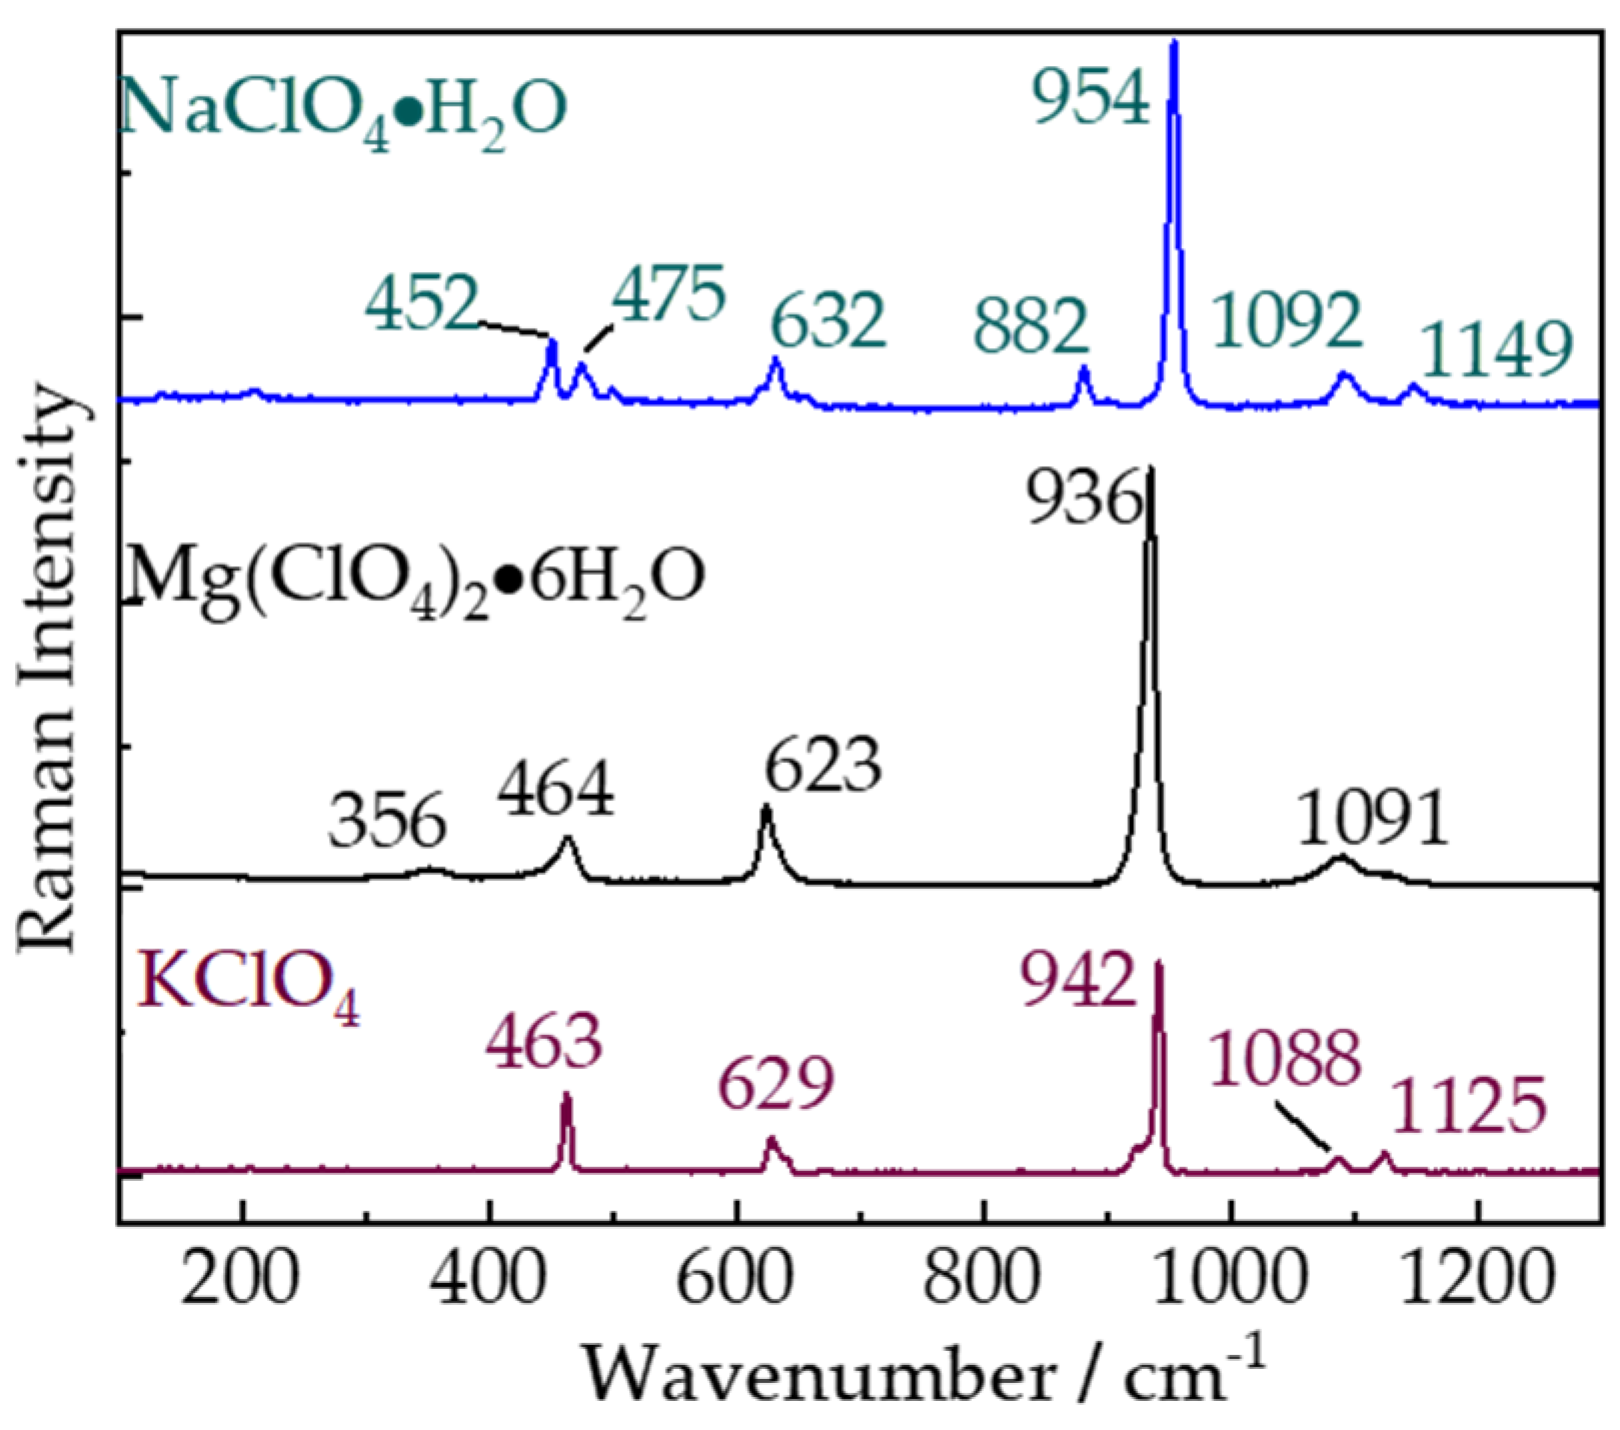
The remote Raman spectra of three perchlorates NaClO4·H2O, Mg(ClO4)2·6H2O, and KClO4 are shown in Figure 3. All major Raman peaks of these three perchlorates can be identified according to their remote Raman spectra obtained with 10 s integration time and 40 mJ/pulse laser (532 nm) incident to sample. Usually, perchlorates would show three main Raman bands, the symmetric Cl-O stretching mode (ν1 (A1)) in the wavenumber region of 950–930 cm−1, Raman active deformation (ν4 (T2)) of Cl-O between 635 and 625 cm−1, and a theoretical Raman inactive deformation (ν2 (E)) belonging to Cl-O within range of 470–445 cm−1. A theoretical inactive vibrational mode, which displays a negligible intensity as the fourth Raman band of perchlorates caused by the anti-symmetric stretching vibration (ν3 (T2)), was observed between 1150–1040 cm−1. Raman peak positions of KClO4, NaClO4·H2O, and Mg(ClO4)26H2O agree well with previous works [31] and are shown in Table 2 with vibrational modes. Perchlorates have been identified on Mars at the Phoenix landing site [32], Gale Crater [33], Viking sites [34,35], and in Martian meteorite EETA79001 [32] and ClO4−1 also has been found in Apollo lunar samples and carbonaceous chondrite meteorites [35]. The presence and distribution of perchlorate on Mars would have implications for Martian Cl cycles and the preservation of biosignatures [36]. Remote Raman with the ability of identifying perchlorates will be a desirable tool to reveal more perchlorates in our solar system.
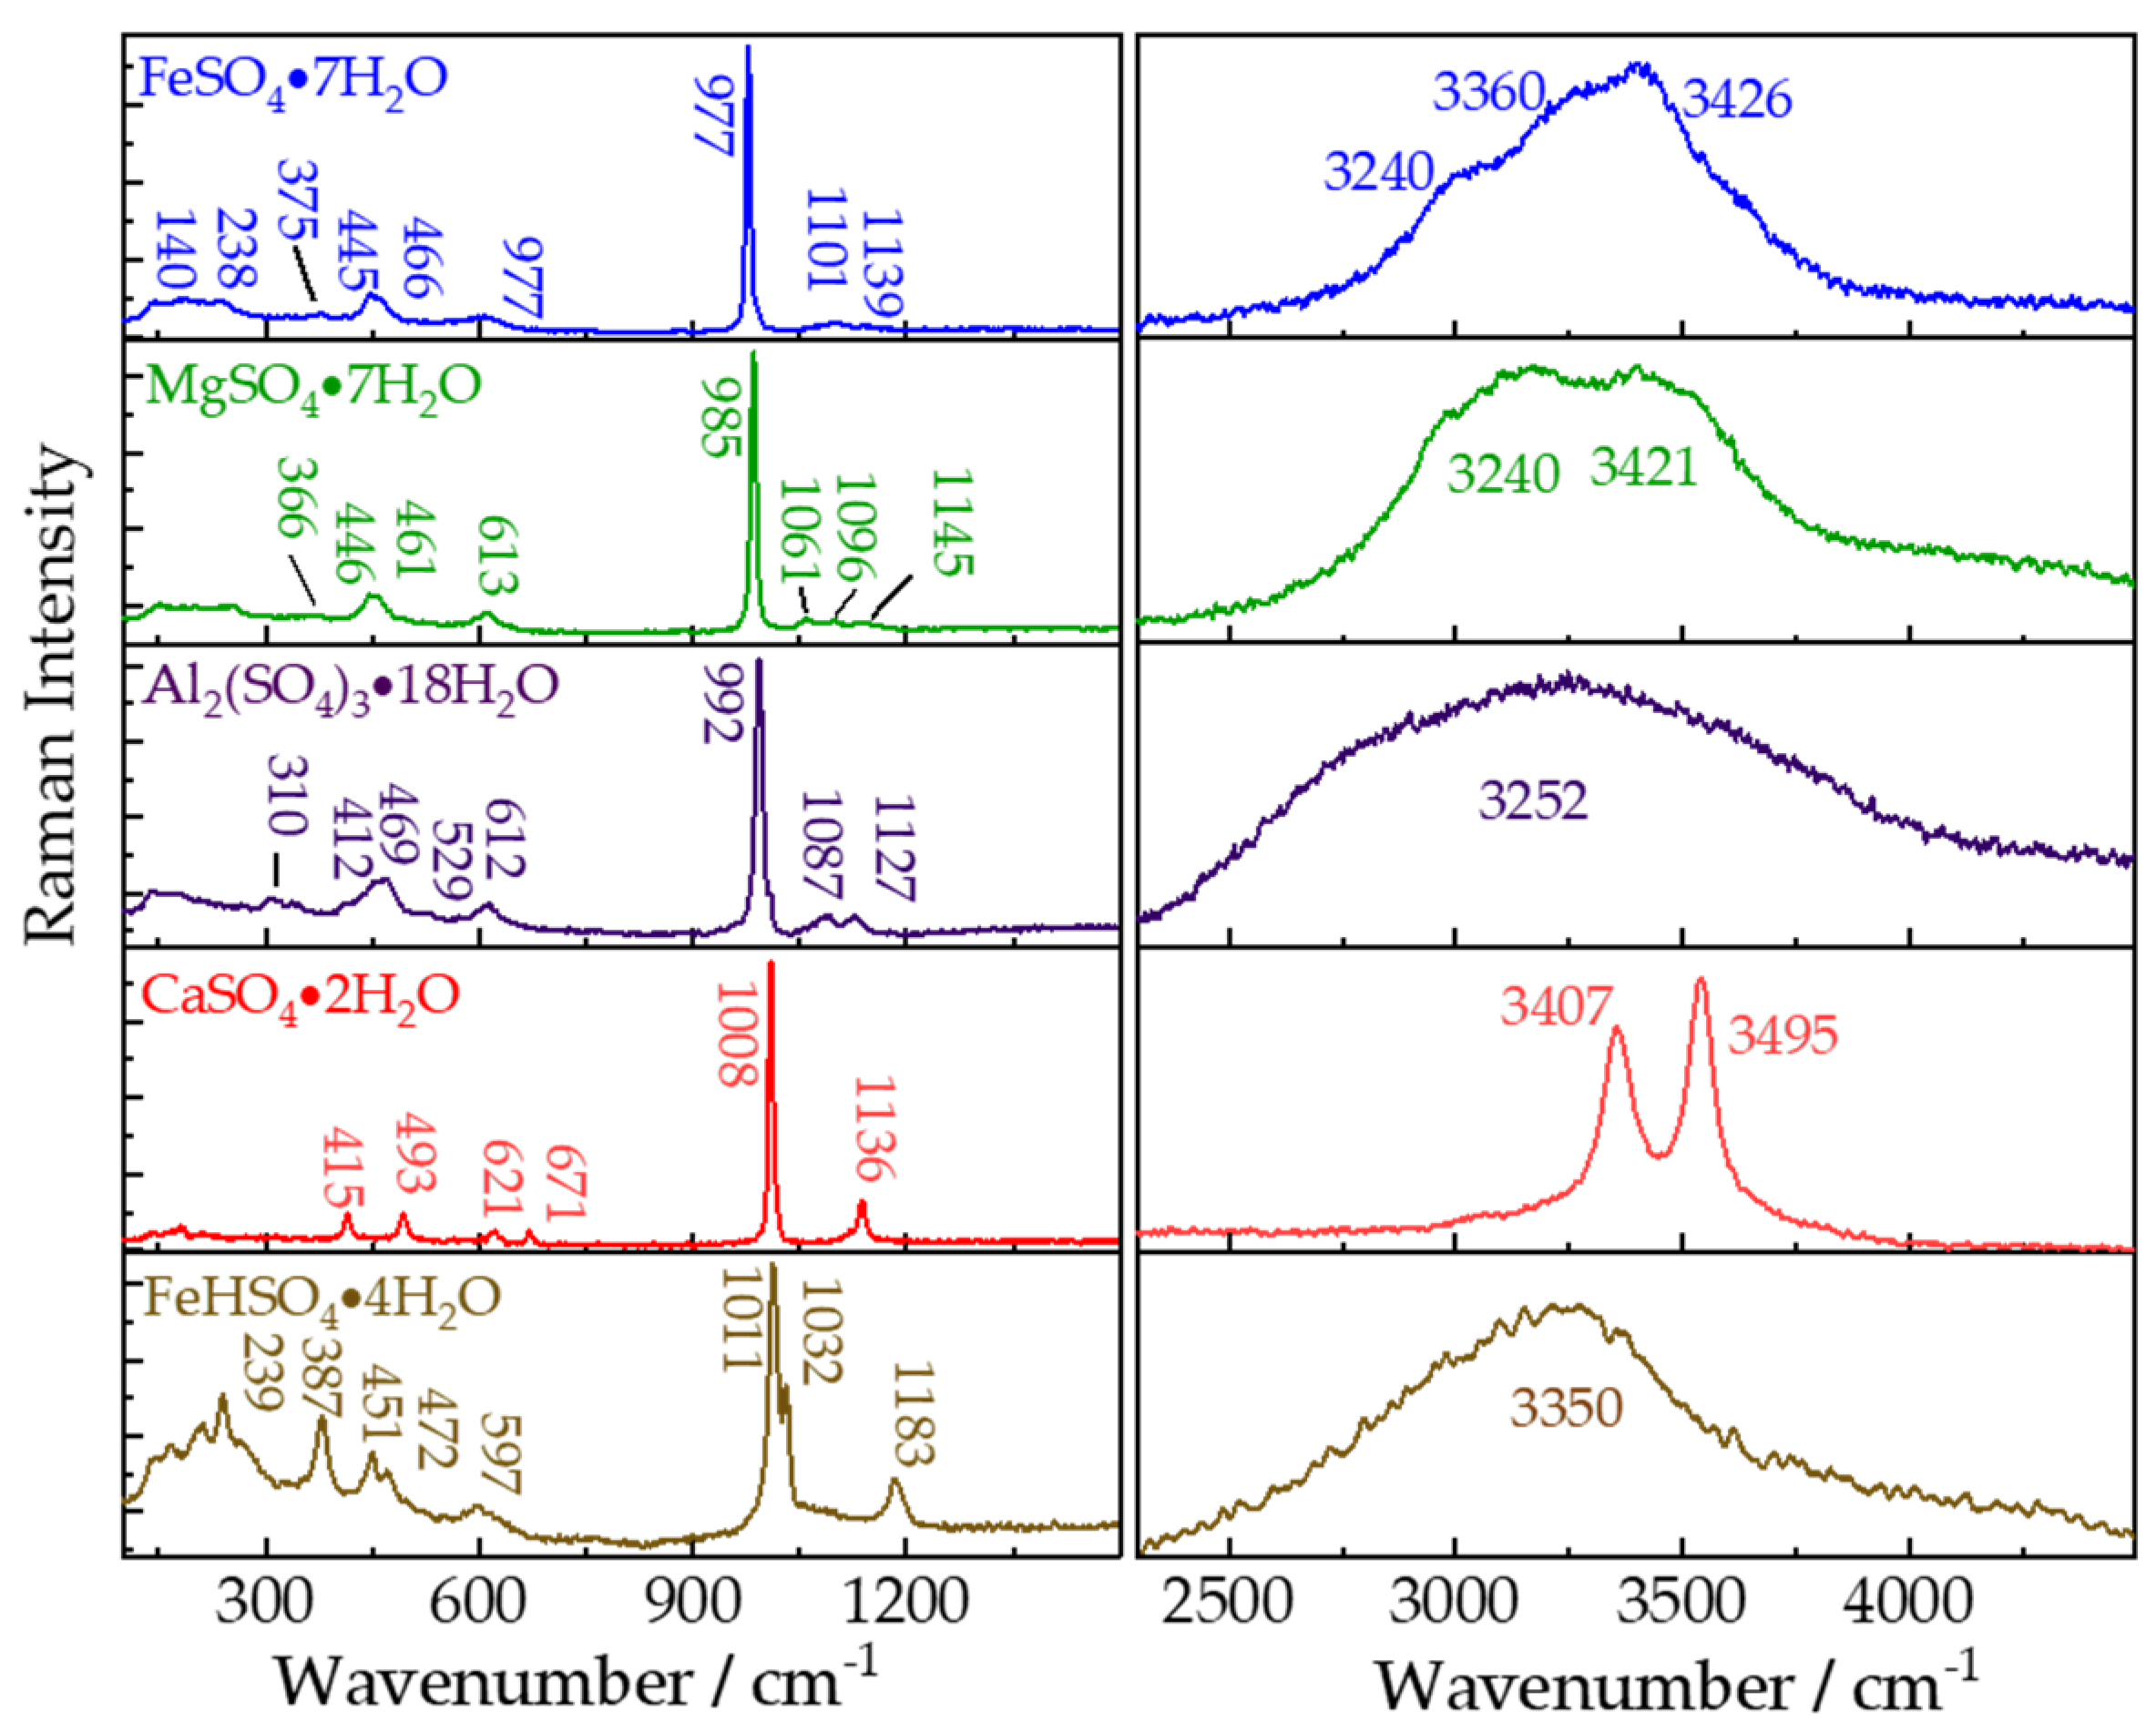
As a significant secondary mineral, sulfates may have important implications for past and present environmental evolutions of Mars. Different types of hydrous/anhydrous sulfates (e.g., Mg-, Ca-, Fe-, and Al-sulfates) have been found on Mars by orbital remote sensing and roving missions [37]. We conducted remote Raman measurements on five types of hydrous sulfates with 65 mJ/pulse laser (532 nm) incident to sample and 20 s integration time. As shown in Figure 4, the remote Raman system is able to clearly obtain the fingerprint Raman bands of FeSO47H2O, MgSO47H2O, Al2(SO4)318H2O, CaSO42H2O, and FeHSO44H2O from 100 to 4000 cm−1. The strongest peaks of five hydrous sulfates at 977, 985, 992, 1008, and 1101 cm−1 are caused by symmetrical stretching mode (ν1(SO42−)) of SO42− ions in FeSO47H2O, MgSO47H2O, Al2(SO4)318H2O, CaSO42H2O, and FeHSO44H2O, respectively. Another ν1(SO42−) mode of FeHSO44H2O was observed near 1032 cm−1. These frequency shifts of the strongest Raman peaks of covalent groups SO4 usually indicate different strong metallic ions (Fe, Mg, Ca, Al), which share the coordinating O with S, within their structure. As a result, the vibrational frequencies of S-O would be affected by different metallic ions because of their difference in atomic weights and attractive forces between the Fe, Mg, Ca, Al and O. The remote Raman spectra of these five hydrous sulfates caused by ν3(SO42−) modes are different from each other. MgSO47H2O produces three peaks at 1061, 1096, and 1145 cm−1. FeSO47H2O has two peaks near 1101 and 1139 cm−1. CaSO42H2O and FeHSO44H2O display only one peak around 1136 and 1183 cm−1 respectively. Al2(SO4)318H2O has two peaks at 1087 and 1127 cm−1. The other two fundamental vibrational modes ν2 and ν4 of SO42− were found at: ν2-446 and 461 cm−1, ν4-613 cm−1 in MgSO4·7H2O; ν2-445 and 465 cm−1, ν4-618 cm−1 in FeSO47H2O; ν2-415 and 493 cm−1, ν4-621 and 671 cm−1 in CaSO42H2O; ν2-451 and 472 cm−1, ν4-597 cm−1 in FeHSO44H2O; ν2-412, 469 and 529 cm−1, ν4-612 cm−1 in Al2(SO4)318H2O. In shorter wavenumber region, the vibration of the (M, H2O) in MgSO47H2O is near 366 cm−1, in FeSO47H2O are at 140, 238, and 375 cm−1, in FeHSO44H2O are at 239 and 378 cm−1, and in Al2(SO4)318H2O is around 310 cm−1. Structural water in sulfates could produce different Raman bands. The O-H stretching modes have been observed at 3297 and 3421 cm−1 in MgSO47H2O, at 3240, 3360, and 3426 cm−1 in FeSO47H2O, at 3407 and 3495 cm−1in CaSO42H2O, at 3350 cm−1 in FeHSO44H2O, at 3252 cm−1 in Al2(SO4)318H2O. The detailed assignments have been concluded in Table 3. The ability of exact identification of hydrous salts would make it possible to acquire a more refined knowledge of past and/or present aqueous environment of extraterrestrial planets using remote Raman spectrometers.
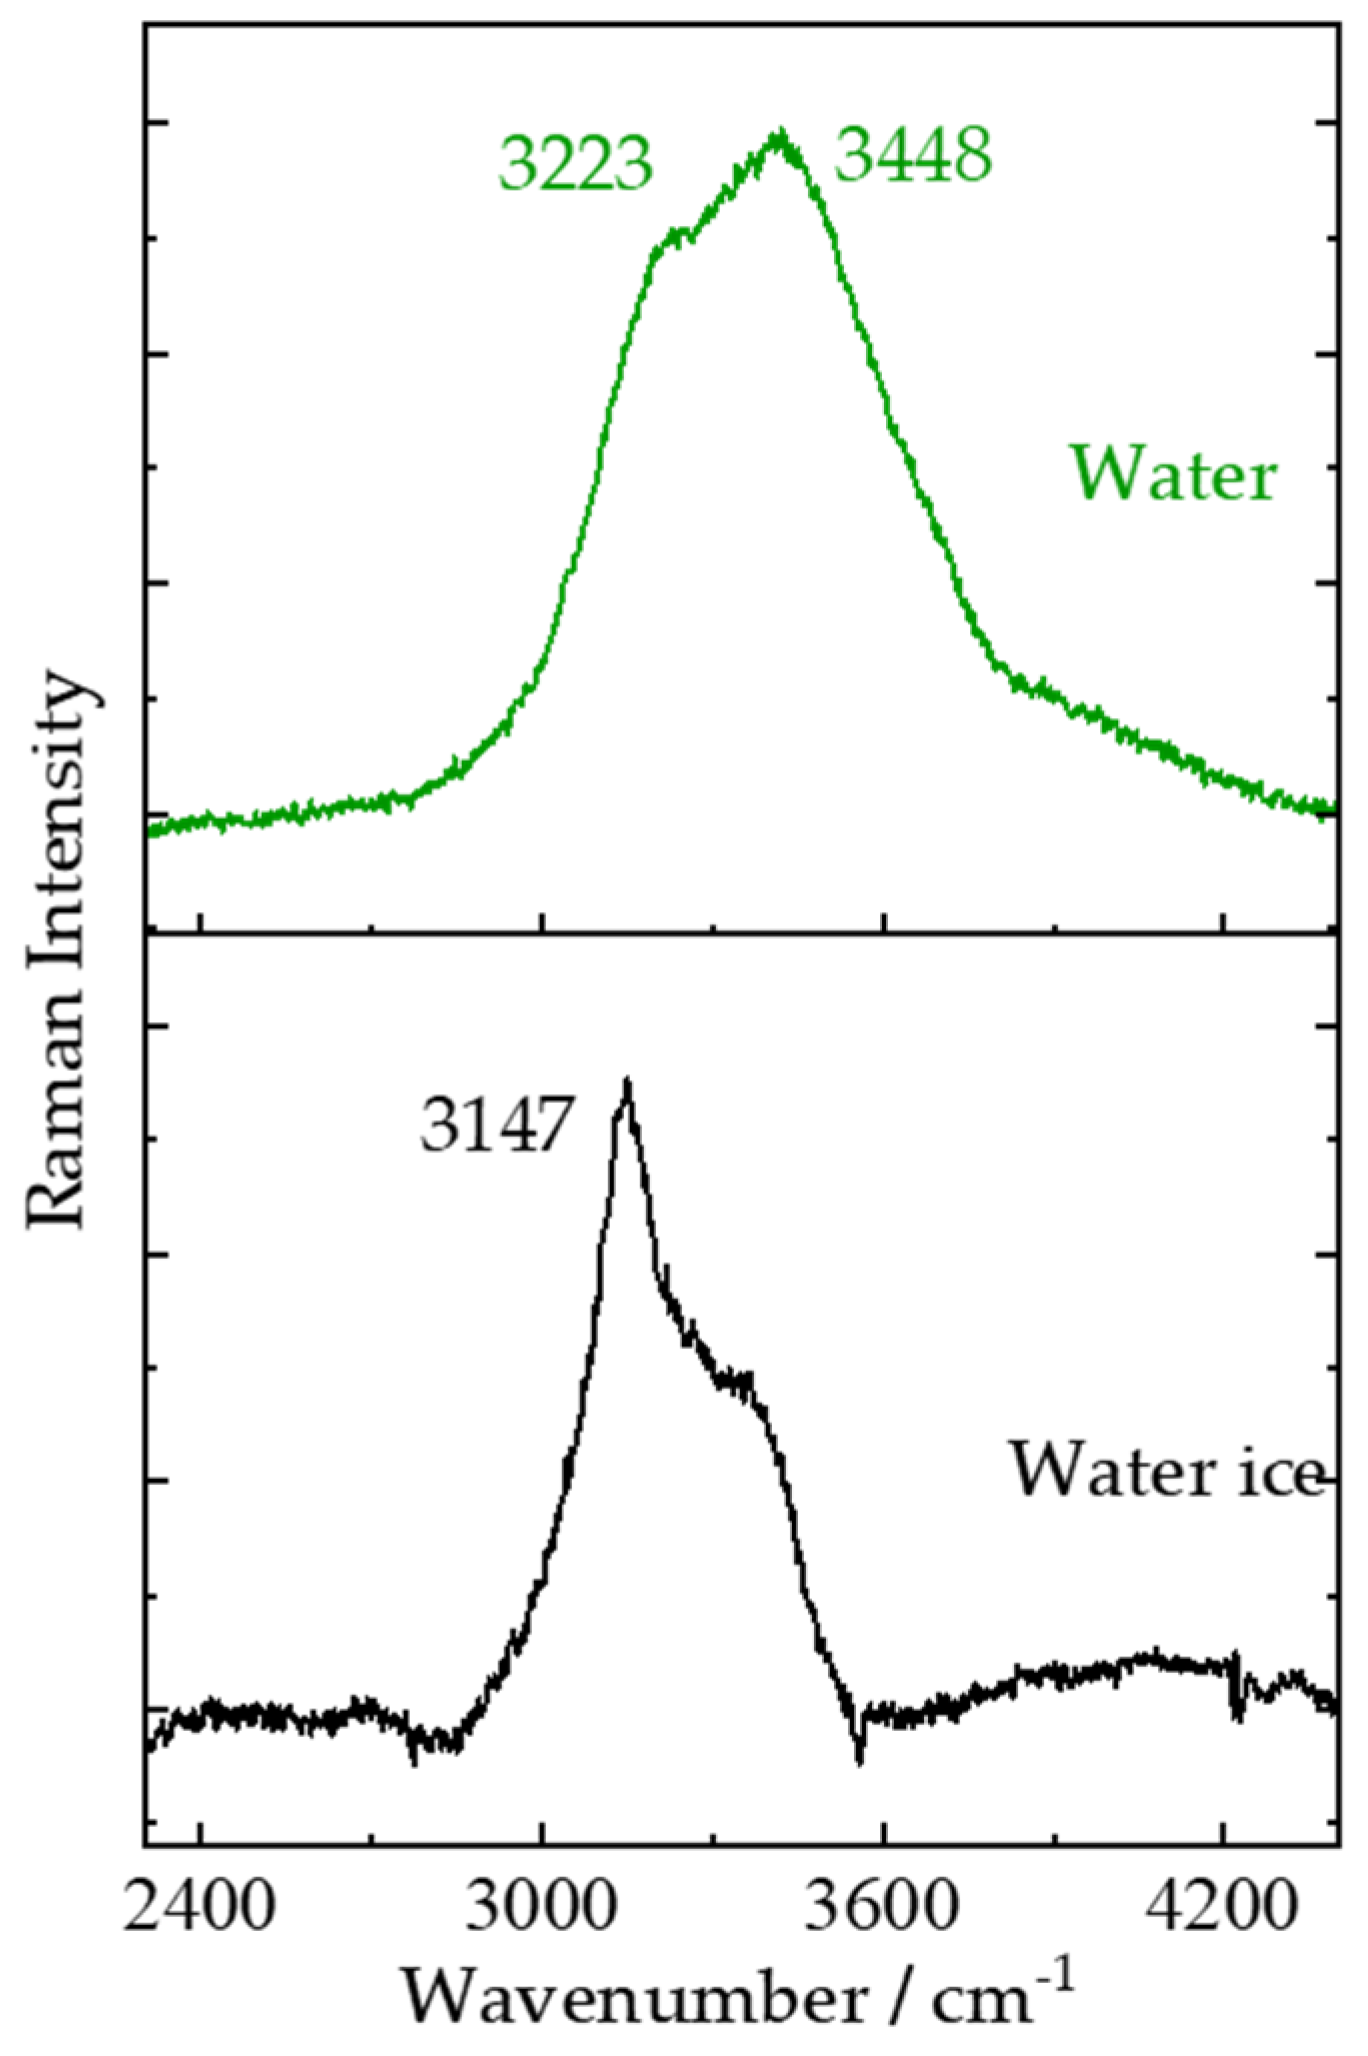
Water displays strong Raman signals in longer wavenumber region due to intramolecular stretching such as the symmetric and antisymmetric stretching vibrational modes. In deionized water Raman spectra obtained at room temperature, two strong broad Raman bands were observed around 3223 and 3448 cm−1 which are attributed to the symmetric (ν1) and antisymmetric stretching (ν3) vibrational modes of the water molecule, respectively [40]. The increase of order in the ice structure will sharpen and shift the H-O-H symmetric stretching mode of water toward short wavenumber region. A sharper Raman band near 3147 cm−1 [41], which is clear enough to distinguish ice and water, was observed in remote Raman spectrum of water ice shown in Figure 5. Water is thought to be essential for supporting life; thus, the presence of water and/or water ice on a planet could make things easier for astronauts drinking and living, as well as in situ resource utilization for creation of oxygen and rocket hydrogen-oxygen fuel. Water ice on the surface of the Moon, Ceres, Mercury, Mars and other planets as well as moons has been reported mostly by visible and near infrared spectral remote sensing [42,43,44]. A remote Raman system carried on a rover would provide positive evidence for the presence and distributions of water ice, which is conductive to further exploration and utilization of water and/or water ice on these celestial bodies.
Organics, which might be indicative for life, are always attractive targets in planetary explorations. Definite detection of organics on extraterrestrial planets and moons might suggest the presence of life. We conducted remote Raman measurements on liquid ethanol (C2H6O), solid L-alanine (C3H7NO2), L-phenylalanine (C9H11NO2), and L-glutamine (C5H10N2O3), shown in Figure 6 and Figure 7. The weak peak at 431 cm−1 in Figure 6 is caused by bending vibration of CCO. The strongest peak at 884 cm−1 is attributed to stretching vibrational mode of CCO and peaks at 1053 and 1097 cm−1 are assigned to deformation mode of CCO. Peak around 1456 cm−1 is produced by bending vibrational modes of CH3 and CH2. The shoulder at 1486 cm−1 is bending vibrational mode of CH3.The symmetric stretching mode of CH3 is observed at 2873 cm−1. The symmetric and asymmetric CH3 stretching modes produce peaks at 2924 and 2972 cm−1, respectively [45]. We did not observe water peaks because of the 99% volume ratio of the ethanol.
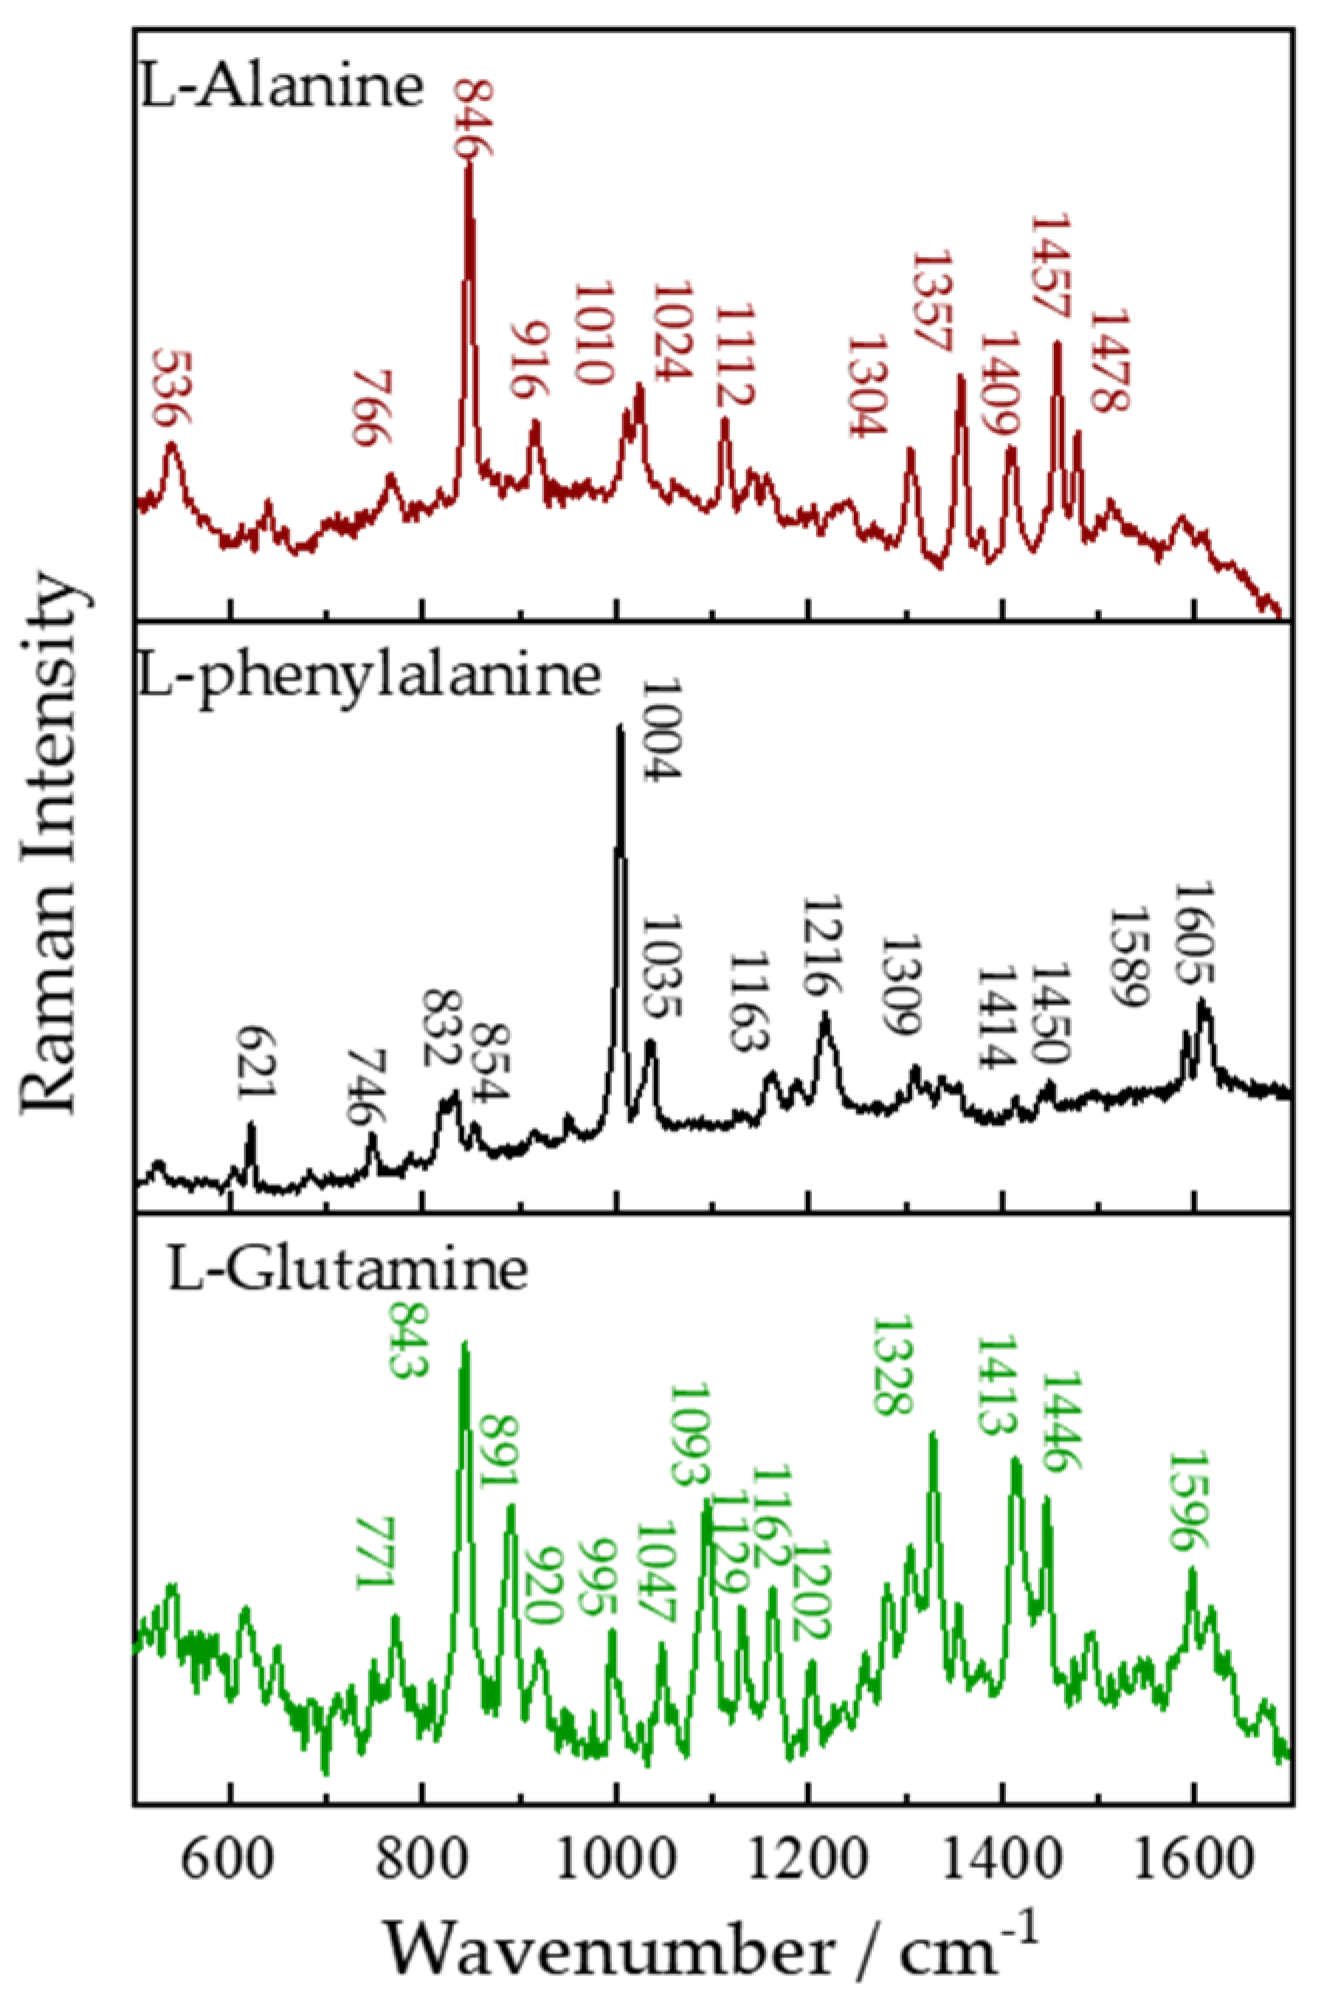
L-alanine (C3H7NO2), L-phenylalanine (C9H11NO2), and L-glutamine (C5H10N2O3) serving as basic elements for the various proteins would display many Raman peaks due to many different kinds of vibrational modes. The Raman spectra of them are shown in Figure 7. For L-alanine, the strongest Raman peak 846 cm−1 is attributed to the (CCH3) symmetric stretching vibration, the 532 cm−1 peak is due to the rocking motion of the CO2− group. The rocking motion of the CH3 group appeared at 1010 and 1024 cm−1. A Raman peak of 1112 cm−1 is attributed to CN stretching vibration and 1304 cm−1 is caused by CH deformation. The CH3 symmetric deformation band (1357 cm−1) and asymmetric deformation bands (1457 and 1478 cm−1) were also observed. In Raman spectra of L-Phenylalanine, the intense Raman peaks at 1004 cm−1 of L-Phenylalanine is caused by C-C symmetric stretching in ring. Peak at 621 cm−1 exhibits the presence of O-C=O in-plane bending modes. Wagging vibration of CH2 is observed near 832 cm−1. 854 cm−1 is assigned to NH2 deformation. 1035 cm−1 is distributed to C-H plane deformation in ring. Raman band corresponding to C-N stretching is observed at 1163 cm−1. Raman peaks at 1216, 1309, 1414, and 1450 cm−1 are, respectively, identified to ring breathing, CH2 wagging vibration, symmetric stretching vibration of COO−, and CH2 scissor vibration. C-C stretching in ring displays two Raman peaks around 1589 and 1605 cm−1. From Raman spectra of L-Glutamine, we can find that the ν(CN) vibrational band can be found at 843 cm−1 and the ν(CC) vibrational bands are at 995 and 1047 cm−1. The δ(CH2) rocking vibrations (891 cm−1) and δ(CH2) twist vibrations were also obtained. Raman peaks at 1093 and 1328 cm−1 are attribute to the symmetric ν(CN) stretching vibrational band and the CH deformation vibration. Two δ(NH3+) rocking vibrations were observed at 1129 and 1162 cm−1. The detailed assignments of these three organics are listed in [46]. The ability for distinguishing organics of our remote Raman system has been demonstrated by experiments with L-alanine, L-phenylalanine, and L-glutamine.
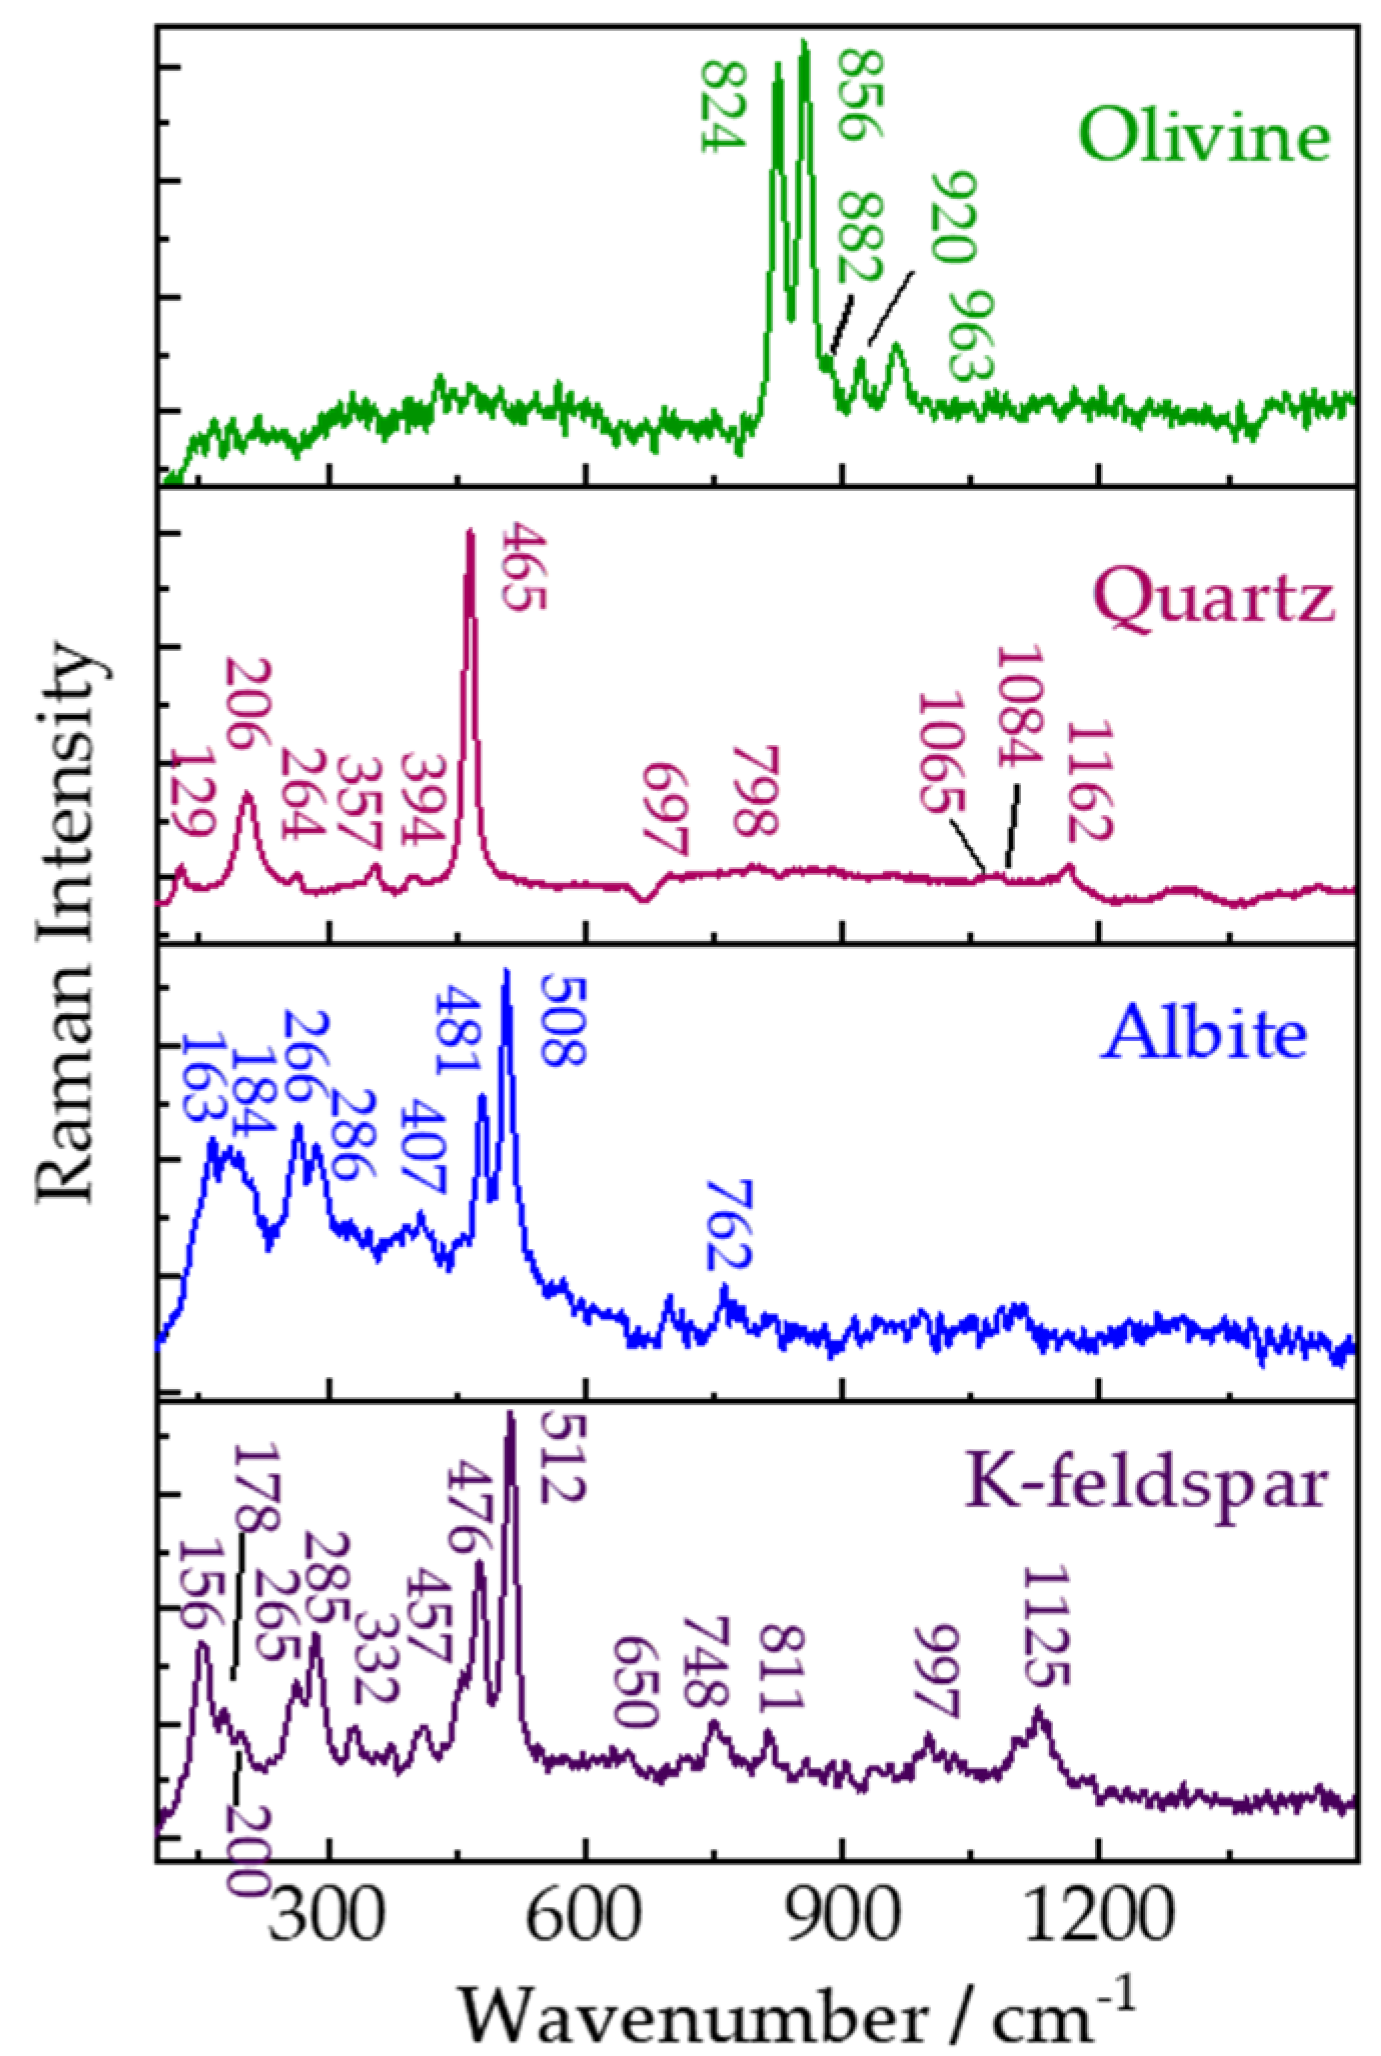
Figure 8 shows remote Raman spectra of olivine, quartz, albite, and K-feldspar with 30 s integration time and 65 mJ/pulse laser (532 nm) incident to sample. The dominant double Raman peaks occurring near 824 and 856 cm−1 are characteristic Raman features of olivine arising from coupled symmetric and asymmetric stretching vibrational modes of SiO4 tetrahedra. Raman spectra related to quartz have been investigated in detail under different pressures and temperatures in previous studies [47,48]. In our remote Raman spectra of quartz obtained at room temperature, Raman peaks from quartz agree well with that from α-quartz and are identified as the fundamental frequencies of A (206, 357, 465 and 1084 cm−1) and E (128, 264, 394, 697, 795–806, 1065 and 1162 cm−1) modes. Feldspars, which include different members, are the most abundant among all minerals and are thought to be a primary tool for classifying igneous rock. Raman spectra of feldspars should be similar with each other due to closely related members. Alkali feldspar series are between Na(Si3Al)O8 and K(Si3Al)O8, and the plagioclase feldspar series are between Na(Si3Al)O8 and Ca(Si2Al2)O8. It is a significant index whether remote Raman system is sufficiently sensitive to distinguish the small changes in structure and chemistry occurring between members of feldspars. K-feldspar and albite were selected as two feldspar members to conduct remote Raman measurement. In the region of 600 to 450 cm−1, the double Raman bands caused by a mixed Si-O-Si (or Si-O-Al) bending/stretching mode are observed at 481 and 508 cm−1 in albite, but triple characters near 457, 476 and 512 cm−1 are found in K-feldspar [49]. Comparing the Raman spectra of K-feldspar and albite collected by our system, we concluded that our remote Raman system is capable of identifying different feldspar members.
Raman features of olivine, albite, and K-feldspar are useable for determining mineralogy, providing mineral chemistries as well as aiding lithologic distinction [49,50]. The shift of the most intense Raman peak of quartz near 465 cm−1 has been used to estimate impact pressure [51], which would cause a distortion of the SiO2 structural framework. Applications for estimating impact pressure using this Raman peak shift have been demonstrated in planetary materials, e.g., lunar soils [52], lunar meteorites [53]. The instrument, which is individually capable of providing mineralogic, compositional information and impact pressure, is strongly and scientifically desired in planetary explorations.
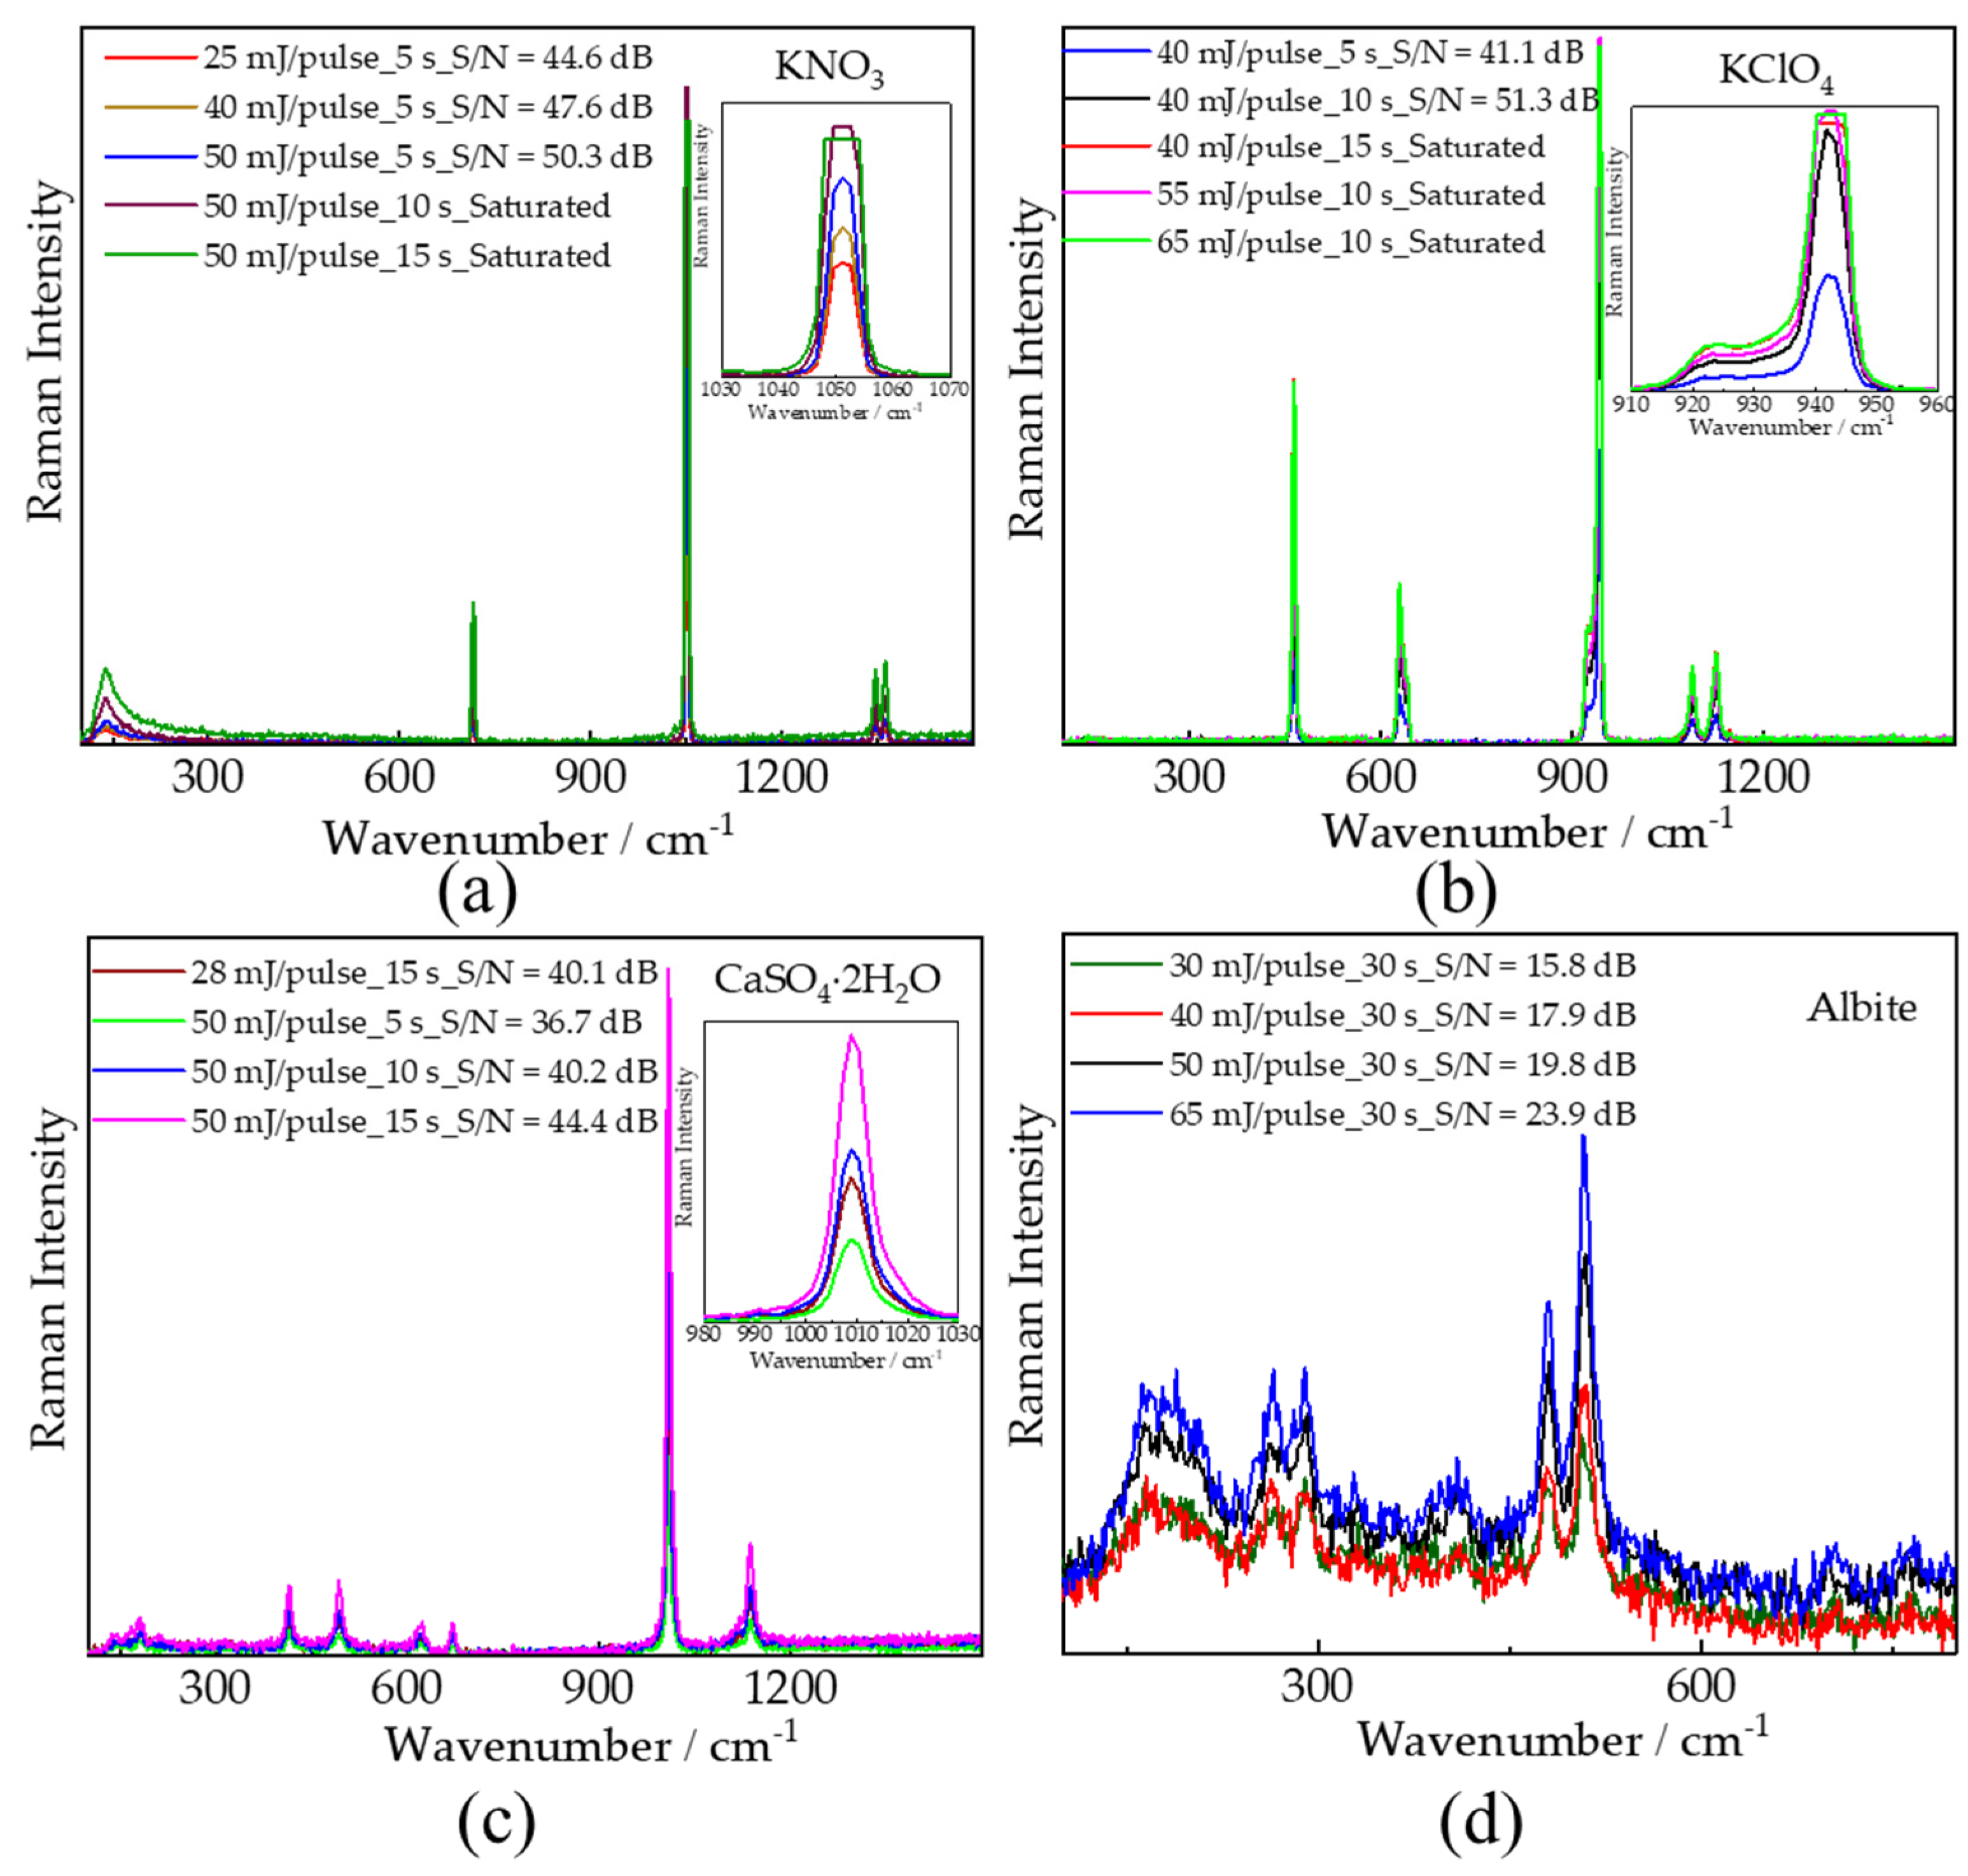
The Raman spectra of four samples (in Figure 9) were selected to demonstrate the experimental repeatability which is crucial for developing instrument. Figure 9 indicates that the repeatability of our remote Raman system is reliable. In Figure 9a, the SNR increases when increasing laser energy from 25 to 50 mJ/pulse with 5 s integration time and Raman signal got saturated with 10 and 15 s integration time as laser energy is 50 mJ/pulse. Similar results could be found in Figure 9b. We can also find that the SNR increases while prolonging integration time with same laser energy in Figure 9c and increases with the increase of laser energy with same integration time. In conclusion, stronger Raman peaks and higher SNR could be obtained by either prolonging integration time (Figure 9a–c) or increasing pulse energy (Figure 9d). However, some saturated Raman signal were observed in Figure 9a,b, e.g., 1052 cm−1 in KNO3 obtained with 50 mJ/pulse laser (532 nm) and 10–15 s integration time, 942 cm−1 in KClO4 obtained with 55–65 mJ/pulse laser (532 nm) and 10 s integration time. Thus, long integration time and/or high pulse energy would cause higher power consumption and unnecessary saturated Raman signal. Distinguishable Raman spectra can be obtained using 25 mJ/pulse laser (532 nm) and 5 s for KNO3, 40 mJ/pulse laser (532 nm) and 5 s for KClO4, 28 mJ/pulse laser (532 nm) and 15 s for CaSO42H2O, and 30 mJ/pulse laser (532 nm) and 30 s for albite in our experiment. It is not our goal to find out the minimum pulse energy/integration time for excitation of Raman signal for each sample, but to propose a remote Raman system with a function of excitation energy adjusting for reducing power consumption, obtaining Raman spectra with good SNR, and possibly avoiding damage of targets. The root mean square (RMS) SNR values shown in Figure 9 were calculated using formula below [54],
The strongest peaks were selected as Ipeak, and Ibackground, which were the strongest background intensity in a region where no Raman signal was detected. Nrms, background is the RMS value of the region mentioned before. The RMS SNR values of some Raman peaks were not calculated due to the saturation that led to flat-top peaks with no accurate intensity value.
4. Conclusions
A remote Raman prototype working in oblique geometry was developed in Shandong University, aiming at providing suggestions on planetary exploration analysis techniques for Chinese planetary exploration. The Raman spectra acquired by our remote Raman system at a distance of 4 m demonstrates the ability of remote Raman for detecting silicates, carbonates, anhydrous/hydrous minerals, water/water ice, and organics. With its character of being sensitive to the molecular structure of a sample, Raman spectra enable us to identify the mineralogy and deduce the mineral chemical composition. For planetary mineralogy detection and survey, a remote Raman system has advantage on no sample preparations, quick and remote analyses, and unambiguous phase identifications that can help us identify minerals, organics, water/water ice, and other volatiles (e.g., CO2 and H2S) on the Moon, Mars, Venus, asteroids, and icy satellites, etc.
Author Contributions
Z.L. designed the entire set of experiments. H.Q. and X.Q. built the remote system and conducted the experiments. H.Q. analyzed the obtained spectra and drafted this manuscript with the help from Z.L., Y.X., C.L. and H.C. All co-authors contributed to discussions, interpretations, and final writing. All authors have read and agreed to the published version of the manuscript.
Funding
This work is supported by the National Natural Science Foundation (U1931211, 11941001, 41972322), and the Natural Science Foundation of Shandong Province (ZR2019MD008). We also thank the funding from the Pre-research project on Civil Aerospace Technologies no. D020102 funded by China National Space Administration (CNSA) and the grants from Key Laboratory of Lunar and Deep Space Exploration (LDSE202002), CAS, and Foundation of Key Laboratory of Space Active Opto-electronics Technology (Chinese Academy of Sciences, 2018-ZDKF-2). This work is also supported by the Physical–Chemical Materials Analytical & Testing Center of Shandong University at Weihai.
Institutional Review Board Statement
Not applicable.
Informed Consent Statement
Not applicable.
Data Availability Statement
Not applicable.
Acknowledgments
We would like to thank the editors and anonymous reviewers for their constructive suggestion, which significantly improve the quality of this work. This is the SDU-CPS publication #86.
Conflicts of Interest
The authors declare no conflict of interest.
References
- Wang, A.; Jolliff, B.L.; Haskin, L.A. Raman spectroscopy as a method for mineral identification on lunar robotic exploration missions. J. Geophys. Res. Planets 1995, 100, 21189–21199. [Google Scholar] [CrossRef]
- Wopenka, B.; Sandford, S. Laser Raman microprobe study of mineral phases in meteorites. Meteoritics 1984, 19, 340. [Google Scholar]
- Hutchinson, I.B.; Ingley, R.; Edwards, H.G.M.; Harris, L.; McHugh, M.; Malherbe, C.; Parnell, J. Raman spectroscopy on Mars: Identification of geological and bio-geological signatures in Martian analogues using miniaturized Raman spectrometers. Philos. Trans. R. Soc. A Math. Phys. Eng. Sci. 2014, 372, 20140204. [Google Scholar] [CrossRef] [PubMed]
- Kobayasi, T.; Inaba, H. Spectroscopic detection of SO2 and CO2 molecules in polluted atmosphere by laser-raman radar technique. Appl. Phys. Lett. 1970, 17, 139–141. [Google Scholar] [CrossRef]
- Angel, S.M.; Kulp, T.J.; Vess, T.M. Remote-Raman spectroscopy at intermediate ranges using low-power cw lasers. Appl. Spectrosc. 1992, 46, 1085–1091. [Google Scholar] [CrossRef]
- Klein, V.; Popp, J.; Tarcea, N.; Schmitt, M.; Kiefer, W.; Hofer, S.; Stuffler, T.; Hilchenbach, M.; Doyle, D.; Dieckmann, M. Remote Raman spectroscopy as a prospective tool for planetary surfaces. J. Raman Spectrosc. 2004, 35, 433–440. [Google Scholar] [CrossRef]
- Abedin, M.N.; Bradley, A.T.; Misra, A.K.; Bai, Y.; Hines, G.D.; Sharma, S.K. Standoff ultracompact micro-Raman sensor for planetary surface explorations. Appl. Opt. 2018, 57, 62–68. [Google Scholar] [CrossRef] [PubMed]
- Sandford, M.W.; Misra, A.K.; Acosta-Maeda, T.E.; Sharma, S.K.; Porter, J.N.; Egan, M.J.; Abedin, M.N. Detecting Minerals and Organics Relevant to Planetary Exploration Using a Compact Portable Remote Raman System at 122 Meters. Appl. Spectrosc. 2021, 75, 299–306. [Google Scholar] [CrossRef]
- Cote, K.; Lallab, E.A.; Konstantinidisc, M.; Dalyd, M.; Dietrich, P. A combined Raman, LIF, and micro-LIBS system with time-resolved fluorescence capabilities for planetary exploration applications. In Proceedings of the International Astronautical Congress (IAC), Washington, DC, USA, 20–25 October 2019; International Astronautical Federation (IAF): Paris, France, 2019. [Google Scholar]
- Misra, A.K.; Sharma, S.K.; Lucey, P.G. Remote Raman spectroscopic detection of minerals and organics under illuminated conditions from a distance of 10 m using a single 532 nm laser pulse. Appl. Spectrosc. 2006, 60, 223–228. [Google Scholar] [CrossRef]
- Clegg, S.; Wiens, R.; Misra, A.K.; Sharma, S.K.; Lambert, J.; Bender, S.; Newell, R.; Nowak-Lovato, K.; Smrekar, S.; Dyar, M.D.; et al. Remote Raman-laser induced breakdown spectroscopy (LIBS) geochemical investigation under Venus atmospheric conditions. In Proceedings of the Lunar and Planetary Science Conference, The Woodlands, TX, USA, 7–11 March 2011. [Google Scholar]
- Clegg, S.; Sharma, S.K.; Misra, A.K.; Dyar, M.D.; Dallmann, N.; Wiens, R.C.; Vaniman, D.T.; Speicher, E.A.; Smrekar, S.E.; Wang, A.; et al. Raman and laser-induced breakdown spectroscopy (LIBS) remote geochemical analysis under Venus atmospheric pressure. In Proceedings of the Lunar and Planetary Science Conference, The Woodlands, TX, USA, 19–23 March 2012. [Google Scholar]
- Sharma, S.K.; Misra, A.K.; Clegg, S.M.; Barefield, J.E.; Wiens, R.C.; Acosta, T.E.; Bates, D.E. Remote-Raman spectroscopic study of minerals under supercritical CO2 relevant to Venus exploration. Spectrochim. Acta Part A Mol. Biomol. Spectrosc. 2011, 80, 75–81. [Google Scholar] [CrossRef]
- Sharma, S.K.; Misra, A.K.; Clegg, S.; Barefield, J.; Wiens, R.C.; Acosta, T. Time-resolved remote Raman study of minerals under supercritical CO2 and high temperatures relevant to Venus exploration. Philos. Trans. R. Soc. A Math. Phys. Eng. Sci. 2010, 368, 3167–3191. [Google Scholar] [CrossRef] [PubMed] [Green Version]
- Sharma, S.K.; Misra, A.K.; Lucey, P.G.; Lentz, R.C. A combined remote Raman and LIBS instrument for characterizing minerals with 532 nm laser excitation. Spectrochim. Acta Part A Mol. Biomol. Spectrosc. 2009, 73, 468–476. [Google Scholar] [CrossRef] [PubMed]
- Sharma, S.K.; Lucey, P.G.; Ghosh, M.; Hubble, H.W.; Horton, K.A. Stand-off Raman spectroscopic detection of minerals on planetary surfaces. Spectrochim. Acta Part A Mol. Biomol. Spectrosc. 2003, 59, 2391–2407. [Google Scholar] [CrossRef] [Green Version]
- Stopar, J.D.; Lucey, P.G.; Sharma, S.K.; Misra, A.K.; Taylor, G.J.; Hubble, H.W. Raman efficiencies of natural rocks and minerals: Performance of a remote Raman system for planetary exploration at a distance of 10 meters. Spectrochim. Acta Part A Mol. Biomol. Spectrosc. 2005, 61, 2315–2323. [Google Scholar] [CrossRef]
- Sharma, S.K.; Angel, S.M.; Ghosh, M.; Hubble, H.W.; Lucey, P.G. Remote pulsed laser Raman spectroscopy system for mineral analysis on planetary surfaces to 66 meters. Appl. Spectrosc. 2002, 56, 699–705. [Google Scholar] [CrossRef]
- Misra, A.K.; Acosta-Maeda, T.E.; Porter, J.N.; Egan, M.J.; Sandford, M.W.; Oyama, T.; Zhou, J. Remote Raman detection of chemicals from 1752 m during afternoon daylight. Appl. Spectrosc. 2020, 74, 233–240. [Google Scholar] [CrossRef]
- Wiens, R.C.; Maurice, S.; Robinson, S.H.; Nelson, A.E.; Cais, P.; Bernardi, P.; Newell, R.T.; Clegg, S.; Sharma, S.K.; Storms, S.; et al. The SuperCam instrument suite on the NASA Mars 2020 rover: Body unit and combined system tests. Space Sci. Rev. 2021, 217, 1–87. [Google Scholar] [CrossRef]
- Beegle, L.; Bhartia, R.; White, M.; DeFlores, L.; Abbey, W.; Wu, Y.-H.; Cameron, B.; Moore, J.; Fries, M.; Burton, A.; et al. SHERLOC: Scanning habitable environments with Raman & luminescence for Organics & Chemicals. In Proceedings of the 2015 IEEE Aerospace Conference, Big Sky, MT, USA, 7–14 March 2015; IEEE: Piscataway, NJ, USA, 2015. [Google Scholar]
- Perez, R.; Parès, L.P.; Newell, R.; Robinson, S.; Bernardi, P.; Réess, J.-M.; Caïs, P.; McCabe, K.; Maurice, S.; Wiens, R.C. The supercam instrument on the NASA Mars 2020 mission: Optical design and performance. In Proceedings of the International Conference on Space Optics—ICSO 2016, Biarritz, France, 18–21 October 2016; International Society for Optics and Photonics: Bellingham, WA, USA, 2017. [Google Scholar]
- Veneranda, M.; Parès, L.P.; Newell, R.; Robinson, S.; Bernardi, P.; Réess, J.-M.; Caïs, P.; McCabe, K.; Maurice, S.; Wiens, R.C. ExoMars Raman Laser Spectrometer (RLS): Development of chemometric tools to classify ultramafic igneous rocks on Mars. Sci. Rep. 2020, 10, 1–14. [Google Scholar] [CrossRef]
- Wan, W.; Wang, C.; Li, C.L.; Wei, Y. China’s first mission to Mars. Nat. Astron. 2020, 4, 721. [Google Scholar] [CrossRef]
- Ling, Z.; Wang, A. A systematic spectroscopic study of eight hydrous ferric sulfates relevant to Mars. Icarus 2010, 209, 422–433. [Google Scholar] [CrossRef]
- Liu, D.; Ullman, F.G.; Hardy, J.R. Raman scattering and lattice-dynamical calculations of crystalline KNO 3. Phys. Rev. B 1992, 45, 2142. [Google Scholar] [CrossRef] [PubMed] [Green Version]
- Brooker, M. Raman study of the structural properties of KNO3 (II). Can. J. Chem. 1977, 55, 1242–1250. [Google Scholar] [CrossRef]
- Gunasekaran, S.; Anbalagan, G.; Pandi, S. Raman and infrared spectra of carbonates of calcite structure. J. Raman Spectrosc. Int. J. Orig. Work Asp. Raman Spectrosc. Incl. High. Order Process. Brillouin Rayleigh Scatt. 2006, 37, 892–899. [Google Scholar] [CrossRef]
- Koura, N.; Kohara, S.; Takeuchi, K.; Takahashi, S.; Curtiss, L.; Grimsditch, M.; Saboungi, M.-L. Alkali carbonates: Raman spectroscopy, ab initio calculations, and structure. J. Mol. Struct. 1996, 382, 163–169. [Google Scholar] [CrossRef]
- Buzgar, N.; Apopei, A.I. The Raman study of certain carbonates. Geol. Tomul L 2009, 2, 97–112. [Google Scholar]
- Zapata, F.; García-Ruiz, C. The discrimination of 72 nitrate, chlorate and perchlorate salts using IR and Raman spectroscopy. Spectrochim. Acta Part A Mol. Biomol. Spectrosc. 2018, 189, 535–542. [Google Scholar] [CrossRef]
- Kounaves, S.; Carrier, B.L.; O’Neil, G.; Stroble, S.T.; Claire, M. Evidence of martian perchlorate, chlorate, and nitrate in Mars meteorite EETA79001: Implications for oxidants and organics. Icarus 2014, 229, 206–213. [Google Scholar] [CrossRef]
- Leshin, L.A.; Mahaffy, P.R.; Webster, C.R.; Cabane, M.; Coll, P.; Conrad, P.G.; Archer, P.D.; Atreya, S.K.; Brunner, A.E.; Buch, A.; et al. Volatile, isotope, and organic analysis of martian fines with the Mars Curiosity rover. Science 2013, 341, 1238937. [Google Scholar] [CrossRef]
- Navarro-González, R.; Vargas, E.; de la Rosa, J.; Raga, A.C.; McKay, C.P. Reanalysis of the Viking results suggests perchlorate and organics at midlatitudes on Mars. J. Geophys. Res. Planets 2010, 115, E12. [Google Scholar] [CrossRef]
- Jackson, W.A.; Davila, A.F.; Sears, D.W.; Coates, J.D.; McKay, C.P.; Brundrett, M.; Estrada, N.; Bohlke, J.K. Widespread occurrence of (per) chlorate in the Solar System. Earth Planet. Sci. Lett. 2015, 430, 470–476. [Google Scholar] [CrossRef]
- Nuding, D.L.; Gough, R.V.; Venkateswaran, K.J.; Spry, J.A.; Tolbert, M.A. Laboratory investigations on the survival of Bacillus subtilis spores in deliquescent salt Mars analog environments. Astrobiology 2017, 17, 997–1008. [Google Scholar] [CrossRef]
- Arvidson, R.E.; Poulet, F.; Bibring, J.-P.; Wolff, M.; Gendrin, A.; Morris, R.V.; Freeman, J.J.; Langevin, Y.; Mangold, N.; Bellucci, G. Spectral reflectance and morphologic correlations in eastern Terra Meridiani, Mars. Science 2005, 307, 1591–1594. [Google Scholar] [CrossRef] [Green Version]
- Buzgar, N.; Buzatu, A.; Sanislav, I.V. The Raman Study on Certain Sulfates; Analele Stiintifice ale Universitatii Al. I. Cuza: Iasi, Romania, 2009; Volume 55, pp. 5–23. [Google Scholar]
- Cao, H.; Chen, J.; Ling, Z. Laboratory synthesis and spectroscopic studies of hydrated Al-sulfates relevant to Mars. Icarus 2019, 333, 283–293. [Google Scholar] [CrossRef]
- Moskovits, M.; Michaelian, K. A reinvestigation of the Raman spectrum of water. J. Chem. Phys. 1978, 69, 2306–2311. [Google Scholar] [CrossRef]
- Đuričković, I.; Claverie, R.; Bourson, P.; Marchetti, M.; Chassot, J.; Fontana, M.D. Water–ice phase transition probed by Raman spectroscopy. J. Raman Spectrosc. 2011, 42, 1408–1412. [Google Scholar] [CrossRef]
- Clark, R.N. Detection of adsorbed water and hydroxyl on the Moon. Science 2009, 326, 562–564. [Google Scholar] [CrossRef] [PubMed] [Green Version]
- Jakosky, B.M.; Haberle, R.M. The seasonal behavior of water on Mars. Mars 1992, 969–1016. [Google Scholar]
- Paige, D.A.; Wood, S.E.; Vasavada, A.R. The thermal stability of water ice at the poles of Mercury. Science 1992, 258, 643–646. [Google Scholar] [CrossRef] [PubMed]
- Burikov, S.; Dolenko, T.; Patsaeva, S.; Starokurov, Y.; Yuzhakov, V. Raman and IR spectroscopy research on hydrogen bonding in water–ethanol systems. Mol. Phys. 2010, 108, 2427–2436. [Google Scholar] [CrossRef]
- De Gelder, J.; de Gussem, K.; Vandenabeele, P.; Moens, L. Reference database of Raman spectra of biological molecules. J. Raman Spectrosc. Int. J. Orig. Work Asp. Raman Spectrosc. Incl. High. Order Process. Brillouin Rayleigh Scatt. 2007, 38, 1133–1147. [Google Scholar] [CrossRef]
- Krishnamurti, D. The Raman spectrum of quartz and its interpretation. Indian Acad. Sci. Sect. A 1958, 47, 276–291. [Google Scholar] [CrossRef]
- Krishnan, R.S. Raman spectrum of quartz. Nature 1945, 155, 452. [Google Scholar] [CrossRef]
- Freeman, J.J.; Wang, A.; Kuebler, K.E.; Jolliff, B.L.; Haskin, L.A. Characterization of natural feldspars by Raman spectroscopy for future planetary exploration. Can. Mineral. 2008, 46, 1477–1500. [Google Scholar] [CrossRef]
- Kuebler, K.E.; Jolliff, B.L.; Wang, A.; Haskin, L.A. Extracting olivine (Fo–Fa) compositions from Raman spectral peak positions. Geochim. Cosmochim. Acta 2006, 70, 6201–6222. [Google Scholar] [CrossRef]
- McMillan, P.F.; Wolf, G.H.; Lambert, P. A Raman spectroscopic study of shocked single crystalline quartz. Phys. Chem. Miner. 1992, 19, 71–79. [Google Scholar] [CrossRef]
- Ling, Z.; Wang, A.; Jolliff, B.L. Mineralogy and geochemistry of four lunar soils by laser-Raman study. Icarus 2011, 211, 101–113. [Google Scholar] [CrossRef]
- Chen, J.; Jolliff, B.L.; Wang, A.; Korotev, R.L.; Wang, K.; Carpenter, P.K.; Chen, H.; Ling, Z.; Fu, X.; Ni, Y.; et al. Petrogenesis and shock metamorphism of basaltic lunar meteorites Northwest Africa 4734 and 10597. J. Geophys. Res. Planets 2019, 124, 2583–2598. [Google Scholar] [CrossRef]
- HORIBA. Determining Signal to Noise Ratio of a Spectrofluorometer: Methods and Formulas to Ensure Accurate Sensitivity Comparisons. Available online: https://www.horiba.com/en_en/technology/spectroscopy/fluorescence-spectroscopy/how-to-calculate-signal-to-noise-ratio/ (accessed on 12 September 2021).
Figure 1.
Schematic diagram of the remote Raman system. M, mirror; FDC, frequency doubling crystal; S, spectroscopy; FP, fiber probe; L, lens; NF = 532 nm Notch filter.
Figure 1.
Schematic diagram of the remote Raman system. M, mirror; FDC, frequency doubling crystal; S, spectroscopy; FP, fiber probe; L, lens; NF = 532 nm Notch filter.

Figure 2.
Remote Raman spectra of CaCO3, K2CO3, and KNO3 with 10 s integration time and 30 mJ/pulse laser (532 nm) incident to sample at 4 m target distance.
Figure 2.
Remote Raman spectra of CaCO3, K2CO3, and KNO3 with 10 s integration time and 30 mJ/pulse laser (532 nm) incident to sample at 4 m target distance.

Figure 3.
Remote Raman spectra of NaClO4H2O, Mg(ClO4)2 6H2O, and KClO4 with 10 s integration time and 40 mJ/pulse laser (532 nm) incident to sample at 4 m target distance.
Figure 3.
Remote Raman spectra of NaClO4H2O, Mg(ClO4)2 6H2O, and KClO4 with 10 s integration time and 40 mJ/pulse laser (532 nm) incident to sample at 4 m target distance.

Figure 4.
Remote Raman spectra of FeSO47H2O, MgSO4 7H2O, Al2(SO4)3 18H2O, CaSO4 2H2O, and FeHSO4 4H2O with 20 s integration time and 65 mJ/pulse laser (532 nm) incident to sample at 4 m target distance.
Figure 4.
Remote Raman spectra of FeSO47H2O, MgSO4 7H2O, Al2(SO4)3 18H2O, CaSO4 2H2O, and FeHSO4 4H2O with 20 s integration time and 65 mJ/pulse laser (532 nm) incident to sample at 4 m target distance.

Figure 5.
Remote Raman spectra of water and water ice with 20 s integration time and 65 mJ/pulse laser (532 nm) incident to sample at 4 m target distance.
Figure 5.
Remote Raman spectra of water and water ice with 20 s integration time and 65 mJ/pulse laser (532 nm) incident to sample at 4 m target distance.

Figure 6.
Remote Raman spectra of ethanol (C2H6O) with 15 s integration time and 50 mJ/pulse laser (532 nm) incident to sample at 4 m target distance.
Figure 6.
Remote Raman spectra of ethanol (C2H6O) with 15 s integration time and 50 mJ/pulse laser (532 nm) incident to sample at 4 m target distance.

Figure 7.
Remote Raman spectra of L-alanine, L-phenylalanine, and L-glutamine with 15 s integration time and 40 mJ/pulse laser (532 nm) incident to sample at 4 m target distance.
Figure 7.
Remote Raman spectra of L-alanine, L-phenylalanine, and L-glutamine with 15 s integration time and 40 mJ/pulse laser (532 nm) incident to sample at 4 m target distance.

Figure 8.
Remote Raman spectra of olivine, quartz, albite, and K-feldspar with 30 s integration time and 65 mJ/pulse laser (532 nm) incident to sample at 4 m target distance.
Figure 8.
Remote Raman spectra of olivine, quartz, albite, and K-feldspar with 30 s integration time and 65 mJ/pulse laser (532 nm) incident to sample at 4 m target distance.

Figure 9.
Remote Raman spectra of (a) KNO3, (b) KClO4, (c) CaSO42H2O and (d) Albite obtained with different pulse energies and integration time.
Figure 9.
Remote Raman spectra of (a) KNO3, (b) KClO4, (c) CaSO42H2O and (d) Albite obtained with different pulse energies and integration time.


| K2CO3 | CaCO3 | KNO3 | Assignments |
|---|---|---|---|
| 142 191 | 154 281 | 137 | T (K, CO3) T (Ca, CO3) B1g (KNO3) |
| 690 | 712 | 716 | ν4-Asymmetric bending mode |
| 1063 | 1085 | 1052 | ν1-Symmetric stretching mode |
| 1407 | 1438 | 1362 1364 | ν3-Asymmetric stretching mode |
| 1768 | 1755 | ν1 + ν4 |
Table 2.
Assignments of Raman peaks of KClO4, NaClO4 H2O, and Mg(ClO4)2 6H2O (in cm−1) [31].
Table 2.
Assignments of Raman peaks of KClO4, NaClO4 H2O, and Mg(ClO4)2 6H2O (in cm−1) [31].
| KClO4 | H2O | 6H2O | Assignments |
|---|---|---|---|
| 463 | 475 452 | 464 | Deformation (ν2 (E)) |
| 629 | 632 | 623 | Deformation (ν4 (T2)) |
| 942 | 954 | 936 | Symmetric stretch (ν1 (A1)) |
| 1125 1088 | 1149 1092 | 1091 | Anti-symmetric stretch (ν3 (T2)) |
7H2O | 7H2O | 2H2O | 4H2O | 18H2O | Assignments |
|---|---|---|---|---|---|
| 366 | 140 238 375 | 239 378 | 310 | T (Fe, H2O) T (Mg, H2O) T (Ca, H2O) T (Al, H2O) | |
| 446 461 | 445 466 | 415 493 | 451 472 | 412 469 529 | ν2(SO4) |
| 613 | 618 | 621 671 | 597 | 612 | ν4(SO4) |
| 985 | 977 | 1008 | 1011 1032 | 992 | ν1(SO4) |
| 1061 1096 1145 | 1101 1139 | 1136 | 1183 | 1087 1127 | ν3(SO4) |
| 3297 3421 | 3240 3360 3426 | 3407 3495 | 3350 | 3252 | ν(H2O) |
Publisher’s Note: MDPI stays neutral with regard to jurisdictional claims in published maps and institutional affiliations. |
© 2021 by the authors. Licensee MDPI, Basel, Switzerland. This article is an open access article distributed under the terms and conditions of the Creative Commons Attribution (CC BY) license (https://creativecommons.org/licenses/by/4.0/).
Share and Cite
MDPI and ACS Style
Qu, H.; Ling, Z.; Qi, X.; Xin, Y.; Liu, C.; Cao, H. A Remote Raman System and Its Applications for Planetary Material Studies. Sensors 2021, 21, 6973. https://doi.org/10.3390/s21216973
AMA Style
Qu H, Ling Z, Qi X, Xin Y, Liu C, Cao H. A Remote Raman System and Its Applications for Planetary Material Studies. Sensors. 2021; 21(21):6973. https://doi.org/10.3390/s21216973
Chicago/Turabian StyleQu, Hongkun, Zongcheng Ling, Xiaobin Qi, Yanqing Xin, Changqing Liu, and Haijun Cao. 2021. "A Remote Raman System and Its Applications for Planetary Material Studies" Sensors 21, no. 21: 6973. https://doi.org/10.3390/s21216973
Note that from the first issue of 2016, this journal uses article numbers instead of page numbers. See further details here.