
Design and Validation of a Reflectarray Antenna with Optimized Beam for Ground Target Monitoring with a DVB-S-Based Passive Radar

 ,
, 
Abstract
:1. Introduction
2. Design Method
3. Design Characteristics
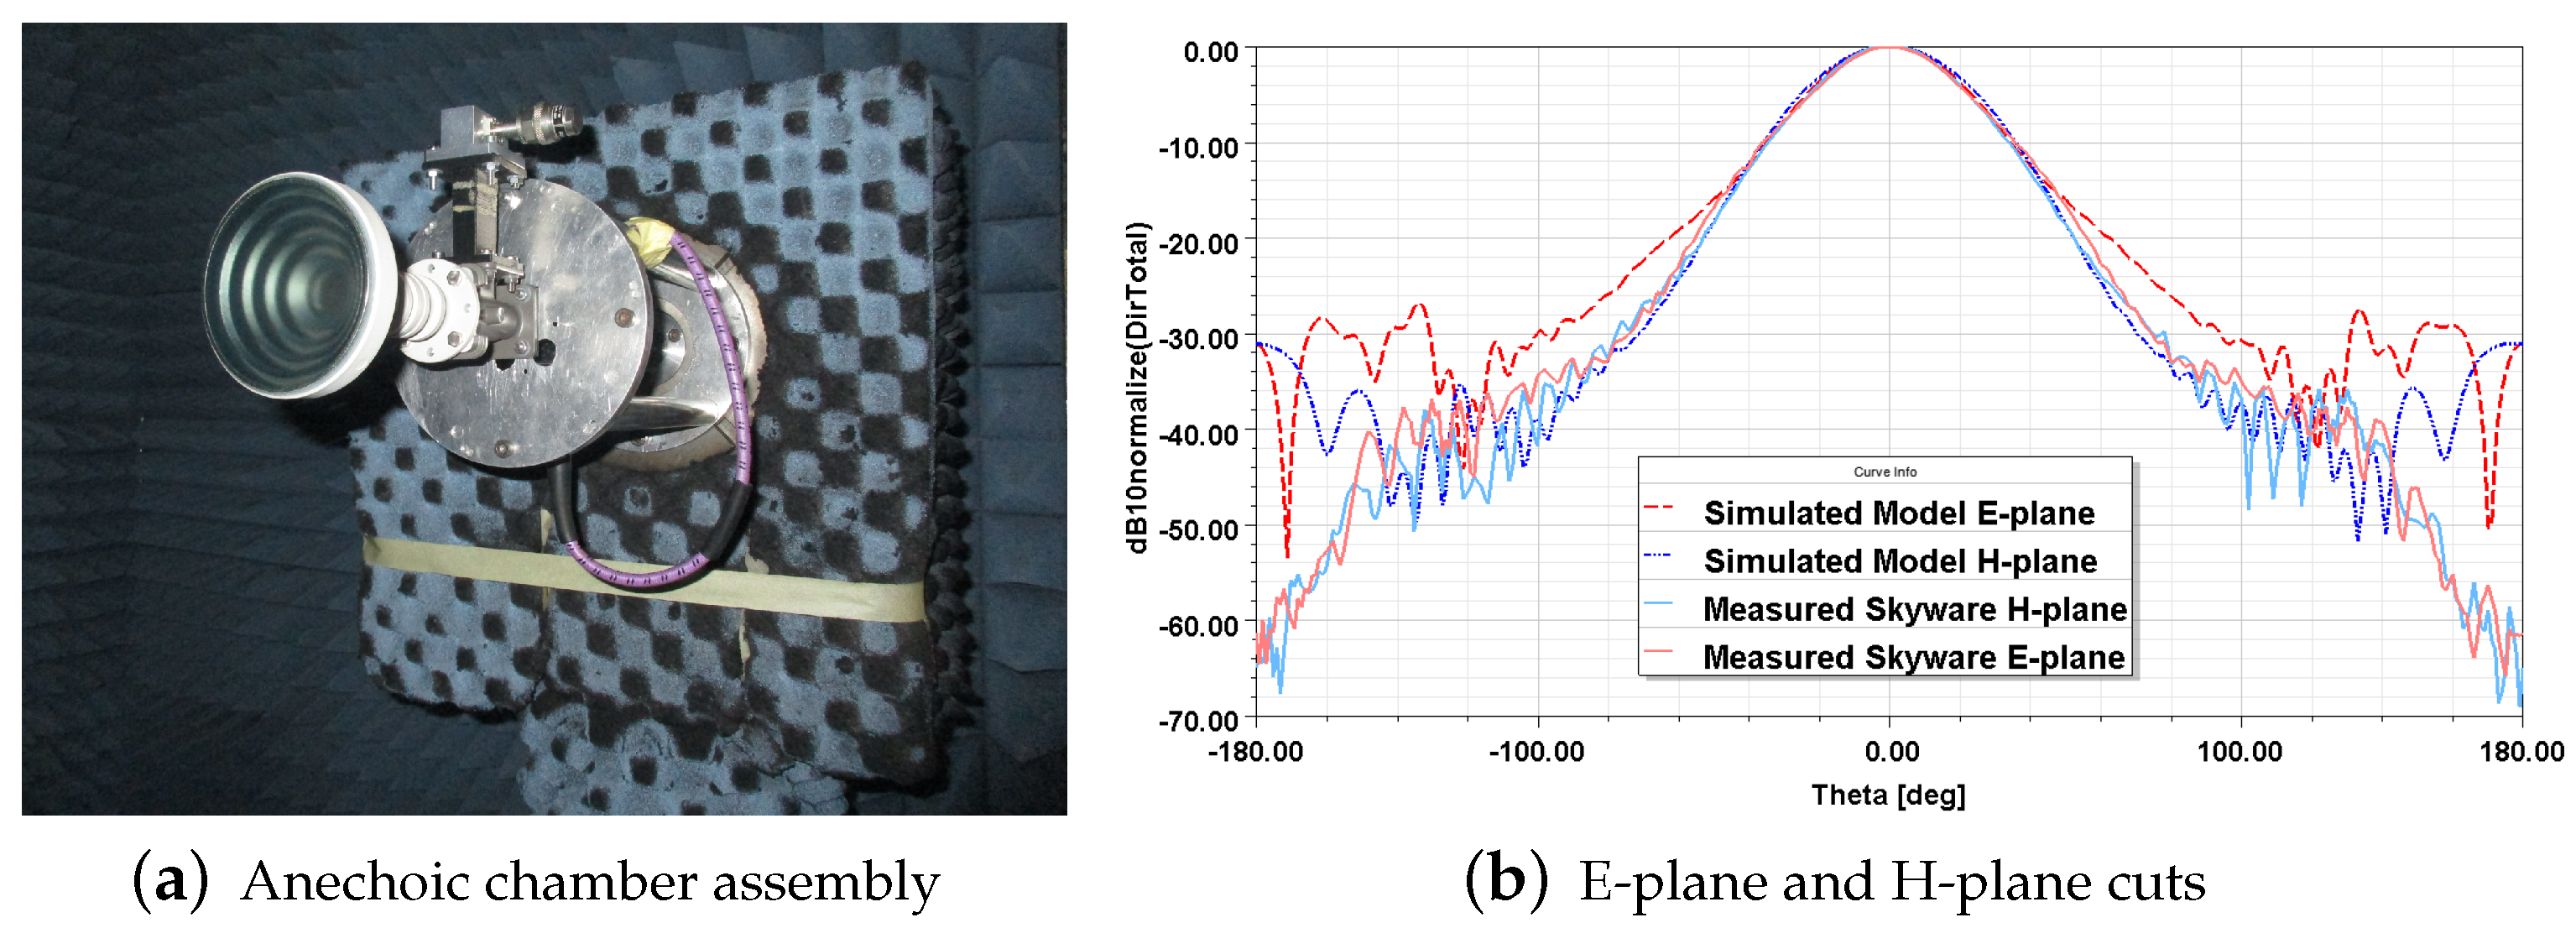
3.1. Feed Characterization
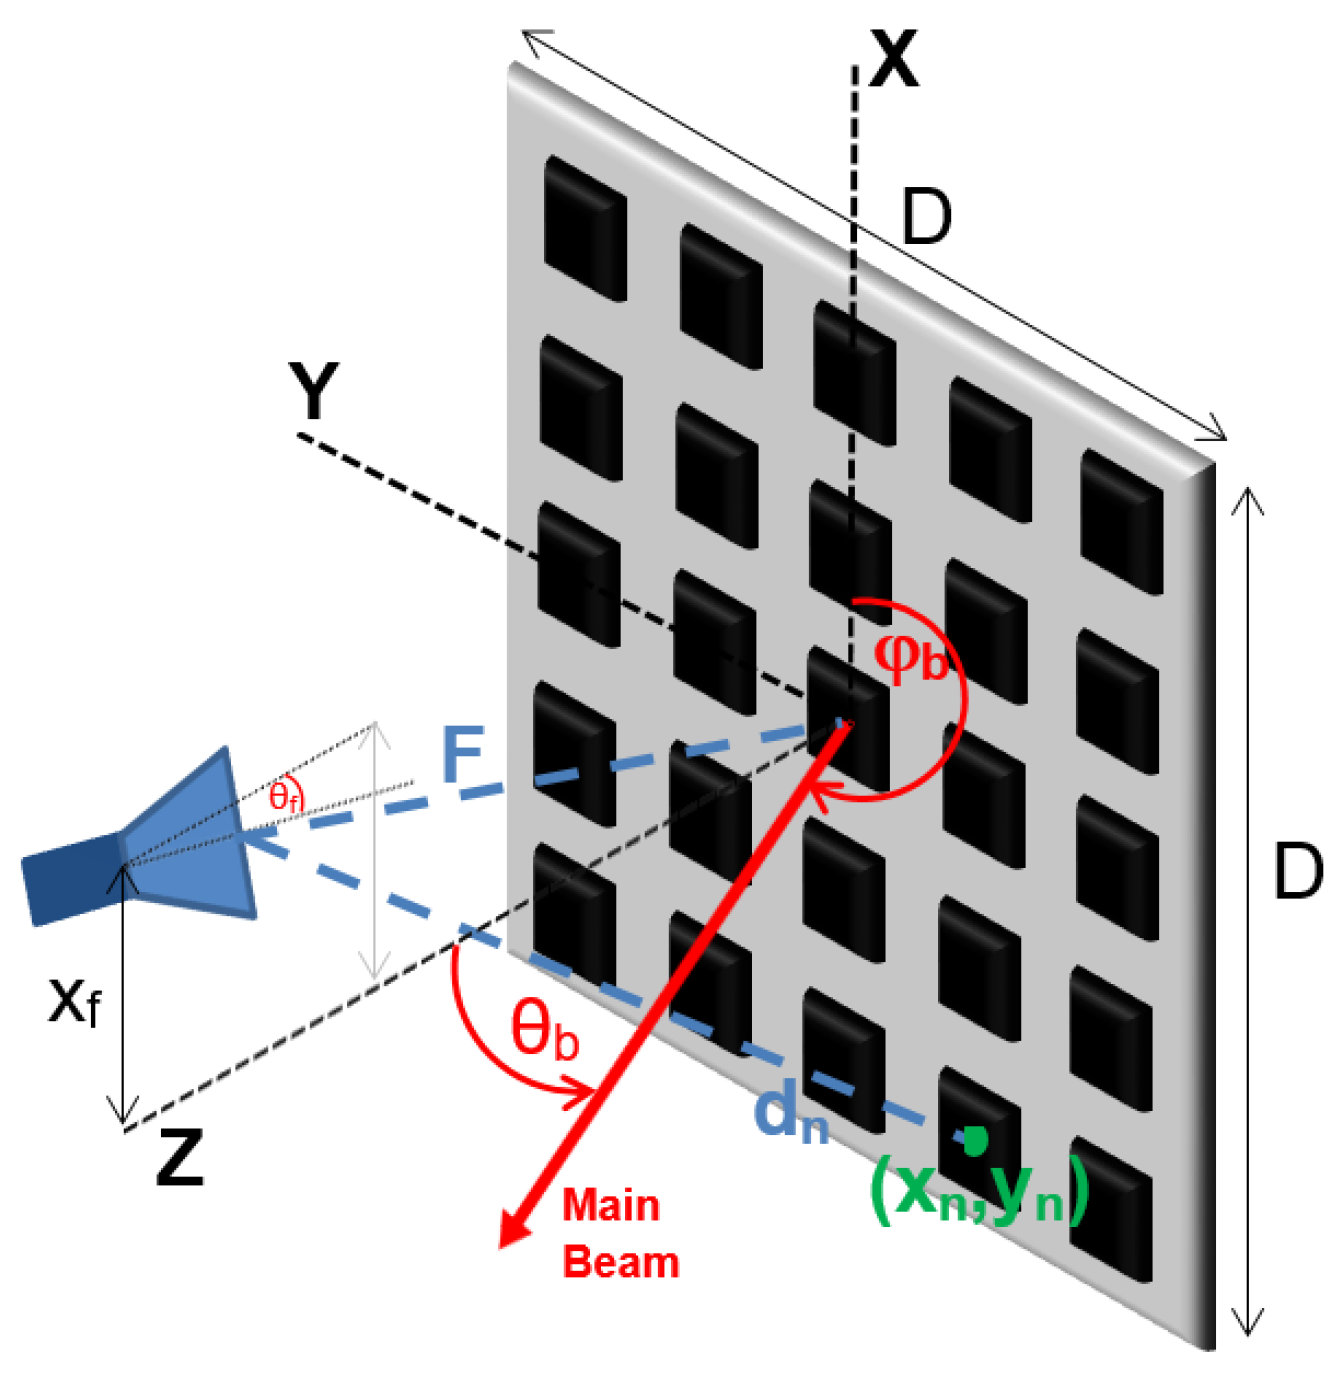
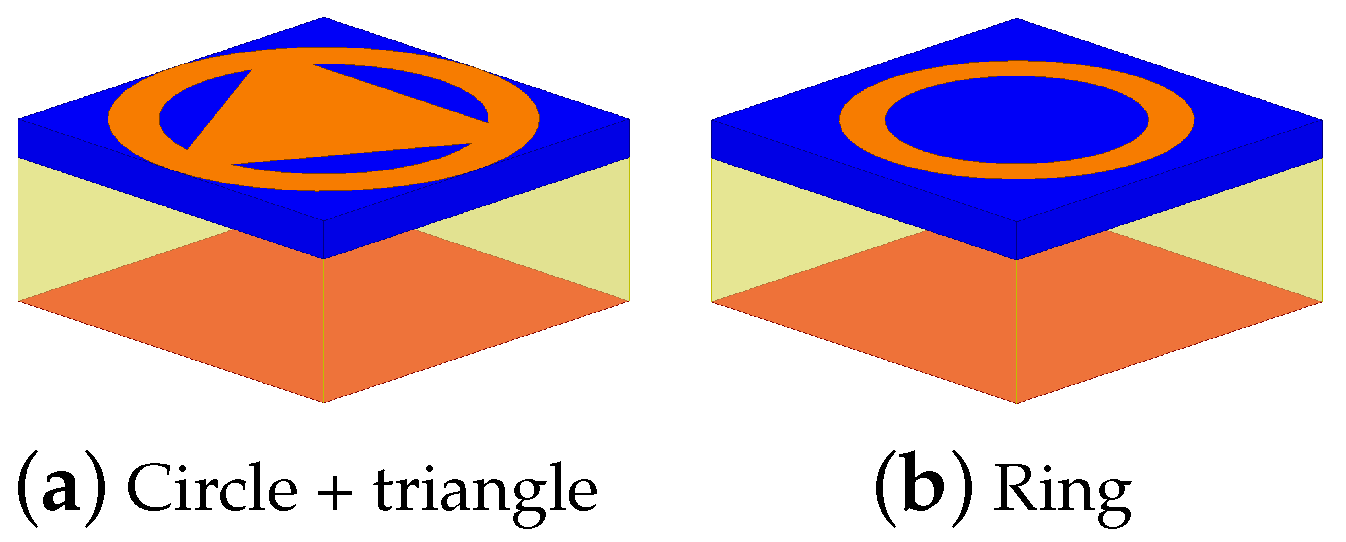
3.2. Geometry Selection
- The feed is located at position mm, mm (due to feedarm misalignment) and mm. This position implies a focal length mm. It has an angle of rotation with respect to the normal of the aperture.
- The feedarm limits physically the maximum semi-distance from the centre to one edge of the aperture in X axis dimension to mm.
- The focal length to reflectarray diameter ratio () is selected to maximize the aperture efficiency in Y axis dimension, while the X axis size () is increased from the one achieving maximum aperture efficiency in order to decrease the elevation beamwidth. According to the horn radiation pattern and focal length, the aperture efficiency in the normal plane to Y axis is maximum for (), which means mm. is fixed at about 374 mm, achieving an aperture efficiency of .
- The inter-element spacing is fixed to be 17 mm, so a reflectarray of elements can be designed.
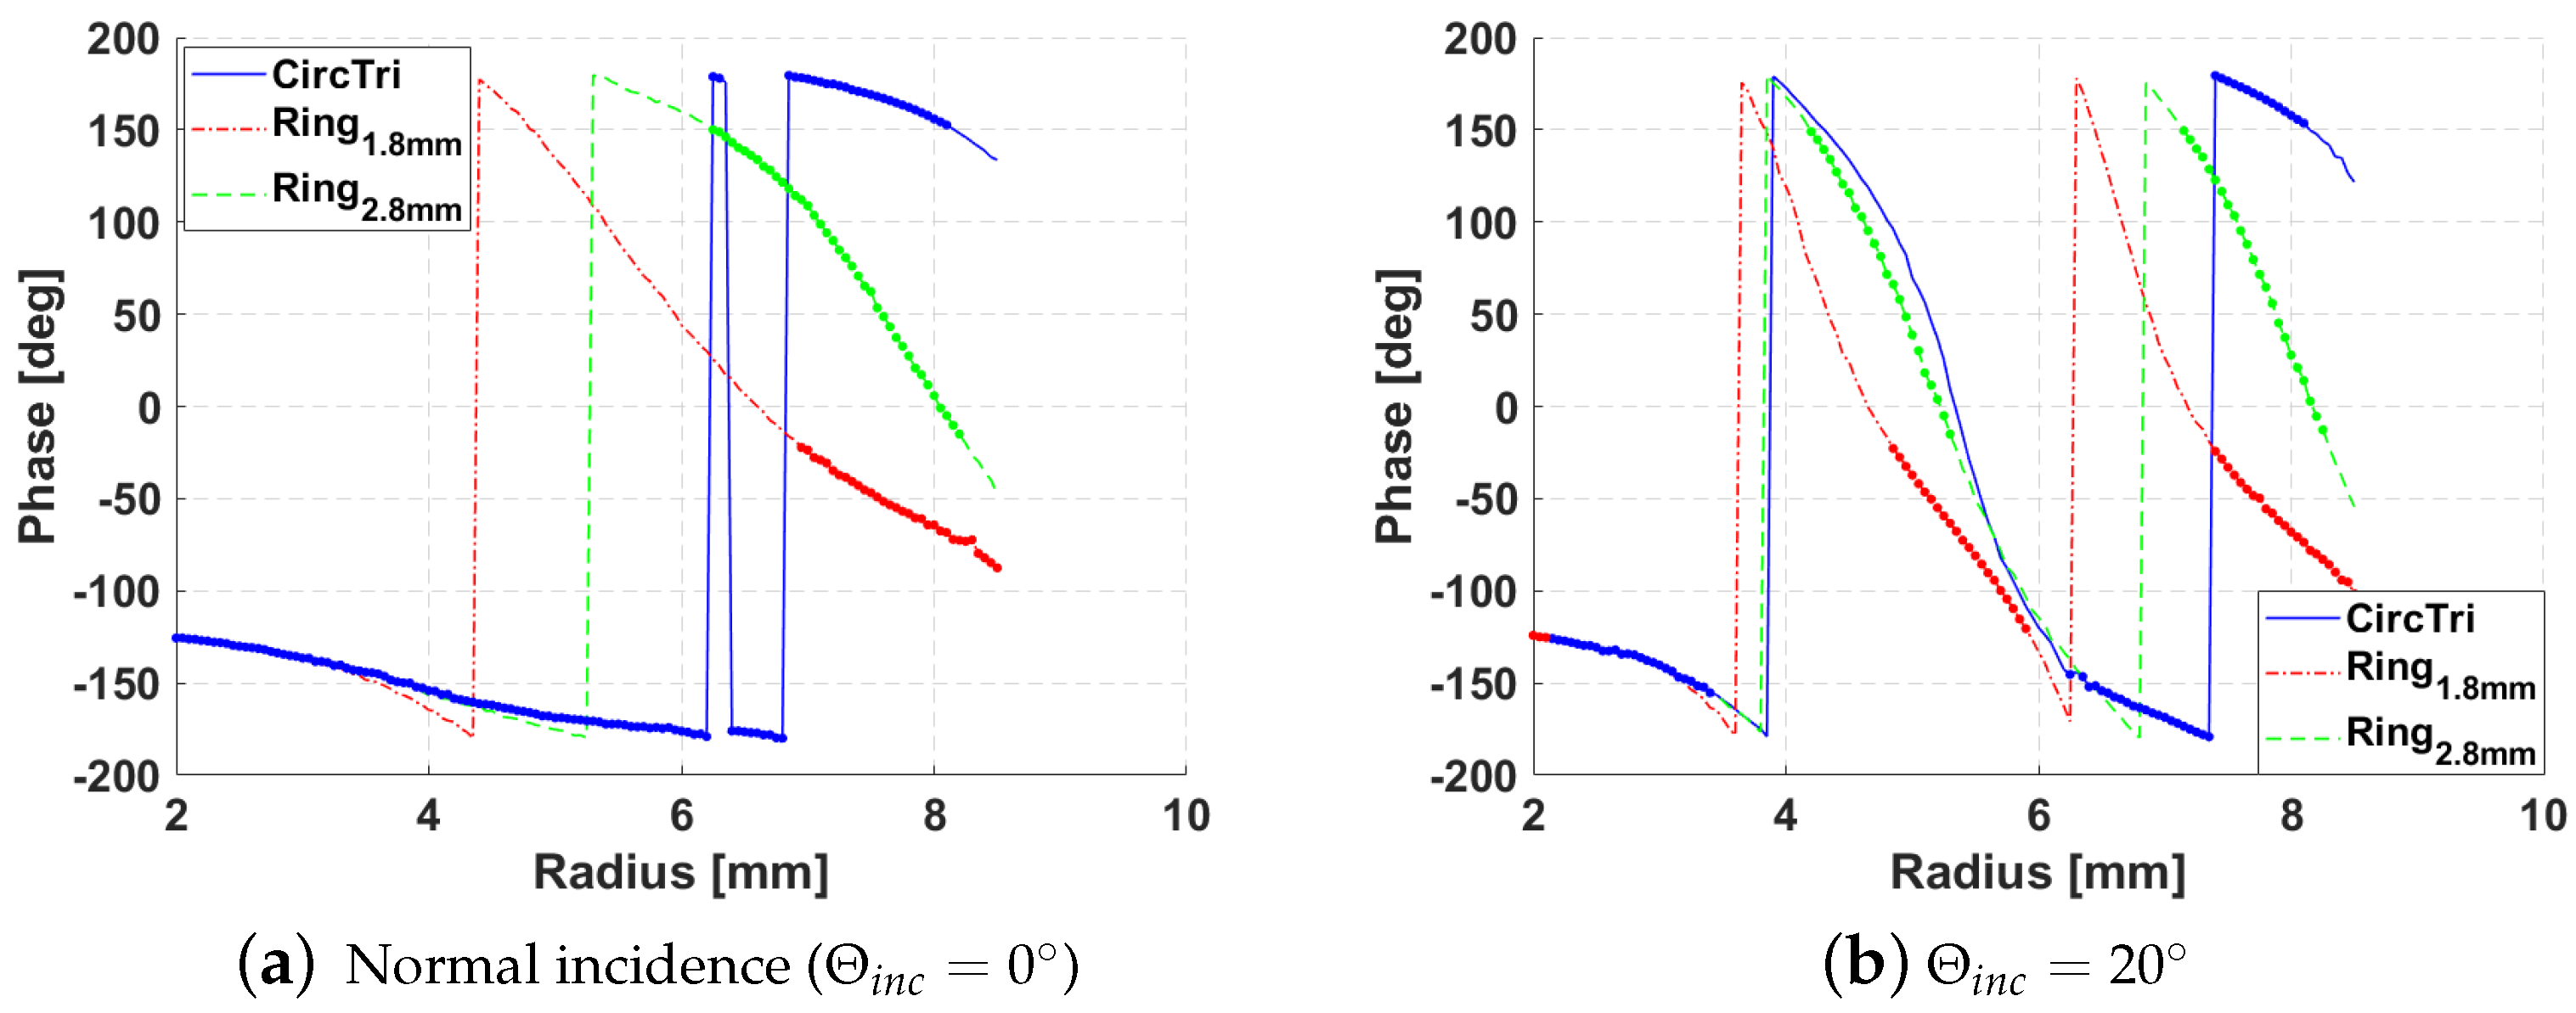
3.3. Element Selection
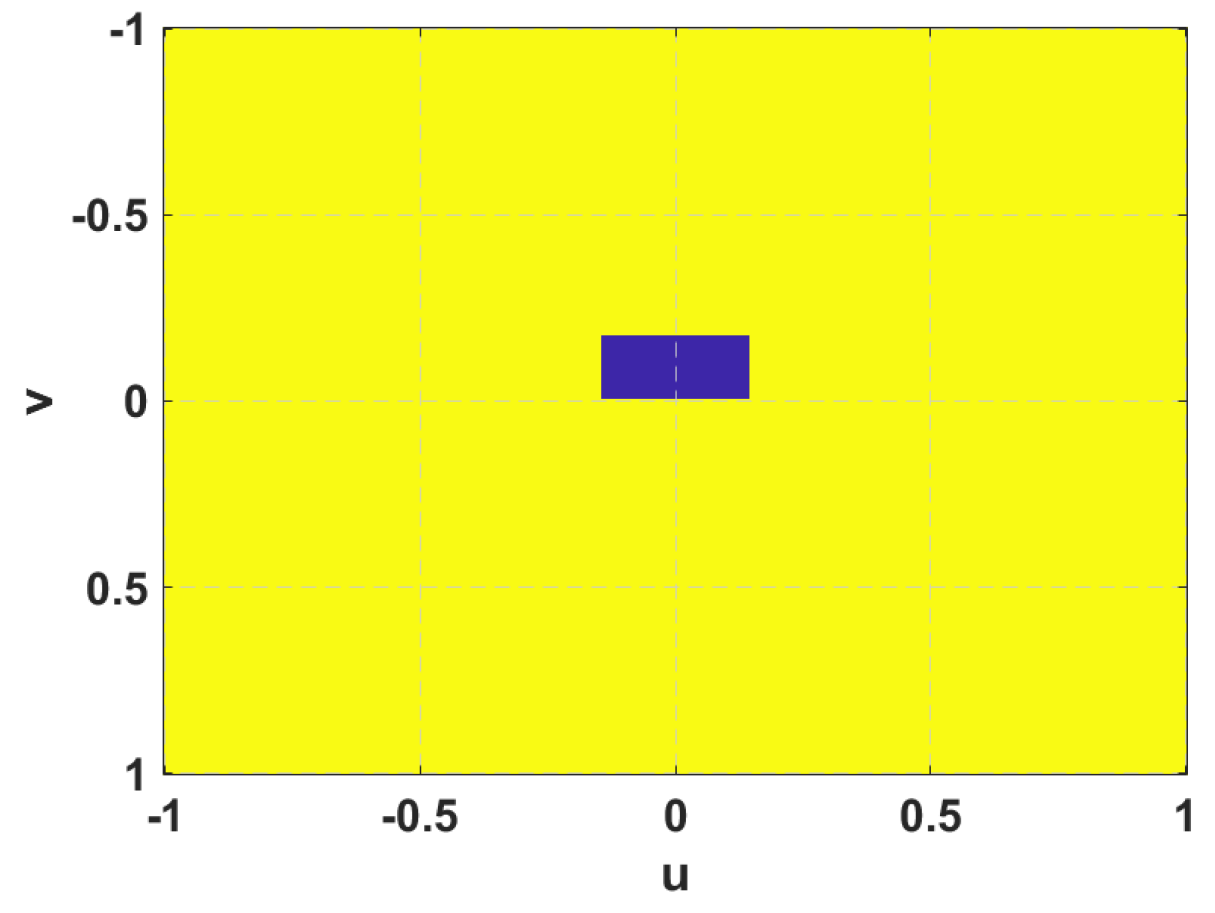
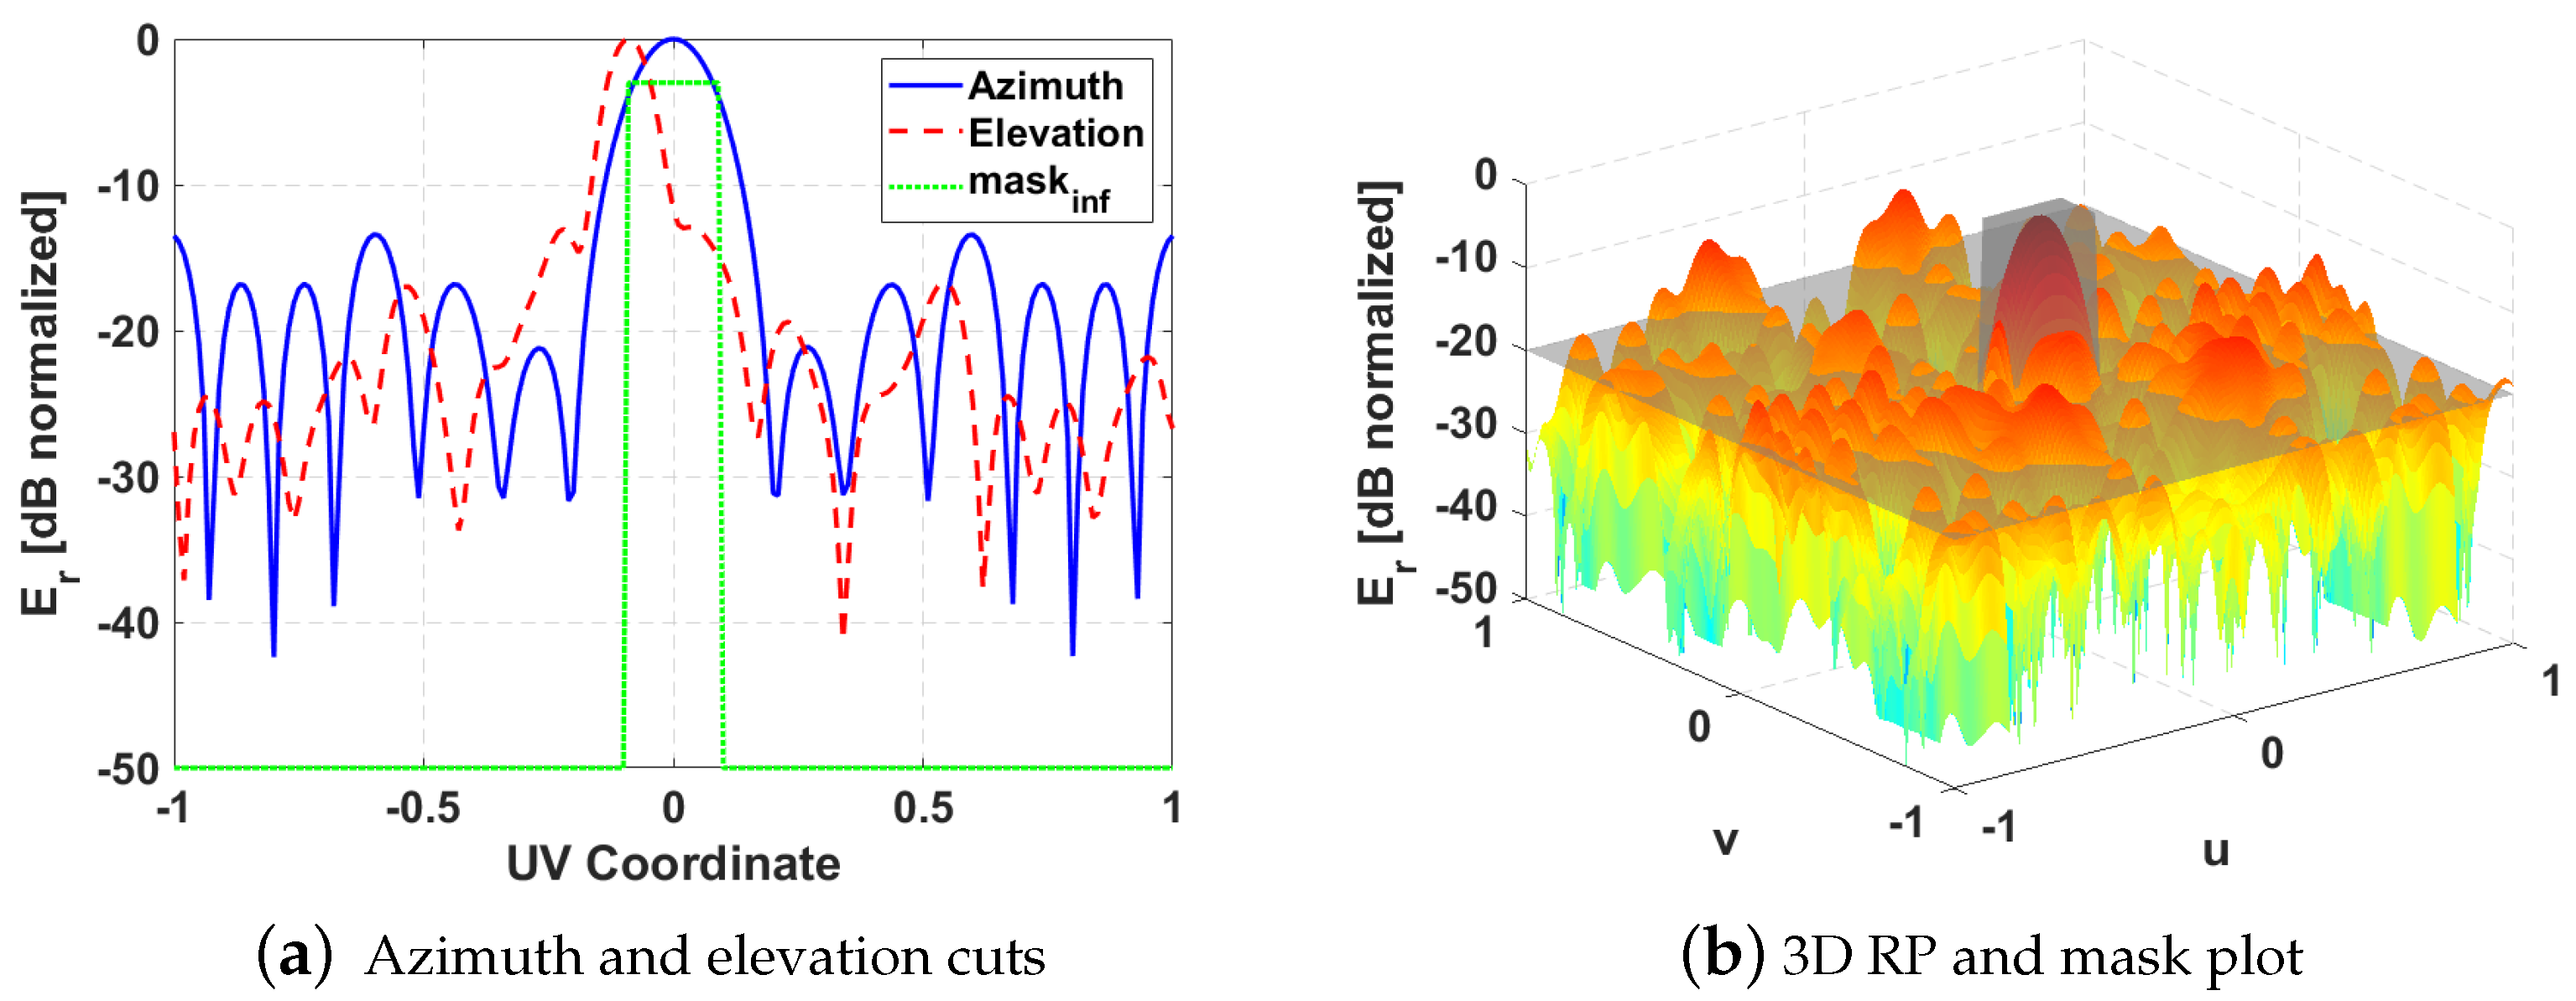
4. Design Results
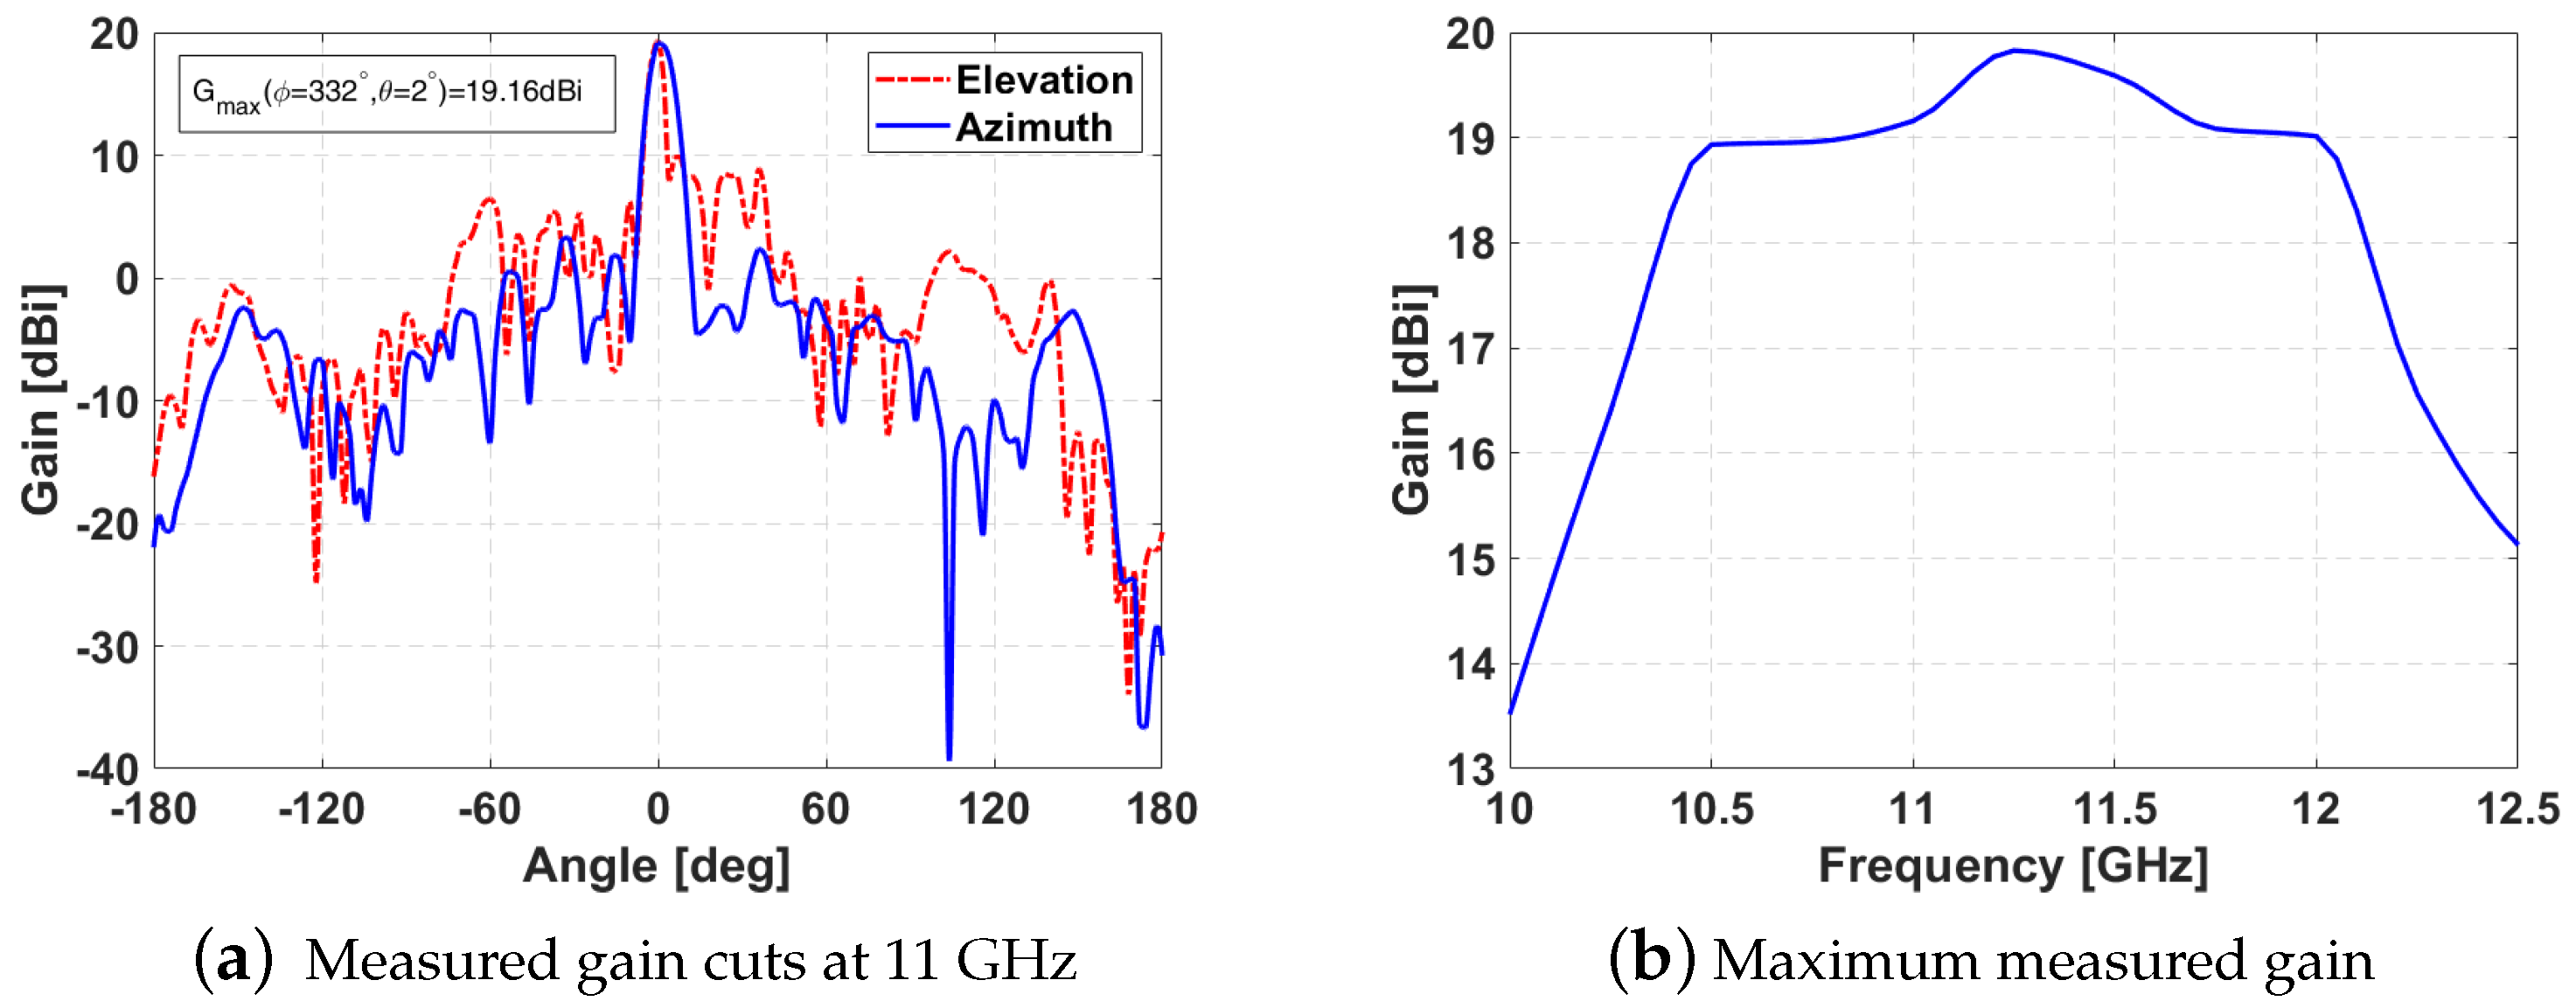
- Design frequency GHz and ;
- Azimuth 3 dB beamwidth: . Elevation 3 dB beamwidth: ;
- Azimuth 10 dB beamwidth: . Elevation 10 dB beamwidth: ;
- SLL: dB;
- ; ; .
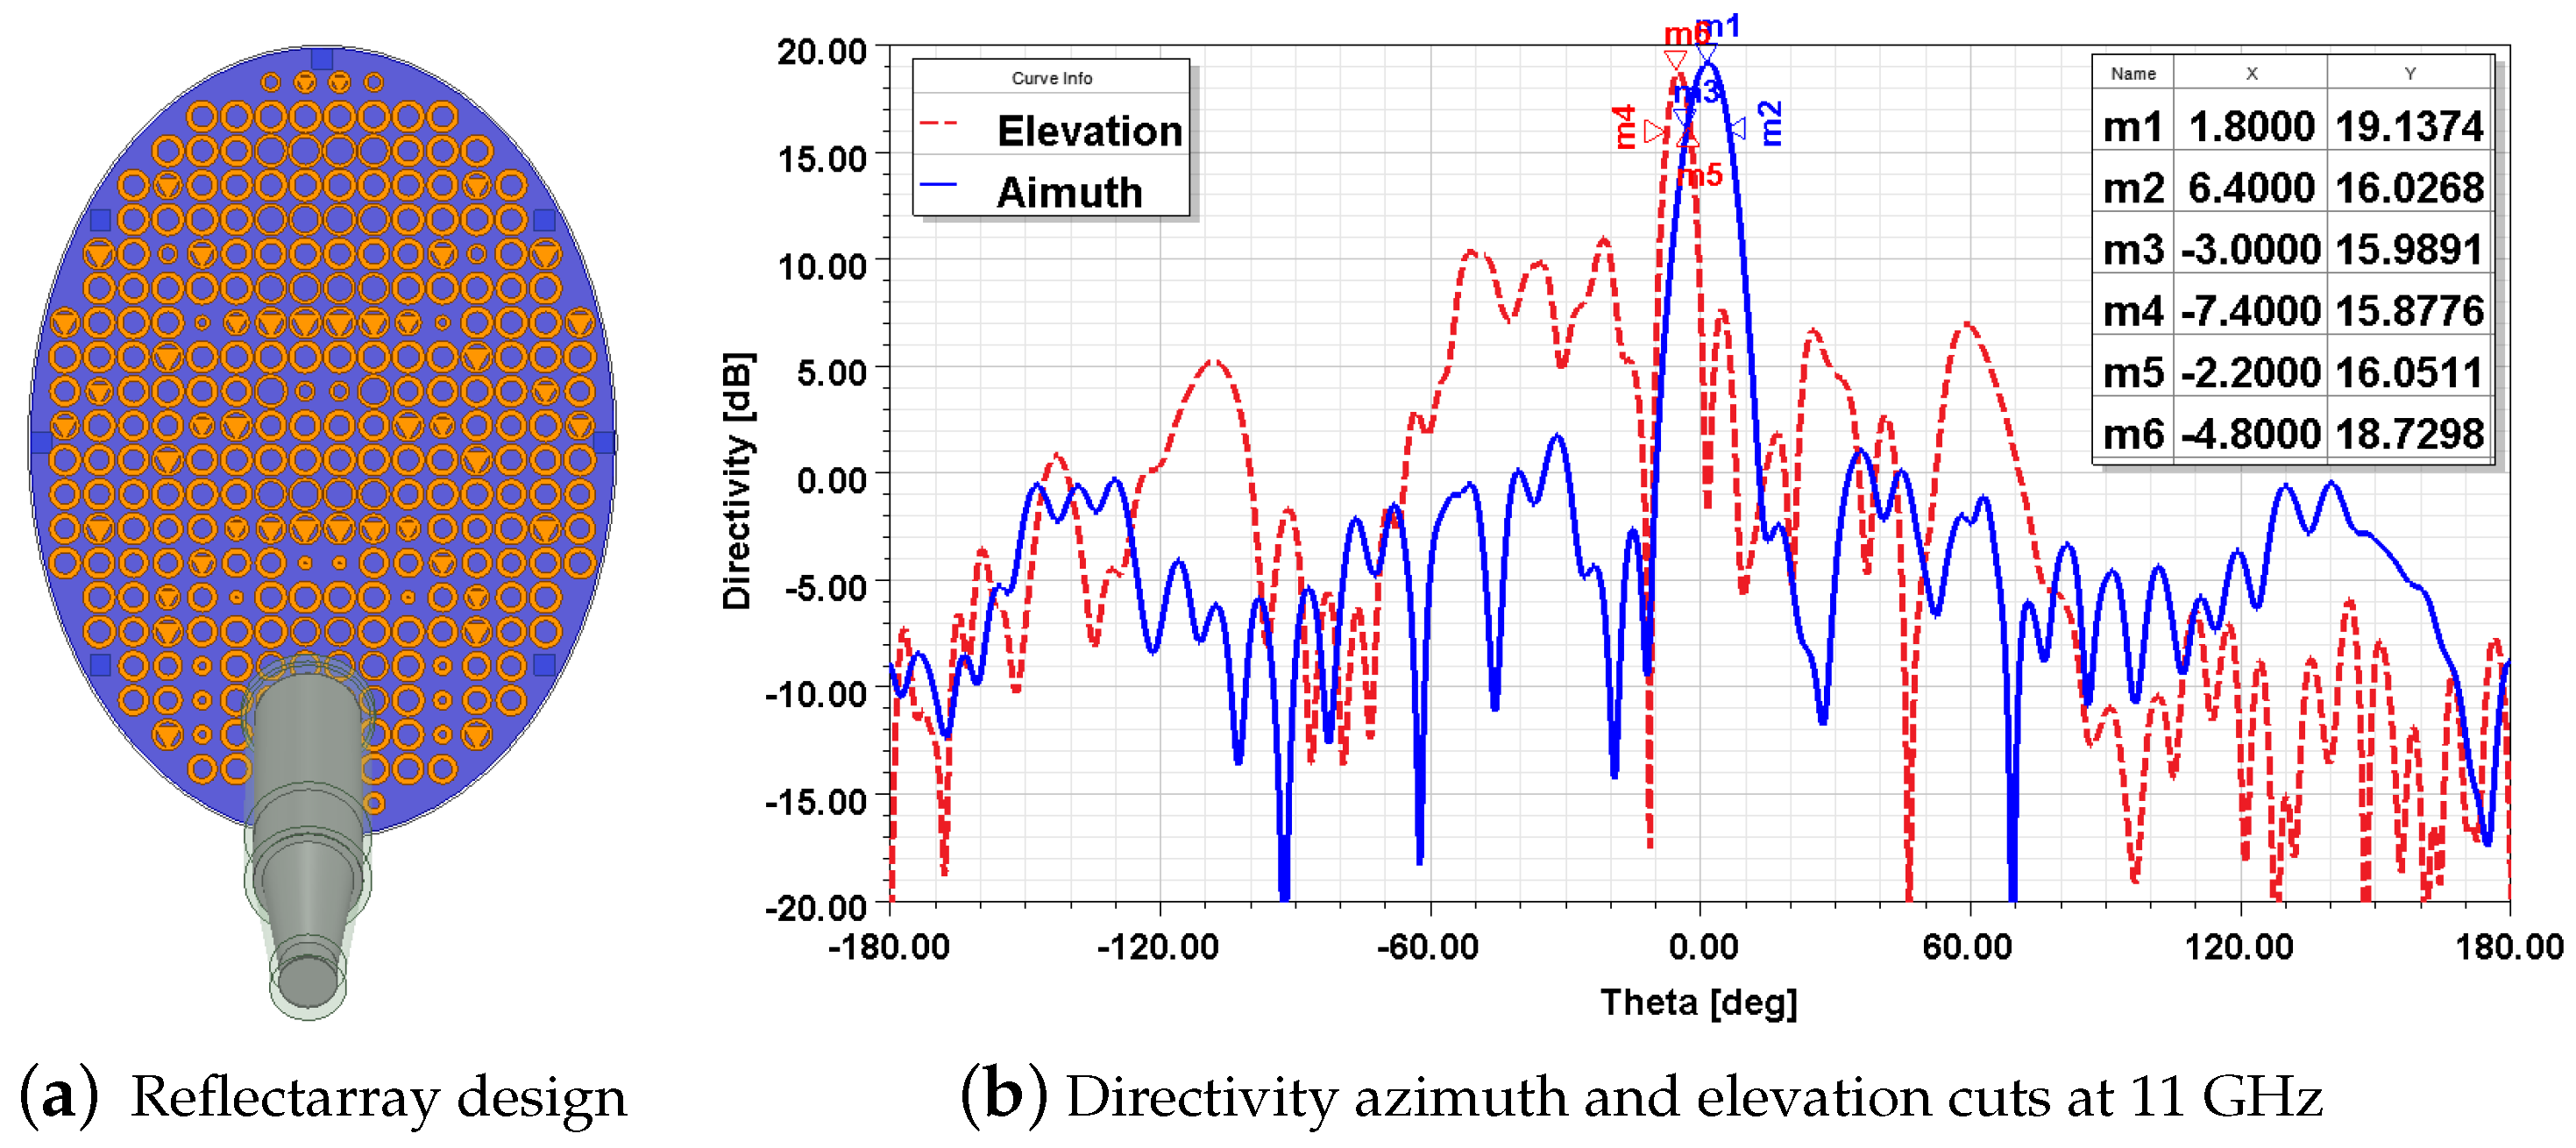
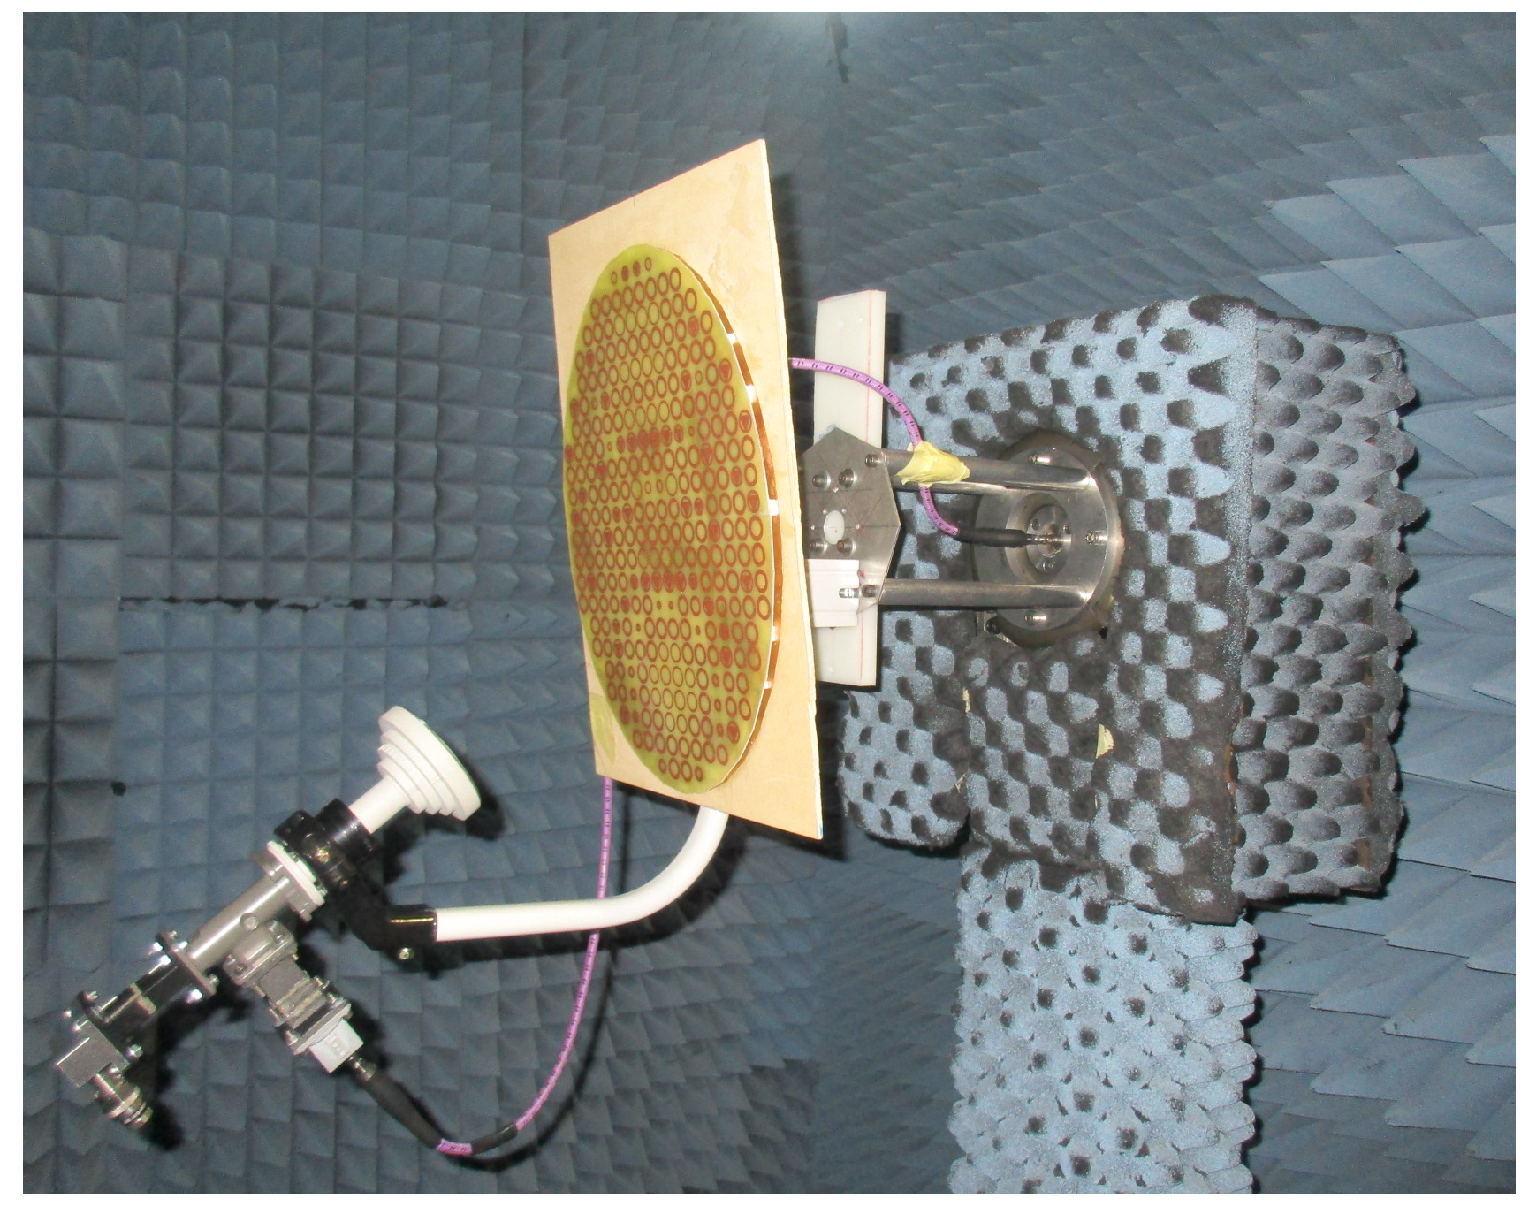
5. Prototype Characterization
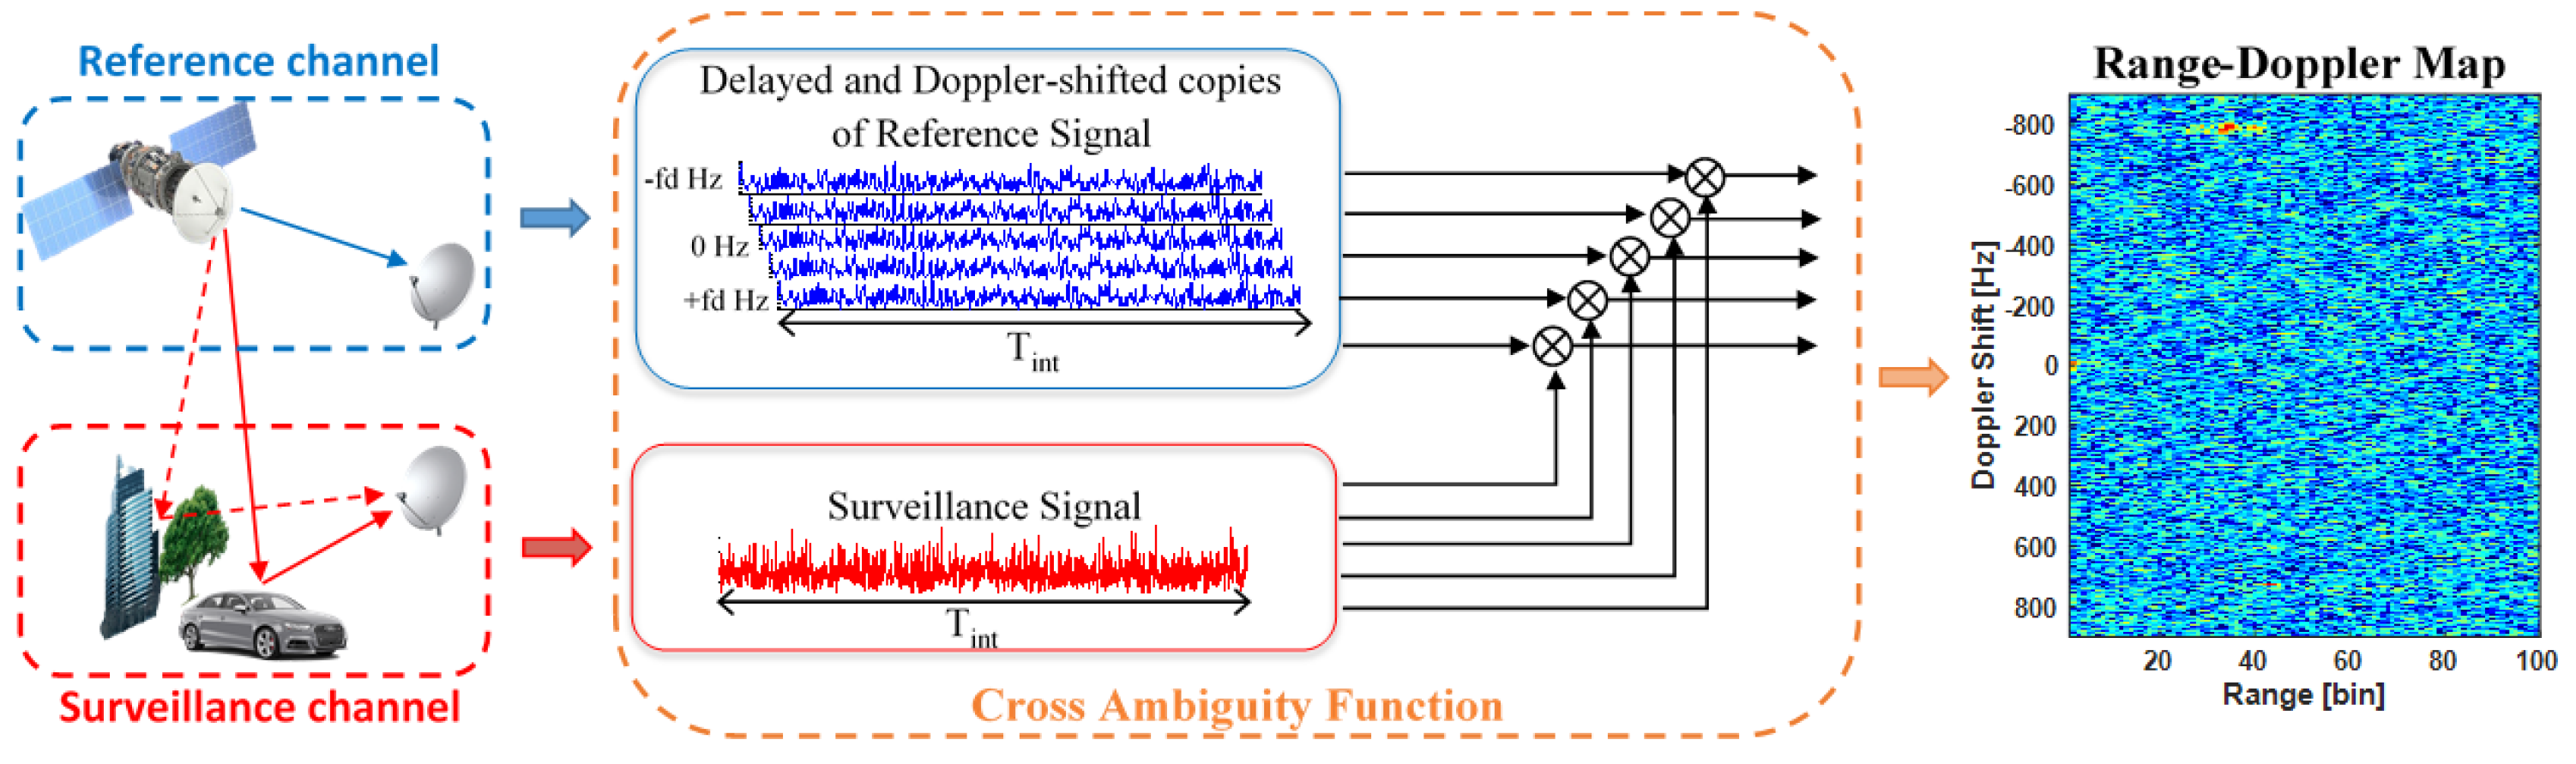
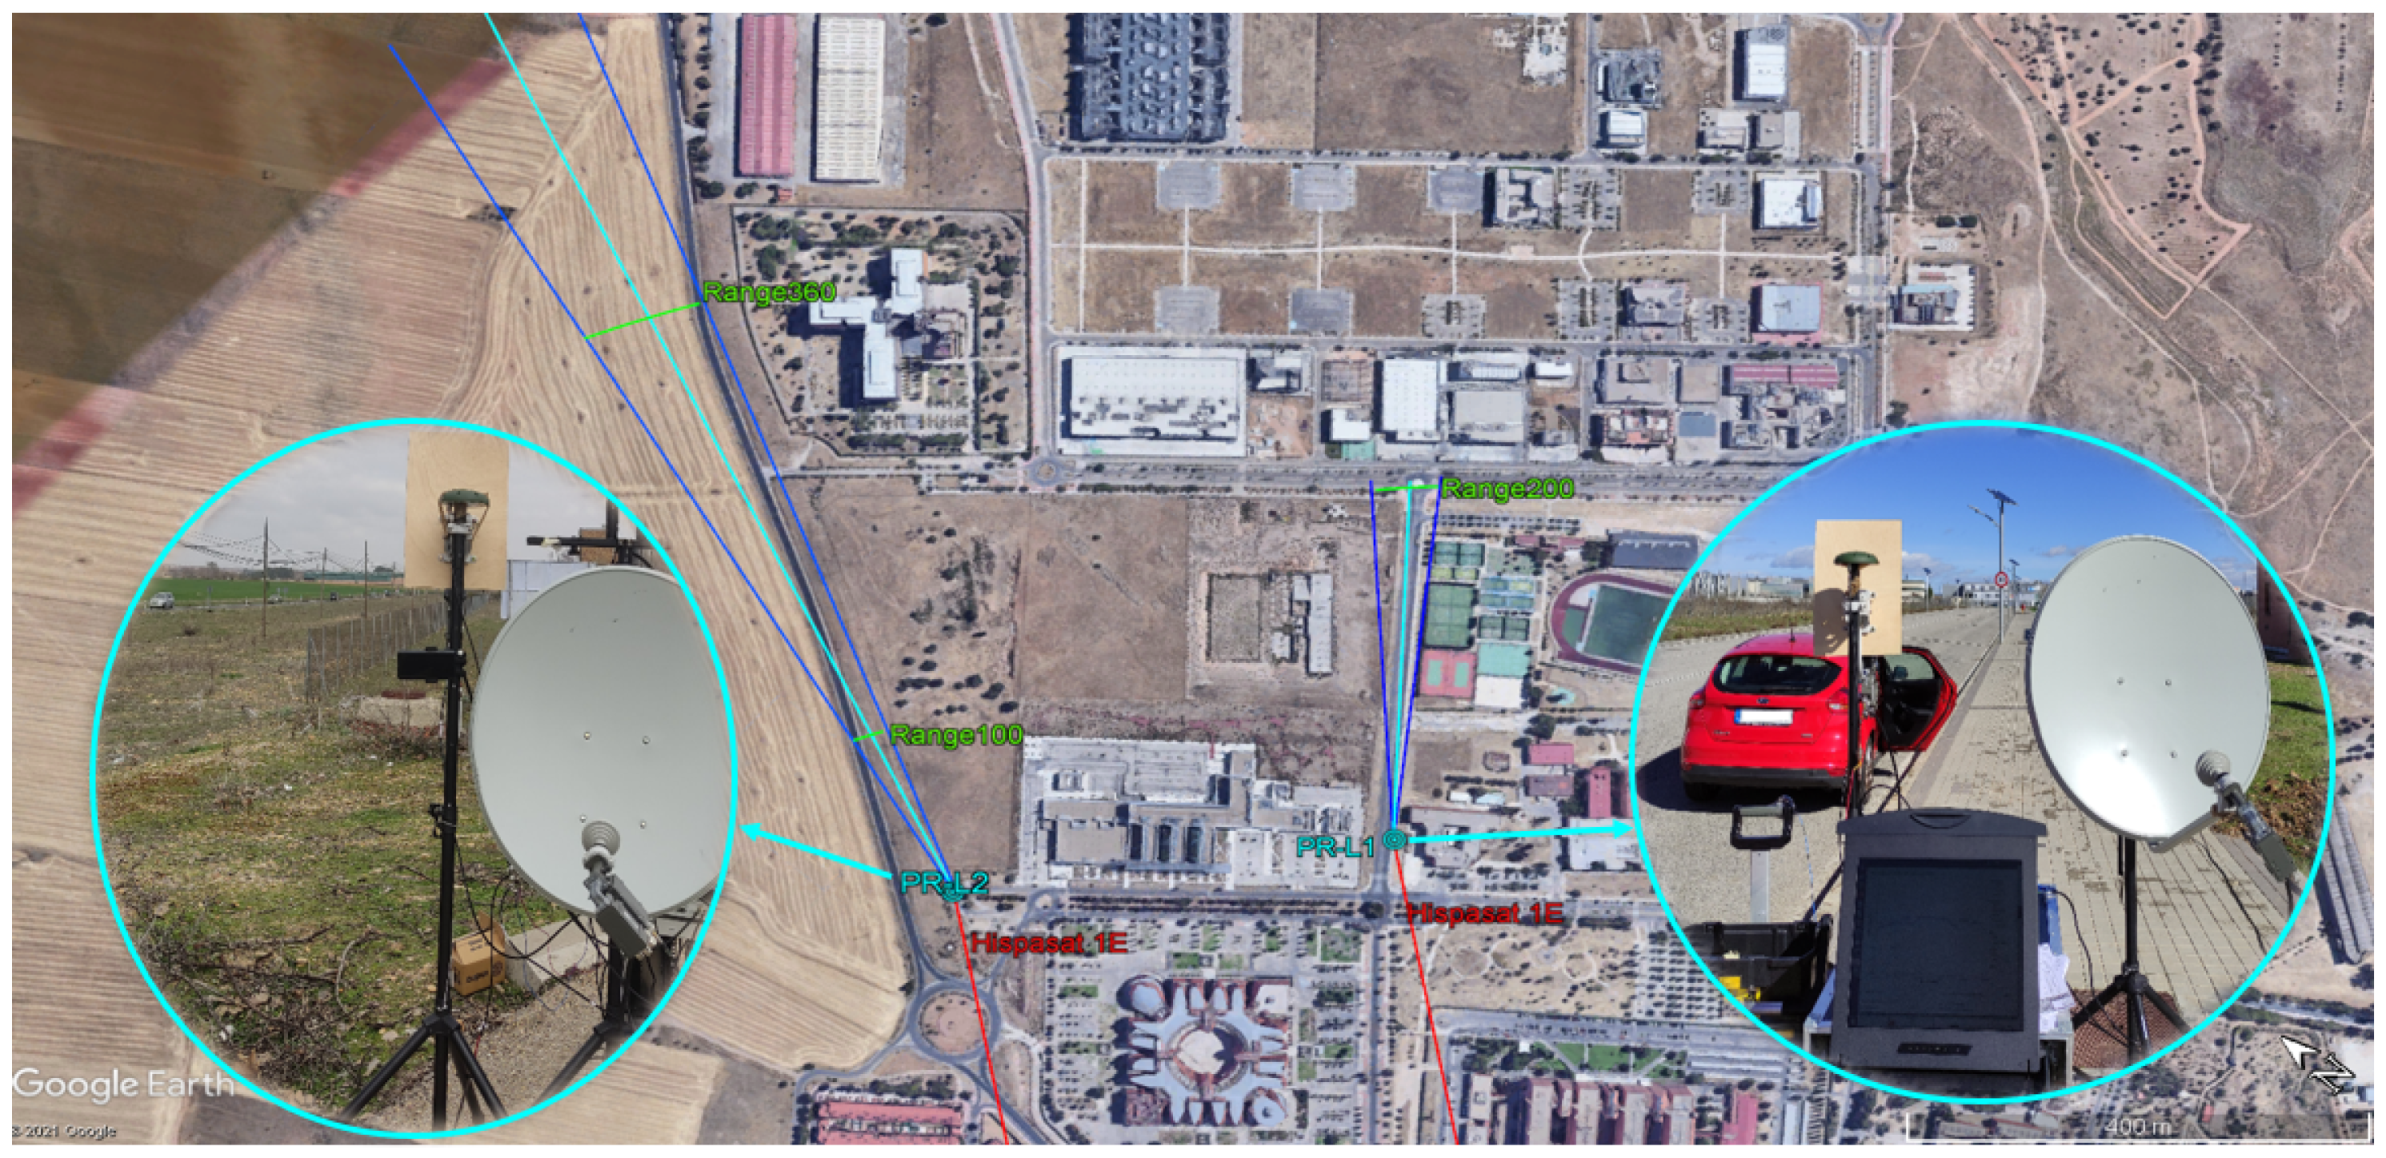
6. Validation in Real PR Trials
6.1. IDEPAR Demonstrator and Trials Scenario
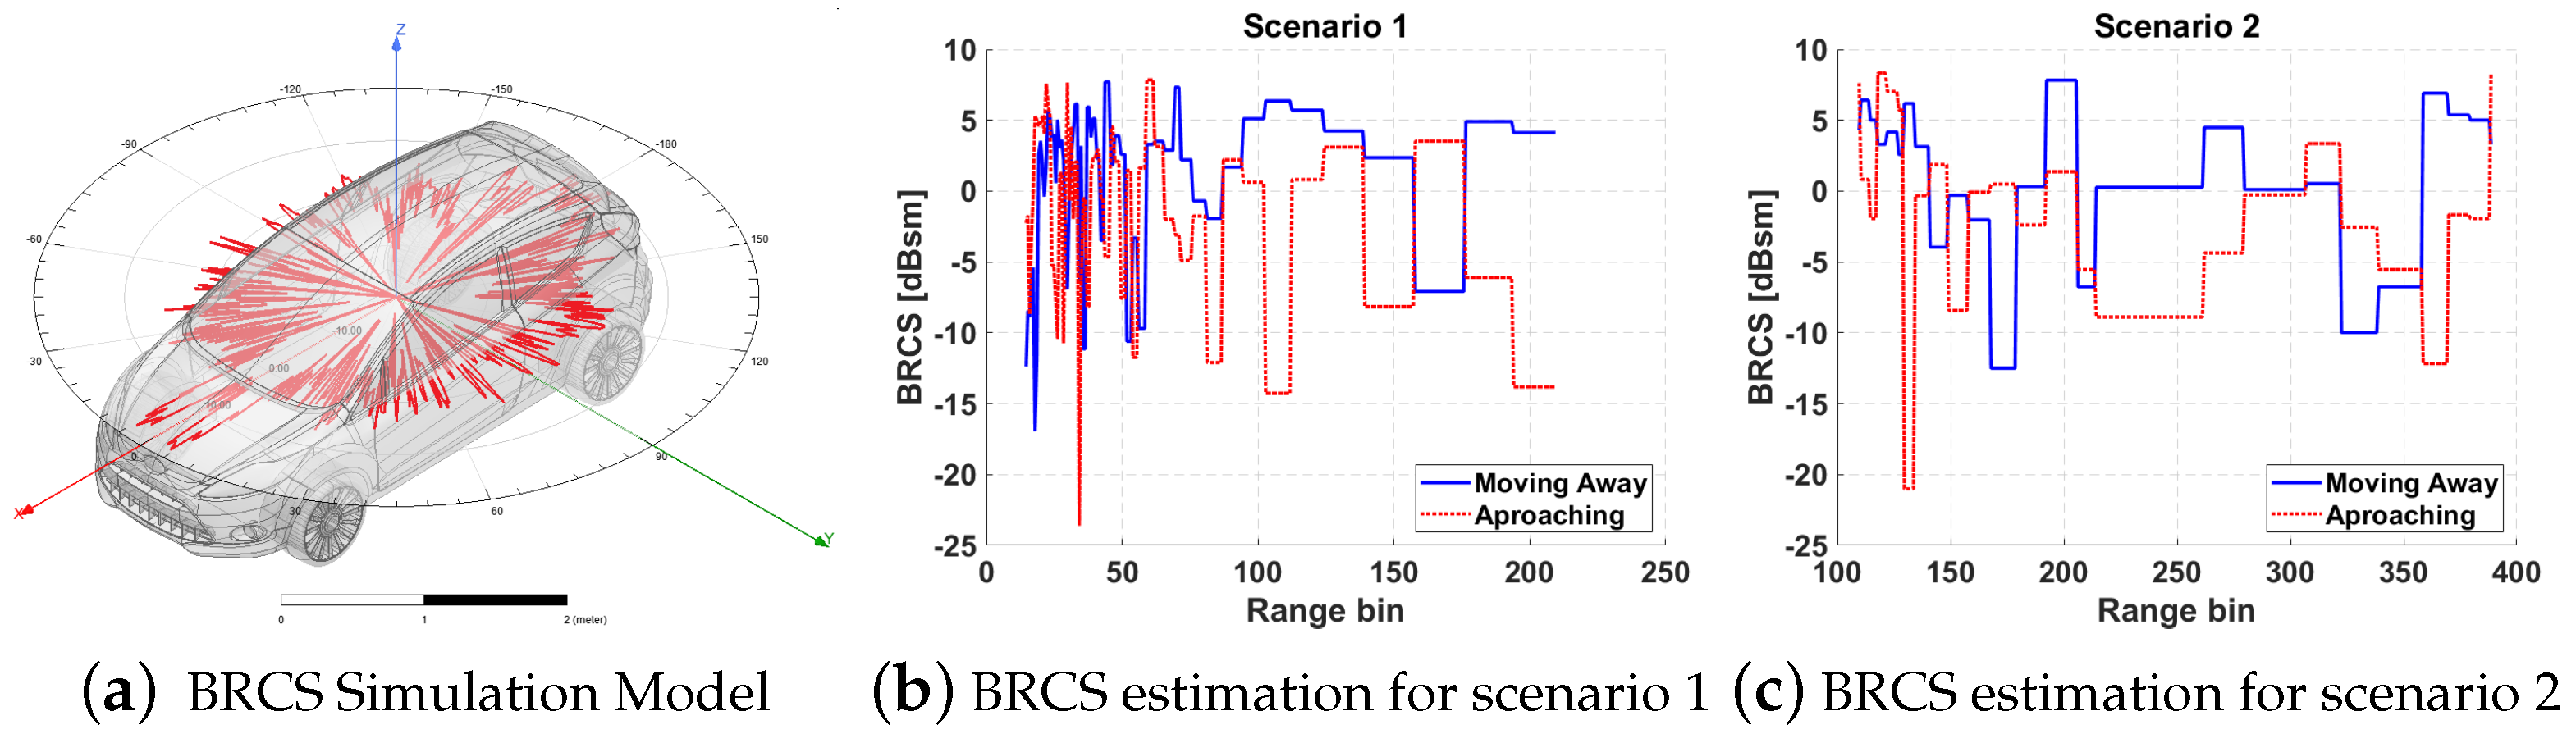
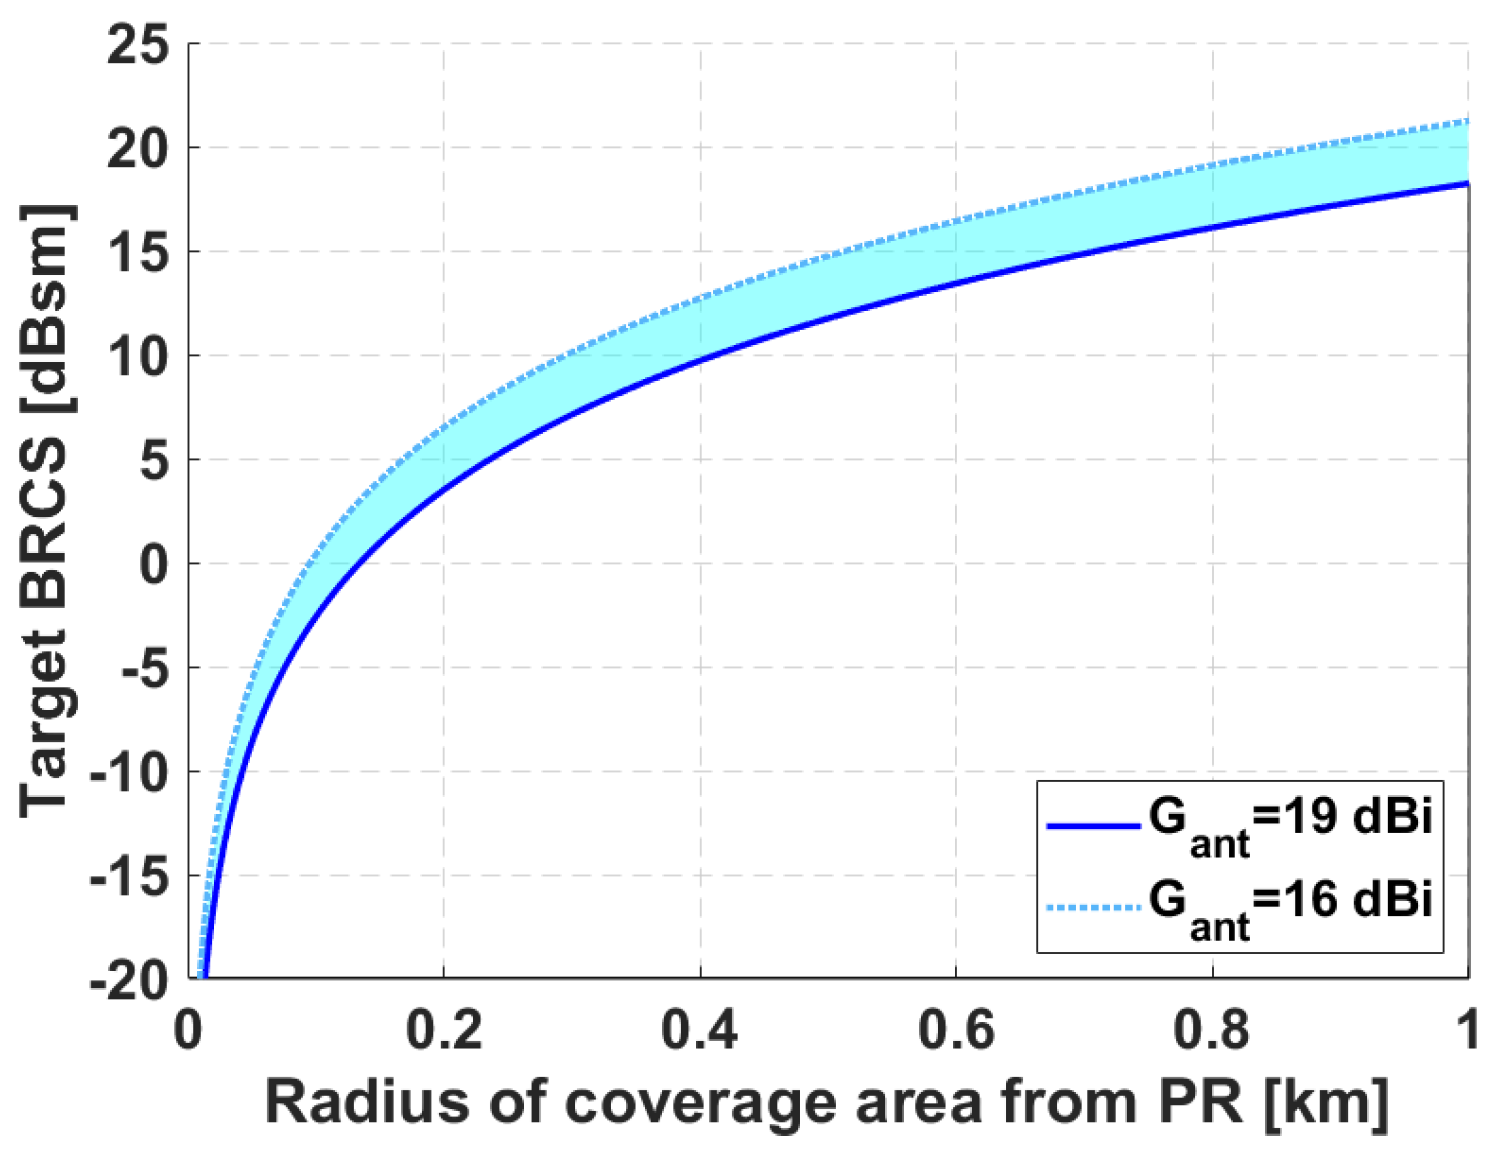
6.2. Target BRCS and Coverage Estimation
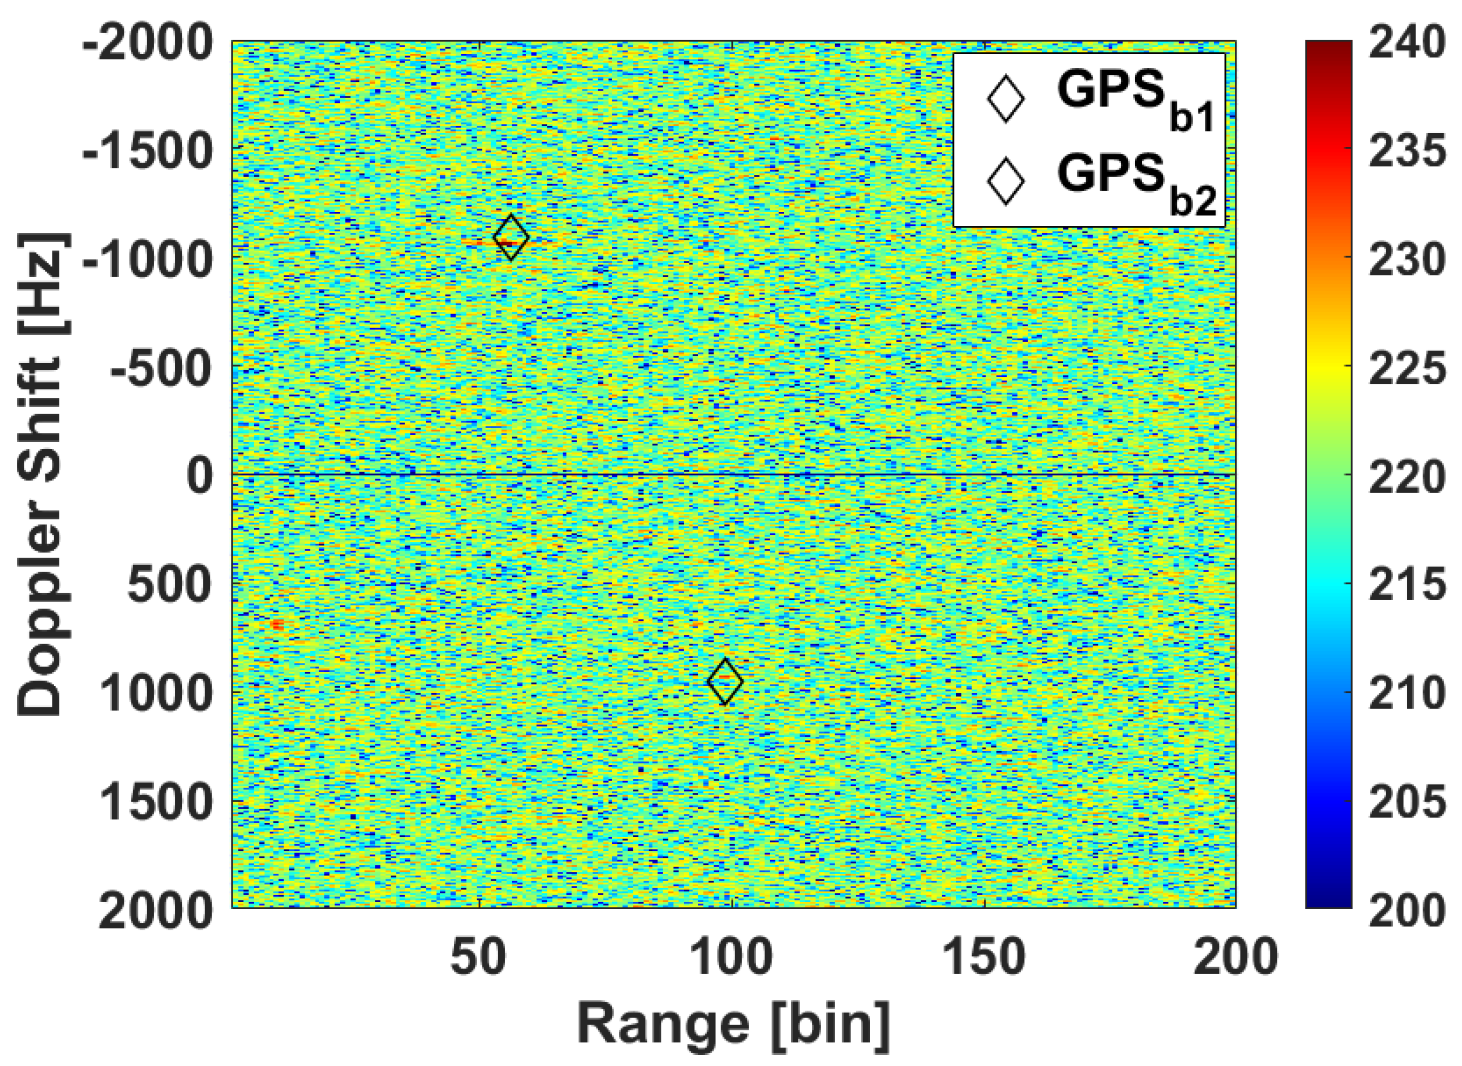
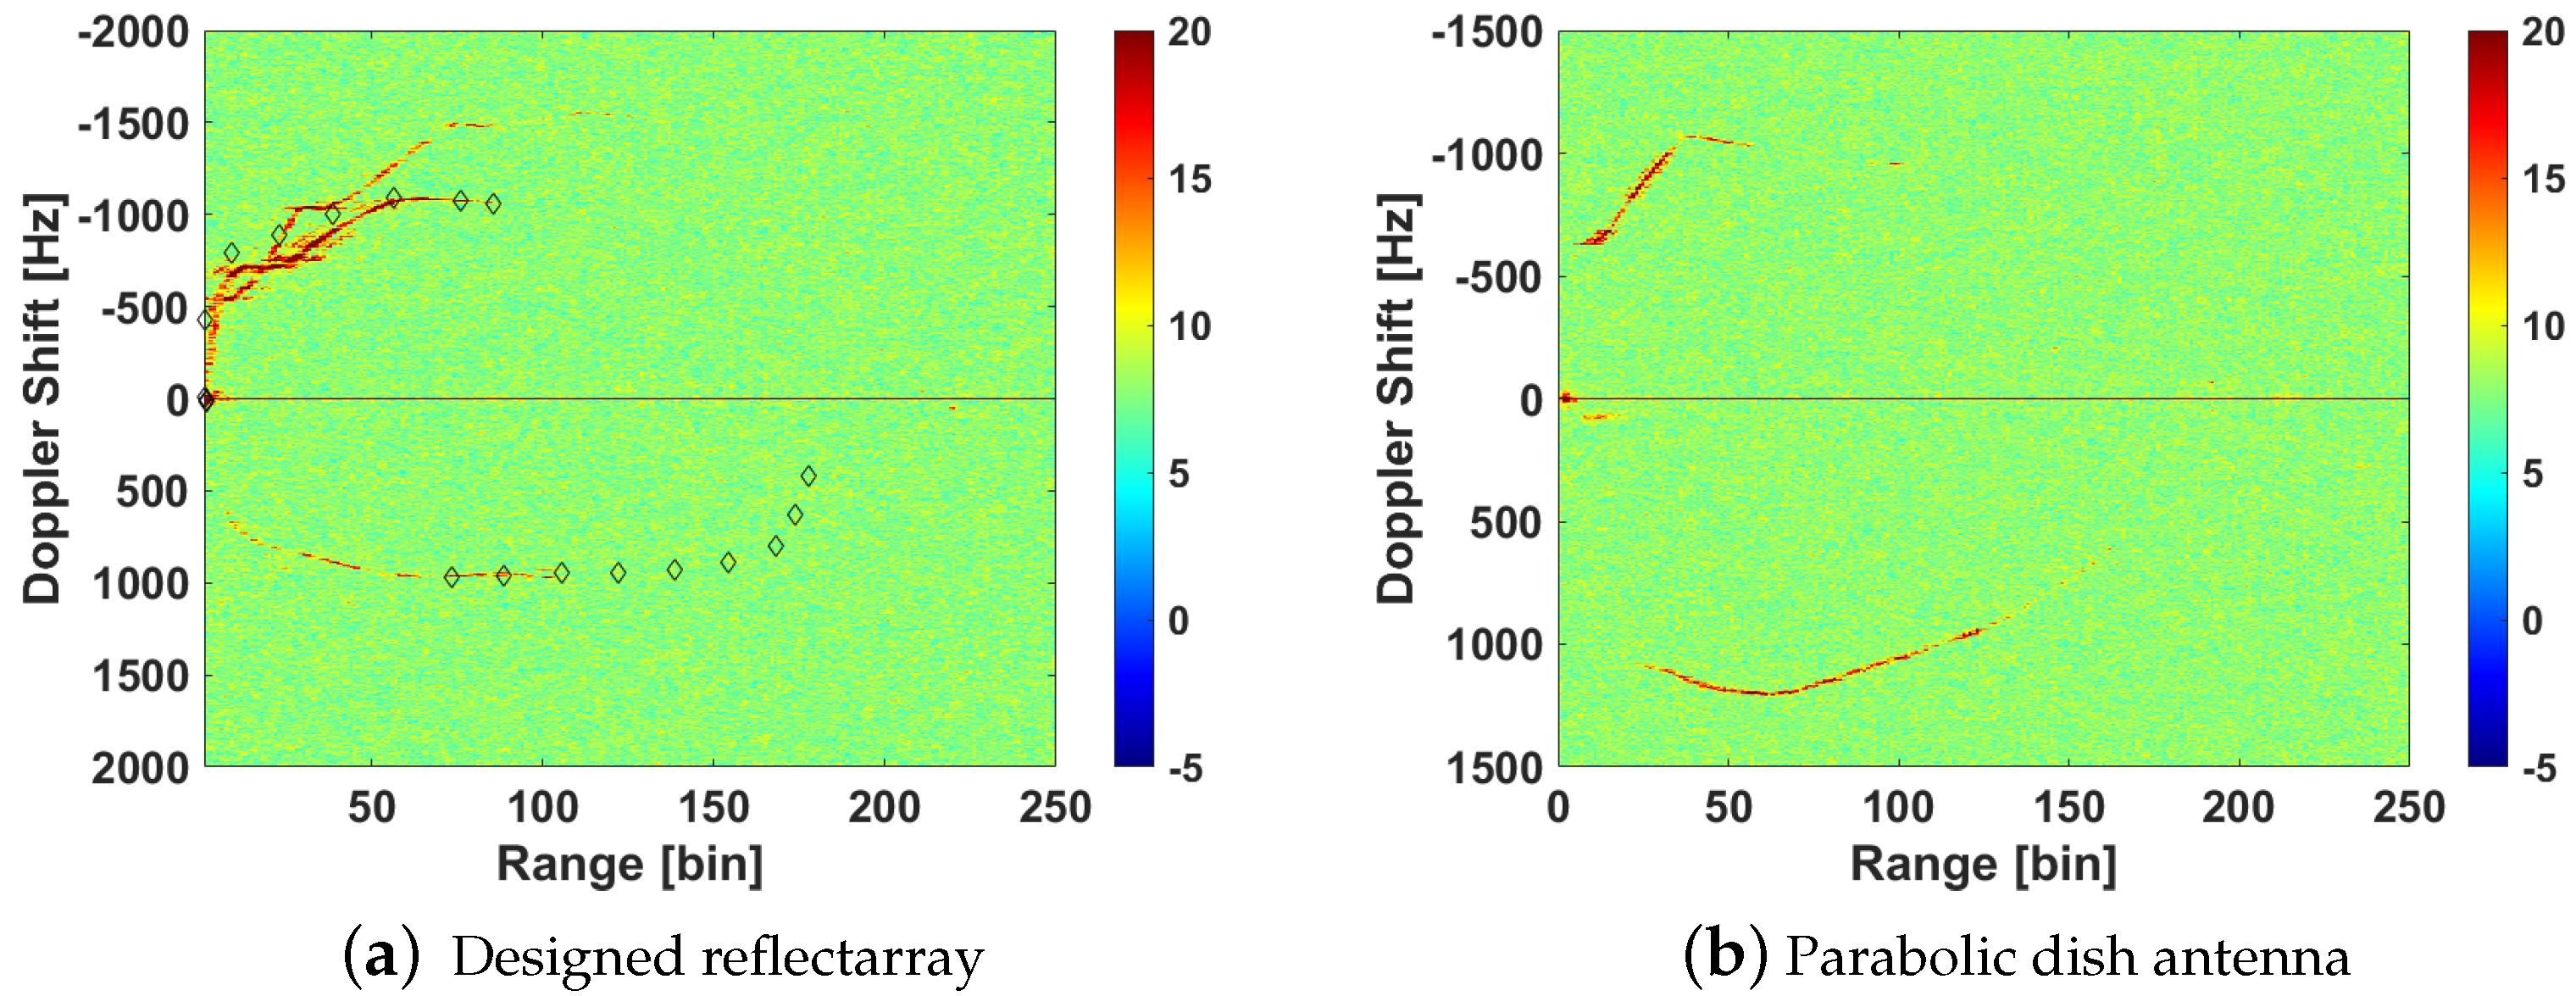
6.3. PR Trials Results
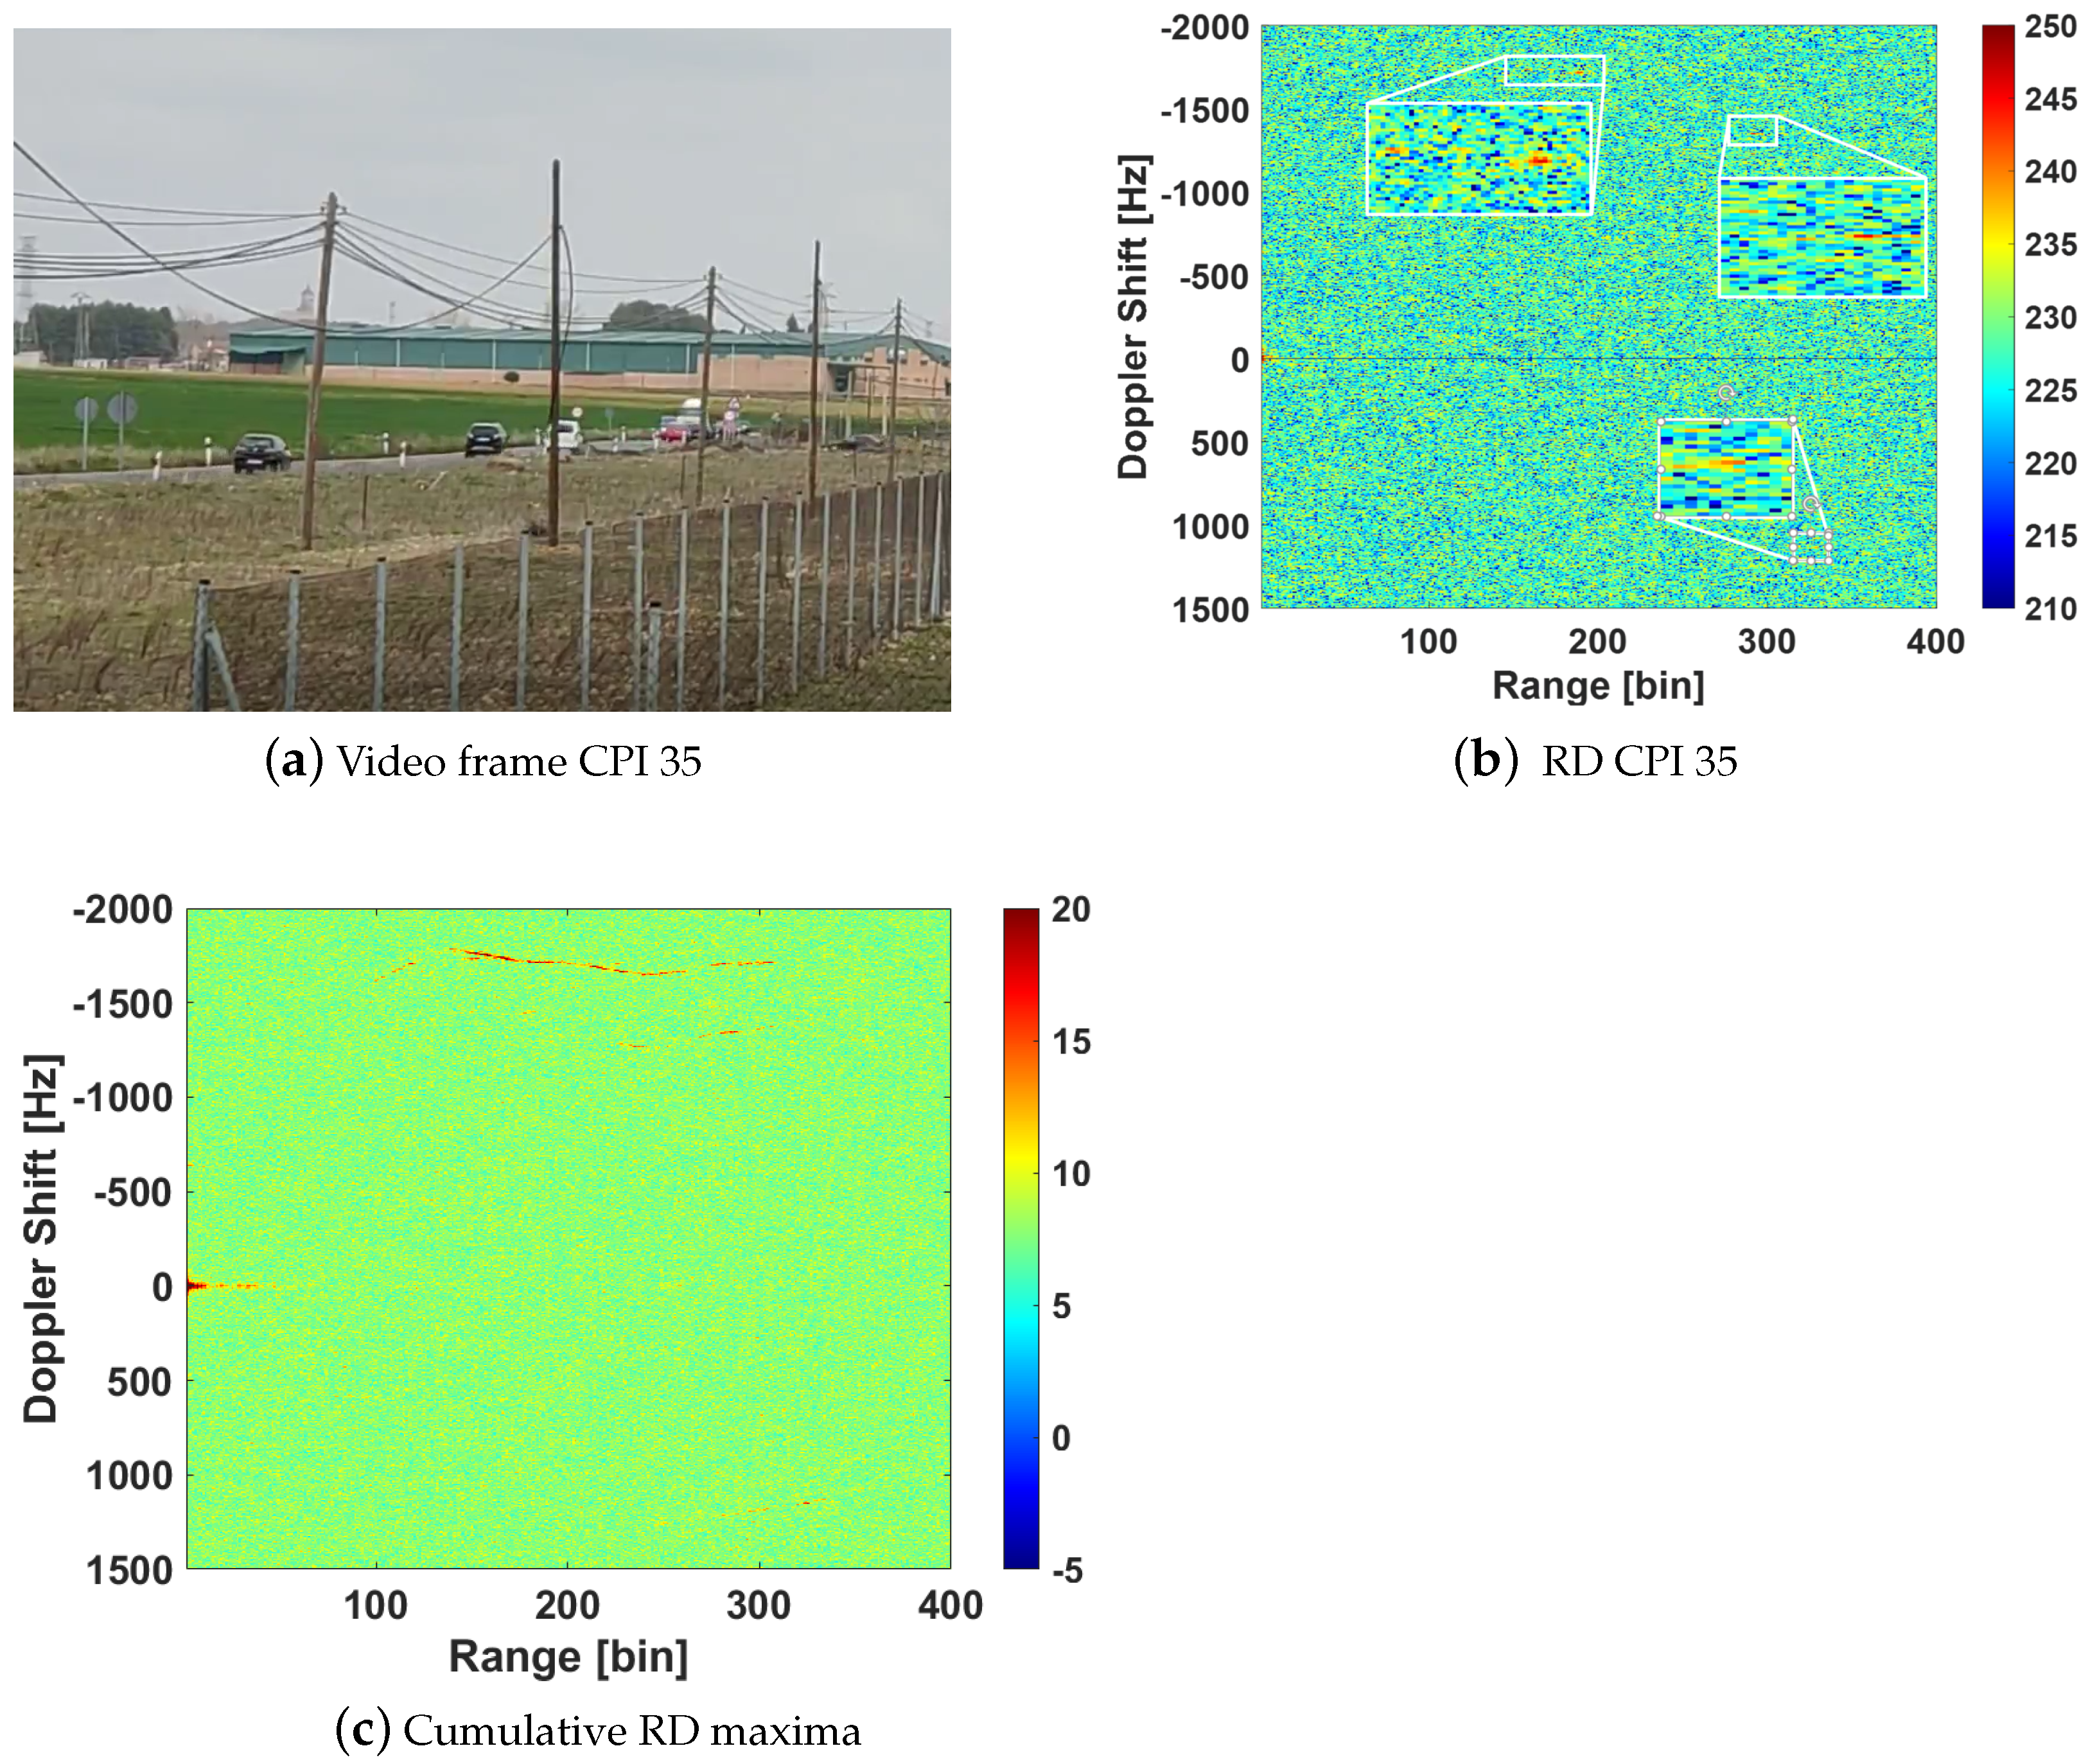
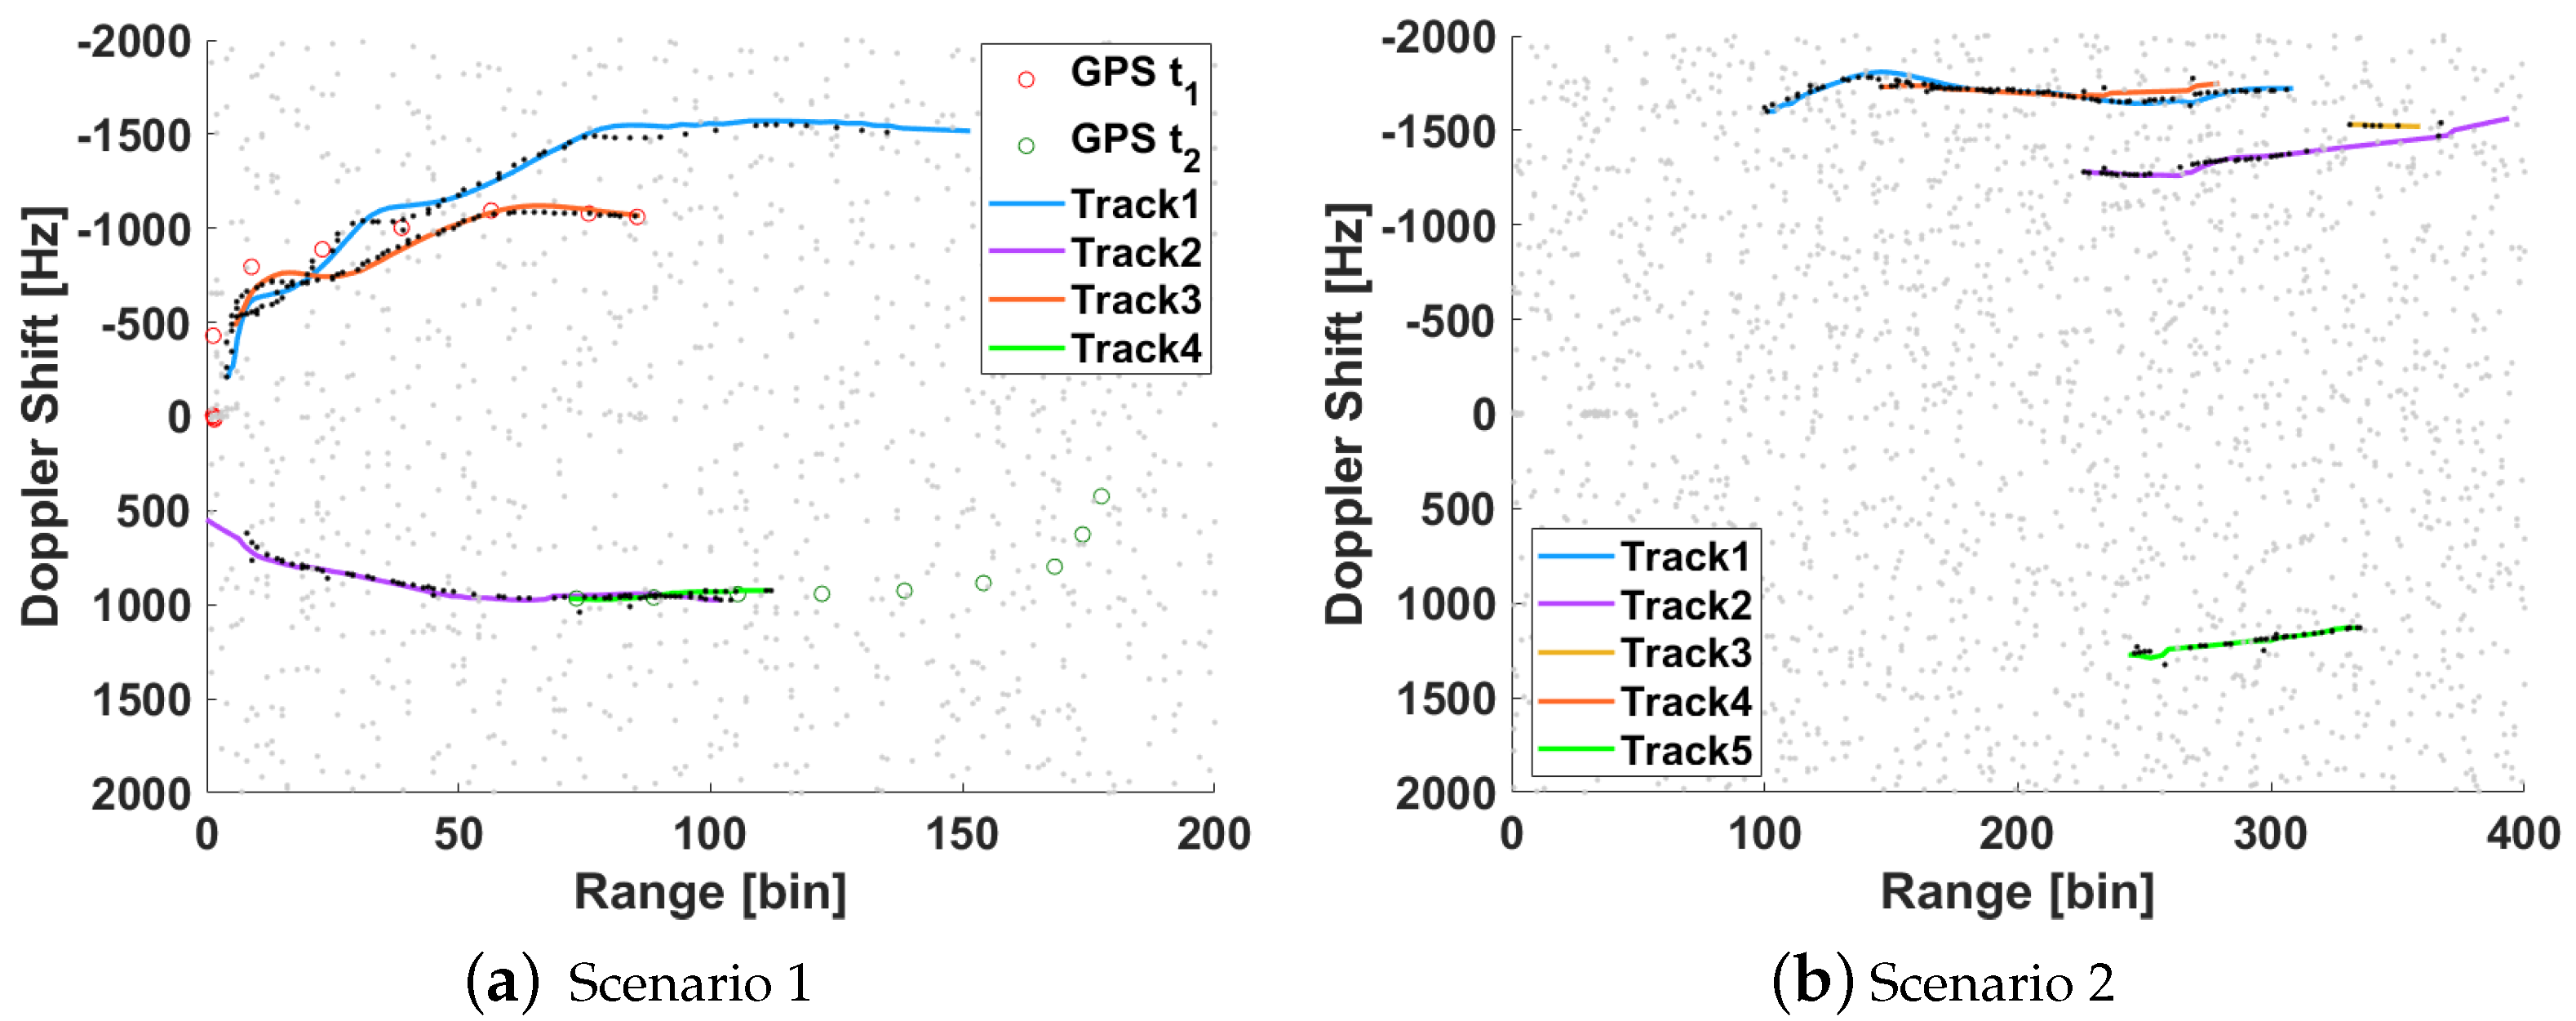
- Moving away from nearer to further from the PR: a car probably out of the main beam, two vehicles at range bins about ~150 and ~200 and ~ −1700 Hz (Figure 17b) and another set of 2 cars, one of which appears at range bin ~300 and Hz;
- Approaching: A concrete truck, at range bin ~330 and Hz, followed by a car that is not appreciated in the RD map.
7. Conclusions
Author Contributions
Funding
Institutional Review Board Statement
Informed Consent Statement
Data Availability Statement
Conflicts of Interest
References
- Bárcena-Humanes, J.L.; Gómez-del-Hoyo, P.J.; Jarabo-Amores, M.P.; Mata-Moya, D.; Rosado-Sanz, J. On the potentials of satellite based passive radars for smart sensors networks in smart cities. In Proceedings of the 2017 IEEE 17th International Conference on Ubiquitous Wireless Broadband (ICUWB), Salamanca, Spain, 12–15 September 2017; pp. 1–5. [Google Scholar] [CrossRef]
- Brisken, S.; Moscadelli, M.; Seidel, V.; Schwark, C. Passive radar imaging using DVB-S2. In Proceedings of the 2017 IEEE Radar Conference (RadarConf), Seattle, WA, USA, 8–12 May 2017; pp. 0552–0556. [Google Scholar] [CrossRef]
- Ummenhofer, M.; Lavau, L.C.; Cristallini, D.; O’Hagan, D. UAV Micro-Doppler Signature Analysis Using DVB-S Based Passive Radar. In Proceedings of the 2020 IEEE International Radar Conference (RADAR), Washington, DC, USA, 28–30 April 2020; pp. 1007–1012. [Google Scholar]
- Rosado-Sanz, J.; Jarabo-Amores, M.P.; Mata-Moya, D.; del-Rey-Maestre, N.; Almodóvar-Hernández, A. DVB-S Passive Radar Performance Evaluation in Semi-Urban Ground Scenario. In Proceedings of the 2020 21st International Radar Symposium (IRS), Warsaw, Poland, 5–8 October 2020; pp. 232–235. [Google Scholar] [CrossRef]
- Berry, D.; Malech, R.; Kennedy, W. The reflectarray antenna. IEEE Trans. Antennas Propag. 1963, 11, 645–651. [Google Scholar] [CrossRef]
- Menzel, W.; Al-Tikriti, M.; Leberer, R. A 76 GHz multiple-beam planar reflector antenna. In Proceedings of the 2002 32nd European Microwave Conference, Milan, Italy, 23–26 September 2002; pp. 1–4. [Google Scholar] [CrossRef]
- Baracco, J.; Ratajczak, P.; Brachat, P.; Toso, G. Dual frequency Ka-band reflectarray for ground terminal application. IEEE Trans. Antennas Propag. 2014, 63, 1437–1440. [Google Scholar]
- Lanteri, J.; Zeitler, A.; Dauvignac, J.-Y.; Pichot, C.; Migliaccio, C.; Feil, P.; Menzel, W. Investigation of wideband millimetre-wave reflectarrays for radar applications operating in the W Band. In Proceedings of the 2009 3rd European Conference on Antennas and Propagation, Berlin, Germany, 23–27 March 2009; pp. 826–830. [Google Scholar]
- Migliaccio, C.; Mazouni, K.; Bréard, A.; Zeitler, A.; Lanteri, J.; Dauvignac, J.; Pichot, C. Reflectarrays for mm-Wave radar applications. In Proceedings of the 2011 IEEE International Symposium on Antennas and Propagation (APSURSI), Spokane, WA, USA, 3–8 July 2011; pp. 105–108. [Google Scholar]
- Tienda, C.; Younis, M.; Lopez-Dekker, P.; Laskowski, P. Ka-band reflectarray antenna system for SAR applications. In Proceedings of the 8th European Conference on Antennas and Propagation (EuCAP 2014), The Hague, The Netherlands, 6–11 April 2014; pp. 1603–1606. [Google Scholar]
- Rosado-Sanz, J.; Jarabo-Amores, M.P.; Mata-Moya, D.; Gómez-del-Hoyo, P.J.; Del-Rey-Maestre, N. Contoured-beam reflectarray for improving angular coverage in DVB-S passive radars. In Proceedings of the 2019 20th International Radar Symposium (IRS), Ulm, Germany, 26–28 June 2019; pp. 1–8. [Google Scholar]
- Huang, J.; Encinar, J.A. Reflectarray Antennas; John Wiley & Sons, Inc.: Hoboken, NJ, USA, 2008. [Google Scholar]
- Zhou, M.; Sørensen, S.B.; Kim, O.S.; Jørgensen, E.; Meincke, P.; Breinbjerg, O. Direct Optimization of Printed Reflectarrays for Contoured Beam Satellite Antenna Applications. IEEE Trans. Antennas Propag. 2013, 61, 1995–2004. [Google Scholar] [CrossRef] [Green Version]
- Rosado-Sanz, J.; Jarabo-Amores, M.P.; Mata-Moya, D.; Dauvignac, J.Y.; Lanteri, J.; Migliaccio, C. High Gain Sectorial Beam Reflectarray Design for DVB-S Passive Radar through Multi-Beam Optimization. In Proceedings of the 2020 23rd International Microwave and Radar Conference (MIKON), Warsaw, Poland, 5–8 October 2020; pp. 361–366. [Google Scholar] [CrossRef]
- Kennedy, J.; Eberhart, R.C. Particle swarm optimization. In Proceedings of the ICNN’95-International Conference on Neural Networks, Perth, WA, Australia, 27 November–1 December 1995; pp. 1942–1948. [Google Scholar]
- Nayeri, P.; Yang, F.; Elsherbeni, A.Z. Reflectarray Antennas; John Wiley & Sons, Inc.: Hoboken, NJ, USA, 2018. [Google Scholar]
- Potter, P. A new horn antenna with suppressed sidelobes and equal beamwidths. Microw. J. 1963, 6, 71–78. [Google Scholar]
- IEEE Standard Test Procedures for Antennas; ANSI/IEEE Std 149-1979; The Institute of Electrical and Electronics Engineers, Inc.: Piscataway, NJ, USA, 1979. [CrossRef]
- Jarabo-Amores, M.P.; Bárcena-Humanes, J.L.; Gómez-del-Hoyo, P.J.; Rey-Maestre, N.; Juara-Casero, D.; Gaitán-Cabañas, F.J.; David, D.M. IDEPAR: A multichannel digital video broadcasting-terrestrial passive radar technological demonstrator in terrestrial radar scenarios. Radar Sonar Navig. 2017, 11, 133–141. [Google Scholar] [CrossRef]
- Colone, F.; O’Hagan, D.W.; Lombardo, P.; Baker, C.J. A Multistage Processing Algorithm for Disturbance Removal and Target Detection in Passive Bistatic Radar. IEEE Trans. Aerosp. Electron. Syst. 2009, 45, 698–722. [Google Scholar] [CrossRef]


| Element Type | Phases | Losses |
|---|---|---|
| Circle plus triangle | dB | |
| Ring mm | dB | |
| Ring mm | dB |
| Direction | Parabolic Dish | Reflectarray | ||||
|---|---|---|---|---|---|---|
| Target | Max. Range | Target | Max. Range | |||
| Moving away | Car | 144 | Car (T1) | 151 | ||
| Car (T3) | 86 | |||||
| Approaching | Bus | 166 | Car (T2) | 102 | ||
| Car (T4) | 112 | |||||
| Direction | Reflectarray | ||
|---|---|---|---|
| Target | Max. Range [bin] | ||
| Moving away | Car (T1) | 305 | |
| Car (T2) | 369 | ||
| Car (T3) | 348 | ||
| Car (T4) | 267 | ||
| Approaching | Concrete truck (T5) | 335 | |
Publisher’s Note: MDPI stays neutral with regard to jurisdictional claims in published maps and institutional affiliations. |
© 2021 by the authors. Licensee MDPI, Basel, Switzerland. This article is an open access article distributed under the terms and conditions of the Creative Commons Attribution (CC BY) license (https://creativecommons.org/licenses/by/4.0/).
Share and Cite
Rosado-Sanz, J.; Jarabo-Amores, M.-P.; Dauvignac, J.-Y.; Mata-Moya, D.; Lanteri, J.; Migliaccio, C. Design and Validation of a Reflectarray Antenna with Optimized Beam for Ground Target Monitoring with a DVB-S-Based Passive Radar. Sensors 2021, 21, 5263. https://doi.org/10.3390/s21165263
Rosado-Sanz J, Jarabo-Amores M-P, Dauvignac J-Y, Mata-Moya D, Lanteri J, Migliaccio C. Design and Validation of a Reflectarray Antenna with Optimized Beam for Ground Target Monitoring with a DVB-S-Based Passive Radar. Sensors. 2021; 21(16):5263. https://doi.org/10.3390/s21165263
Chicago/Turabian StyleRosado-Sanz, Javier, María-Pilar Jarabo-Amores, Jean-Yves Dauvignac, David Mata-Moya, Jérôme Lanteri, and Claire Migliaccio. 2021. "Design and Validation of a Reflectarray Antenna with Optimized Beam for Ground Target Monitoring with a DVB-S-Based Passive Radar" Sensors 21, no. 16: 5263. https://doi.org/10.3390/s21165263