
An Analytic Model for Reducing Authentication Signaling Traffic in an End-to-End Authentication Scheme


1
Computer Science Department, Jouf University, Sakaka 42421, Saudi Arabia
2
Faculty of Technology and Applied Science, Al Quds Open University, Gaza 860, Palestine
*
Author to whom correspondence should be addressed.
Sensors 2021, 21(15), 4980; https://doi.org/10.3390/s21154980
Submission received: 10 June 2021
/
Revised: 14 July 2021
/
Accepted: 20 July 2021
/
Published: 22 July 2021
(This article belongs to the Section Communications)
Abstract
:In an end-to-end authentication (E2EA) scheme, the physician, patient, and sensor nodes authenticate each other through the healthcare service provider in three phases: the long-term authentication phase (LAP), short-term authentication phase (SAP), and sensor authentication phase (WAP). Once the LAP is executed between all communication nodes, the SAP is executed (m) times between the physician and patient by deriving a new key from the PSij key generated by healthcare service provider during the LAP. In addition, the WAP is executed between the connected sensor and patient (m + 1) times without going back to the service provider. Thus, it is critical to determine an appropriate (m) value to maintain a specific security level and to minimize the cost of E2EA. Therefore, we proposed an analytic model in which the authentication signaling traffic is represented by a Poisson process to derive an authentication signaling traffic cost function for the (m) value. wherein the residence time of authentication has three distributions: gamma, hypo-exponential, and exponential. Finally, using the numerical analysis of the derived cost function, an optimal value (m) that minimizes the authentication signaling traffic cost of the E2EA scheme was determined.
1. Introduction
Today, the Internet of Things (IoT) healthcare system is in common use around the world. Its essential goal is to monitor a patient’s vital signs while a physician delivers treatment and medical advice remotely; moreover, it can reduce the number of the healthcare centers and bring expert medical care to remote areas where there is a shortage of them [1,2,3,4,5,6].
A wireless medical sensor network (WMSN) collects data from sensors that register temperature, blood pressure, blood sugar levels, etc. [1,2,3,4,5]. Then, the data are transmitted to the healthcare provider, which sends them to physicians electronically [1,2,7]. In such a system, data security is the main concern because an unauthorized party could access a patient’s sensor nodes to reveal the secrecy and privacy of his or her health status [1,2,8]. Furthermore, the unauthorized party could compromise the integrity of the patient safety by falsifying the doctor’s instructions or advice or by changing a dose from the electronic insulin pumps [1]. Therefore, the healthcare IoT system is susceptible to numerous types of attacks such as smartcard loss, sensor spoofing, desynchronization, impersonation, replay, insider, intrusion, and man-in-the-middle attacks [1,2,9,10,11].
Several authentication schemes have been proposed to deal with sensor deficiencies, but they did not adequately consider performance and authentication costs [12,13,14,15,16,17,18,19,20,21,22,23,24,25]. To reduce authentication overhead, communication has been made more practical. Many schemes now generate a preset number of parameters to execute more authentication sessions between system nodes without having to refer back to the authentication center or the service provider’s server, thus reducing delays. However, this technique could have adverse results if some of the authentication parameters have to be changed because of, for example, a difference in the request rate. Therefore, authentication schemes need to use a cost function that estimates the number of the authentication sessions and the quantity of authentication parameters to be generated.
The first author has proposed an authentication scheme called end-to-end authentication (E2EA) [1], which can support various security and performance features such that mutual authentication, anonymity, and perfect forwarding services are satisfied. Furthermore, E2EA can protect against the abovementioned attacks using low-cost storage space, computations, and communications.
Therefore, in this paper we proposed an analytical cost function model to examine the effect of the number of authentication parameters that will be generated during the execution of E2EA on the signaling traffic cost. Thus, the healthcare service provider can estimate in advance the number authentication sessions to be executed for a specific patient; then, according to this cost estimate, set the number of parameters to be generated and transmit them to the nodes when the E2EA scheme is executed.
1.1. Background
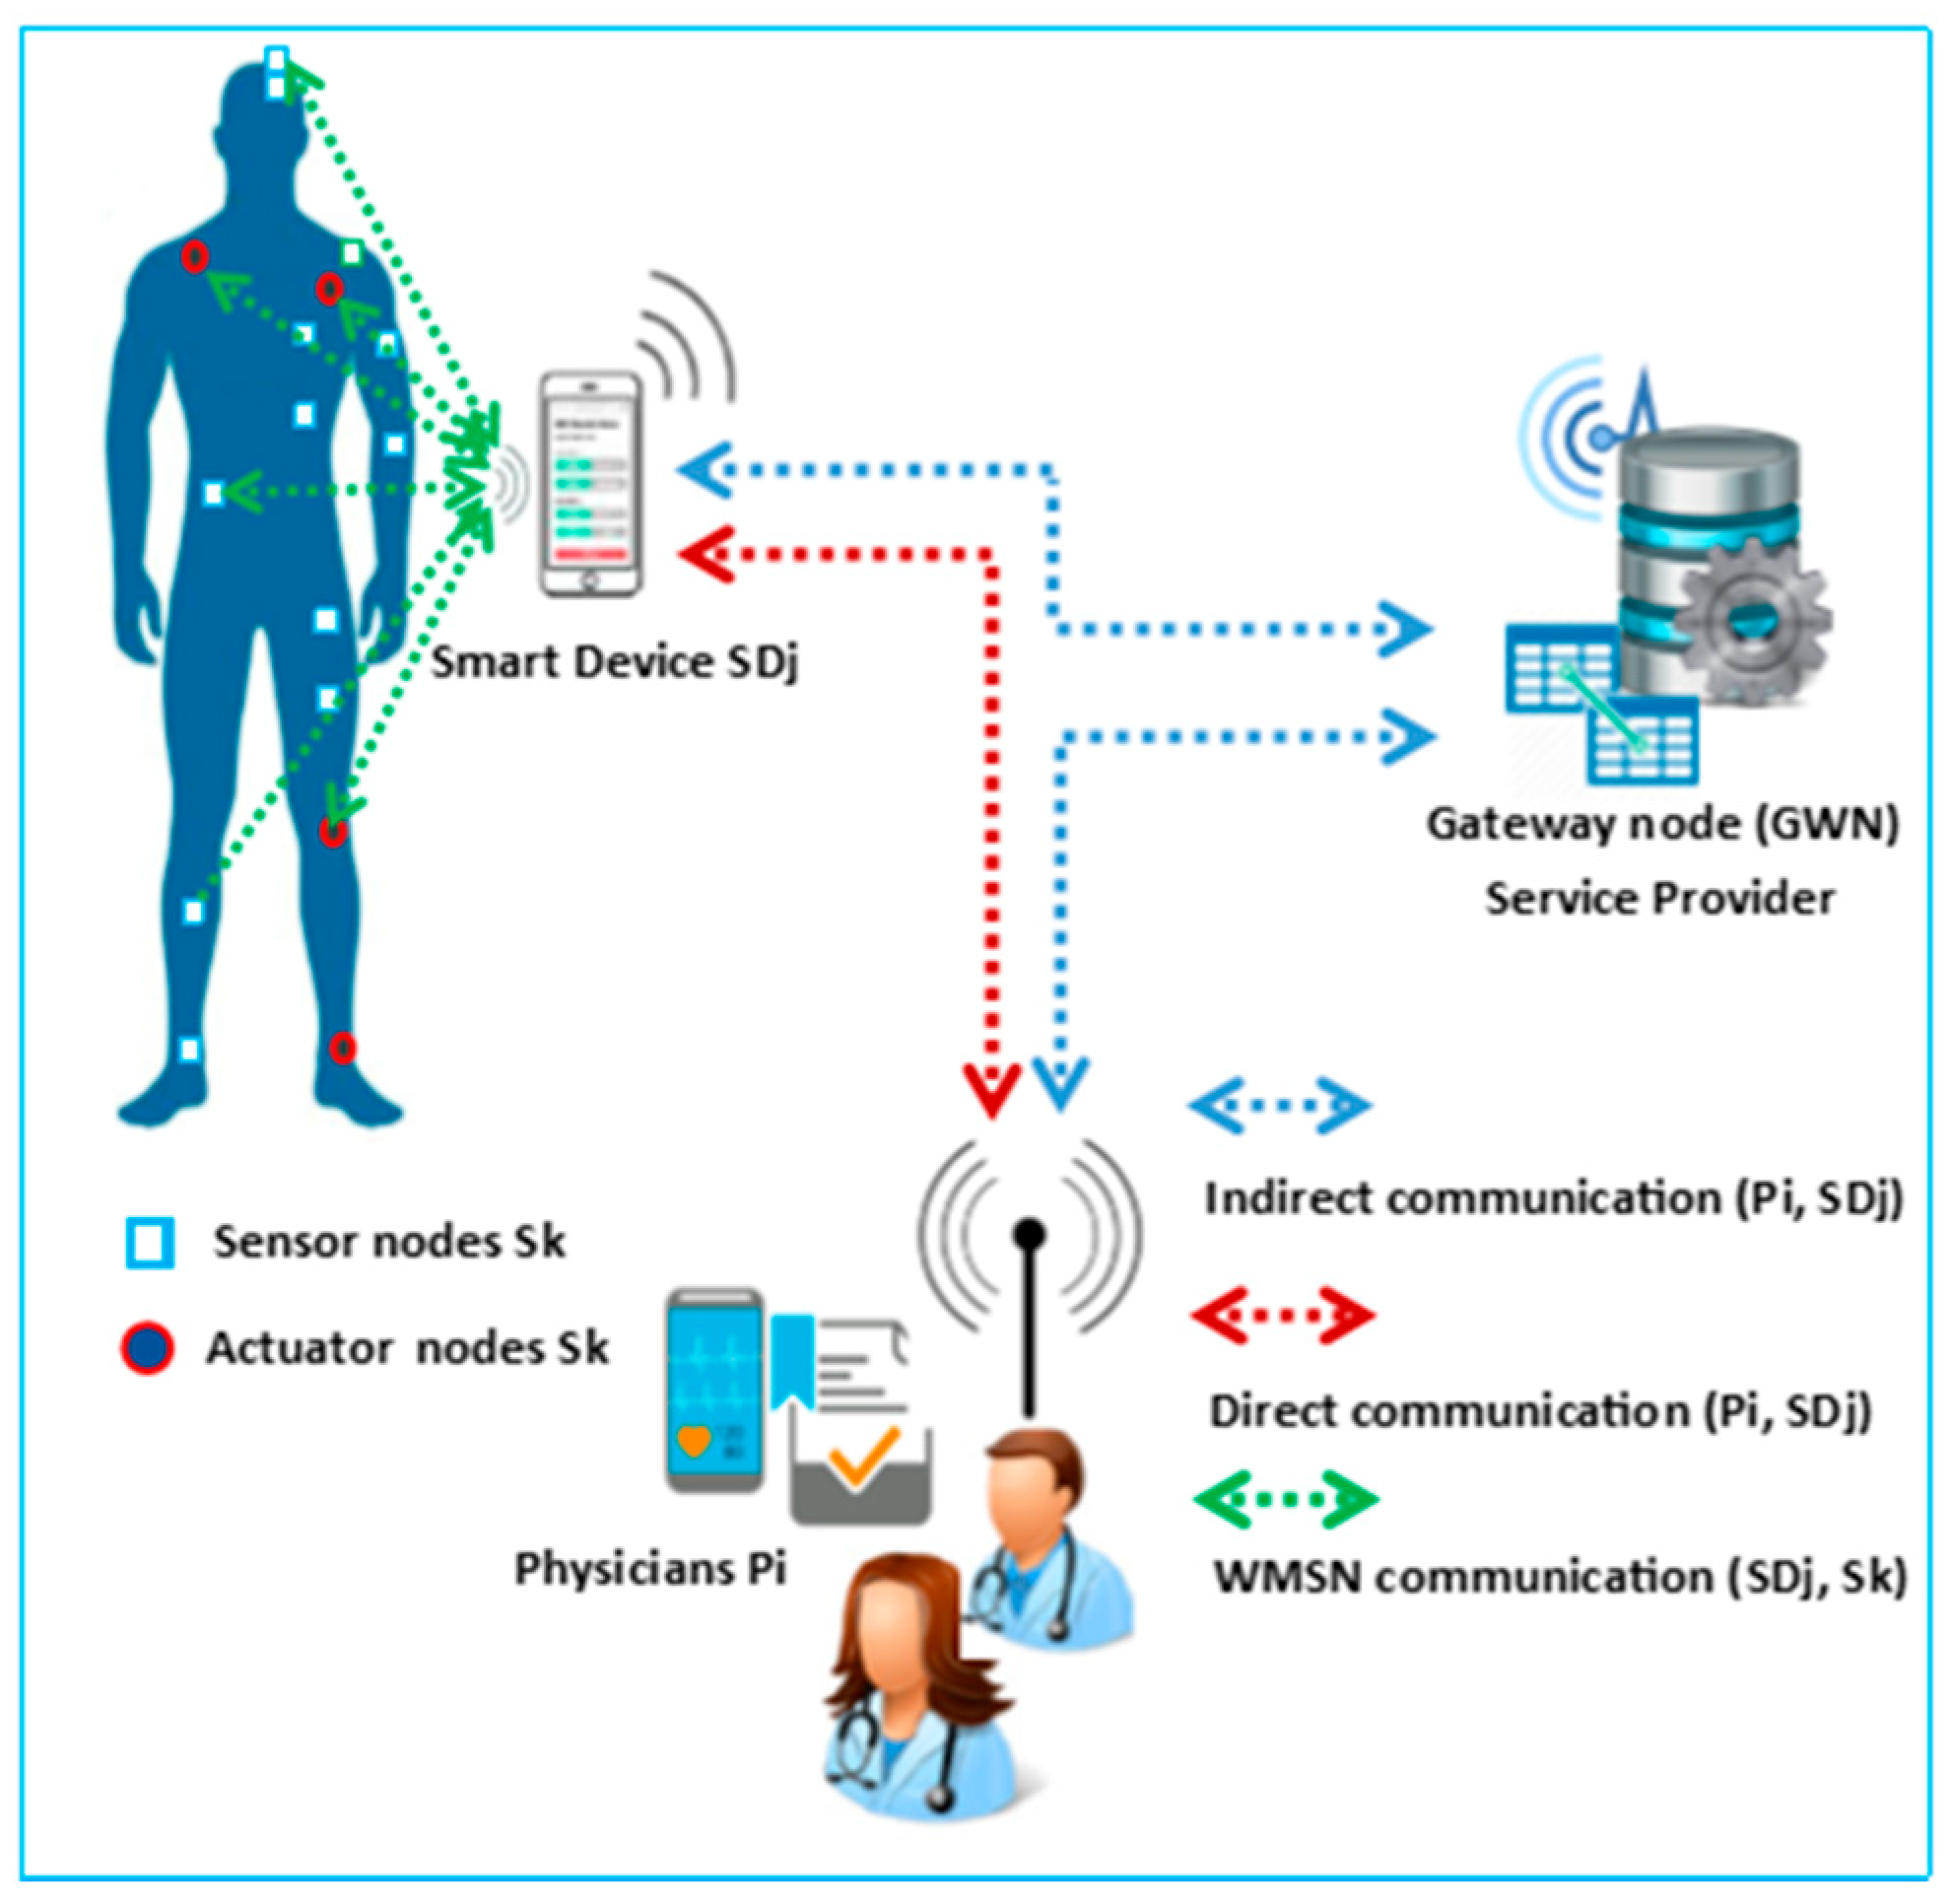
In E2EA, the communication nodes of the IoT architecture are the gateway node (GWN), representing the healthcare service provider, the physician’s monitoring device (Pi), the patient’s smart device (SDj), and the nodes (Sk) as illustrated in Figure 1. The Sk sensor nodes collect the patient’s vital signs and send them as an on-demand report to the SDj; the Sk actuator nodes receive medical orders from the Pi through the SDj to perform a specific action such as turning on the insulin pumps [1,2,3,4,5,6]. Communication between the SDj and Sk nodes is accomplished via the WMSN [1,2,3,4,5,6,12].
The SDj supports the registration process with the GWN and connects with a new sensor node. The SDj should be able to save the vital signs collected by specific sensor node, then forward them to the Pi indirectly through GWN or directly during emergencies. Communication between the SDj, GWN, and Pi is conducted over the Internet [1,12,13,14,15,16].
The GWN is the core node of the E2EA scheme because it supports registration with the Pi and SDj. The GWN observes the authentication and key agreement (AKA) execution to coordinate authentication between the Pi and SDj.
The Pi can collect vital signs from the SDj and transmit medical orders to the actuator sensors for treatment through the SDj.
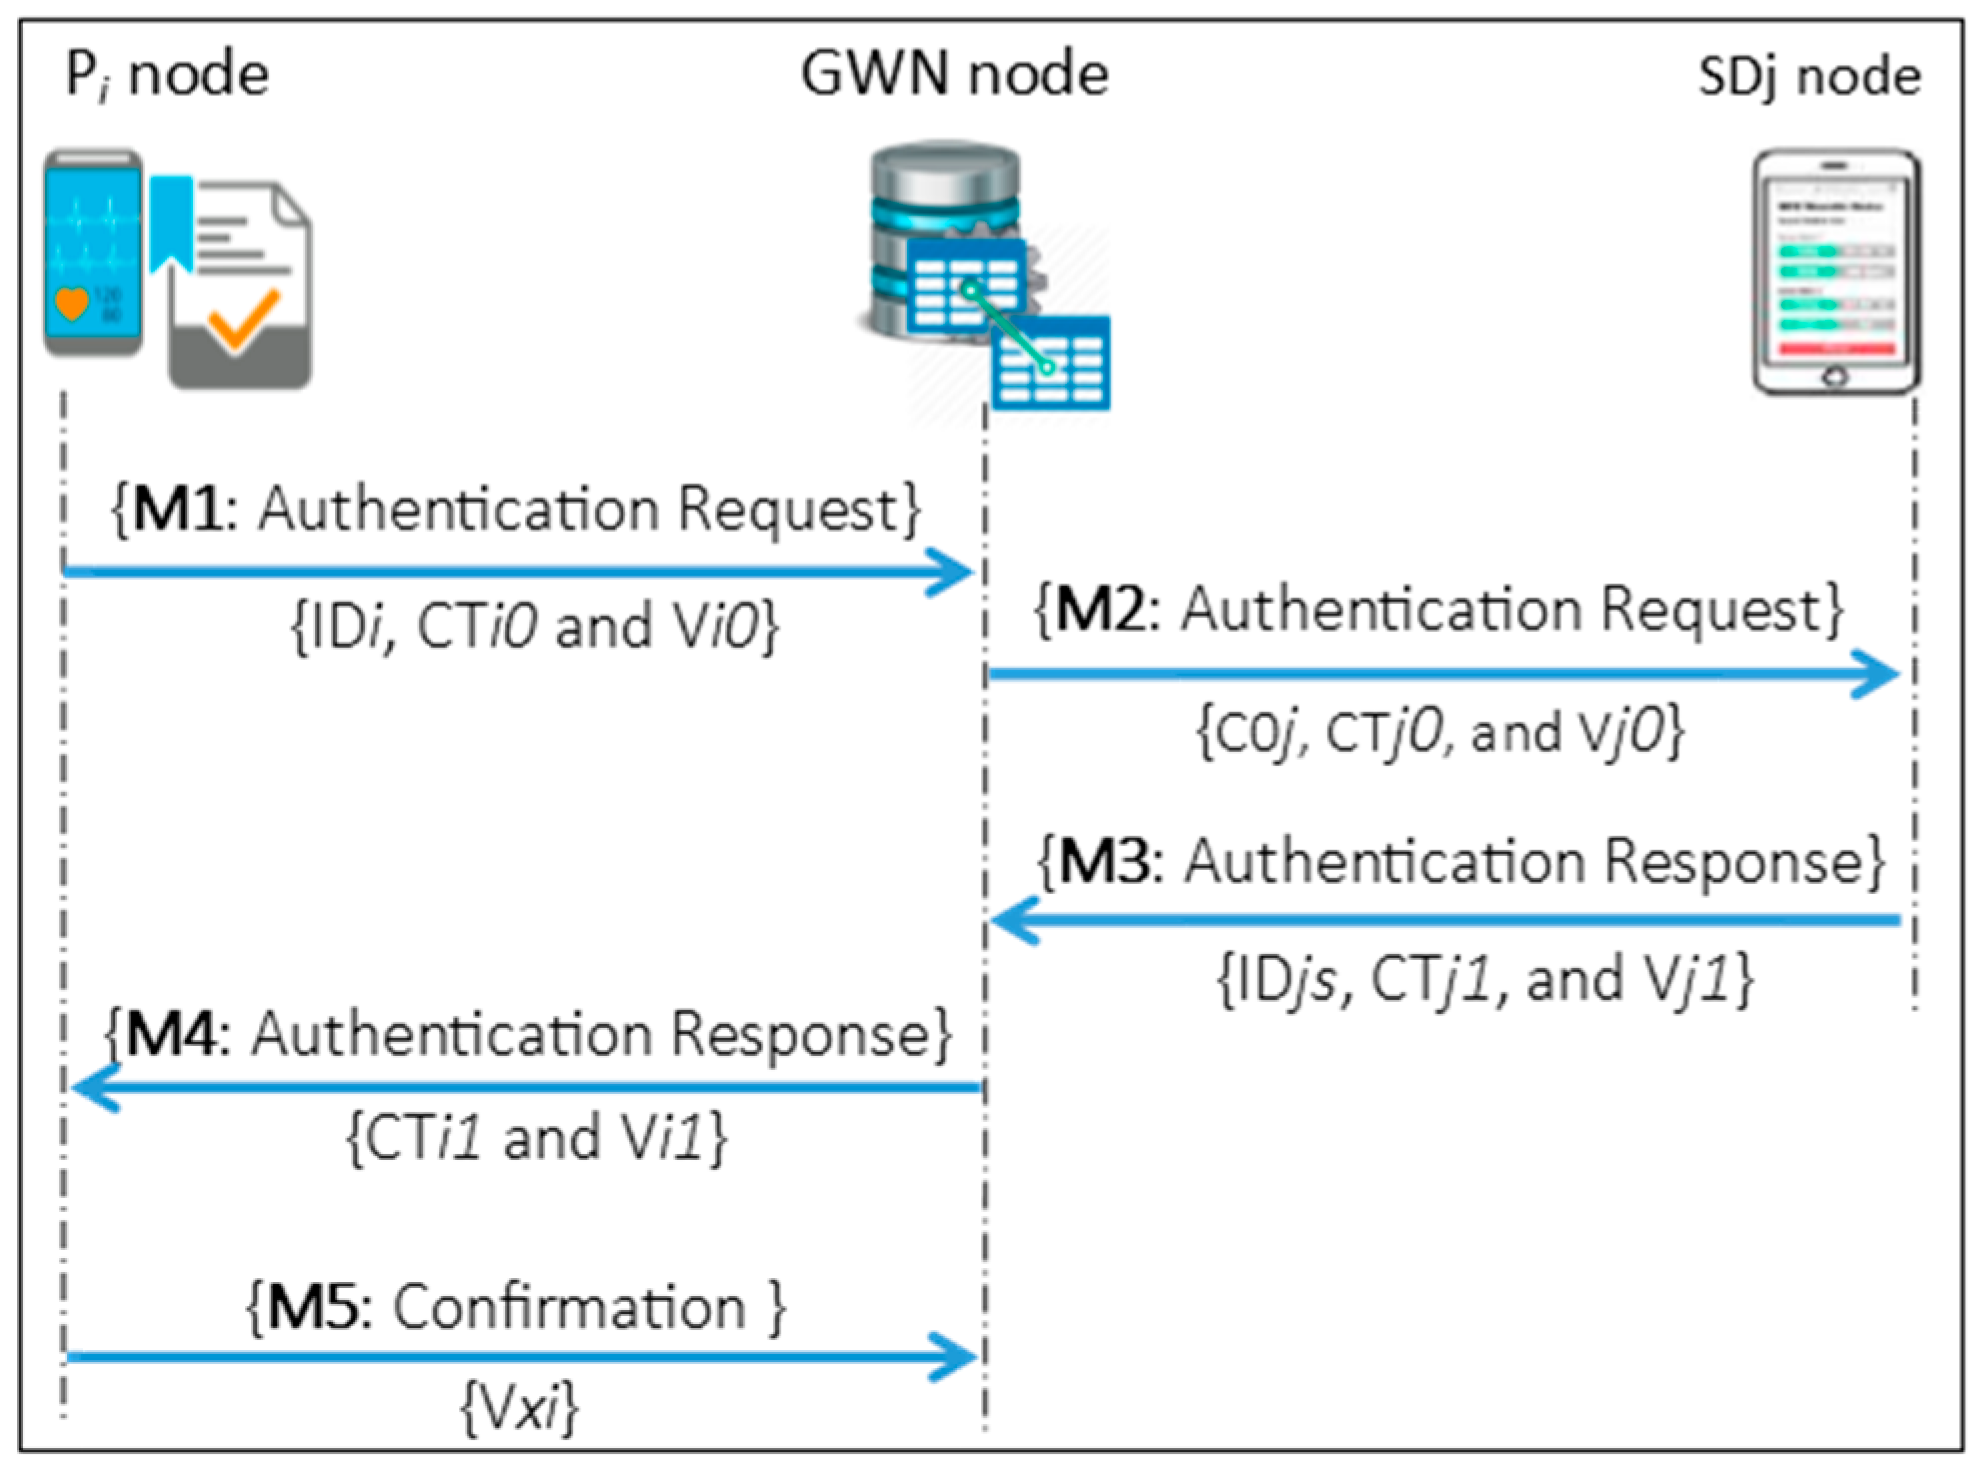
In E2EA, authentication is exercised for every monitoring and treatment event between the GWN, Pi, SDj and Sk through three authentications phases: the long-term authentication phase (LAP), short-term authentication phase (SAP), and WMSN authentication phase (WAP) as shown in Figure 2, Figure 3 and Figure 4, respectively.
As shown in Figure 2, the LAP supports full mutual authentication, i.e., authentication of the Pi by the GWN and authentication of the GWN by the Pi through the exchange of authentication messages M1, M4 and M5. Furthermore, authentication of the GWN by the SDj and authentication of the SDj by the GWN through exchanging the authentication messages M2 and M3.
The LAP performs a set of a symmetric cryptographic functions using the authentication keys that were generated during the registration phases of the Pi and SDj with the GWN. Besides, one-way hash functions are used to generate the verification values of the authentication parameters for all authentication messages. This phase also establishes a new subsequent key PSij generated by the GWN to be used when the Pi and SDj execute the SAP to authenticate each other directly.
M1 is a request authentication message that the Pi generates to prove itself to the GWN and has the values IDi, CTi0 and Vi0: IDi represents the Pi’s identity; CTi0 is an encrypted value of the Pi’s timestamp and a random number with the identity of the patient; and Vi0 is a hash value used on the GWN side to verify the CTi0 value. M4 is a response message that the GWN generates to prove itself to the Pi and has the values CTi1 and Vi1: CTi1 is an encryption of the concatenation value of the timestamp, random number, and PSij key that are generated by the GWN, and Vi1 is a hash value used on the Pi side to verify the CTi1 value. M5 is a confirmation message the Pi sends to the GWN to complete the mutual authentication. This message includes the hash value (Vxi), which is used as a confirmation value to the GWN.
On the other side, M2 is a request authentication message that the GWN generates to prove itself to the SDj and has the values C0j, CTj0, and Vj0: C0j is an incremental counter of the authentication session; CTj0 is an encrypted value of the timestamp, random number, the PSij key of the GWN’s; and Vj0 is a hash value used on the SDj side to verify the CTj0 value. Finally, M3 is a response message that the SDj generates to prove itself to the GWN and has the values IDjs, CTj1, and Vj1: IDjs is the SDj’s identity; CTj1 is an encrypted value of the SDj’s timestamp and random number; and Vj1 is a hash value used on the GWN side to verify the CTj1 value.
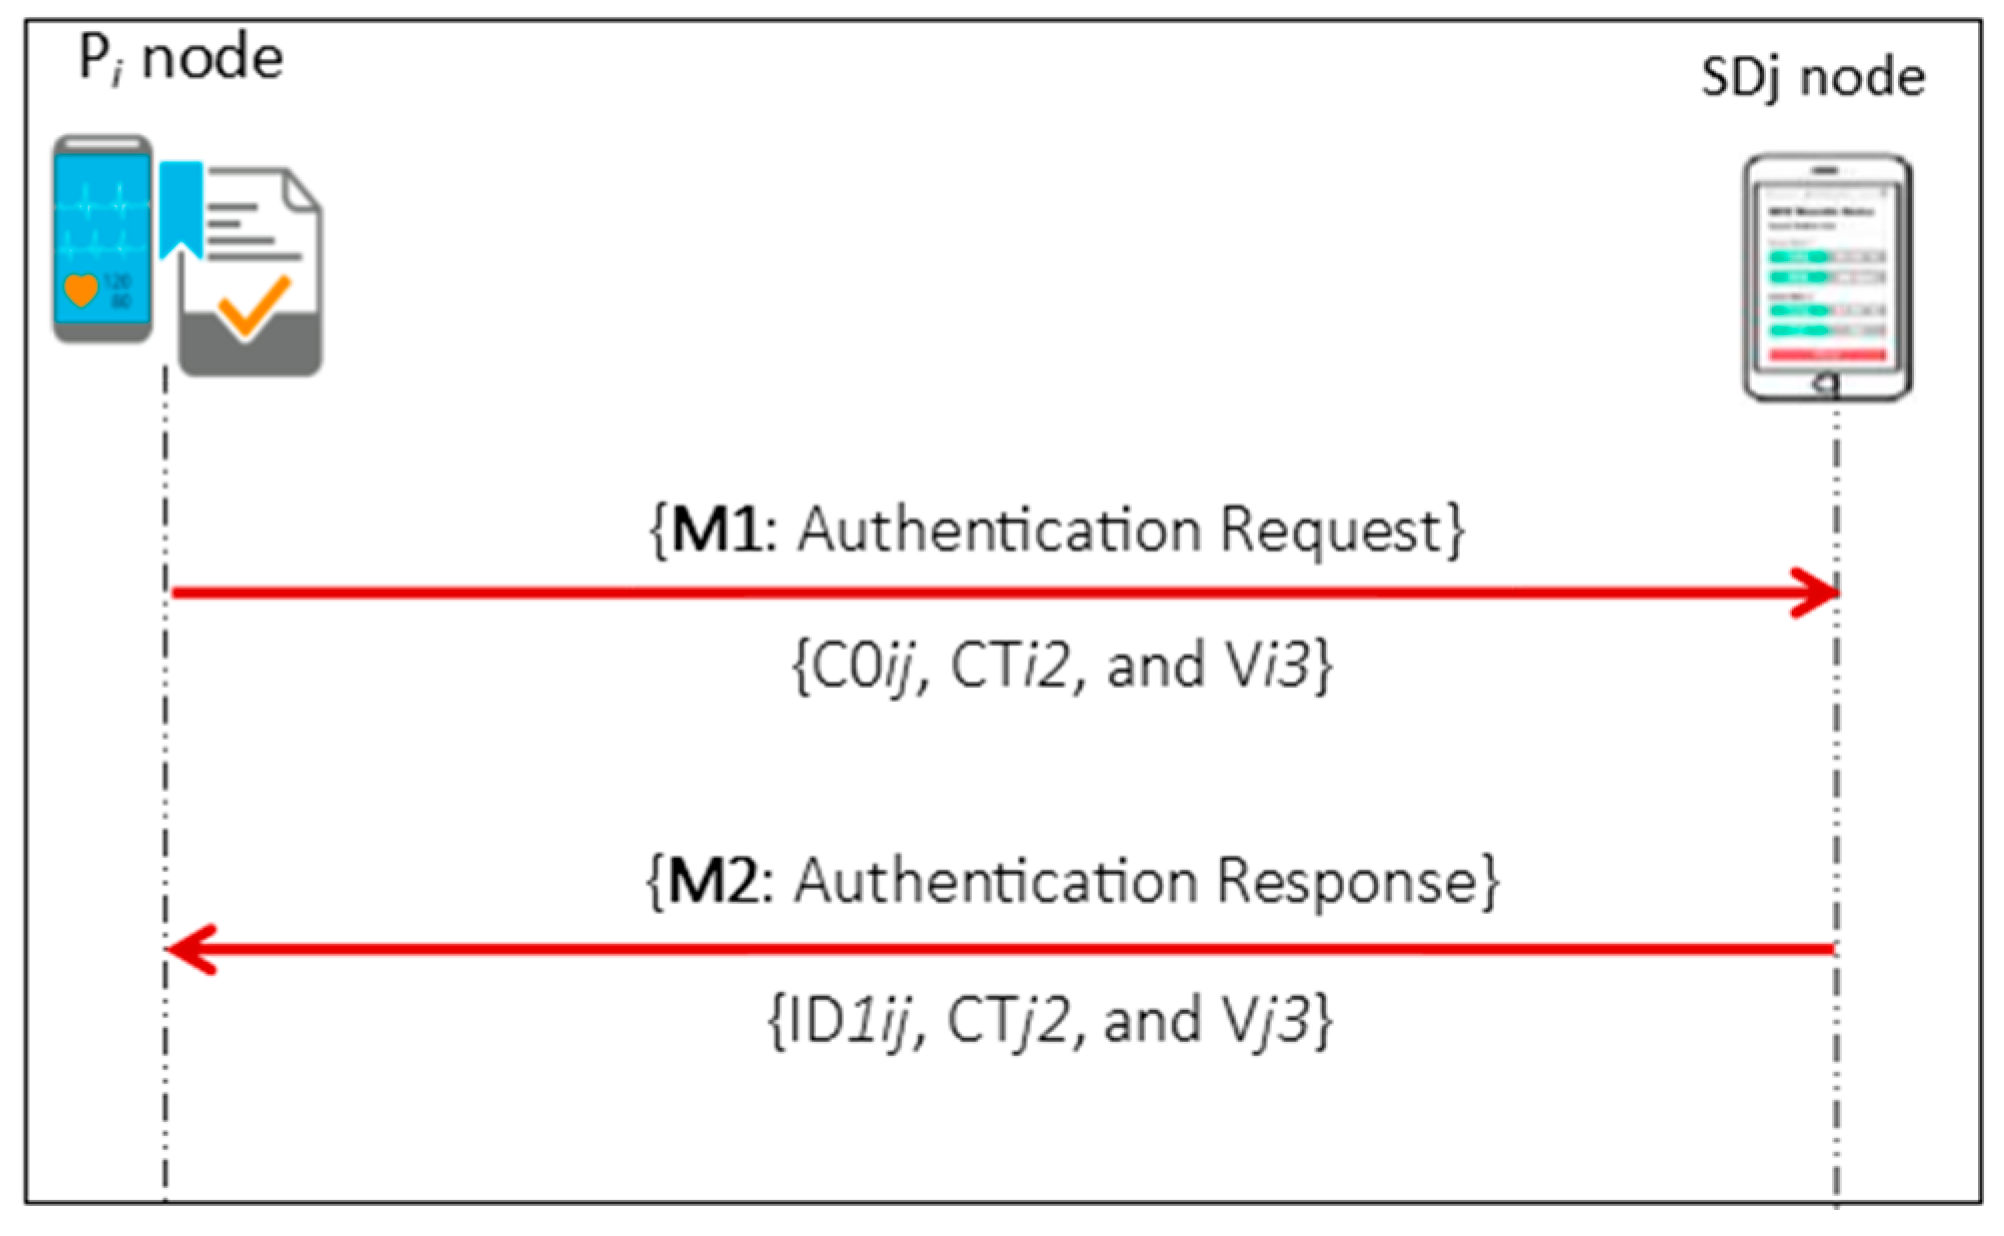
In the SAP, as illustrated in Figure 3, mutual authentication is achieved between the Pi and SDj through the direct exchange of authentication messages M1 and M2. The PSij that was received by both sides during the LAP will be used to encrypt the authentication parameters. In this phase, both authentication sides maintained a session counter (C0ij) to determine how many times the PSij value will derive a new key for the next direct mutual authentication session without going back to execute the LAP for a new PSij key. M1 is a request authentication message generated by the Pi to prove itself to the SDj and has the values C0ij, CTi2, and Vi3: C0ij is a session counter as mentioned; CTj2 is an encrypted value of the Pi’s timestamp and random number with C0ij using the derived subsequent key (PSij); and Vi3 is a hash value used on the SDj side to verify the CTi2 value. On other hand, the M2 message is a response message that the SDj generates to prove itself to the Pi. In the same manner, M2 comprises ID1ij, CTj2, and Vj3: ID1ij represents the pseudonym for SDj generated by the Pi to derive a new value of the PSij key for the current authentication session, and Vj3 is a hash value on the Pi side that verifies the CTj2 value.
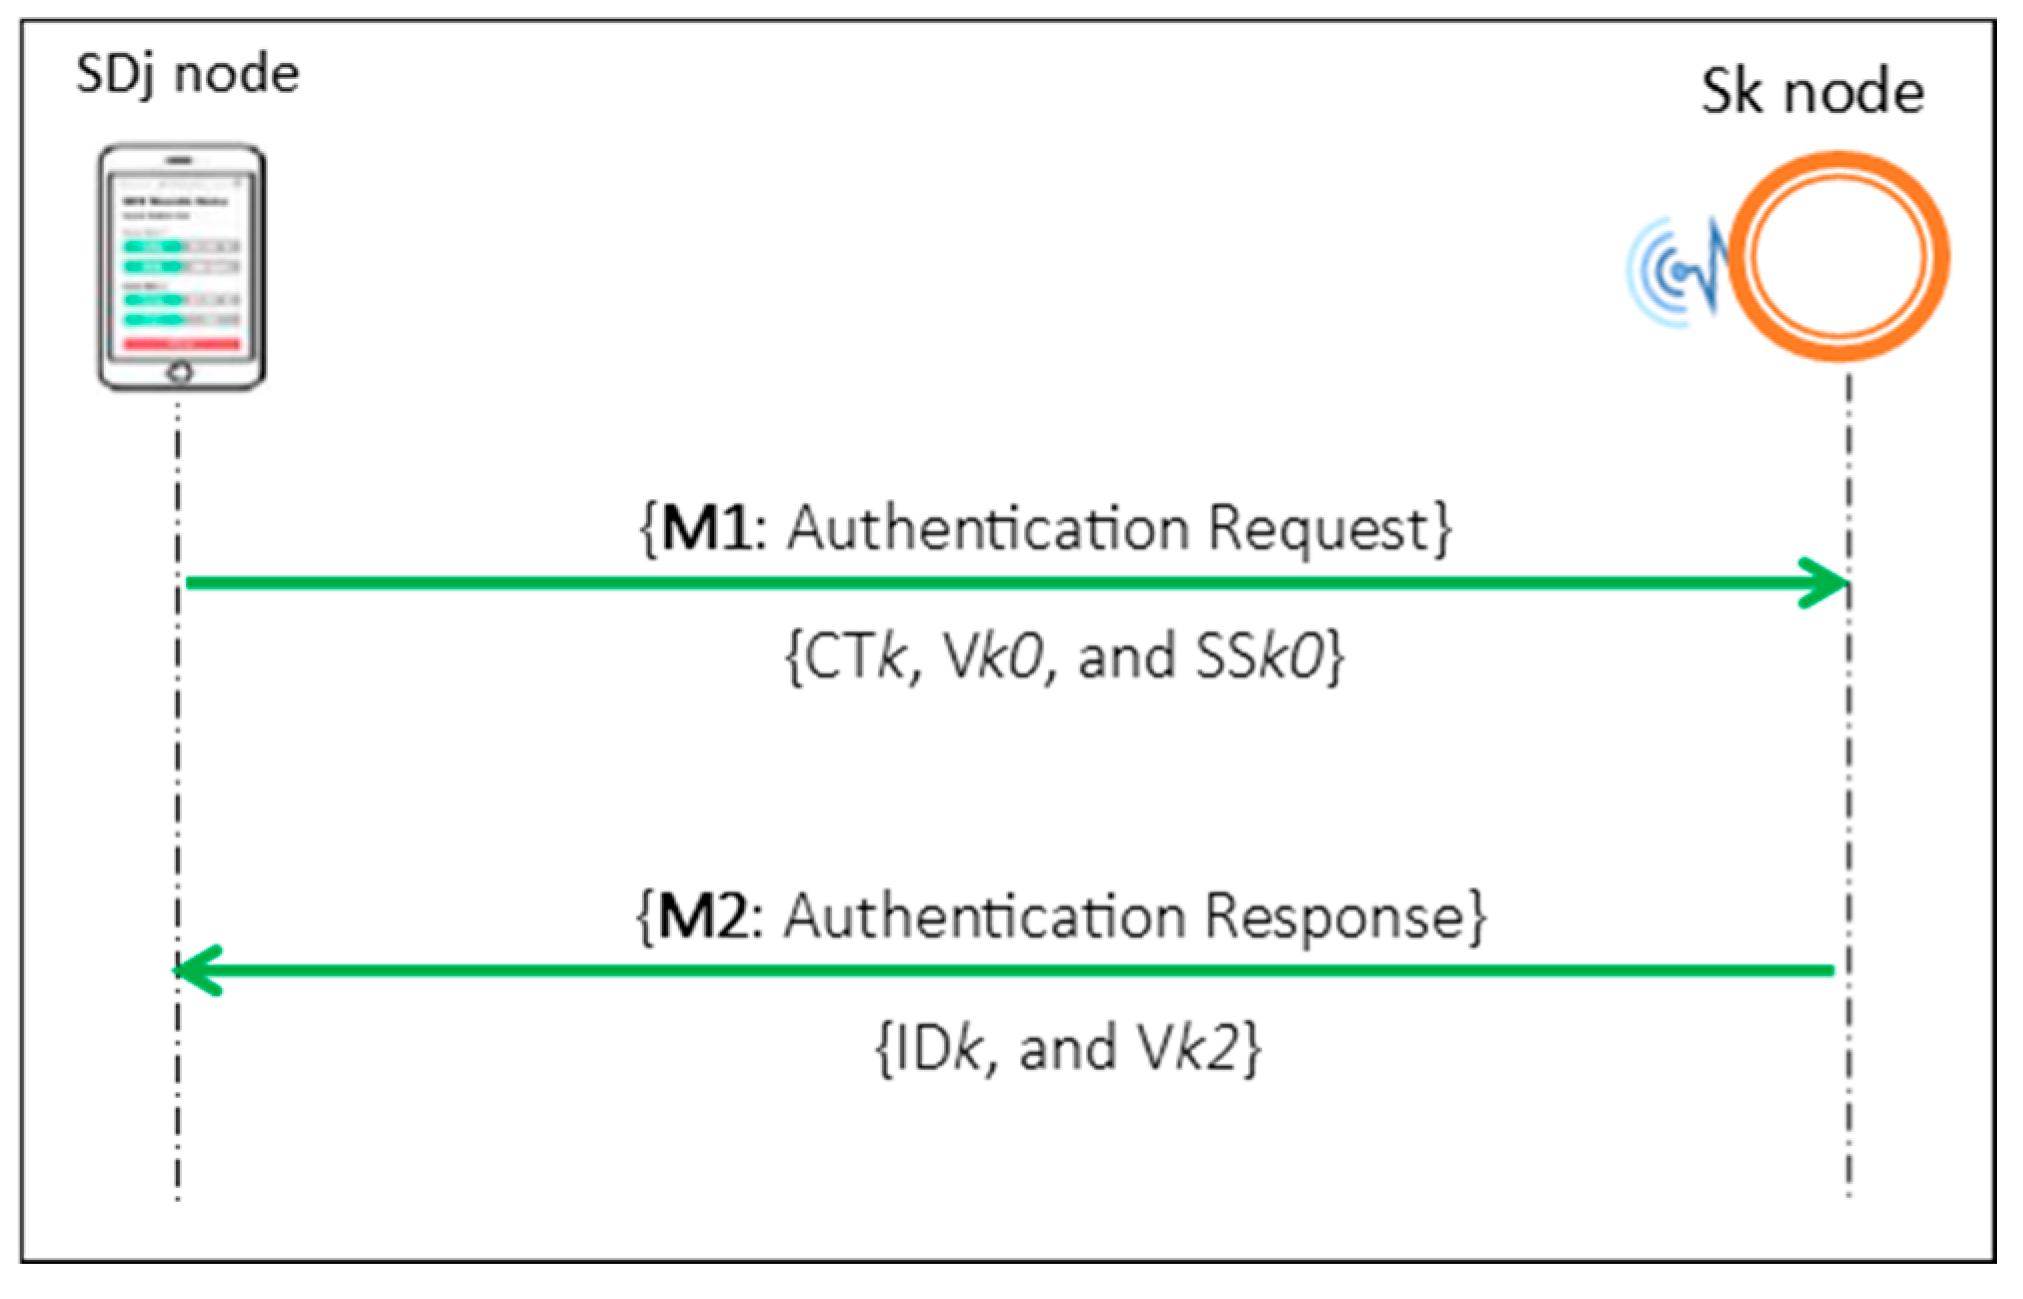
As shown in Figure 4, the exchange of M1 and M2 achieves mutual authentication between the SDj and Sk in the WAP. The SDj generates a secret key (SKk) to calculate the authentication parameters of the request message by performing a set of one-way hash functions, and the Sk derives the same SKk value to calculate the authentication parameters of the response message using the same hash functions that used on the SDj side. In this phase, both of the authentication sides maintain a pair of sequence numbers, SSk0 and SSk1, to maintain mutual synchronization.
M1 is a request authentication message that is the SDj generates to prove itself to the connected Sk and has the values CTk, Vk0 and SSk0: CTk hides the hash value of the SKk and the authentication session number; Vk0 is a hash value on the Sk side that verifies CTk; and SSk0 is a sequence number on the SDj side. Finally, M2 is a response massage that the Sk generates to prove itself to the SDj and consists of IDk and Vk2: IDk is a pseudonym for the Sk generated by the SDj to identify the Sk, and Vk2 value is a hash value used on the SDj side to verify the connected Sk.
From the aforementioned discussion, the main execution points of the E2EA scheme can be summarized as follows:
- (1)
- The Pi executes the LAP by sending an authentication request message to the GWN and delegates the GWN to perform mutual authentication with the SDj, wherein both of the Pi and SDj obtain the seed value of the PSij key;
- (2)
- The Pi and SDj can execute the SAP to authenticate each other a maximum of m times directly without going back to execute the LAP. In each SAP execution, the Pi and SDj derive a new value from the PSij key to encrypt the authentication parameters of the messages exchanged between them;
- (3)
- The WAP can be executed between the SDj and connected Sk after either the LAP or SAP execution to exchange either the vital signs or the medical orders of the patient. Therefore, the WAP can execute a maximum of m + 1 times without going back to the LAP execution.
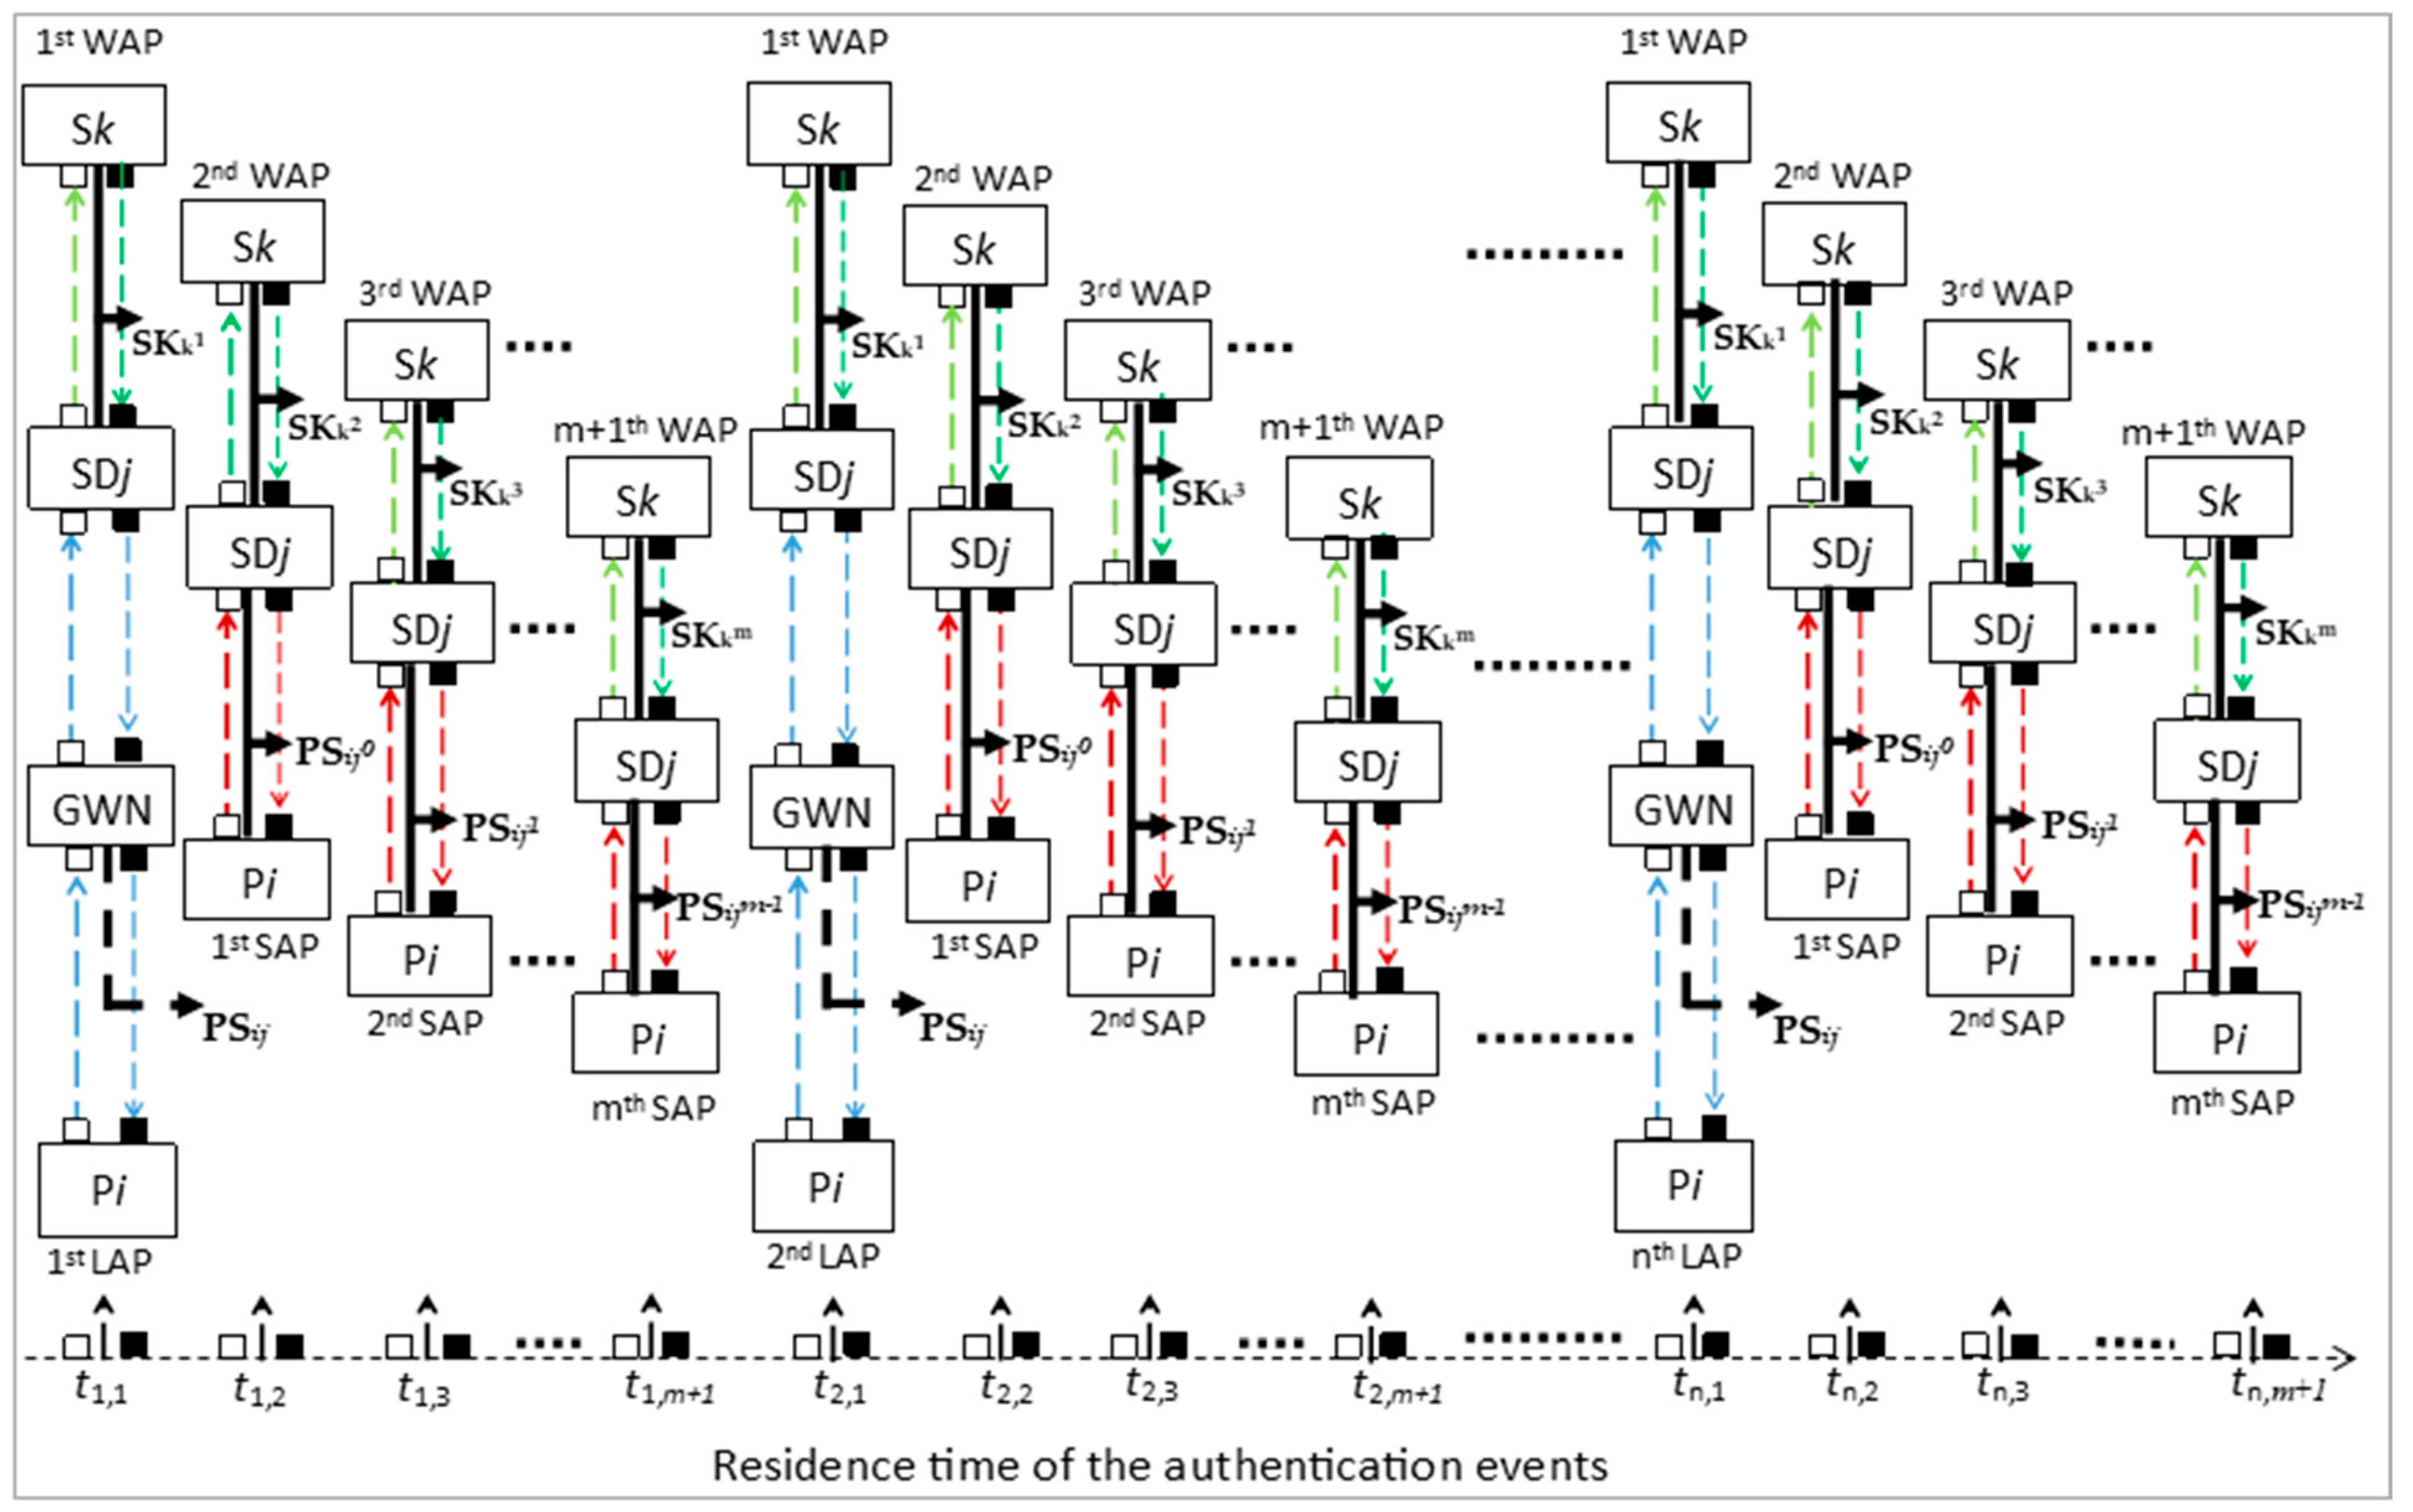
For further clarification of the relationship among the three phases, consider the timeline diagram in Figure 5. Suppose that the Pi sends a new authentication request to the GWN at time τ1,1. Then, the LAP is executed and a new PSij key is created by the GWN. So, both of the Pi and SDj obtained the first value of the PSij0 key. Mutual authentication is performed between the SDj and Sk by executing WAP using the first value of SKk1.
After τ1,1, the second authentication request event occurs at time τ1,2. The Pi initiates the first SAP using the (PSij0) key and the SDj initiates the second WAP with Sk using the second derived value of (SKk2).
At time τ1,m+1, the last allowable derived key value (PSijm−1) for the PSij key was used for the SAP at the m-th authentication event. (Cij is at the maximum value of m − 1). Moreover, based on the new value of SSk0 and SSk1, the last allowable derived value of SKkm was used for WAP at the (m+1)-th authentication event. So, at time τ1,m+1, both the Pi and SDj used a set of derived subsequent keys {PSij0, PSij1, PSij2…., PSijm−1} to authenticate each other by executing m-SAPs directly.
After τ1,m+1, the next authentication event occurred at τ2,1. The Pi realized that the value of Cij had reached maximum (Cij = m − 1), which executed the second LAP to obtain the next PSij key from the GWN, after which Pi and SDj performed the m-SAPs and m+1-WAPs, respectively. For next authentication events, the LAPs, SAPs, and WAPs were performed accordingly as descried above.
After τn,m+1, the Pi and SDj used the N-th PSij values that was created by GWN via all executed LAPs. It is worth mentioning that, the first WAP execution in each of the LAPs were not considered since it was not included in min Cij–max Cij. Thus, during the period τ1,1–τn,m+1, the authentication sessions number is (N − 1 LAPs, (N − 1) × m SAPs and (N − 1) × m WAPs).
1.2. Related Work
A few researchers have proposed an analytical model for the traffic signaling of authentication schemes. In 2003, Lin and Chen [26] proposed an analytical model base on the Poisson process to reduce authentication signaling traffic in a third-generation mobile network. This model was proposed to investigate the impact of the number of authentication vectors (AVs) generated by the serving network on the signaling traffic during the execution of the authentication scheme. This model was also used to develop an automatic K-selection mechanism that selected the size of the AV array dynamically to reduce network signaling cost. In 2009, Hen et al. [27] evaluated the signaling loads in the third-generation mobile network via an analytical model based on the renewal process theory. This model was used to study the effect of the call arrival rate, mobility, subscribers’ preference and operational policy during execution of the scheme. In 2017, Al-Saraireh [28] proposed an analytic model based on the Poisson process to reduce authentication signaling traffic in the long term evolution (LTE) mobile network. This model was proposed to determine the impact of the size of authentication vector (AV) array generated by the serving network on the signaling traffic during the execution. In 2021, the authors [29] proposed an analytical model to reduce the overhead message cost of the secure anonymity authentication key and key agreement scheme (SAK–AKA) for 4G/5G mobile networks. In this analytical model, the authentication messages were represented by a Poisson process, wherein the residence time of the user request for authentication had an exponential distribution to determine the number of authentication vectors (AVs) to be generated by the serving network to authenticate the user’s mobile.
In none of the aforementioned research papers was there a proposal for an analytical model to analyze and minimize the authentication signaling traffic cost of a healthcare systems authentication scheme.
1.3. Motivations and Contributions
In an E2EA scheme, LAP operations carry high communication costs. Therefore, we sought to increase the maximum limit of Cij to reduce the number of LAPs performed when the Pi sends an authentication request to the GWN. On the other hand, if there is a large number of m, the level of security may be degraded. Thus, an appropriate (m) value need to be found that can maintain a specific level of security while minimizing the authentication signaling traffic costs. The main contributions of this paper can be summarized as follows:
- (1)
- Introduced the E2EA scheme by explaining the relationship between its authentication phases.
- (2)
- Introduced the residence timeline of authentication events in E2EA scheme.
- (3)
- Proposed an analytic model to represent E2EA signaling traffic according to Poisson process, wherein the residence authentication time has three types of distribution: gamma, hypo-exponential, and exponential.
- (4)
- Derived a signaling traffic cost function for the (m) value effect on the communication lines between the authentication nodes.
- (5)
- Analyzed the derived signaling traffic cost function numerically using the Newton–Raphson method to determine the optimal value of (m) to minimize the cost of E2EA scheme.
1.4. Organization of This Paper
In Section 2, an analytic model is proposed to derive an authentication signaling traffic cost function for the E2EA scheme by representing the signaling traffic according to the Poisson process using three types of distributions. Section 3 discusses the analysis of the proposed analytical model to show the impact of the (m) value on the signaling traffic costs of the authentication events. In Section 4, the Newton–Raphson method is used to derive the optimal value of (m) numerically. Finally, we provide our conclusions in Section 5.
2. Proposed Analytic Model of E2EAScheme
Let N be the total number of LAP authentication events performed by the Pi. For each LAP event, the Pi and SDj execute m-SAPs, where the WAPs are a consequence of the SAP times. Suppose that the aggregate incoming/outgoing Pi authentication messages form a Poisson process with rate (λ), {N(t): t ≥ 0}, where t is the residence time that the Pi sends an authentication request to the GWN. Let Ψ (n, m, t) be the probability that there are n-LAPs for residence period t; this means that the process does not reach the (n+1)-th LAP and the authentications were n-LAPs; that is, m(n − 1)-SAPs and i-SAPs before time τ n,m+1, where 0 ≤ i ≤ m − 1. Thus, the total number of performed authentication events of the Pi at time t = (τn,m+1–τ1,1) is (m(n − 1) + i). Therefore, according the probability function of the Poisson distribution [30], we have:
let Ψ (n, m) be the probability function that there are n-LAPs during the residence time and m is the performed SAPs for each LAP so that:
where T is a non-negative random variable representing the residence time of the Pi. The expected number of authentication events through the residence time is given as:
if C(m) is considered to be the total cost of transmitted messages in the E2EA scheme through the residence time when the Pi requests authentication to monitor a specific SDj, then the total cost of all authentication phases is the expected number of authentication events multiplied by the cost of each event (i.e., the LAPs, SAPs, and WAPs phases), which can be expressed as:
where α and β represent the overhead transmission cost of the authentication messages through the internet and WMSN connections. In the following subsections, the Ψ (n, m), E(N), and C(m) are computed, wherein the residence time T has gamma, hypo-exponential, and exponential distributions, respectively.
2.1. T Has an Exponential Distribution with Mean
Equation (2) becomes:
Using the geometric series formula:
if , and ; then Equation (5) becomes:
Equation (6) explains that Ψ (n, m) has the geometric probability function with mean p−1. This is a reasonable and consistent result since a LAP should be executed first and then m-SAPs with probability γm. In general, N has a geometric distribution expectation, so (3) and (4) can be rewritten as (7) and (8), respectively:
2.2. T Has Hypo-Exponential Distribution
Actually, the hypo-exponential distribution was used for modeling multiple exponential phases in series, which is a suitable for an IoT system since the Pi executes two types of authentication phases (LAP and SAP). WLOG, assume that T has hypo-exponential distribution with mean such that , then from Equation (2) we have:
If , then the geometric series formula gives:
Note that the is a linear combination of two probability density functions of the geometric distribution with means and , respectively; therefore:
2.3. T Has a Gamma Distribution
Assuming that T has a gamma distribution with the shape parameter and that is the scale parameter (with mean , and variance ), then from Equation (2) we have:
where .
Ψ (n, m) is the cumulative distribution function of the negative binomial distribution regarding the number of executed m-SAPS (sometimes called mixture of a family of Poisson distributions with Gamma mixing weights) with parameter () and (γ). To find the relation between the probability function Ψ (n, m) and the mean of the residence time, substitute and into Equation (12):
Thus, the expectation E(N) and the cost function C(m) in Equations (3) and (4) will be:
3. Analysis of the Proposed Analytical Model
This section describes the impact of (m) values on the E(N) according to Equations (7), (10) and (14), and the cost function C(m) according to Equations (8), (11) and (15).
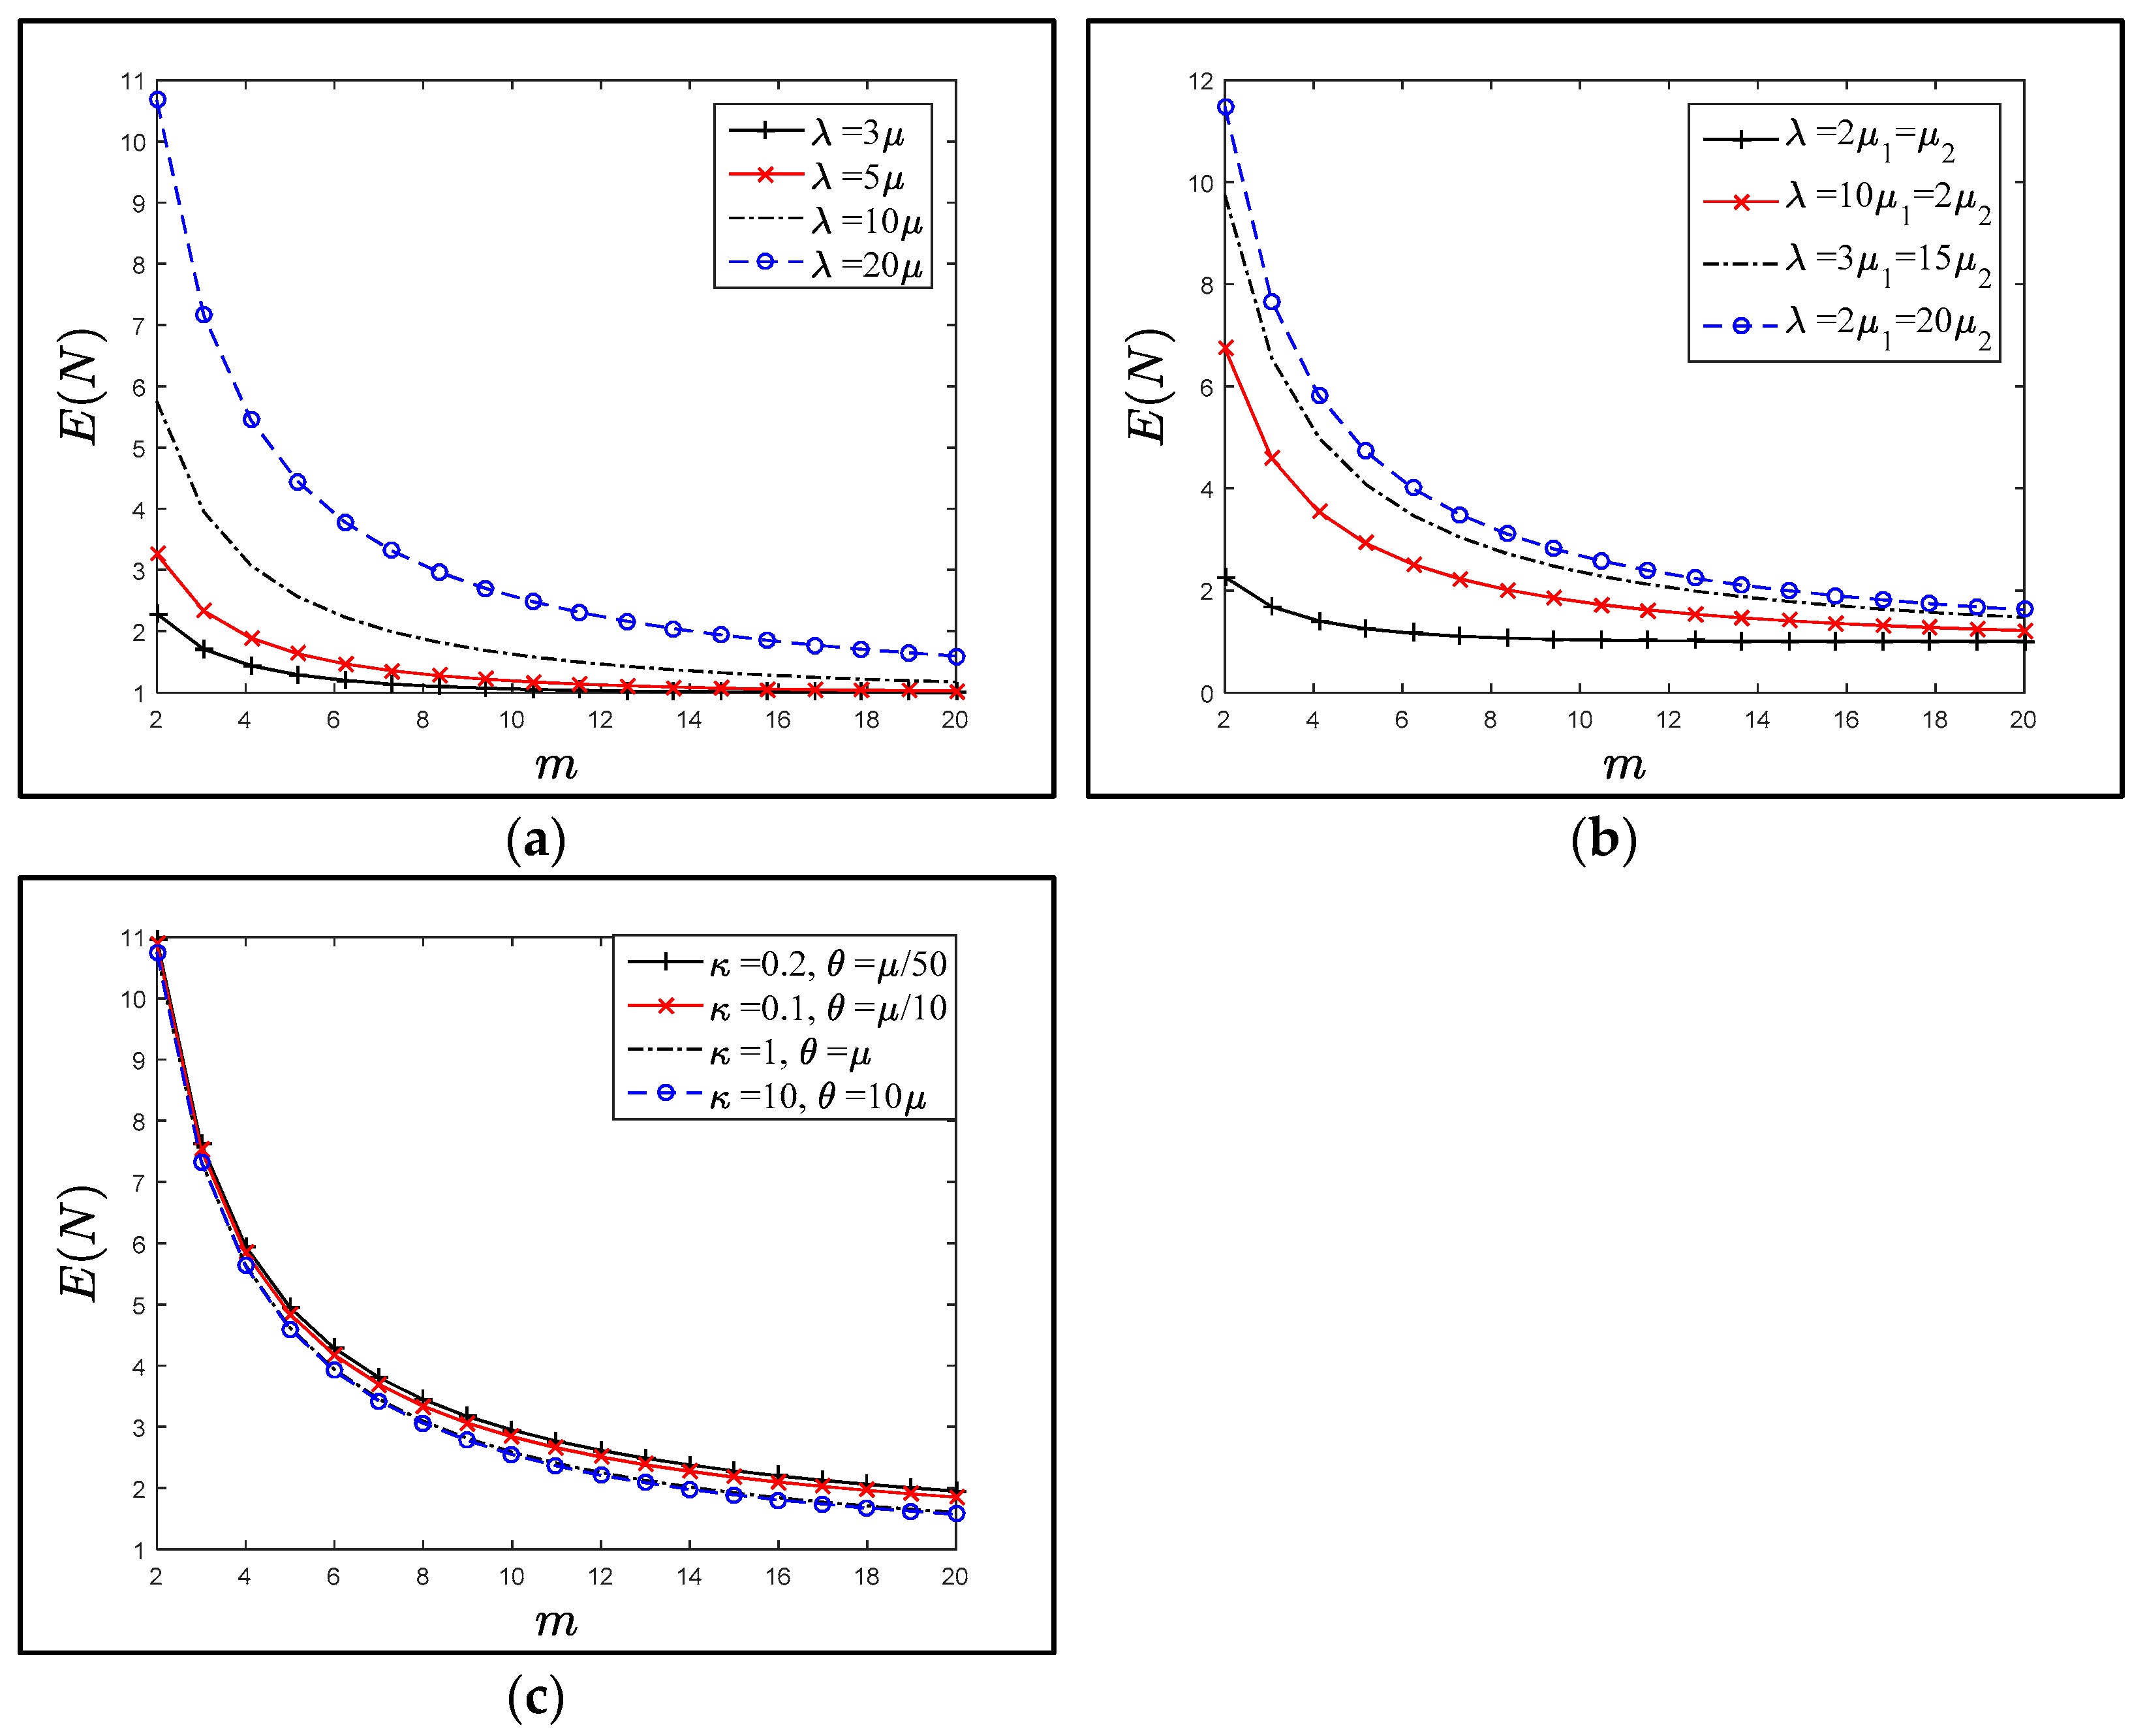
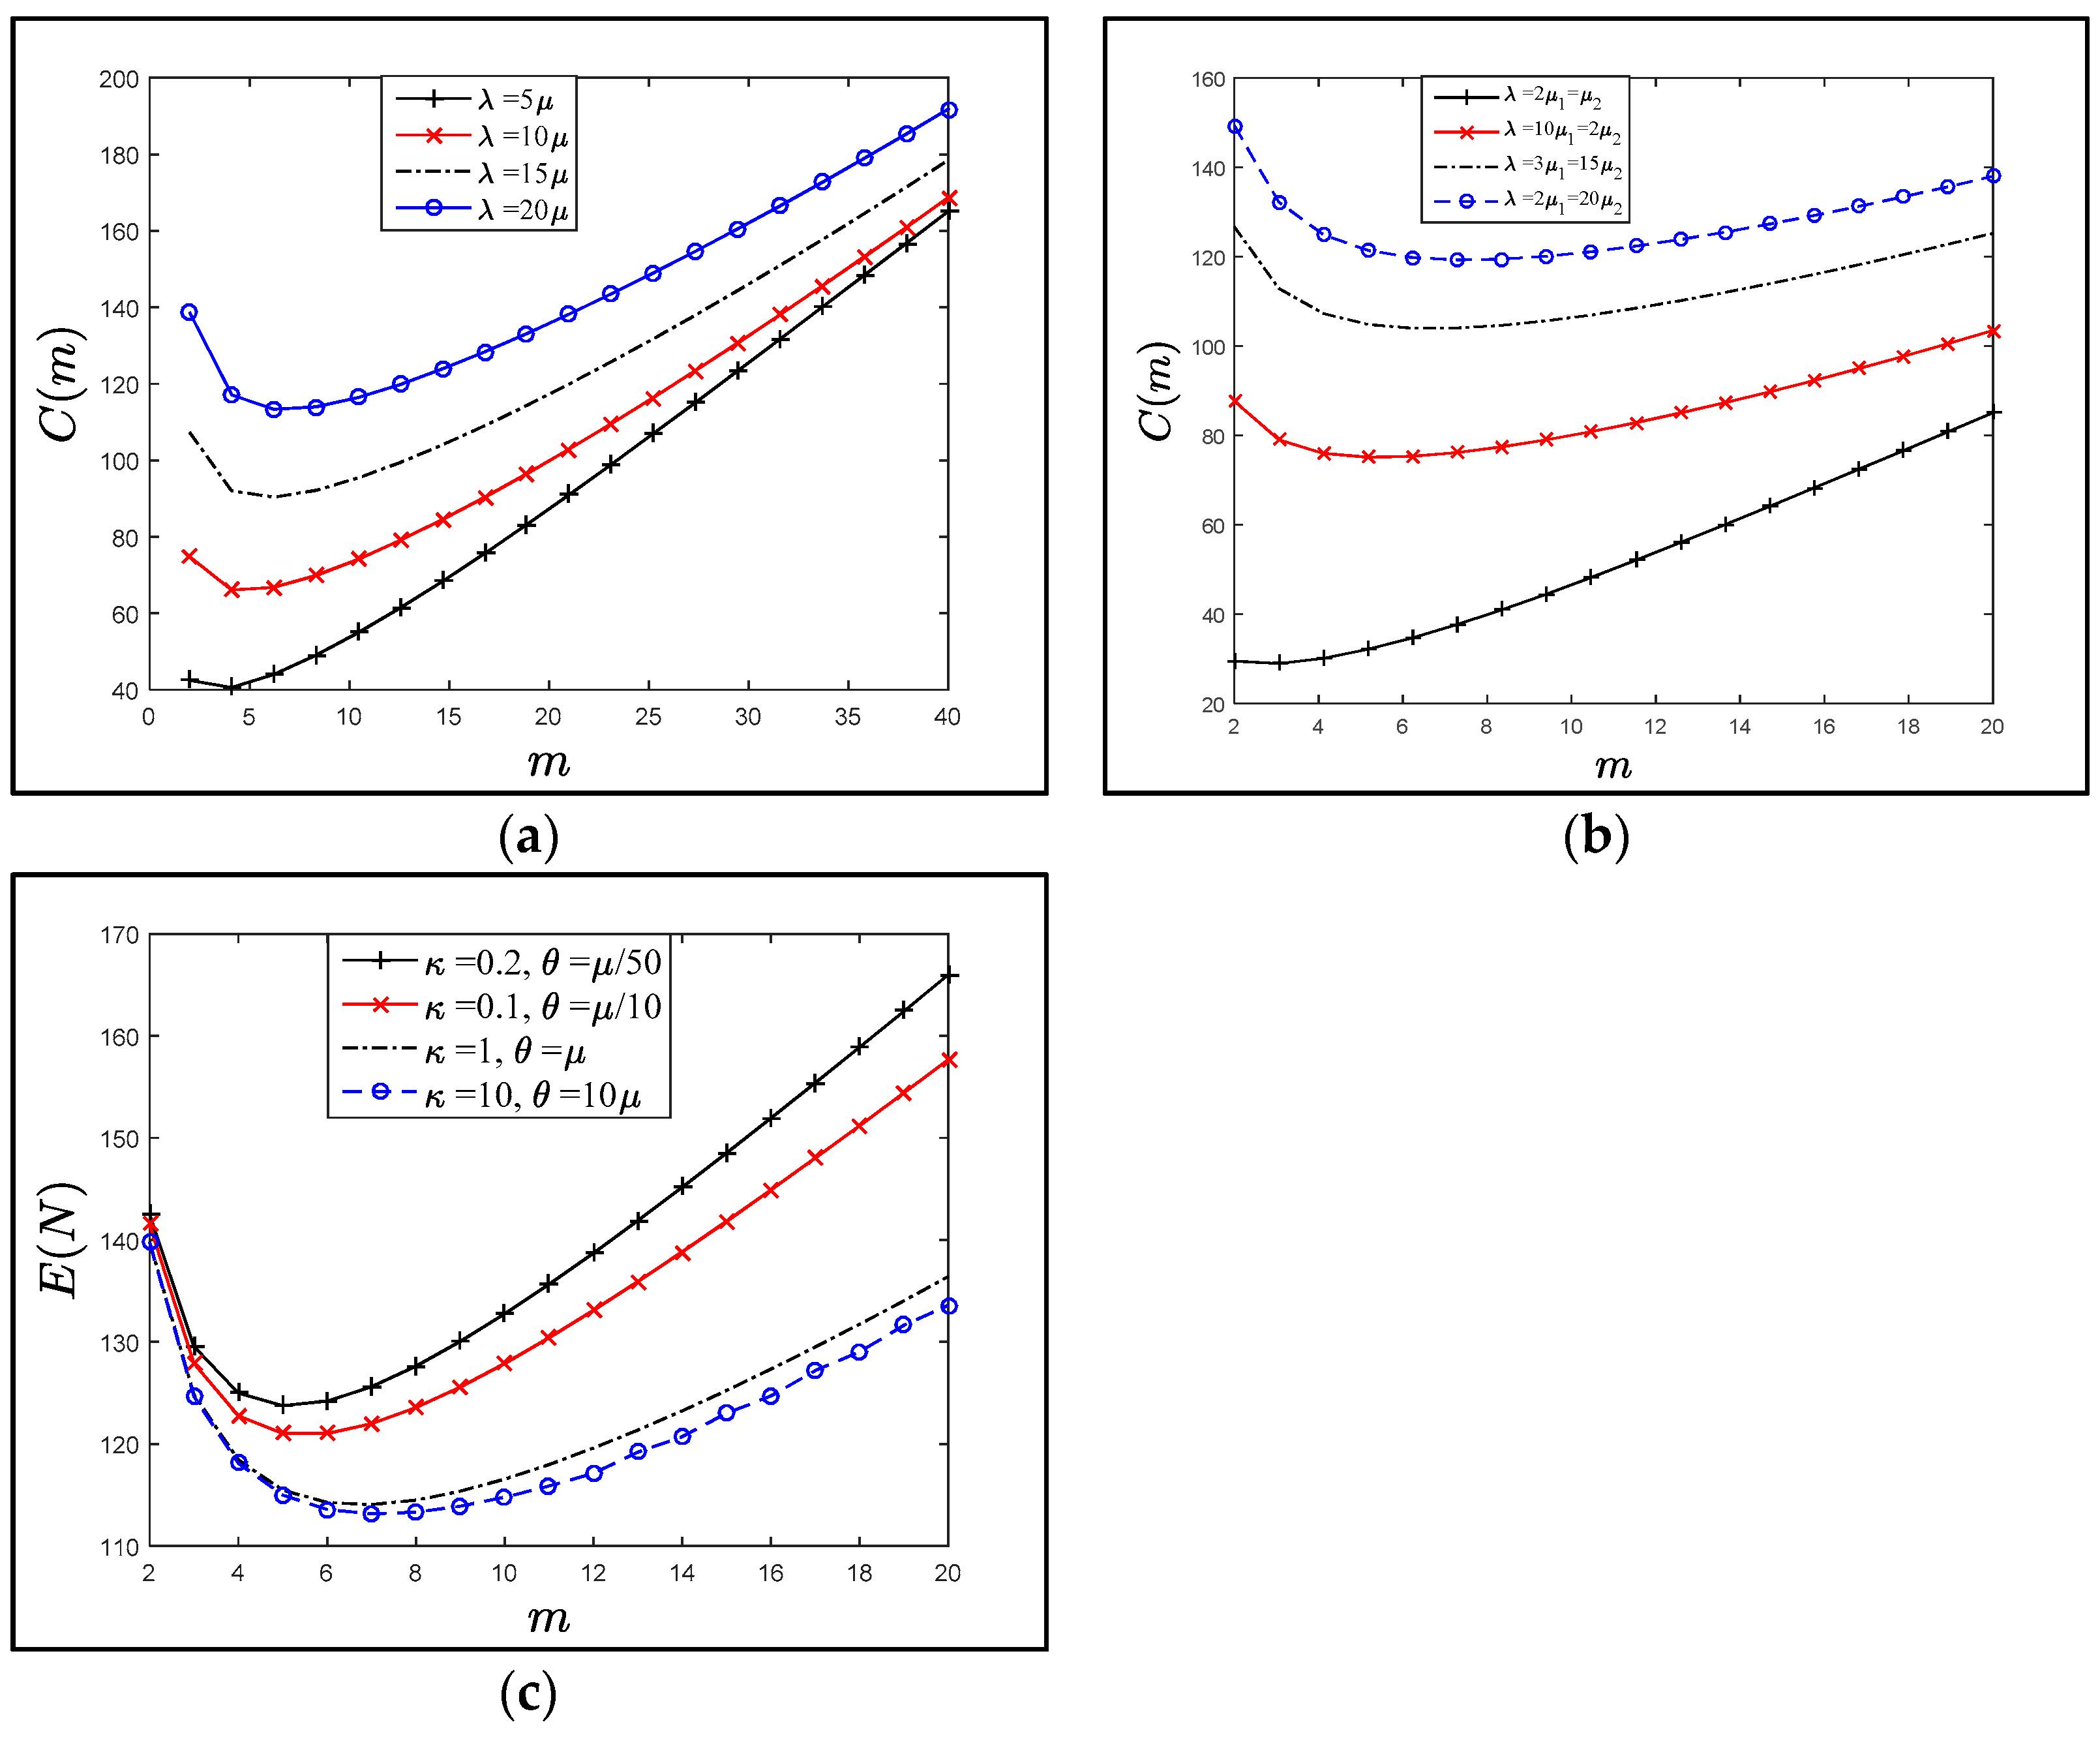
Figure 6a–c plot the relation between the E(N) versus the value of m for the multiple arrival rate (λ), where the residence time is distributed (exponential, hypo exponential and gamma) with means μ−1, μ1−1 + μ2−1, and μ−1, respectively. It is obvious the E(N) is a decreasing function of m and the plotted points are closed to each other. After a while m ≥ 10, E(N) is insignificantly reduced by increasing the value of m.
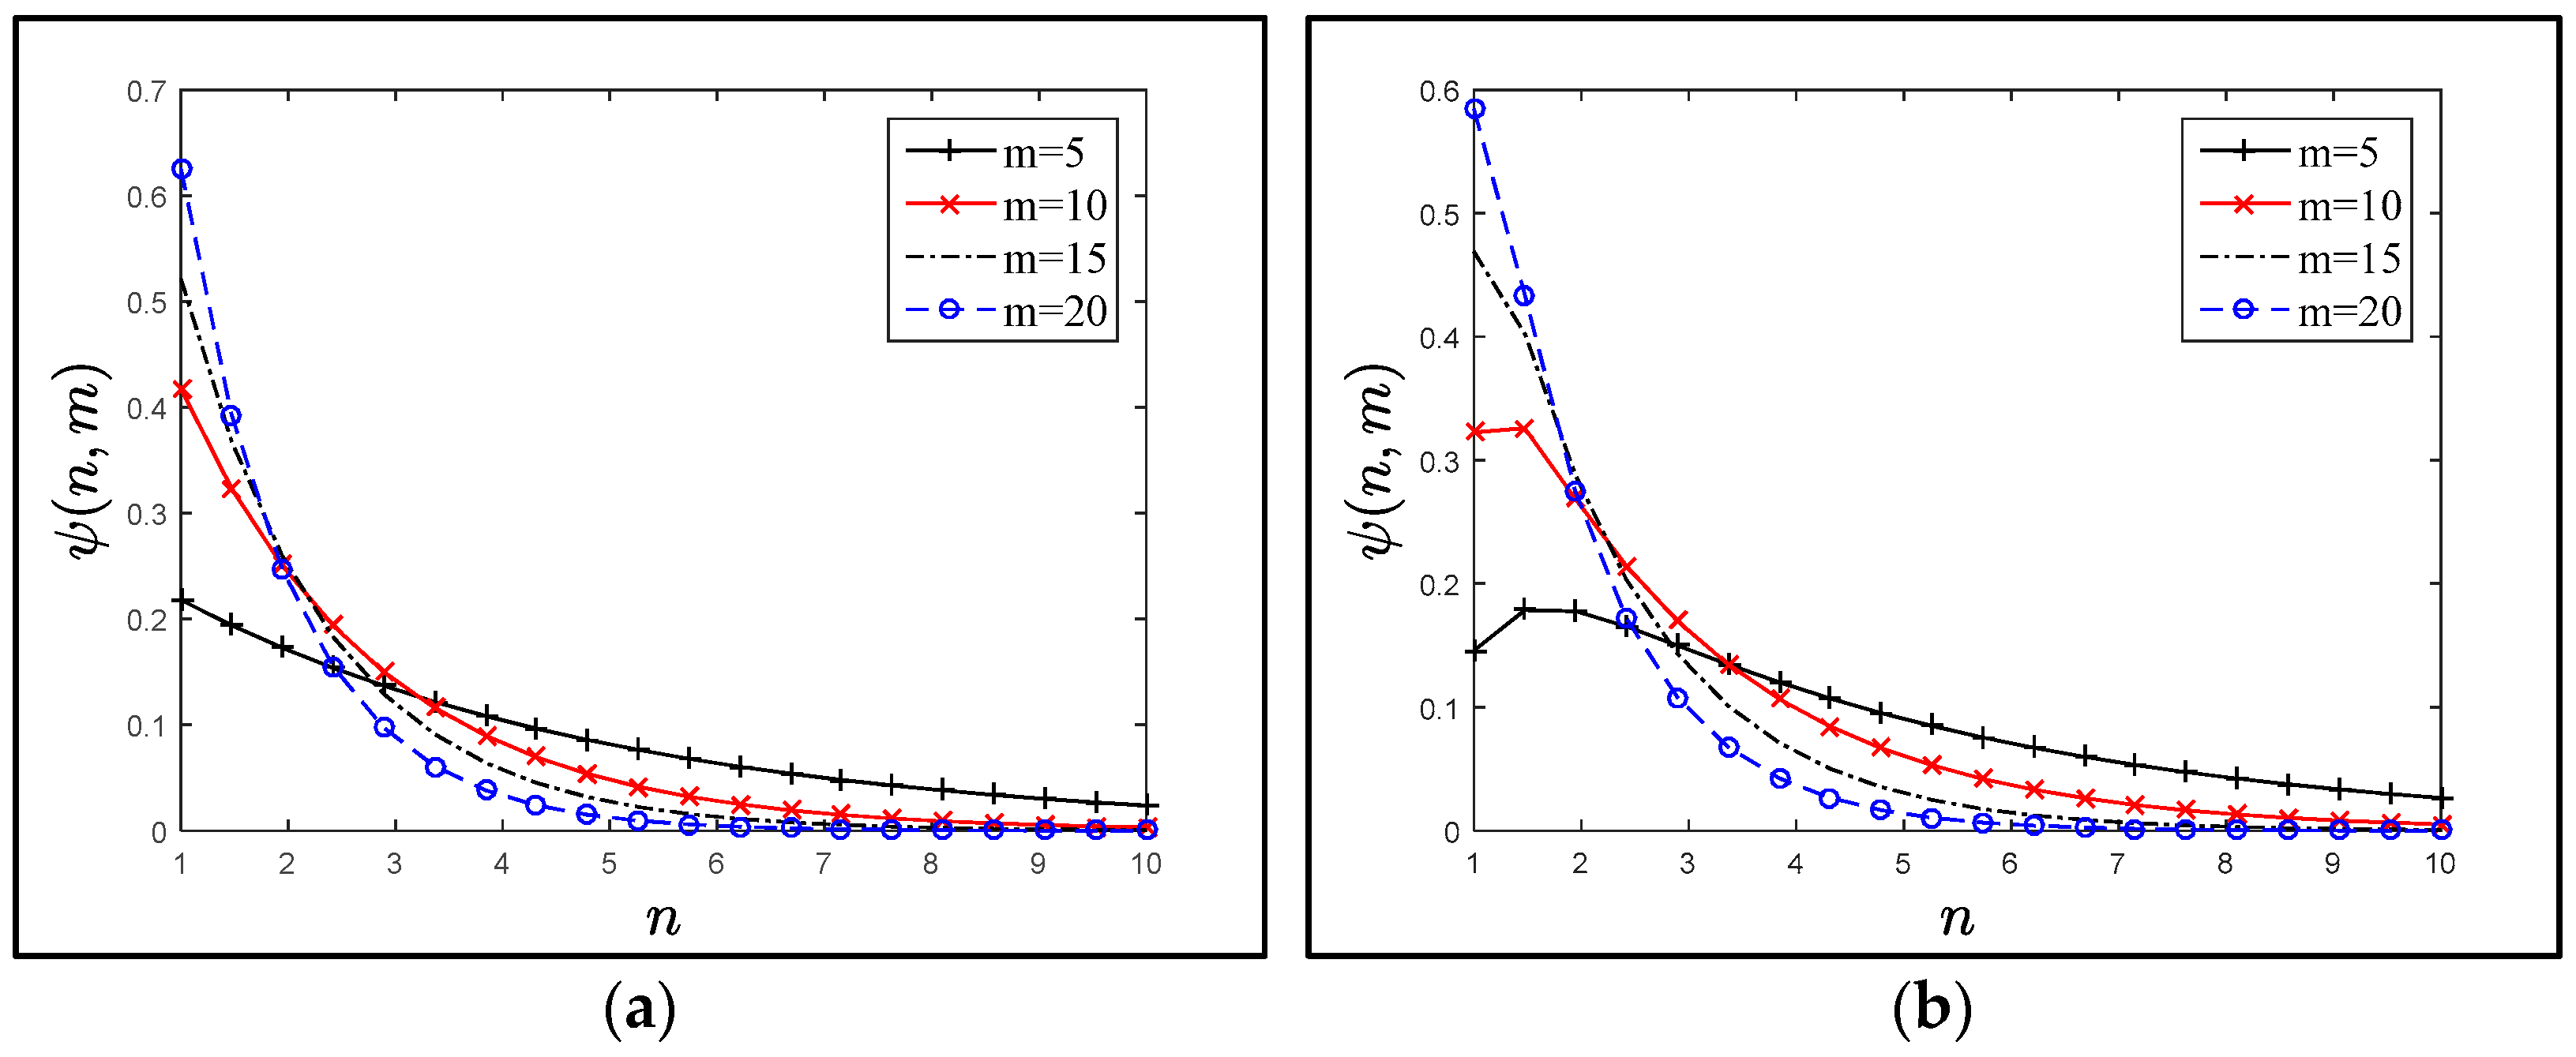
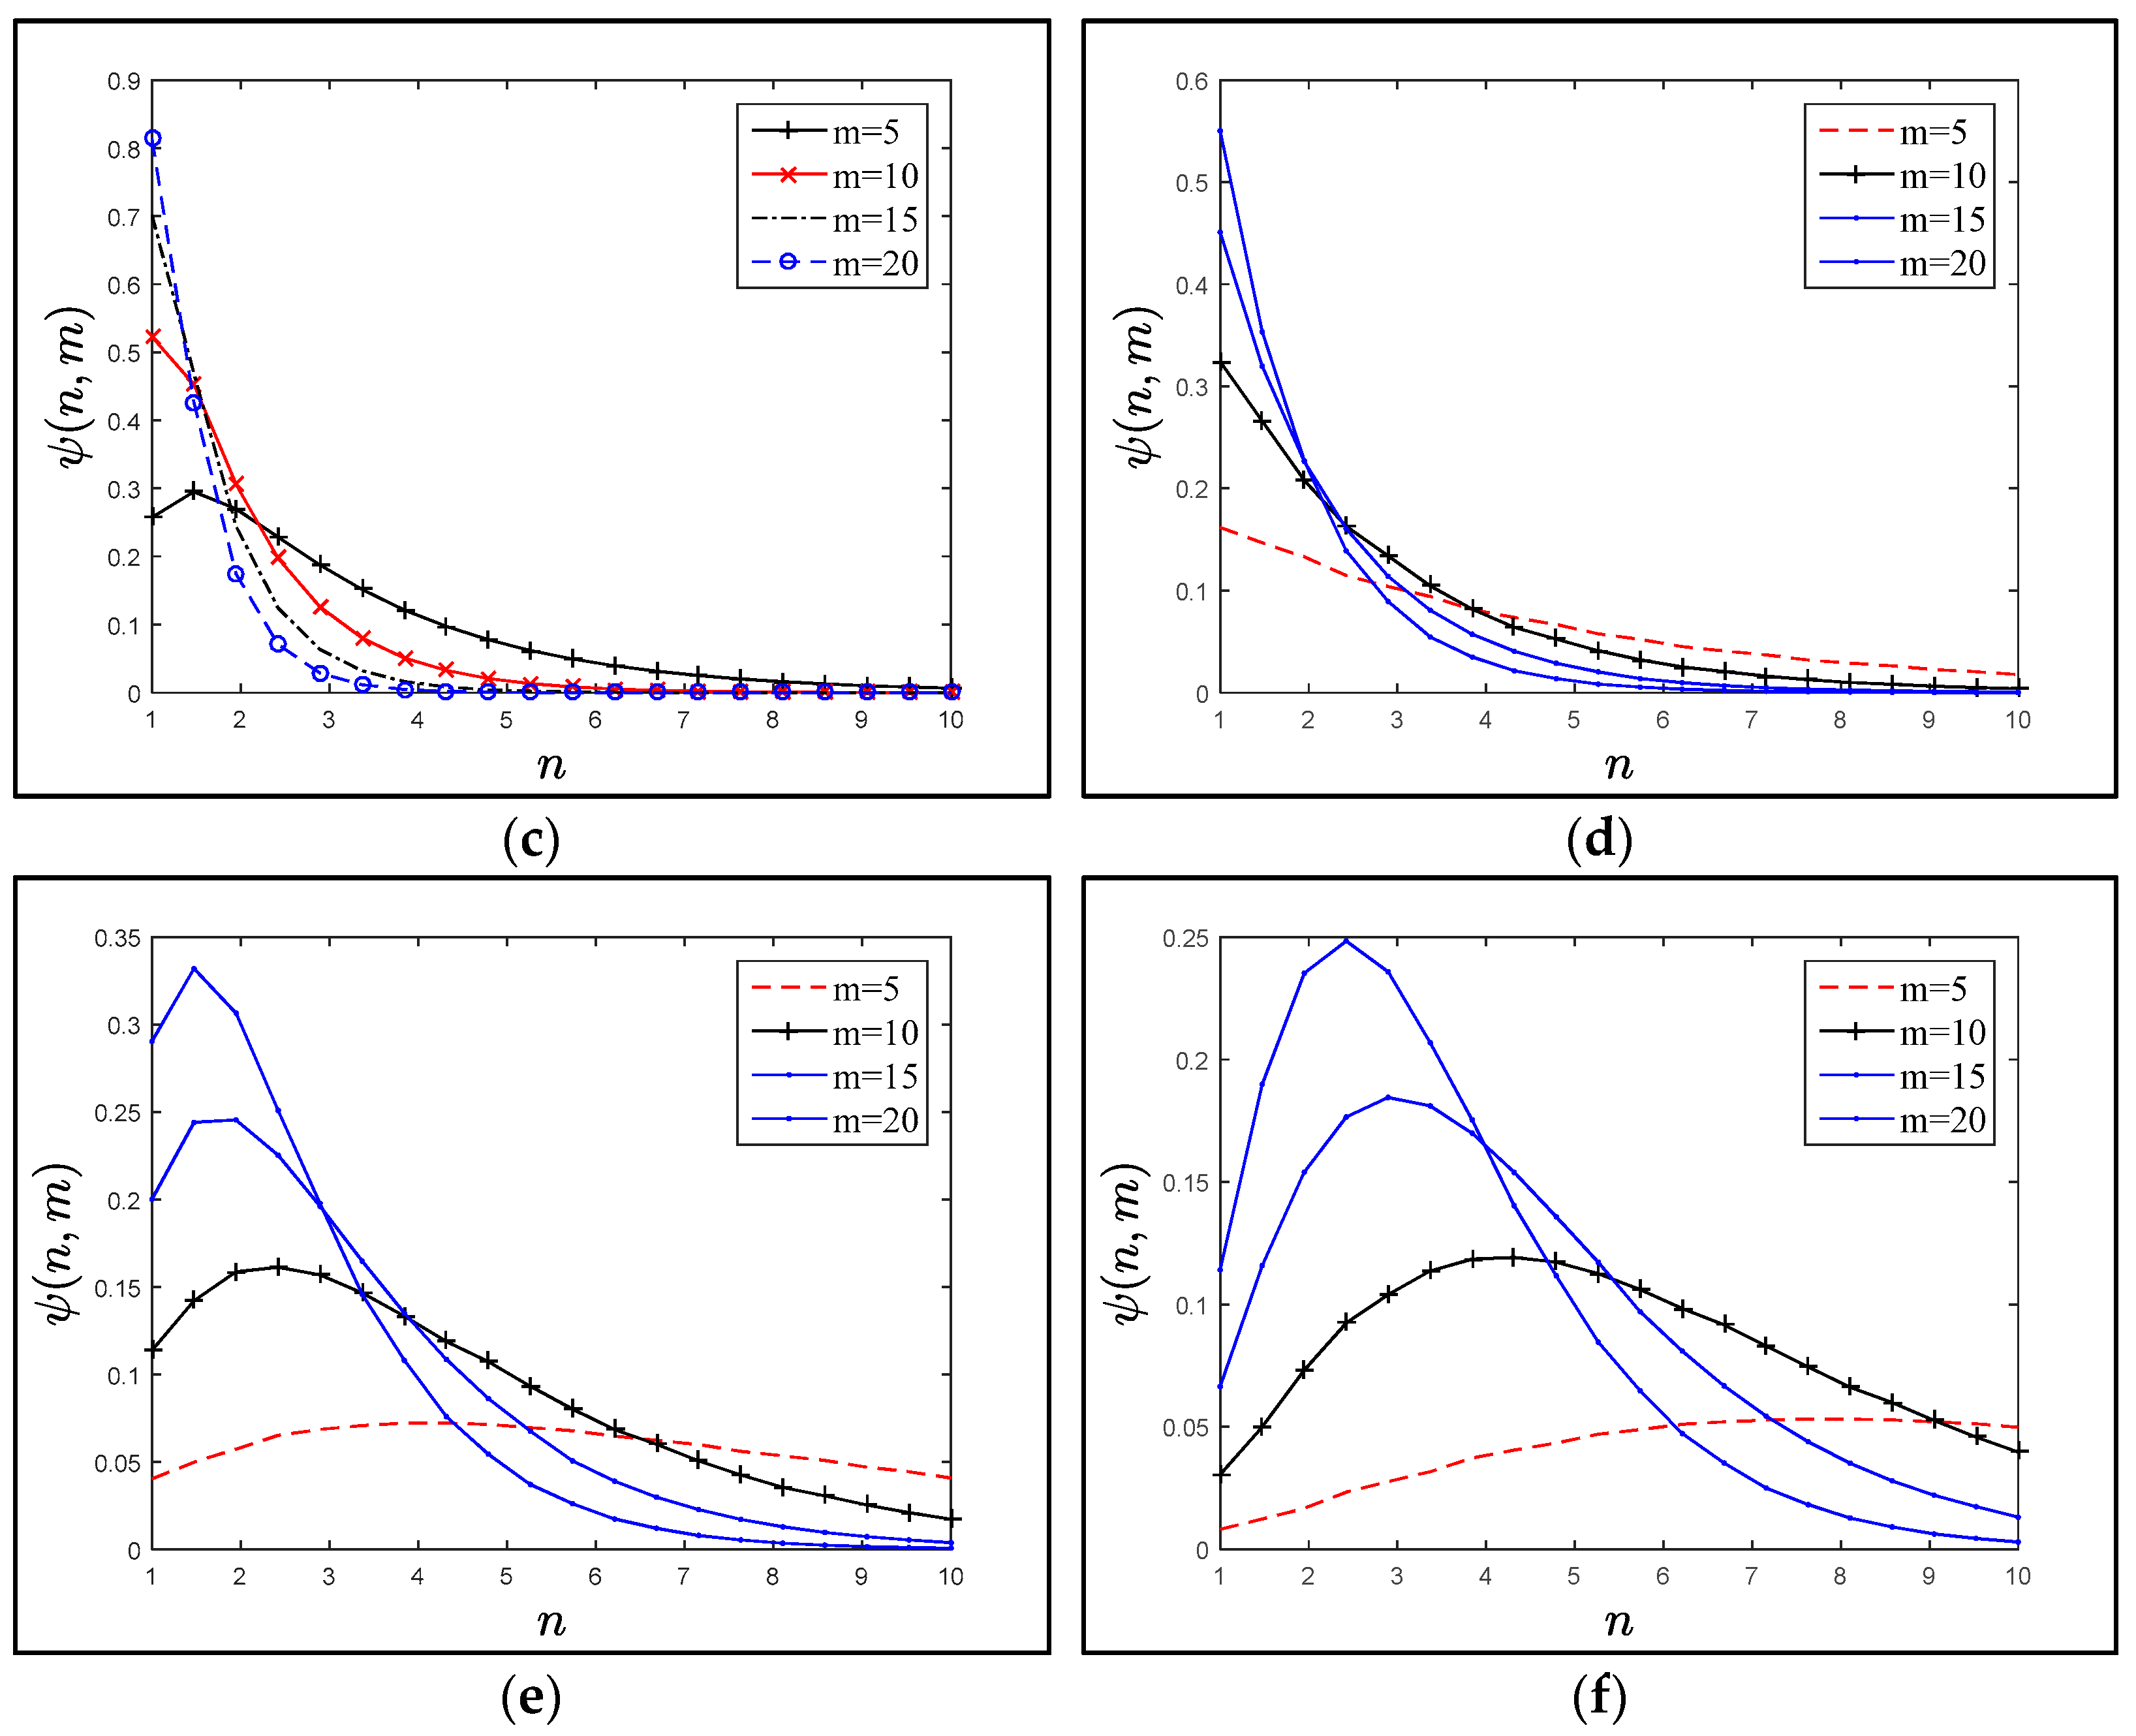
On the other hand, the function Ψ (n, m) had a different behavior with respect to m, for the fixed ratio γ. Figure 7a–f plot the probability density function Ψ (n, m) when the number of SAPs was 5 ≤ m ≤ 20, for various residence-time distributions. Notice that the behavior of Ψ (n, m) was similar after a specified number of n; for n ≥ 6, the plotted points were closed to each other. This observation was consistent with Figure 6, i.e., the E(N) value was the same for the large (m) value, and the increasing value of m did not improve the E(N) value.
Figure 8a–c show the effect of m values on the trend of the cost function C(m) for fixed α, β, and λ. The trend of the plots is the same for various residence time distribution, all plots obviously show that there is a critical value (m), which is minimizing the cost function, and after this point, the C(m) is rapidly increased. Also, the C(m) values are significantly increased with the increasing of the (λ) values. These results are proportionate with goal of the direct authentication between the Pi and SDj, that if there are more SAPs, then more authentication keys (PSij) should be derived by the Pi and SDj.
Figure 6, Figure 7 and Figure 8 show that applying various distributions (gamma, hypo-exponential and exponential) as residence times did not change the trend of Ψ (n, m), E(N) or C(m) significantly. Therefore, studying the extent of the influence of one of these probability distributions was sufficient. Where the exponential distribution was good in the mean and dealt with all the trends was a special case of the gamma and hypo-exponential distributions.
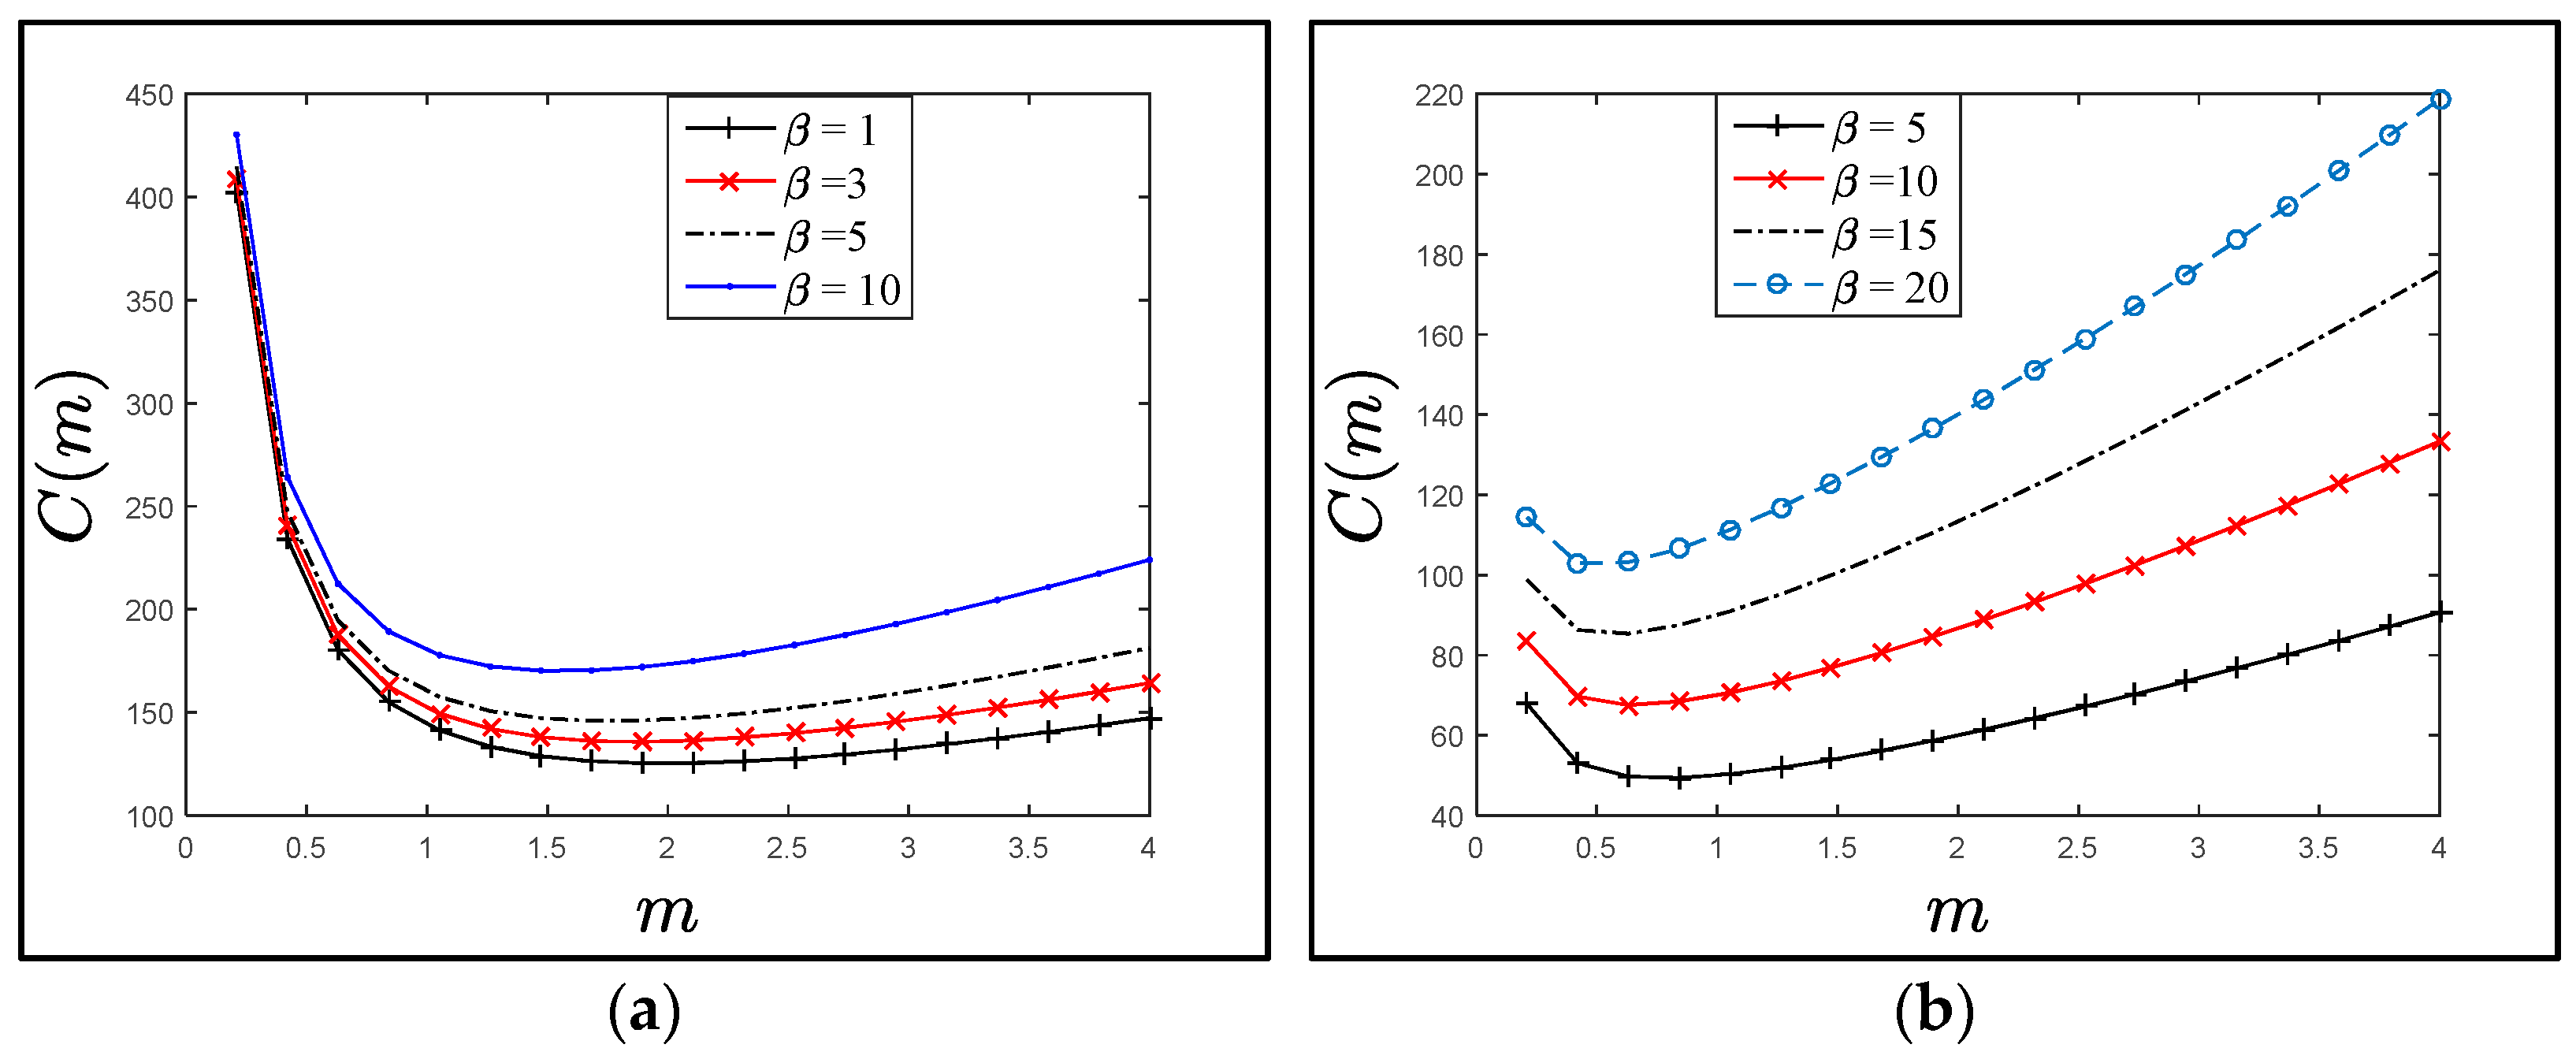
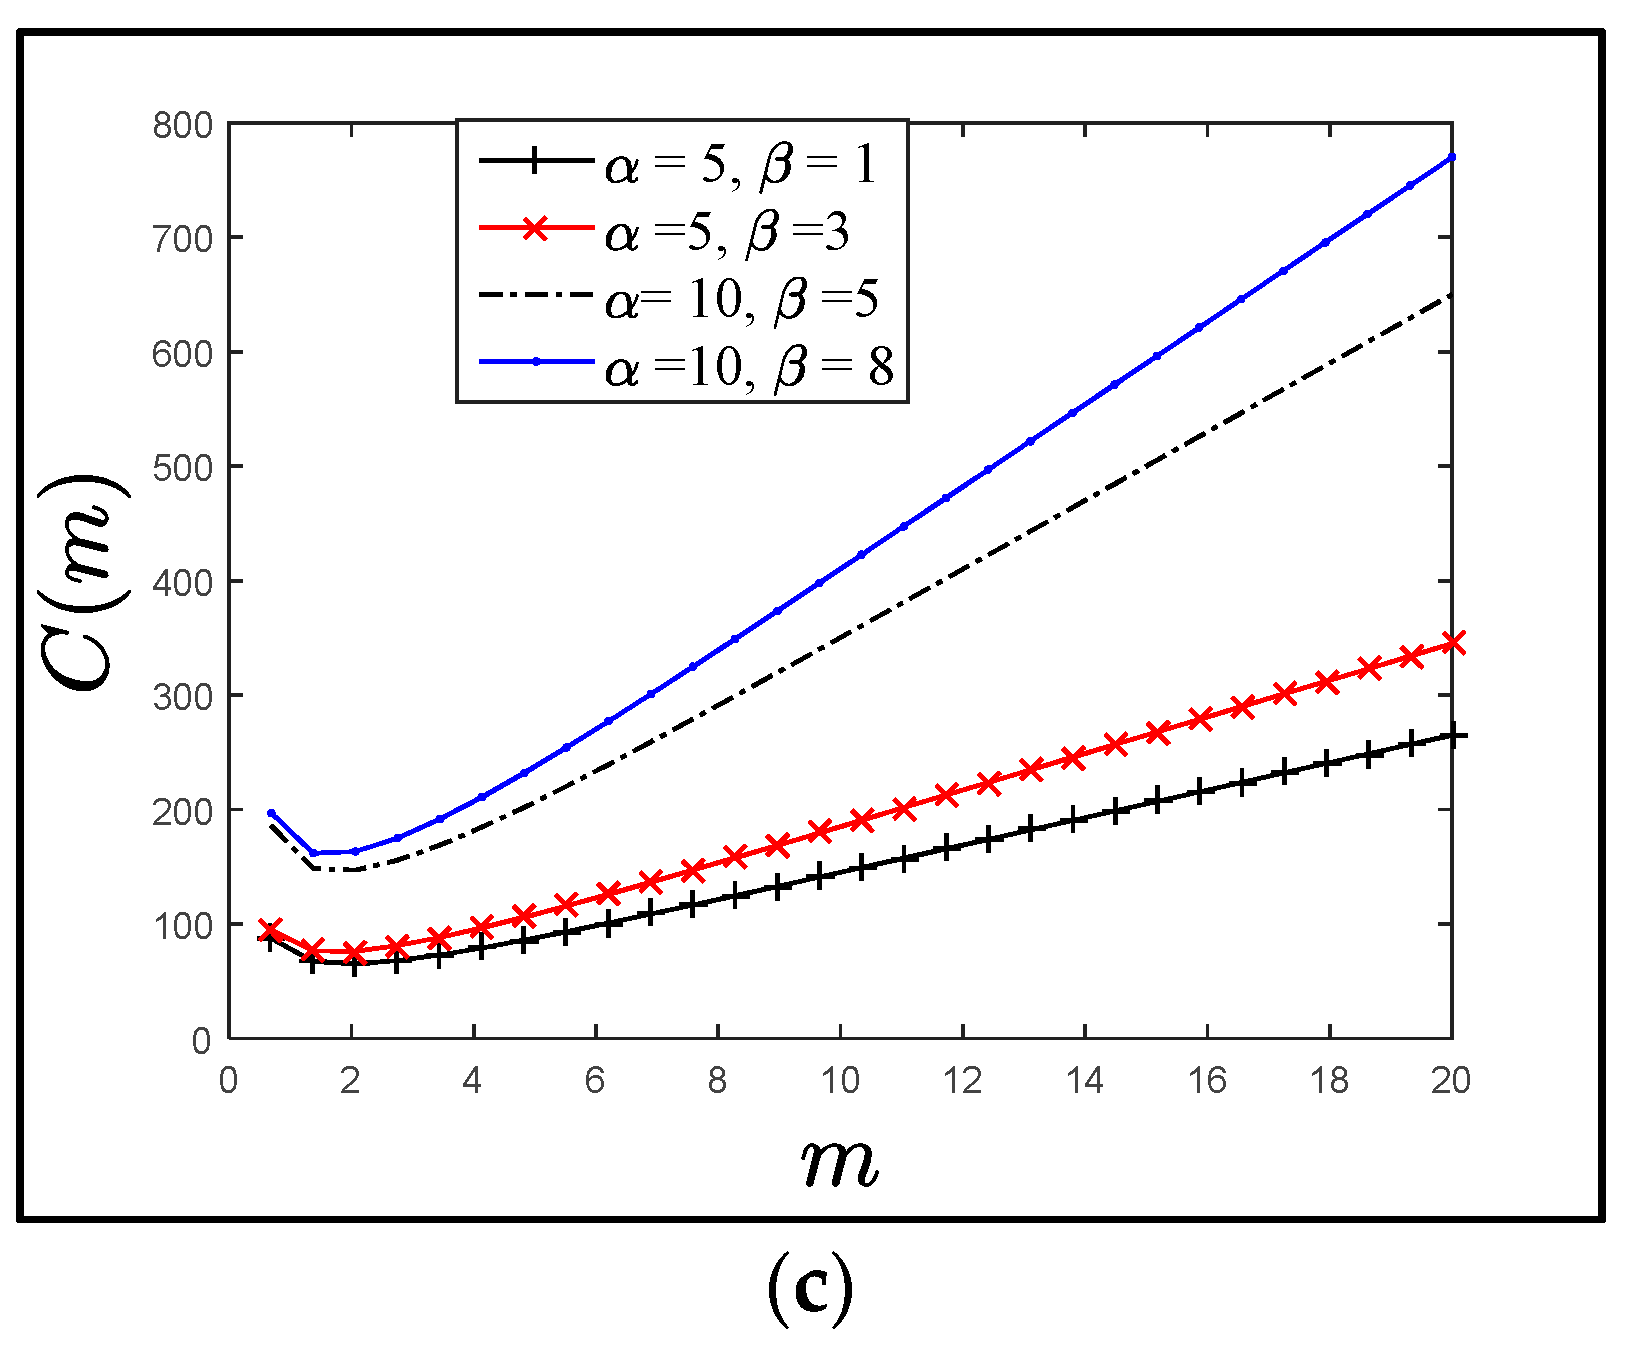
Figure 9a–c represent the relation of the C(m) function when the residence time is exponentially distributed (with mean µ−1, where λ = µ) versus m-SAP values to illustrate the effect of the overhead transmissions of the authentication messages α and β during the SAP and WAP execution under different conditions (1 ≤ β ≤ α =10, α = 5 ≤ β ≤ 20, and in c, 1 ≤ β ≤ 8 and 1 ≤ α ≤ 10). All figures show that there is an optimal value that minimizes the cost function C(m), and it increased rapidly after this point. can be obtained by differentiating C(m) in Equation (8), where X can be approximated by:
4. Optimal m-Value Selection
This section provides a numerical analysis to compute the optimal values (X*) that minimizes the cost function C(m). Applying the Newton–Raphson formula [31] on the derivative of Equation (8), the recursive equation is:
where X0 = 1 and k = 0, 1,2, ….
In Table 1, the optimal values are given for different α, β, and γ, where λ = zµ, and z = 1, 2, 3, 4, 5, 10, 20, and determined according to different combinations of α and β values. We assumed that the values of (β) were {1, 2, 3, 4, 5, 10, 15, 20, 75, 100} and the values of α were {1, 5, 10, 20, 100}. Clearly, the value of X* increased when the ratio (γ) increased (i.e., λ increased), and X* increased slightly with the large increase in α values for any specific fixed value of the request ratio (γ). On the other hand, X* decreased when (β) increased. However, the results of Table 1 confirmed the consistency of the relation between the optimal value C(m), α, β and γ that were previously deduced. In this context, the main factors that increased the authentication requests were the medical status and the number of the patient’s connected sensors.
5. Conclusions
In the E2EA scheme, it is important to determine an appropriate m value that represent how many times the SAPs and WAPs will be executed when the LAP is executed. This can maintain a specific level of security and reduce the authentication signaling traffic cost. In this paper, we proposed an analytical model based on the Poisson process for E2EA to derive the authentication cost function and compute the optimal values of m according to the overhead transmission of authentication messages that minimize the signaling traffic cost. We observed from the numerical analysis of the proposed model that the optimal value m increased when the value of the authentication request ratio γ increased. For any specific γ value, the optimal m value decreased when the overhead of the authentication messages α transmitted through the communication channels increased. Hence, the service provider of the E2EA scheme-based healthcare IoT system should use an m-selection algorithm to determine its optimal value dynamically according to the authentication request ratio of the physician when it executes the LAP and SAP for a specific patient to reduce the cost of authentication signaling traffic. Therefore, investigating of our analytical model using a complement simulation tool, and designing a dynamic algorithm to determine the optimal values of (m) with variant authentication request ratio are our future works.
Author Contributions
Conceptualization, S.N.; methodology and writing—original draft preparation, S.N., I.I.H.N.; writing—review and editing, S.N. Both authors have read and agreed to the published version of the manuscript.
Funding
This research received no external funding.
Institutional Review Board Statement
Not applicable.
Informed Consent Statement
Not applicable.
Data Availability Statement
Not applicable.
Acknowledgments
We are very grateful to the reviewers for their valuable comments that helped improve the paper. We wish to express our gratitude to all members of our colleges, Jouf University and Al Quds Open University, for their support.
Conflicts of Interest
The authors declare no conflict of interest.
References
- Nashwan, S. An End-to-End Authentication Scheme for Healthcare IoT Systems Using WMSN. Comput. Mater. Contin. 2021, 68, 607–642. [Google Scholar] [CrossRef]
- Nashwan, S. AAA-WSN: Anonymous access authentication scheme for wireless sensor networks in big data environment. Egypt. Inform. 2021, 22, 15–26. [Google Scholar] [CrossRef]
- Morales, L.V.; Ruiz, D.D.; Rueda, S.J. Comprehensive security for body area networks: A survey. Int. J. Netw. Secur. 2019, 21, 342–354. [Google Scholar]
- Thaier, T.; Mohd, B.J.; Imran, M.; Almashaqbeh, G.; Vasilakos, A.V. Secure authentication for remote patient monitoring with wireless medical sensor networks. Sensors 2016, 16, 424. [Google Scholar]
- Hasan, M.K.; Shahjalal, M.; Chowdhury, M.Z.; Jang, Y.M. Real-time healthcare data transmission for remote patient monitoring in patch-based hybrid OCC/BLE networks. Sensors 2019, 19, 1208. [Google Scholar] [CrossRef] [PubMed] [Green Version]
- Al-Qerem, A.; Kharbat, F.; Nashwan, S.; Ashraf, S.; Blaou, K. General model for best feature extraction of EEG using discrete wavelet transform wavelet family and differential evolution. Int. J. Distrib. Sens. Netw. 2020, 16, 1550147720911009. [Google Scholar] [CrossRef]
- Hamarsheh, A.; Abdalaziz, Y.; Nashwan, S. Recent impediments in deploying IPv6. Adv. Sci. Technol. Eng. Syst. J. (ASTES) 2021, 6, 336–341. [Google Scholar] [CrossRef]
- Nykvist, C.; Larsson, M.; Sodhro, A.H.; Gurtov, A. A lightweight portable intrusion detection communication system for auditing applications. Int. J. Commun. Syst. 2020, 33, 4327. [Google Scholar] [CrossRef]
- Nashwan, S.; Alshammari, B. Formal analysis of MCAP protocol against replay attack. Br. J. Math. Comput. Sci. (BJMCS) 2017, 22, 1–14. [Google Scholar] [CrossRef] [Green Version]
- Almrezeq, N.; Almadhoor, L.; Alrasheed, T.; Abd El-Aziz, A.A.; Nashwan, S. Design a secure IoT architecture using smart wireless networks. Int. J. Commun. Netw. Inf. Secur. (IJCNIS) 2020, 12, 401–410. [Google Scholar]
- Bolton, T.; Dargahi, T.; Belguith, S.; Al-Rakhami, M.S.; Sodhro, A.H. On the security and privacy challenges of virtual assistants. Sensors 2021, 21, 2312. [Google Scholar] [CrossRef]
- Kumar, P.; Lee, S.; Lee, J. E-SAP: Efficient-strong authentication protocol for healthcare applications using wireless medical sensor networks. Sensors 2012, 12, 1625–1647. [Google Scholar] [CrossRef] [Green Version]
- He, D.; Kumar, K.; Chen, J.; Lee, C.; Chilamkurti, N. Robust anonymous authentication protocol for healthcare applications using wireless medical sensor networks. Multimed. Syst. 2015, 21, 49–60. [Google Scholar] [CrossRef]
- Li, X.; Niu, J.; Kumari, S.; Liao, J.; Liang, W. A new authentication protocol for healthcare applications using wireless medical sensor networks with user anonymity. Secur. Comm. Netw. 2016, 9, 2643–2655. [Google Scholar] [CrossRef]
- Wu, F.; Xu, L.; Kumari, S.; Li, X. An improved and anonymous two-factor authentication protocol for health-care applications with wireless medical sensor networks. Multimed. Syst. 2017, 23, 195–205. [Google Scholar] [CrossRef]
- Mir, O.; Munilla, J.; Kumari, S. Efficient anonymous authentication with key agreement protocol for wireless medical sensor networks. Peer-to-Peer Netw. Appl. 2017, 10, 79–91. [Google Scholar] [CrossRef]
- Nashwan, S. SAK-AKA: A secure anonymity key of authentication and key agreement protocol for LTE network. Int. Arab J. Inf. Technol. (IAJIT) 2017, 14, 790–801. [Google Scholar]
- Nashwan, S. Secure authentication protocol for NFC mobile payment systems. Int. J. Comput. Sci. Netw. Secur. (IJCSNS) 2017, 17, 256–263. [Google Scholar]
- Nashwan, S. Synchronous authentication key management scheme for Inter-eNB handover over LTE networks. Int. J. Adv. Comput. Sci. Appl. (IJACSA) 2017, 8, 100–107. [Google Scholar] [CrossRef] [Green Version]
- Al-Fayoumi, M.; Nashwan, S. Performance analysis of SAP-NFC protocol. Int. J. Commun. Netw. Inf. Secur. (IJCNIS) 2018, 10, 125–130. [Google Scholar]
- Nashwan, S. SE-H: Secure and efficient hash protocol for RFID system. Int. J. Commun. Netw. Inf. Secur. (IJCNIS) 2017, 9, 358–366. [Google Scholar]
- Chen, Y.; Ge, Y.; Wang, Y.; Zeng, Z. An improved three-factor user authentication and key agreement scheme for wireless medical sensor networks. IEEE Access 2019, 7, 85440–85451. [Google Scholar] [CrossRef]
- Amin, R.; Islam, S.H.; Biswas, G.P.; Khan, M.K.; Kumar, N. A robust and anonymous patient monitoring system using Wireless medical sensor networks. Future Gener. Comput. Syst. 2018, 80, 483–495. [Google Scholar] [CrossRef]
- Shuai, M.; Liu, B.; Yu, N.; Xiong, X. Lightweight and secure three-factor authentication scheme for remote patient monitoring using on-body wireless networks. Secur. Commun. Netw. 2019, 8145087. [Google Scholar] [CrossRef]
- Fotouhi, M.; Bayat, M.; Das, A.K.; Far, H.A.N.; Pournaghi, S.M.; Doostari, M.A. A lightweight and secure two-factor authentication scheme for wireless body area networks in health-care IoT. Comput. Netw. 2020, 177, 107333. [Google Scholar] [CrossRef]
- Lin, Y.; Chen, Y. Reducing authentication signaling traffic in third-generation mobile network. IEEE Trans. Wirel. Commun. 2003, 2, 493–501. [Google Scholar]
- Han, C.; Choi, H.; Baek, J.; Lee, H. Evaluation of authentication signaling loads in 3GPP LTE/SAE networks. In Proceedings of the 34th Annual IEEE Conference on Local Computer Networks, Zurich, Switzerland, 20–23 October 2009; IEEE Computer Society: New York, NY, USA, 2009. [Google Scholar]
- Al-Saraireh, J. Reducing authentication signaling traffic for LTE mobile networks. Int. J. Appl. Eng. Res. 2017, 12, 9306–9314. [Google Scholar]
- Nashwan, S.; Nashwan, I.I.H. Reducing the overhead messages cost of the SAK-AKA authentication scheme for 4G/5G mobile networks. IEEE Access 2021. [Google Scholar] [CrossRef]
- Broun, M. Probability and Statistics for Computer Scientists, 2nd ed.; Taylor and Francis Group: New York, NY, USA, 2014; pp. 64–67. [Google Scholar]
- Allen, M.B.; Isaacson, E.L. Numerical Analysis for Applied Science, 2nd ed.; WILEY: New York, NJ, USA, 2019; pp. 192–203. [Google Scholar]
Figure 1.
Healthcare IoT system architecture of E2EA.

Figure 2.
Long-term authentication phase (LAP).

Figure 3.
Short-term authentication phase (SAP).

Figure 4.
WMSN authentication phase (WAP).

Figure 5.
The E2EA scheme residence timeline diagram: the dashed blue arrows represent the request and response authentication messages of the LAP; the dashed red arrows represent the request and response authentication messages of the SAP; the dashed green arrows represent the request and response authentication messages of the LAP; the dashed black arrows represent the generation process of the PSij key; and the solid black arrows represent the derivate process of subsequent PSij and SKk keys.

Figure 6.
Effect of SAPs on the expected LAPs when the residence time is distributed as in (a–c). (a) Exponentially distributed residence time with mean . (b) Hypo exponential distributed residence time with mean . (c) Gamma distributed residence time, when .
Figure 6.
Effect of SAPs on the expected LAPs when the residence time is distributed as in (a–c). (a) Exponentially distributed residence time with mean . (b) Hypo exponential distributed residence time with mean . (c) Gamma distributed residence time, when .

Figure 7.
With different residence/request time distributions as in (a–e). (a) Exponentially distributed residence time, mean , when . (b) Hypo-exponential distributed residence time, when . (c) Hypo-exponential distributed residence time, when . (d) Gamma-distributed residence time is when , and . (e) Gamma-distributed residence time, when , and . (f) Gamma-distributed residence time, when , and .


Figure 8.
The cost function when , with different residence time distributions as in (a–c). (a) The residence time is exponential distributed. (b) The residence time is hypo exponential distributed. (c) The residence time is gamma distributed.
Figure 8.
The cost function when , with different residence time distributions as in (a–c). (a) The residence time is exponential distributed. (b) The residence time is hypo exponential distributed. (c) The residence time is gamma distributed.

Figure 9.
The C(m) values when the residence time is exponentially distributed with mean μ−1. (a) The C(m) values when . (b) The C(m) values when . (c) The C(m) values when .
Figure 9.
The C(m) values when the residence time is exponentially distributed with mean μ−1. (a) The C(m) values when . (b) The C(m) values when . (c) The C(m) values when .


Table 1.
The optimized X* of the cost function C(m) for different values of (α) and (β) with respect to a fixed ratio (γ) when λ = zµ, where z = 1, 2, 3, 4, 5, 10, and 20.
Table 1.
The optimized X* of the cost function C(m) for different values of (α) and (β) with respect to a fixed ratio (γ) when λ = zµ, where z = 1, 2, 3, 4, 5, 10, and 20.
| 1 | 1 | 2 | 3 | 3 | 3 | 4 | 5 | 7 |
| 2 | 2 | 2 | 3 | 3 | 3 | 4 | 6 | |
| 3 | 2 | 2 | 2 | 3 | 3 | 4 | 5 | |
| 4 | 2 | 2 | 2 | 2 | 3 | 4 | 5 | |
| 5 | 1 | 2 | 2 | 2 | 3 | 3 | 4 | |
| 5 | 1 | 2 | 3 | 4 | 4 | 5 | 6 | 9 |
| 3 | 2 | 3 | 3 | 4 | 4 | 6 | 8 | |
| 5 | 2 | 3 | 3 | 3 | 4 | 5 | 7 | |
| 10 | 1 | 2 | 3 | 4 | 4 | 5 | 7 | 9 |
| 2 | 2 | 3 | 4 | 4 | 5 | 6 | 9 | |
| 5 | 2 | 3 | 3 | 4 | 4 | 6 | 8 | |
| 8 | 2 | 3 | 3 | 4 | 4 | 5 | 8 | |
| 10 | 2 | 3 | 3 | 3 | 4 | 5 | 7 | |
| 20 | 1 | 3 | 3 | 4 | 4 | 5 | 7 | 10 |
| 2 | 2 | 3 | 4 | 4 | 5 | 7 | 9 | |
| 5 | 2 | 3 | 4 | 4 | 5 | 6 | 9 | |
| 10 | 2 | 3 | 3 | 4 | 4 | 6 | 8 | |
| 15 | 2 | 3 | 3 | 4 | 4 | 6 | 8 | |
| 20 | 2 | 3 | 3 | 3 | 4 | 5 | 7 | |
| 100 | 1 | 3 | 3 | 4 | 5 | 5 | 7 | 10 |
| 10 | 2 | 3 | 4 | 4 | 5 | 7 | 9 | |
| 15 | 2 | 3 | 4 | 4 | 5 | 7 | 9 | |
| 50 | 2 | 3 | 3 | 4 | 4 | 6 | 8 | |
| 75 | 2 | 3 | 3 | 4 | 4 | 6 | 8 | |
| 100 | 2 | 3 | 3 | 3 | 4 | 5 | 7 |
Publisher’s Note: MDPI stays neutral with regard to jurisdictional claims in published maps and institutional affiliations. |
© 2021 by the authors. Licensee MDPI, Basel, Switzerland. This article is an open access article distributed under the terms and conditions of the Creative Commons Attribution (CC BY) license (https://creativecommons.org/licenses/by/4.0/).
Share and Cite
MDPI and ACS Style
Nashwan, S.; Nashwan, I.I.H. An Analytic Model for Reducing Authentication Signaling Traffic in an End-to-End Authentication Scheme. Sensors 2021, 21, 4980. https://doi.org/10.3390/s21154980
AMA Style
Nashwan S, Nashwan IIH. An Analytic Model for Reducing Authentication Signaling Traffic in an End-to-End Authentication Scheme. Sensors. 2021; 21(15):4980. https://doi.org/10.3390/s21154980
Chicago/Turabian StyleNashwan, Shadi, and Imad I. H. Nashwan. 2021. "An Analytic Model for Reducing Authentication Signaling Traffic in an End-to-End Authentication Scheme" Sensors 21, no. 15: 4980. https://doi.org/10.3390/s21154980
Note that from the first issue of 2016, this journal uses article numbers instead of page numbers. See further details here.