
Wind Booster Optimization for On-Site Energy Generation Using Vertical-Axis Wind Turbines

 ,
,  ,
,  , , ,
, , ,  and
and 
Abstract
:1. Introduction
1.1. Aim of the Study
1.2. Savonius Wind Turbine
1.3. Wind Booster
1.3.1. Single Direction Flow Inlet
1.3.2. Omni-Direction Flow Inlet
2. Methodology
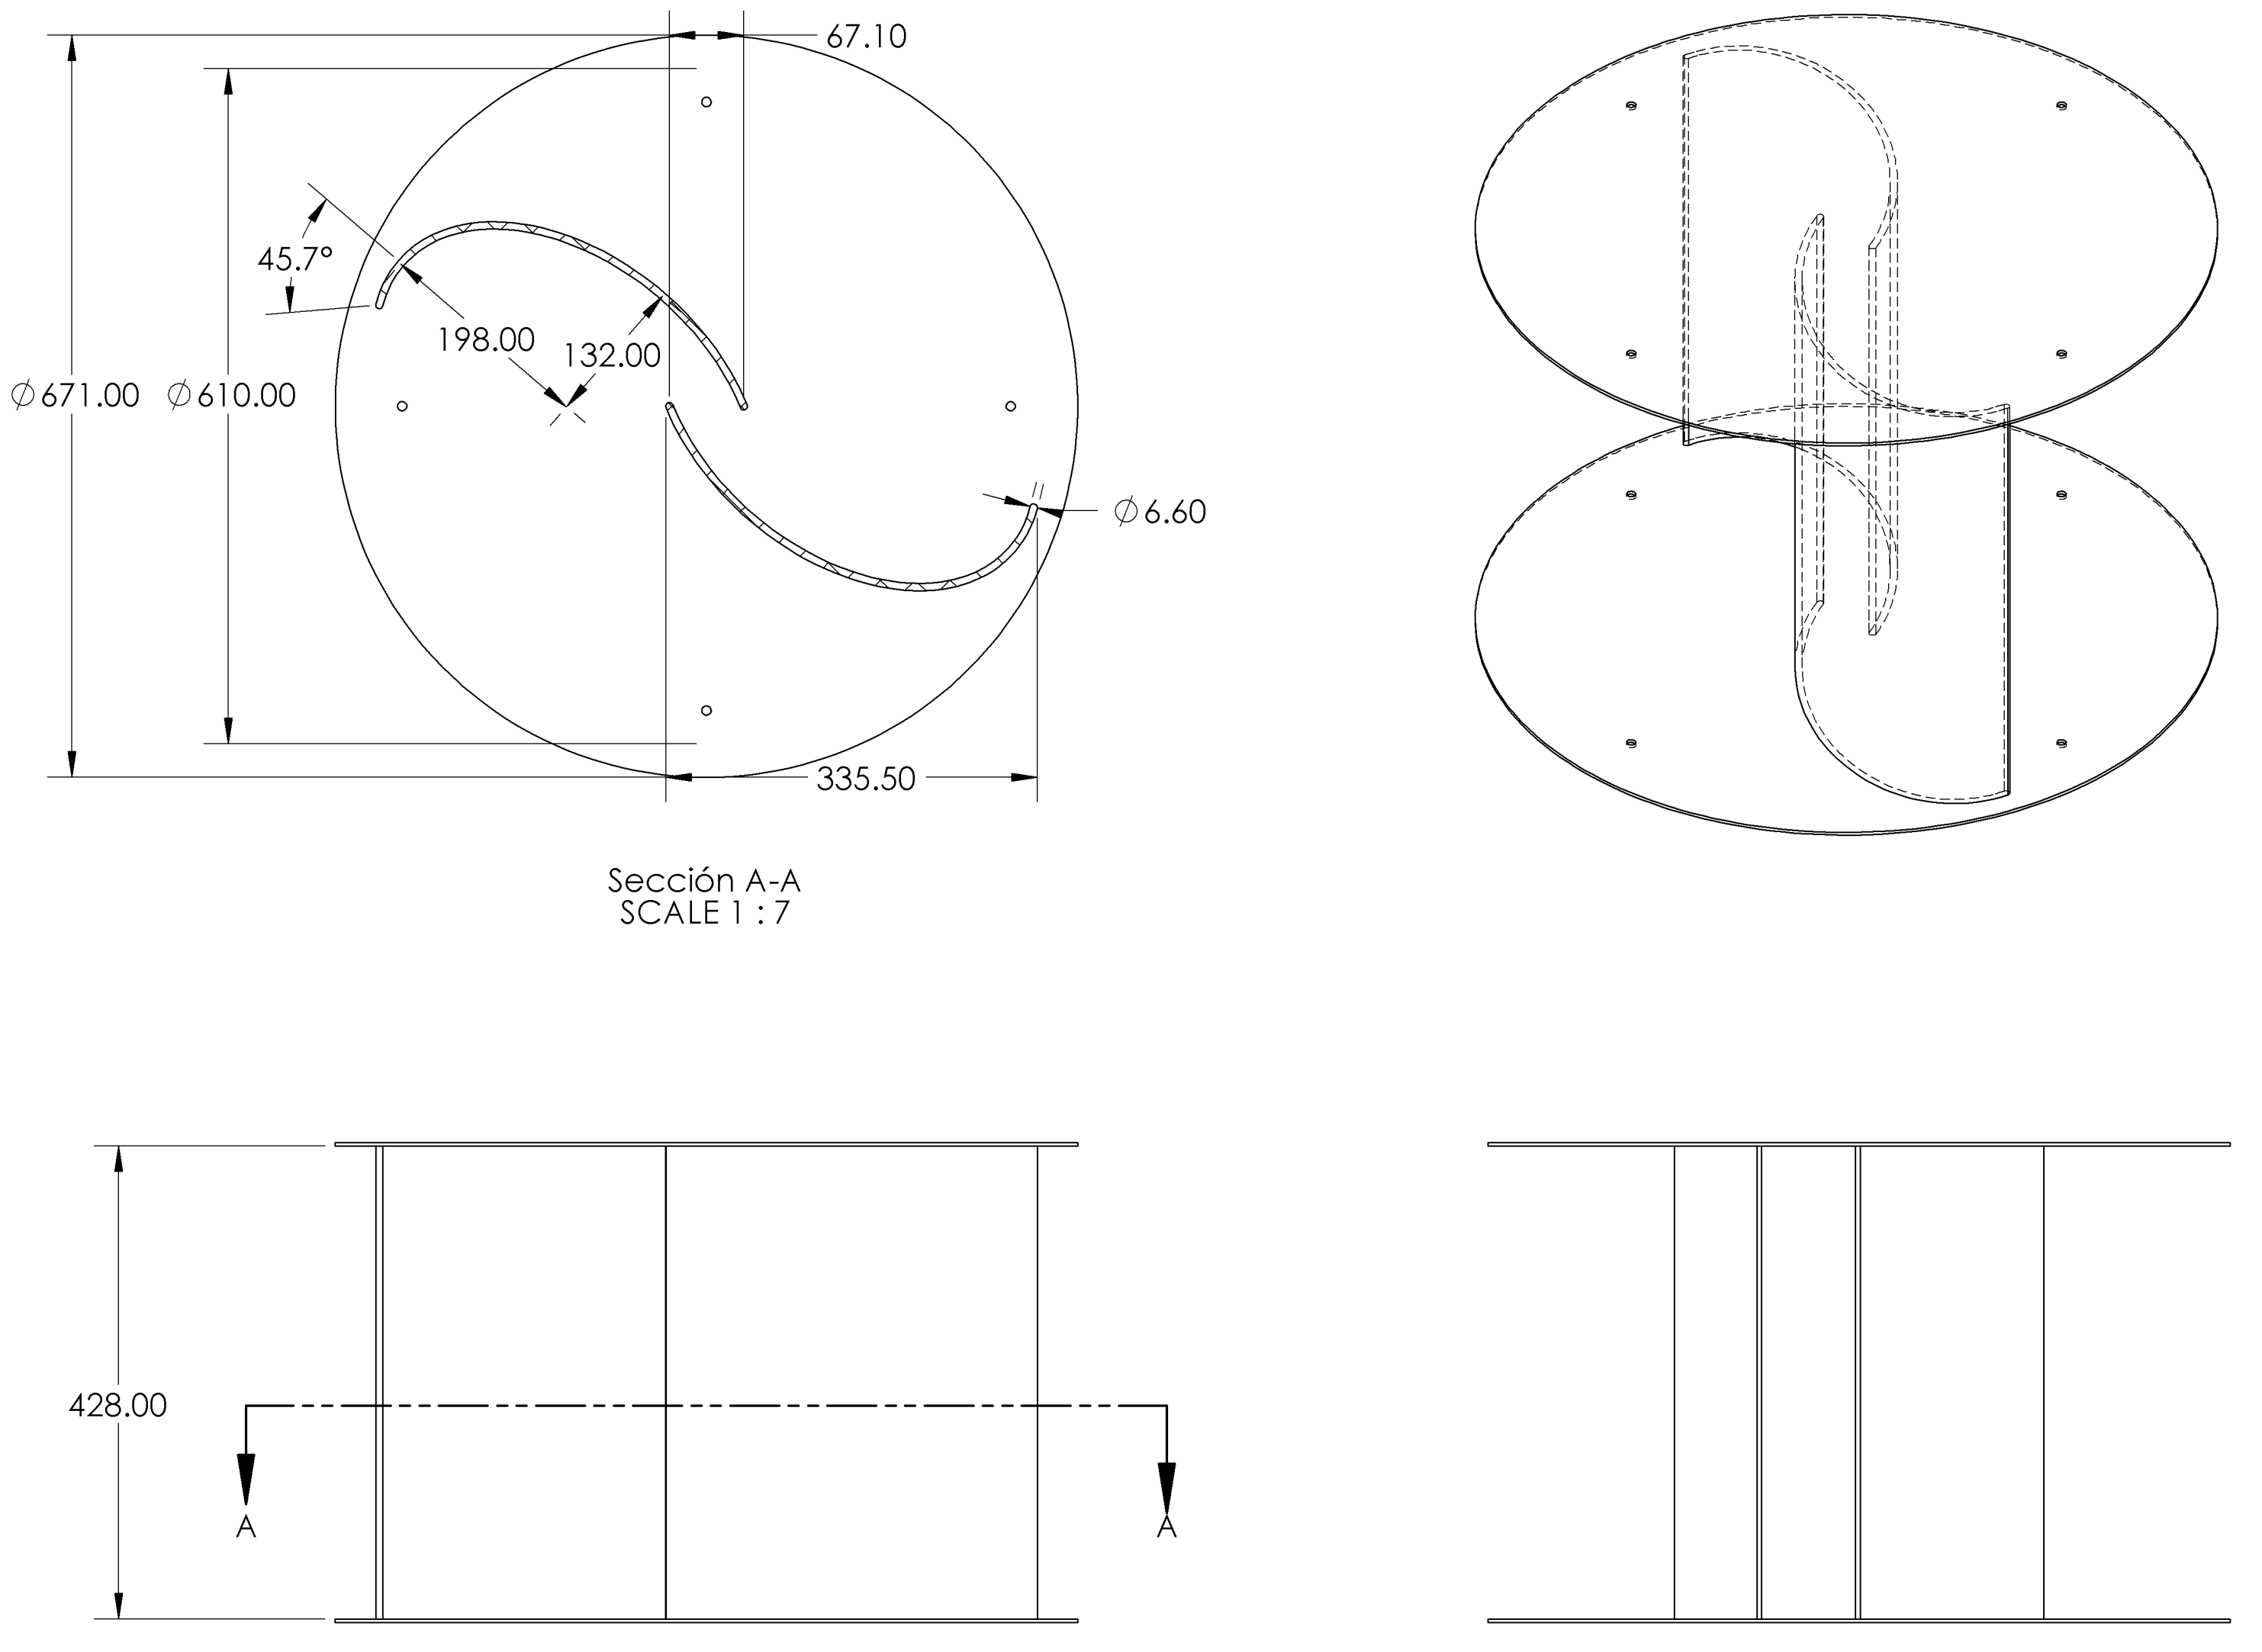
2.1. Select Savonius
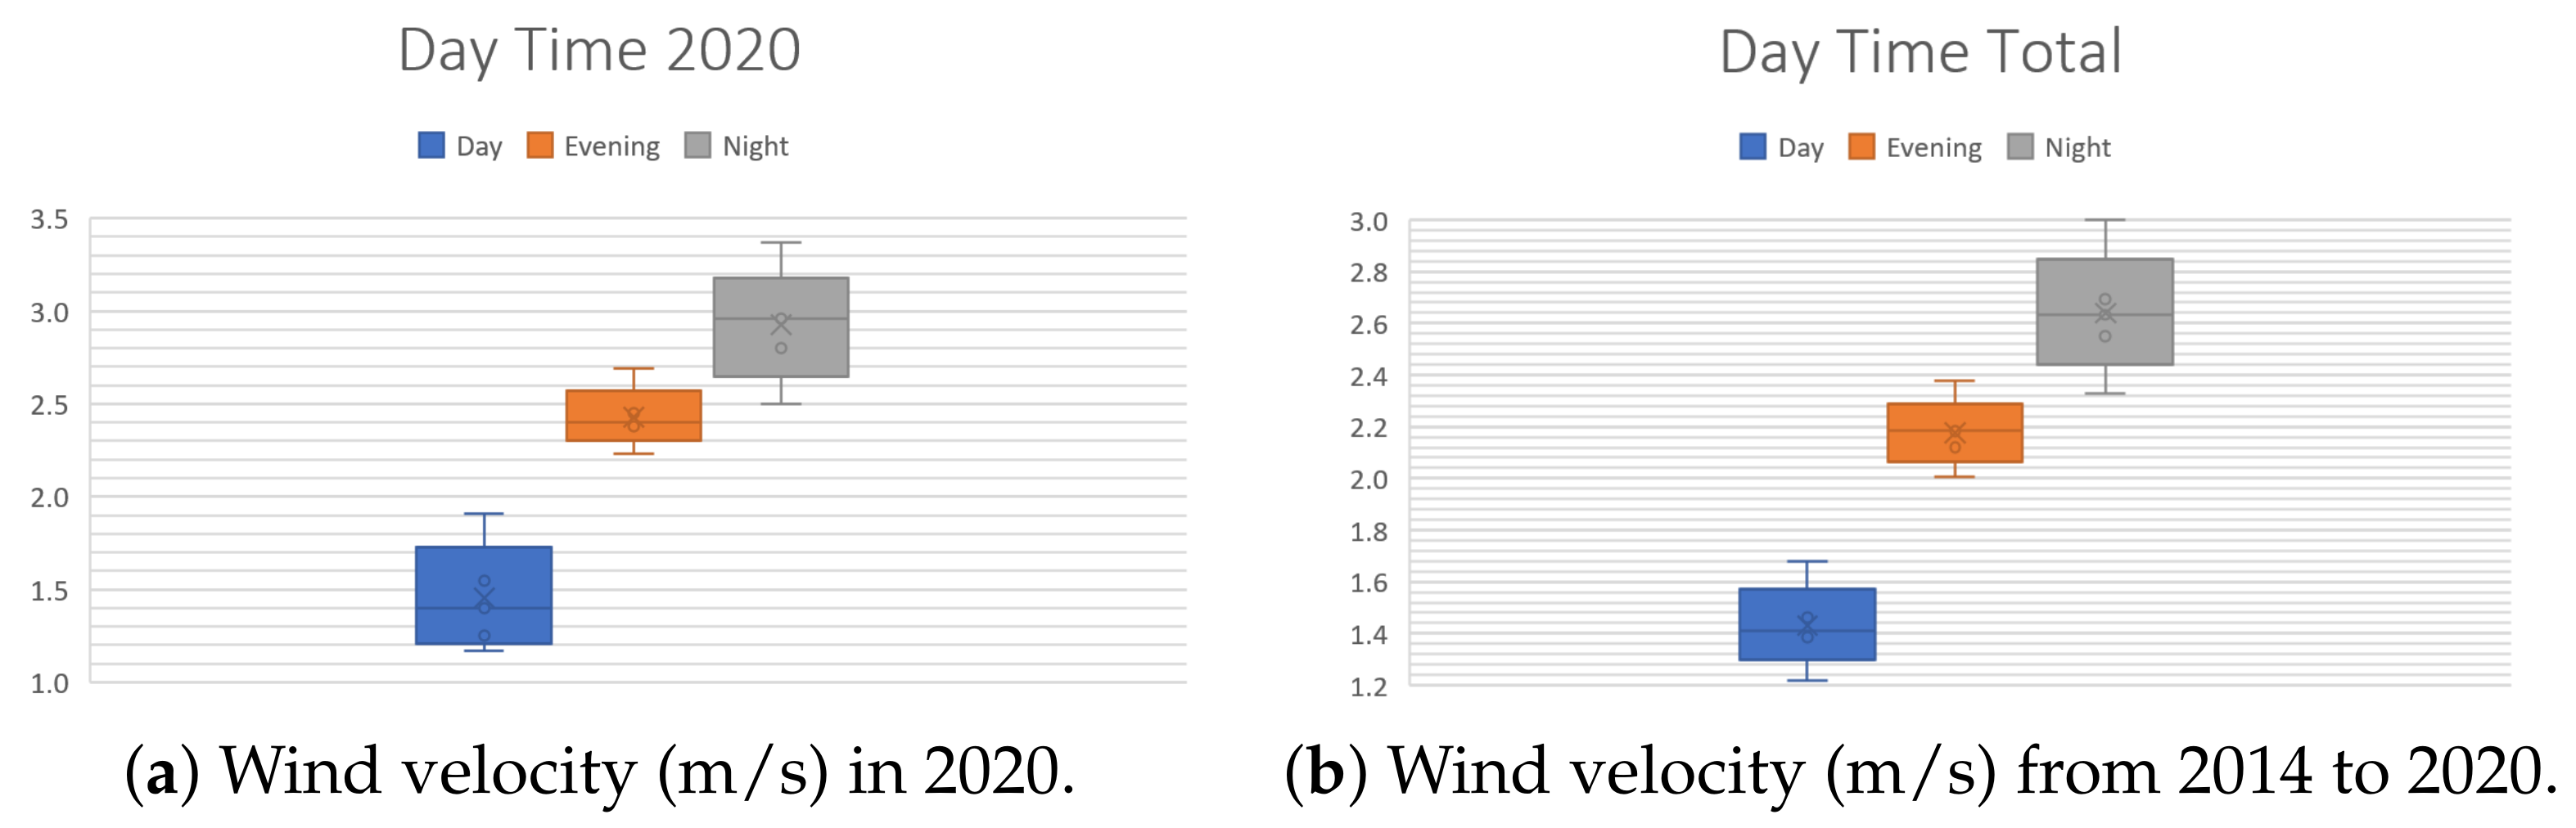
- Periods of the day. There are three periods per day: morning (1:00 a.m. to 9:00 a.m.), afternoon (9:00 a.m. to 4:00 p.m.) and night (4:00 p.m. to 12:00 p.m.). These are useful to analyze the changes in wind speed throughout the day. Figure 4 illustrates the behavior of the wind velocity (m/s) during the periods of the day. Note in Figure 4b that during nights, the wind has a maximum speed of 3 m/s.
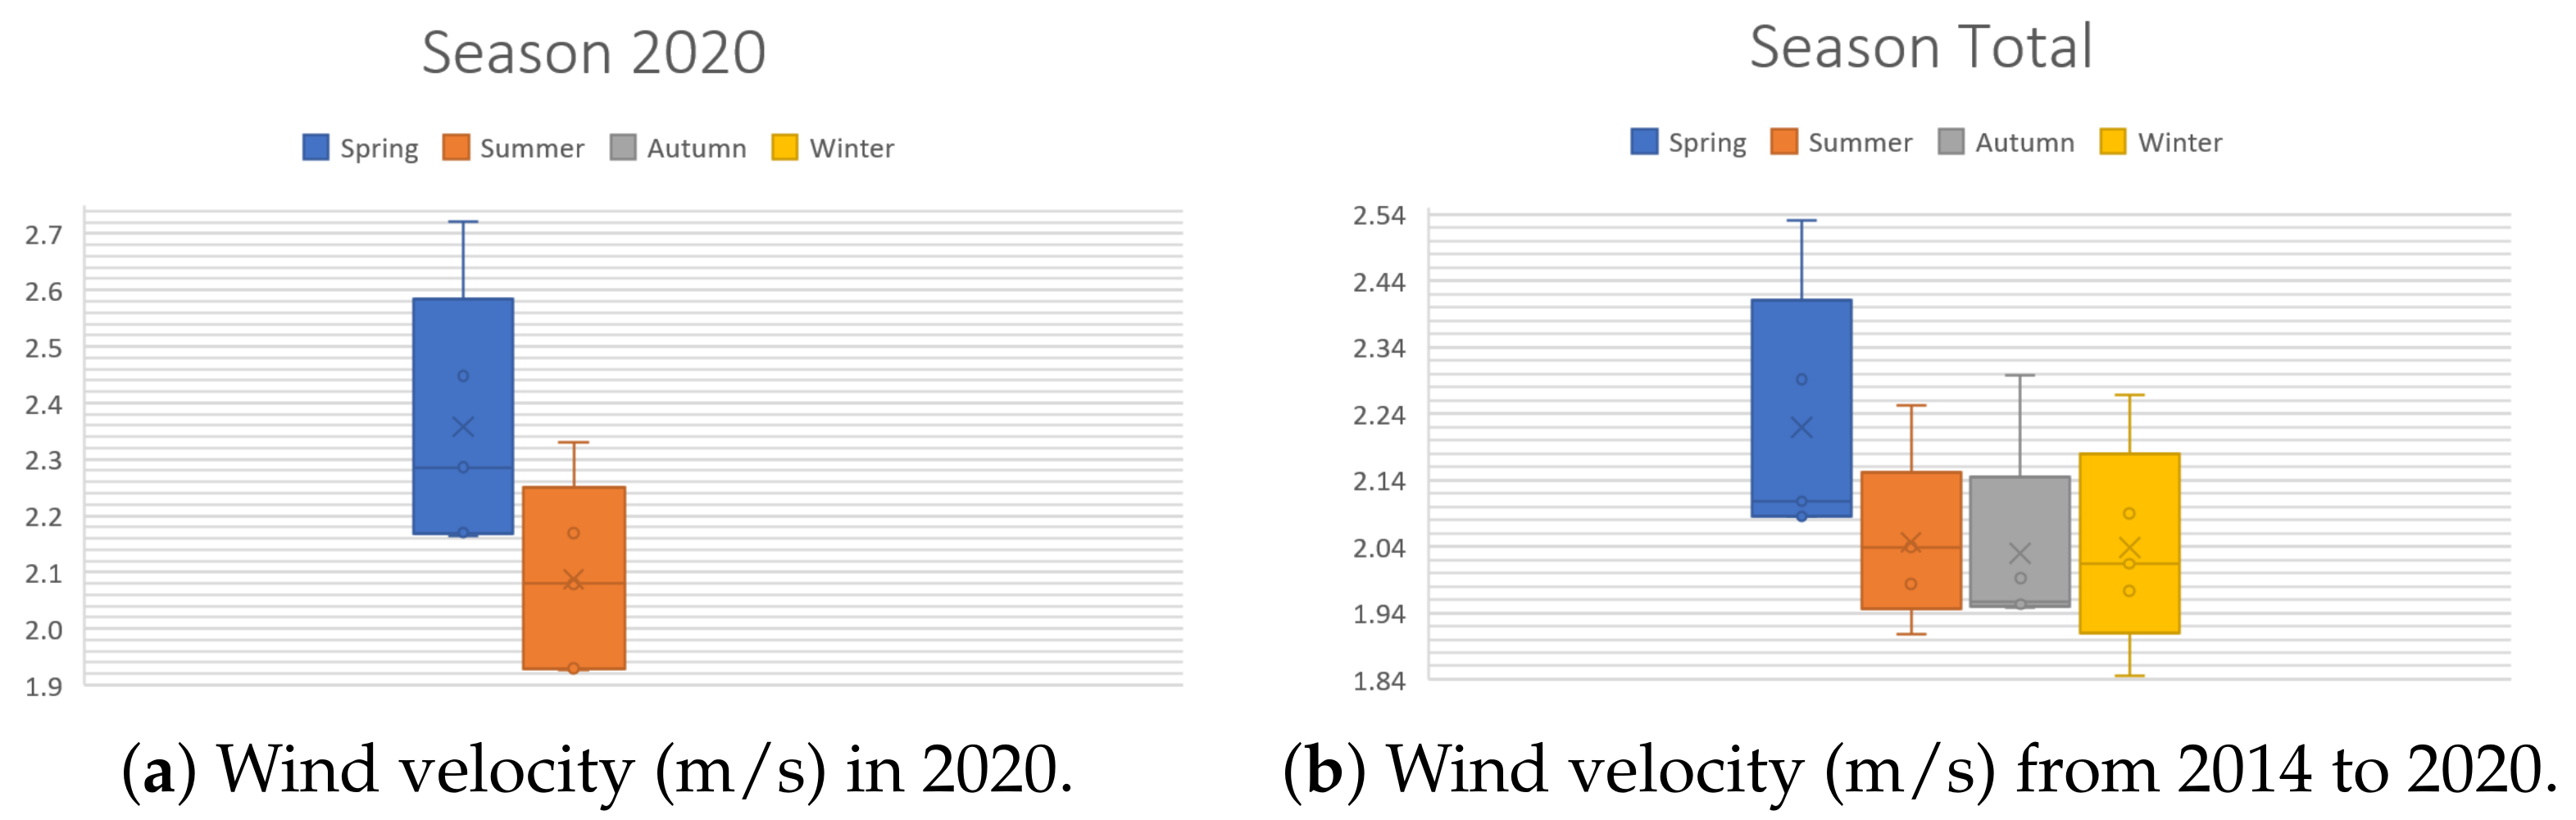
- Seasons of the year: spring (21 March to 20 June), summer (21 June to 20 September), autumn (21 September to 20 December), winter (21 December to 20 March). These are useful to observe how the climatic changes in each season affect the speed of this phenomenon. Figure 5 shows the behavior of the wind velocity (m/s) during different seasons. Figure 5a displays only that of spring and summer since it is currently mid-2020.
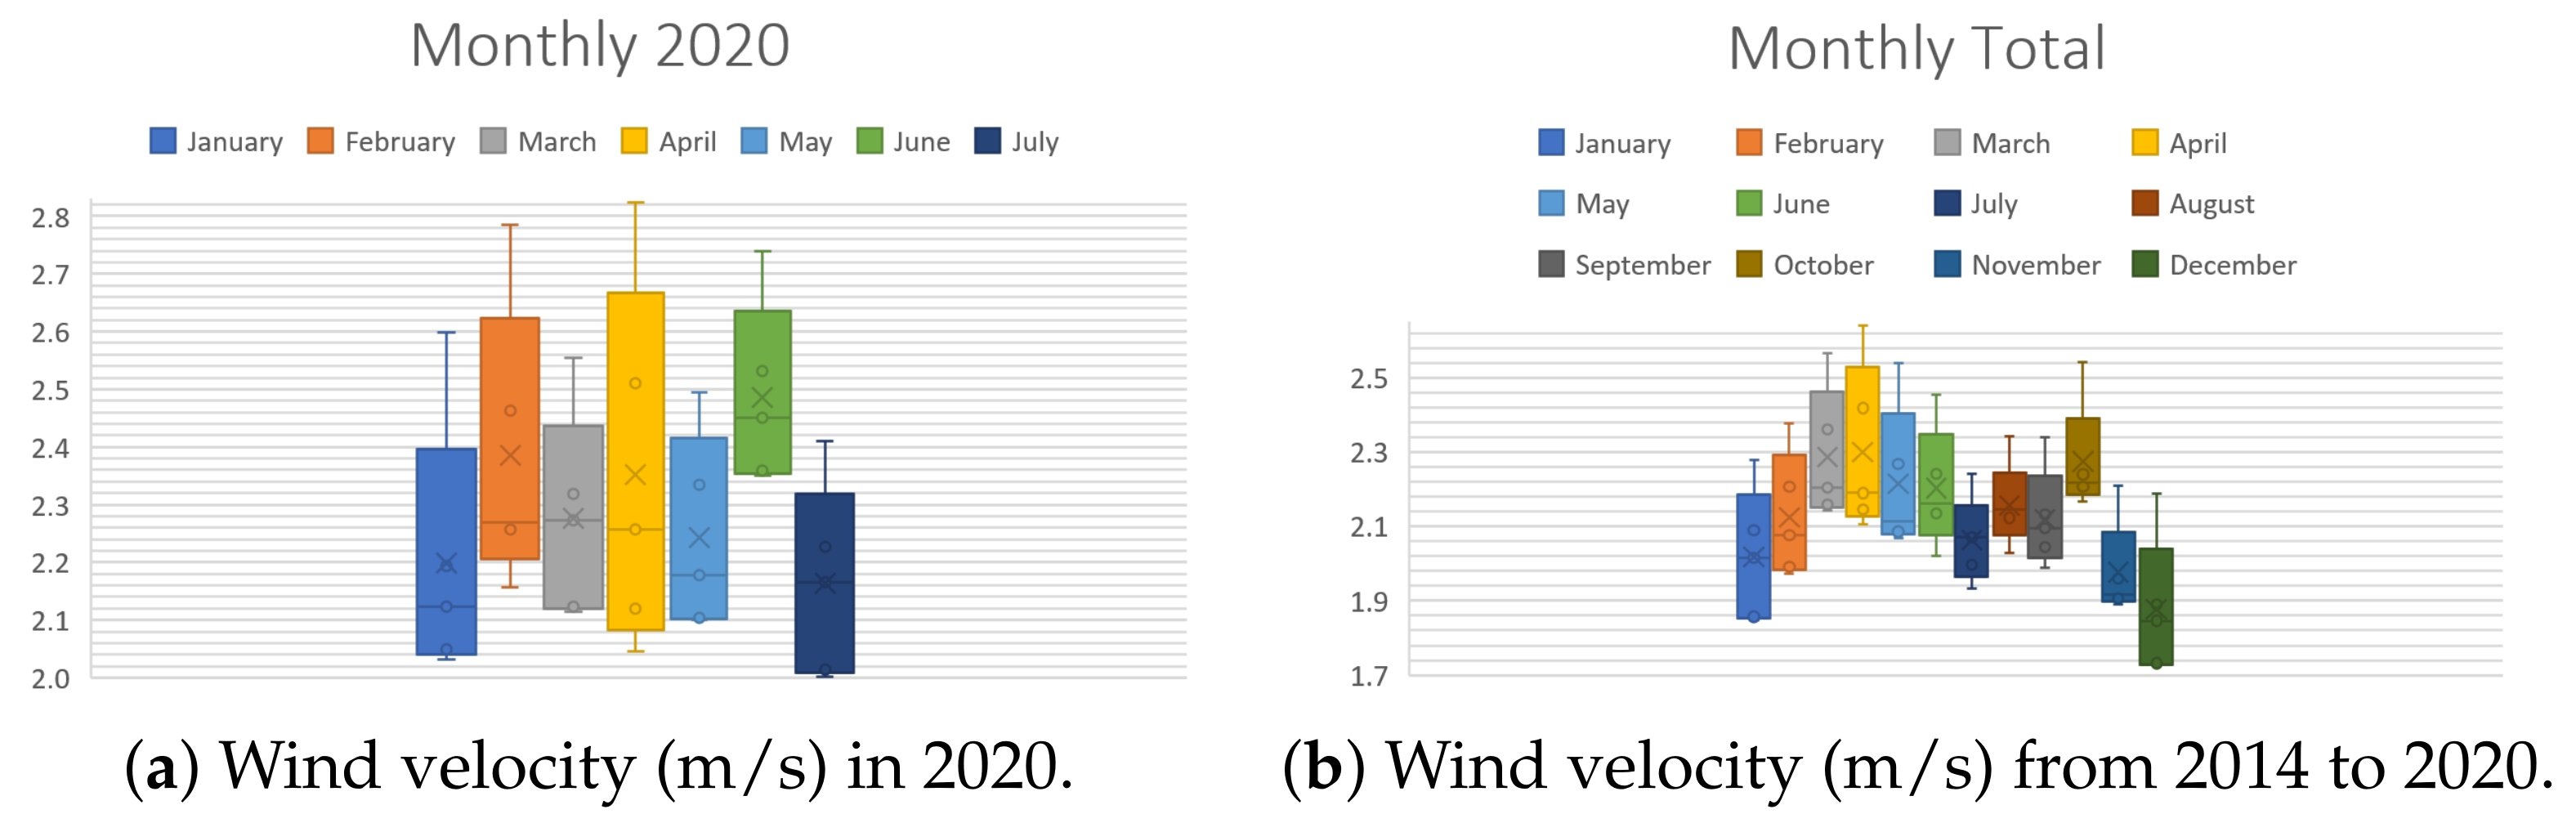
- Months of the year. To understand how wind speed varies during the 12 divisions of a year, Figure 6 exhibits that the months with lower wind velocity are January, February, July, August, September, November, and December. Contrastingly, March, April, May, June, and October have more significant velocities. Figure 6a shows only values from January to July since it is currently mid-2020.
2.2. Select an Initial Wind Boosters and Choose the Best One
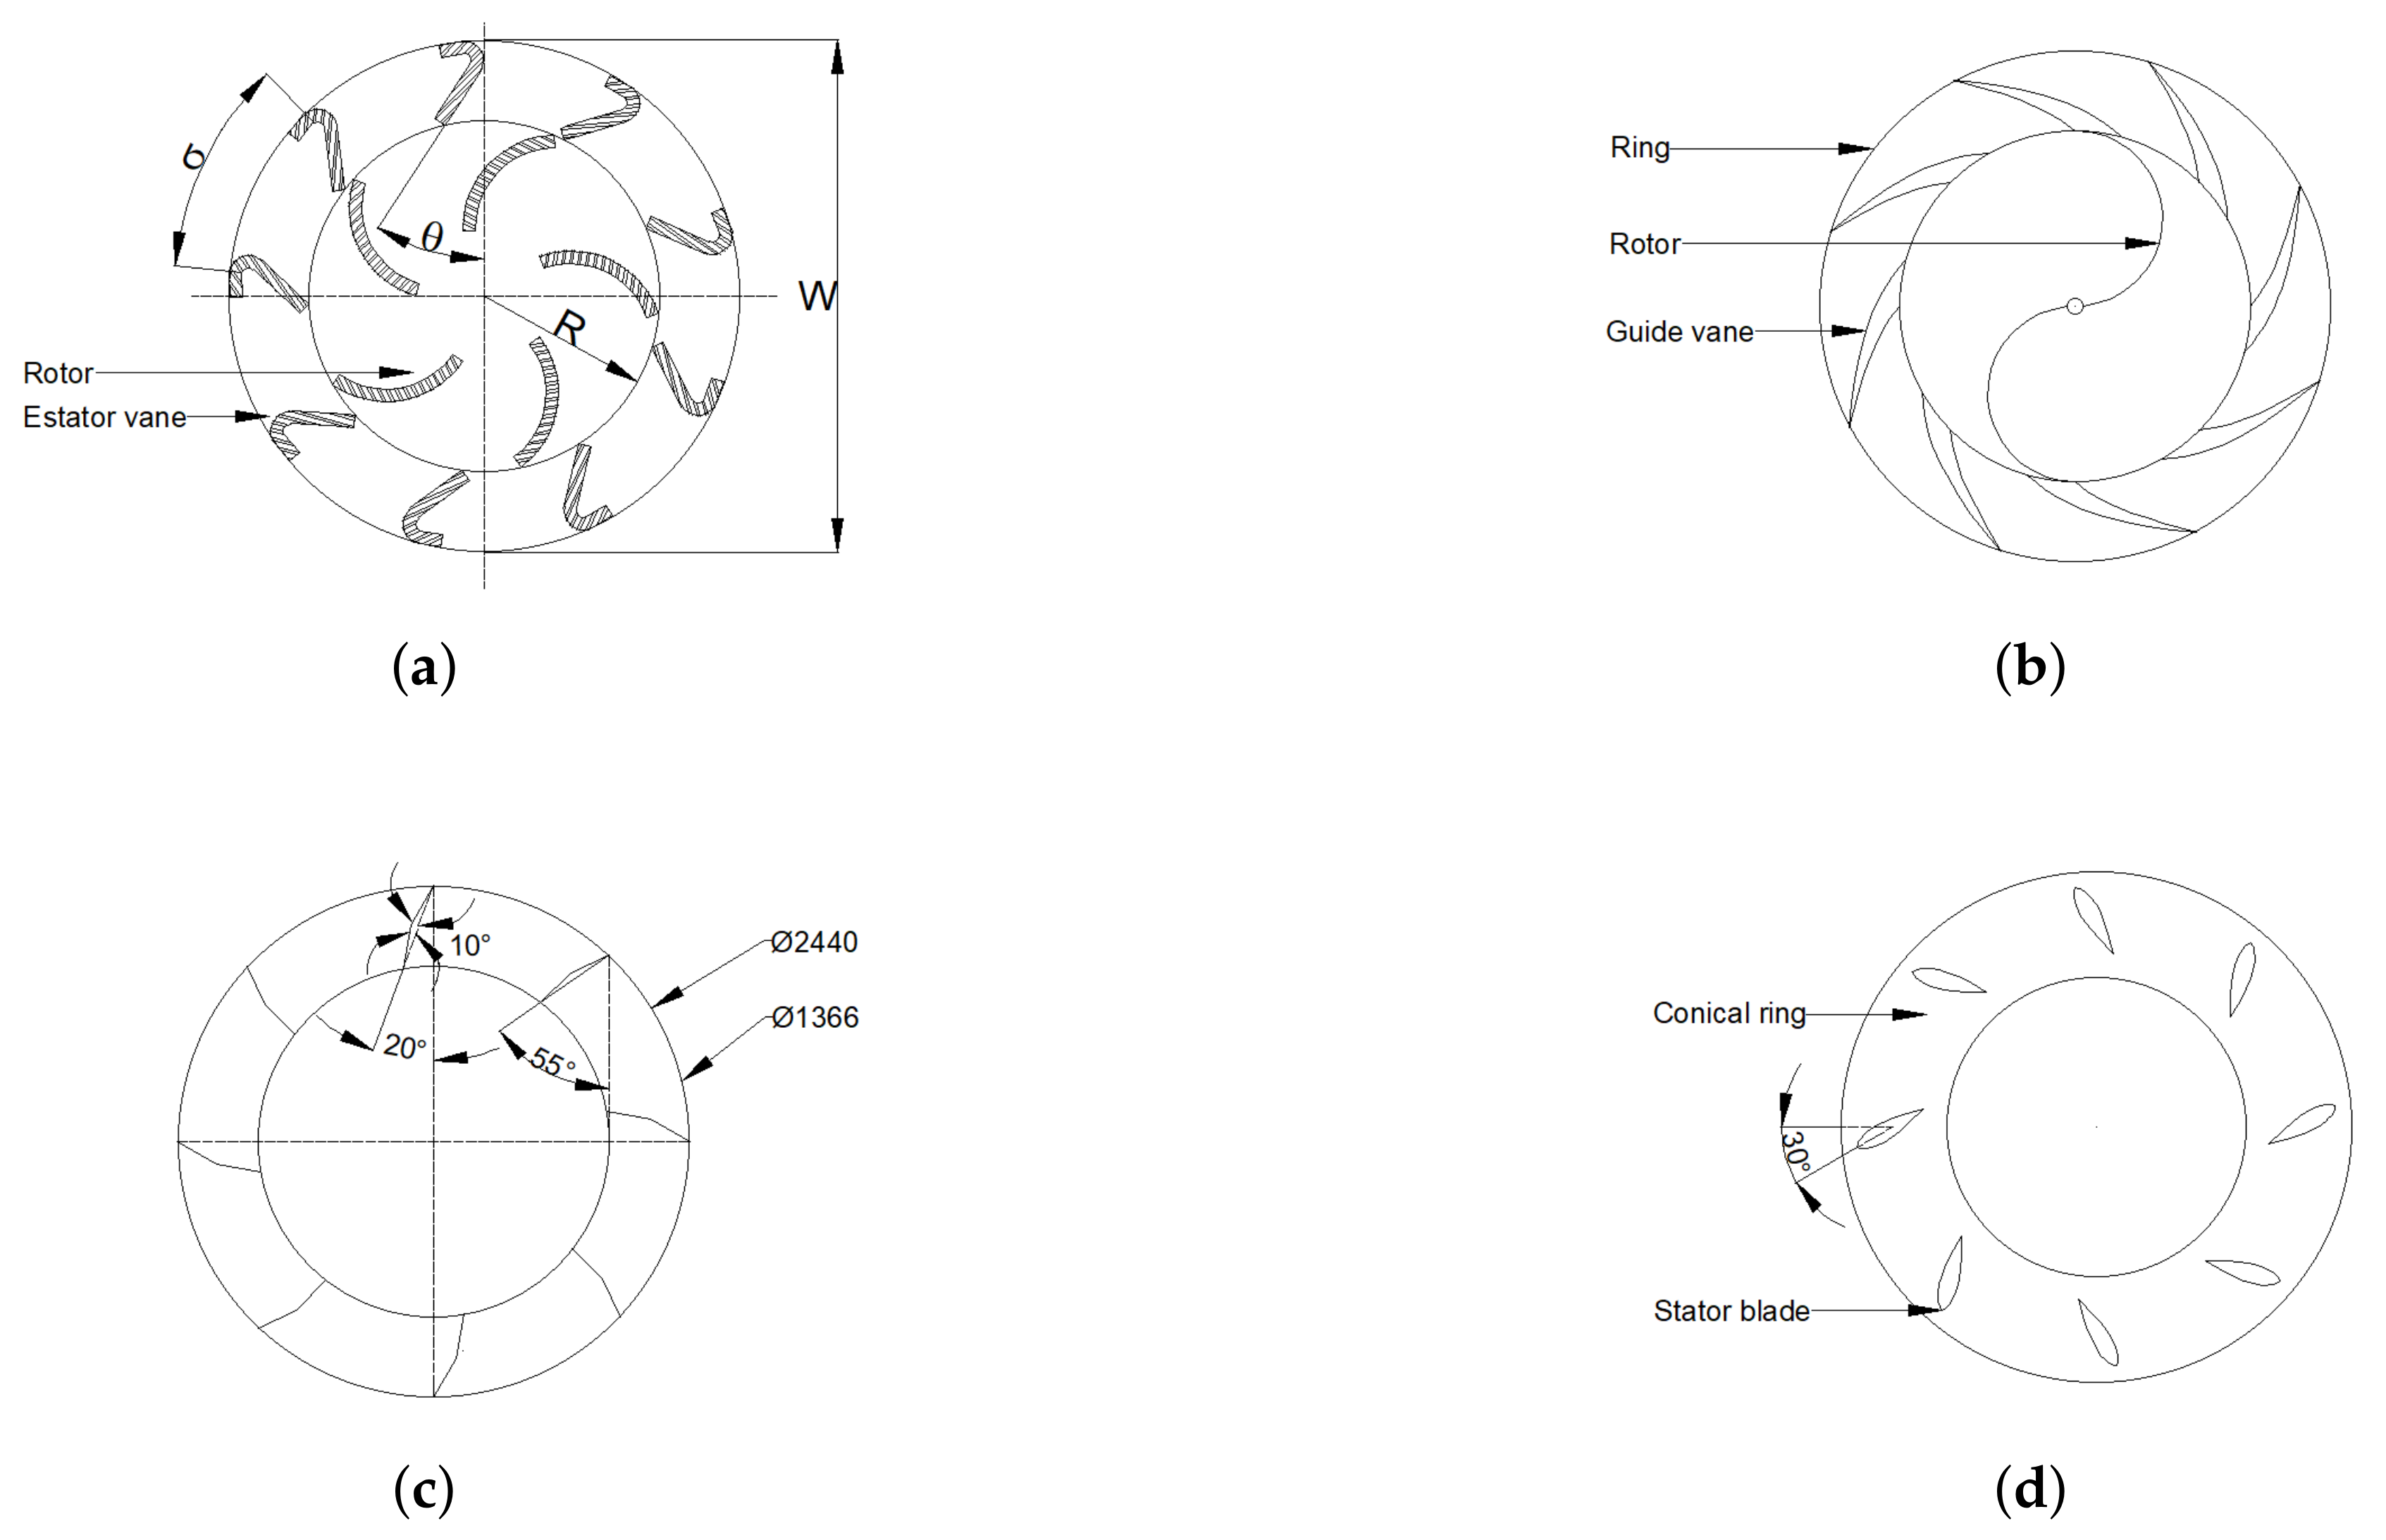
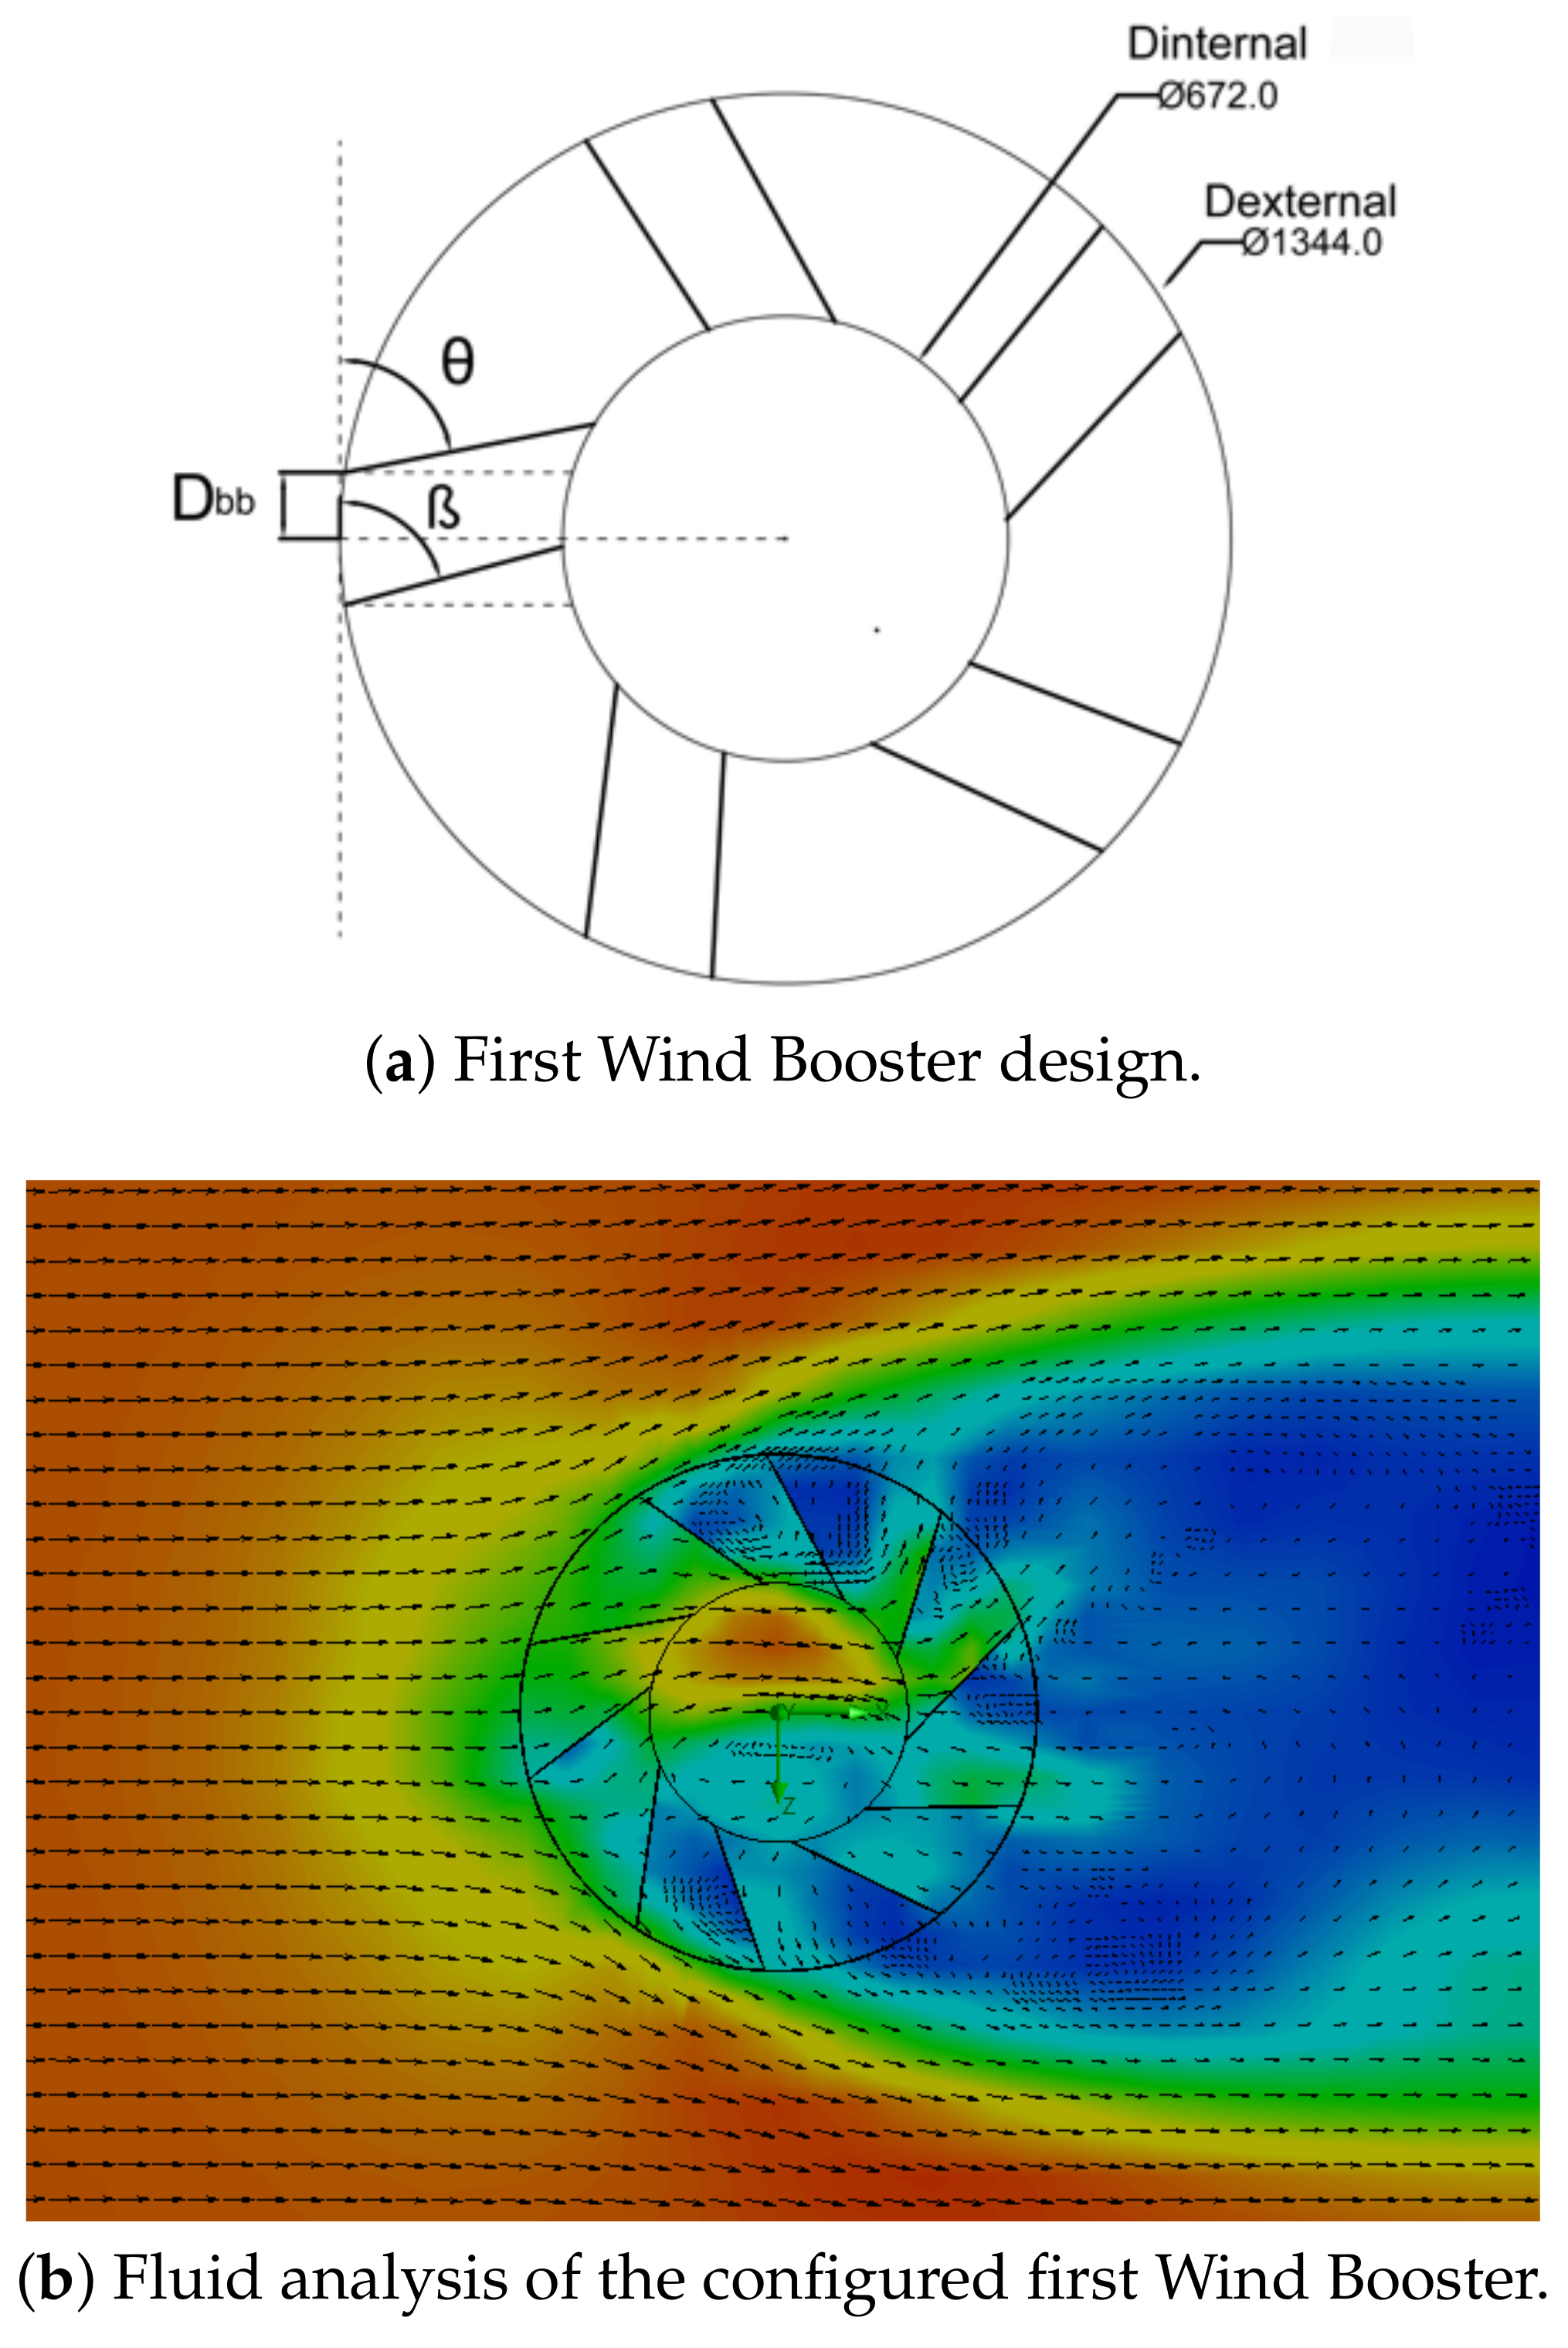
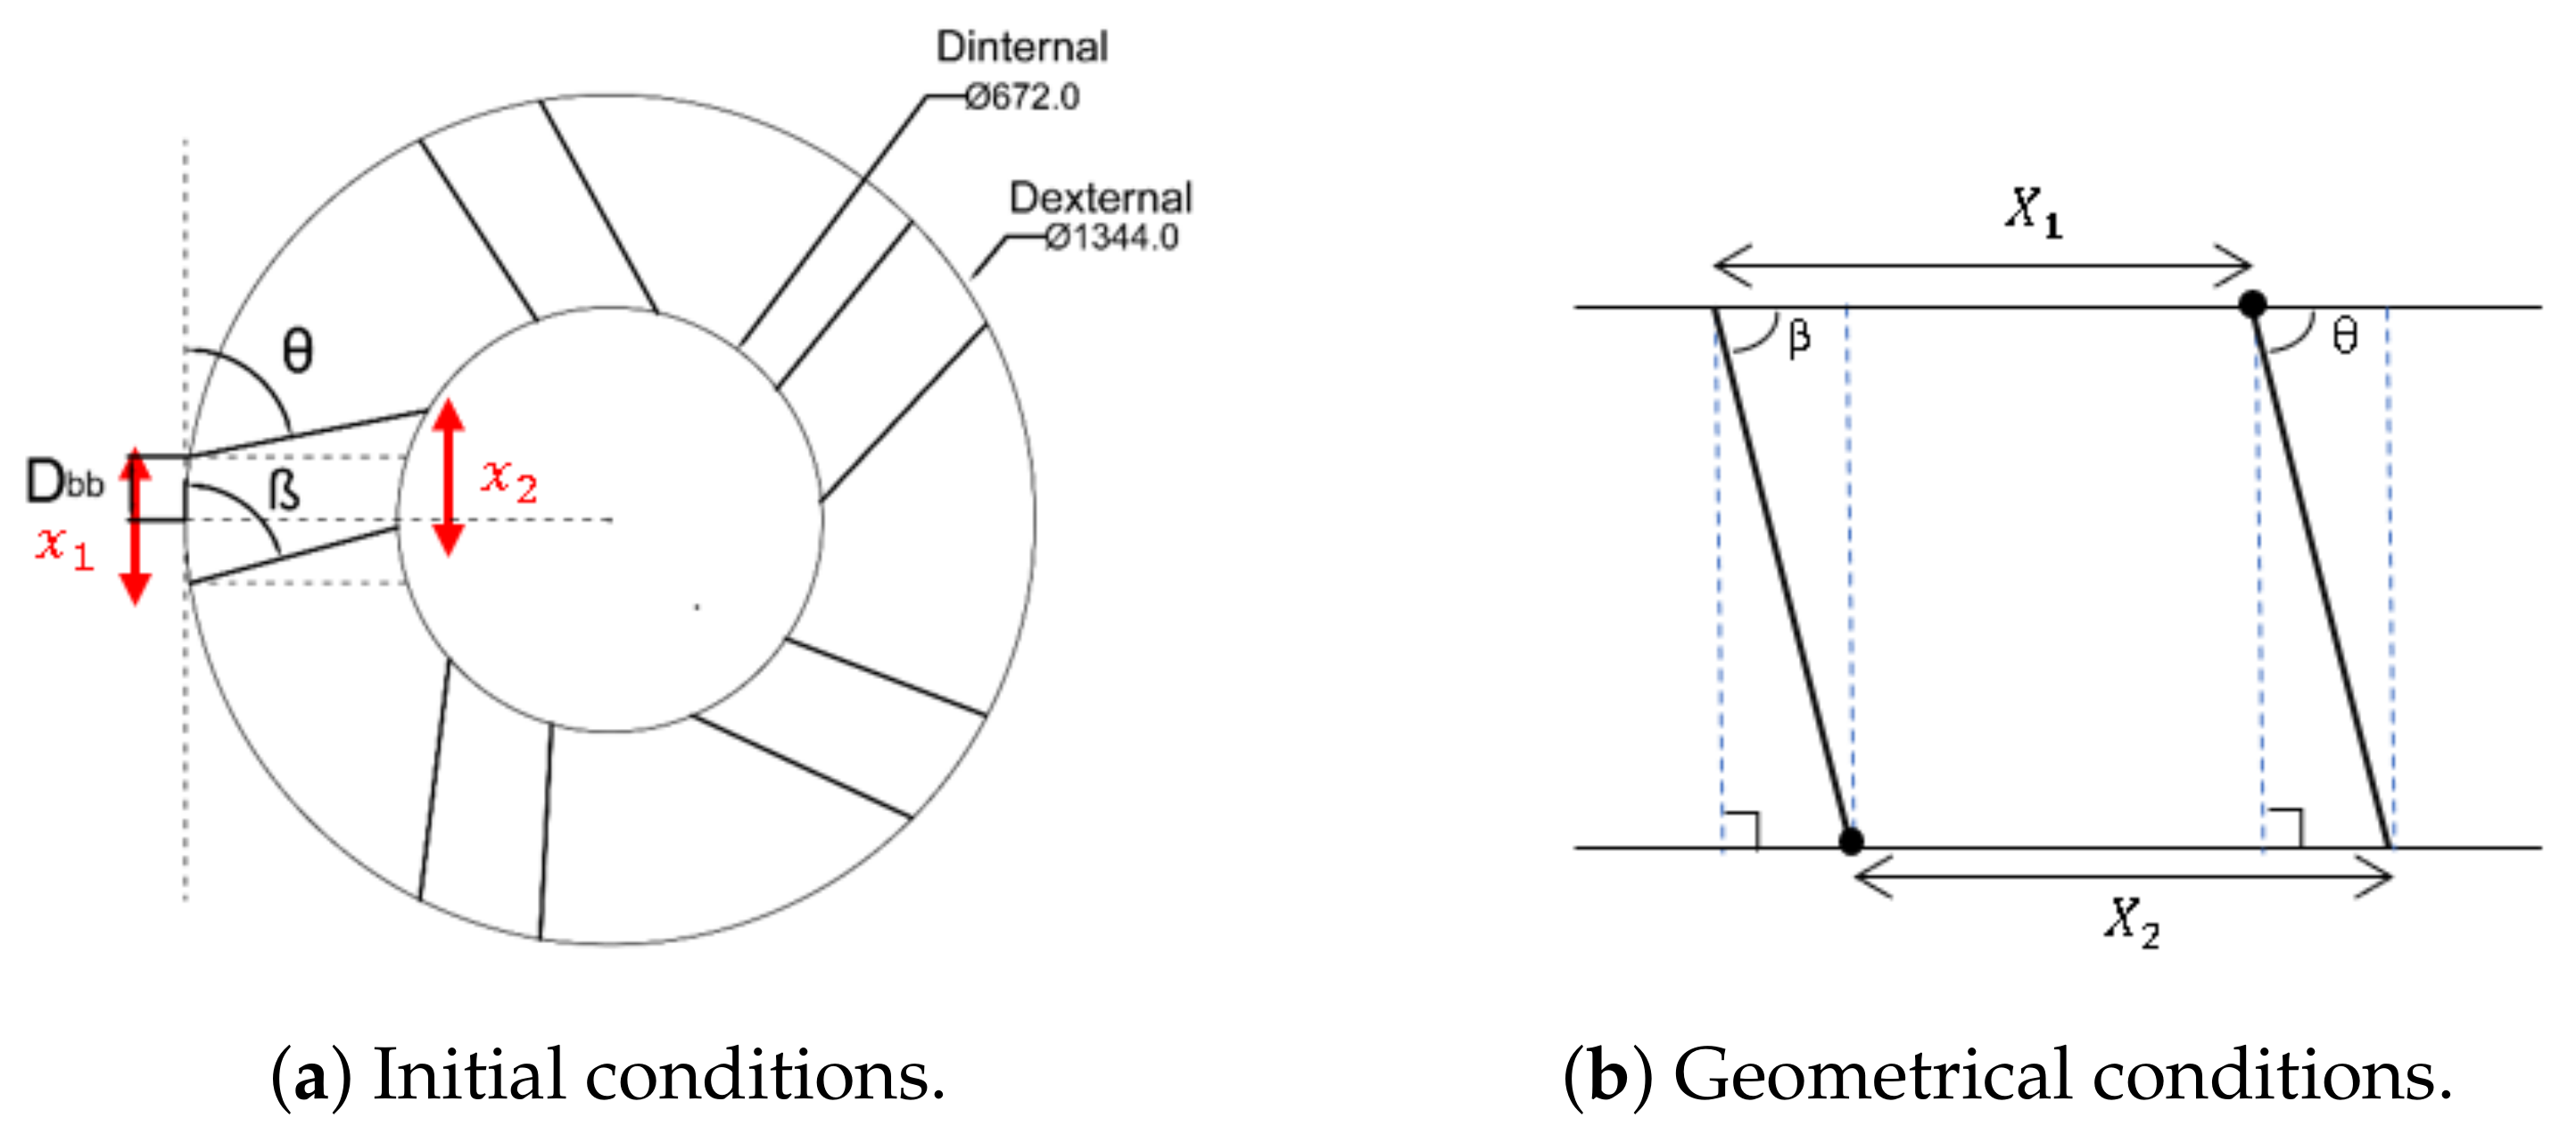
- Wind Booster with pairs of straight blades. The purpose of this design is to analyze the behavior of the ODGV with these kinds of bends. Figure 7 shows an initial configuration of this Wind Booster that has the following values: the number of pairs of blades () = 4, internal diameter () = 672 mm, external diameter () = 1344 mm, distance between the blades () = 100 mm, angle of the odd blade () = , angle of the pair blade () = . After some tests, for the fluid analysis, values that are changed are, , , and mm. As seen in the upper internal part in Figure 7b, the ODGV lets the maximum wind speed pass, visualized in orange.
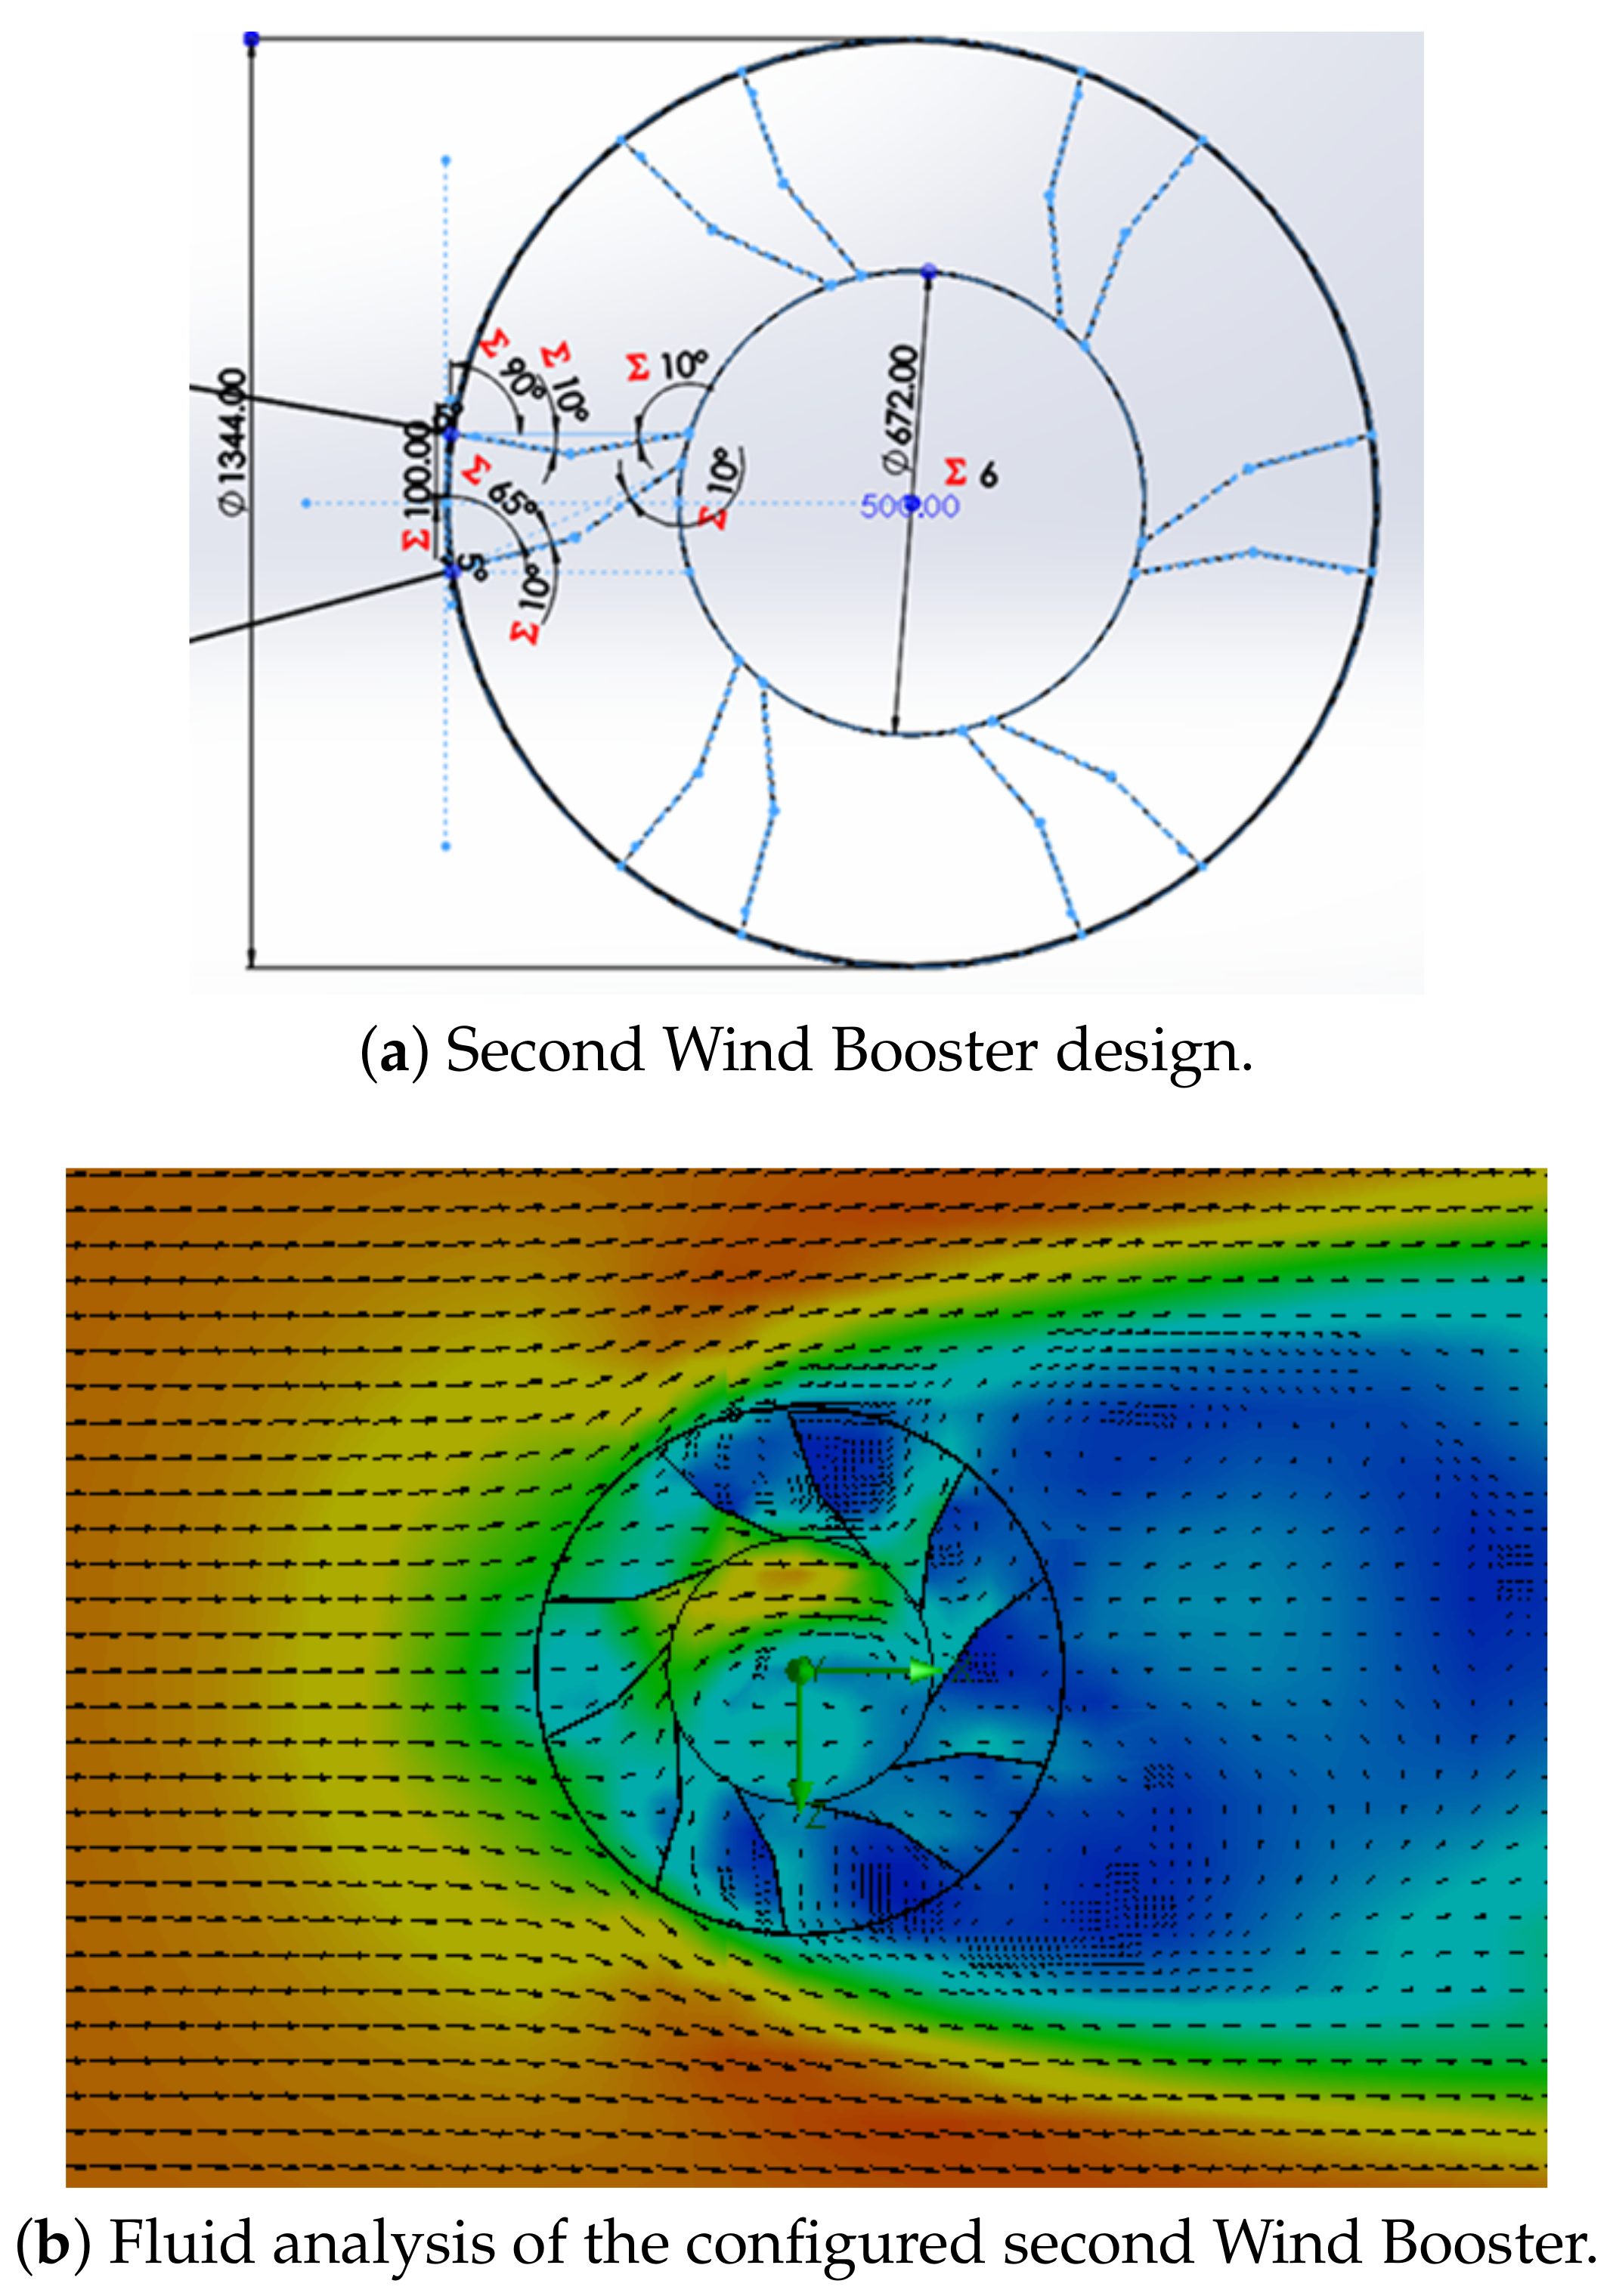
- Wind Booster with pairs of bent blades. This model incorporates an intermediate angle in the blades. The idea is to manage the wind flow with more aerodynamicity. Figure 8 shows the initial configuration of this Wind Booster that has the following values: bent angle () = , , mm, mm, mm, , . After some experiments, for the fluid analysis, the values that are changed are , mm, , , . Notice that in Figure 8b, the internal wind velocity is lower than in Figure 7b.
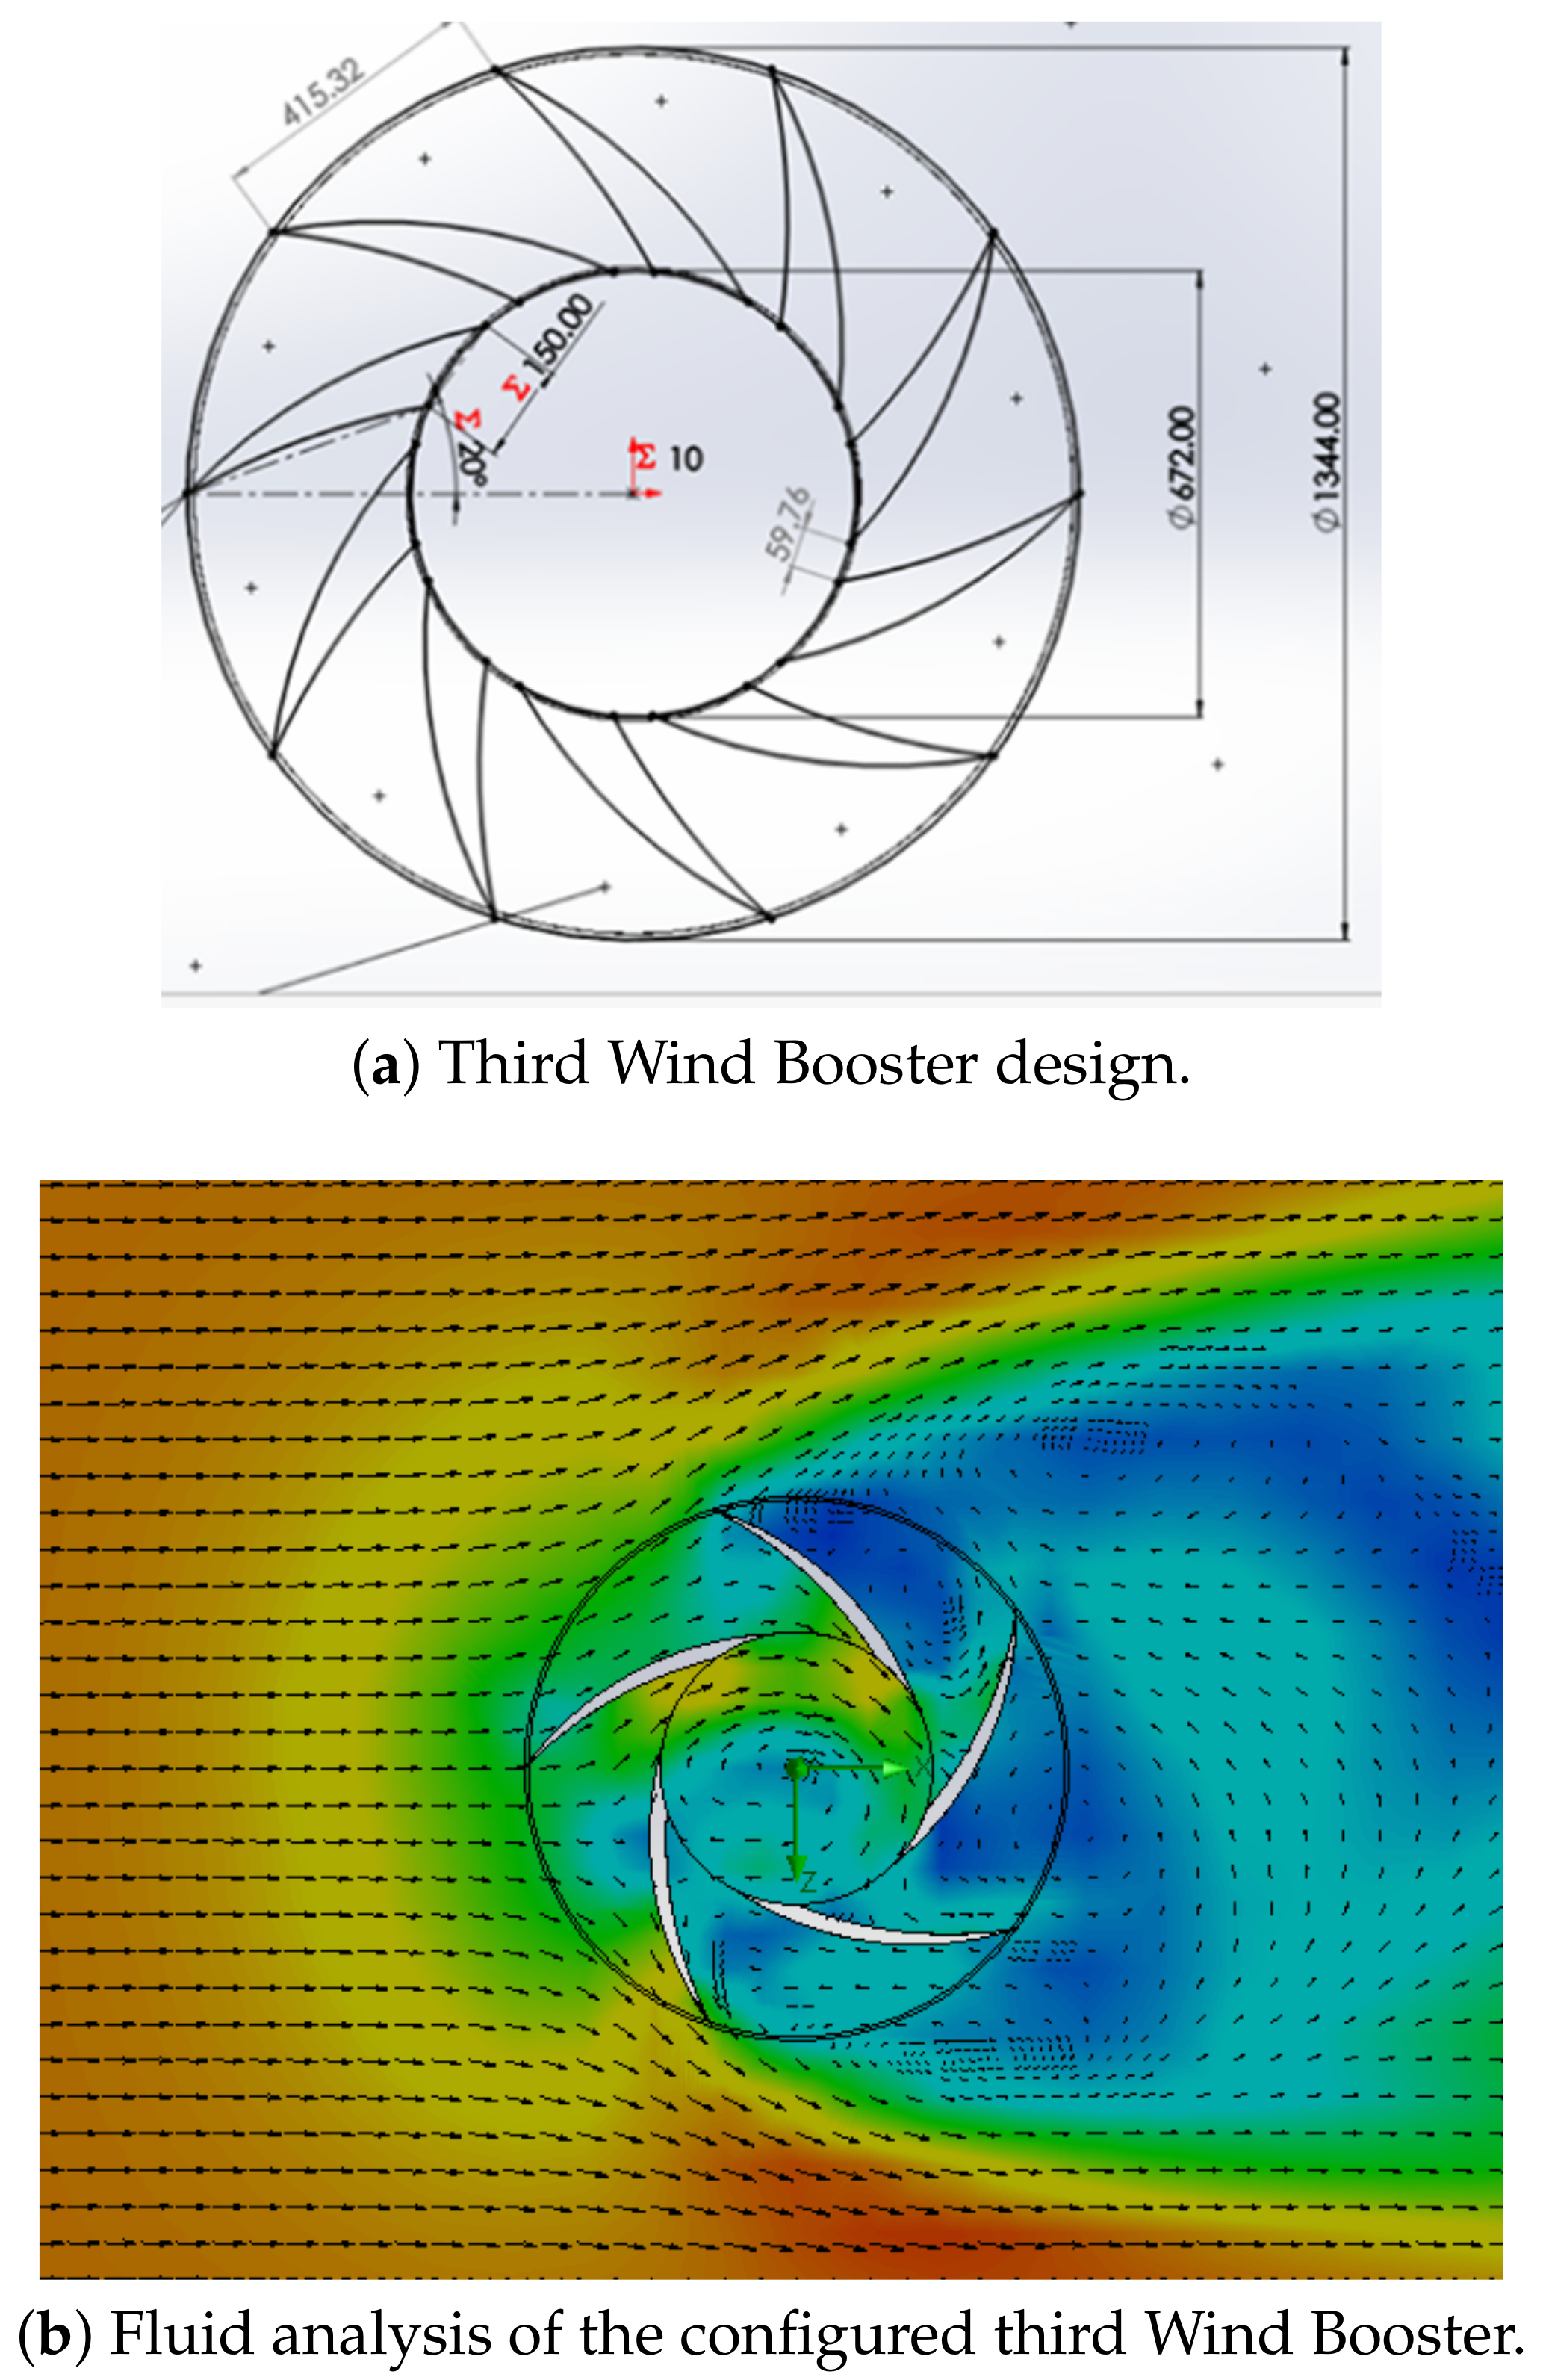
- Wind Booster with curved blades. The curved style uses the theory of fluid dynamics that indicates that a curved profile is more efficient than a straight one. The concept of pairs of blades is not necessary. Figure 9a shows the starting configuration of this Wind Booster that has the next values, number of blades () = 10, blade base width () = 150 mm, blade tilt angle () = . After several experiments, for the fluid analysis, the new values are , mm, . Figure 9b shows an increase in speed; however, the maximum wind speed is not found inside the wind booster, showing that it does not help as much as desired.
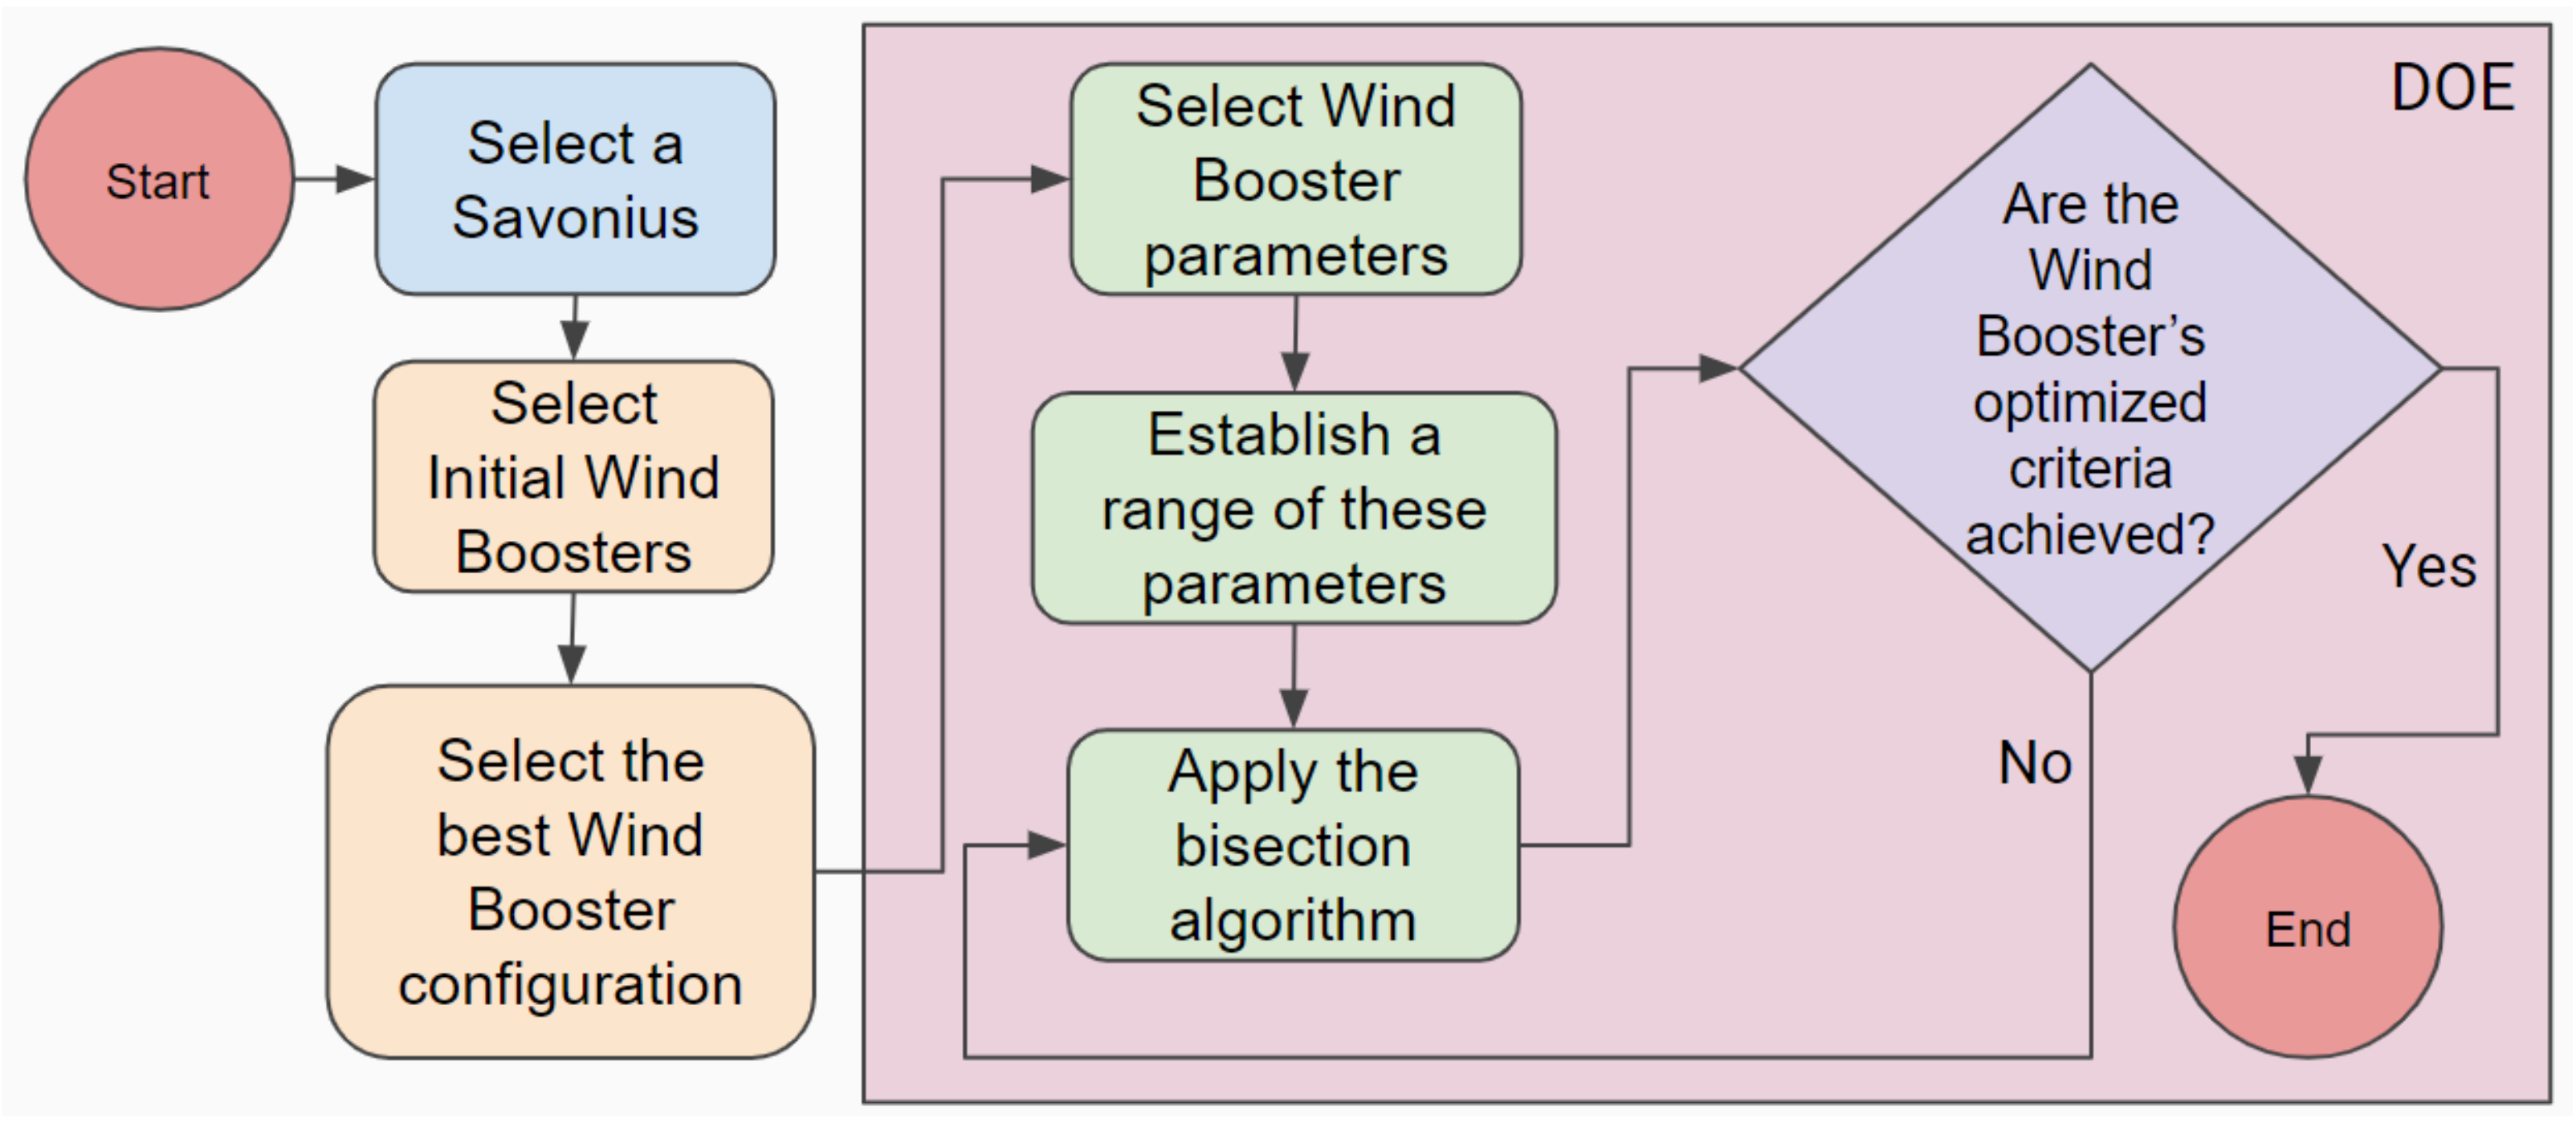
2.3. Design of Experiments
2.4. Optimization Criteria
3. Validation
Discussion
- The study of the state of the art was highly helpful in choosing the Savonius and the Wind Booster configuration, as it provided us with a starting point based on past studies.
- To further improve the wind turbine’s performance, it is possible to apply our methodology to the Savonius and maybe other components of the wind turbine.
- Concerning the designed variables , , and , our final analysis is as follows:
- Since the purpose is to orient the wind to the forward blade of the Savonius, the geometric limit for theta and beta is .
- Regarding the diameter of the Savonius, the minimum value of , has a cosecant relationship.
- Considering the internal diameter and external diameter of the Wind Booster, we have the following relationship:As shown in Figure 18a, the blade corresponding to that angle is not centered. Therefore, there is a correction factor of . Thus, . Following the same logic, we obtain . These calculations consider ; any change in this variable influences each angle’s lower and upper limits.
- We continue with the premise of increasing the speed inside the wind booster; for this reason, the objective is to increase speed with a decrease in the cross-sectional area. This objective leads to geometric restrictions in the design of the Wind Booster, as can be seen in Figure 18b: , and must meet that in order to enable a reduction in the cross-sectional area; therefore, the angle .
- Computational fluid dynamics software enables us to venture toward a challenging design since it allows to test initial designs without wasting time and money.
- The optimization process of the Wind Booster: There are only a very few works on this matter in the literature. Natapol Korprasertsak presented different versions of this idea [33,42,43]; Korprasertsak et al. [33] used an alternating direction technique to change the angles of the blades. However, this procedure takes too long to establish a good result and only uses one physical variable of the WB. Our proposal uses three different physical values of the WB for optimization and only requires a few steps to achieve an improved result. The main limitation of our algorithm is establishing the minimum and maximum values of the variables correctly. We solved this issue with a geometrical analysis.
4. Conclusions
Author Contributions
Funding
Institutional Review Board Statement
Informed Consent Statement
Data Availability Statement
Conflicts of Interest
Appendix A. SolidWorks Simulations Configuration
- Load the file: Please select the desired model and load it in SolidWorks, as seen in Figure A1.
- Use the Wizard: Launch the flow simulation plugin in SolidWorks and run the Wizard. Select the following options:
- Give the project a name and leave a comment, click next.
- Select the SI Unit system and click next.
- Select external analysis and click next.
- As the fluid, select air, and place in fluid type, laminar and turbulent. Do not select humidity and the number of flows; click next.
- Use a roughness of 0 micrometers and thus represent a completely smooth surface; click next.
- Now, assign values for pressure, temperature, wind direction, and wind speed. In our case, we use 101700 PA, 294.15 K, x-axis, 2.04 m/s respectively. Click finish.
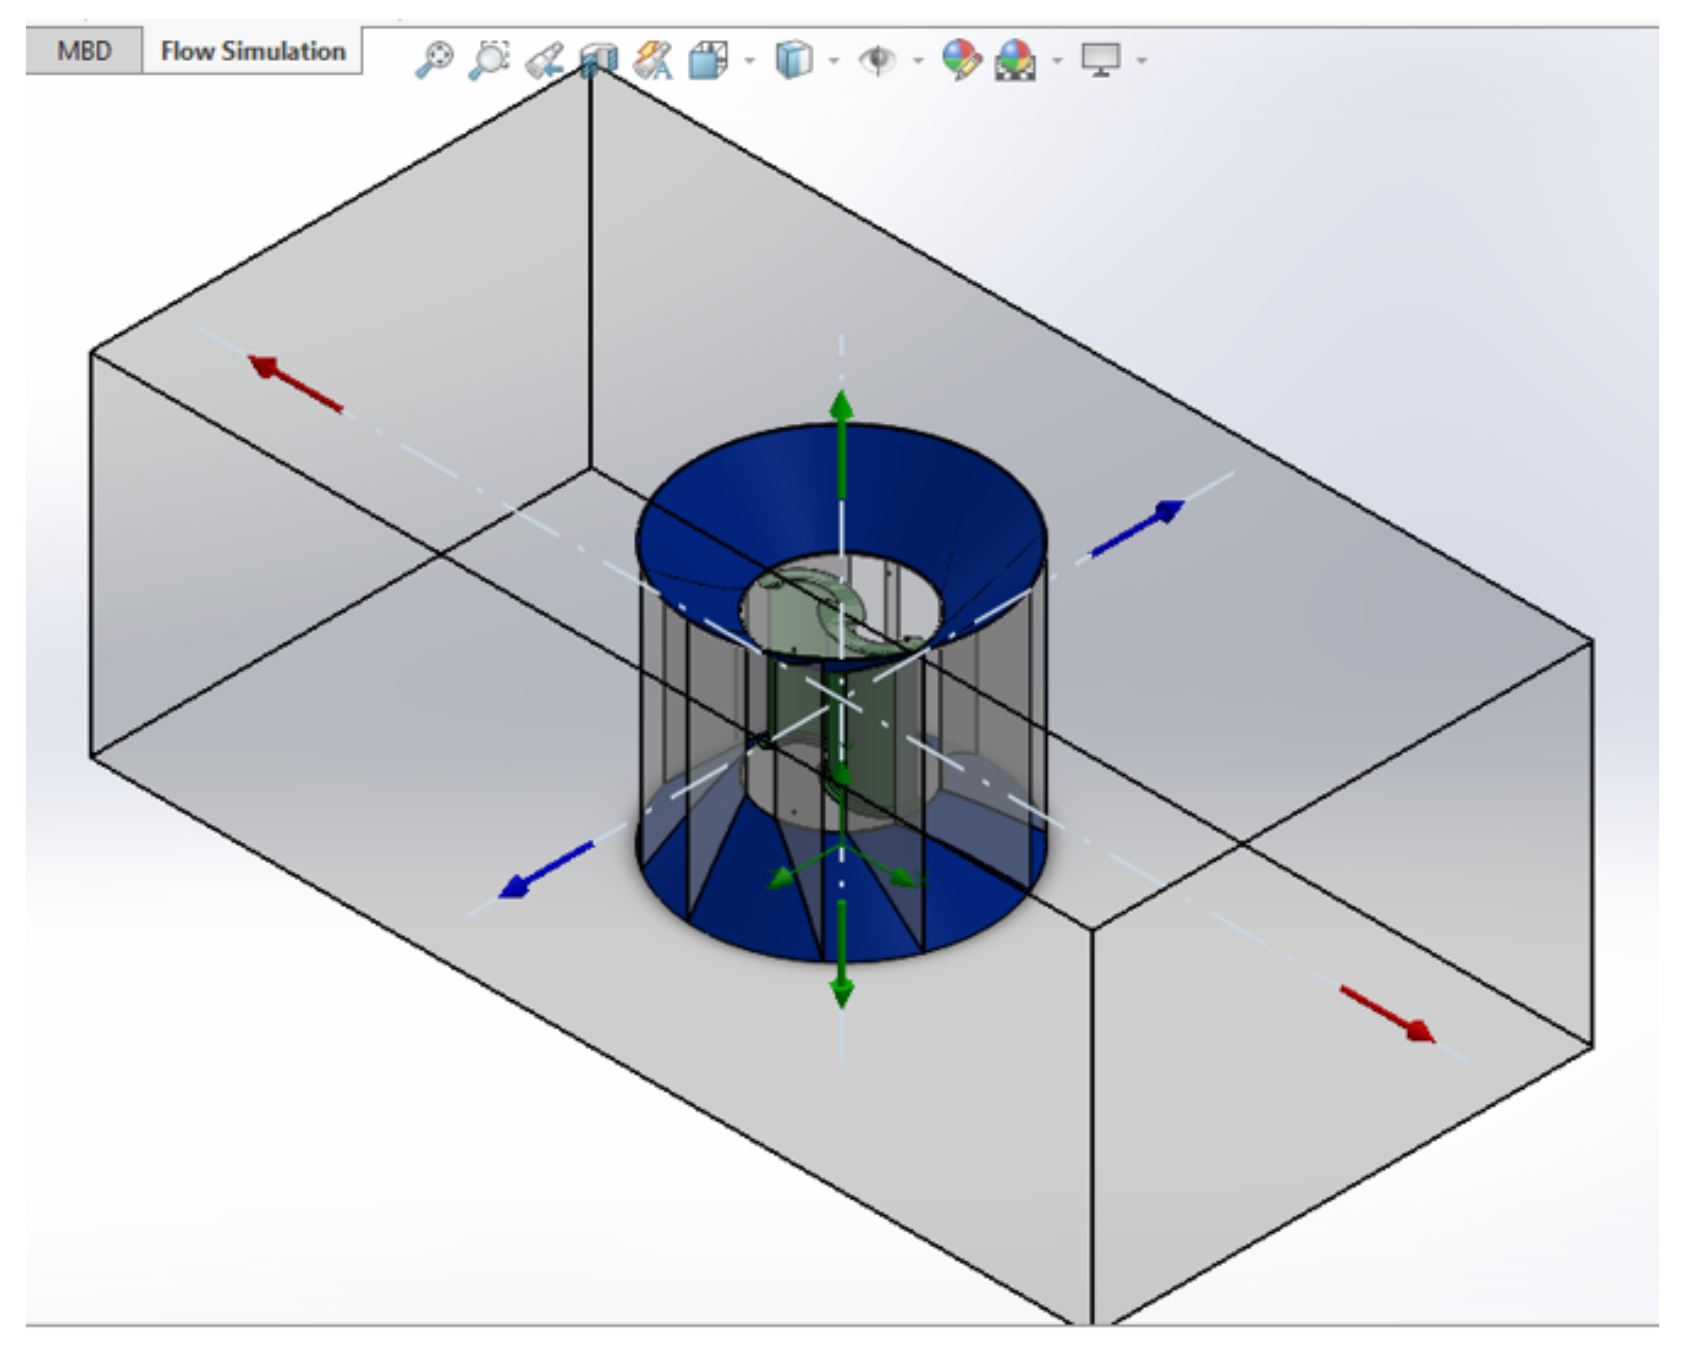
- Computational domain: Before starting the simulation, it is necessary to assign values to the computational domain’s three axes. Select each axis with the mouse to set a value as seen in Figure A2. It is advisable not to use ample space; otherwise, the simulation will take a long time.


Appendix B. COMSOL Simulations Configuration
- Computational DomainAir: The study contemplates a computational domain to simulate a wind tunnel in which is immersed the wind turbine. We divide this domain into two subdomains, the first being larger and shaped like a rectangular prism, and the second with a cylindrical shape called the rotational domain, whose center coincides with the center of the geometry of the wind turbine; see Table A1.Table A1. Dimensions of the wind computational domains.
Domain Size (mm) Position (mm) Rectangular domain (9000 × 25,000 × 3000) (x,y,z) (0 × 5000 × 500) (x,y,z) Rotational domain (1160,3000)(Radio,Altura) (0,0,−1000)(x,y,z) Wind turbine: The rest of each study’s computational domains correspond to the different pieces that make up the Savonius wind turbine assembly itself and the Wind Booster. Their parameters and dimensions are detailed in the CAD files of each one. They can be grouped into two sets of domains called the wind turbine domain and the booster domain, respectively. The method to finalize the geometry is Form Union. - To repair the geometries, we use diverse virtual operations, such as deleting holes, collapsing faces, and composing faces, among others. As a result, we obtain more uniform and cleaner domains that simplify the meshing process.
- Materials: We only consider two materials—air (we use the default settings) and for the solids, we use PLA plastic defined in Table A2.Table A2. Physical properties of PLA plastic.
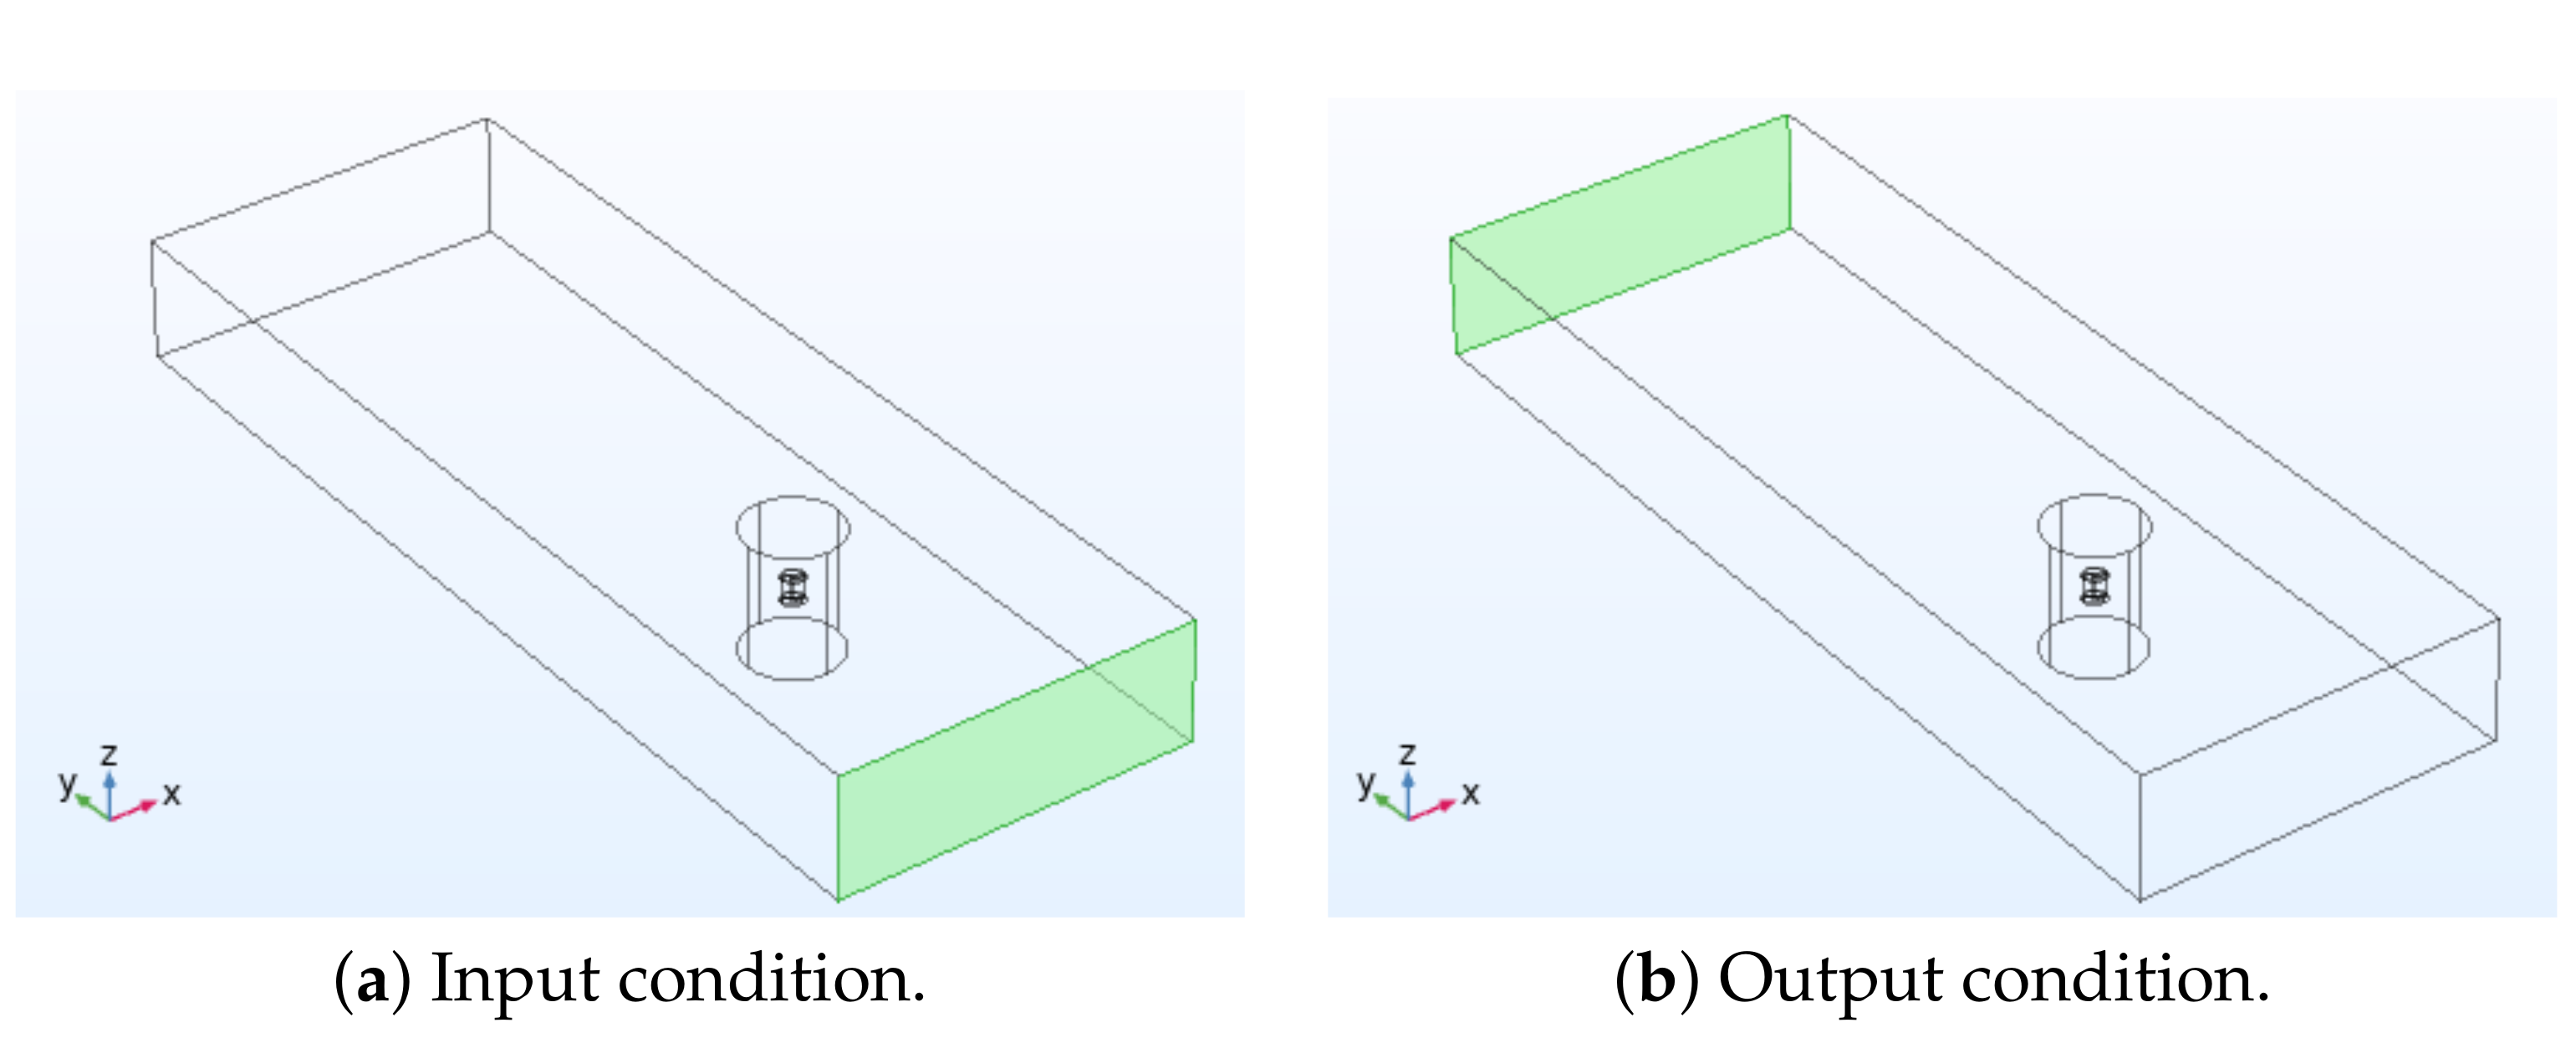
Propierty Valor Unit Density 1252 kg/m Poisson’s ratio 0.36 – Young’s modulus 1.28 × 10 Pa - Physics: The physics contemplated in the study is fluid dynamics. In particular, we simulate a single-phase and laminar fluid flow without considering any turbulence model. This physical model only applies to computational wind domains, and we use all initial properties and conditions default values.Boundary conditions. (a) Input: We take the wind tunnel domain’s front face as the fluid inlet with a constant speed. We highlight in green this face, as shown in Figure A3a; (b) Output: As an output condition, we consider the face opposite the wind tunnel inlet with a relative pressure of 0 Pa taken at the fluid outlet (see Figure A3b).Figure A3. Boundary conditions.
![Sensors 21 04775 g0a3]() Symmetry and wall: Finally, as symmetry conditions, the wind tunnel domain’s remaining faces are taken, and only the domains corresponding to the wind turbine and the wind booster are considered wall conditions.
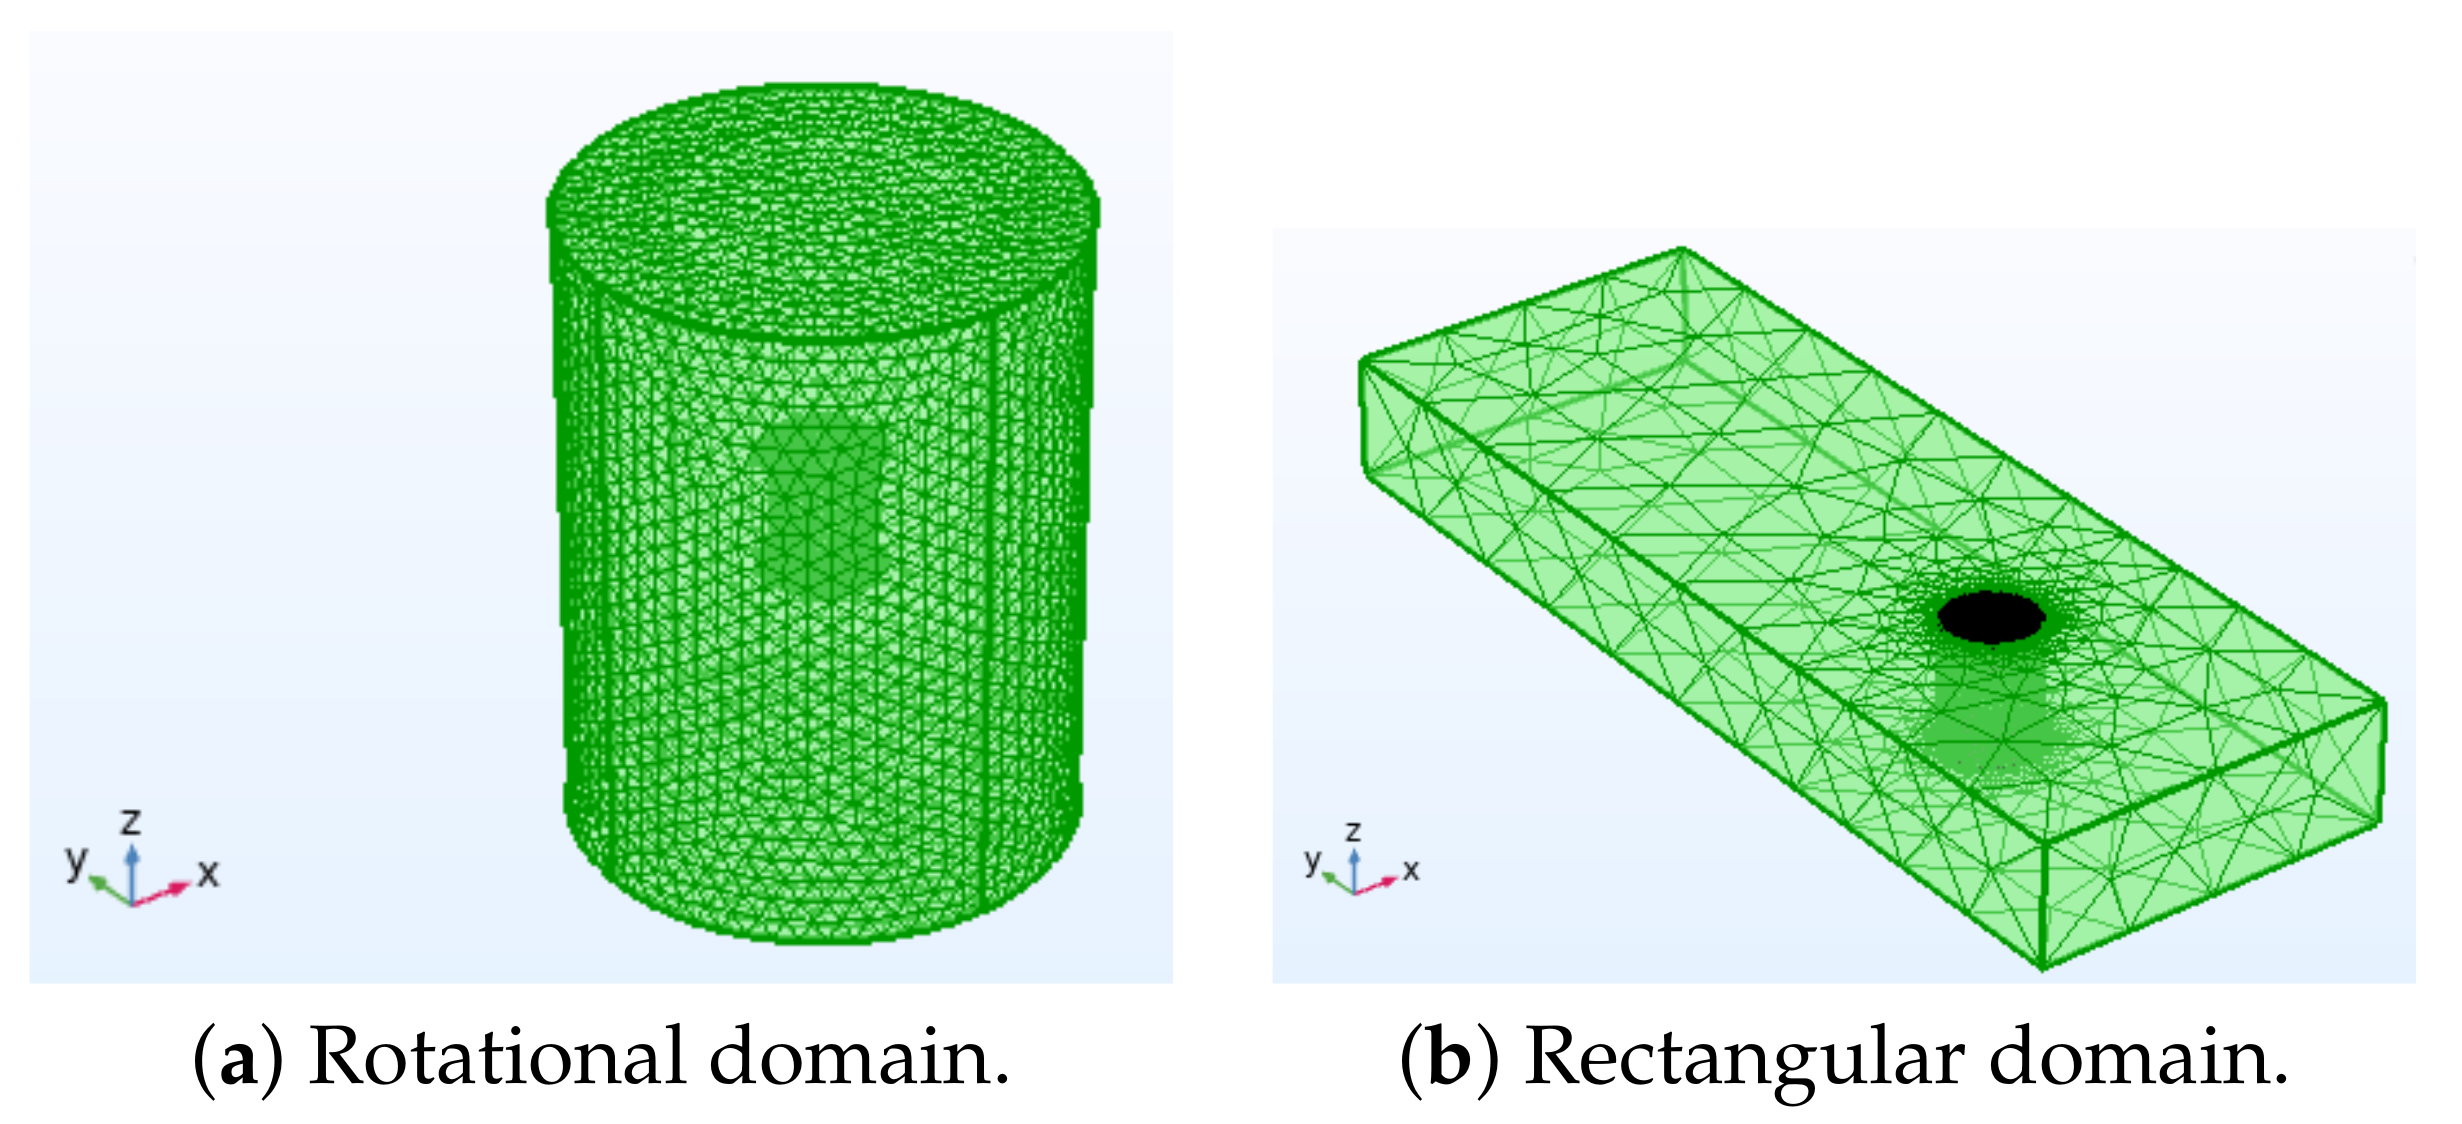
Symmetry and wall: Finally, as symmetry conditions, the wind tunnel domain’s remaining faces are taken, and only the domains corresponding to the wind turbine and the wind booster are considered wall conditions. - Mesh: We carry out the meshing process in separate parts: building the mesh for the wind turbine domains and building the mesh for the wind domains.Wind tunnel: We use a tetrahedral mesh as shown in Figure A4 with its corresponding conditions in Table A3.Figure A4. Wind Tunnel Mesh.
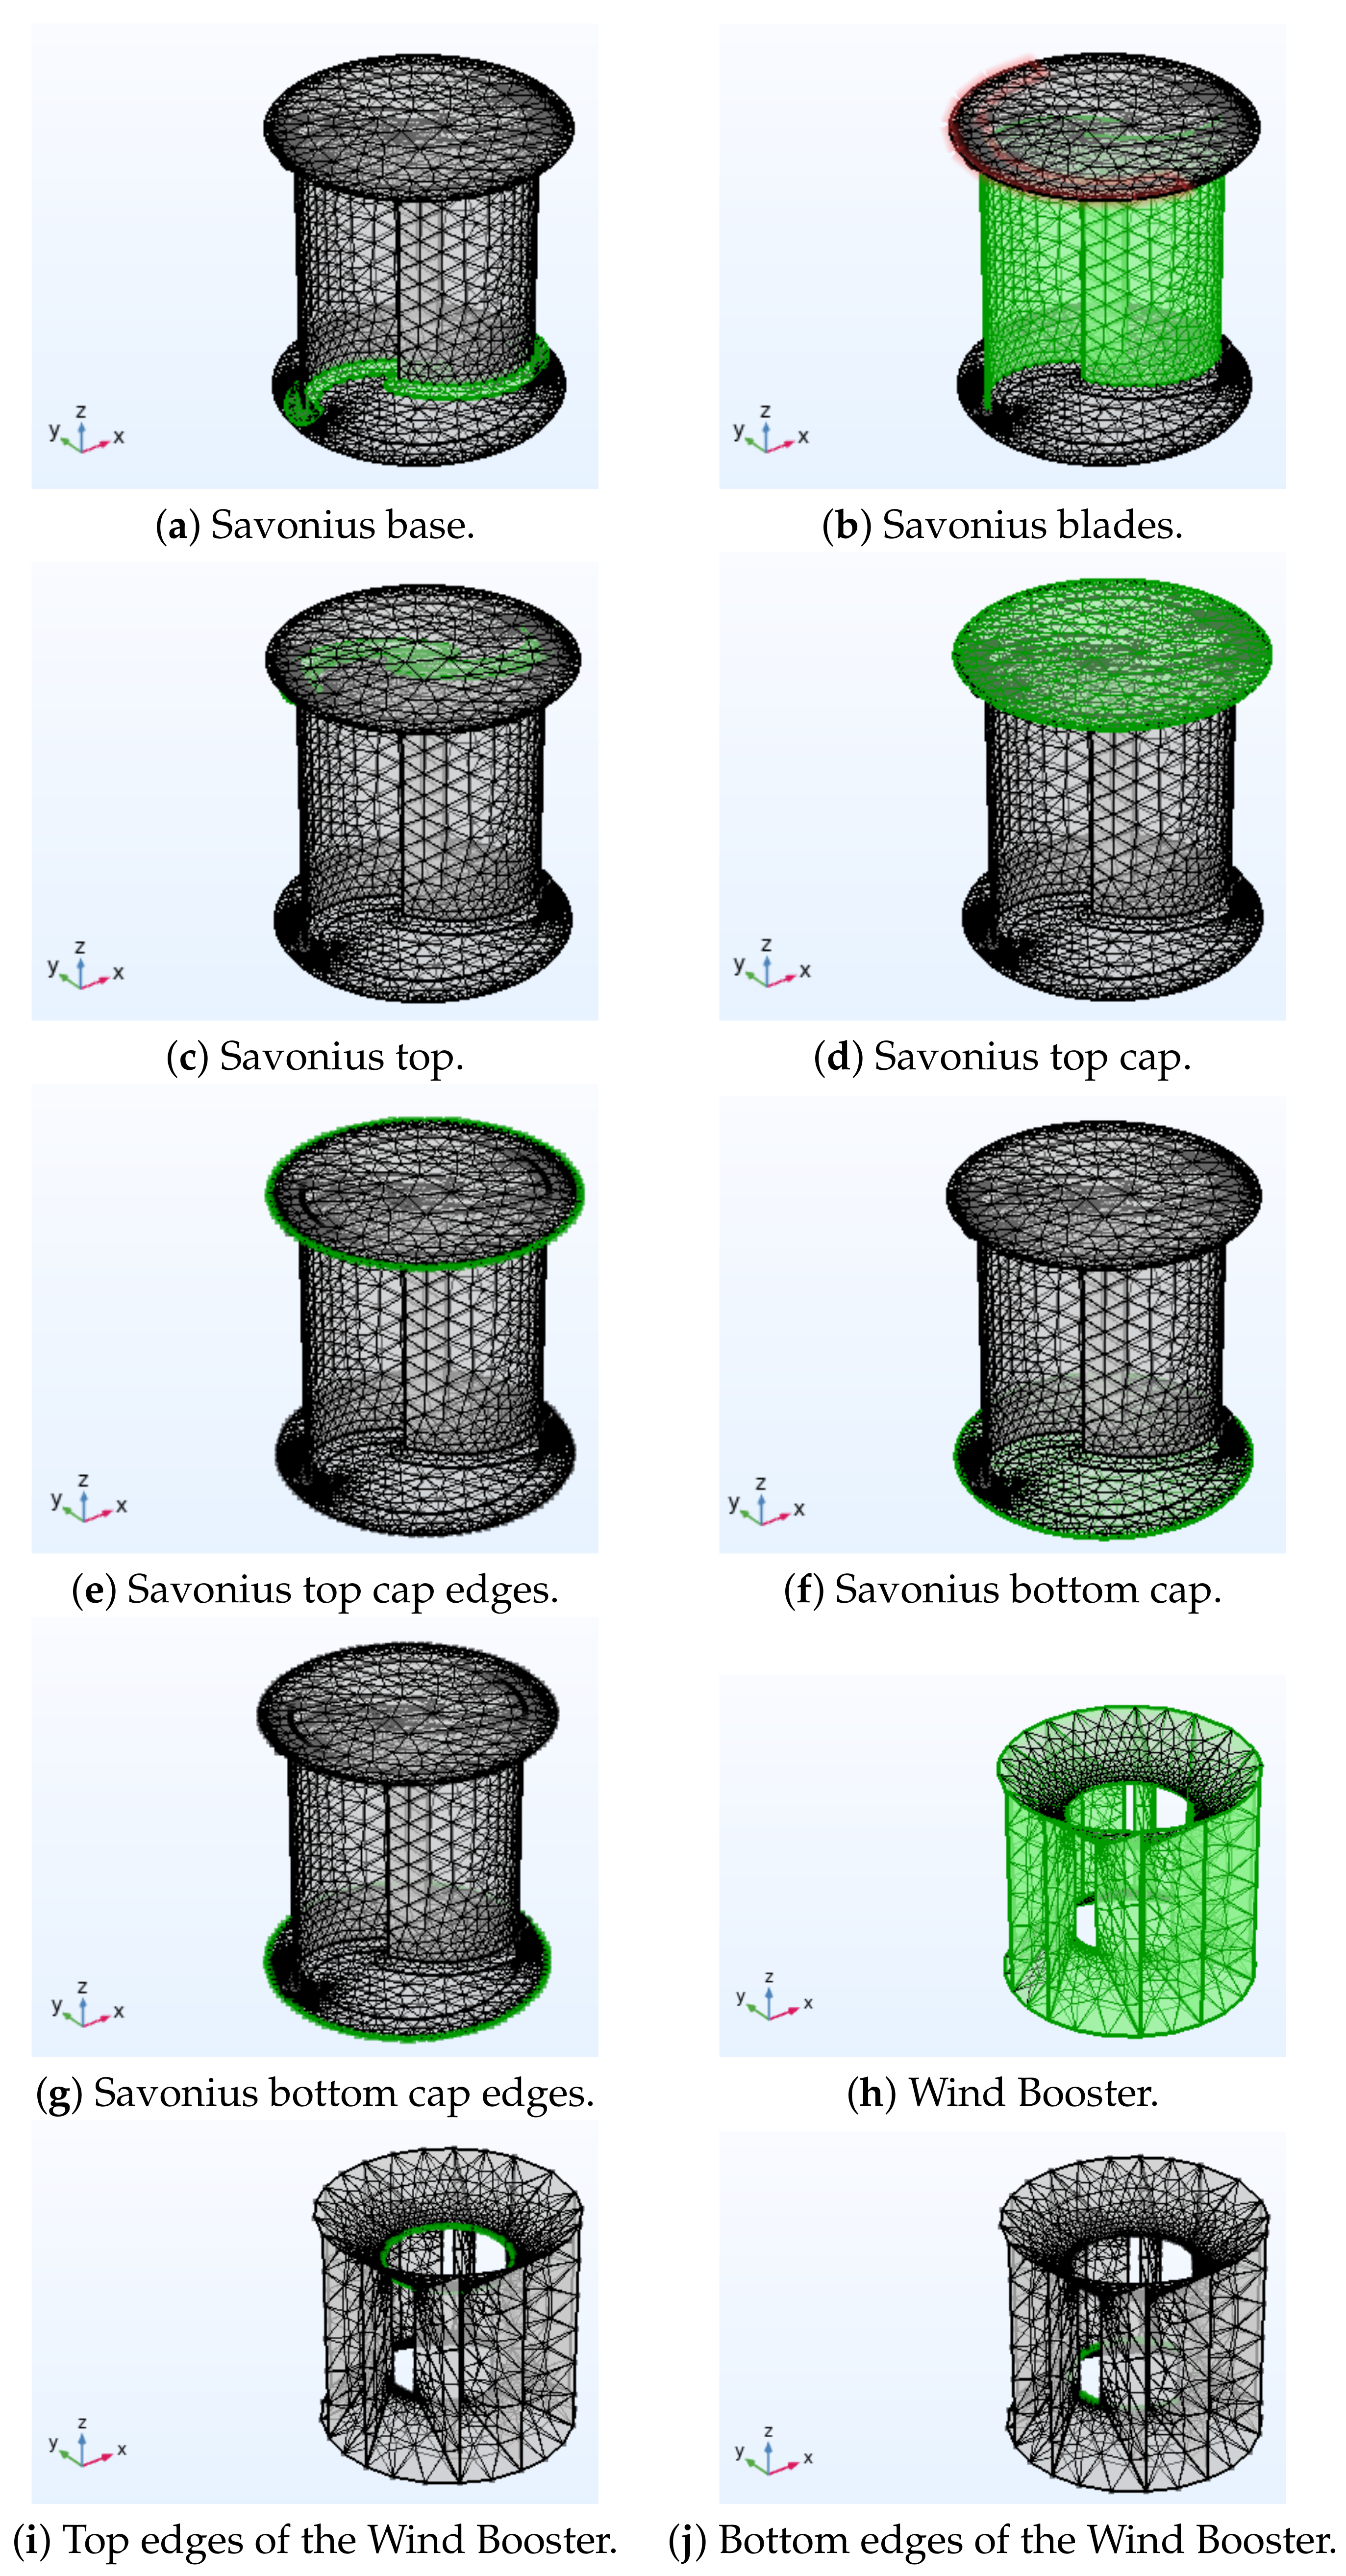
![Sensors 21 04775 g0a4]() Wind turbine: We use a triangular mesh as shown in Figure A5 with its corresponding conditions in Table A4.Table A4. Mesh parameters.
Wind turbine: We use a triangular mesh as shown in Figure A5 with its corresponding conditions in Table A4.Table A4. Mesh parameters.Figure Calibrated Preset Size Maximum Element Size Minimum Element Size Figure A5a General Physics Normal Predefined 25 (mm) Figure A5b General Physics Extremely fine Predefined Predefined Figure A5c General Physics Normal Predefined 25 (mm) Figure A5d * General Physics Normal Predefined 165 (mm) Figure A5f ** General Physics Normal Predefined 185 (mm) Figure A5h *** General Physics Fine Predefined Predefined * Additionally, an element distribution is configured with a finite number of elements adjacent to the selected edge in Figure A5e, setting the number of elements to 50; ** Additionally, an element distribution is configured with a finite number of elements adjacent to the selected edge in Figure A5g, setting the number of elements to 50; *** Additionally, an element distribution is configured with a finite number of elements adjacent to the selected edge in Figure A5i,j, setting the number of elements to 10.Figure A5. Wind turbine mesh.![Sensors 21 04775 g0a5]()


References
- Canseco, M. Energías Renovables en América Latina; Fundación Ciudadanía y Valores: Madrid, Spain, 2010; pp. 1–12. [Google Scholar]
- WWEA. World Wind Capacity at 650.8 GW, Corona Crisis will Slow Down Markets in 2020, Renewables To Be Core of Economic Stimulus Programmes. 2020. Available online: https://wwindea.org/blog/2020/04/16/world-wind-capacity-at-650-gw/ (accessed on 29 July 2020).
- Mexican Government. PROSEDEN. Programa de Desarrollo del Sistema Eléctrico Nacional 2018–2032. Executive Summary. 2018. Available online: https://base.energia.gob.mx/prodesen/PRODESEN2018/EXECUTIVE_SUMMARY_PRODESEN_2018-2032.pdf (accessed on 8 August 2020).
- Chong, W.; Naghavi, M.; Poh, S.; Mahlia, T.; Pan, K. Techno-economic analysis of a wind—Solar hybrid renewable energy system with rainwater collection feature for urban high-rise application. Appl. Energy 2011, 88, 4067–4077. [Google Scholar] [CrossRef]
- Chong, W.; Fazlizan, A.; Poh, S.; Pan, K.; Hew, W.; Hsiao, F. The design, simulation and testing of an urban vertical axis wind turbine with the omni-direction-guide-vane. Appl. Energy 2013, 112, 601–609. [Google Scholar] [CrossRef]
- Heo, Y.G.; Choi, N.J.; Choi, K.H.; Ji, H.S.; Kim, K.C. CFD study on aerodynamic power output of a 110 kW building augmented wind turbine. Energy Build. 2016, 129, 162–173. [Google Scholar] [CrossRef]
- Haase Matthias, L.E. Building Augmented Wind Turbines—BAWT: Integrated Solutions and Technologies of Small Wind Turbines. 2015. Available online: http://hdl.handle.net/11250/2388620 (accessed on 4 August 2020).
- Zhu, H.; Li, C.; Hao, W.; Ding, Q.; Yu, W. Investigation on aerodynamic characteristics of building augmented vertical axis wind turbine. J. Renew. Sustain. Energy 2018, 10, 053302. [Google Scholar] [CrossRef]
- Casini, M. Small vertical axis wind turbines for energy efficiency of buildings. J. Clean Energy Technol. 2016, 4, 56–65. [Google Scholar] [CrossRef] [Green Version]
- Kazak, J.K.; Świąder, M. SOLIS—A Novel Decision Support Tool for the Assessment of Solar Radiation in ArcGIS. Energies 2018, 11, 2105. [Google Scholar] [CrossRef] [Green Version]
- Vilar, A.Á.; Xydis, G.; Nanaki, E.A. Small Wind: A Review of Challenges and Opportunities. In Sustaining Resources for Tomorrow; Springer: Berlin/Heidelberg, Germany, 2020; pp. 185–204. [Google Scholar]
- Deshmukh, A. The Role of Decentralized Renewable Energy for Rural Electrification. Maharashtra Case Study, India. Master’s Thesis, Lund University, Lund, Sweden, 2009. [Google Scholar]
- Martin, J. Distributed vs. Centralized Electricity Generation: Are We Witnessing a Change of Paradigm. 2009. Available online: https://www.vernimmen.net/ftp/An_introduction_to_distributed_generation.pdf (accessed on 11 July 2021).
- Möllerström, E.; Ottermo, F.; Hylander, J.; Bernhoff, H. Noise emission of a 200 kW vertical axis wind turbine. Energies 2016, 9, 19. [Google Scholar] [CrossRef] [Green Version]
- Hau, E. Wind Turbines: Fundamentals, Technologies, Application, Economics; Springer: Berlin/Heidelberg, Germany, 2013. [Google Scholar]
- Akwa, J.V.; Vielmo, H.A.; Petry, A.P. A review on the performance of Savonius wind turbines. Renew. Sustain. Energy Rev. 2012, 16, 3054–3064. [Google Scholar] [CrossRef]
- Savonius, S.J. The S-rotor and its applications. Mech. Eng. 1931, 53, 333–338. [Google Scholar]
- Ogawa, T.; Yoshida, H.; Yokota, Y. Development of Rotational Speed Control Systems for a Savonius-Type Wind Turbine. ASME J. Fluids Eng. 1989, 111, 53–58. [Google Scholar] [CrossRef]
- Grinspan, A.; Saha, U. Experimental investigation of twisted bladed Savonius wind turbine rotor. Int. Energy J. 2005, 5, 1–9. [Google Scholar]
- Kacprzak, K.; Liskiewicz, G.; Sobczak, K. Numerical investigation of conventional and modified Savonius wind turbines. Renew. Energy 2013, 60, 578–585. [Google Scholar] [CrossRef]
- Roy, S.; Mukherjee, P.; Saha, U.K. Aerodynamic performance evaluation of a novel Savonius-style wind turbine under an oriented jet. In Gas Turbine India Conference; American Society of Mechanical Engineers: New York, NY, USA, 2014; Volume 49644. [Google Scholar]
- Alom, N.; Kolaparthi, S.C.; Gadde, S.C.; Saha, U.K. Aerodynamic design optimization of elliptical-bladed Savonius-style wind turbine by numerical simulations. In International Conference on Offshore Mechanics and Arctic Engineering; American Society of Mechanical Engineers: New York, NY, USA, 2016; Volume 49972, p. V006T09A009. [Google Scholar]
- Mari, M.; Venturini, M.; Beyene, A. A novel geometry for vertical axis wind turbines based on the savonius concept. J. Energy Resour. Technol. 2017, 139. [Google Scholar] [CrossRef]
- Piskorz, W. Wind Turbine with Cylindrical Rotor. Patent EP2508751A1, 10 November 2012. [Google Scholar]
- Piskorz, W.; Piskorz, T.; Piskorz, I. Multisegment Vertical Axis Wind Turbine. U.S. Patent US20,160,305,400A1, 20 October 2016. [Google Scholar]
- Wong, K.H.; Chong, W.T.; Sukiman, N.L.; Poh, S.C.; Shiah, Y.C.; Wang, C.T. Performance enhancements on vertical axis wind turbines using flow augmentation systems: A review. Renew. Sustain. Energy Rev. 2017, 73, 904–921. [Google Scholar] [CrossRef]
- Jamieson, P. Innovation in Wind Turbine Design; Wiley: Hoboken, NJ, USA, 2018. [Google Scholar]
- Roy, S.; Saha, U.K. Review of experimental investigations into the design, performance and optimization of the Savonius rotor. Proc. Inst. Mech. Eng. Part A J. Power Energy 2013, 227, 528–542. [Google Scholar] [CrossRef]
- Golecha, K.; Eldho, T.; Prabhu, S. Influence of the deflector plate on the performance of modified Savonius water turbine. Appl. Energy 2011, 88, 3207–3217. [Google Scholar] [CrossRef]
- Altan, B.D.; Atılgan, M.; Özdamar, A. An experimental study on improvement of a Savonius rotor performance with curtaining. Exp. Therm. Fluid Sci. 2008, 32, 1673–1678. [Google Scholar] [CrossRef]
- Chong, W.; Pan, K.; Poh, S.; Fazlizan, A.; Oon, C.; Badarudin, A.; Nik-Ghazali, N. Performance investigation of a power augmented vertical axis wind turbine for urban high-rise application. Renew. Energy 2013, 51, 388–397. [Google Scholar] [CrossRef]
- Pope, K.; Rodrigues, V.; Doyle, R.; Tsopelas, A.; Gravelsins, R.; Naterer, G.; Tsang, E. Effects of stator vanes on power coefficients of a zephyr vertical axis wind turbine. Renew. Energy 2010, 35, 1043–1051. [Google Scholar] [CrossRef]
- Korprasertsak, N.; Leephakpreeda, T. Analysis and optimal design of wind boosters for Vertical Axis Wind Turbines at low wind speed. J. Wind. Eng. Ind. Aerodyn. 2016, 159, 9–18. [Google Scholar]
- Wong, K.H.; Chong, W.; Yap, H.; Fazlizan, A.; Omar, W.; Poh, S.; Hsiao, F. The design and flow simulation of a power-augmented shroud for urban wind turbine system. Energy Procedia 2014, 61, 1275–1278. [Google Scholar] [CrossRef] [Green Version]
- Nobile, R.; Vahdati, M.; Barlow, J.F.; Mewburn-Crook, A. Unsteady flow simulation of a vertical axis augmented wind turbine: A two-dimensional study. J. Wind. Eng. Ind. Aerodyn. 2014, 125, 168–179. [Google Scholar] [CrossRef] [Green Version]
- Manwell, J.F.; McGowan, J.G.; Rogers, A.L. Wind Energy Explained: Theory, Design and Application; John Wiley & Sons: Hoboken, NJ, USA, 2010. [Google Scholar]
- Alom, N.; Saha, U.K. Four decades of research into the augmentation techniques of Savonius wind turbine rotor. J. Energy Resour. Technol. 2018, 140. [Google Scholar] [CrossRef]
- Mexico City’s Government. Air Quality (in Spanish: Calidad del aire). 2020. Available online: http://www.aire.cdmx.gob.mx/ (accessed on 8 August 2020).
- Moreno-Armendáriz, M.A.; Duchanoy, C.A.; Calvo, H.; Salcedo-Castañeda, J.S.; Ayala-Canseco, M.; Ibarra-Ontiveros, E.; García, D. WindBooster Data. Available online: https://github.com/Duchanoy/WindBooster_Data (accessed on 9 August 2020).
- Goupy, J.; Creighton, L. Introduction to Design of Experiments with JMP Examples; SAS Publishing: Cary, NC, USA, 2007. [Google Scholar]
- Atkinson, K.E. An Introduction to Numerical Analysis; John Wiley & Sons: Hoboken, NJ, USA, 2008. [Google Scholar]
- Korprasertsak, N. CFD-Based Analysis and Optimization of Wind Boosters for Low Speed Vertical Axis Wind Turbines. Ph.D. Thesis, Sirindhorn International Institute of Technology, Thammasat University, Bangkok, Thailand, 2015. [Google Scholar]
- Korprasertsak, N.; Leephakpreeda, T. Optimal design of wind boosters for low speed vertical axis wind turbines. Appl. Mech. Mater. 2015, 798, 195–199. [Google Scholar] [CrossRef]


| Design Parameters | Value |
|---|---|
| Cutting angle of ellipse | |
| Number of blades | 2 |
| Chord length of blade | mm |
| Overall rotor diameter | 550 mm |
| End plate diameter | 600 mm |
| Blade thickness | 3 mm |
| Blade torsion | |
| Overlap distance | mm |
| The largest radius of the blade ellipse | 198 mm |
| The smallest radius of the blade ellipse | 132 mm |
| Aspect ratio |
Publisher’s Note: MDPI stays neutral with regard to jurisdictional claims in published maps and institutional affiliations. |
© 2021 by the authors. Licensee MDPI, Basel, Switzerland. This article is an open access article distributed under the terms and conditions of the Creative Commons Attribution (CC BY) license (https://creativecommons.org/licenses/by/4.0/).
Share and Cite
Moreno-Armendáriz, M.A.; Duchanoy, C.A.; Calvo, H.; Ibarra-Ontiveros, E.; Salcedo-Castañeda, J.S.; Ayala-Canseco, M.; García, D. Wind Booster Optimization for On-Site Energy Generation Using Vertical-Axis Wind Turbines. Sensors 2021, 21, 4775. https://doi.org/10.3390/s21144775
Moreno-Armendáriz MA, Duchanoy CA, Calvo H, Ibarra-Ontiveros E, Salcedo-Castañeda JS, Ayala-Canseco M, García D. Wind Booster Optimization for On-Site Energy Generation Using Vertical-Axis Wind Turbines. Sensors. 2021; 21(14):4775. https://doi.org/10.3390/s21144775
Chicago/Turabian StyleMoreno-Armendáriz, Marco A., Carlos A. Duchanoy, Hiram Calvo, Eddy Ibarra-Ontiveros, Jesua S. Salcedo-Castañeda, Michel Ayala-Canseco, and Damián García. 2021. "Wind Booster Optimization for On-Site Energy Generation Using Vertical-Axis Wind Turbines" Sensors 21, no. 14: 4775. https://doi.org/10.3390/s21144775