Theoretical Modeling of Multi-Channel Intracavity Spectroscopy Technology Based on Mode Competition in Er-Doped Fiber Ring Laser Cavity

 , , ,
, , ,
Abstract
:1. Introduction
2. Theoretical Modeling and Solution Methods
2.1. Theoretical Modeling
2.2. Theoretical Solutions
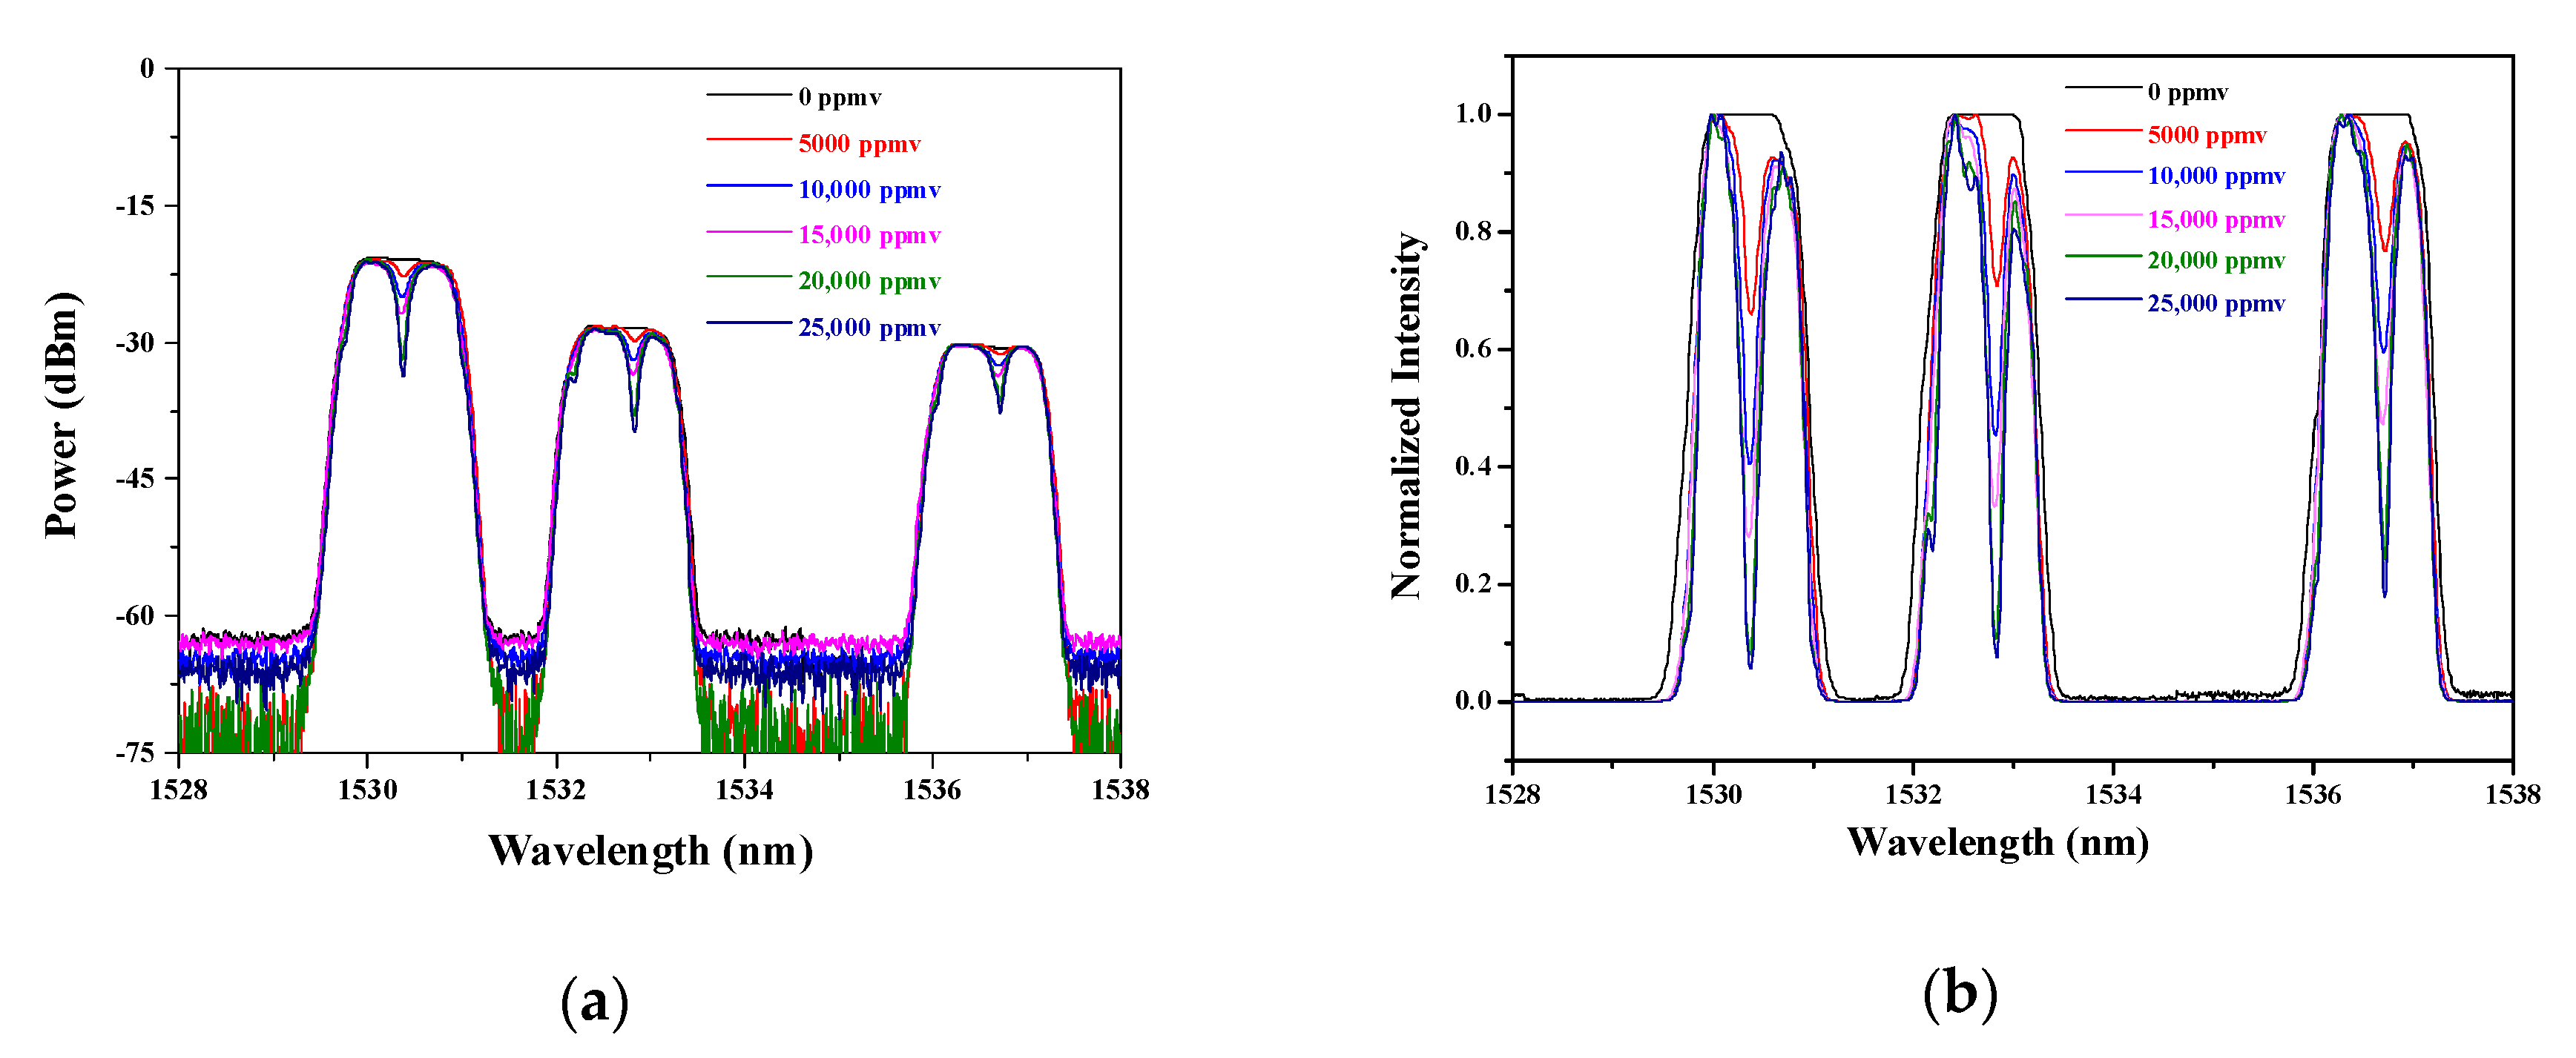
3. Multi-Channel Sensing Principle and Calculation
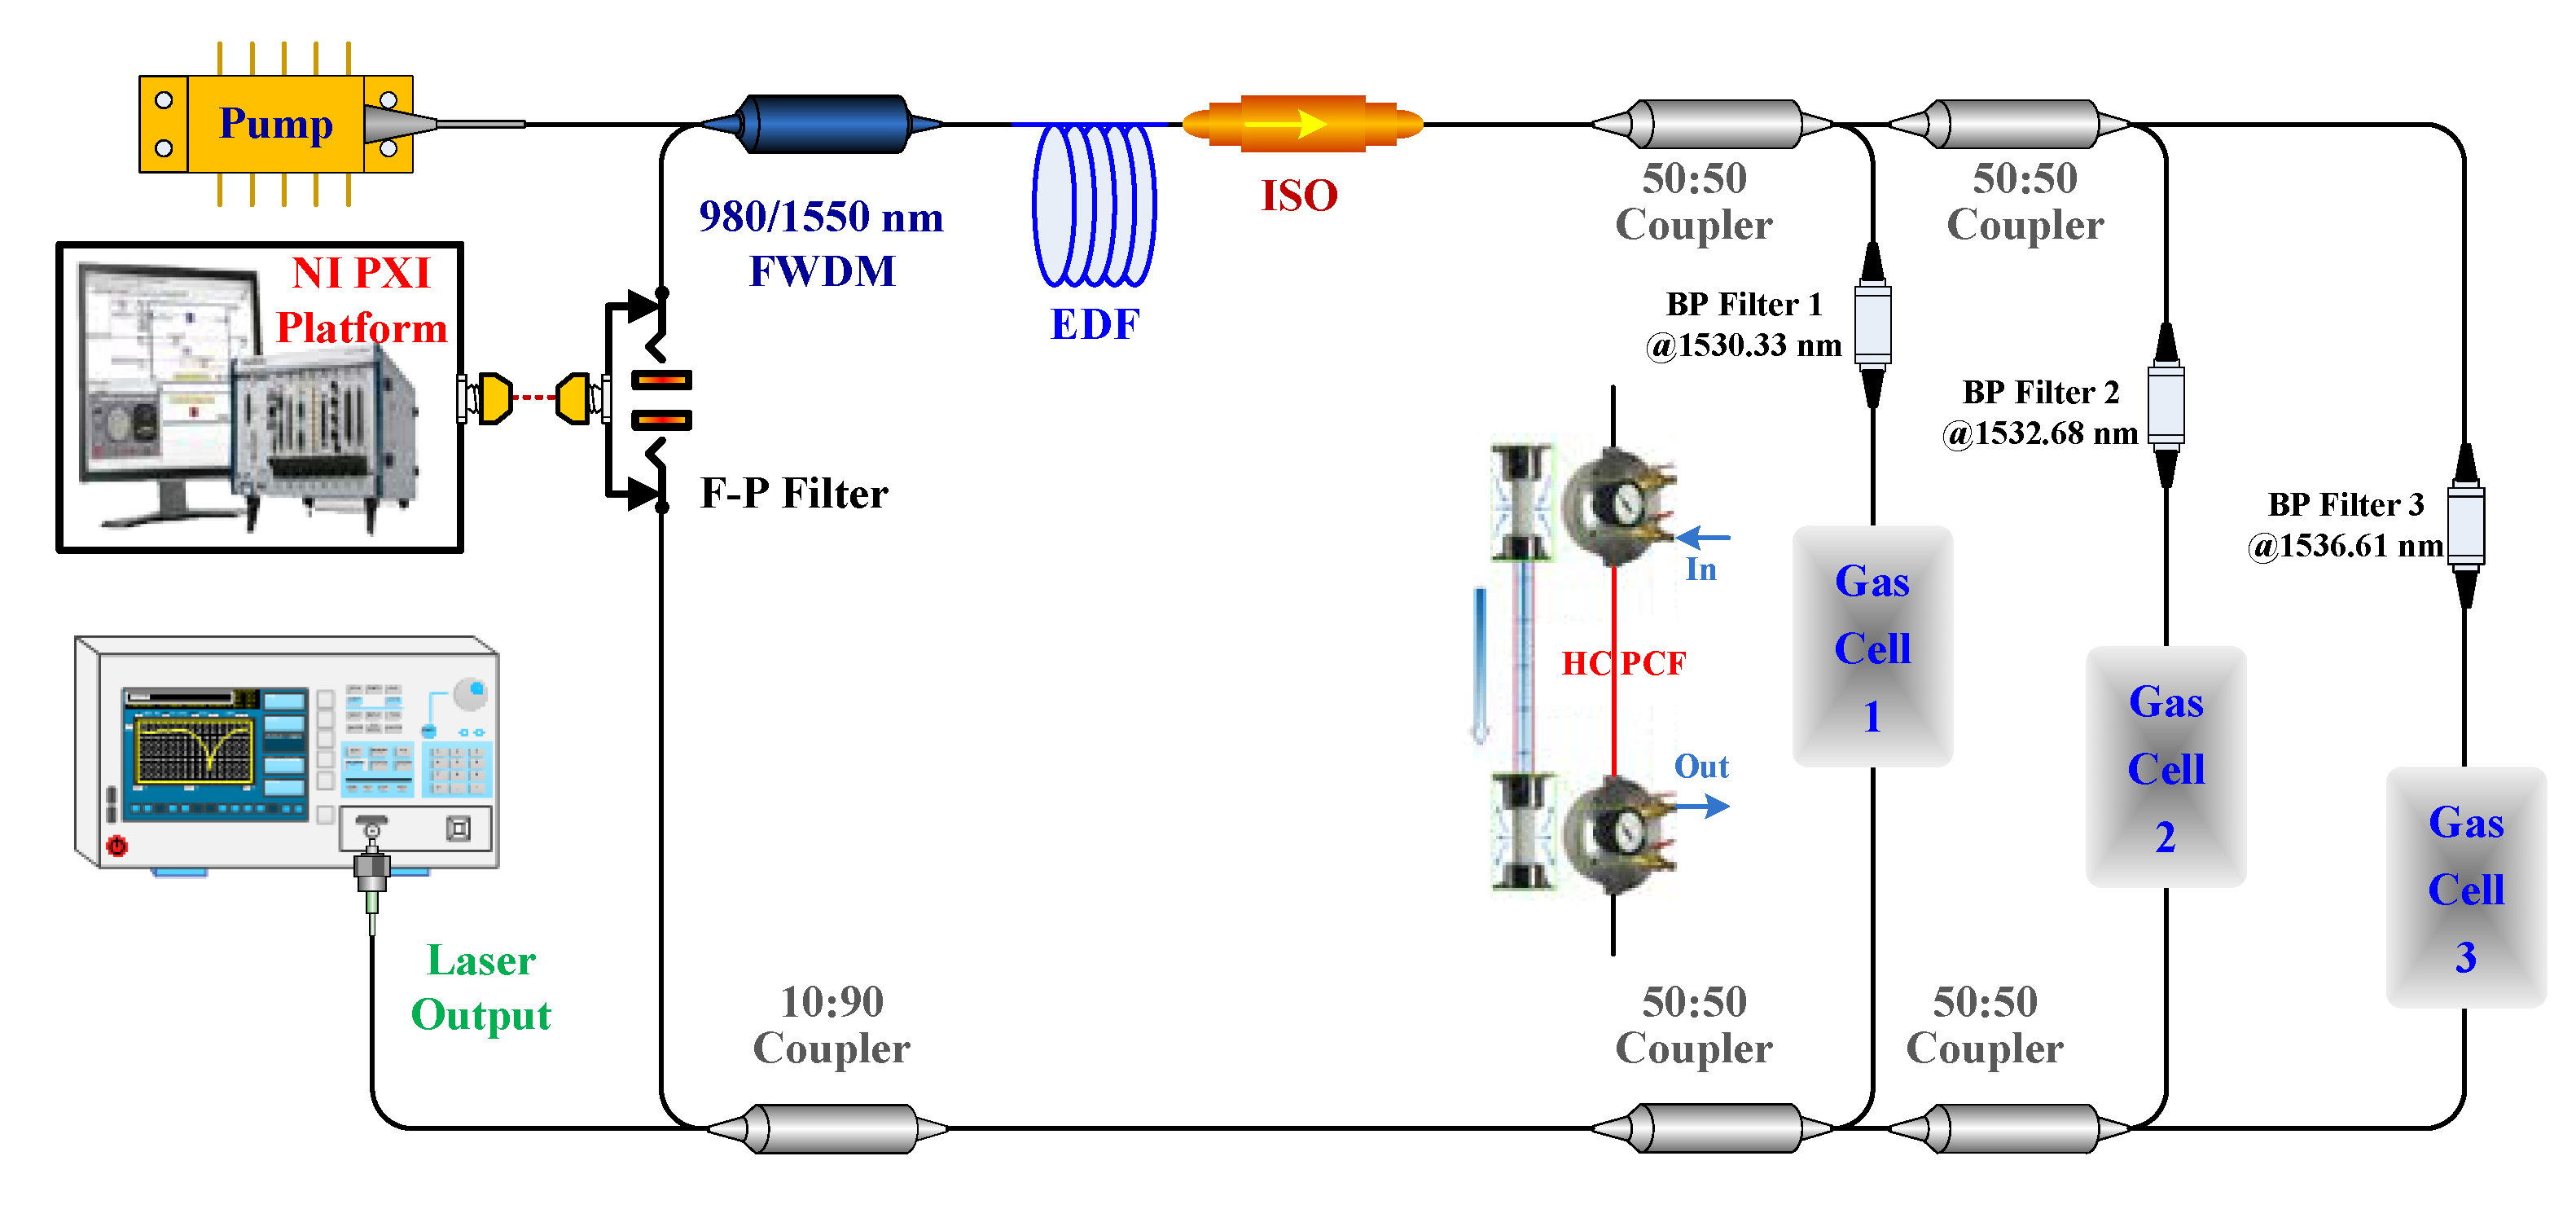
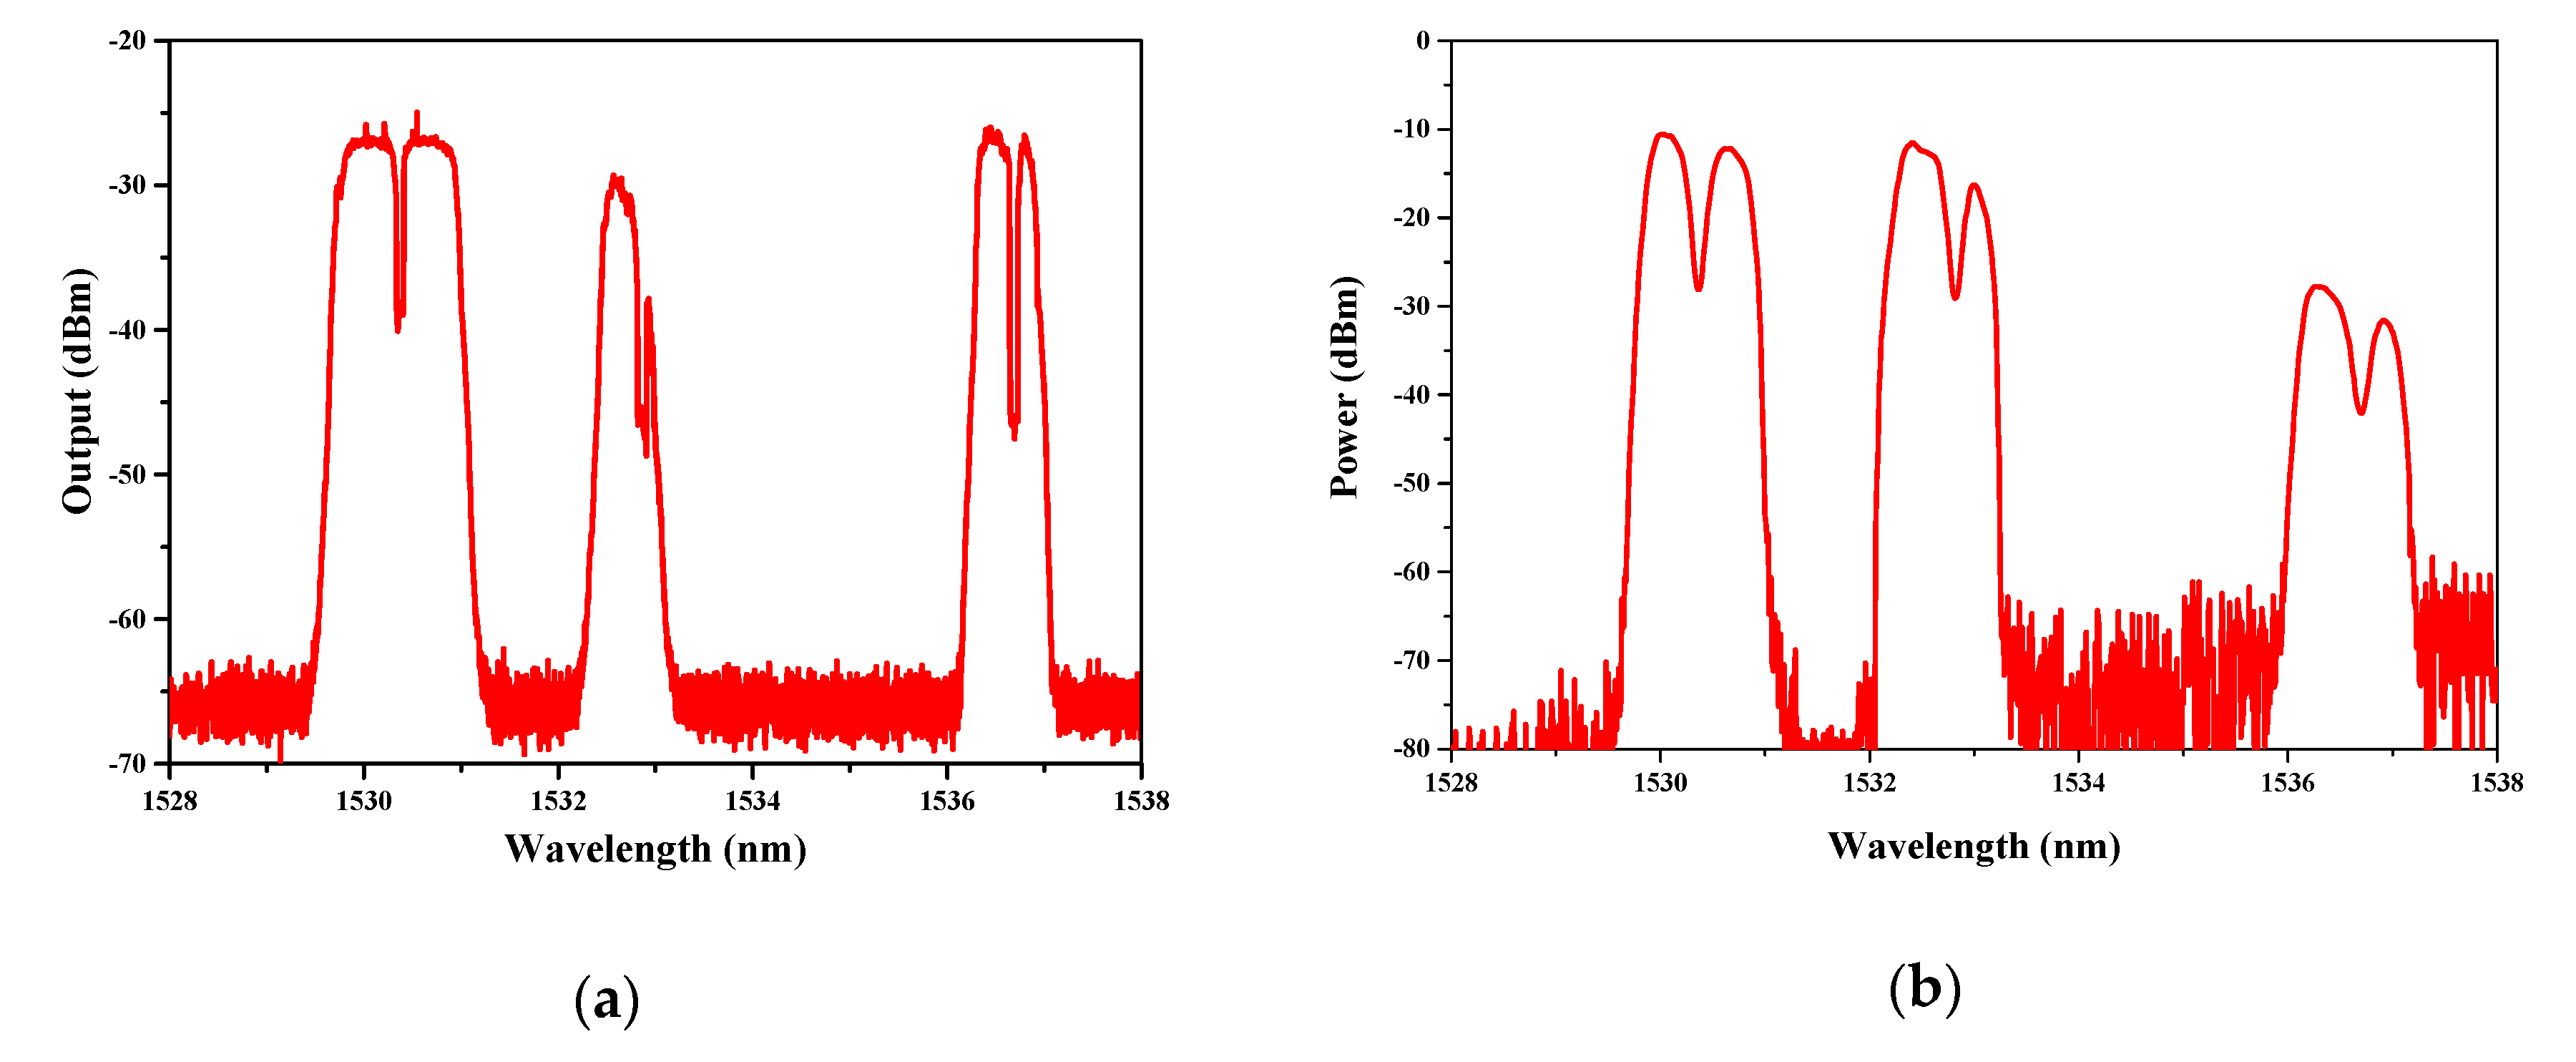
4. Experiments and Results
5. Conclusions
Author Contributions
Funding
Conflicts of Interest
Abbreviations
| A | area of the active fiber core |
| ASE | amplified spontaneous emission |
| EDF | Er-doped fiber |
| c | velocity of the light in vacuum |
| h | Planck’s constant |
| ICST | intracavity spectroscopy technology |
| ICL | intracavity laser |
| L | length of the active fiber |
| N1 | population densities in the ground state |
| N2 | population densities in the metastable state |
| N3 | population densities in the excited state |
| Nt | total active ions density |
| power of ASE with co-propagation direction | |
| power of ASE with counter-propagation direction | |
| power of pump with co-propagation direction | |
| power of pump with counter-propagation direction | |
| power of signal with co-propagation direction | |
| power of signal with counter-propagation direction | |
| v | group velocities of the ASE |
| vp | group velocities of the pump |
| vs | group velocities of the signal |
| αa | additional cavity loss |
| αp | internal loss of the pump |
| αs | internal loss of the signal |
| Γp | fraction of the pump power coupled into the active core |
| Γs | transverse overlap between the laser beam intensity and dopants concentration profiles |
| Δλ | wavelength interval |
| Δz | length interval |
| λi | the ith wavelength in the ASE |
| σpa | absorption cross sections of the pump |
| σpe | emission cross sections of the pump |
| σsa | absorption cross sections of the signal |
| σse | emission cross sections of the signal |
| τ21 | decay times from metastable level to ground level |
| τ32 | decay times from pump level to metastable level |
References
- Baev, V.M.; Eschner, J.; Paeth, E.; Schüler, R.; Toschek, P.E. Intra-cavity spectroscopy with diode lasers. Appl. Phys. B 1992, 55, 463–477. [Google Scholar] [CrossRef]
- Li, M.; Yang, F.; Luo, Y.; Peng, G. An intra-cavity absorption fiber gas sensor based on performance enhanced techniques. J. Teraheartz Sci. Electron. Inf. Technol. 2015, 13, 16674–16686. [Google Scholar]
- Goldman, A.; Rahinov, I.; Cheskis, S.; Löhden, B.; Wexler, S.; Sengstock, K.; Baev, V.M. Fiber laser intracavity absorption spectroscopy of ammonia and hydrogen cyanide in low pressure hydrocarbon flames. Chem. Phys. Lett. 2006, 423, 147–151. [Google Scholar]
- Yang, X.; Duan, L.; Zhang, H.; Lu, Y.; Wang, G.; Yao, J. Highly sensitive dual-wavelength fiber ring laser sensor for the low concentration gas detection. Sens. Actuators B Chem. 2019, 296, 126637. [Google Scholar] [CrossRef]
- Wang, S.; Liu, S.; Ni, W.; Wu, S.; Lu, P. Dual-wavelength highly-sensitive refractive index sensor. Opt. Express 2017, 25, 14389–14396. [Google Scholar]
- Zhang, Q.; Chang, J.; Cong, Z.; Feng, Y.; Wang, Z.; Sun, J. Scanned-wavelength intra-cavity QEPAS sensor with injection seeding technique for C2H2 detection. Opt. Laser Technol. 2019, 120, 105751. [Google Scholar] [CrossRef]
- Zhao, Y.; Jin, W.; Lin, Y.; Yang, F.; Ho, H.L. All-fiber gas sensor with intracavity photothermal spectroscopy. Opt. Lett. 2018, 43, 1566–1569. [Google Scholar]
- Shi, J.; Wang, Y.; Xu, D.; Su, G.; Zhang, H.; Feng, J.; Yan, C.; Fu, S.; Yao, J. Remote magnetic field sensor based on intracavity absorption of evanescent field. IEEE Photonics J. 2016, 8, 1–7. [Google Scholar]
- Duan, L.; Zhang, H.; Shi, W.; Yang, X.; Lu, Y.; Yao, J. High-resolution temperature sensor based on single-frequency ring fiber laser via optical heterodyne spectroscopy technology. Sensors 2018, 18, 3245. [Google Scholar]
- Oe, R.; Taue, S.; Minamikawa, T.; Nagai, K.; Shibuya, K.; Mizuno, T.; Fukano, H. Refractive-index-sensing optical comb based on photonic radio-frequency conversion with intracavity multi-mode interference fiber sensor. Opt. Express 2018, 26, 19694–19706. [Google Scholar] [CrossRef]
- Liu, K.; Jing, W.; Peng, G.; Zhang, J.; Wang, Y.; Liu, T.; Jia, D.; Zhang, H.; Zhang, Y. Wavelength sweep of intracavity fiber laser for low concentration gas detection. IEEE Photonics Technol. Lett. 2008, 20, 1515–1517. [Google Scholar] [CrossRef] [Green Version]
- Zhang, Y.; Jin, W.; Yu, H.B.; Zhang, M.; Liao, Y.B.; Ho, H.L.; Demokan, M.S.; Stewart, G.; Culshaw, B.; Li, Y.H. Novel intracavity sensing network based on mode-locked fiber laser. IEEE Photonics Technol. Lett. 2002, 14, 1336–1338. [Google Scholar]
- Zhang, H.; Lu, Y.; Duan, L.; Zhao, Z.; Shi, W.; Yao, J. Intracavity absorption multiplexed sensor network based on dense wavelength division multiplexing filter. Opt. Express 2014, 22, 24545–24550. [Google Scholar]
- Zhang, H.; Duan, L.; Shi, W.; Sheng, Q.; Lu, Y.; Yao, J. Dual-point automatic switching intracavity-absorption photonic crystal fiber gas sensor based on mode competition. Sens. Actuators B Chem. 2017, 247, 124–128. [Google Scholar] [CrossRef]
- Zhang, Y.; Zhang, M.; Jin, W.; Ho, H.L.; Demokan, M.S.; Fang, X.H.; Stewart, G. Investigation of erbium-doped fiber laser intra-cavity absorption sensor for gas detection. Opt. Commun. 2004, 234, 435–441. [Google Scholar] [CrossRef]
- Liu, K.; Liu, T.G.; Peng, G.D.; Jiang, J.F.; Zhang, H.X.; Jia, D.G.; Wang, Y.; Jing, W.C.; Zhang, Y.M. Theoretical investigation of an optical fiber amplifier loop for intra-cavity and ring-down cavity gas sensing. Sens. Actuators B Chem. 2010, 146, 116–121. [Google Scholar]
- Li, M.; Dai, J.; Liu, K.; Peng, G.D. Performance analysis and design optimization of an intracavity absorption gas sensor based on fiber ring laser. J. Lightwave Technol. 2011, 29, 3748–3756. [Google Scholar]
- Sharma, R.; Raghuwanshi, S.K. Modeling and analysis of overmodulation in erbium-doped fiber amplifiers including amplified spontaneous emission. Opt. Eng. 2017, 56, 026105. [Google Scholar]
- Phung, Q.B.; Le, H.S. Gain and noise in erbium-doped fiber amplifier (EDFA)-A rate equation approach (REA). Commun. Phys. 2004, 14, 1–6. [Google Scholar]
- Desurvire, E.; Simpson, J.R. Amplification of spontaneous emission in erbium-doped single-mode fibers. J. Lightwave Technol. 1989, 7, 835–845. [Google Scholar] [CrossRef]
- Giles, C.R.; Desurvire, E. Propagation of signal and noise in concatenated erbium-doped fiber optical amplifiers. J. Lightwave Technol. 1991, 9, 147–154. [Google Scholar] [CrossRef]
- Barnard, C.; Myslinski, P.; Chrostowski, J.; Kavehrad, M. Analytical model for rare-earth-doped fiber amplifiers and lasers. IEEE J. Quantum Electron. 1994, 30, 1817–1830. [Google Scholar] [CrossRef]
- Ko, K.Y.; Demokan, M.S.; Tam, H.Y. Transient analysis of erbium-doped fiber amplifiers. IEEE Photonics Technol. Lett. 1994, 6, 1436–1438. [Google Scholar] [CrossRef]
- Digonnet, M.J. Rare-Earth-Doped Fiber Lasers and Amplifiers, Revised and Expanded; CRC Press: Boca Raton, FL, USA, 2001. [Google Scholar]
- HITRAN. Molecules: Launch Simulation. Available online: http://hitran.iao.ru/molecule (accessed on 12 March 2020).


| Parameter | Value | Parameter | Value |
|---|---|---|---|
| λp | 980 nm | τ21 | 10 ms [21] |
| λs | 1532.83 nm | τ32 | 1 ns [21] |
| λi | 1525−1650 nm | Γp | 0.85 |
| Δλ | 0.01 nm | Γs | 0.85 |
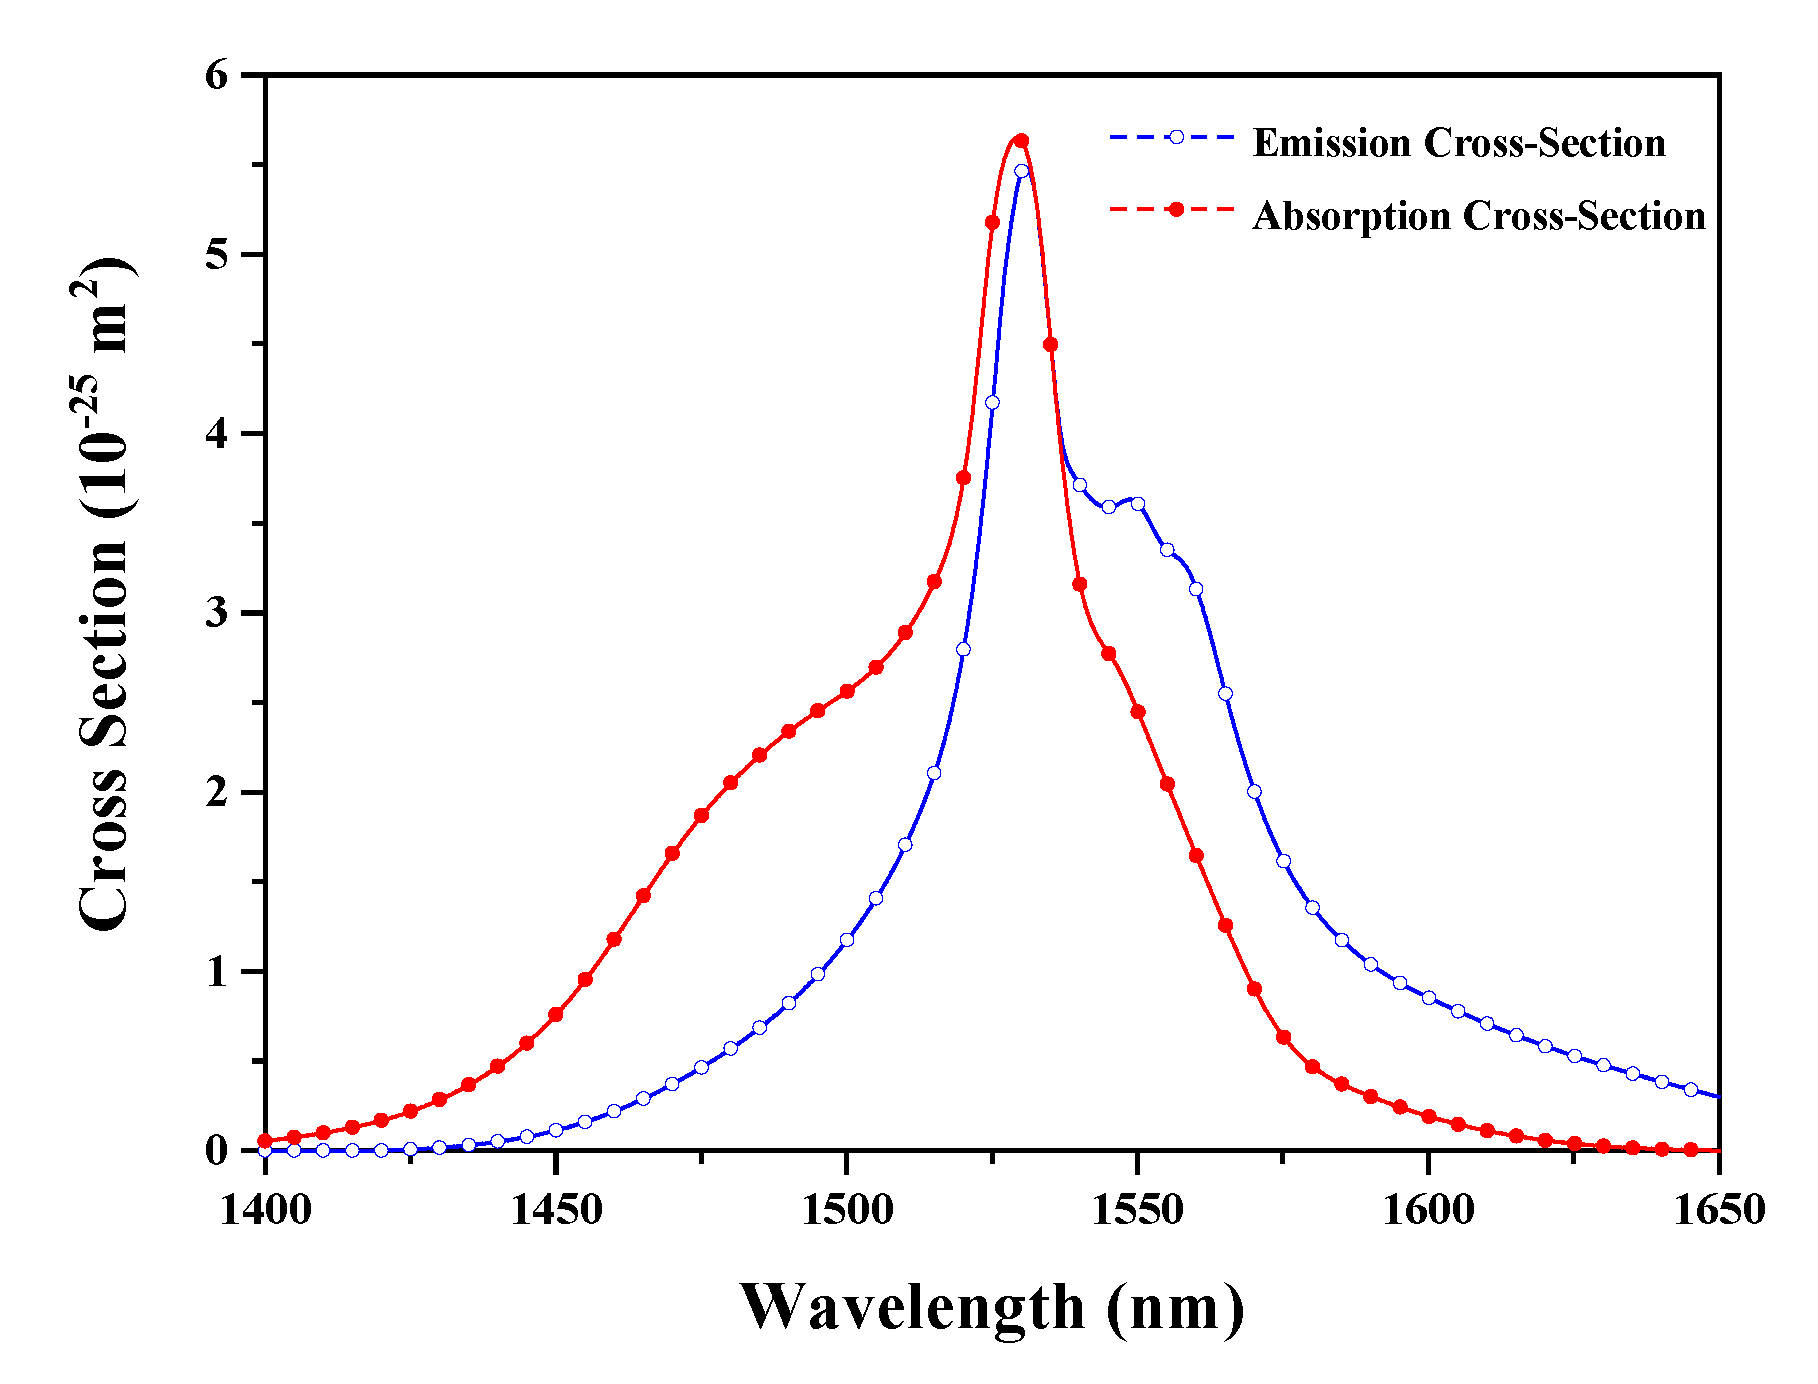
| σpa | 1.86 × 10⁻²⁵ m2 | σsa | Figure 3 |
| σpe | 0.42 × 10⁻²⁵ m2 | σse | Figure 3 |
| Nt | 5.4 × 1024 m3 | αa | 0.1 × 10⁻¹ m−1 |
| A | 7.1 × 10⁻¹¹ m2 | αp | 3 × 10⁻¹ m−1 |
| h | 6.626 × 10⁻³⁴ J·s | αs | 3 × 10⁻¹ m−1 |
| c | 3 × 10⁸ m/s | R | 0.01 |
© 2020 by the authors. Licensee MDPI, Basel, Switzerland. This article is an open access article distributed under the terms and conditions of the Creative Commons Attribution (CC BY) license (http://creativecommons.org/licenses/by/4.0/).
Share and Cite
Zhang, H.; Duan, L.; Zhao, Y.; Xue, L.; Jiang, P.; Liu, J.; Bai, Y.; Shi, W.; Yao, J. Theoretical Modeling of Multi-Channel Intracavity Spectroscopy Technology Based on Mode Competition in Er-Doped Fiber Ring Laser Cavity. Sensors 2020, 20, 2539. https://doi.org/10.3390/s20092539
Zhang H, Duan L, Zhao Y, Xue L, Jiang P, Liu J, Bai Y, Shi W, Yao J. Theoretical Modeling of Multi-Channel Intracavity Spectroscopy Technology Based on Mode Competition in Er-Doped Fiber Ring Laser Cavity. Sensors. 2020; 20(9):2539. https://doi.org/10.3390/s20092539
Chicago/Turabian StyleZhang, Haiwei, Liangcheng Duan, Yan Zhao, Lifang Xue, Pengbo Jiang, Jun Liu, Yangbo Bai, Wei Shi, and Jianquan Yao. 2020. "Theoretical Modeling of Multi-Channel Intracavity Spectroscopy Technology Based on Mode Competition in Er-Doped Fiber Ring Laser Cavity" Sensors 20, no. 9: 2539. https://doi.org/10.3390/s20092539