A Generic Design of Driver Drowsiness and Stress Recognition Using MOGA Optimized Deep MKL-SVM


1
Department of Technology, School of Science and Technology, The Open University of Hong Kong, Hong Kong
2
School of Business & Economics, Deree College—The American College of Greece, 153-42 Athens, Greece
3
Effat College of Engineering, Effat University, Jeddah P.O. Box 34689, Saudi Arabia
4
Hubei Key Laboratory of Inland Shipping Technology, School of Navigation, Wuhan University of Technology, Wuhan 430063, China
*
Author to whom correspondence should be addressed.
Sensors 2020, 20(5), 1474; https://doi.org/10.3390/s20051474
Submission received: 27 December 2019
/
Revised: 25 February 2020
/
Accepted: 4 March 2020
/
Published: 7 March 2020
(This article belongs to the Special Issue Internet of Things and Artificial Intelligence in Transportation Revolution)
Abstract
:Driver drowsiness and stress are major causes of traffic deaths and injuries, which ultimately wreak havoc on world economic loss. Researchers are in full swing to develop various algorithms for both drowsiness and stress recognition. In contrast to existing works, this paper proposes a generic model using multiple-objective genetic algorithm optimized deep multiple kernel learning support vector machine that is capable to recognize both driver drowsiness and stress. This algorithm simplifies the research formulations and model complexity that one model fits two applications. Results reveal that the proposed algorithm achieves an average sensitivity of 99%, specificity of 98.3% and area under the receiver operating characteristic curve (AUC) of 97.1% for driver drowsiness recognition. For driver stress recognition, the best performance is yielded with average sensitivity of 98.7%, specificity of 98.4% and AUC of 96.9%. Analysis also indicates that the proposed algorithm using multiple-objective genetic algorithm has better performance compared to the grid search method. Multiple kernel learning enhances the performance significantly compared to single typical kernel. Compared with existing works, the proposed algorithm not only achieves higher accuracy but also addressing the typical issues of dataset in simulated environment, no cross-validation and unreliable measurement stability of input signals.
1. Introduction and Literature Review
The World Health Organization (WHO) has reported that the annual road traffic deaths and injuries remain unacceptably high as 1.35 million and 50 million respectively [1]. It has highlighted the road traffic is the 8th leading cause of death for people of all ages. More important, it ranks number one when it comes to the age group of 5–29 years old, which can wreak havoc on economic and social development. To be transformed into monetary measure, it accounts for 3% loss (equivalent to 2400 billion USD) in world gross domestic product (GDP). Injuries include minor cuts, whiplash, bruises to broken limbs, paralysis and spinal injuries. The report from the American Automobile Association (AAA) concluded that the poor driving behaviors leads to over 55% of fatal crashes [2]. With the ever-growing number of cars, the leading cause of death will soar from the 9th to the 7th position by 2030 if no action and prevention are carried out. In this paper, the issues of driver drowsiness and stress will be addressed.
Driver drowsiness is about the sleepiness of drivers that is an undesired condition in real-world driving. Surveys revealed that more than half of adult drivers felt sleepy while driving and even more severe that about 30% of them fell asleep [3]. This high prevalence can further estimate that drivers could experience accidents (affect or being influenced attributable to drowsy driving). It is worth mentioning that driver drowsiness is differed from driver fatigue [4]. Drivers drive unconsciously in the former condition but are with a conscious status in latter condition. In reality, people are usually fatigued in today’s fast paced world.
Stress is body’s way to react any kind of threat, challenge and demand. Research has revealed that stress has played a crucial role in adapting to driving and making decision [5]. The primary sources for driver stress are congestion and adverse driving condition as well as time pressure [6]. The stress can lead to poor and dangerous driving behaviors, for instance, flashing high beams, eliciting anger in drivers, road rage and aggressive driving, which are major causes of road traffic accidents [7]. Various recent studies have been carried out on the investigation between psychological factors and driving behaviors. In [8], results revealed that anger leads to stress, which is reflecting in the form of aggressive and negative cognitive driving behavior. On the other hand, research argued that risky drivers generally exhibited more antisocial and substance misuse, reward sensitive personality features and sensation seeking [9]. In addition, traffic penalties reported by public transport drivers are preceded by individual factors, personality and work-related when combined with driving anger. It may enhance negative results on traffic sanctions given they are preceded by risky road behaviors and affect overall road safety [10].
Repeated exposure of stressful conditions affects drivers’ daily life and drivers have higher risks in suffering from stress-related health problems, for instance, accelerated aging [11], depression and anxiety [12], type 2 diabetes [13], asthma [14] and cardiovascular diseases [15]. These have indicated that driver stress can lead to long-term health issues.
1.1. Literature Review
Various research works have been carried out in driver drowsiness and driver fatigue detection. We believe that this paper is the first work that fully considers a generic model that can apply to recognize both driver drowsiness and stress. In this subsection, the literature review is divided into two parts, which firstly present the latest works on driver drowsiness recognition.
1.1.1. Existing Works of Driver Drowsiness Recognition
Typical algorithms for driver drowsiness recognition were based on three types of inputs: (i) the biometric-signal-based approach [16,17,18,19]; (ii) the vehicle-based approach [20,21,22,23] and (iii) the image-based approach [24,25,26,27]. Approach (i) is intrusive whereas approaches (ii) and (iii) are non-intrusive.
The first approach is illustrated as follows. In [16], driver drowsiness recognition was based on the input of respiratory signal, which measurement requires the tracking of the displacements of the diaphragm, abdominal and rib cage. A threshold was derived by analyzing the respiratory rate variability of the training dataset. The first work to adopt the electrocardiogram (ECG) signal was presented in [17], which is differed from traditional works that relied on partial information of the ECG signal, R wave or heart rate variability (HRV). The feature vector was formulated by cross-correlation coefficient between ECG signals and the classification problem was modeled by support vector machine (SVM). Another biometric-signal-based approach includes the electroencephalogram (EEG) signal, examples can be referred to [18] and [19] for the SVM model and long short-term memory (LSTM) model respectively.
When it comes to the vehicle-based approach, a lightweight threshold-based algorithm was proposed to analyze the status of drivers, with the continuous input of steering wheel angle [20]. With the same input, multilevel ordered logit model was implemented [21]. Some works utilized more measurements as inputs for driver drowsiness recognition. For instance, in [22], besides the steering wheel angle, pedal input, vehicle speed and acceleration were selected as features for classification model based on the dynamic Bayesian network. The deviation from the current lane could also be a useful indicator of driver drowsiness, as verified using an exponentially weighted moving average [23].
The third approach is based on the images of drivers, specifically the images are retrieved from continual video frames recorded by an in-vehicle camera. The textual and landmark information of the drivers’ face were collected as inputs of the driver drowsiness recognition algorithm, implemented by the deep belief network [24]. Researchers in [25] constructed the features based on the detection of the face, eyes, nose and mouth of the drivers. A threshold was determined on the number of eye blinks per minute in order to deduce the percentage of drowsiness level. Mandal et al. proposed a fusion and reasoning method to measure the driver drowsiness, the following modules were included, head and shoulder detection, face detection based on the front view and oblique view analysis, eye detection based on Open Source Computer Vision Library (OpenCV) and Institute for Infocomm Research (I2R) as well as the eye openness estimation [26]. A multi-channel (3, 6 and 9 channels) second-order blind identification algorithm was proposed, which analyzed the yawn signals and eye blinks and yielded optimal thresholds for the drowsiness level [27].
1.1.2. Existing Works of Driver Stress Recognition
When it comes to driver stress recognition, there are less research publications compared to driver drowsiness recognition. However, both are of equal importance as life threatening sources. The approach for driver stress recognition was mainly based on the biometric-signal-based approach. Khattak et al. carried out statistical analysis (Wilcoxon Signed rank test, t-test and analysis of variance (ANOVA)) on the driver stress based on drivers’ HRV [28]. Electrodermal activity (EDA) skin potential response (SPR) is another typical input for the driver stress detection, which an example was shown along with adaptive filtering and spike detection techniques [29]. Skin conductance and EEG served as inputs of the driver stress condition, which were further explored by the incremental association Markov blanket algorithm for feature extraction [30]. The least square support vector machine (LS-SVM) was applied to construct the classifier. In [31], researchers discussed the feasibility of the employment of HRV and photoplethysmogram (PPG) signal for driver stress recognition through ensemble learning of k-nearest neighbor (kNN), decision tree (DT) and linear discriminant analysis (LDA). Sparse Bayesian learning (SBL) and principal component analysis (PCA) were adopted to find out the optimal feature vector from a galvanic skin response (GSR), HRV and respiration [32]. Two kernel-based methods SVM and extreme learning machine (ELM) were applied and evaluated with typical kernels, sigmoid, radial basis function (RBF) and linear kernel.
It is noted that there were a few discussions on driver stress recognition via other approaches like steering wheel angle [33], steering wheel angle and road shape [34] and speech signal [35]. Besides, there is a recent work that detected the driver’s status among normal, stress, fatigue and drowsiness [36]. However, it has been limited by assuming only one status. Differing from the authors work, we perform drowsiness and stress recognition in parallel to each other so that drivers will have multiple statuses, awake/drowsy and stress level.
1.2. Research Gaps and Motivation
Various methods have been proposed for driver drowsiness recognition [16,17,18,19,20,21,22,23,24,25,26,27] and driver stress recognition [28,29,30,31,32,33,34,35]. Nonetheless, there exist several challenges and limitations that require further research.
- There is no generic model for driver drowsiness and stress recognition, which is one model suits two applications. Existing studies considered the formulation separately and required the implementation of different models to serve two applications. This may increase the complexity of the recognition system as well as include more input signals.
- The study in [37] analyzed the measurement reliability of several signals, ECG, EEG and video recording on real-world driving conditions (highway, urban and turning). EEG and video recording may not be reliable input signals as only 85% and 59% of the time the acquired signals are with good signal quality. The severe signal distortion in the rest of the period could alter the validity of the foundation of the problem formulations, which could be considered as misleading input and thus output. Therefore, EEG and video-based approaches experience challenges in signal acquisition.
- There was limited utilization of a full ECG signal as signal input [17], which most of the existing works were focusing on HRV, which is a single point of an ECG signal. An in-depth analysis could be made on driver drowsiness and stress recognition via ECG signal.
- Generally, shallow learning was adopted in existing works, except the discussion of a deep belief network in [24] for driver drowsiness recognition. Since there is room for improvement of accuracy of the existing classifiers, applying and investigating the deep learning technique could benefit on the classification performance.
To address the aforementioned challenges, the following measures are introduced in this paper:
- A generic model is proposed for the recognition of both driver drowsiness and stress.
- The high measurement reliability ECG signal is adopted as the input signal.
- The complete ECG signal is employed so that more representative features can be included in the feature extraction process.
- The deep learning approach is selected to build the classifier. It is noted that there is a consideration of deep learning with small samples, which implies that typical deep neural network is not appropriate.
1.3. Research Contributions
The key contributions of this paper are summarized as follows.
- A generic model using the multiple-objective genetic algorithm (MOGA) optimized deep multiple kernel learning support vector machine (D-MKL-SVM) is proposed for the recognition of driver drowsiness and stress detection.
- The ECG signal is newly applied for driver stress recognition in which the idea of using the ECG signal as an input was proposed in [17] for driver drowsiness recognition. The identical input signal and model serving two applications, i.e., driver stress and drowsiness recognition could reduce the complexity of the system theoretically and practically.
- Deep support vector machine is employed, which takes the advantage in small samples problem.
- The proposed generic model achieves highest accuracy for both driver drowsiness recognition and driver stress recognition compared to existing works. It also addresses typical issues of existing works, which are input signals of poor measurement stability, performance evaluation without cross-validation and collecting data using the simulated environment.
2. Materials and Methodology
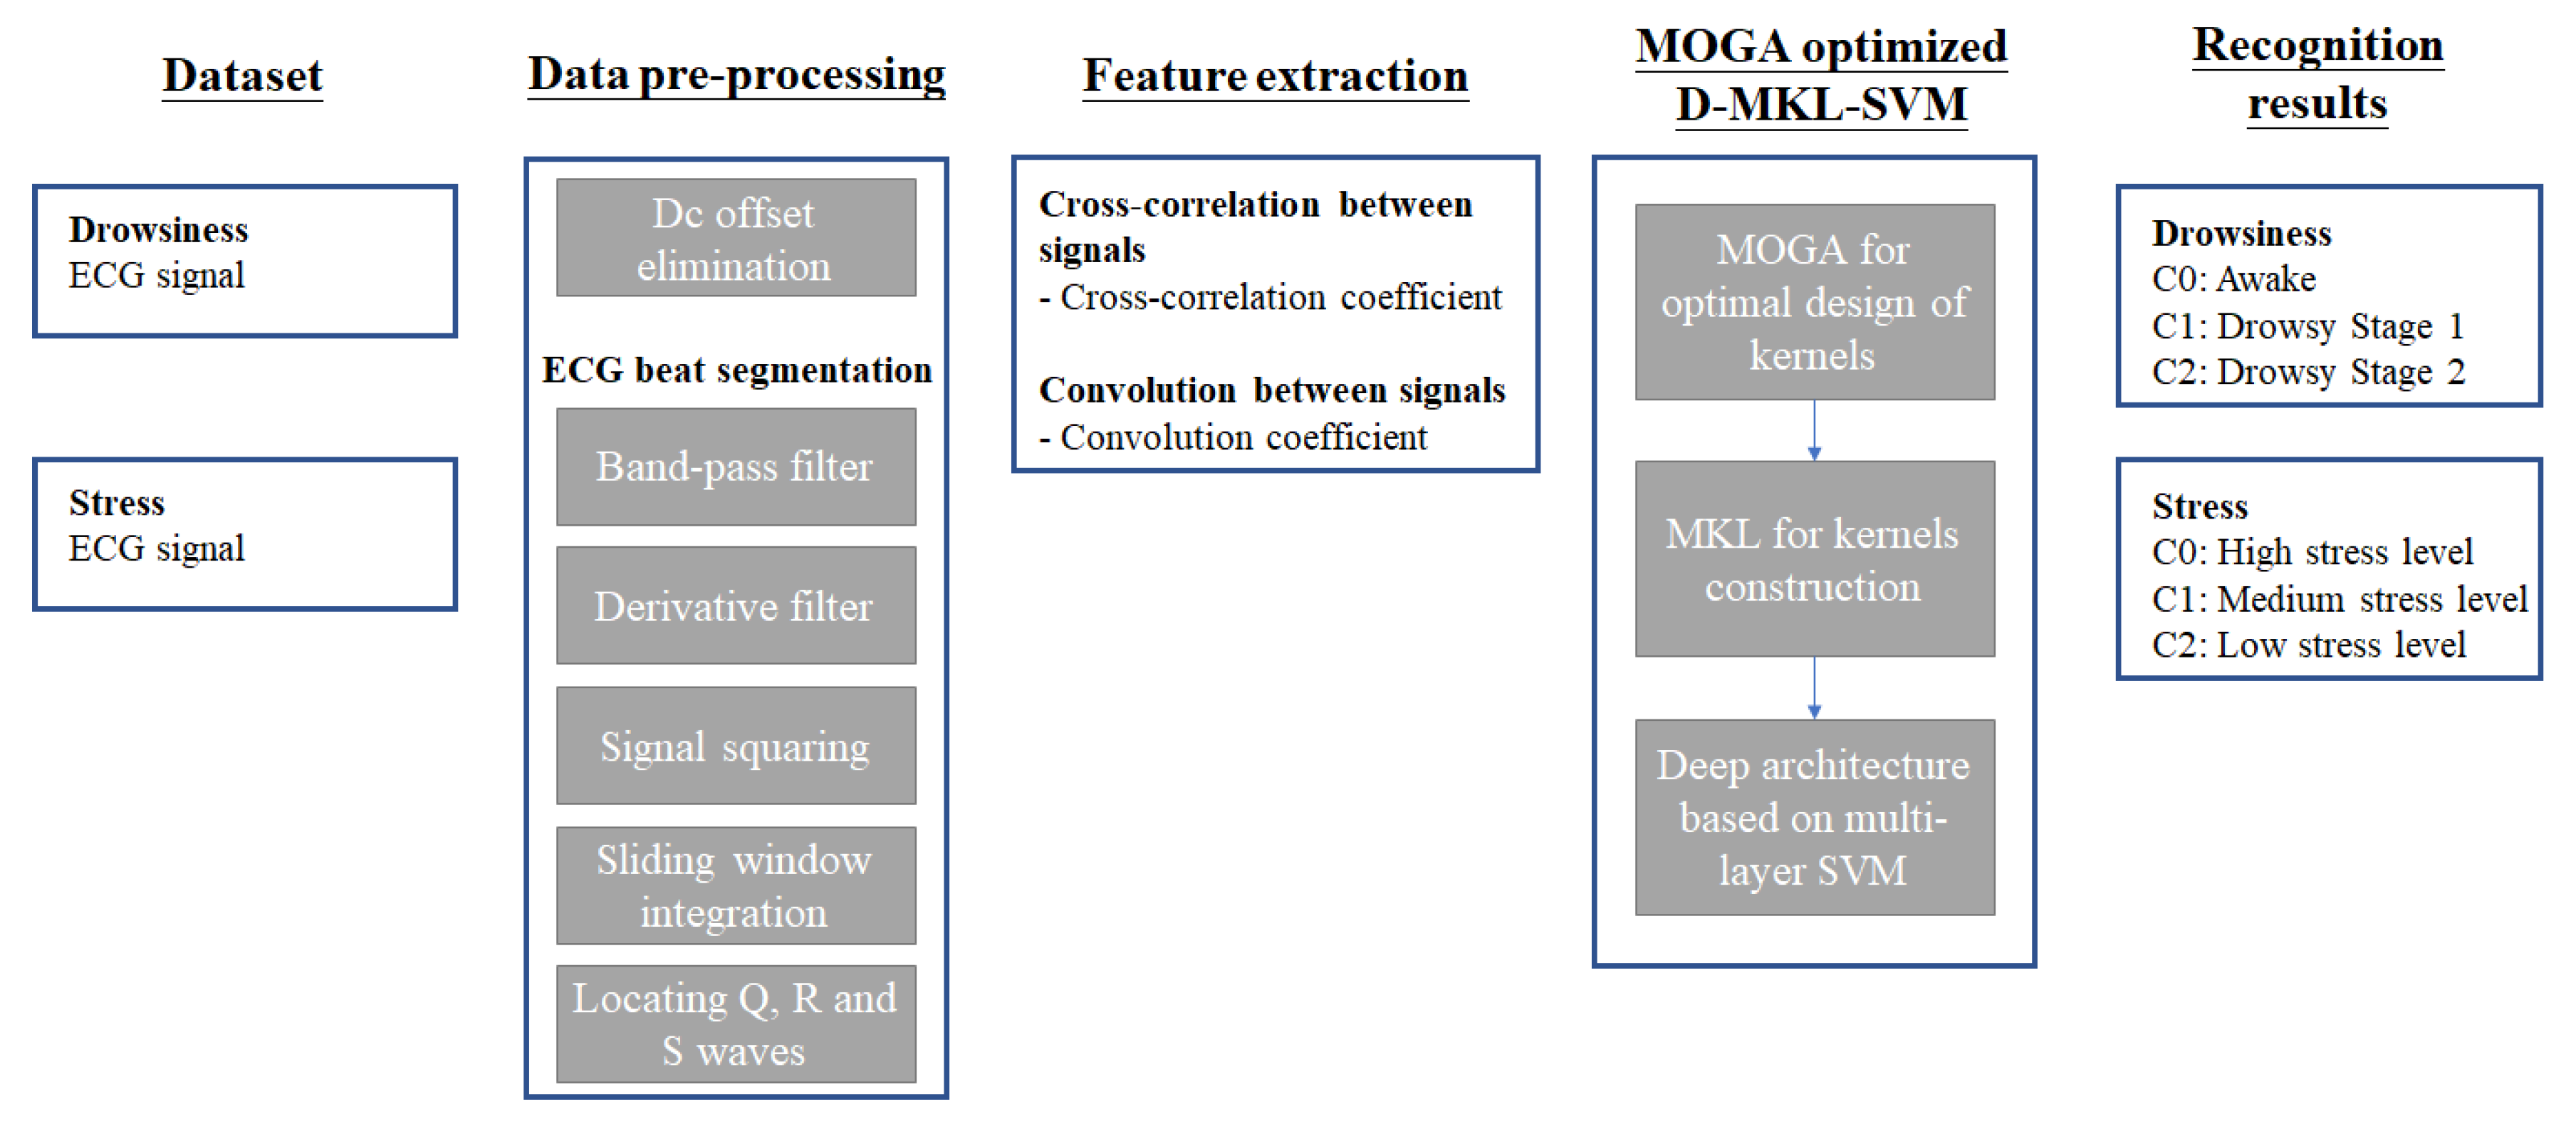
In this section, the dataset for driver drowsiness and stress data was firstly presented. It was followed by data pre-processing techniques as well as beat segmentation for the ECG signal. Afterwards, the proposed generic model using MOGA optimized D-MKL-SVM would be discussed.
2.1. Driver Drowsiness and Stress Dataset
The dataset for driver drowsiness and stress data was retrieved from publicly available databases: the Stress Recognition in Automobile Drivers Database [38,39] and the cyclic alternating pattern (CAP) Sleep Database [39,40]. The first database includes 18 records of real-world driving in Boston, USA, which the route was started from the first baseline period, to the first city, to the first highway, to the second highway, to the second city and ended with the second baseline period, which is summarized in Figure 1a. The experiment was conducted in mid-morning or mid-afternoon to avoid heavy road traffic. Each participant was at rest (eyes closed and sitting inside the vehicle) for 15 minutes before and after the driving. This period of data provides a baseline of the participant. The medium stress environment was set-up by highway driving between a toll preceding the off-ramp and at the on-ramp. The high stress environment was side street and main street driving environment with a winding, narrow lamp. The ECG signal of the drivers were continually monitored and collected. The duration of records ranged from 50 to 90 min. Three stress levels: (i) high stress level; (ii) medium stress level and (iii) low stress level; were defined. To avoid the effect of traffic condition, the experiment was carrying out at mid-morning or mid-afternoon.
The second database had 108 records from sleep centers. These records contained six categories of sleep stages (i) awake stage; (ii) sleep stage 1; (iii) sleep stage 2; (iv) sleep stage 3; (v) sleep stage 4 and (vi) rapid eye movement (REM) stage. Only sleep stage 1 and sleep stage 2 were selected, which is drowsy stage 1 and drowsy stage 2 because they were the immediate stages after awake stage, which the timeline is shown in Figure 1b.
2.2. Data Pre-Processing
The data pre-processing of the dataset aimed at segmenting ECG beat into individual samples. We have adopted an existing Tompkins’ method [41,42] as it achieves favorable performance in ECG beat segmentation. The major steps involved are dc offset elimination, digital band-pass filter, derivative filter, signal squaring, sliding window integration and locating Q, R and S waves. The detail was omitted as this was not the focus of this paper.
There are three classes in each of the driver drowsiness dataset and driver stress dataset. Their corresponding number of samples is tabulated in Table 1 after ECG beat segmentation. Totally, the driver drowsiness dataset and driver stress dataset contain 131,500 and 76,200 samples respectively.
2.3. Generic Model Using MOGA Optimized D-MKL-SVM
We have proposed a generic model using MOGA optimized D-MKL-SVM. Figure 2 shows the general flow of the model. Dataset and data pre-processing were discussed in Section 2.1 and Section 2.2 respectively. For feature extraction, the rationale is explained as follows. Previous works had revealed that HRV or R waves of ECG signals could serve as an important feature for driver drowsiness recognition. In this paper, the consideration was further extended to a full utilization of the ECG signal. Cross-correlation and convolution techniques were applied between every two samples (as defined in Section 2.2), which resulted in cross-correlation coefficients and convolution coefficient and serving as feature inputs of driver drowsiness and stress data.
Cross-correlation between two ECG signals X1 and X2 with length of N = 100 (zero-padding when len{X}<100) is given in Equation (1).
Convolution between X1 and X2 can be calculated by:
The model for driver drowsiness and stress recognition is built based on deep multi-layer SVM architecture. Generally, it consists of multiple hidden layers of SVM and an output layer of SVM. Compared to other deep learning architectures, multi-layer SVM takes several advantages like (i) the output layer SVM has strong regularization power to avoid over-fitting; (ii) able to handle problem of very large input vectors and few training samples and (iii) the design of kernel functions is more flexible.
The deep multi-layer SVM is structured as in Figure 3. Assume D, L, M and N are integers. Here the number of hidden layers had not been fixed, which is a general form of architecture. In this paper, experimental results indicate that the optimal setting for driver drowsiness and driver stress recognition is deep three-layered SVM and deep four-layered SVM respectively. In each of the SVM, the kernel function is customized by multiple kernel learning (MKL), which weighting factors where there is Nk kernels, are optimally designed by MOGA.
The kernel function of every SVM is designed by the combinations of typical kernels, linear kernel, RBF kernel, polynomial kernel and sigmoid kernel. The classifier can achieve better performance by taking the advantages from each kernel. Four kernel properties are applied for joining these kernels. Weighting factors are also introduced between kernels and optimally solved by MOGA. It is worth mentioning that, each SVM in multi-layer SVM architecture may result in different sets of optimal weighting factors. The kernel properties are presented as follows [43]. Assume there are two Mercer’s kernel and , is the resultant Mercer’s kernel. It is trivial to derive that joining properties between P1, P2, P3 and P4 in Equations (3)–(6) is also governed by Mercer’s theorem.
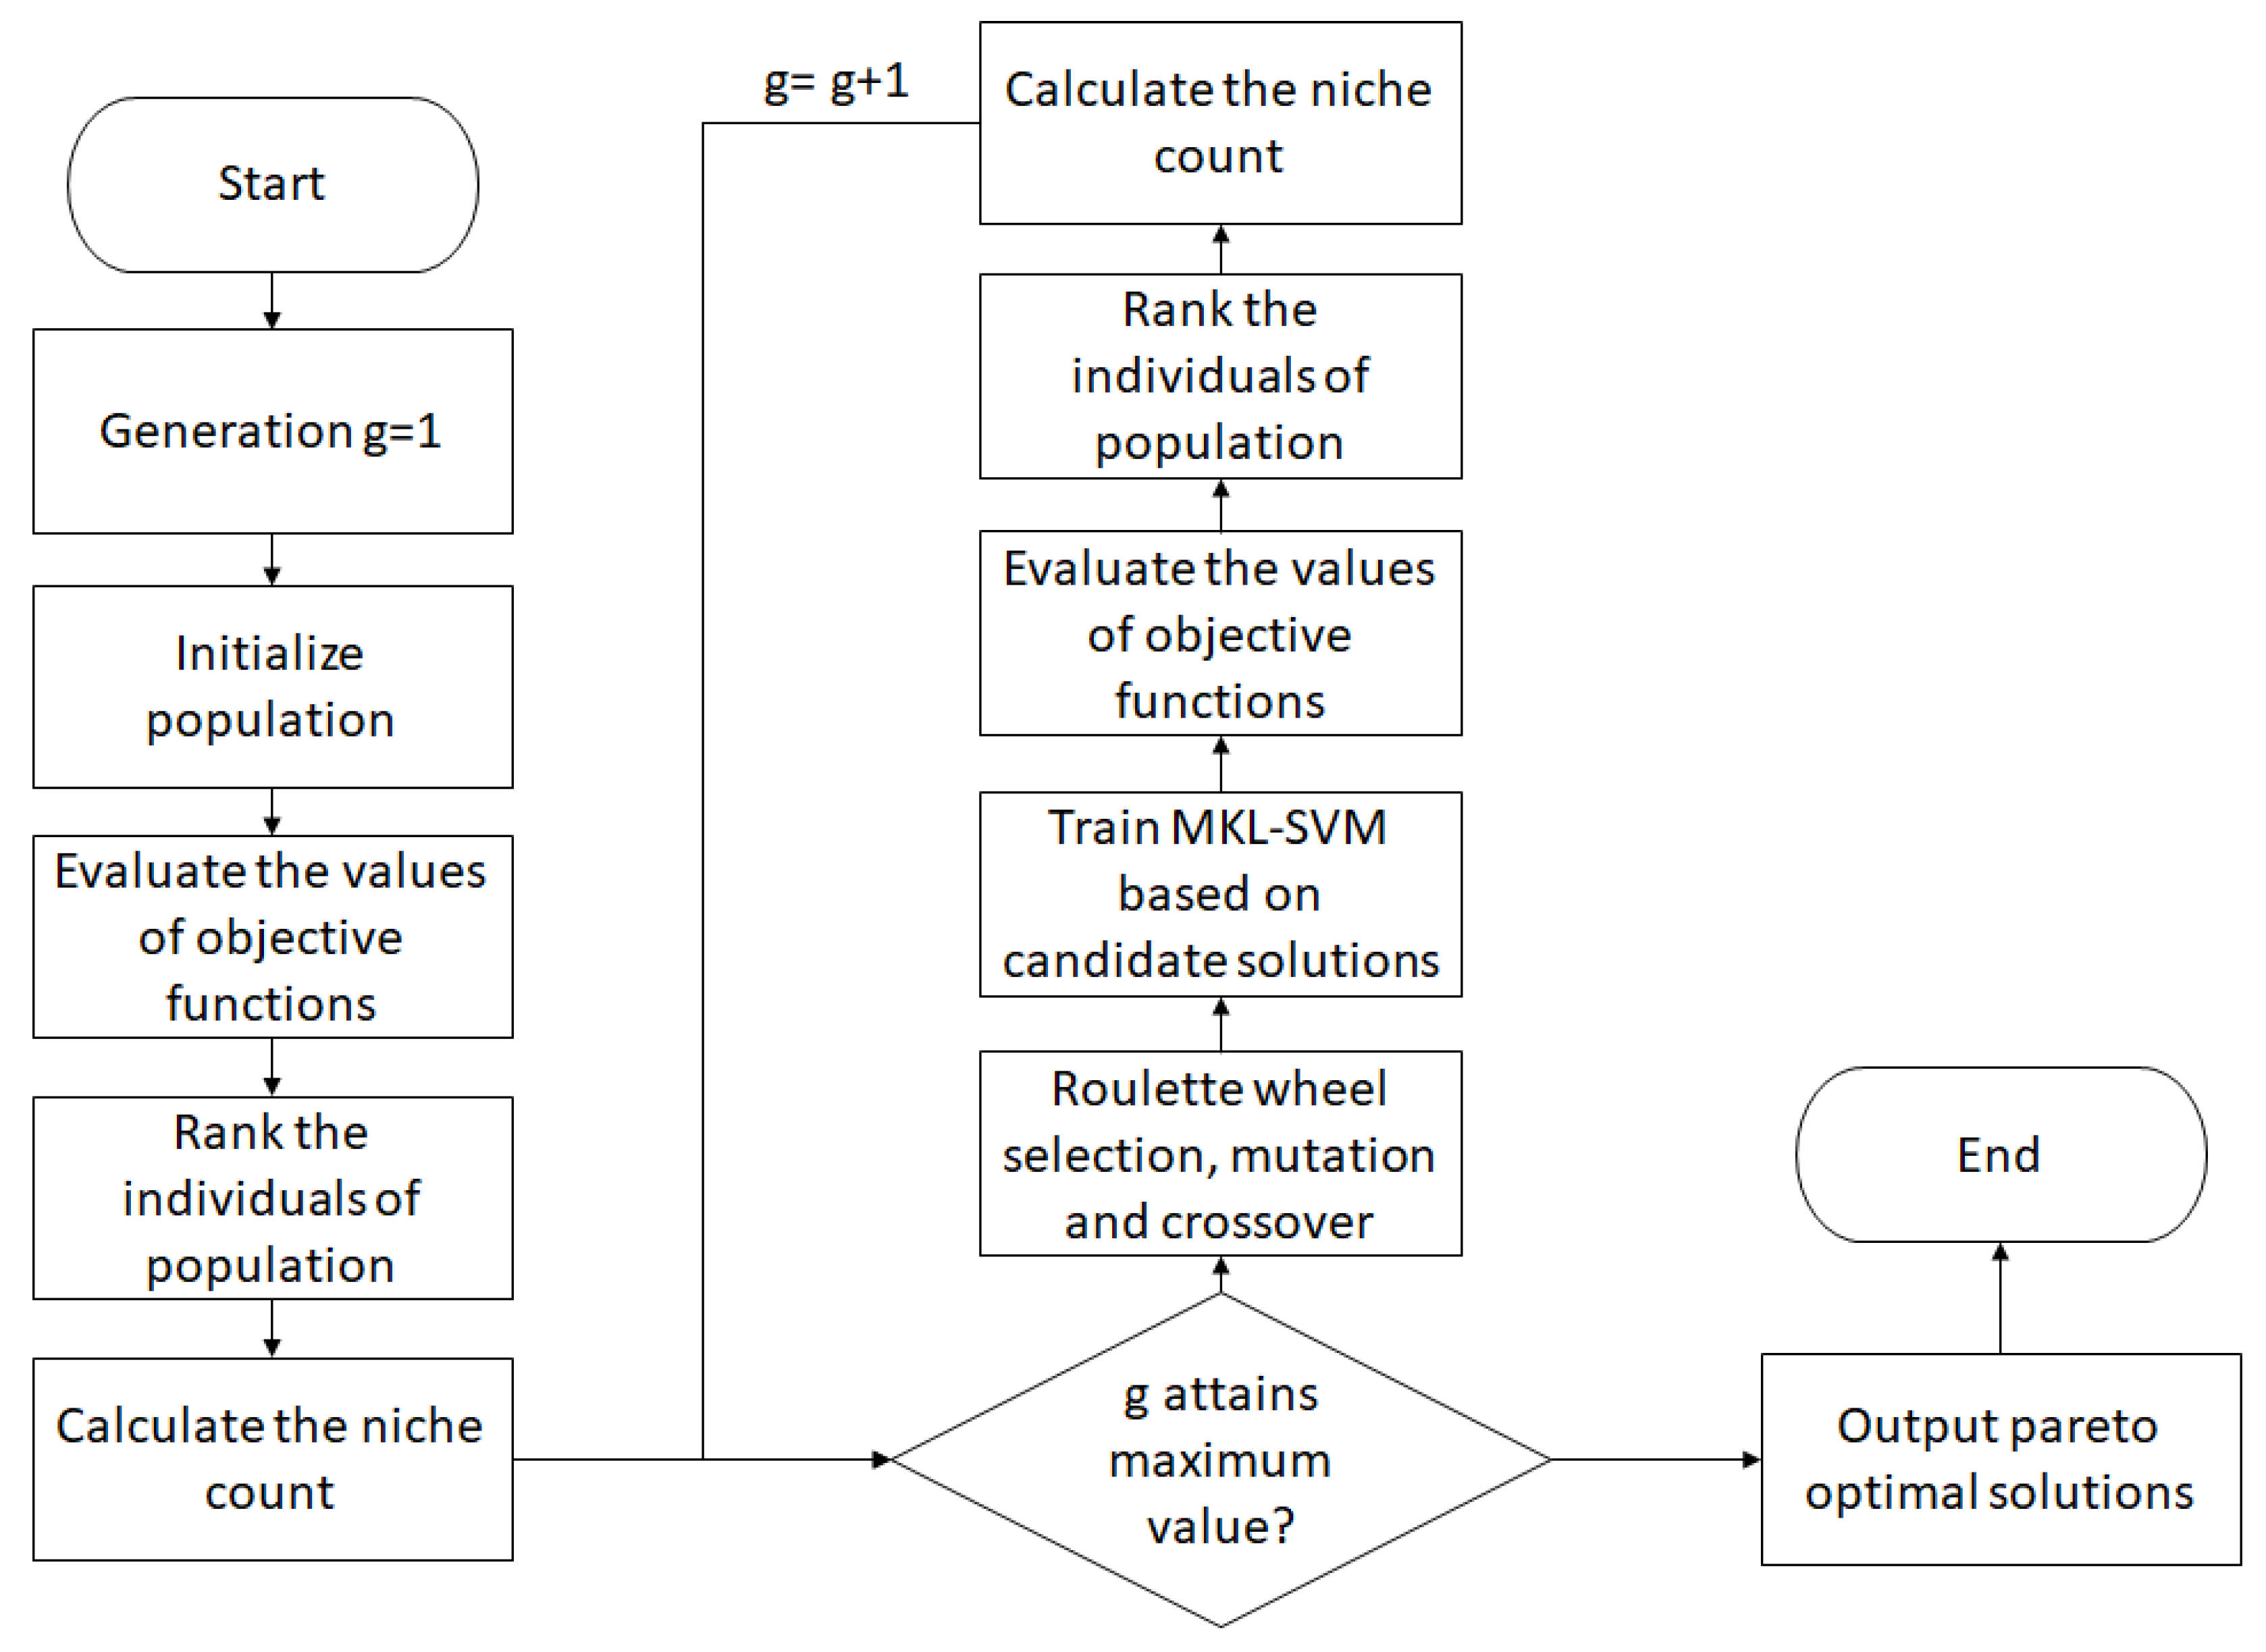
The optimal design of kernel functions for each SVM is considered as a multi-objective optimization (MOO) problem, which is solved by MOGA. MOO is practically important because daily life applications are generally with multi-objective and those objectives are conflicted with each other [44,45]. Traditional single objective optimization often normalizes and combines objectives into single objective; whereas MOO provides trade-off optimal solutions, and these compromise of the solutions and can increase the satisfaction of the decision-makers. In addition, MOO is characterized by different search spaces, multiple objectives and cardinalities-optimal solutions [46]. Here are quick review of definitions of important concepts: (i) Objective space is defined as the multidimensional space of the objective functions; (ii) Pareto optimal solution is defined as the optimal solution in the objective space and (iii) Pareto front is defined as the set of Pareto optimal solutions.
Attributed to multiple conflicting objectives, there exists a challenge in obtaining single optimal objective. As a result, the technique of domination was introduced. Consider a minimization problem of the N-objective, we say candidate solution a is dominated by another candidate solution b if and only if function values of a is partially less than b, its mathematical expression is:
Hence, non-dominated Pareto optimal solutions are desired. The flow of the MOGA for the optimal design of MKL for each SVM is shown in Figure 4. The key steps are summarized:
- Initialize the values of objective function as well as the population size.
- Based on the first step, compute the values of the objective function for all individuals within the population. This creates a list of values.
- Rank the individuals based on the list of values in Step (ii).
- For a defined population size, the nature of stochastic selection errors governs the convergency of the population, which depends on a small group of Pareto optimal solutions, rather than all optimal solutions.
- Lengthen the distance between Pareto optimal solutions along the axis of objective functions. This could increase the diversity of the population in order to lower the tendency of the convergence to small group solutions. Thus, the niche count is utilized and defined.
- Generate a new offspring.
- Evaluate the values of objective functions.
- Calculate ranks assignment and niche count repeatedly in the new offspring.
- MOGA can be terminated in two situations: (i) the output reaches the Pareto front; or (ii) generation (number of iterations) reaches the maximum number of generations.
The MOO for driver drowsiness and stress recognition is formulated as follows, with objectives O1, O2 and O3:
where O1 aims at maximizing the margin, defining as the Lagrange multiplier, as the output class and is the resultant Mercer’s kernel defined by applying kernel properties in Equations (3)–(6) on typical kernels: linear kernel, RBF kernel, polynomial kernel and sigmoid kernel. O2 maximizes the specificity, which is the ratio of true negative (TN) and number of negative samples (Nn). O3 maximizes the sensitivity, which is the ratio of true positive (TP) and number of positive samples (Np).
3. Analysis and Results
Various scenarios were analyzed to reveal the effectiveness of proposed generic model using MOGA optimized D-MKL-SVM for driver drowsiness and stress recognition. Four parts would be discussed in detail: (i) the performance of the proposed generic model MOGA optimized D-MKL-SVM was evaluated; (ii) study of the effectiveness of MOGA comparing with pure D-MKL-SVM; (iii) comparing the performance between MKL and single typical kernel and (iv) comparing the performance of proposed algorithm and related works.
3.1. Performance Evaluation of MOGA Optimized D-MKL-SVM
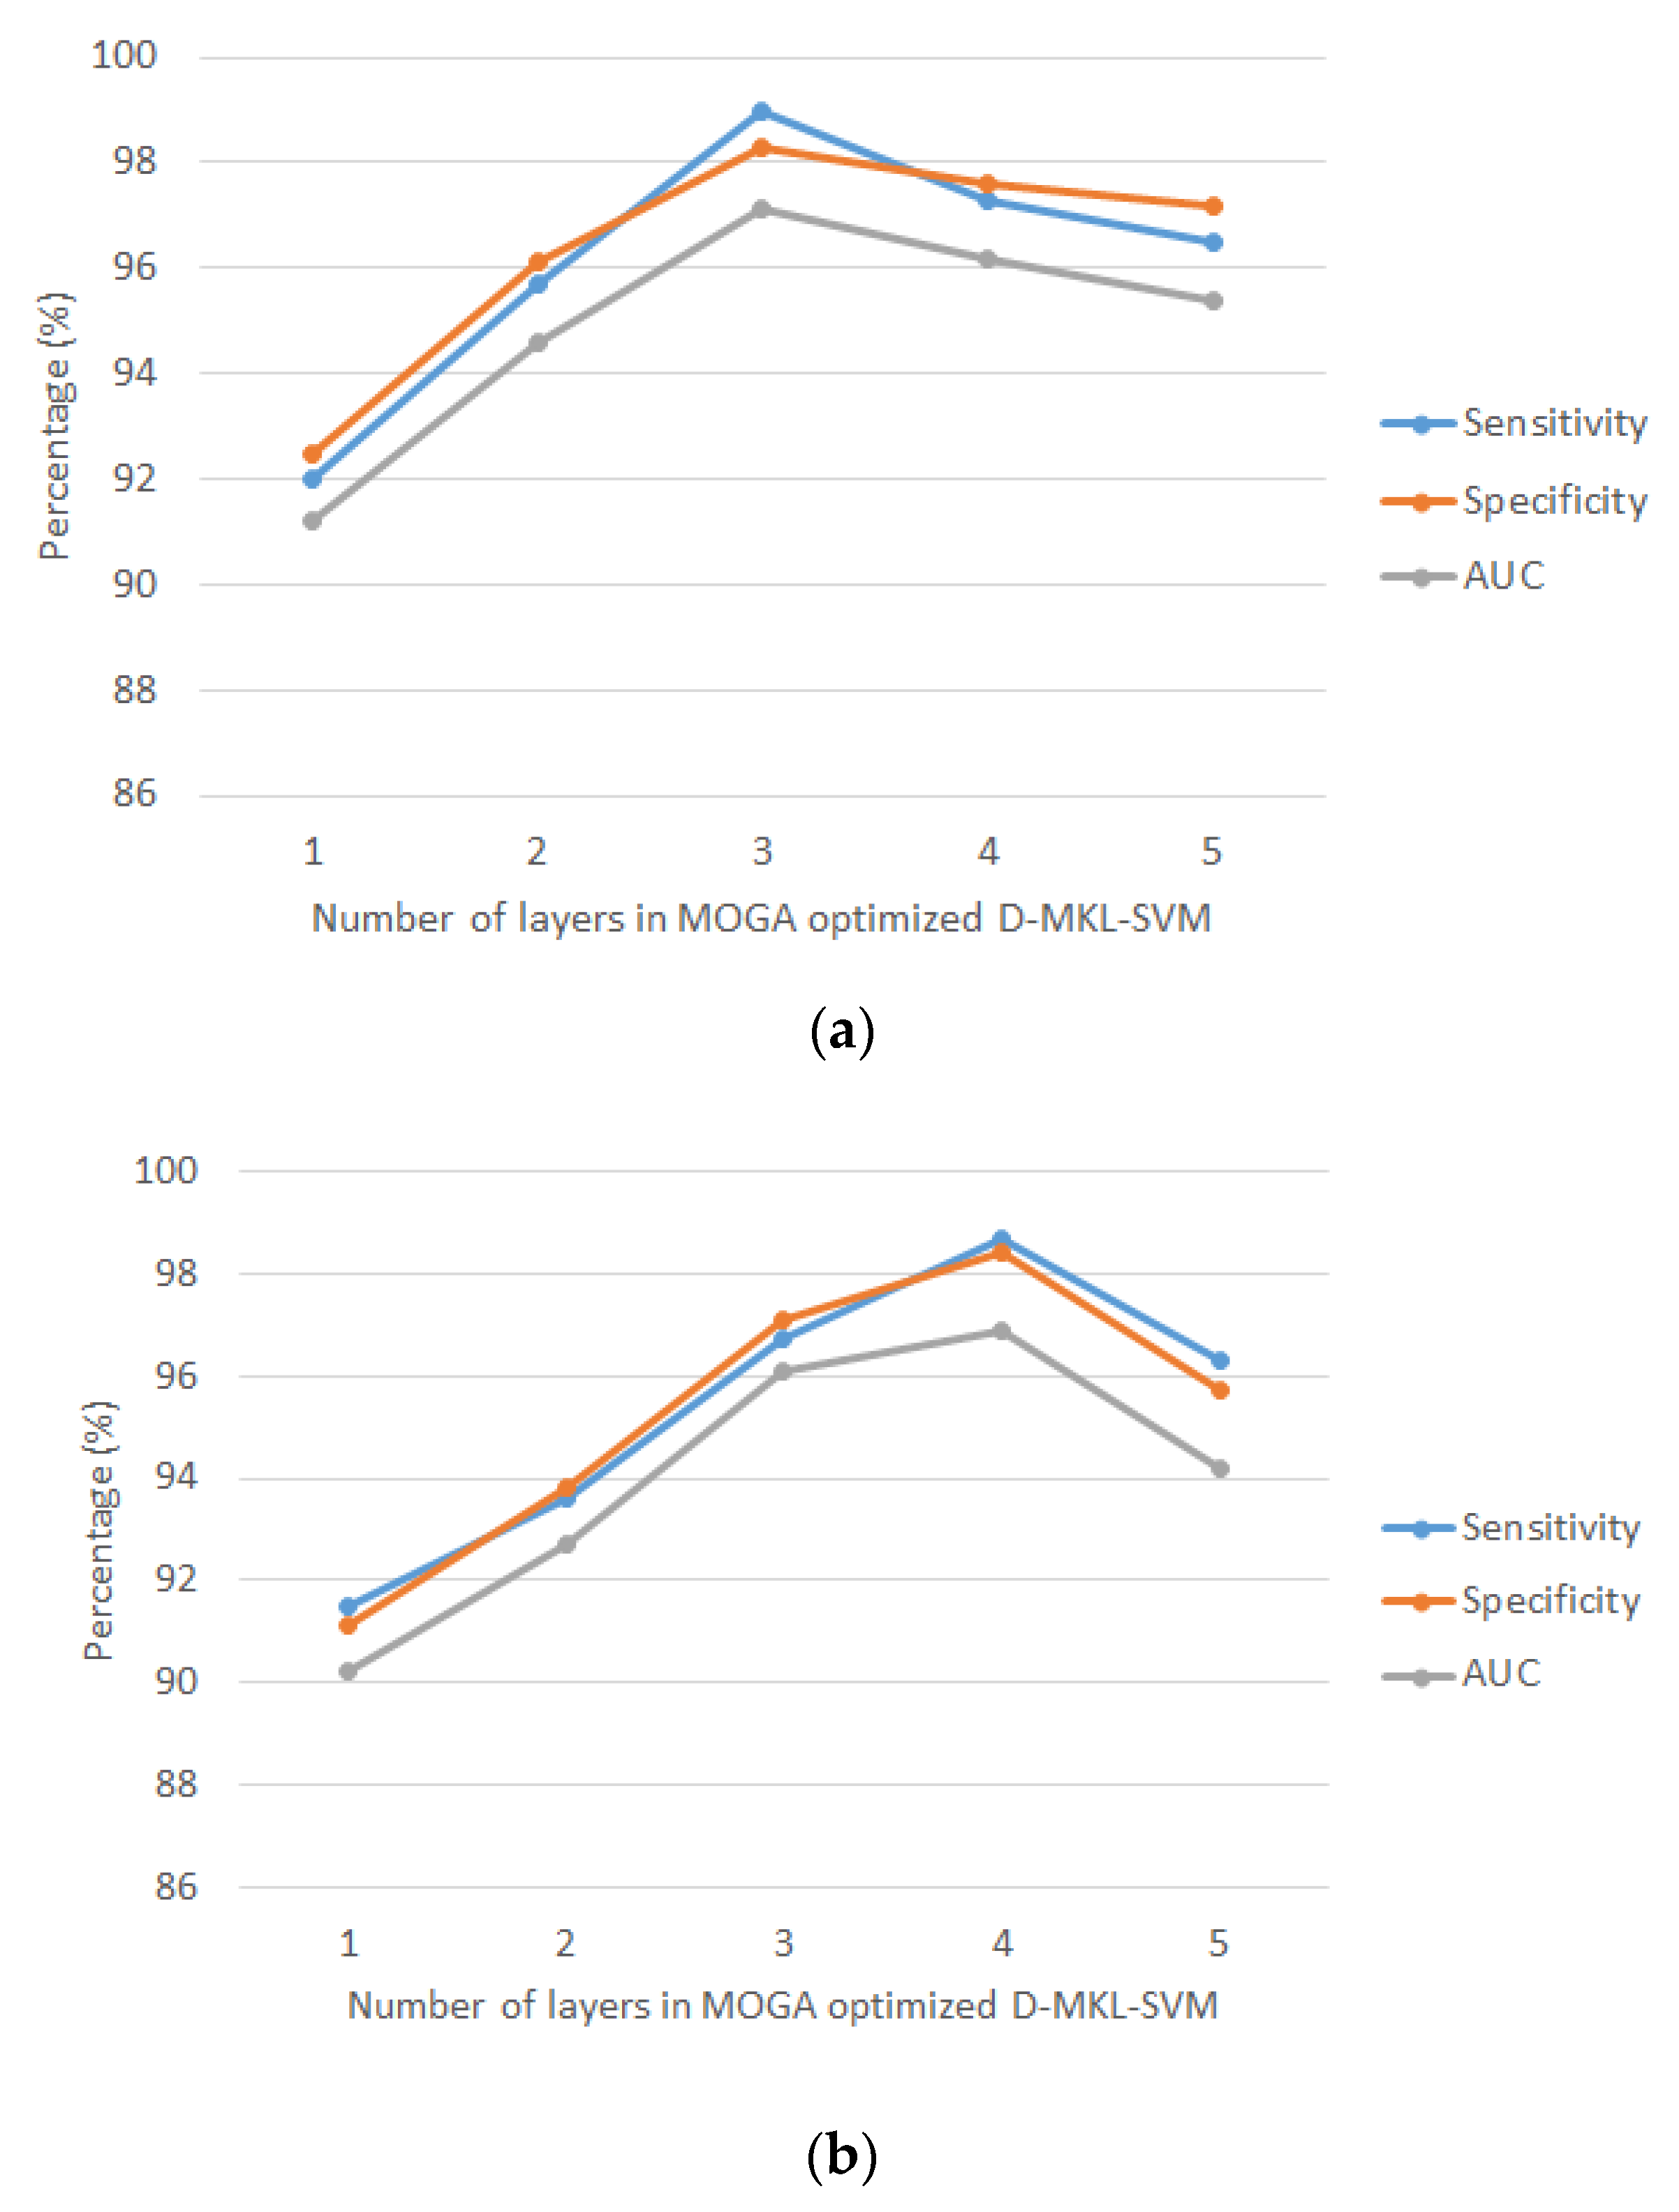
The evaluation criteria for driver drowsiness and stress recognition via the MOGA optimized D-MKL-SVM algorithm are the specificity, sensitivity and area under the receiver operating characteristic curve (AUC). Figure 5 shows the average of sensitivity, specificity and AUC (based on 10-fold cross-validation) of driver drowsiness and driver stress versus the number of layers in MOGA optimized D-MKL-SVM. As a trade-off to computation time, the number of layers was limited to 5.
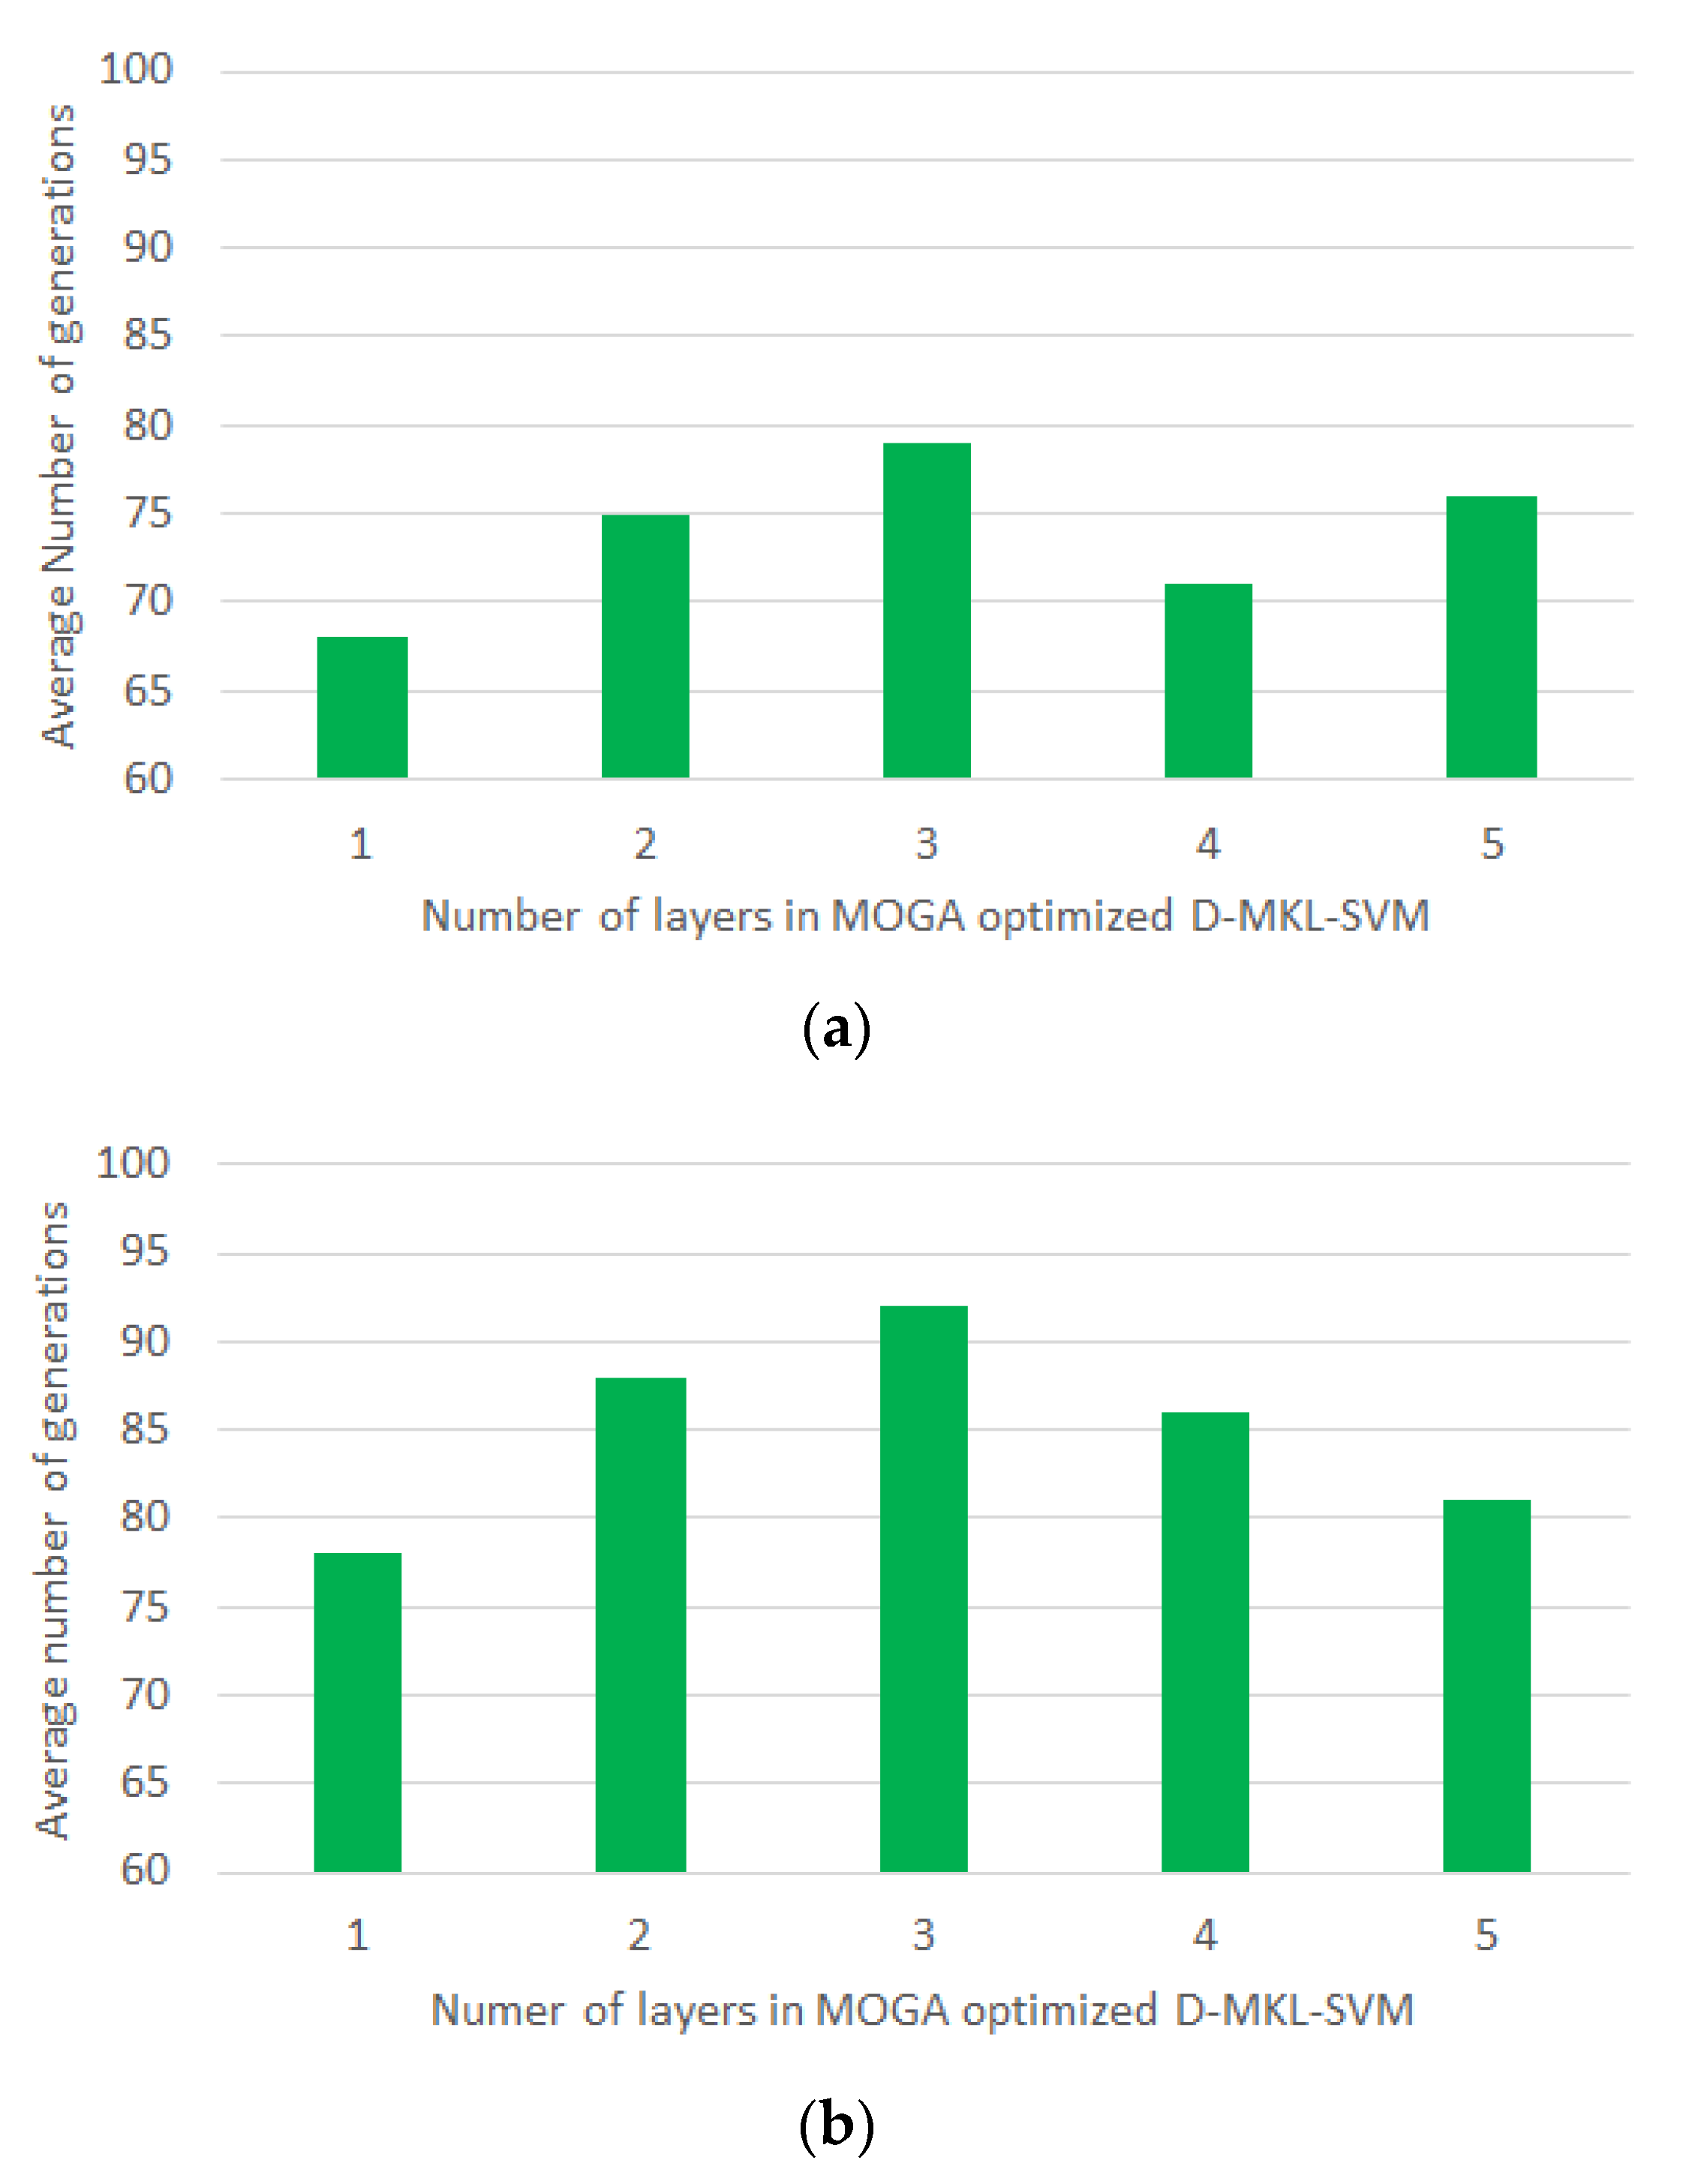
Results revealed that the proposed algorithm achieved favorable performance in average sensitivity, specificity and AUC in both driver drowsiness and stress recognition. For driver drowsiness recognition, the best performance was obtained using deep three-layered SVM, with average sensitivity of 99%, specificity of 98.3% and AUC of 97.1%. For driver stress recognition, the best performance was yielded when deep four-layered SVM was adopted, with average sensitivity of 98.7%, specificity of 98.4% and AUC of 96.9%. On the other hand, the average number of generations (rounded to nearest integer) in each layer for driver drowsiness and stress recognition is shown in Figure 6. As a result, the proposed approach was generic, which suited both applications.
3.2. Study on the Benefits of MOGA
For parameter selection, grid search is a typical method that would carry out a simple trial and error on the values parameters, given a range and certain step size between successive test values. The grid search method requires one to test all the scenarios with the step size that requires excessive computation power when it comes to a small step size and large difference in boundaries. To avoid excessive iterations, the step size for weighting factors using grid search was selected to be 0.05 and 0.1.
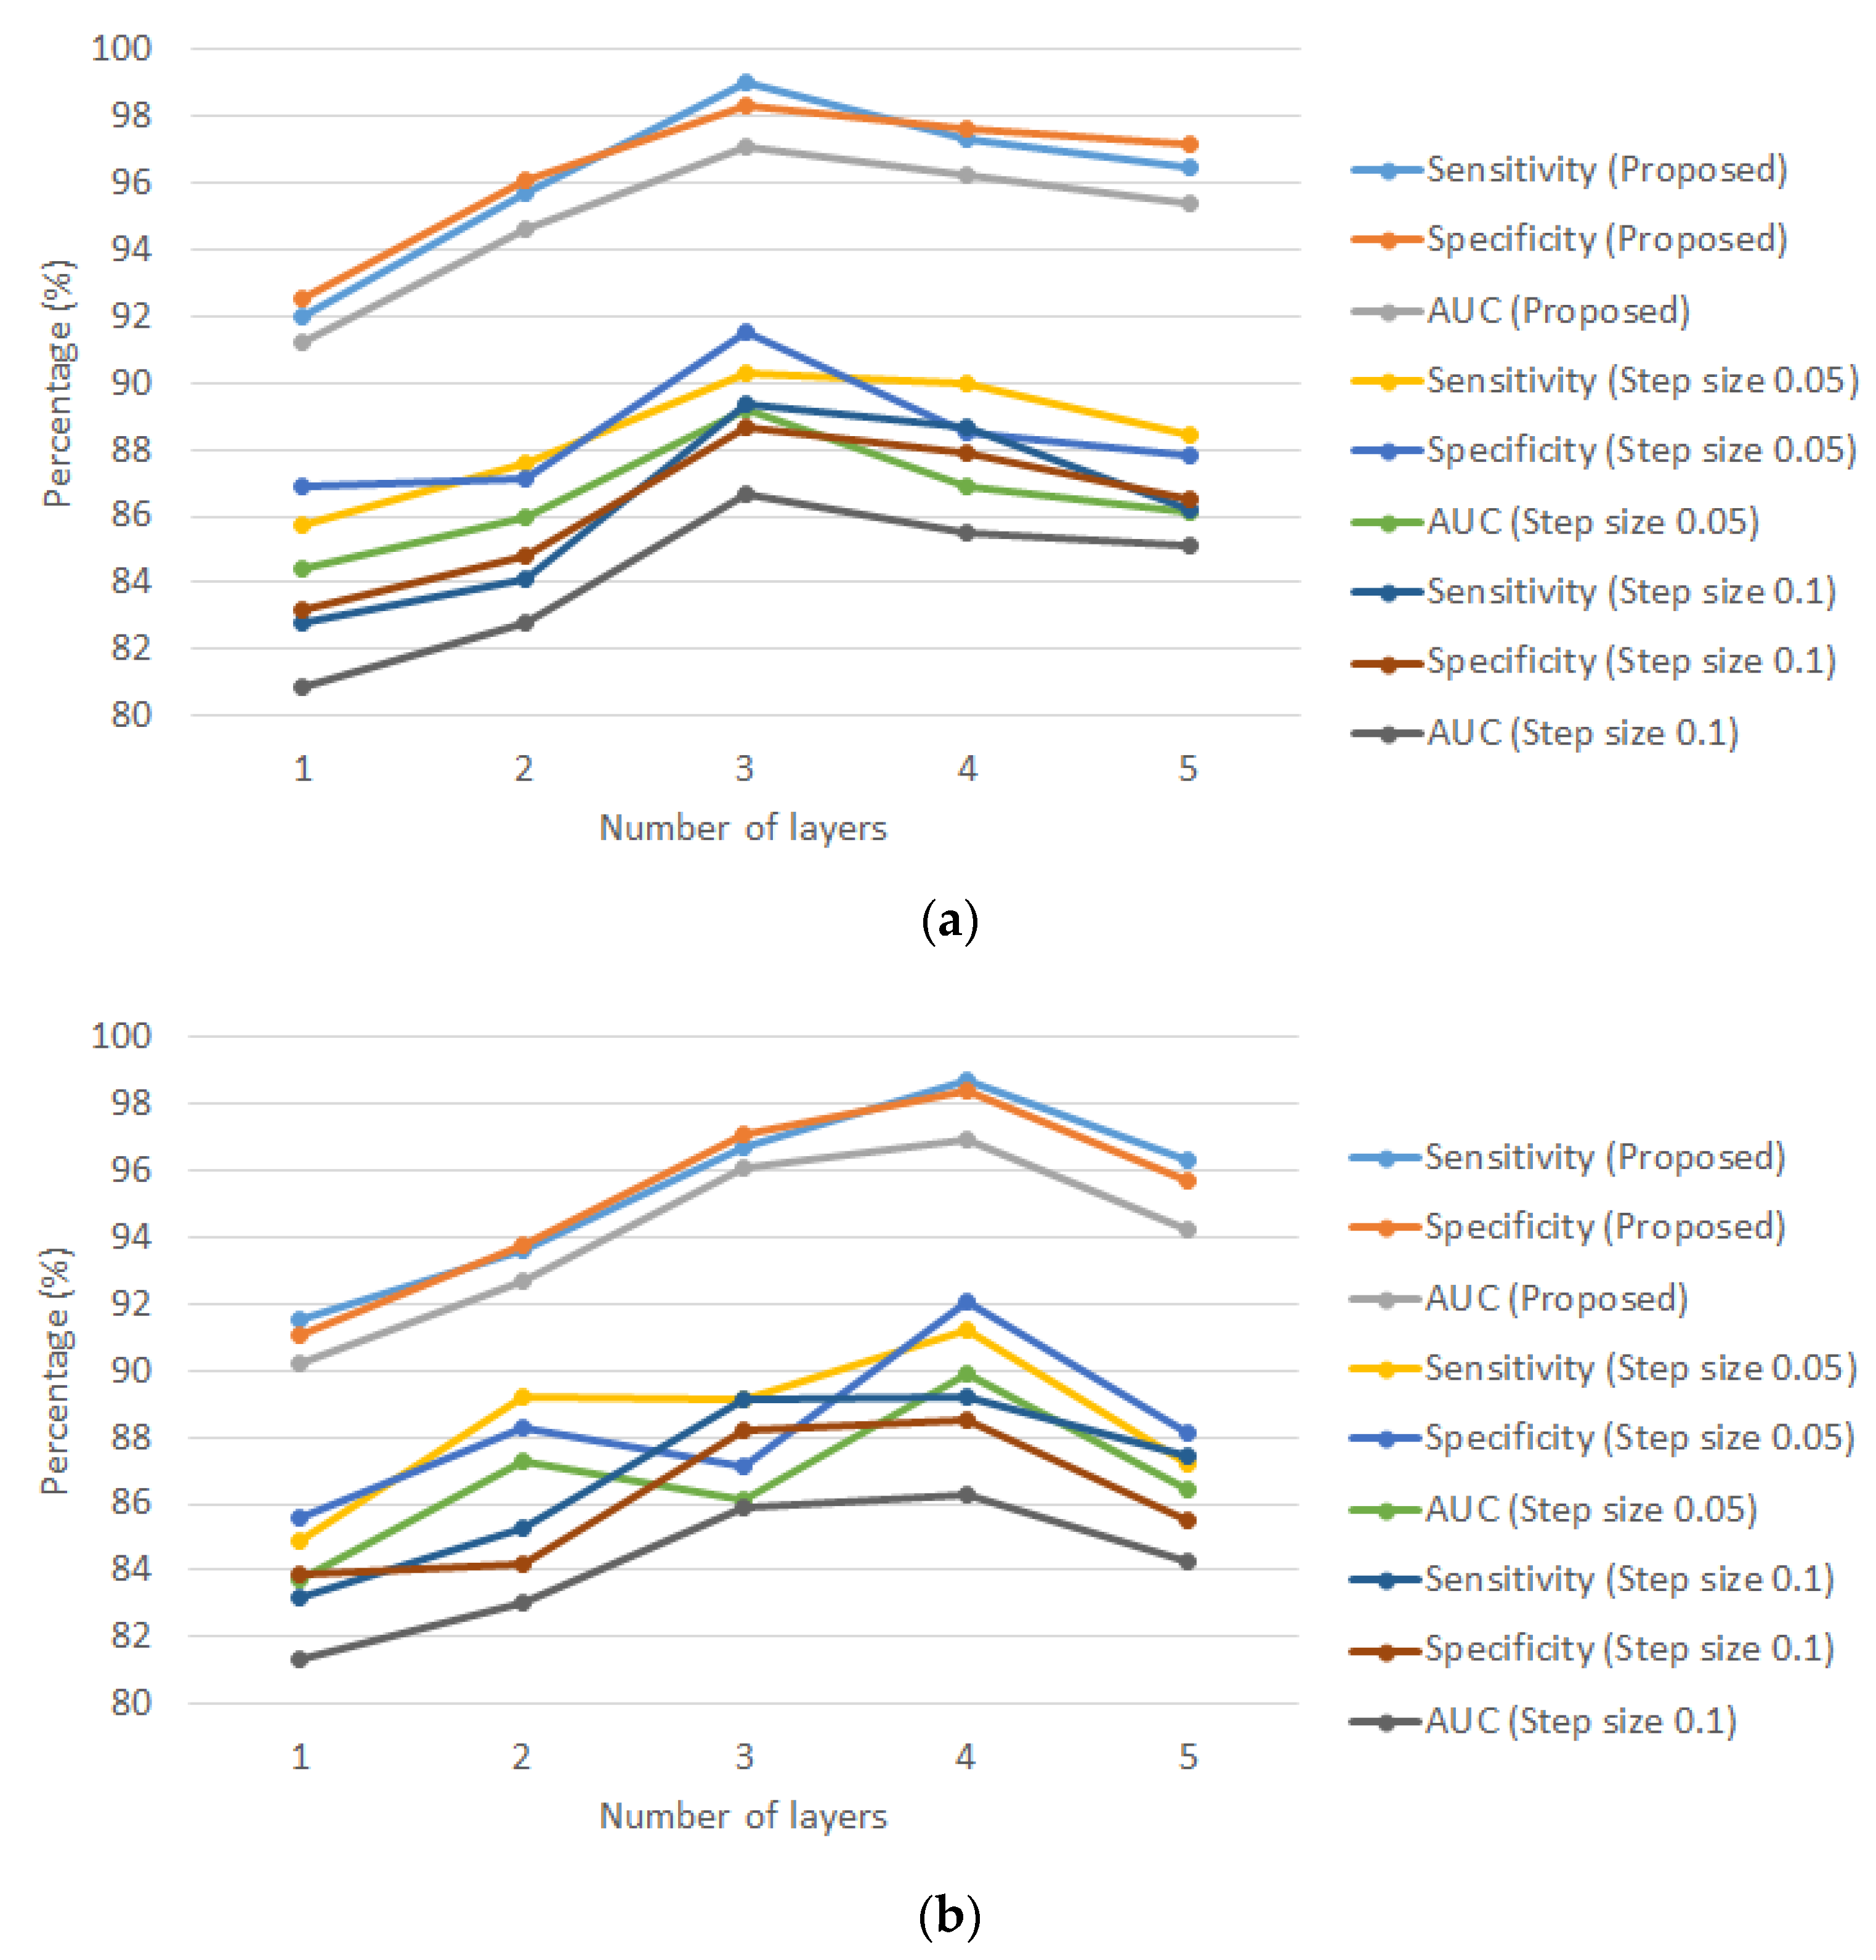
Figure 7 shows the average sensitivity, specificity and AUC of the proposed algorithm and grid search method with a step size of 0.05 and 0.1, in driver drowsiness and stress recognition. The results were summarized as follows. For driver drowsiness recognition as in Figure 7a, the performance indicators of average sensitivity, specificity and AUC of the proposed algorithm were 99%, 98.3% and 97.1%. For the grid search approach with a step size of 0.05, the indicators were 90.3%, 91.5% and 89.2%. When the step size was doubled the indicators were 89.4%, 88.7% and 86.7%. Hence, the average improvement by MOGA was 8.64% and 11.2% comparing with grid search with a step size of 0.05 and 0.1 respectively.
When it comes to driver stress recognition, referring to Figure 7b, the proposed algorithm achieved 98.7%, 98.4% and 96.9%, the grid search approach with a step size of 0.05 achieved 91.2%, 92.1% and 88.9% and that for a step size of 0.1 was 89.2%, 88.5% and 86.3%. Thus, the average improvement by MOGA was 8.01% and 11.4% comparing with a grid search with a step size of 0.05 and 0.1 respectively.
It was concluded that the proposed algorithm outperformed the grid search method. All the methods agreed that the optimal numbers of deep layers for driver drowsiness and stress recognition were three and four respectively. A step size of 0.05 was better than that of 0.1 as the number of considered solutions was significantly increased. MOGA had better searching in the solution space whereas a grid search only bounds to limited solutions. One may argue that the step size can be further reduced so that all the possible solutions can be approximately analyzed, however, it requires extensive computation power, which is normally not a generic and feasible approach practically. Here, the proposed algorithm was a deep learning approach, which involved many optimization problems (optimal SVM).
3.3. Study on the Benefits of MKL
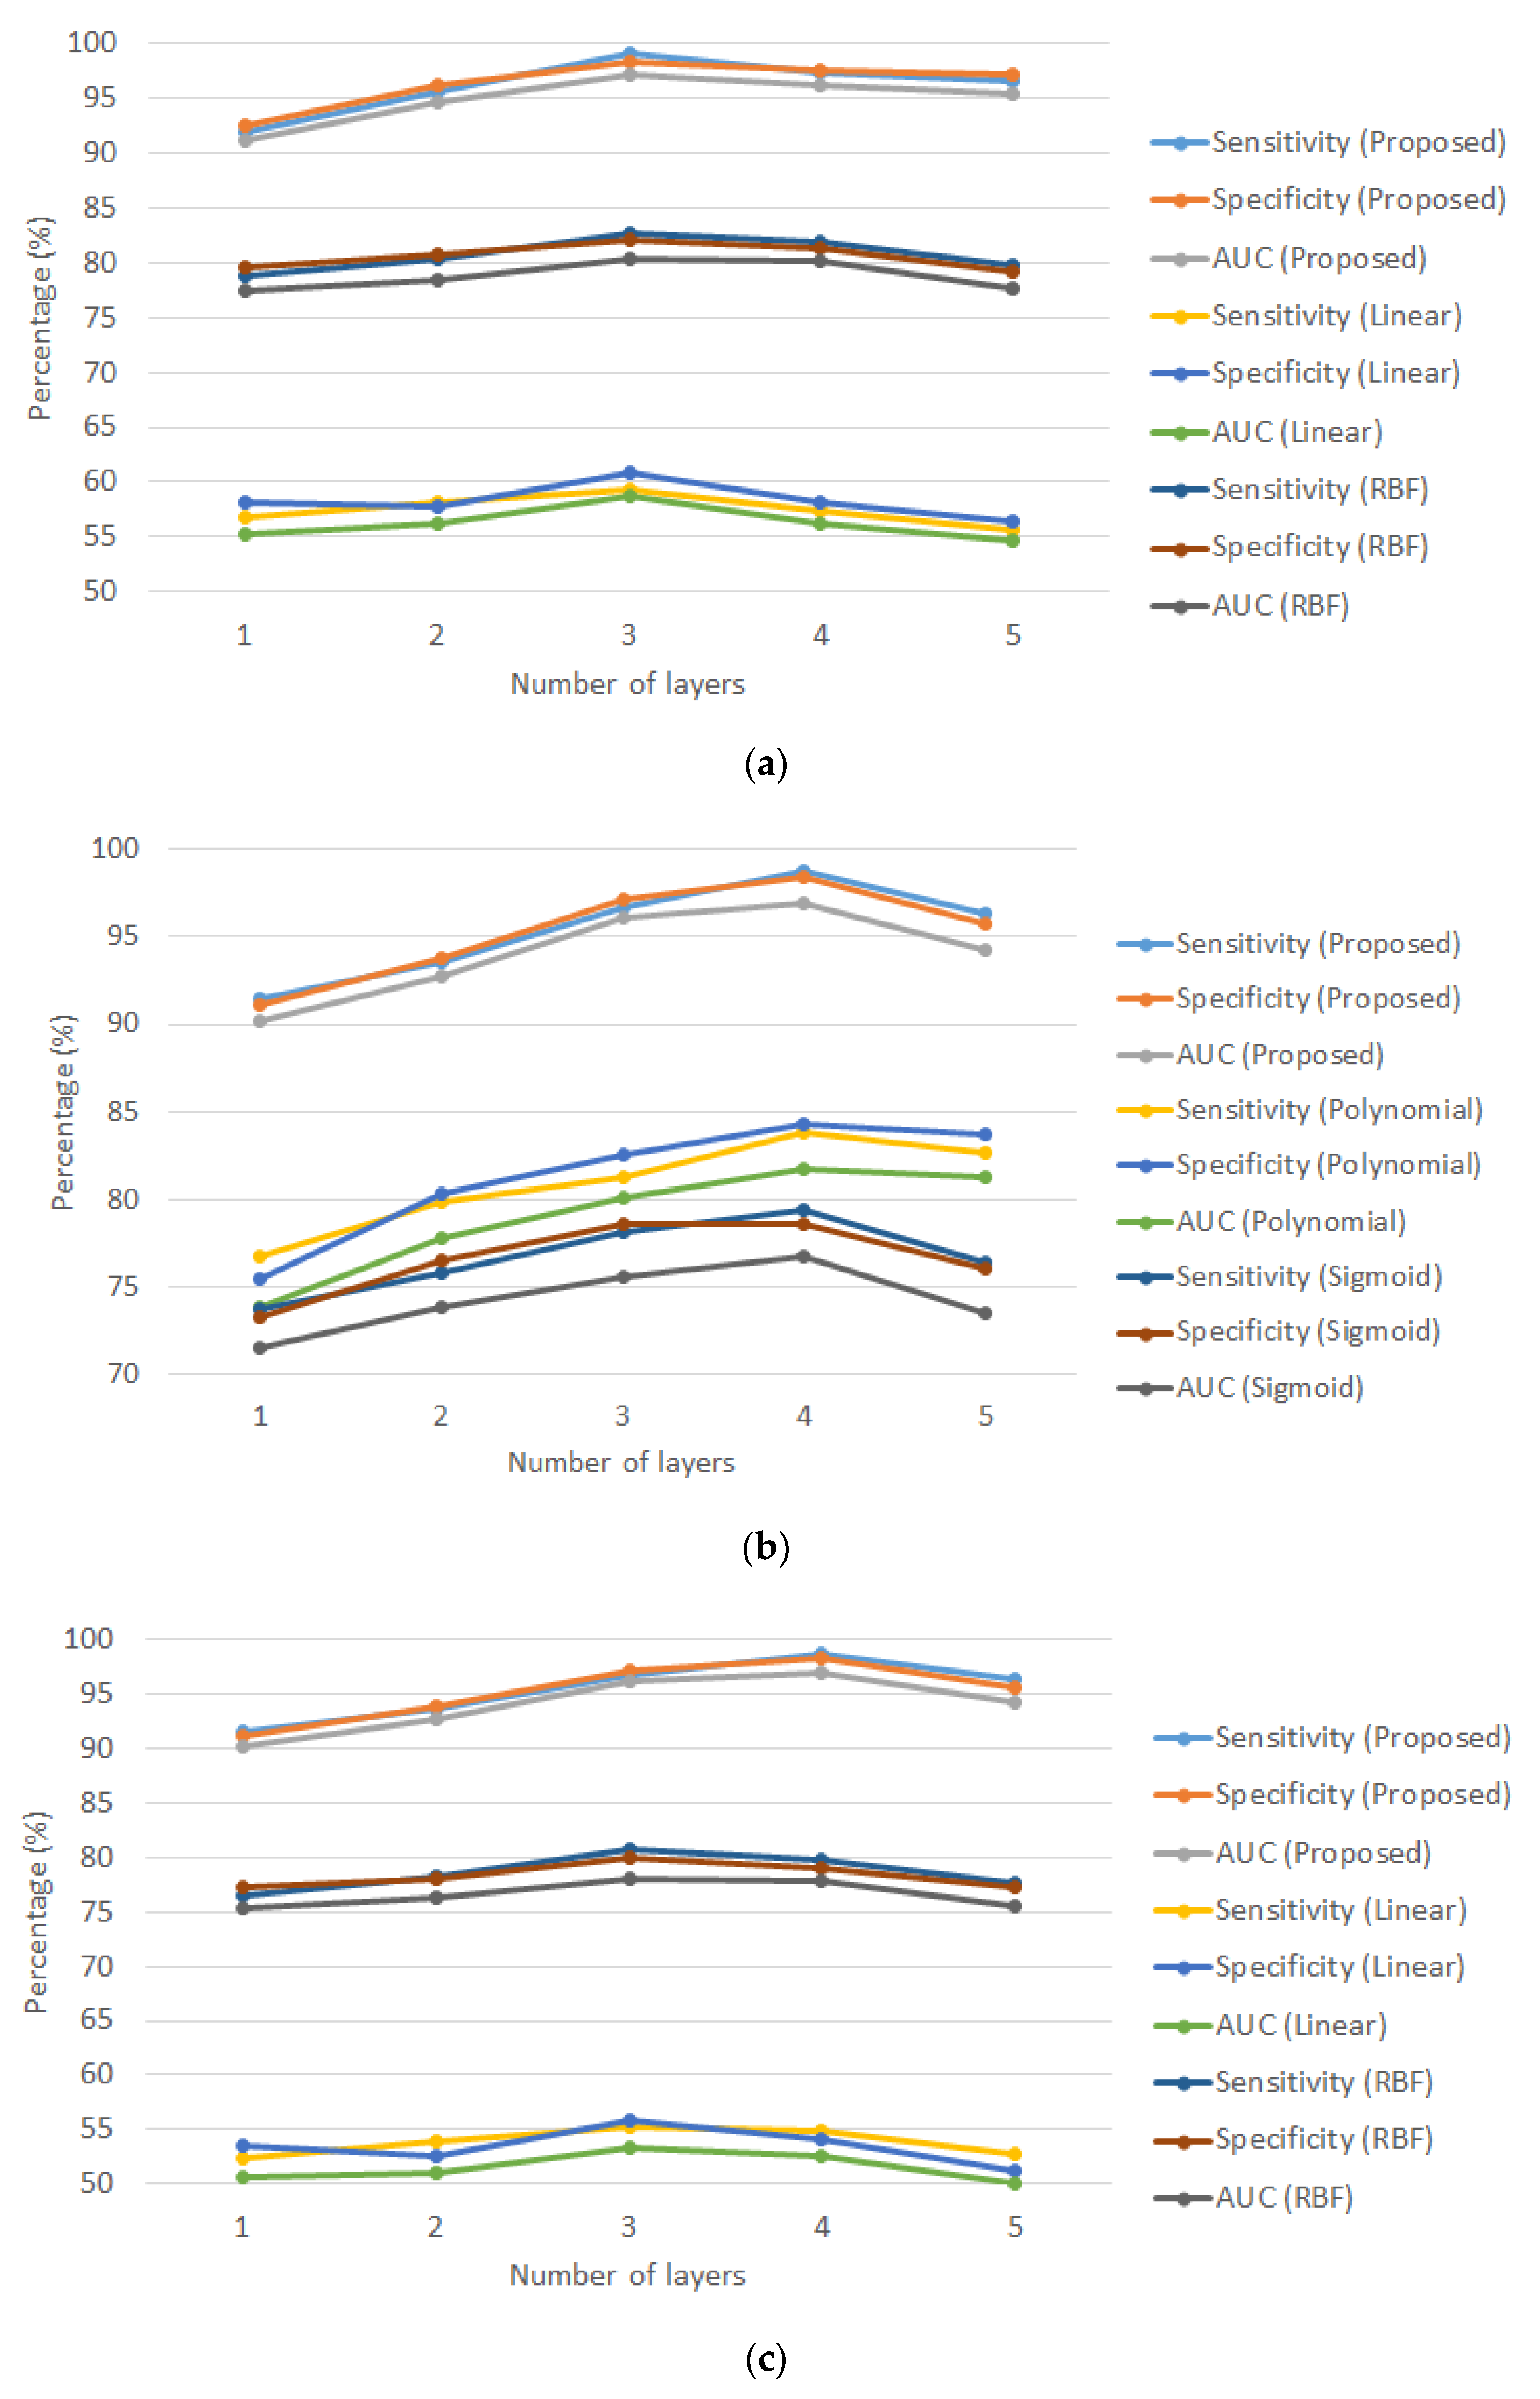
To reveal the improvement of MKL, analysis is made between MKL and single typical kernel: linear kernel, RBF kernel, polynomial kernel and sigmoid kernel. Figure 8 shows the results of MKL, linear kernel, RBF kernel, polynomial kernel and sigmoid kernel for driver drowsiness and stress recognition. To better visualize the results, each subfigure compares MKL with two of the kernels.
Driver drowsiness recognition was analyzed based on Figure 8a,b. It can be concluded that the proposed algorithm using MKL significantly improved the performance indicators compared with all single typical kernel. Results between different kernel agreed with the optimal number of layers of three. The average performance improvement by the proposed algorithm was 64.6%, 20.1%, 17.7% and 25.2% compared to linear kernel, RBF kernel, polynomial kernel and sigmoid kernel, respectively.
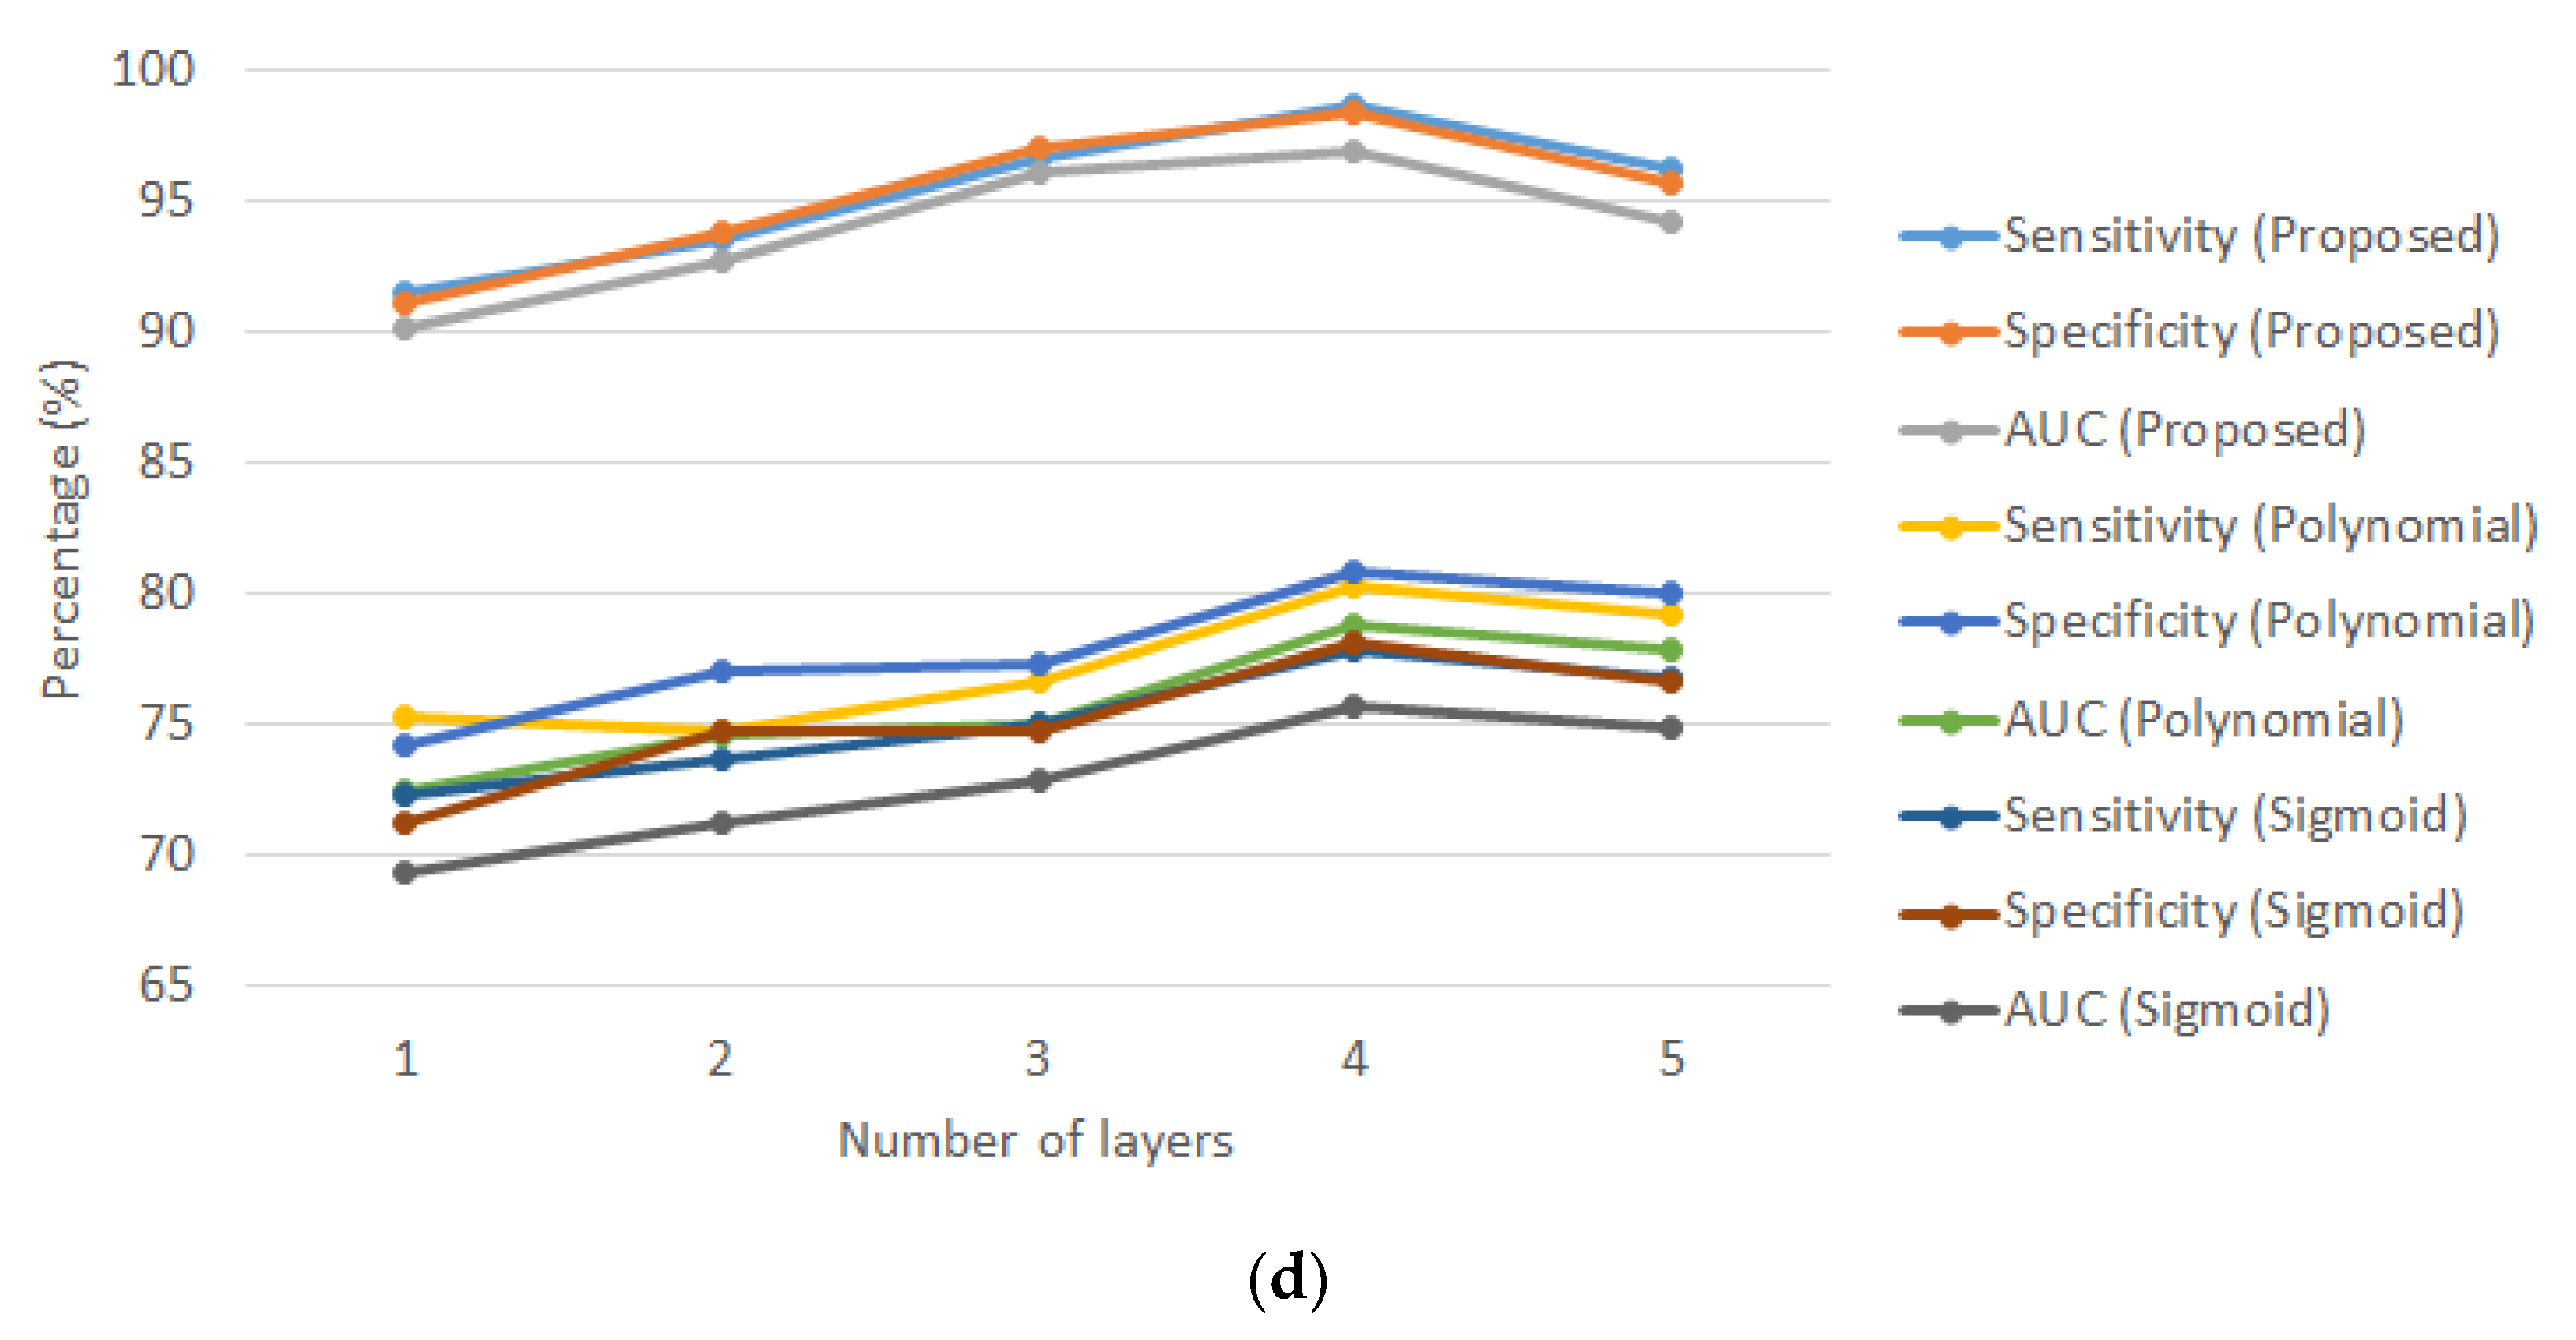
The same finding was observed for driver stress recognition in Figure 8c,d. The optimal number of layers matches (which is four) in all approaches. On average, the performance improvement by the proposed algorithm was 82.0%, 24.3%, 22.5% and 26.9% respectively.
MKL combines the advantages and properties of various kernels so that the resultant kernel function outperforms any single typical kernel. One of the other key reasons is typical kernels are not customized to a specific application. Therefore, the proposed approach using MKL, which the weighting factors were optimally designed by MOGA, is a customized approach for designing the optimal kernel function for driver drowsiness and stress recognition.
3.4. Comparisons to Related Works
First, the comparison was carried out on driver drowsiness recognition. Table 2 summarizes the performance between proposed MOGA optimized D-MKL-SVM and existing works [16,17,18,19,20,21,22,23,24,25,26,27]. It summarizes the category of input signals, dataset, methodology, types of cross-validation and performance. Existing works may experience the following issues, which lead to lower reliability (and thus performance) when the methodology is implemented practically.
Generally, the first part of any methodology is the source of the input signal in which study in [37] analyzed the measurement reliability of several signals, ECG, EEG and video recording on real-world driving conditions (highway, urban and turning). EEG and a video recording may not be reliable input signals as only 85% and 59% of the time the acquired signals were with good signal quality. The severe signal distortion in the rest of the period could alter the validity of the foundation of the problem formulations, which could be considered as misleading input and thus output. Therefore, EEG and video-based approaches experience challenges in signal acquisition. As a result, the performance in related works [18,19,24,25,26,27] is reduced in a practical situation, which the methodology is governed by a maximum accuracy of 85% and 59% for an EEG-based and image-based approach.
It can be seen from Table 2 that some works [20,21,22,23,25,26,27] did not employ cross-validation. The bias training dataset (lack of generalization) may be selected to obtain high accuracy. In addition, many existing works [16,18,19,21,22,23,25,26,27] utilized simulation driving datasets. These were not convincing to reflect actual driver’s status.
The proposed MOGA optimized D-MKL-SVM algorithm utilizes the ECG signal, which provides a reliable measurement of stability. The real-world driving dataset and 10-fold cross-validation were adopted. Therefore, the performance of proposed work was more reliable and robust.
Consider driver stress recognition, Table 3 compares the performance between the proposed algorithm and related works [28,29,30,31,32,33,34,35], towards a category of input signals, dataset, methodology, types of cross-validation and performance. Similar to driver drowsiness recognition, related works in driver stress recognition experienced similar issues.
The EEG signal was adopted in [30], which the input signal has a measurement stability of 85% [37]. Some of the works [28,29,33] did not analyze the method using cross-validation. Data was collected using the simulated environment in [29,35]. It is noted that there is an unspecified dataset in [35]. To compare the rest of the existing works, the proposed algorithm outperforms [30,31,32,34] significantly.
As a result, the proposed MOGA optimized D-MKL-SVM outperforms existing works and serves as a generic approach for both driver drowsiness and stress recognition.
4. Conclusions
Owning to the fact that existing works on driver drowsiness and stress recognition have room for improvement, which suffer from the following concerns: (i) input signals of poor measurement stability, (ii) performance evaluation without cross-validation and (iii) collecting data using a simulated environment, this paper proposed a generic model using the multiple-objective genetic algorithm (MOGA) optimized deep multiple kernel learning support vector machine (D-MKL-SVM). For driver drowsiness recognition, the average sensitivity, specificity and AUC were 99%, 98.3% and 97.1% respectively. For driver stress recognition, the average sensitivity, specificity and AUC were 98.7%, 98.4% and 96.9% respectively. For performance evaluation, we firstly analyzed the importance of MOGA versus the traditional grid search method and MKL versus the single typical kernel. The proposed generic model achieved the highest accuracy for both driver drowsiness recognition and driver stress recognition compared to existing works.
The proposed approach can improve road safety as follows. Once drowsy events have been concluded, a sound could be emitted to awake drivers. In contrast to drowsiness recognition, stress recognition cannot directly prevent a stressed driving accident. The decision should come along with some relaxation techniques in order to lower the stress level of drivers. There are some measures to relieve stress while driving: (i) turn off disturbing noise, (ii) take deep breaths at stoplights, (iii) say what you see, (iv) try not to have long haul driving, (v) drive in slow and safe areas and (vi) embrace mindfulness. It is extremely important to reduce the stress level while driving. It not only helps at preventing accidents but also increases the happiness after driving, since stress can be accumulated as a snowball effect.
The future work will be suggested in two ways: (i) analyze the performance of proposed work with a real-world driving dataset, towards volunteers of different countries, so that the proposed algorithm can be adopted worldwide and (ii) test if the proposed generic model is applicable to cardiovascular diseases recognition because the proposed approach utilizes the ECG signal as an input, which is also the key input for cardiovascular diseases recognition.
Author Contributions
Formal analysis, K.T.C., M.D.L. and R.W.L.; Investigation, K.T.C., M.D.L. and R.W.L.; Methodology, K.T.C.; Validation, K.T.C., M.D.L. and R.W.L.; Visualization, K.T.C.; Writing—original draft, K.T.C., M.D.L. and R.W.L. Writing—review and editing, K.T.C., M.D.L. and R.W.L. All authors have read and agreed to the published version of the manuscript.
Funding
This research received no external funding.
Conflicts of Interest
The authors declare no conflict of interest.
References
- World Health Organization. Global Status Report on Road Safety 2018; World Health Organization: Geneva, Switzerland, 2018. [Google Scholar]
- Du, X.; Shen, Y.; Chang, R.; Ma, J. The exceptionists of Chinese roads: The effect of road situations and ethical positions on driver aggression. Transp. Res. Part F Traffic Psychol. Behav. 2018, 58, 719–729. [Google Scholar] [CrossRef]
- Rosekind, M.R. Underestimating the societal costs of impaired alertness: Safety, health and productivity risks. Sleep Med. 2005, 6, S21–S25. [Google Scholar] [CrossRef]
- Sikander, G.S.; Anwar, S. Driver fatigue detection systems: A review. IEEE Trans. Intell. Transp. Syst. 2019, 20, 2339–2352. [Google Scholar] [CrossRef]
- Useche, S.A.; Ortiz, V.G.; Cendales, B.E. Stress-related psychosocial factors at work, fatigue, and risky driving behavior in bus rapid transport (BRT) drivers. Accid. Anal. Prev. 2017, 104, 106–114. [Google Scholar] [CrossRef] [PubMed]
- Qu, W.; Zhang, Q.; Zhao, W.; Zhang, K.; Ge, Y. Validation of the Driver Stress Inventory in China: Relationship with dangerous driving behaviors. Accid. Anal. Prev. 2016, 87, 50–58. [Google Scholar] [CrossRef]
- Precht, L.; Keinath, A.; Krems, J.F. Effects of driving anger on driver behavior–Results from naturalistic driving data. Transp. Res. Part F Traffic Psychol. Behav. 2017, 45, 75–92. [Google Scholar] [CrossRef]
- Ge, Y.; Qu, W.; Jiang, C.; Du, F.; Sun, X.; Zhang, K. The effect of stress and personality on dangerous driving behavior among Chinese drivers. Accid. Anal. Prev. 2014, 73, 34–40. [Google Scholar] [CrossRef]
- Brown, T.G.; Ouimet, M.C.; Eldeb, M.; Tremblay, J.; Vingilis, E.; Nadeau, L.; Pruessner, J.; Bechara, A. Personality, executive control, and neurobiological characteristics associated with different forms of risky driving. PLoS ONE 2016, 11, e0150227. [Google Scholar] [CrossRef]
- Montoro, L.; Useche, S.; Alonso, F.; Cendales, B. Work environment, stress, and driving anger: A structural equation model for predicting traffic sanctions of public transport drivers. Int. J. Environ. Res. Public Health 2018, 15, 497. [Google Scholar] [CrossRef] [Green Version]
- Maurya, P.K.; Noto, C.; Rizzo, L.B.; Rios, A.C.; Nunes, S.O.V.; Barbosa, D.S.; Sethi, S.; Zeni, M.; Mansur, R.B.; Maes, M.; et al. The role of oxidative and nitrosative stress in accelerated aging and major depressive disorder. Prog. Neuropsychopharmacol. Biol. Psychiatry 2016, 65, 134–144. [Google Scholar] [CrossRef]
- Smoller, J.W. The genetics of stress-related disorders: PTSD, depression, and anxiety disorders. Neuropsychopharmacology 2016, 41, 297. [Google Scholar] [CrossRef] [PubMed]
- Hackett, R.A.; Steptoe, A. Type 2 diabetes mellitus and psychological stress—A modifiable risk factor. Nat. Rev. Endocrinol. 2017, 13, 547. [Google Scholar] [CrossRef] [PubMed]
- Marshall, G.D., Jr. Psychological stress, immunity, and asthma: Developing a paradigm for effective therapy and prevention. Curr. Opin. Behav. Sci. 2019, 28, 14–19. [Google Scholar] [CrossRef]
- Esler, M. Mental stress and human cardiovascular disease. Neurosci. Biobehav. Rev. 2017, 74, 269–276. [Google Scholar] [CrossRef] [PubMed]
- Guede-Fernández, F.; Fernández-Chimeno, M.; Ramos-Castro, J.; García-González, M.A. Driver drowsiness detection based on respiratory signal analysis. IEEE Access 2019, 7, 81826–81838. [Google Scholar] [CrossRef]
- Chui, K.T.; Tsang, K.F.; Chi, H.R.; Wu, C.K.; Ling, B.W.K. Electrocardiogram Based Classifier for Driver Drowsiness Detection. In Proceedings of the 2015 IEEE 13th International Conference on Industrial Informatics, (INDIN ’15), Cambridge, UK, 22–24 July 2015; IEEE: Piscataway, NJ, USA, 2015; pp. 600–603. [Google Scholar]
- Li, G.; Chung, W.Y. Combined EEG-gyroscope-tDCS brain machine interface system for early management of driver drowsiness. IEEE Trans. Hum. syst. 2018, 48, 50–62. [Google Scholar] [CrossRef]
- Budak, U.; Bajaj, V.; Akbulut, Y.; Atilla, O.; Sengur, A. An Effective Hybrid Model for EEG-Based Drowsiness Detection. IEEE Sens. J. 2019, 19, 7624–7631. [Google Scholar] [CrossRef]
- Li, Z.; Li, S.; Li, R.; Cheng, B.; Shi, J. Online detection of driver fatigue using steering wheel angles for real driving conditions. Sensors 2017, 17, 495. [Google Scholar] [CrossRef] [Green Version]
- Chai, M. Drowsiness monitoring based on steering wheel status. Transp. Res. Part D Transp. Environ. 2019, 66, 95–103. [Google Scholar] [CrossRef]
- McDonald, A.D.; Lee, J.D.; Schwarz, C.; Brown, T.L. A contextual and temporal algorithm for driver drowsiness detection. Accid. Anal. Prev. 2018, 113, 25–37. [Google Scholar] [CrossRef]
- Assuncao, A.N.; Aquino, A.L.; Santos, C.D.M.; Ricardo, C.; Guimaraes, R.L.; Oliveira, R.A. Vehicle Driver Monitoring through the Statistical Process Control. Sensors 2019, 19, 3059. [Google Scholar] [CrossRef] [PubMed] [Green Version]
- Zhao, L.; Wang, Z.; Wang, X.; Liu, Q. Driver drowsiness detection using facial dynamic fusion information and a DBN. IET Intell. Transp. Syst. 2018, 12, 127–133. [Google Scholar] [CrossRef]
- Ahmad, R.; Borole, J.N. Drowsy Driver Identification Using Eye Blink Detection. Int. J. Comp. Sci. Inf. Technol. 2015, 6, 270–274. [Google Scholar]
- Mandal, B.; Li, L.; Wang, G.S.; Lin, J. Towards detection of bus driver fatigue based on robust visual analysis of eye state. IEEE Trans. Intell. Transp. 2016, 18, 545–557. [Google Scholar] [CrossRef]
- Zhang, C.; Wu, X.; Zheng, X.; Yu, S. Driver drowsiness detection using multi-channel second order blind identifications. IEEE Access 2019, 7, 11829–11843. [Google Scholar] [CrossRef]
- Khattak, Z.H.; Fontaine, M.D.; Boateng, R.A. Evaluating the impact of adaptive signal control technology on driver stress and behavior using real-world experimental data. Trans. Res. Part F Traffic Psychol. Behav. 2018, 58, 133–144. [Google Scholar] [CrossRef]
- Affanni, A.; Bernardini, R.; Piras, A.; Rinaldo, R.; Zontone, P. Driver’s stress detection using skin potential response signals. Measurement 2018, 122, 264–274. [Google Scholar] [CrossRef]
- Wan, P.; Wu, C.; Lin, Y.; Ma, X. Driving Anger States Detection Based on Incremental Association Markov Blanket and Least Square Support Vector Machine. Discrete Dyn. Nat. Soc. 2019, 2019, 2745381. [Google Scholar] [CrossRef]
- Dobbins, C.; Fairclough, S. Signal Processing of Multimodal Mobile Lifelogging Data towards Detecting Stress in Real-World Driving. IEEE Trans. Mob. Comput. 2019, 18, 632–644. [Google Scholar] [CrossRef] [Green Version]
- Chen, L.L.; Zhao, Y.; Ye, P.F.; Zhang, J.; Zou, J.Z. Detecting driving stress in physiological signals based on multimodal feature analysis and kernel classifiers. Expert Syst. Appl. 2017, 85, 279–291. [Google Scholar] [CrossRef]
- Lee, B.G.; Chung, W.Y. Wearable glove-type driver stress detection using a motion sensor. IEEE Trans. Intell. Transp. 2017, 18, 1835–1844. [Google Scholar] [CrossRef]
- Muñoz-Organero, M.; Corcoba-Magaña, V. Predicting upcoming values of stress while driving. IEEE Trans. Intell. Transp. 2017, 18, 1802–1811. [Google Scholar] [CrossRef]
- Kurniawan, H.; Maslov, A.V.; Pechenizkiy, M. Stress Detection from Speech and Galvanic Skin Response Signals. In Proceedings of the 26th IEEE International Symposium on Computer-Based Medical Systems, Porto, Portugal, 20–22 June 2013; IEEE: Piscataway, NJ, USA, 2013; pp. 209–214. [Google Scholar]
- Choi, M.; Koo, G.; Seo, M.; Kim, S.W. Wearable device-based system to monitor a driver’s stress, fatigue, and drowsiness. IEEE T. Instrum. Meas. 2017, 67, 634–645. [Google Scholar] [CrossRef]
- Sun, Y.; Yu, X.B. An Innovative Nonintrusive Driver Assistance System for Vital Signal Monitoring. IEEE J. Biomed. Health Inform. 2014, 18, 1932–1939. [Google Scholar] [CrossRef] [PubMed]
- Healey, J.A.; Picard, R.W. Detecting stress during real-world driving tasks using physiological sensors. IEEE Trans. Intell. Transp. 2005, 6, 156–166. [Google Scholar] [CrossRef] [Green Version]
- Goldberger, A.L.; Amaral, L.A.N.; Glass, L.; Hausdorff, J.M.; Ivanov, P.C.H.; Mark, R.G.; Mietus, J.E.; Moody, G.B.; Peng, C.K.; Stanley, H.E. PhysioBank, PhysioToolkit, and PhysioNet: Components of a New Research Resource for Complex Physiologic Signals. Circulation 2003, 101, e215–e220. [Google Scholar] [CrossRef] [Green Version]
- Terzano, M.G.; Parrino, L.; Sherieri, A.; Chervin, R.; Chokroverty, S.; Guilleminault, C.; Hirshkowitz, M.; Mahowald, M.; Moldofsky, H.; Rosa, A.; et al. Atlas, rules, and recording techniques for the scoring of cyclic alternating pattern (CAP) in human sleep. Sleep Med. 2001, 2, 537–553. [Google Scholar] [CrossRef]
- Kohler, B.U.; Hennig, C.; Orglmeister, R. The principles of software QRS detection. IEEE Eng. Med. Biol. 2002, 21, 42–57. [Google Scholar] [CrossRef]
- Tompkins, W.J. Biomedical Digital Signal Processing C-Language Examples and Laboratory Experiments for the IBM®PC; Prentice Hall: Upper Saddle River, NJ, USA, 2000; pp. 236–264. [Google Scholar]
- Herbrich, R. Learning Kernel Classifiers Theory and Algorithms; The MIT Press: London, UK, 2002. [Google Scholar]
- Thokala, P.; Devlin, N.; Marsh, K.; Baltussen, R.; Boysen, M.; Kalo, Z.; Longrenn, T.; Mussen, F.; Peacock, S.; Watkins, J.; et al. Multiple criteria decision analysis for health care decision making—An introduction: Report 1 of the ISPOR MCDA Emerging Good Practices Task Force. Value Health 2016, 19, 1–13. [Google Scholar] [CrossRef] [Green Version]
- Mardani, A.; Zavadskas, E.K.; Khalifah, Z.; Jusoh, A.; Nor, K.M. Multiple criteria decision-making techniques in transportation systems: A systematic review of the state of the art literature. Transport 2016, 31, 359–385. [Google Scholar] [CrossRef] [Green Version]
- Ruiz-Torrubiano, R.; Suárez, A. A memetic algorithm for cardinality-constrained portfolio optimization with transaction costs. Appl. Soft. Comput. 2015, 36, 125–142. [Google Scholar] [CrossRef] [Green Version]
- Tavakoli, M.; Shokridehaki, F.; Akorede, M.F.; Marzband, M.; Vechiu, I.; Pouresmaeil, E. CVaR-based energy management scheme for optimal resilience and operational cost in commercial building microgrids. Int. J. Electr. Power Energy Syst. 2018, 100, 1–9. [Google Scholar] [CrossRef]
- Marzband, M.; Azarinejadian, F.; Savaghebi, M.; Pouresmaeil, E.; Guerrero, J.M.; Lightbody, G. Smart transactive energy framework in grid-connected multiple home microgrids under independent and coalition operations. Renew. Energ. 2018, 126, 95–106. [Google Scholar] [CrossRef]
- Hsu, C.W.; Lin, C.J. A comparison of methods for multiclass support vector machines. IEEE Trans. Neural Netw. 2002, 13, 415–425. [Google Scholar]
- Epstein, J.I.; Zelefsky, M.J.; Sjoberg, D.D.; Nelson, J.B.; Egevad, L.; Magi-Galluzzi, C.; Vickers, A.J.; Parwani, A.V.; Reuter, V.E.; Fine, S.W.; et al. A contemporary prostate cancer grading system: A validated alternative to the Gleason score. Eur. Urol. 2016, 69, 428–435. [Google Scholar] [CrossRef] [Green Version]
Figure 1.
(a) Scenario setting in the Stress Recognition in Automobile Drivers Database and (b) the scenario setting in the cyclic alternating pattern (CAP) Sleep Database.
Figure 1.
(a) Scenario setting in the Stress Recognition in Automobile Drivers Database and (b) the scenario setting in the cyclic alternating pattern (CAP) Sleep Database.

Figure 2.
General flow of the proposed generic model multiple-objective genetic algorithm (MOGA) optimized deep multiple kernel learning support vector machine (D-MKL-SVM).
Figure 2.
General flow of the proposed generic model multiple-objective genetic algorithm (MOGA) optimized deep multiple kernel learning support vector machine (D-MKL-SVM).

Figure 3.
Architecture of MOGA optimized D-MKL-SVM.

Figure 4.
MOGA process for the optimal design of MKL-SVM.

Figure 5.
Average sensitivity, specificity and area under the receiver operating characteristic curve (AUC) versus number of layers in MOGA optimized D-MKL-SVM under 10-fold cross-validation: (a) driver drowsiness recognition and (b) driver stress recognition.
Figure 5.
Average sensitivity, specificity and area under the receiver operating characteristic curve (AUC) versus number of layers in MOGA optimized D-MKL-SVM under 10-fold cross-validation: (a) driver drowsiness recognition and (b) driver stress recognition.

Figure 6.
Average number of generations versus the number of layers in MOGA optimized D-MKL-SVM under 10-fold cross-validation: (a) driver drowsiness recognition and (b) driver stress recognition.
Figure 6.
Average number of generations versus the number of layers in MOGA optimized D-MKL-SVM under 10-fold cross-validation: (a) driver drowsiness recognition and (b) driver stress recognition.

Figure 7.
Average sensitivity, specificity and AUC of the proposed algorithm using MOGA and a traditional grid search with a step size of 0.05 and a step size of 0.1, versus the number of layers under a 10-fold cross-validation: (a) driver drowsiness recognition and (b) driver stress recognition.
Figure 7.
Average sensitivity, specificity and AUC of the proposed algorithm using MOGA and a traditional grid search with a step size of 0.05 and a step size of 0.1, versus the number of layers under a 10-fold cross-validation: (a) driver drowsiness recognition and (b) driver stress recognition.

Figure 8.
Average sensitivity, specificity and AUC of the proposed algorithm using multiple kernel learning (MKL) and typical single kernel versus number of layers under 10-fold cross-validation: (a) the MKL approach versus linear and radial basis function (RBF) kernels for driver drowsiness recognition; (b) the MKL approach versus polynomial and sigmoid kernels for driver drowsiness recognition; (c) the MKL approach versus linear and RBF kernels for driver stress recognition and (d) the MKL approach versus polynomial and sigmoid kernels for driver stress recognition.


Table 1.
Definition of classes and number of samples in driver drowsiness and stress dataset.
| Dataset | Class | Number of Samples |
|---|---|---|
| Driver drowsiness dataset | Class 0: Awake stage | 76,200 |
| Class 1: Drowsy stage 1 | 35,300 | |
| Class 2: Drowsy stage 2 | 20,000 | |
| Driver stress dataset | Class 0: High stress level | 19,300 |
| Class 1: Medium stress level | 45,000 | |
| Class 2: Low stress level | 11,900 |
Table 2.
Performance comparison between the proposed method and existing works for driver drowsiness recognition.
Table 2.
Performance comparison between the proposed method and existing works for driver drowsiness recognition.
| Work | Category | Dataset | Methodology | Cross-Validation | Performance |
|---|---|---|---|---|---|
| [16] | Biometric-signal-based (respiratory signal) | 20 volunteers (simulated environment) Samples: 2246 awake; 1035 drowsy | Threshold-based approach by the tracking of the displacements of diaphragm, abdominal and rib cage | Leave-one-subject-out | Specificity: 96.6% Sensitivity: 90.3% |
| [17] | Biometric-signal-based (ECG signal) | 18 volunteers (real-world driving environment) Samples: unknown | SVM using polynomial kernel using cross-correlation coefficient | 10-fold cross-validation | Sensitivity: 77.4% Specificity: 76.5% Overall accuracy: 76.9% |
| [18] | Biometric-signal-based (EEG signal) | 17 volunteers (simulated environment) Samples: 255 awake; 477 slightly drowsy; 167 moderate drowsy; 98 significant drowsy; 20 extremely drowsy | SVM using RBF kernel using RBP (α) and movement power | Leave-one-subject-out | Overall accuracy: 93.7% |
| [19] | Biometric-signal-based (EEG signal) | 16 volunteers (simulated environment) Samples: unknown | LSTM using spectral entropy and instantaneous frequency | 10-fold cross-validation | Overall accuracy: 94.3% |
| [20] | Vehicle-based (steering wheel angle) | 6 volunteers (real-world driving environment) Samples: 92 awake; 99 drowsy | Threshold-based approach by analyzing steering wheel angle | No | Accuracy: 78.0% |
| [21] | Vehicle-based (steering wheel angle) | 10 volunteers (simulated environment) Samples: Total 7020 | Multilevel ordered logit model | No | Accuracy: 72.9% |
| [22] | Vehicle-based (steering wheel angle, pedal input, vehicle speed and acceleration) | 72 volunteers (simulated environment) Samples: 840 awake; 21 drowsy | Dynamic Bayesian Network algorithm | No | Specificity: 85% AUC: 77% |
| [23] | Vehicle-based (deviation from the current lane) | Unknown number of volunteers (simulated environment) Samples: 4000 awake; 4000 drowsy | Exponentially weighted moving average | No | Sensitivity: 76% Accuracy: 86% |
| [24] | Image-based (image of driver’s head) | 30 volunteers (real-world driving environment) Samples: 11568 awake; 4224 moderate drowsy; 4560 severe drowsy | Deep belief network | 10-fold cross-validation | Average accuracy: 96.7% |
| [25] | Image-based (eyes) | Unknown number of volunteers (simulated environment) Samples: 2500 images | Threshold-based approach by analyzing eye blinking frequency | No | Accuracy: 89% |
| [26] | Image-based (eyes) | 15 volunteers (simulated environment) Samples: 1068 images in total | Fusion and reasoning method including head and shoulder detection, face detection based on front view and oblique view analysis, eye detection | No | Average accuracy: 90.1% |
| [27] | Image-based (yawns and eyes) | 15 volunteers (simulated environment) Samples: unknown | Threshold-based approach using second-order blind identification algorithm | No | Accuracy: From 27.2% to 95.3% to under different scenarios |
| Proposed algorithm | Biometric-signal-based | 126 volunteers (real-world driving environment) Samples: 76,200 awake; 35,300 sleep stage 1, 20,000 sleep stage 2 | MOGA optimized D-MKL-SVM with cross-correlation and convolution coefficients | 10-fold cross-validation | Sensitivity: 99% Specificity: 98.3% AUC: 97.1% |
Area under the curve (AUC); Receiver operating characteristic (ROC); Deep multiple kernel learning support vector machine (D-MKL-SVM); Electrocardiogram (ECG); Electroencephalography (EEG); Long short-term memory (LSTM); Multiple-objective genetic algorithm (MOGA); Radial basis function (RBF); Relative band power (RBP); Support vector machine (SVM).
Table 3.
Performance comparison between the proposed method and existing works for driver stress recognition.
Table 3.
Performance comparison between the proposed method and existing works for driver stress recognition.
| Work | Category | Dataset | Methodology | Cross-Validation | Performance |
|---|---|---|---|---|---|
| [28] | Biometric-signal-based (HRV) | 22 volunteers (real-world driving environment) Samples: Unknown | Wilcoxon Signed rank test, t-test and ANOVA | No | No (statistical analysis between HRV and stress level) |
| [29] | Biometric-signal-based (EDA SPR) | 15 volunteers (simulated environment) Samples: 510 | Adaptive filtering and spike detection | No | Accuracy: 83.9% |
| [30] | Biometric-signal-based (Skin conductance and EEG) | 30 volunteers (real-world driving environment) Samples: 713 normal; 430 low anger; 315 medium anger; 161 high anger | Incremental association Markov blanket and least square SVM | 10-fold cross-validation | Accuracy: 82.2% |
| [31] | Biometric-signal-based (HRV and PPG) | 21 volunteers (real-world driving environment) Samples: Unknown | Ensemble learning of kNN, DT and LDA | 10-fold cross-validation | Accuracy: 86.9% |
| [32] | Biometric-signal-based (GSR), HRV and respiration) | 18 volunteers (real-world driving environment) Samples: 588 high stress level; 588 medium stress level; 588 low stress level | SVM and ELM | Leave-one-subject-out | SVM Sensitivity: 88.5% Specificity: 94.2% ELM Sensitivity: 88.2% Specificity: 94.1% |
| [33] | Vehicle-based (steering wheel angle) | 8 volunteers (simulated environment) Samples: 2154 normal; 2287 stress | SVM | No | Accuracy: 82.5% |
| [34] | Vehicle-based (steering wheel angle and road shape) | 4 volunteers (real-world driving environment) Samples: 220 | Multilayer perceptron | 10-fold cross-validation | Accuracy: 46.9% |
| [35] | Speech-based (speech and GSR) | N/A | SVM | 10-fold cross-validation | 92.4% |
| Proposed algorithm | Biometric-signal-based | 18 volunteers (real-world driving environment) Samples: 19,300 high stress level; 45,000 medium stress level; 11,900 low stress level | MOGA optimized D-MKL-SVM with cross-correlation and convolution coefficients | 10-fold cross-validation | Sensitivity: 98.7% Specificity: 98.4% AUC: 96.9% |
Analysis of variance (ANOVA); Decision tree (DT); Electrodermal activity (EDA); Extreme learning machine (ELM); Galvanic skin response (GSR); Heart rate variability (HRV); k-nearest neighbor (kNN); Linear discriminant analysis (LDA); Photoplethysmogram (PPG); Signal potential response (SPR).
© 2020 by the authors. Licensee MDPI, Basel, Switzerland. This article is an open access article distributed under the terms and conditions of the Creative Commons Attribution (CC BY) license (http://creativecommons.org/licenses/by/4.0/).
Share and Cite
MDPI and ACS Style
Chui, K.T.; Lytras, M.D.; Liu, R.W. A Generic Design of Driver Drowsiness and Stress Recognition Using MOGA Optimized Deep MKL-SVM. Sensors 2020, 20, 1474. https://doi.org/10.3390/s20051474
AMA Style
Chui KT, Lytras MD, Liu RW. A Generic Design of Driver Drowsiness and Stress Recognition Using MOGA Optimized Deep MKL-SVM. Sensors. 2020; 20(5):1474. https://doi.org/10.3390/s20051474
Chicago/Turabian StyleChui, Kwok Tai, Miltiadis D. Lytras, and Ryan Wen Liu. 2020. "A Generic Design of Driver Drowsiness and Stress Recognition Using MOGA Optimized Deep MKL-SVM" Sensors 20, no. 5: 1474. https://doi.org/10.3390/s20051474
Note that from the first issue of 2016, this journal uses article numbers instead of page numbers. See further details here.