Extended Target Echo Detection Based on KLD and Wigner Matrices

1
Key Laboratory of Radar Imaging and Microwave Photonics, Nanjing University of Aeronautics and Astronautics, Ministry of Education, Nanjing 210016, China
2
School of Electronic and Information Engineering, Nanjing University of Information Science and Technology, Nanjing 210044, China
*
Author to whom correspondence should be addressed.
Sensors 2019, 19(24), 5385; https://doi.org/10.3390/s19245385
Submission received: 9 November 2019
/
Revised: 1 December 2019
/
Accepted: 3 December 2019
/
Published: 6 December 2019
(This article belongs to the Special Issue Sensors Application on Early Warning System)
Abstract
:With the development of airborne radar radio frequency stealth (RFS) technology, the method of improving the RFS performance of airborne radar by optimizing target detection performance has been extensively studied. However, for wideband radar signals, the traditional point target model appears as an extended target model in the range-dimension, which is unfavorable to the detection of target echoes. To overcome the existing drawbacks, this paper devises an efficient echo detection algorithm from the perspective of information theory and random matrix. Firstly, aperiodic agile wideband radar signals are utilized to observe targets. Then, one frame of echo signals in the same range gate is reconstructed into a data form conforming to the Wigner matrix spectral decomposition. Finally, according to the signal detection theory, Kullback-Leibler Divergence (KLD) is used as the test statistic to complete the echo detection of the stealthy extended targets. By statistical analysis and comparison with other established echo detection algorithms, simulation results manifest that the proposed algorithm has superior detection performance and strong robustness, which not only makes up for the deficiency of traditional narrowband radar detection algorithms, but also increases the detection probability of radar system when it is faced with stealthy extended targets.
1. Introduction
Radar RFS is overwhelmingly important in electronic war (EW), and waveform design and selection [1]. Low radiation power control is one of the main ways to realize RFS, which is more effective by improving the performance of detection algorithms to reduce the signal-to-noise ratio (SNR) of target detection. Radar target detection refers to the whole process of extracting target information by the radar receiver from the received target echo via suppressing the noise clutter.
Traditionally, radar RFS target detection includes digital beam forming (DBF), intrapulse matching filtering, pulse integration, and constant false alarm rate (CFAR) detection. Pulse integration can be divided into coherent integration and noncoherent integration, which have been widely studied by myriad scholars. The principal difference between the two approaches lies in that coherent integration takes into account the phase information of the target, so that the accumulation effect is better than the noncoherent integration. A typical coherent integration algorithm is the moving target detection (MTD) algorithm [2], which is implemented by fast Fourier transform (FFT) in a single range unit. Although the most effective way to achieve target detection at low SNR is to extend the target accumulation time, long-term observations can cause the target echo envelope to present across range unit (ARU) and Doppler frequency migration (DFM) phenomena [3,4], which seriously restrict the long-term accumulation performance of the target.
Aiming at the problem of ARU, since Zhang et al. applied Keystone transform (KT) for synthetic aperture radar (SAR) to target detection of pulse Doppler (PD) radar, KT has received extensive attention in radar target detection [5]. The second-order KT [6] can address the second-order ARU phenomenon prompted by the target acceleration. Subsequently, Kong et al. presented a generalized KT to cope with the ARU phenomenon of any order [7], and later scholars continue to bring forward KT for joint processing of Doppler fuzzy correction [8]. Aiming at the issue of DFM, time-frequency methods are considered first, including Wigner-Ville distribution and Choi-Williams distribution [9]. However, due to the existence of cross-terms, the two methods are not conducive to the parameter estimation of the signal. In that case, methods for suppressing cross-terms such as Radon-Wigner transform, Radon-ambiguity transform, and Wigner-Hough transform [10,11] are advocated. In recent years, target detection algorithms based on normality tests have also been put forward, including Jarque-Bera test, Lilliefors test, and Anderson-Darling test [12].
One attractive problem in radar systems is waveform design for the alleged “extended targets”, which are also referred to as “range-spread targets” in some studies [13]. Owing to a suitable reformulation of the considered nonconvex design problem, Cheng et al. devised an iterative optimization procedure over the transmit signal and the receive filter bank [14]. Ciuonzo et al. dealt with the problem of adaptive multidimensional/multichannel signal detection in homogeneous Gaussian disturbance with unknown covariance matrix and structured (unknown) deterministic interference [15]. Conte et al. addressed the problem of adaptive detection of range-spread targets in homogeneous and partially homogeneous environment [16]. It is well known that the range resolution is inversely proportional to the signal bandwidth. Compared with the narrowband radar, the wideband radar can offer the information of the distance, size, and shape of a target and form a high range resolution profile (HRRP). Dai et al. proposed and analyzed an adaptive detection method of range spread targets with range walking across range cells [17]. D. Ciuonzo also devised imaging functions for wideband computational time-reversal (C-TR) based on generalized likelihood ratio (GLR), Rao, and Wald statistics under the single-source model [18].
While the above-mentioned target detection algorithms provide us with a guidance to address the issue of low radiation power control, they still cannot handle the problem of target detection in low SNR. In this paper, as far as the limited sampling number of echo signals be concerned, we make some prospective research on the echo detection of stealth extended target of wideband radar signals from the perspective of information theory and random matrix.
In view of the aforementioned problems, in this paper, we present echo detection algorithm of stealth extended targets based on KLD and Wigner matrices. The spectral distribution of Wigner matrices in finite dimensions was taken as the essential feature of background white noise, and the signal detection was conducted by testing the similarity between the empirical spectral cumulative distribution function (CDF) of received signals and the spectral CDF of Wigner matrices in finite dimensions. The algorithm in this paper uses KLD as the test statistic of signal, which has a superior detection performance and robustness.
The major contributions of the proposed work are summarized as follows:
- Most of the current research assumes that the target is a “point target” model, but this is only applicable to the situation that the radar range resolution unit is much larger than the geometrical dimension of the target and the target scattering energy is concentrated in one range unit. In practical applications, especially for wideband radar signals, the range resolutions are relatively high, and the target scattering centers are distributed in multiple range units. If the traditional method is still adopted, especially the stealth target’s echo is exceedingly weak. This paper comes up with an echo detection algorithm for this sort of stealthy extended target.
- In this paper, the white Gaussian noise signal sequence in the environment is reconstructed into Wigner matrices, and the spectral distribution of Wigner matrices in finite dimensions is innovatively brought forward as the characteristic of white Gaussian noise. The KLD of the empirical spectral CDF and the finite dimensional spectral CDF of the reconstructed echo signal is calculated and used as the test statistic.
- Numerous studies on target detection are based on the assumption that the echo signal can be sampled sufficiently. However, the sampling frequency of actual radar receiver is limited. In this paper, the probability density function (PDF) and CDF of Wigner matrices are studied for the limited number of samples, and the properties of spectral distribution of Wigner matrices in finite dimensions are rigorously derived.
- Numerical results are provided to demonstrate that the proposed algorithm effectively improves the signal detection performance and is suitable for different low probability of intercept (LPI) radar waveforms. The method advocated in this paper can reduce the SNR required for radar target detection and achieve low radiation power control, so as to improve the RFS performance of airborne radar.
The rest of this paper is organized as follows. Section 2 introduces the application of KLD and Wigner matrices in echo detection. They are the core theoretical bases of the detection algorithm presented in this paper. In Section 3.1, the schematic of the proposed algorithm is expounded. Assuming that the echo signal has no target, we set forth the calculation of spectral distribution of Wigner matrices in finite dimensions constructed via the white Gaussian noise signal in Section 3.2. We make a rigorous derivation for the test statistic and detection threshold of the proposed algorithm in Section 3.3, whose performance is assessed at length via simulation presented in Section 4.1 and whose superiority in terms of detection performance compared to other classical methods is illustrated by comparative numerical results. Section 4.2 makes a detailed analysis of the influencing factors of detection performance. We present our concluding remarks in Section 5.
Notation: Vectors (matrices) are denoted by boldface lower (upper) case letters. The symbols ⊗, ⇒, , , and represent Kronecker product, mapping, accumulation, Gamma function, and the space of real numbers, respectively. The cardinality of set A is denoted by #A. means that the random variable is averaged with q. Superscript denotes transpose and means that simple convergence of the series to l.
2. Application of KLD and Wigner Matrices in Echo Detection
2.1. Application of KLD in Echo Detection
Since Shannon [19] published his paper “A mathematical theory of communication” in 1948, an army of scholars have also applied information theory to radar systems. One of the most representative results is that of Bell [20], who applied mutual information to radar waveform design in 1993. Numerous scholars make the broad range of research on the target detection, recognition, and tracking of radar waveforms based on the mutual information and KLD in the information theory. Extensive research by serious scholars establish the relationship between “entropy” and “radar signal processing”.
In radar systems and passive detection systems, the KLD between the received signal and the background noise of the radar/passive detection device is adopted to measure the receiving performance of the receiving system of the radar/passive detection device. KLD, which is also called “relative entropy”, is a measure of the difference between two probability distributions [21]. For instance, the KLD between PDF and can be defined as:
is a non-negative binary function. Only when can be established. Small indicates is similar to [22]. Compared with the established methods used to measure the difference between PDFs, namely Bhattacharyya distance, F-divergence, and Hellinger distance, KLD has advantages of low computational complexity, clear physical concept, and rigorous mathematical derivation.
Assuming that the radar waveform is represented by and the sampling frequency of the receiver is formulated as , we set forth that the time-domain sampling value of the signal can be described as:
where N denotes a finite number of samples.
The signal processed by the intercepted receiver is a signal in additive noise, which can be expressed by:
where represents the sampled value of the additive white Gaussian noise (AWGN) with a mean of and a variance of . L represents the number of signals in additive noise.
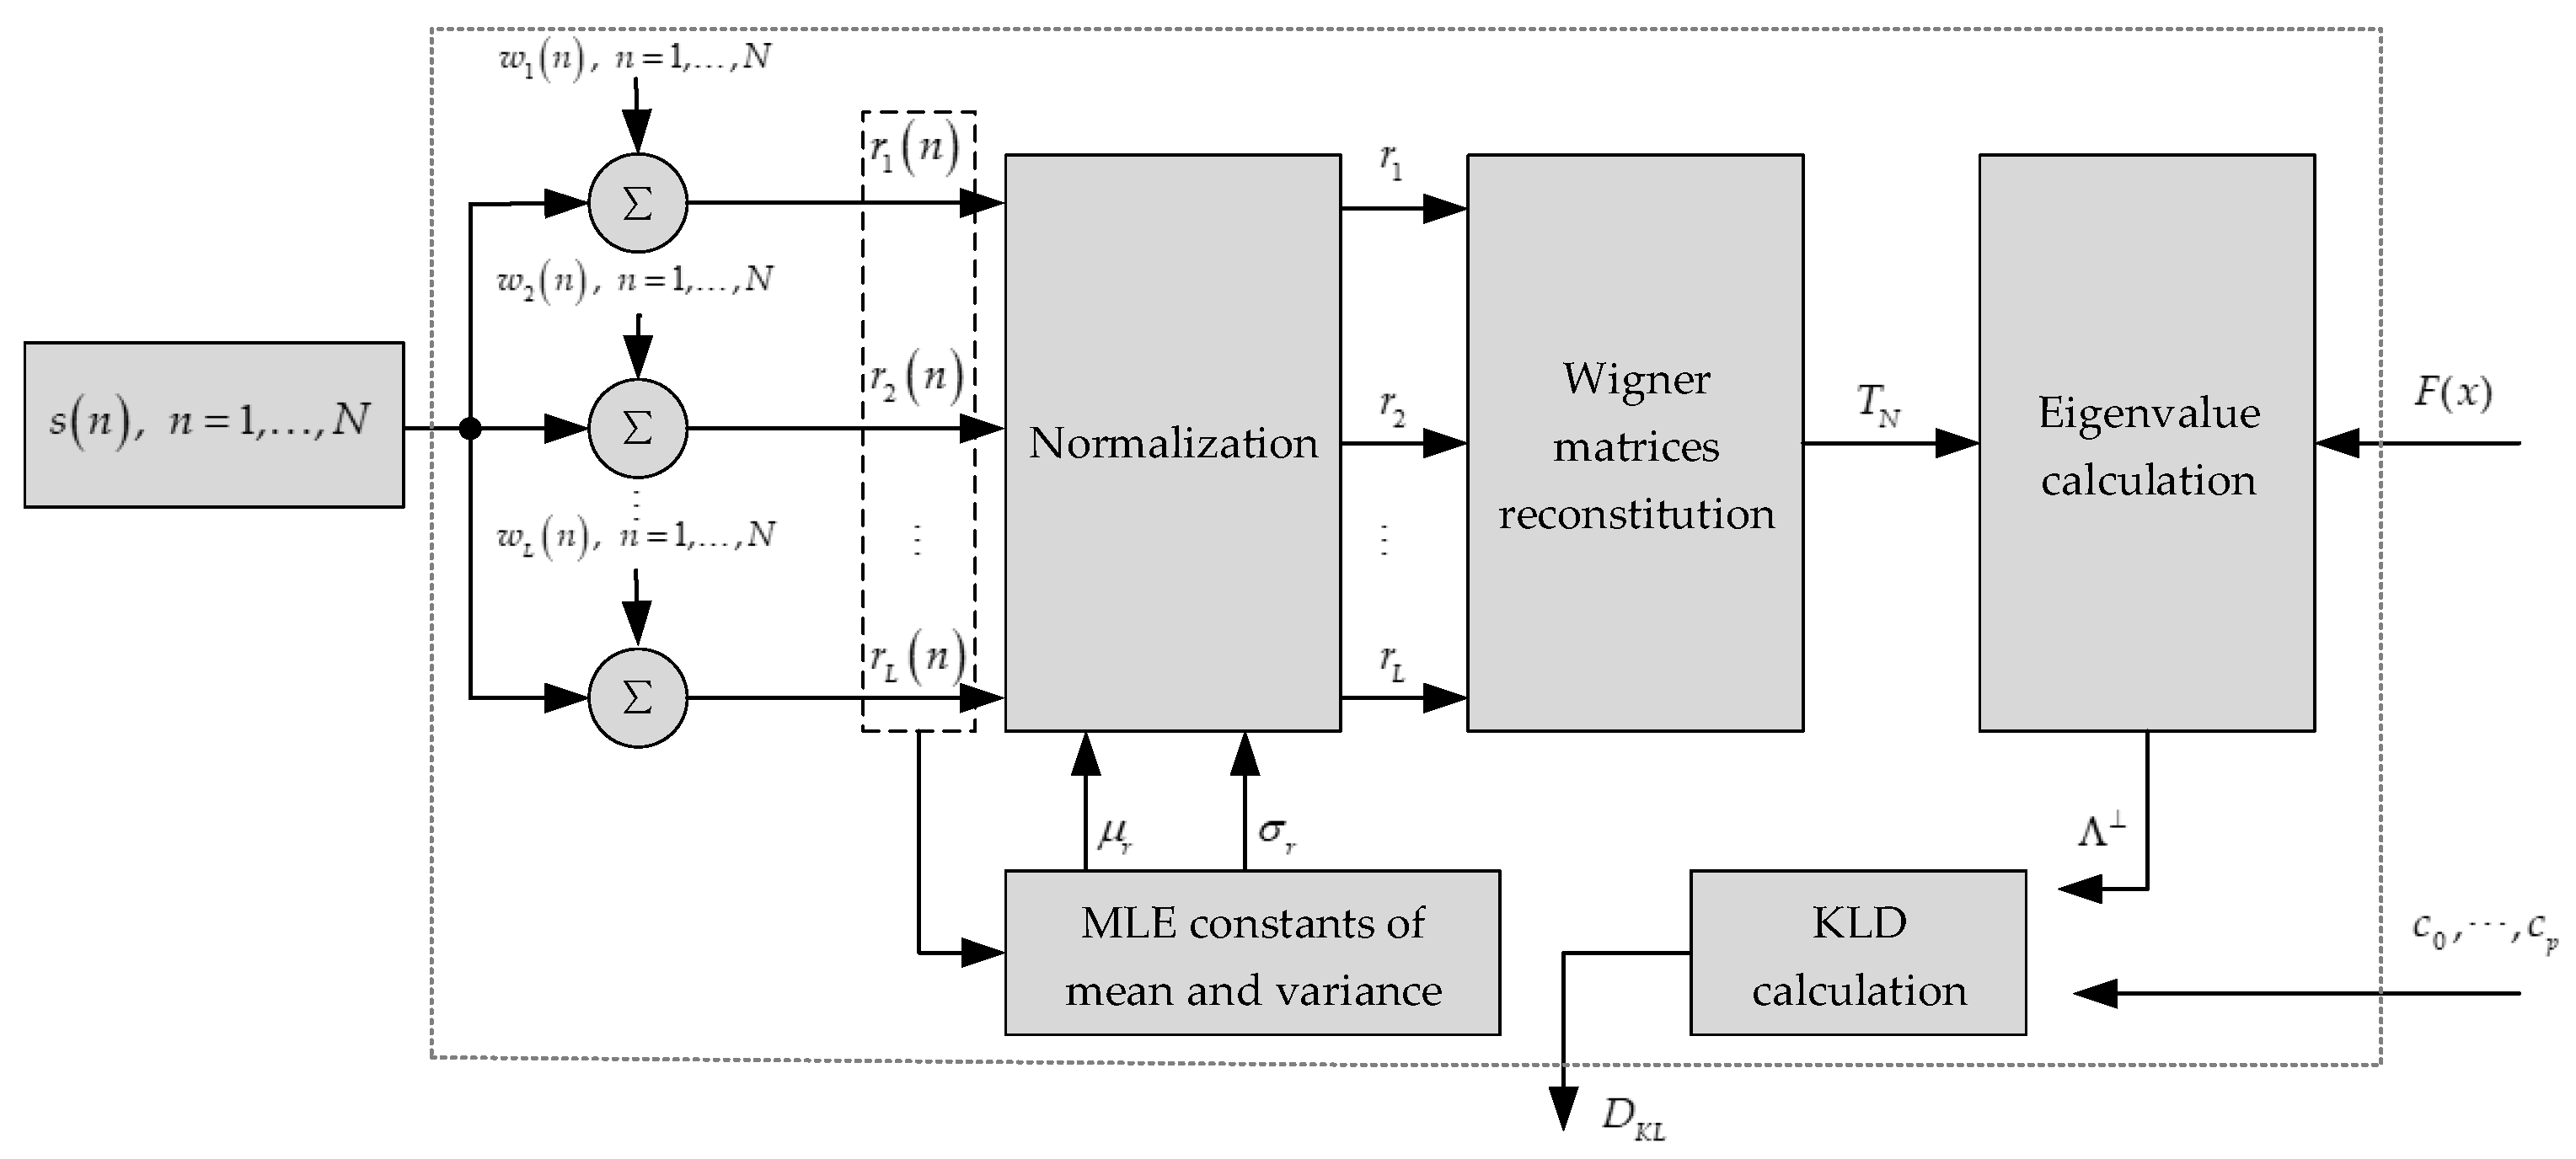
The KLD between the empirical spectral CDF and the finite dimensional spectral CDF is used as an airborne radar RFS performance indicator [23,24]. Its calculation process is depicted in Figure 1.
The KLD of from is defined as:
where f and denote the PDF of F and , respectively.
Since the interval of eigenvalues of random matrix is inconclusive, to simplify Equation (4), the probability integral transform is used to transform the original eigenvalues to an equivalent set . As and , the elements of set come from the uniform distribution . Thus, as set , we have the density function where is given by:
We also have the empirical spectral CDF .
As previously stated, the KLD can be calculated by:
where is the empirical CDF of eigenvalue set , U is the CDF of the uniform distribution in , and and are the corresponding PDFs.
We define as the partition points in the interval , and . When and , the test statistic can finally be derived as:
2.2. Application of Wigner Matrices in Echo Detection
With the increase of the number of antennas received by radar or passive sensor and the sampling data of each antenna, the data we need to process usually have the traits of high dimension. However, the traditional limit theorem is only applicable to data with fixed dimensions, and it is no longer applicable to data with higher dimensions [25]. Therefore, random matrix theory (RMT), which is used to process large-dimensional data, has been widely concerned and applied. Since E. Wigner established the well-known semicircular law, RMT has been developed into a pivotal research area in mathematical physics and probability. This paper makes proper use of the semicircular law property of the RMT to derive the essential characteristics of the signal.
An Hermitian matrix is a Wigner matrix if its upper-triangular entries are independent zero mean random variables with identical variance. If the variance is , is a standard Wigner matrix. This is a generally accepted definition of Wigner matrices.
When , the empirical spectral distribution of the normalized Wigner matrix weakly converges to the semicircular distribution, and has the following PDF:
If denotes the kth moment of the semicircular law, we can obtain the following lemma. For , we have [26]:
where represents Gamma function.
Suppose that are independently identically distribution (IID) samples drawn from a n-dimensional multivariate normal population . Then, the sample covariance matrix is defined as:
where . When m tends to infinity, and . denotes the normalized Wigner matrix.
Suppose a Wigner matrix is a symmetric matrix of , and, for the sake of derivation, we set N = 2 m. The PDF of the eigenvalues of Wigner matrix can be calculated by [27]:
where is a standardized Hermitian function and , is an Hermitian polynomial and .
The spectral CDF of Wigner matrices in finite dimensions can be expressed by the equation:
For purpose of calculating the display expression in Equation (12), we need to calculate the integral term . Bringing the expression of the standardized Hermitian function into the integral term, we can obtain:
For simplicity, is represented by . Thus, the Hermitian polynomial can be described as: . Bringing it into , we get:
where is the CDF of the standard normal distribution and is given by:
According to Equations (13) and (14), can be finally calculated as follows:
3. Description of the Echo Detection Algorithm for Stealth Extended Targets
The electromagnetic wave emitted by the radar is reflected by the detection target to obtain the target echo signal, which not only contains useful signals characterizing the target traits, but also contains clutter and various noises. Aiming at the issue of stealth extended target detection of wideband radar signals, this paper only studies the target echo detection problem in the presence of background white Gaussian noise without considering the impact of clutter on echo due to the relatively long detection distance for most airborne warning radars that take airborne aircraft and missiles as targets.
3.1. Detection Method of Target Echo
For a single receiving antenna, the signal detection problem can be described by a binary hypothesis test of a null hypothesis (: signal absent) and an alternative hypothesis (: signal present), as follows:
where is the received signal and is the background noise. We set , where N is the number of signal samples.
A common method to solve the hypotheses test in Equation (20) is the normality test [28], such as Jarque-Bera test, Lilliefors test, or Anderson-Darling test. Moreover, the signal detection performance of multi-receiving antenna is usually better than that of single receiving antenna. The binary hypothesis testing problem in Equation (20) can be transformed into a multiple hypothesis testing:
where represents the number of receiving antennas.
One of the most typical approaches for solving Equation (21) is likelihood ratio test (LRT), which devises rational test statistics via likelihood functions. It is not easy to get the PDFs of under and (denoted as and ), which results in a great difficulty in obtaining the likelihood function , where is a set of . Consequently, most of the research is based on the assumption that the received sample values are Gaussian and independent. Among them, the maximum and minimum eigenvalue (MME) detection method [29] is one of the most effective signal detection algorithms. It utilizes the eigenvalues of the sample covariance matrix as the test statistic. Nevertheless, MME method discards most of the eigenvalue information, using only the maximum and minimum values of the eigenvalues, thus reducing the performance of signal detection to some extent.
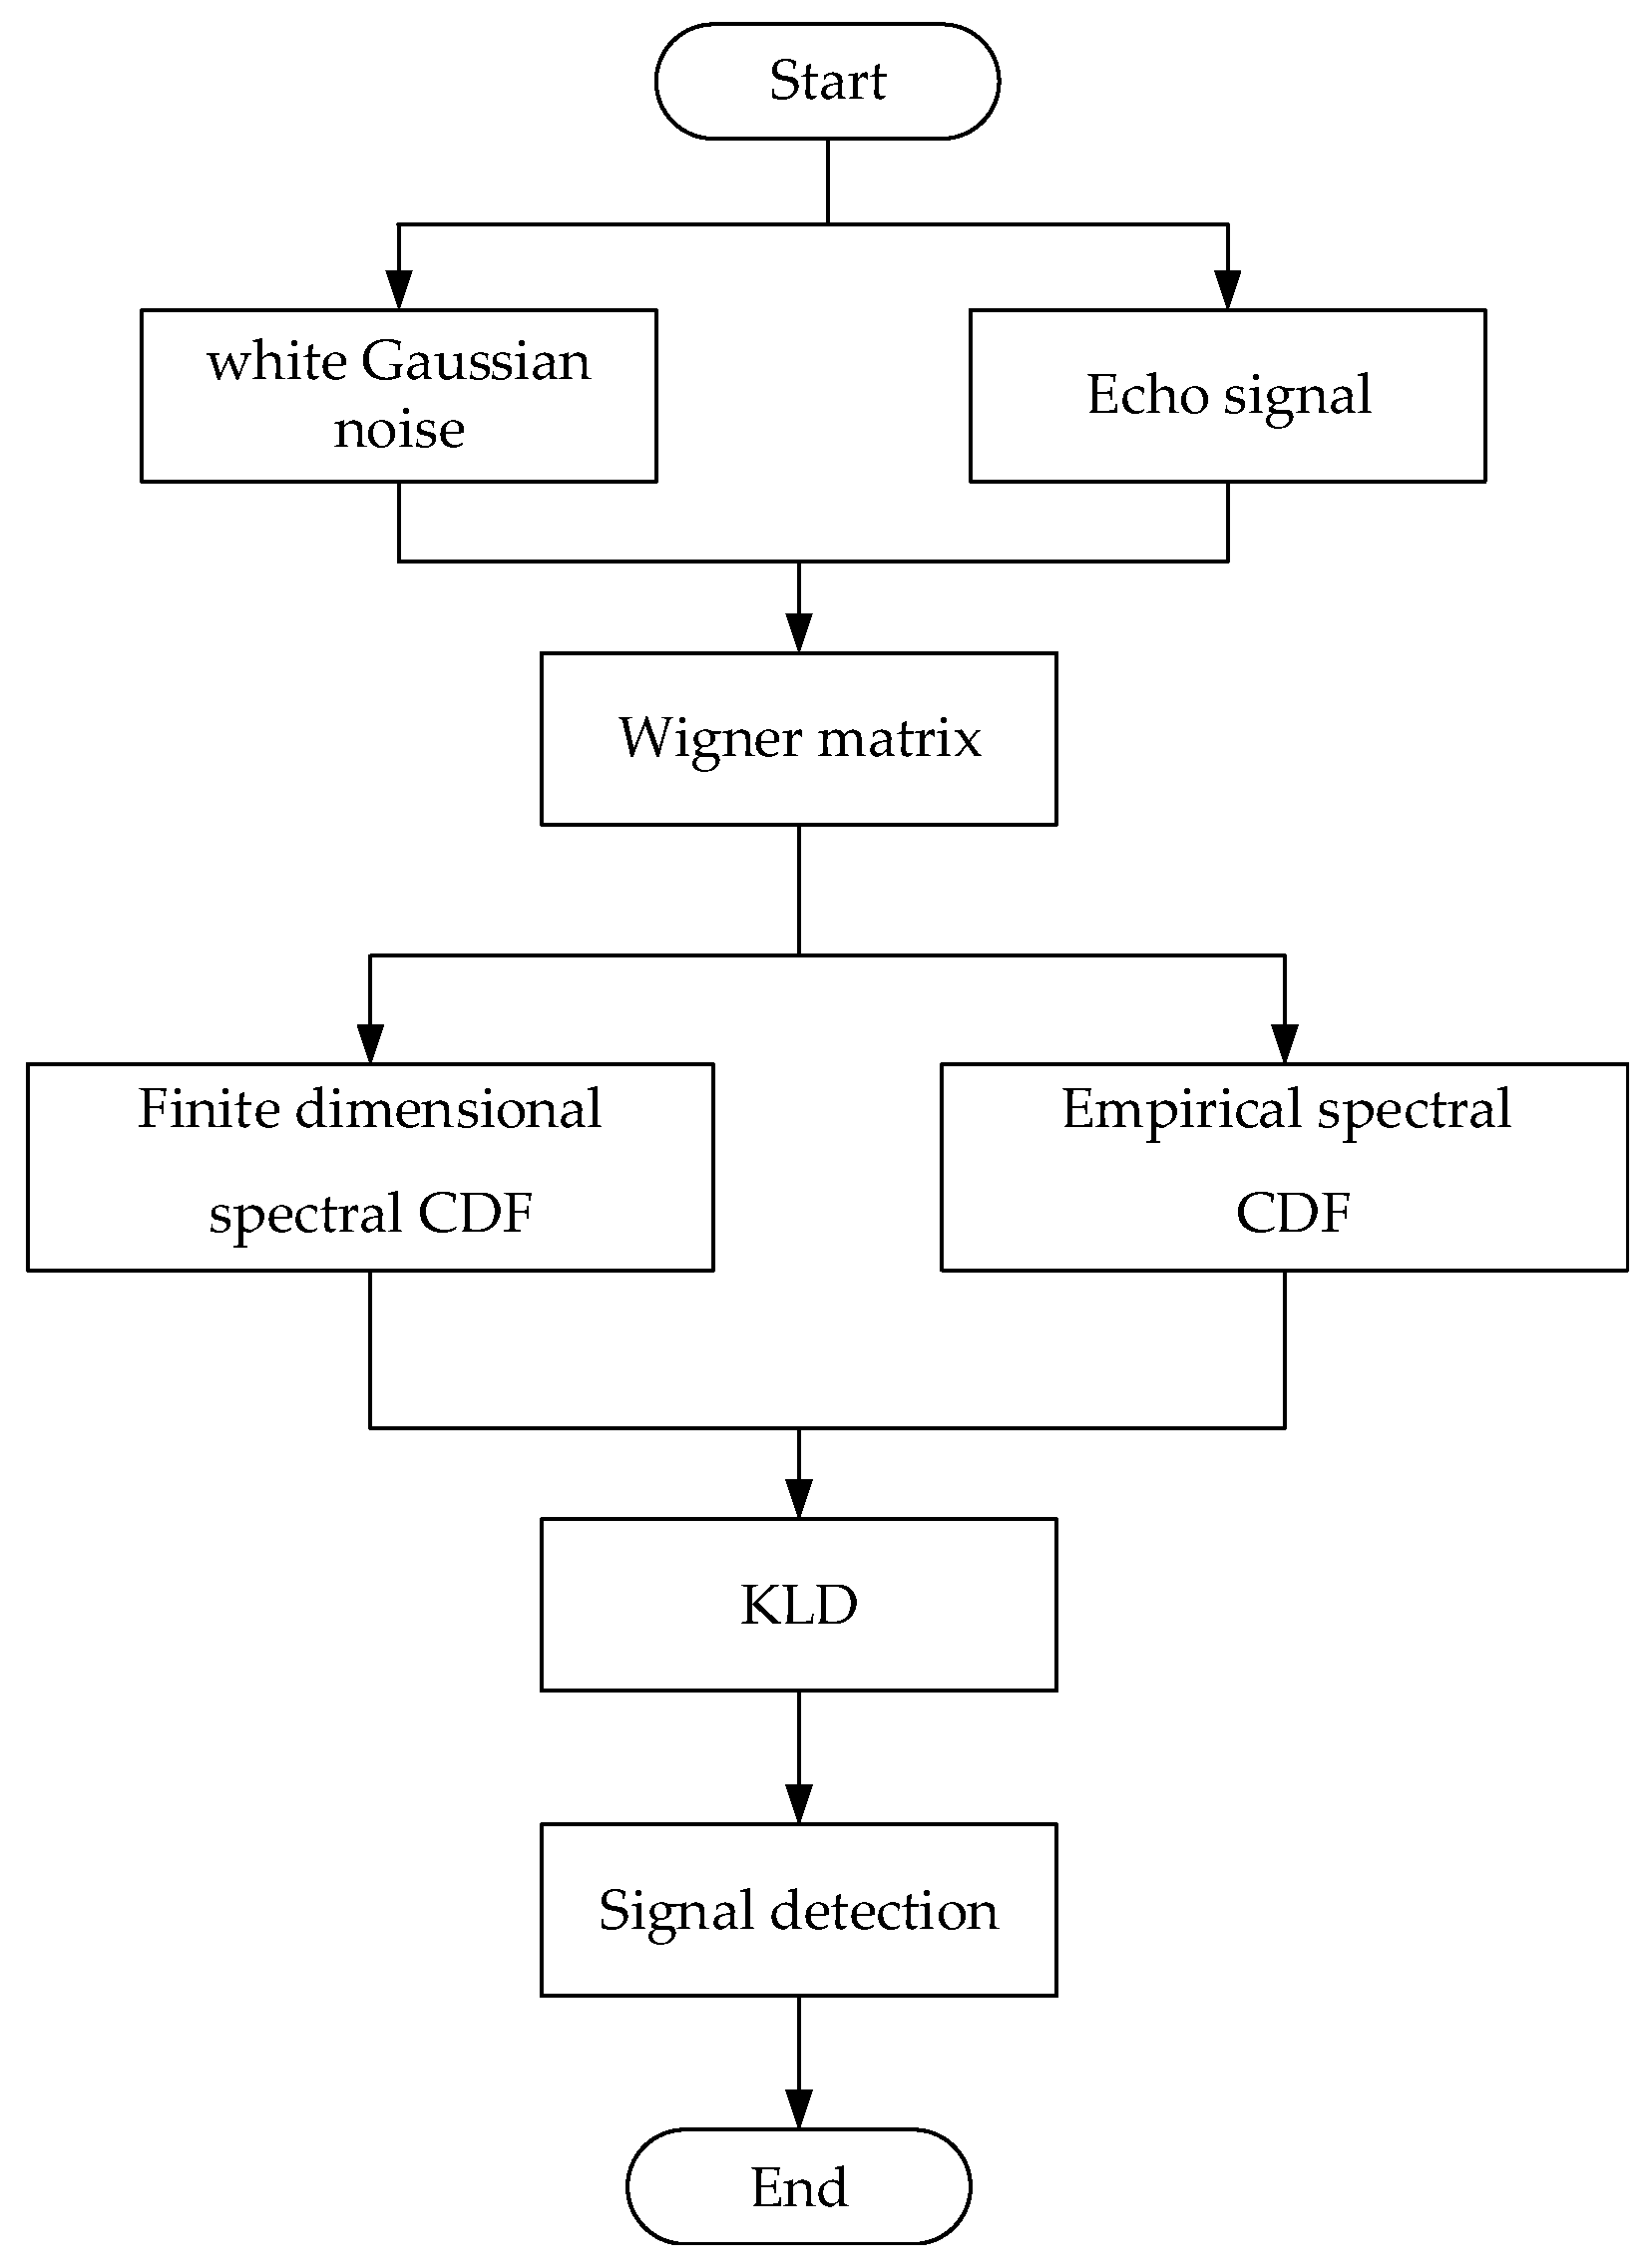
Here, from the perspective of random matrix, the spectral distribution characteristic of Wigner matrices in finite dimensions is taken as the essential characteristic of white Gaussian noise, and the distance between empirical spectral CDF of observed signals and spectral CDF of Wigner matrices in finite dimensions is measured by KLD, which measures multivariate data information. The specific target echo detection process is shown in Figure 2.
3.2. Spectral CDF of Wigner Matrices in Finite Dimension
Assuming that the echo signal has no target, only the background white Gaussian noise, the constructed Wigner matrix is a symmetric matrix of . In the light of the theoretical basis of Section 2.2, the PDF of the eigenvalues of a symmetric Wigner matrix can be formulated as:
Assuming that , the PDF of the symmetric Wigner matrix with dimension constructed via white Gaussian noise signal can be obtained as follows [30]:
According to Equations (12)–(17) in Section 2.2, the above PDF can be integrated to obtain the spectral CDF of Wigner matrix in finite dimension constructed by white Gaussian noise signal, which can be calculated as follows:
For detailed explanation of the parameters, please refer to Equations (15)–(19).
3.3. Echo Detection of Wideband Radar Signal
The detection of stealthy extended target in wideband radar signal is described as a binary hypothesis test. When there are both target echo signal and white Gaussian noise in the echo signal, the above binary hypothesis testing problem is simply described as:
where , is the transmitted signal vector, , is the channel coefficient from the transmitter to the ith receive antenna, and . is an additive white Gaussian noise (AWGN) matrix. Note oversampling is used in each receive antenna with K samples. Let and can be defined as , where the sample value of echo signal , is a random vector from the M-dimensional normal population with IID. Among them:
The mean value of the sample value of the normalized echo signal and its sample covariance matrix can be obtained, which can be expressed by:
When the number of pulses is , , ( is a standard Wigner matrix). Let .
Furthermore, the KLD between the empirical spectral CDF of the random matrix constructed by the echo signal and the finite dimensional spectral CDF of white Gaussian noise is used to detect the extended target echo signal. The distance of the test statistic information is defined as:
where f and denote the PDF of F and , respectively.
According to Equations (4)–(7) in Section 2.1, Equation (28) can be further converted into:
where U is the CDF of the uniform distribution .
Since KLD is non-negative, the algorithm in this paper is a one-sided test problem. When the false alarm rate is constant, if the test statistic is greater than or equal to the threshold value, then the null hypothesis is rejected. is the -quantile of the test statistic distribution function under the null hypothesis. Since the number of samples and the distribution of the test statistic are unknown under the null hypothesis, the corresponding detection threshold can only be determined by obtaining the percentile of the empirical distribution of test statistics through the Monte Carlo method [31].
The algorithm complexity of the proposed method mainly comes from the calculation of covariance matrix shown in Equation (27) and the eigenvalue decomposition of matrix . The computational complexity of the sample covariance matrix is . For the eigenvalue decomposition of matrix , the computational complexity is . Consequently, algorithm complexity of this paper can be expressed by:
4. Numerical Simulations and Performance Analysis
In this section, we provide numerical simulations to demonstrate the accuracy of the theoretical calculations as well as quantify the detection performance of the target echo detection based on KLD and Wigner matrices. This section is divided into two parts. Section 4.1 considers Figure 2 in Section 3.1 as the schematic diagram to devise the simulation and finally obtains the detection performance of the proposed method. Section 4.2 introduces the influencing factors of detection performance.
4.1. Comparison of Detection Performance
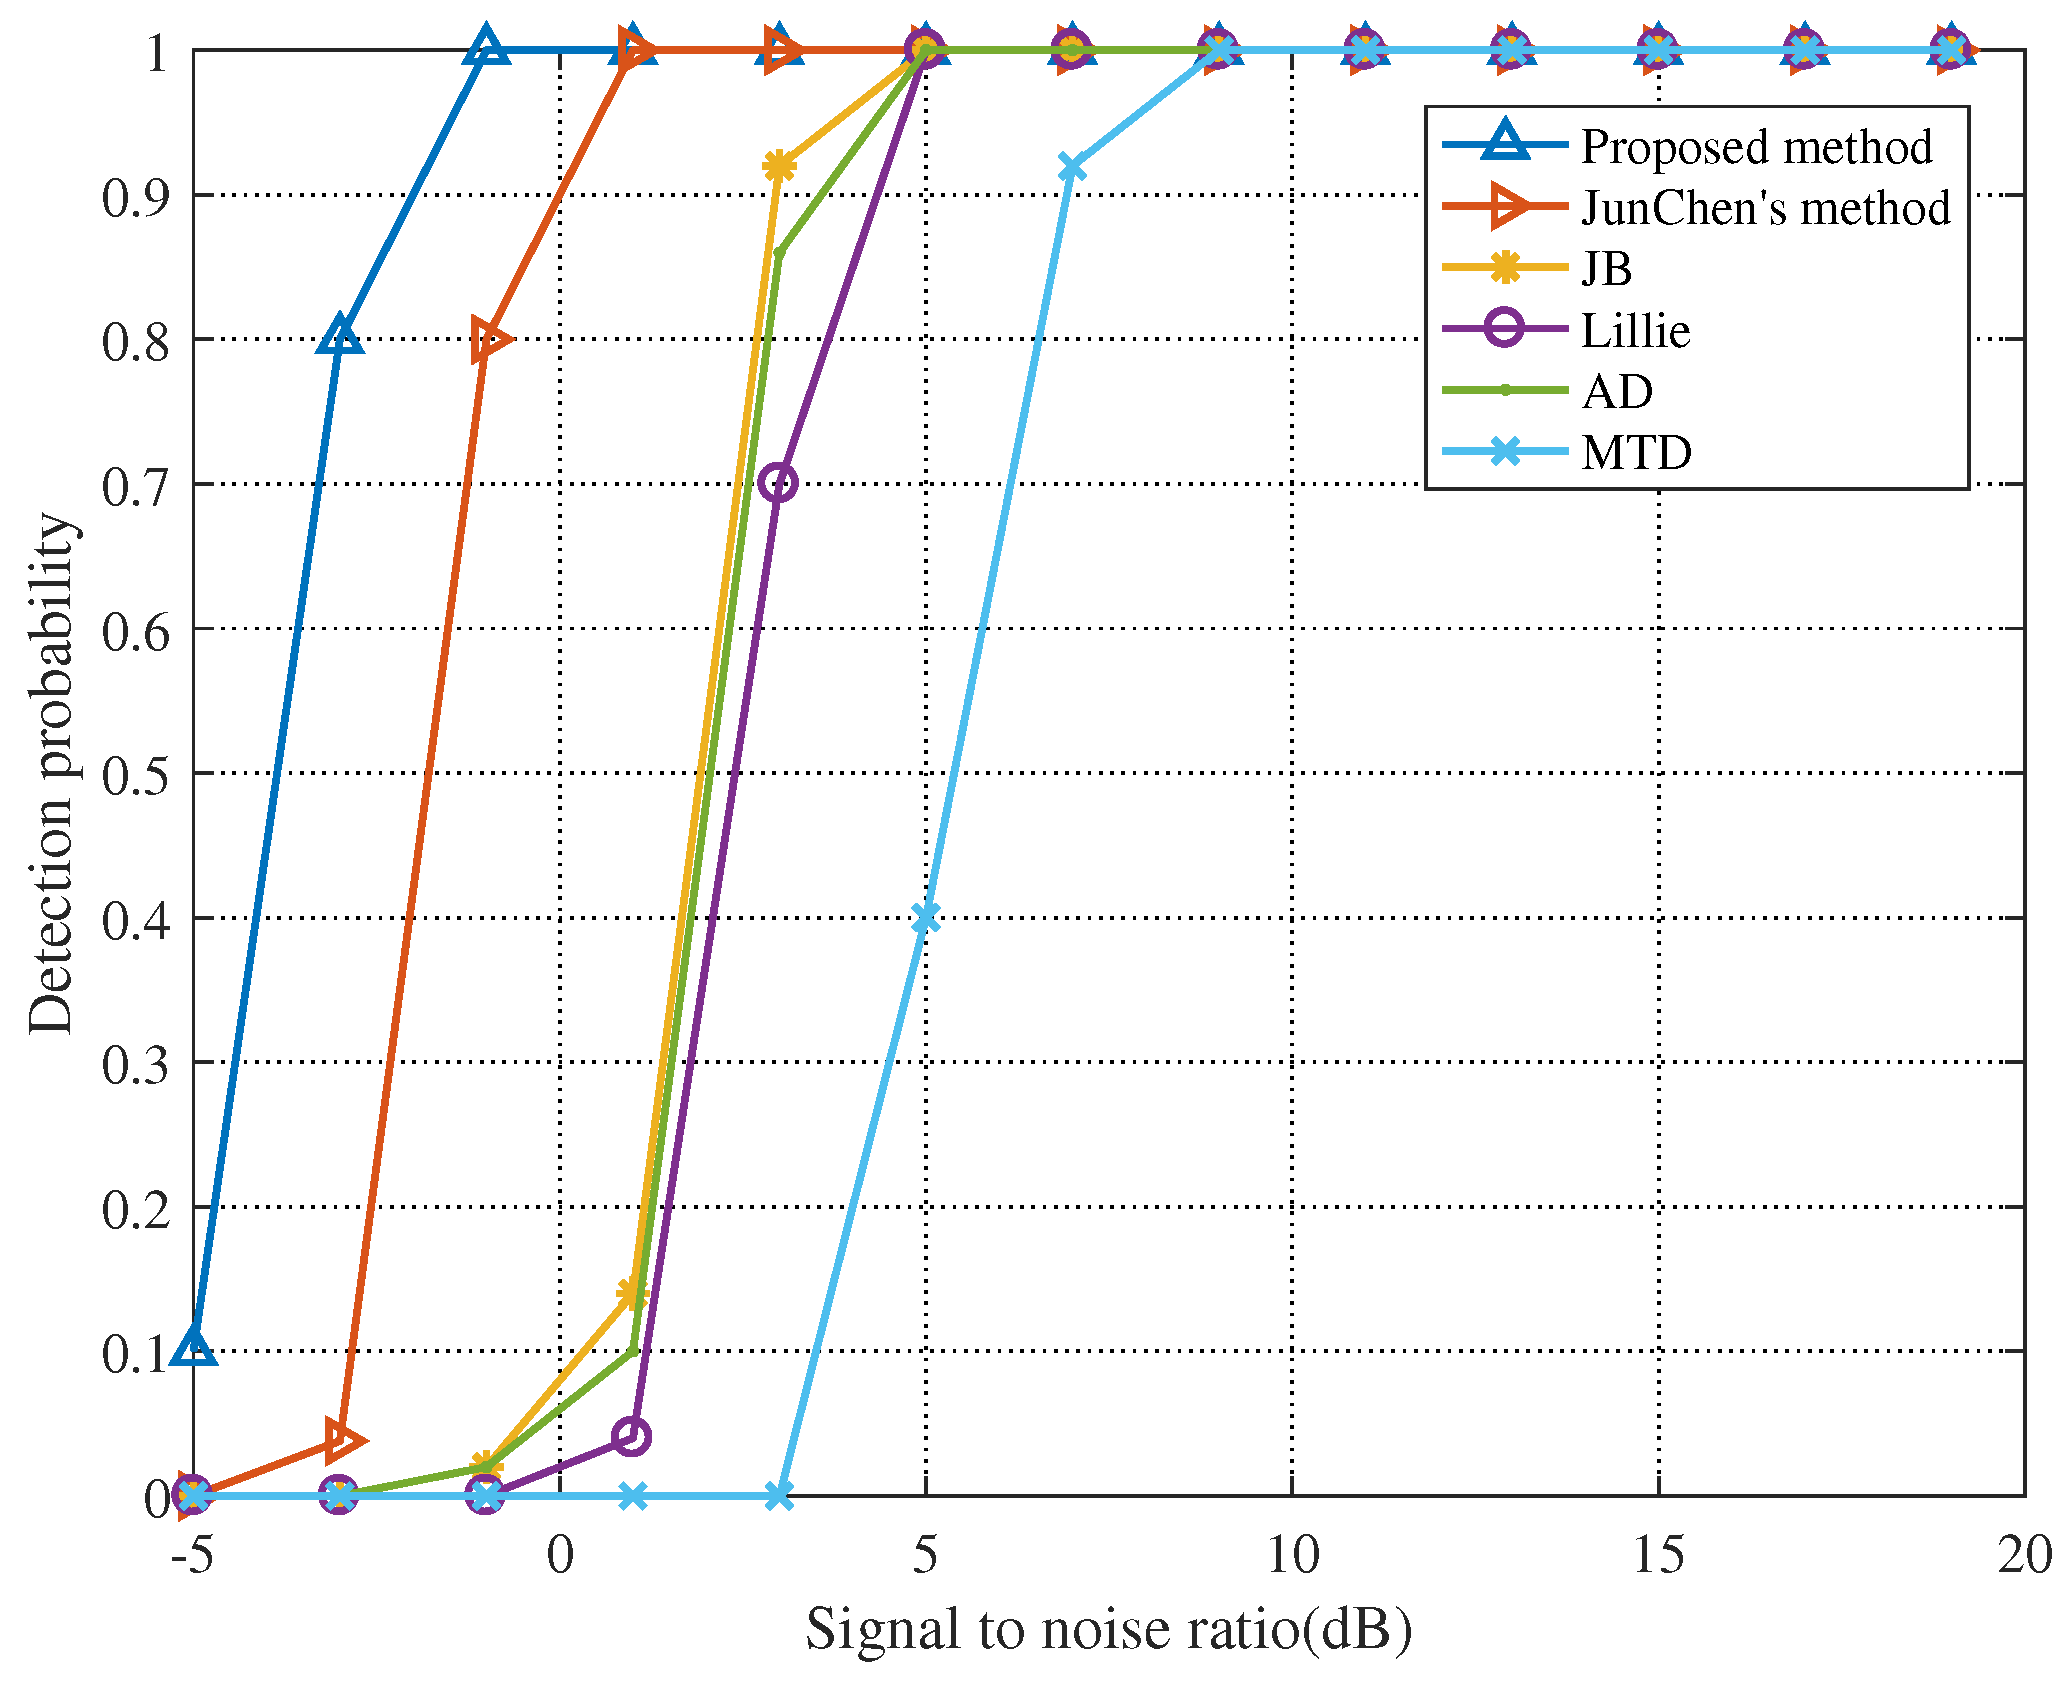
Here, consider common LPI radar waveforms: Linear frequency modulation (LFM) and Poly-Phase Shift Keying (PPSK) techniques including Frank, P1, P2, P3, and P4 codes [32]. To verify the efficiency of the proposed method, Figure 3 precisely illustrates the comparison of performance between the proposed method and the three established ones, namely, Jun Chen’s method, the normality tests, and the MTD [33,34]. The normality tests are Jarque-Bera test (JB), Lilliefors test (Lillie), and Anderson-Darling test (AD). For wideband radar signals, we continuously select 10 echo pulses in the same range gate and make the width of each echo pulse as 1 s. Each pulse may be an arbitrary LPI radar waveform, and the interval of any two pulses is stochastic and larger than the unambiguity range. The signal bandwidth is 600 MHz and the signal sampling frequency is 4.8 GHz. We set false alarm rate and detection threshold . When the test statistic is greater than or equal to the detection threshold, it indicates that the signal is detected in the echo, otherwise the echo is noise.
As shown in Figure 3, when the SNR is 7 dB, the detection probability of MTD approaches 1. The detection performance of JB, Lillie, and AD are virtually the same. Even though Jun Chen’s method is superior to the above four methods, it still fails to detect signals when the SNR is −3 dB. The detection probability is close to 1 until the SNR declines to −3 dB for the proposed method. We can find that, with the increase of SNR, these methods can detect the signal, but the method proposed in this paper can obviously tackle the problem of target detection in low SNR.
For purpose of comparing the effect of signal sampling frequency on detection performance, we set the signal sampling frequency at 3 GHz and keep other parameters unchanged. By calculation, the detection threshold at a sampling frequency of 3 GHz is . We simulated again to obtain Figure 4.
When the sampling frequency is reduced, the detection performance of all methods will decrease. For example, the detection probability is close to 1 until the SNR declines to −1 dB for the proposed method. In Figure 4, it can be seen that, even if the sampling frequency of the signal is changed, the method proposed in this paper is still superior to other detection methods.
By comparing Figure 3 and Figure 4, we can find that the sampling frequency has a certain impact on signal detection performance. For the sake of obtaining more intuitive data, we set the SNR at 3 dB and keep other parameters unchanged. The detection probabilities of the six different detection methods at different sampling frequencies are listed in Table 1 ( denotes the sampling frequency of the signal).
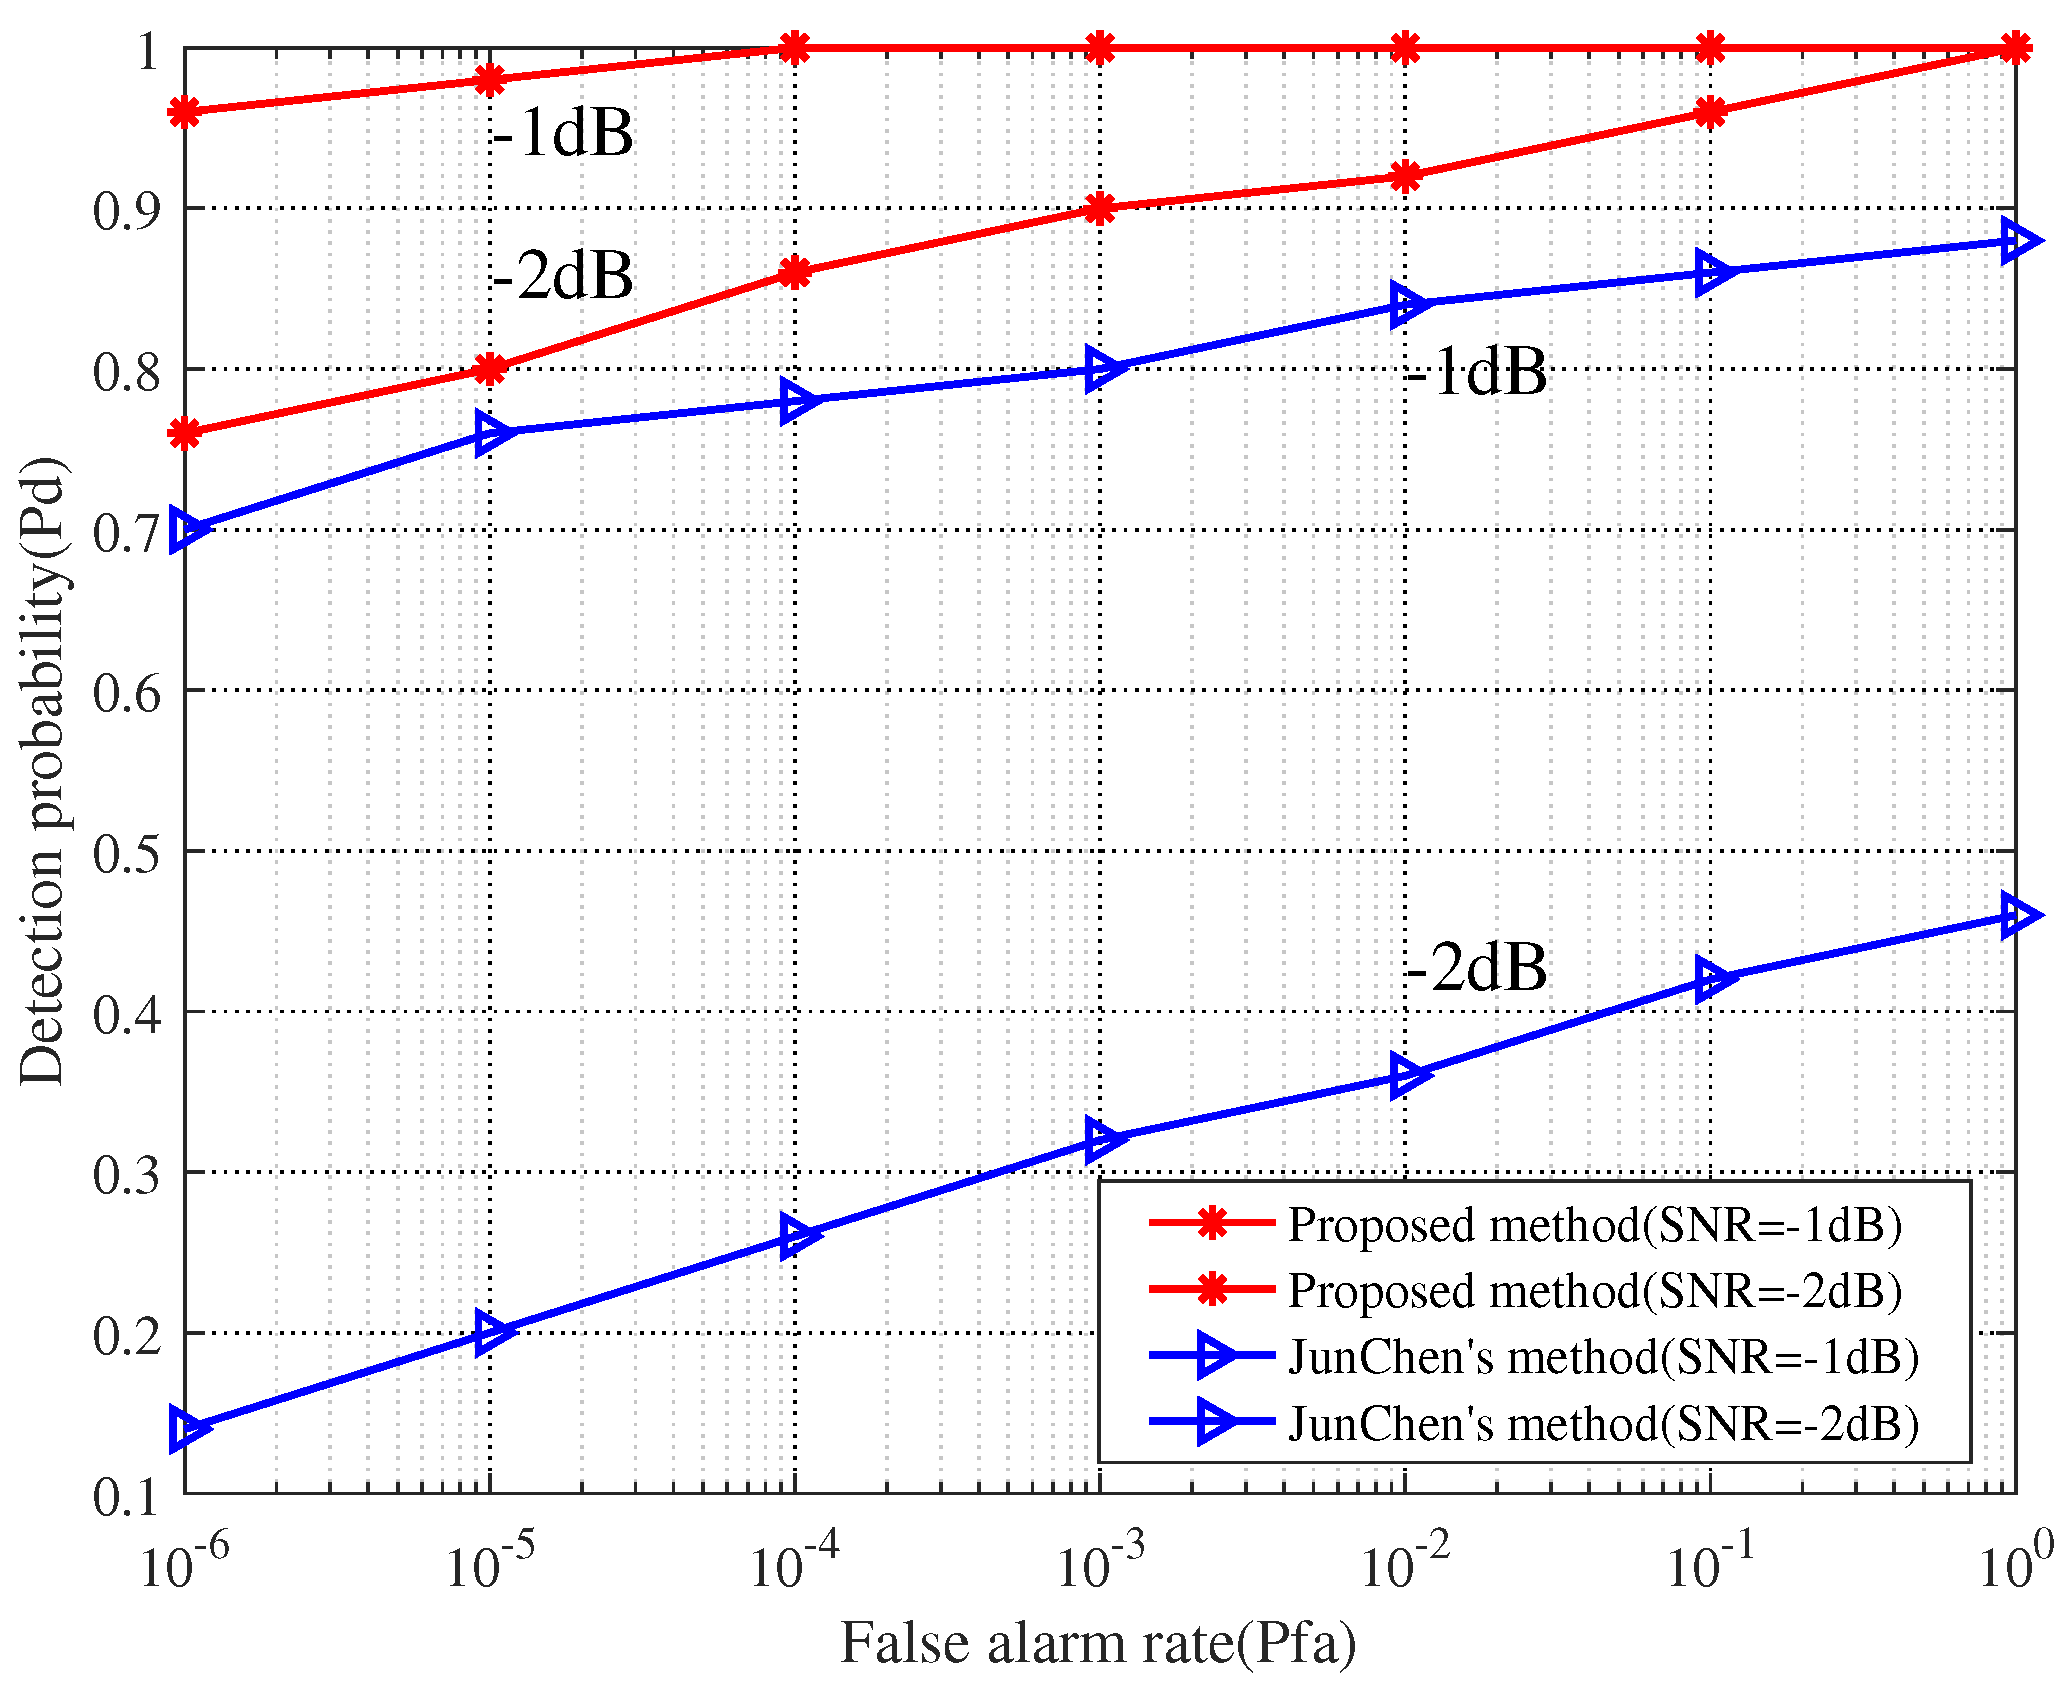
As can be seen from Table 1, the proposed method and Jun Chen’s method are relatively superior to the other methods. Figure 5 shows the receiver operating characteristic (ROC) curves of these two methods over different SNR. We set the signal sampling frequency at 3 GHz and keep other parameters unchanged.
In Figure 5, it can be seen that the false alarm rate and SNR are significantly and positively correlated with detection probability. In addition, with the same SNR and false alarm rate, the detection probability of the proposed method is higher than that of Jun Chen’s method.
By comparing different detection methods, we verified the efficiency of the proposed algorithm. However, the signal we selected is random; we are not sure whether the presented algorithm is valid for ubiquitous LPI signals. To deeply investigate the robustness of the advocated method, we experimentally simulated LFM, Frank, P1, P2, P3, and P4 codes to demonstrate that the proposed algorithm has fabulous target detection performance, as shown in Figure 6.
As can be observed in Figure 6, the algorithm proposed in this paper has positive detection performance for the LPI signals listed above. Therefore, we can find that the stochastic or non-stochastic modulation of the signal has little impact on the detection of the echo signal. When the SNR is −1 dB, the detection probability of all signals approaches 1. This fully manifests whether a radar waveform has better or worse stealth performance than another radar waveform, not only associated with the waveform itself, but also to the SNR.
4.2. Influencing Factors of Detection Performance
Figure 3, Figure 4, Figure 5 and Figure 6 show that the SNR has a significant impact on target detection performance. Additionally, we also found that the starting sampling point (SSP) of the signal has a certain influence on target detection performance. When the echo signal is sampled, we cannot be sure that the sample must contain a useful signal, and we cannot identify the starting point of the useful signal. To gain more insight, we demonstrated our hypothesis through simulation experiments.
means that there is a signal in the initial sample data, means no signal in the first of the sample data, means no signal in the first of the sample data, means no signal in the first of the sample data, and means no signal in the sample data. Figure 7 shows that the earlier is the SSP, the better is the detection performance.
Figure 8 and Figure 9, respectively, exemplify certain statistical analyses on the test statistics advocated by Jun Chen and the proposed method. Similarly, the parameter settings here are the same as those given in Figure 4.
Figure 8 shows that, as the SNR increases, the test statistic will continue to increase and eventually stabilize. However, when there is no signal in the first and the first of the data, the variance of the test statistic will not reach a constant value. These indicate that the detection method presented by Jun Chen has no steady detection performance.
Conversely, in Figure 9, when the SNR reaches 13 dB, the test statistic will tend to stabilize. As the SNR increases, the variance of the test statistic first becomes larger and then becomes smaller until it is 0. These elucidate that the detection method proposed in this paper has strong robustness. Furthermore, it can be found that the minimum value of the test statistic in the blue line is greater than the detection threshold when the SNR is −1 dB. This means that the test statistic can detect the signal when the SNR is greater than −1 dB. When only the noise is included in the first and the first echo signals, the test statistic can detect the echo signal when the SNR is greater than 1 dB.
5. Conclusions
In this paper, a new target detection algorithm is brought forward from the perspective of information theory and random matrix for stealthy extended target. This algorithm is innovatively integrated into the basic theory of Wigner matrices and KLD. Numerical results verify that the proposed algorithm has favorable detection performance and strong robustness, which enable it to secure a superiority over other alternatives. Not only does it increase the sensitivity of airborne radar, but it also provides a novel idea for designing airborne radar RFS technology.
Furthermore, the following works will be further studied in the future.
- Containing abundant information, KLD is taken as the test statistic, whose mean and variance are studied in this paper and whose deeper content needs to be further explored in the future.
- Figure 6 demonstrates that the proposed method has fabulous target detection performance for common LPI radar waveforms (LFM, Frank, P1, P2, P3, and P4 codes), but for advanced LPI signals, whether the proposed method can still maintain superior detection performance remains to be further studied.
- It is widely believed that finding a balance between observation duration and detection rates is the ultimate goal of the detection of ultra-high-speed targets. Hence, it also might be of interest to devise an effective detection method of ultra-high-speed targets in a short observation time.
Author Contributions
Conceptualization, D.X. and F.W.; methodology, D.X.; software, F.W.; validation, D.X. and J.C.; formal analysis, D.X. and J.C.; investigation, F.W.; resources, J.C.; data curation, D.X.; writing—original draft preparation, D.X.; writing—review and editing, D.X.; visualization, J.C.; supervision, J.C.; project administration, F.W.; and funding acquisition, F.W.
Funding
This research received no external funding.
Acknowledgments
This work was partially supported by National Natural Science Foundation of China under (Grant No. 61801212), Natural Science Foundation of Jiangsu Province under (Grant Nos. BK20180423 and BK20190772), Aeronautics Science Foundation of China (Grant Nos. 2017ZC52036 and 20172752019), and Key Laboratory of Radar Imaging and Microwave Photonics (Nanjing Univ. Aeronaut. Astronaut.), Ministry of Education, China.
Conflicts of Interest
The authors declare no conflict of interest.
References
- Wang, F.; Sellathurai, M.; Liu, W.; Zhou, J. Security information factor based airborne radar RF stealth. J. Syst. Eng. Electron. 2015, 26, 258–266. [Google Scholar] [CrossRef]
- Donatien, S.; Seung, N.; Jin, K.; Ngoc, B. Low-Rank Matrix Recovery Approach for Clutter Rejection in Real-Time IR-UWB Radar-Based Moving Target Detection. Sensors 2016, 16, 1409. [Google Scholar] [CrossRef] [Green Version]
- Sun, Z.; Li, X.; Yi, W. Range walk correction and velocity estimation for high-speed target detection. In Proceedings of the 2017 IEEE Radar Conference, Seattle, WA, USA, 8–12 May 2017; pp. 1478–1482. [Google Scholar]
- Tao, R.; Zhang, N.; Wang, Y. Analysing and compensating the effects of range and Doppler frequency migrations in linear frequency modulation pulse compression radar. IET Radar Sonar Navig. 2011, 5, 12–22. [Google Scholar] [CrossRef]
- Zhang, S.; Zhang, W.; Wang, Y. Multiple targets’ detection in terms of Keystone transform at the low SNR level. In Proceedings of the 2008 International Conference on Information and Automation, Changsha, China, 20–23 June 2008; pp. 2184–2188. [Google Scholar]
- Scott, K.M.; Barott, W.C.; Himed, B. The keystone transform: Practical limits and extension to second order corrections. In Proceedings of the 2015 IEEE Radar Conference, Arlington, VA, USA, 10–15 May 2015; pp. 1264–1269. [Google Scholar]
- Kong, L.; Li, X.; Cui, G.; Yi, W.; Yang, Y. Coherent Integration Algorithm For A Maneuvering Target with High-Order Range Migratione. IEEE Trans. Signal Process. 2015, 63, 4474–4486. [Google Scholar] [CrossRef]
- Zhang, S.; Zeng, T.; Long, T.; Yuan, H. Dim target detection based on keystone transform. In Proceedings of the 2005 IEEE International Radar Conference, Arlington, VA, USA, 9–12 May 2005; pp. 889–894. [Google Scholar]
- Barry, D.T. Fast calculation of the Choi-Williams time-frequency distribution. IEEE Trans. Signal Process. 1992, 40, 450–455. [Google Scholar] [CrossRef]
- Wang, M.; Chan, A.K.; Chui, C.K. Linear frequency-modulated signal detection using Radon-ambiguity transform. IEEE Trans. Signal Process. 1998, 46, 571–586. [Google Scholar] [CrossRef]
- Barbarossa, S. Analysis of multicomponent LFM signals by a combined Wigner-Hough transform. IEEE Trans. Signal Process. 1995, 43, 1511–1515. [Google Scholar] [CrossRef]
- Joaquim, S. Non-Parametric Tests of Hypotheses. In Applied Statistics Using SPSS, STATISTICA and MATLAB, 2nd ed.; Joaquim, P., Roberto, F., Eds.; Springer: Berlin, Germany, 2007; pp. 172–188. [Google Scholar]
- Karbasi, S.M.; Aubry, A.; De Maio, A. Robust Transmit Code and Receive Filter Design for Extended Targets in Clutter. IEEE Trans. Signal Process. 2015, 63, 1965–1996. [Google Scholar] [CrossRef]
- Cheng, X.; Aubry, A.; Ciuonzo, D.; De Maio, A.; Wang, X. Robust Waveform and Filter Bank Design of Polarimetric Radar. IEEE Trans. Aerosp. Electron. Syst. 2017, 53, 370–384. [Google Scholar] [CrossRef]
- Ciuonzo, D.; De Maio, A.; Orlando, D. A Unifying Framework for Adaptive Radar Detection in Homogeneous Plus Structured Interference—Part II: Detectors Design. IEEE Trans. Signal Process. 2016, 64, 2907–2919. [Google Scholar] [CrossRef] [Green Version]
- Conte, E.; De Maio, A.; Ricci, G. GLRT-based adaptive detection algorithms for range-spread targets. IEEE Trans. Signal Process. 2001, 49, 1336–1348. [Google Scholar] [CrossRef]
- Dai, F.; Liu, H.; Shui, P.; Wu, S. Adaptive Detection of Wideband Radar Range Spread Targets with Range Walking in Clutter. IEEE Trans. Aerosp. Electron. Syst. 2012, 48, 2052–2064. [Google Scholar] [CrossRef]
- Ciuonzo, D. On Time-Reversal Imaging by Statistical Testing. IEEE Signal Process. Lett. 2017, 24, 1024–1028. [Google Scholar] [CrossRef] [Green Version]
- Shannon, C.E. A mathematical theory of communication. Bell Labs Tech. J. 1948, 27, 623–656. [Google Scholar] [CrossRef]
- Bell, M.R. Information theory and radar waveform design. IEEE Trans. Inf. Theory 1993, 39, 1578–1597. [Google Scholar] [CrossRef] [Green Version]
- Kullback, S.; Leibler, R.A. On Information and Sufficiency. Ann. Math. Statist. 1951, 22, 79–86. [Google Scholar] [CrossRef]
- Shao, H.; Miao, L.; Gao, W.; Shen, J. Ensemble Particle Filter Based on KLD and Its Application to Initial Alignment of the SINS in Large Misalignment Angles. IEEE Trans. Ind. Electron. 2018, 65, 8946–8955. [Google Scholar] [CrossRef]
- Chen, J.; Wang, F.; Zhou, J. Wigner-Matrix-Based Normality Test and Application to Weak Signal Detection in SISO/SIMO Systems. Chin. Phys. Lett. 2016, 33, 5–8. [Google Scholar] [CrossRef]
- Chen, J.; Wang, F.; Zhou, J. On Short-Time Velocity Identification and Coherent-Like Detection of Ultrahigh Speed Targets. IEEE Trans. Signal Process. 2018, 66, 4811–4825. [Google Scholar] [CrossRef]
- Couillet, R.; Debbah, M. Random matrices. In Random Matrix Methods for Wireless Communications, 1st ed.; Cambridge University Press: London, UK, 2011; pp. 17–30. [Google Scholar]
- Bai, Z.; Silverstein, J.W. Wigner Matrices and Semicircular Law. In Spectral Analysis of Large Dimensional Random Matrices, 2nd ed.; Springer: Berlin, Germany, 2010; pp. 15–38. [Google Scholar]
- Mehta, M.L.; Gaudin, M. On the density of Eigenvalues of a random matrix. Nucl. Phys. 1960, 18, 420–427. [Google Scholar] [CrossRef]
- Machiwal, D.; Jha, M.K. Methods for Testing Normality of Hydrologic Time Series. In Hydrologic Time Series Analysis: Theory and Practice, 2nd ed.; Springer: New Delhi, India, 2012; pp. 32–50. [Google Scholar]
- Yousif, E.; Ratnarajah, T.; Sellathurai, M. A Frequency Domain Approach to Eigenvalue-Based Detection with Diversity Reception and Spectrum Estimation. IEEE Trans. Signal Process. 2016, 64, 35–47. [Google Scholar] [CrossRef]
- Chen, J.; Wang, F.; Zhou, J. Information content based optimal radar waveform design: LPI’s purpose. Entropy 2017, 19, 2039–2056. [Google Scholar] [CrossRef] [Green Version]
- Dunn, W.L.; Shultis, J.K. The Basis of Monte Carlo. In Exploring Monte Carlo Methods, 1st ed.; Elsevier: Amsterdam, The Netherlands, 2012; pp. 21–46. [Google Scholar]
- Kretschmer, F.F.; Lewis, B.L. Doppler Properties of Polyphase Coded Pulse Compression Waveforms. IEEE Trans. Aerosp. Electron. Syst. 1983, AES-19, 521–531. [Google Scholar] [CrossRef]
- Shen, M.; Wang, J.; Wu, D.; Zhu, D. An Efficient Moving Target Detection Algorithm Based on Sparsity-Aware Spectrum Estimation. Sensors 2014, 14, 17055–17067. [Google Scholar] [CrossRef] [PubMed] [Green Version]
- Chen, J.; Wang, F.; Zhou, J. The metrication of LPI radar waveforms based on the asymptotic spectral distribution of wigner matrices. In Proceedings of the 2015 IEEE International Symposium on Information Theory, Hong Kong, China, 14–19 June 2015; pp. 331–335. [Google Scholar]
Figure 1.
Calculation block diagram of radar RFS evaluation index KLD.

Figure 2.
A schematic diagram of target echo detection.

Figure 3.
Detection probability when sampling frequency is 4.8 GHz.

Figure 4.
Detection probability when sampling frequency is 3 GHz.

Figure 5.
Comparison of ROC over different signal to noise ratio.

Figure 6.
Detection performance of different LPI signals.

Figure 7.
The influence of SSP on detection performance when = 3 GHz and .

Figure 8.
Statistical analyses of test statistics advocated by Jun Chen.

Figure 9.
Statistical analyses of test statistics advocated in this paper.


Table 1.
Signal detection performance at different sampling frequencies.
| Method | (GHz) | ||||
|---|---|---|---|---|---|
| 0.5 | 1 | 2 | 3 | 4.8 | |
| Proposed method | 0 | 0.64 | 0.9 | 1 | 1 |
| Jun Chen’s method | 0 | 0.24 | 0.88 | 1 | 1 |
| JB | 0 | 0 | 0.23 | 0.94 | 1 |
| Lillie | 0 | 0 | 0 | 0.66 | 1 |
| AD | 0 | 0 | 0.03 | 0.92 | 1 |
| MTD | 0 | 0 | 0 | 0 | 0.4 |
© 2019 by the authors. Licensee MDPI, Basel, Switzerland. This article is an open access article distributed under the terms and conditions of the Creative Commons Attribution (CC BY) license (http://creativecommons.org/licenses/by/4.0/).
Share and Cite
MDPI and ACS Style
Xie, D.; Wang, F.; Chen, J. Extended Target Echo Detection Based on KLD and Wigner Matrices. Sensors 2019, 19, 5385. https://doi.org/10.3390/s19245385
AMA Style
Xie D, Wang F, Chen J. Extended Target Echo Detection Based on KLD and Wigner Matrices. Sensors. 2019; 19(24):5385. https://doi.org/10.3390/s19245385
Chicago/Turabian StyleXie, Dingsu, Fei Wang, and Jun Chen. 2019. "Extended Target Echo Detection Based on KLD and Wigner Matrices" Sensors 19, no. 24: 5385. https://doi.org/10.3390/s19245385
Note that from the first issue of 2016, this journal uses article numbers instead of page numbers. See further details here.