1. Introduction
Peanut meal, a good protein raw material, is the peanut byproduct obtained after high-temperature oil extraction; it is a plant-derived protein with a high nutritional value, the content of which can range from 40.1% to 50.9% [
1,
2]. Nevertheless, after extraction using high temperatures and organic solvents, this peanut meal protein is highly denatured, and its nutritional value and functionality (flavor base) decrease significantly, thereby limiting its application in the food industry [
3,
4]. Protein enzymolysis technology has become one of the effective methods for preparing flavor bases because it is not time-consuming; it is also harmless when directly employed to cure indigestion [
5]. The peanut meal protein enzymolysis solution contains several free amino acids and small-molecule peptides, which give the enzymolysis liquid a complex taste; different free amino acid and peptide compositions render different tastes. As compared to the single enzymolysis of peanut meal, double enzymolysis can reduce the bitter taste value of hydrolysates obtained via enzymatic hydrolysis and improve the utilization rate of protein, thereby providing a new method for preparing flavor bases using protein hydrolysates.
Conventionally, sensory analysis using trained panelists has been employed to assess taste attributes in food; it is the only method that directly measures the perceived food taste intensity. However, there are some disadvantages of using subjective human sensory organs to evaluate food taste characteristics. For example, the results of sensory evaluation are influenced by subjective and objective factors and with a certain degree of ambiguity and uncertainty. Furthermore, it is expensive as panelists have to be paid for their time and effort. Moreover, it is also time-consuming to organize the training. For all these reasons, there has been increasing research into alternative objective evaluation methods, such as the use of an electronic tongue, which is based on biosensors.
Since the late 1990s, electronic tongues which use an array of multi-channel taste sensors which measure response signals characteristic of the sample solution, coupled with a signal processing unit based on pattern recognition and/or multivariate data analysis algorithms have been studied as objective taste assessment devices for the qualitative and/or quantitative characterization of compounds [
6,
7,
8]. In principle, the electronic tongue system works in a manner similar to that of a human gustatory system. The arrays of low-selectivity taste sensors mimic the human tongue to sense the different tastes instead of using special sensors to obtain single information. To identify different tastes, the signal processing unit mimics the human nervous system to collect excited sensory signals and process the data using software. Therefore, as compared to conventional sensory evaluation, the electronic tongue has the advantages of good repeatability, high resolution, as well as rapid and facile operation. To collect comprehensive signals characteristic of the sample solution, various electronic tongue systems use different electrochemical measurement methods such as potentiometry, cyclic voltammetry, and impedance spectroscopy. After over ten years of development, the electronic tongue has already been applied widely in the food and beverage industry in applications ranging from the distinction of food varieties as well as food freshness to the prediction of food ingredients and to classification of food quality in water [
9,
10,
11], beverages [
12,
13,
14,
15,
16,
17,
18], wine [
19,
20,
21], milk [
22,
23], or oil [
24,
25,
26]. Moreover, electronic tongues have been shown to exhibit the potential to mimic the human tasting process and the response of a sensory panel to assess samples taste [
27,
28,
29]. They have also been used to predict the taste intensity in pharmaceutical formulations [
30,
31,
32,
33,
34,
35,
36,
37] and hydrolysates, which are mainly bitter [
38,
39], and the relationship between the amount of bitter substances adsorbed onto membranes and taste sensors [
40]. For example, Legin [
32] has applied the electronic tongue for pharmaceutical analysis, where it could discriminate between different taste modalities of substances and its masking efficiency was found to be consistent with that obtained from a human taste panel. Rachid [
33] has used an Alpha M.O.S. Astree electronic tongue to evaluate the masking efficacy of sweetening and/or flavoring agents on the bitter taste of epinephrine. First, a bitterness model was constructed with six standard pharmaceutical ingredients and then the bitterness score of different E bitartrate (EB) and EB + NMI solutions was predicted. However, thus far, relatively few studies exist on the taste assessment of protein-rich samples using electronic tongues. Newman [
38,
39] has used the electronic tongue to assess bitter dairy protein hydrolysates and investigated the correlation between the electronic tongue and sensory panel results (
R2 of 0.98). Prediction models built using sensory, chromatographic, and electronic tongues were compared; strong correlations between these models were studied, showing an
R2 from 0.78 to 0.93. Multivariate data analysis and pattern recognition methods such as principal component analysis (PCA), linear discriminate analysis (LDA), and partial least-square regression (PLS) have been increasingly applied in the abovementioned taste assessment studies. In particular, PLS regression has been widely applied for the construction of numerical prediction models from using chromatographic data to electronic tongue data in the taste assessment.
These previous studies indicate that the use of an electronic tongue may be suitable for assessing taste characteristics of peanut meal double enzymatic-hydrolysis hydrolysates (DEH). However, until now, qualitative analysis and judgment of taste characteristics in DEH have predominantly been conducted by analyzing the composition of the free amino acids and peptide species as well as by molecular weight distribution. For example, acidic amino acids or a short peptide containing acidic amino acid residues tastes umami. Glutamic acid, aspartic acid, and its amide are sour, short peptides with molecular weight less than 1000 Da are slightly salty; some short peptides are bitter, while amino acids such as Gly, Ser, Thr, Ala, and Pr are sweet. Sensory analysis is the only method to quantify the perceived different taste intensity of the hydrolysates obtained via enzymatic hydrolysis. Thus far, few studies have been conducted to demonstrate the ability of the electronic tongue to assess the taste characteristics of peanut meal DEH, which has complex different tastes.
This study aims to investigate the ability of an electronic tongue to assess the taste attributes of peanut meal DEH. The response characteristics of the electronic tongue to the six types of peanut meal DEH samples and five standard taste samples were investigated by PCA and DFA. PLS and RBF neural network (RBFNN) quantitative umami and saltiness prediction models were employed to compare the predictive abilities of the intensity of umami and saltiness and to correlate results obtained from both the electronic tongue and sensory analysis, respectively.
3. Results and Discussion
3.1. Sensory Analysis
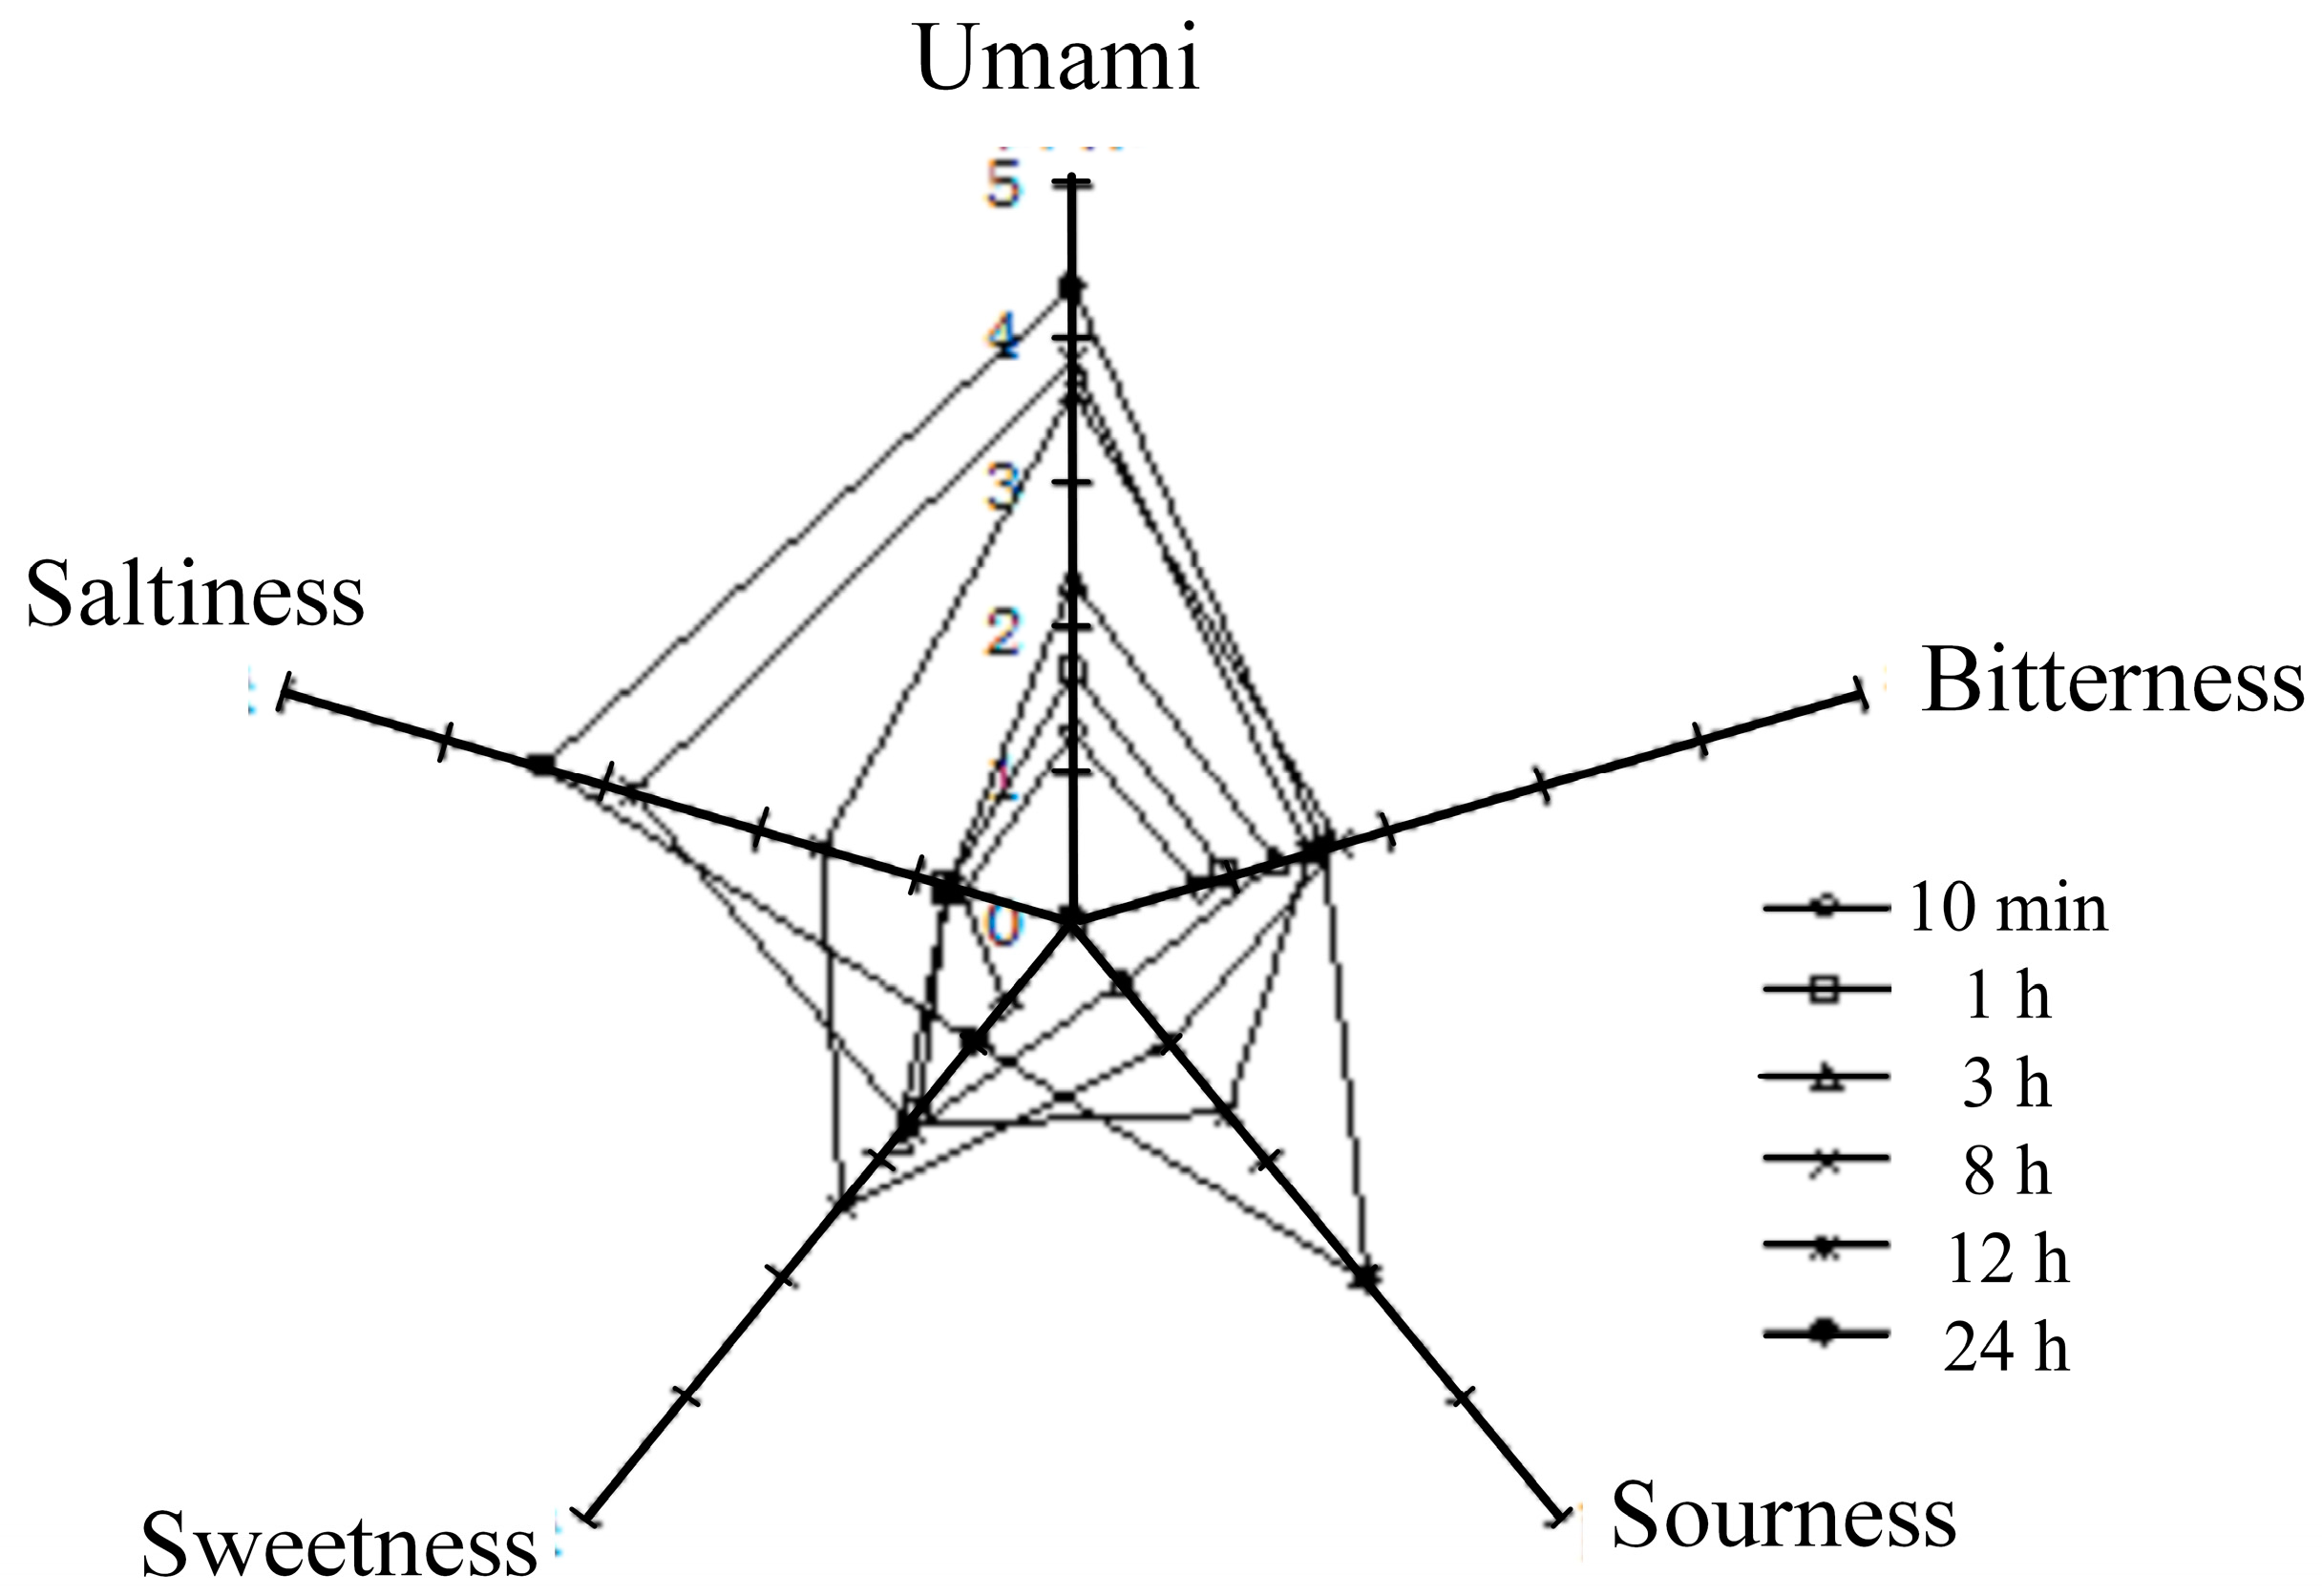
The quantitative sensory evaluation of the five taste attributes (umami, saltiness, sourness, sweetness, bitterness) of six peanut meal DEH samples (denoted as A1–A6) at different enzymolysis times (10 min, 1 h, 3 h, 8 h, 12 h, 24 h) was performed (
Figure 1 and
Table 2). Rather than a single taste, five complex tastes including umami, saltiness, sourness, sweetness, and bitterness were observed for the DEH samples. Among these tastes, the intensity of umami was the maximum (score 1.3–4.2), followed by that of saltiness (score 0.6–3.4); the intensities for both sourness and sweetness were weak, while the intensity of bitterness was the weakest (score 0.7–1.8).
As shown in
Table 2, the trends of umami and saltiness gradually increased within 24 h with the progression of enzymolysis time. Sensory analysis showed that the umami score was the highest for samples A1–A6, with umami being predominant.
Figure 1.
Radar distribution results of sensory analysis.
Figure 1.
Radar distribution results of sensory analysis.
Table 2.
Characteristics and taste intensity scores of peanut meal DEH, which were used to compare the taste attributes obtained by the electronic tongue.
Table 2.
Characteristics and taste intensity scores of peanut meal DEH, which were used to compare the taste attributes obtained by the electronic tongue.
| Sample | Enzymolysis Time (min) | Degree of Hydrolysis (DH) (%) | Protein Extraction Rate (%) | Ratio of Different Relative Molecular Weight Peptides and the Total Peptides % (Da) | Taste Intensity Score |
|---|
| <1 k | 1–3 k | >20 k | Umami | Saltiness |
|---|
| A1 | 10 | 4.8 | 61 | 6.38 | 11.64 | 37.72 | 1.3 | 0.6 |
| A2 | 60 | 8.2 | 63 | 13.27 | 14.22 | 25.98 | 1.7 | 0.7 |
| A3 | 180 | 11.0 | 78 | 14.6 | 16.8 | 21.96 | 2.2 | 0.9 |
| A4 | 480 | 15.2 | 72 | 20.79 | 16.86 | 20.73 | 3.6 | 1.6 |
| A5 | 720 | 17.1 | 71 | 24.02 | 16.77 | 15.4 | 3.8 | 2.8 |
| A6 | 1440 | 20.4 | 68 | 26.34 | 20.36 | 10.23 | 4.2 | 3.4 |
3.2. Analysis of Taste Attributes by Gel Exclusion Chromatography
GEC was conducted to obtain the molecular weight distribution of peanut meal DEH (
Table 2). The peptides with molecular weight greater than 20 kDa rapidly reduced as enzymolysis time progressed, while smaller-molecular-weight peptides (<1 kDa) gradually increased. For instance, at an enzymolysis time of 1440 min (24 h), the content of the peptides with molecular weight greater than 20 KDa decreased from 46.88% to 10.23%, while the content of peptides with molecular weight less than 1 KDa gradually increased from the original 0.99% to 26.34%, because trypsin (endonuclease) rapidly hydrolyzed the protein to macromolecular peptide, and the compound flavor enzyme (including endonuclease and exonuclease) continuously hydrolyzed the macromolecular peptide to small-molecule peptides or free amino acids during enzymolysis. The small peptides with molecular weight less than 1 kDa clearly exhibited umami and saltiness (small peptides with molecular weight 1 k–3 kDa have umami-enhancing effect). Hence, from the analysis of the taste attributes by GEC, peanut meal DEH predominantly exhibits umami, and with increasing enzymolysis time, the umami taste increases. These results are consistent with those reported by
Yamada and Nishimura as well as with former sensory analysis.
3.3. Representation of Sensor Response of the Electronic Tongue
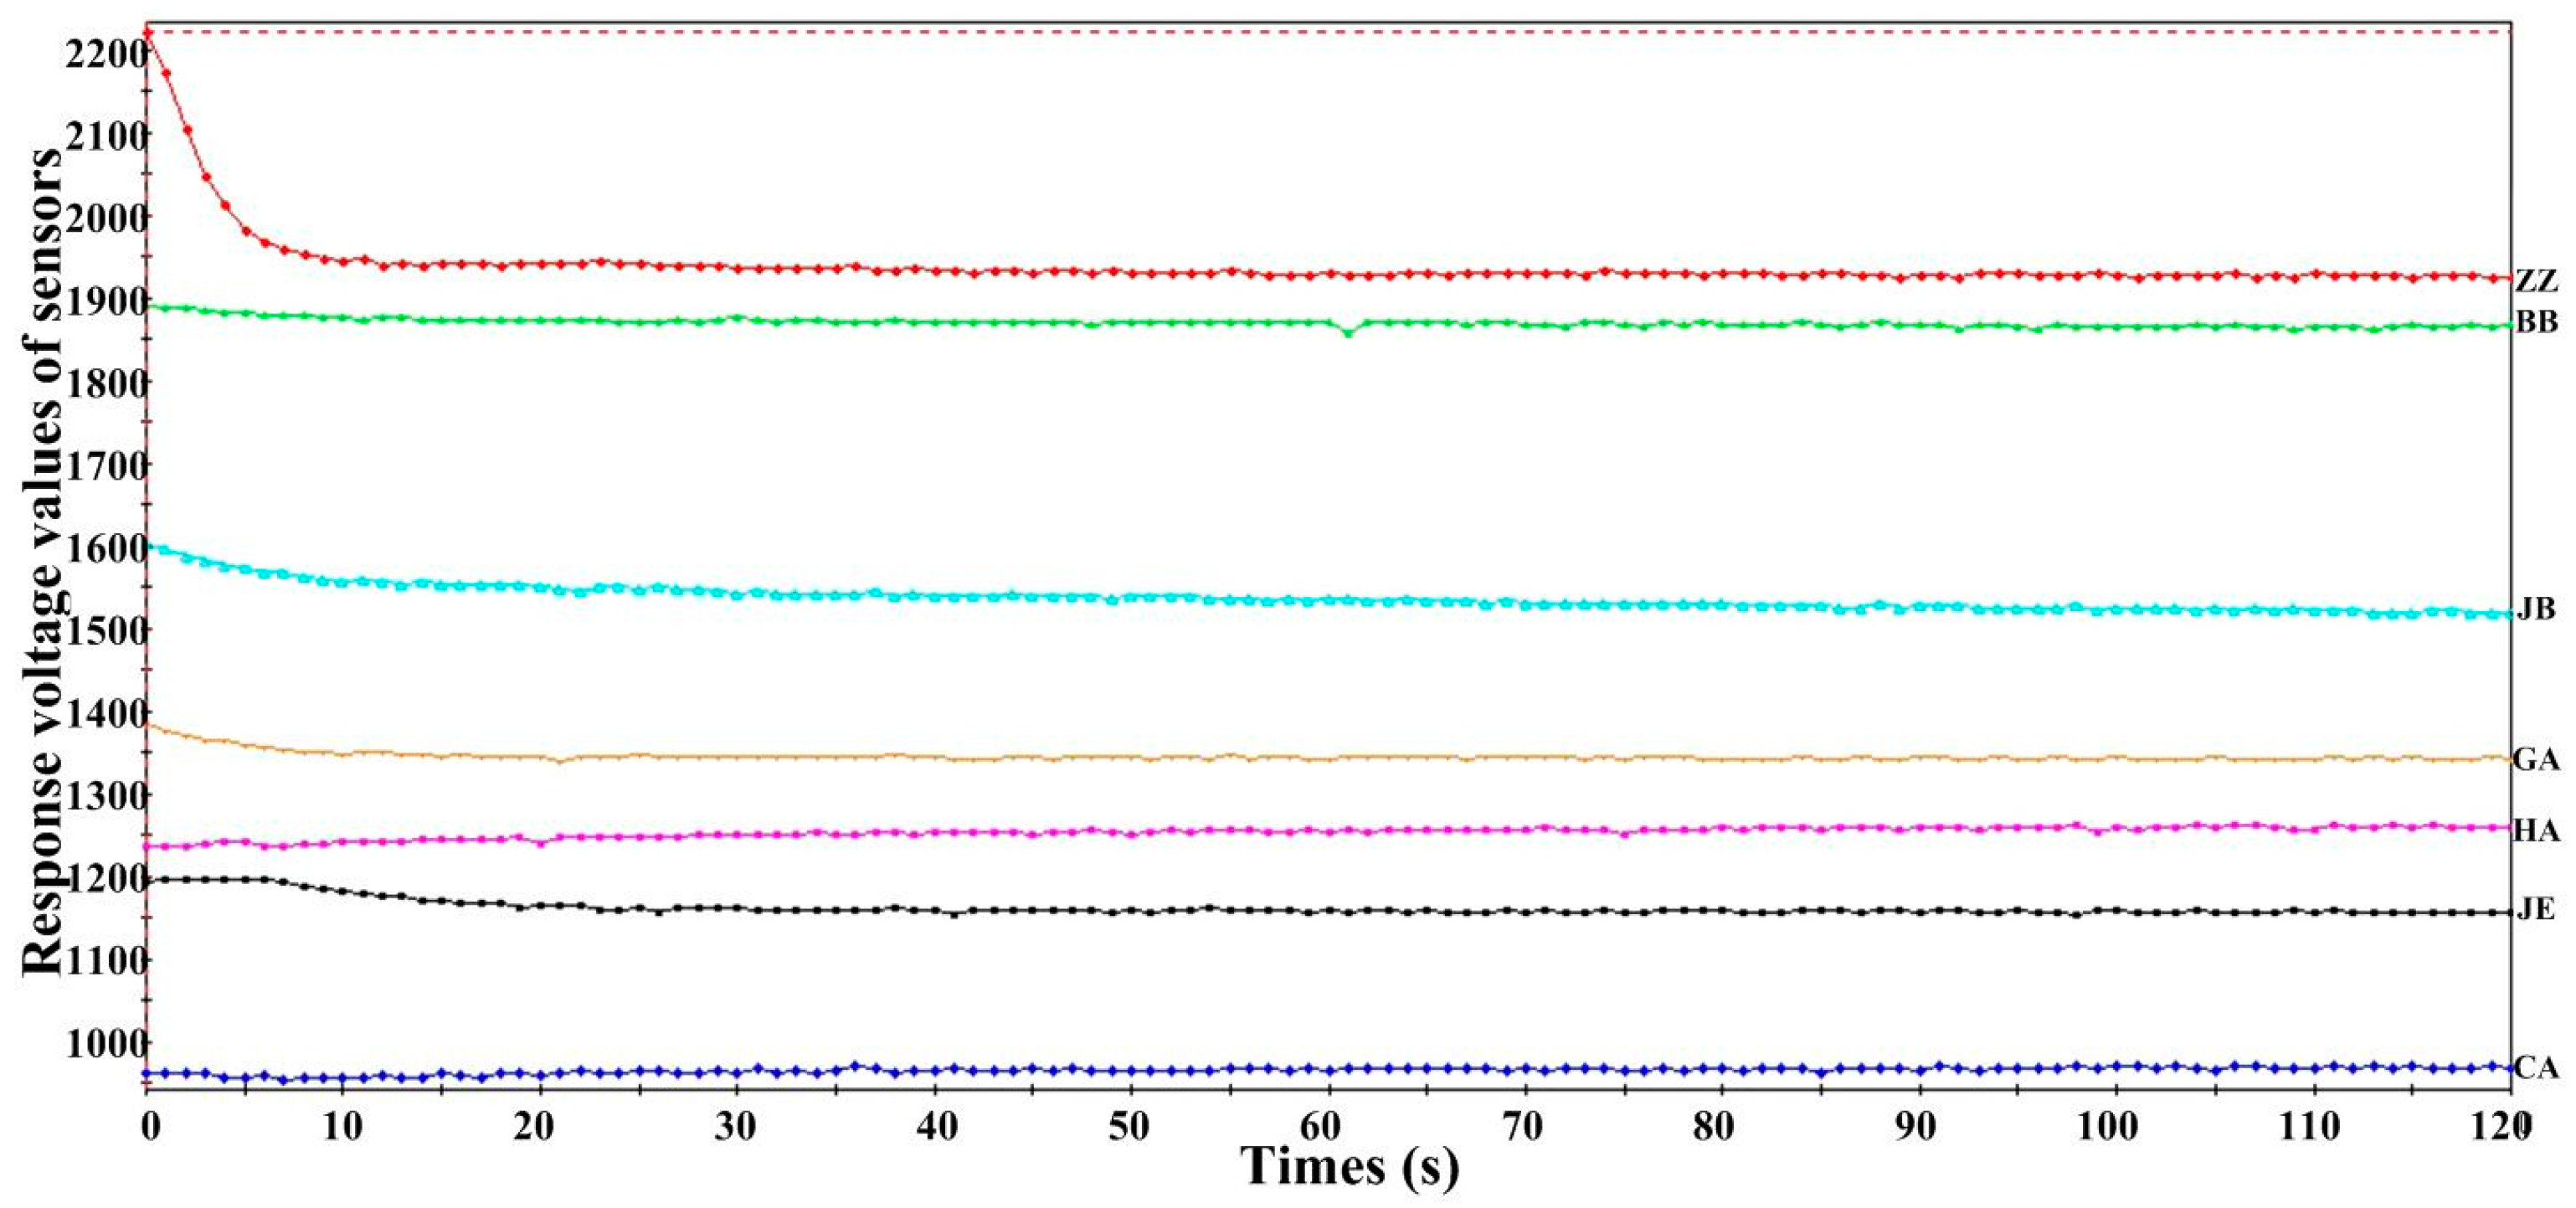
Further objective analysis of the DEH samples was performed using the electronic tongue.
Figure 2 shows the response curves of ZZ, JE, BB, CA, GA, HA, and JB to sample A6 (enzymolysis time 24 h). The X- and Y-axes denote the data acquisition time (120 s) and response voltage values of the seven sensors, respectively. The sensors exhibited good stability and repeatability with respect to the measured signal, except for the variation of the acquired data before 30 s.
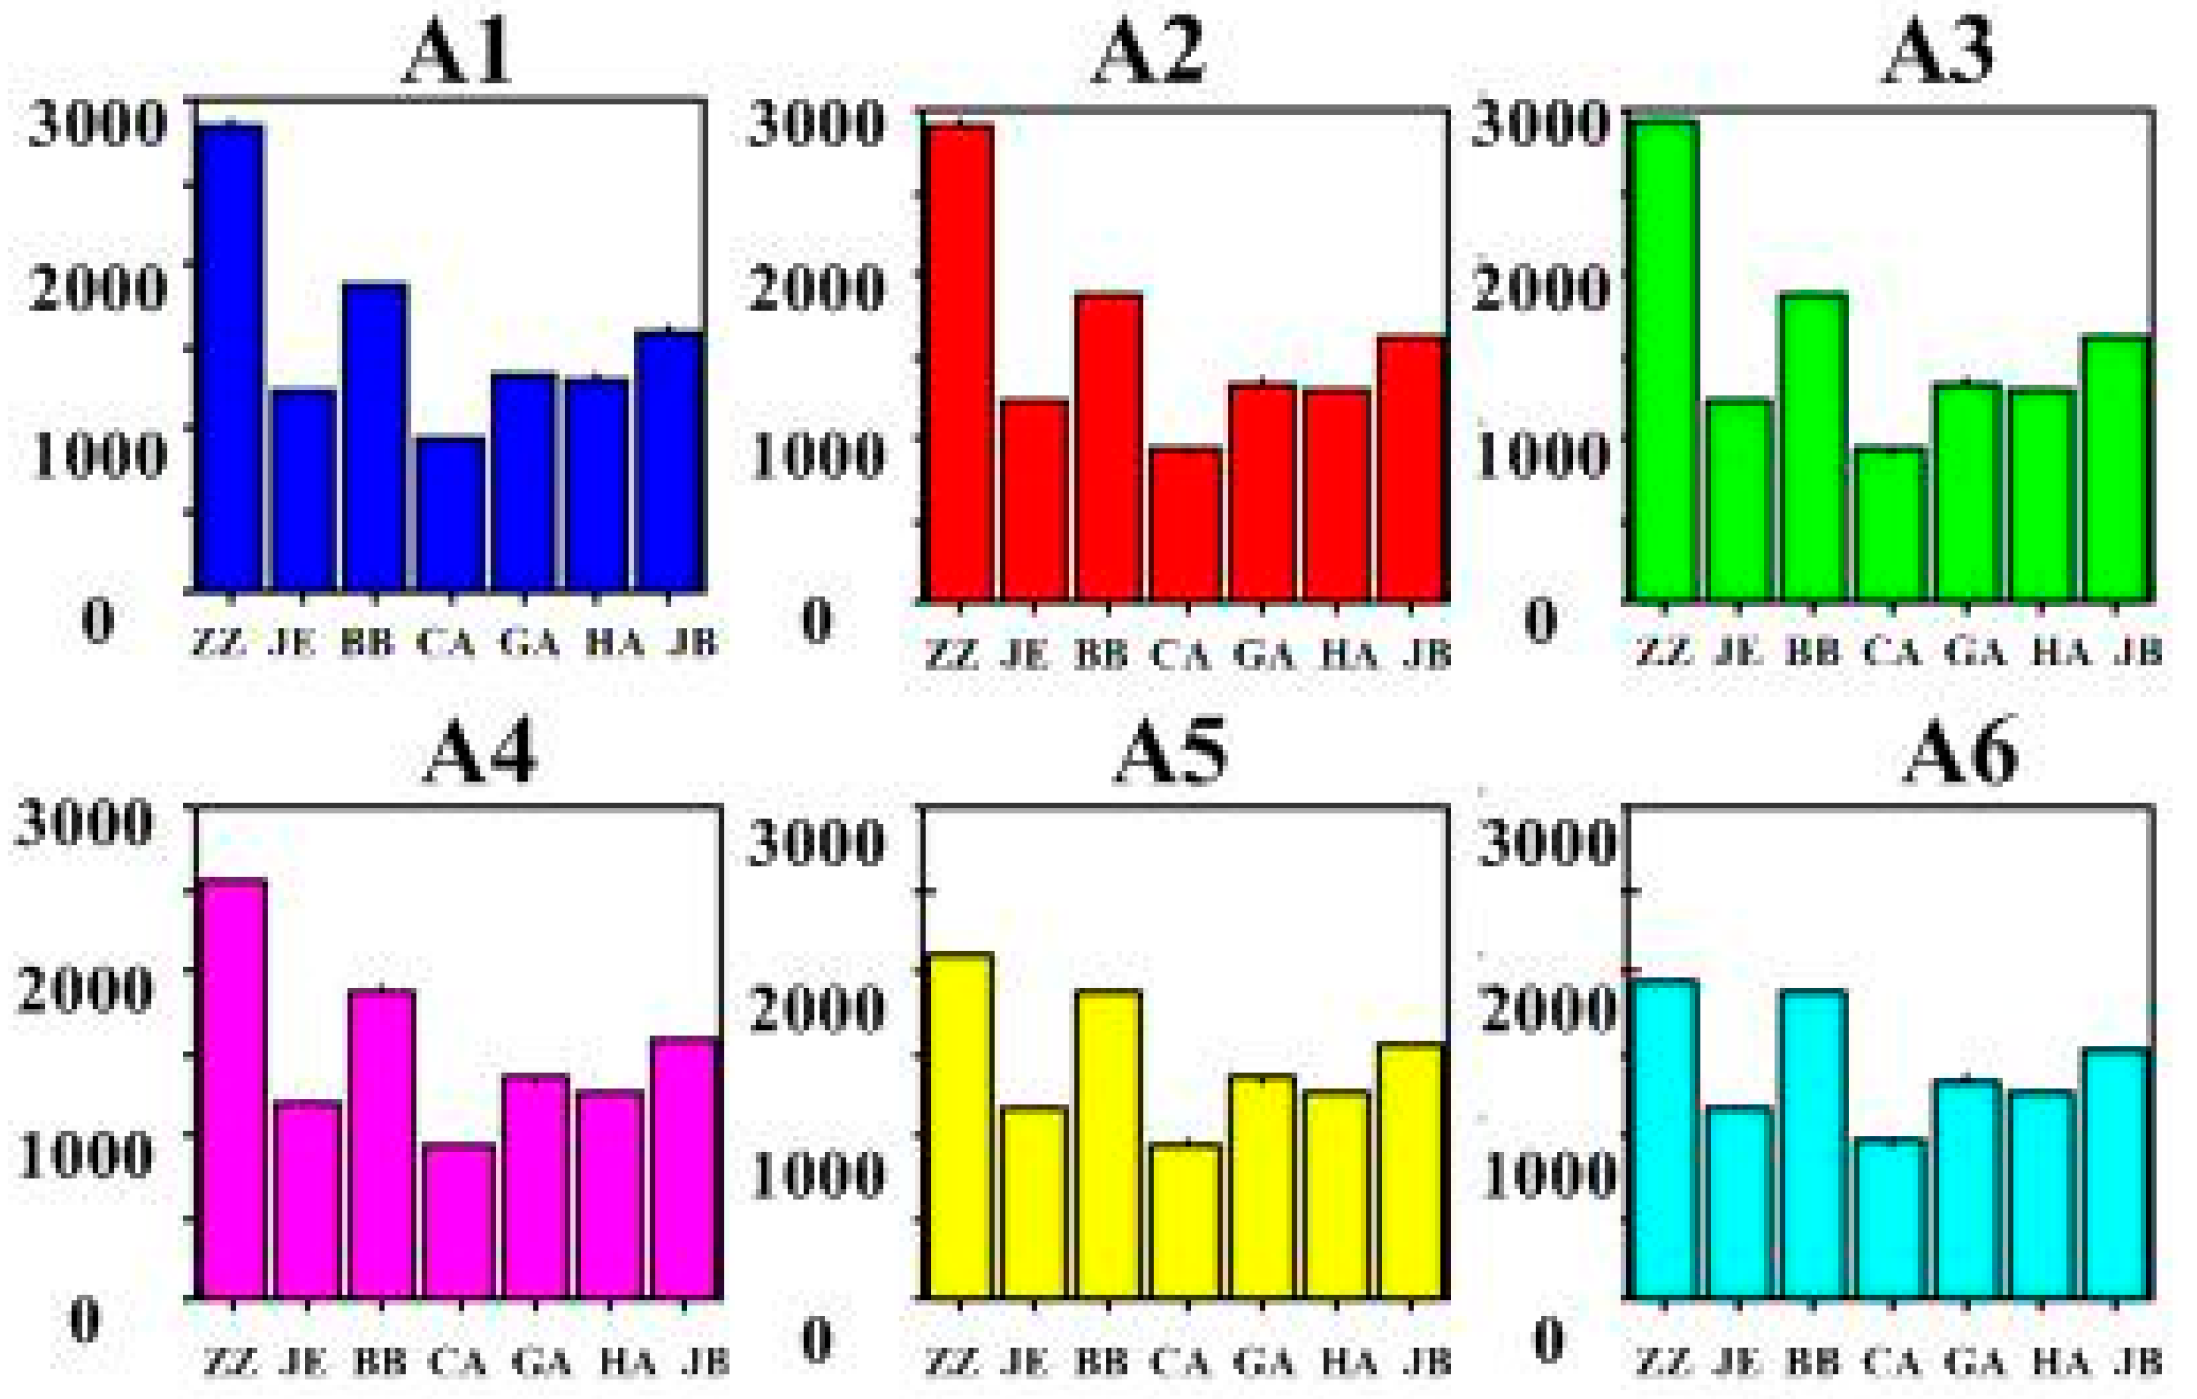
Figure 3 shows bar graphs of response intensity of the seven lipid membrane sensors to samples A1–A6. The X- and Y-axes denote each sensor and the final stable voltage response values of the sensors, respectively. The different colors represent different samples. Each sample was measured five times. Sensors ZZ, BB, and JB exhibited a higher response intensity, while CA exhibited the lowest response intensity. Moreover, JE, GA, and HA exhibited a similar response intensity.
Figure 2.
Response curves of the seven sensors to Sample A6.
Figure 2.
Response curves of the seven sensors to Sample A6.
Figure 3.
Bar graphs of the response values of sensors to all samples.
Figure 3.
Bar graphs of the response values of sensors to all samples.
The relative standard deviation (RSD) values of the seven sensors in the DEH samples and the five standard taste samples were less than 6%, which indicates that the difference in experimental data obtained by the electronic tongue was small and exhibits good reproducibility.
3.4. Analysis of Five Taste Attributes of DEH Samples
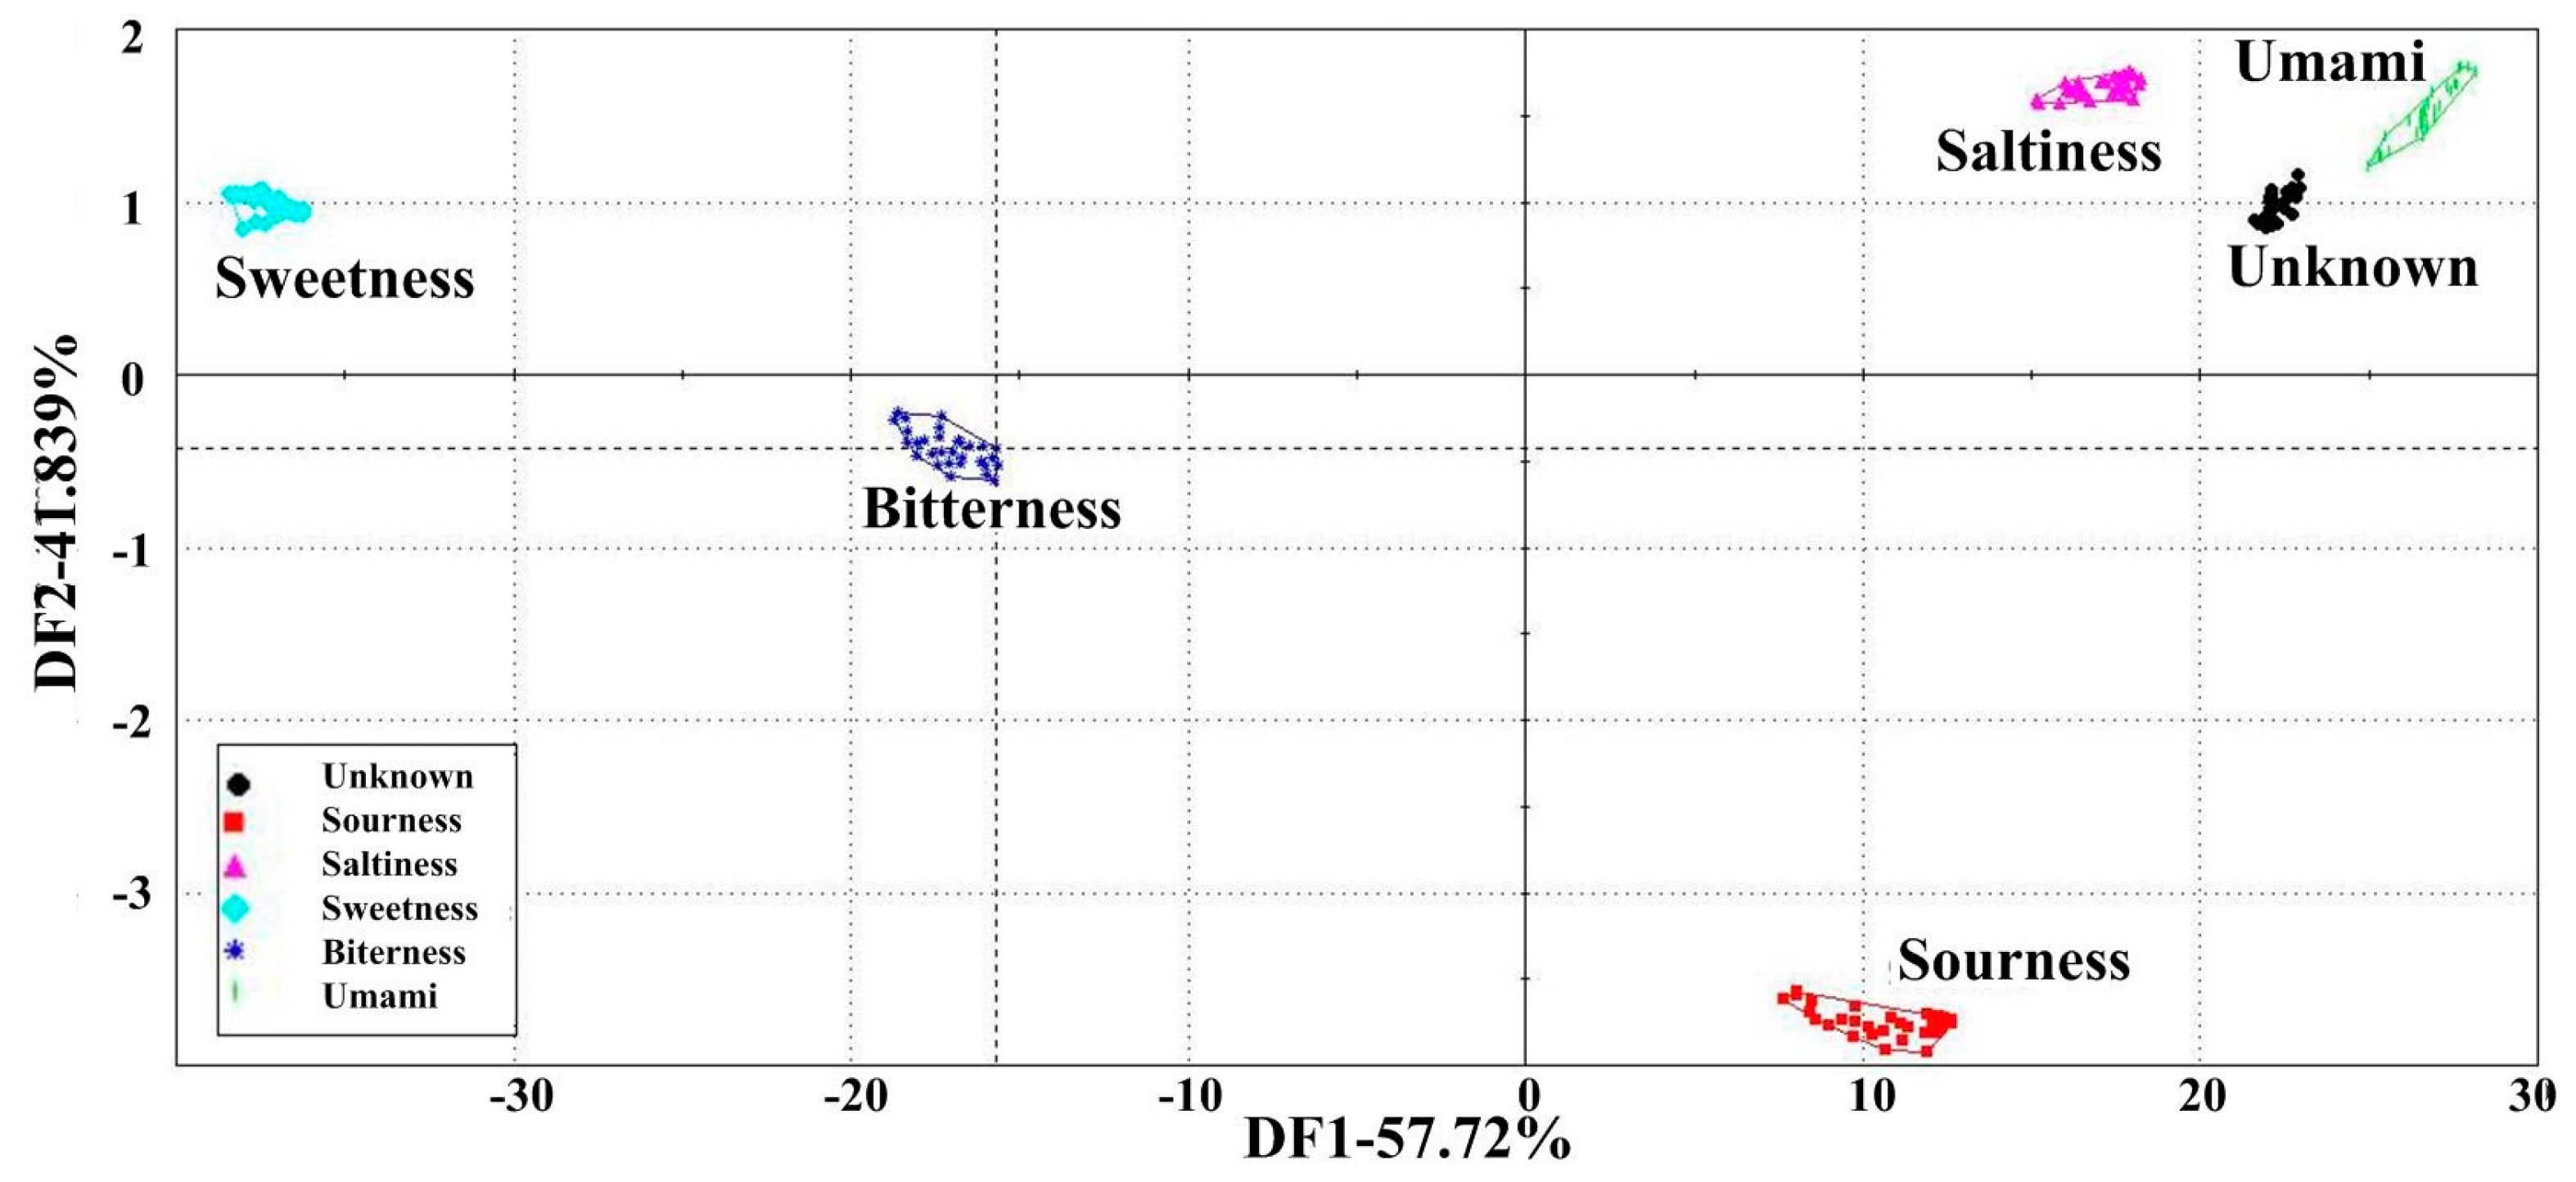
DFA can be a useful tool for differentiating the individual to which each colony is affiliated; DFA was mapped using the response voltage values of the seven sensors for each sample as data for calculating a set of new variables called discriminant factors. Each sensor response voltage value was decided according to the average of the last three measurements of the sensor of each sample. From
Figure 4, DFA showed a total contribution of 99.56% with the contribution from the first two discriminant factors being 57.72% and 41.839%, respectively, with a Discrimination Index (DI) value of 98. All samples were separated into six distinct clusters. Five standard tastes (umami, saltiness, sourness, bitterness, and sweetness) were successfully discriminated. The space within each sample was close, while the distance between the two groups was large, indicating good data repeatability and a clear distinction between different samples. All six peanut meal DEH samples as unknown samples were projected into five tastes in the DFA map. From the cluster formations in the DFA map, the position of the peanut meal DEH samples cluster (unknown cluster) was relatively close to the umami and saltiness clusters, with the position being closer to the umami cluster. The unknown cluster was at a farther distance to the sourness cluster, and the distance between the sweetness and bitterness clusters was the farthest.
Figure 4.
Analysis of the taste attributes of the five taste samples and peanut meal DEH samples (unknown samples was peanut meal DEH at enzymolysis times of 10 min, 1 h, 3 h, 8 h, 12 h, 24 h. Umami: 0.1%–1.0% MSG; saltiness: 0.001%–0.2% salt; sourness: 0.02%–0.2% citric acid; bitterness: 0.025%–0.25% tannic acid; sweetness: 0.25%–2.5% sugar). Data were processed by DFA.
Each point in each cluster represents each replicate sample measurement by the sensor array, indicating that peanut meal DEH samples exhibited characteristics similar to umami and saltiness. This result is in agreement with those obtained from sensory analysis and GEC. Samples A1–A6 mainly exhibited umami and saltiness, followed by sourness, while the intensities of both sweetness and bitterness were the weakest. Umami was the most prominent taste of peanut meal DEH samples. The DFA map from the electronic tongue showed that it can assist and even replace human sensory analysis.
In addition, the lack of discrimination among samples of different concentration gradients in the umami and saltiness clusters as well as from samples of peanut meal DEH indicated that further research is required for the discrimination of these three taste samples. The discrimination of the three taste samples with different taste attributes was also mapped with DFA using the same data extraction method as shown in
Figure 4. DFA (
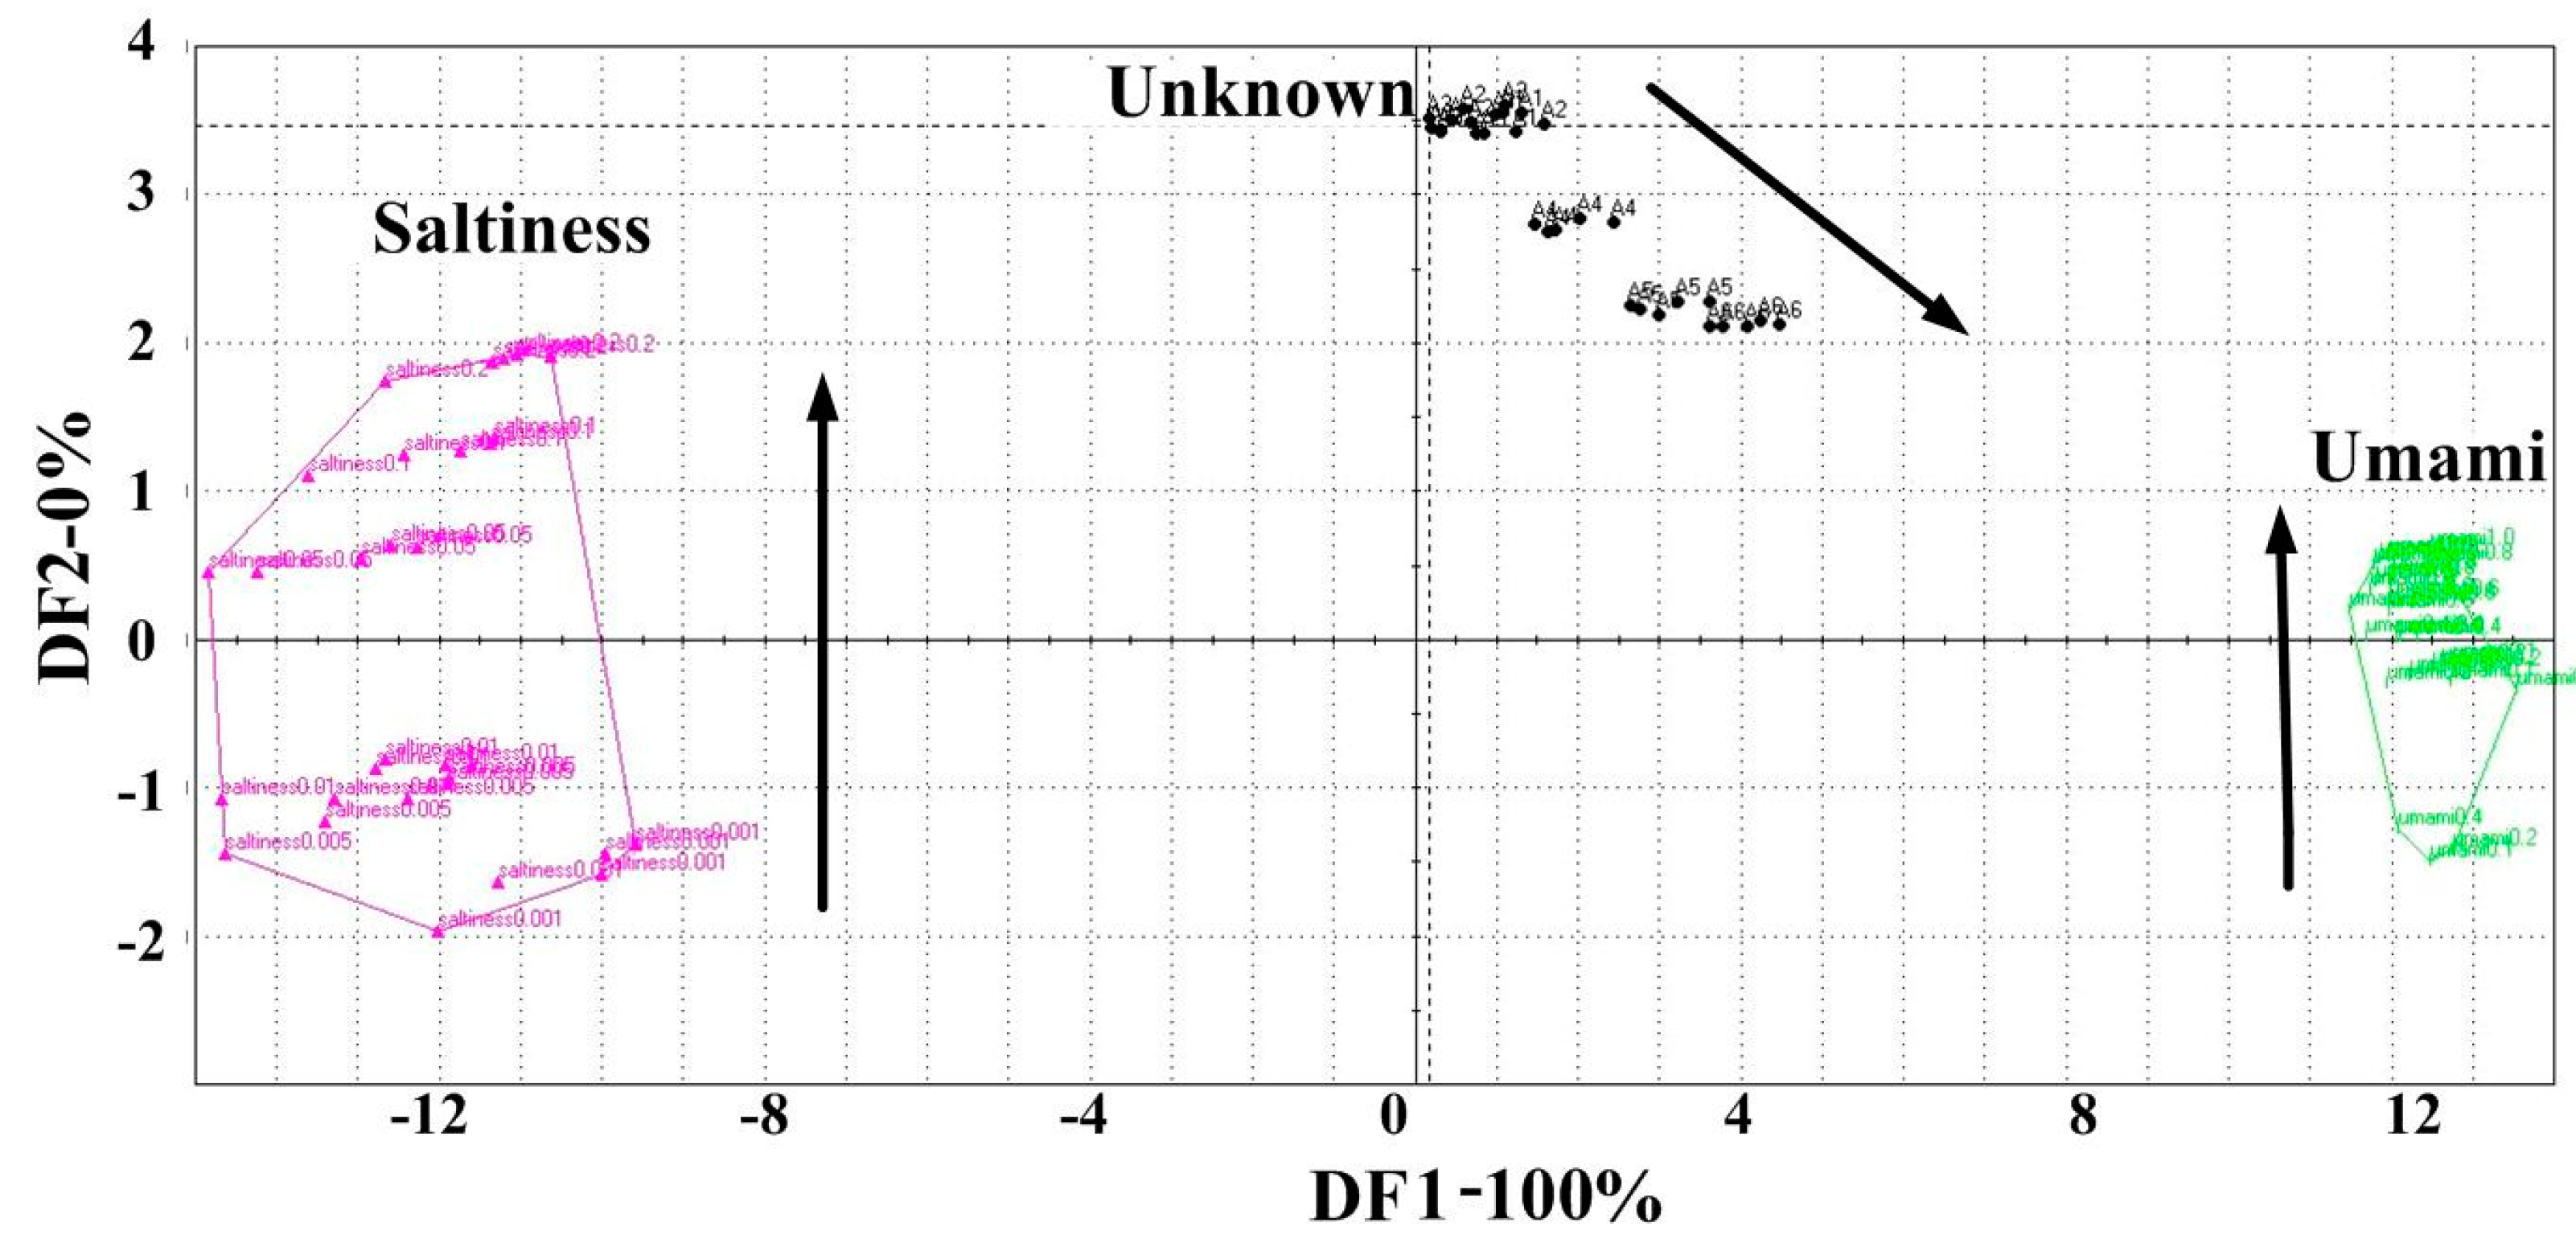
Figure 5) showed a complete 100% contribution with the first discriminant factor (DF1) with a DI value of 100. It indicated that the DFA map can represent the response data of all samples using the electronic tongue. All samples were separated into three distinct clusters. Three taste samples—umami, saltiness and peanut meal DEH samples—were successfully discriminated. The saltiness cluster was located at the left edge of the map, the umami cluster was located at the right edge of the map, and the peanut meal DEH (unknown cluster) was located between them, albeit closer to the umami cluster. Thus, the relationship between their relative positions on this map demonstrated a strong correlation with their taste attributes perceived by human. From the saltiness cluster, the six samples exhibiting saltiness (0.001%, 0.005%, 0.01%, 0.05%, 0.1%, and 0.2%) were separated from each other, indicating that the electronic tongue can discriminate different concentrations with the same taste. DF2 in the map approximately coincided with the direction of intensity change of saltiness in samples. The arrow on the map represents the increasing direction of the intensity of saltiness. Similar results were observed for the umami cluster. Six umami samples (0.1%, 0.2%, 0.4%, 0.6%, 0.8% and 1.0%) were separated, and the direction of the arrow on the map represents the increasing intensity of umami. For peanut meal DEH samples as projected into the map as unknown samples exhibited mainly two taste attributes, it located in a direction shown with an arrow direction representing the increasing enzymolysis time. The arrow direction is also called taste intensity increase direction because according to the previous analysis, the taste intensity increased with enzymolysis time. The first three samples of peanut meal DEH were not distinguished probably because of the low concentration of the prepared DEH solution. The lack of discrimination among these three samples indicated the necessity to search for more supervised methods for the quantitative analysis of peanut meal DEH samples, such as PLS or ANN.
The results from the above analysis demonstrated that the electric tongue has the potential to qualitatively assess different taste samples. The location of the different samples indicates the taste similarity degree. In the same cluster, the location can reflect different taste intensities and can regularly change with changing concentration.
Figure 5.
Evaluation of taste attributes of the three samples (Unknown peanut meal DEH samples under 10 min, 1 h, 3 h, 8 h, 12 h, 24 h; Umami: 0.1%–1.0% MSG; saltiness: 0.001%–0.2% salt).
Figure 5.
Evaluation of taste attributes of the three samples (Unknown peanut meal DEH samples under 10 min, 1 h, 3 h, 8 h, 12 h, 24 h; Umami: 0.1%–1.0% MSG; saltiness: 0.001%–0.2% salt).
3.5. Discrimination of Different DEH Samples by PCA and DFA
Because of the satisfactory taste trend observed in the previous analysis, the whole set of peanut meal DEH samples was further analyzed using only the electronic tongue, and data were processed by PCA and DFA to obtain consistent taste assessment results using different data processing methods (
Figure 6).
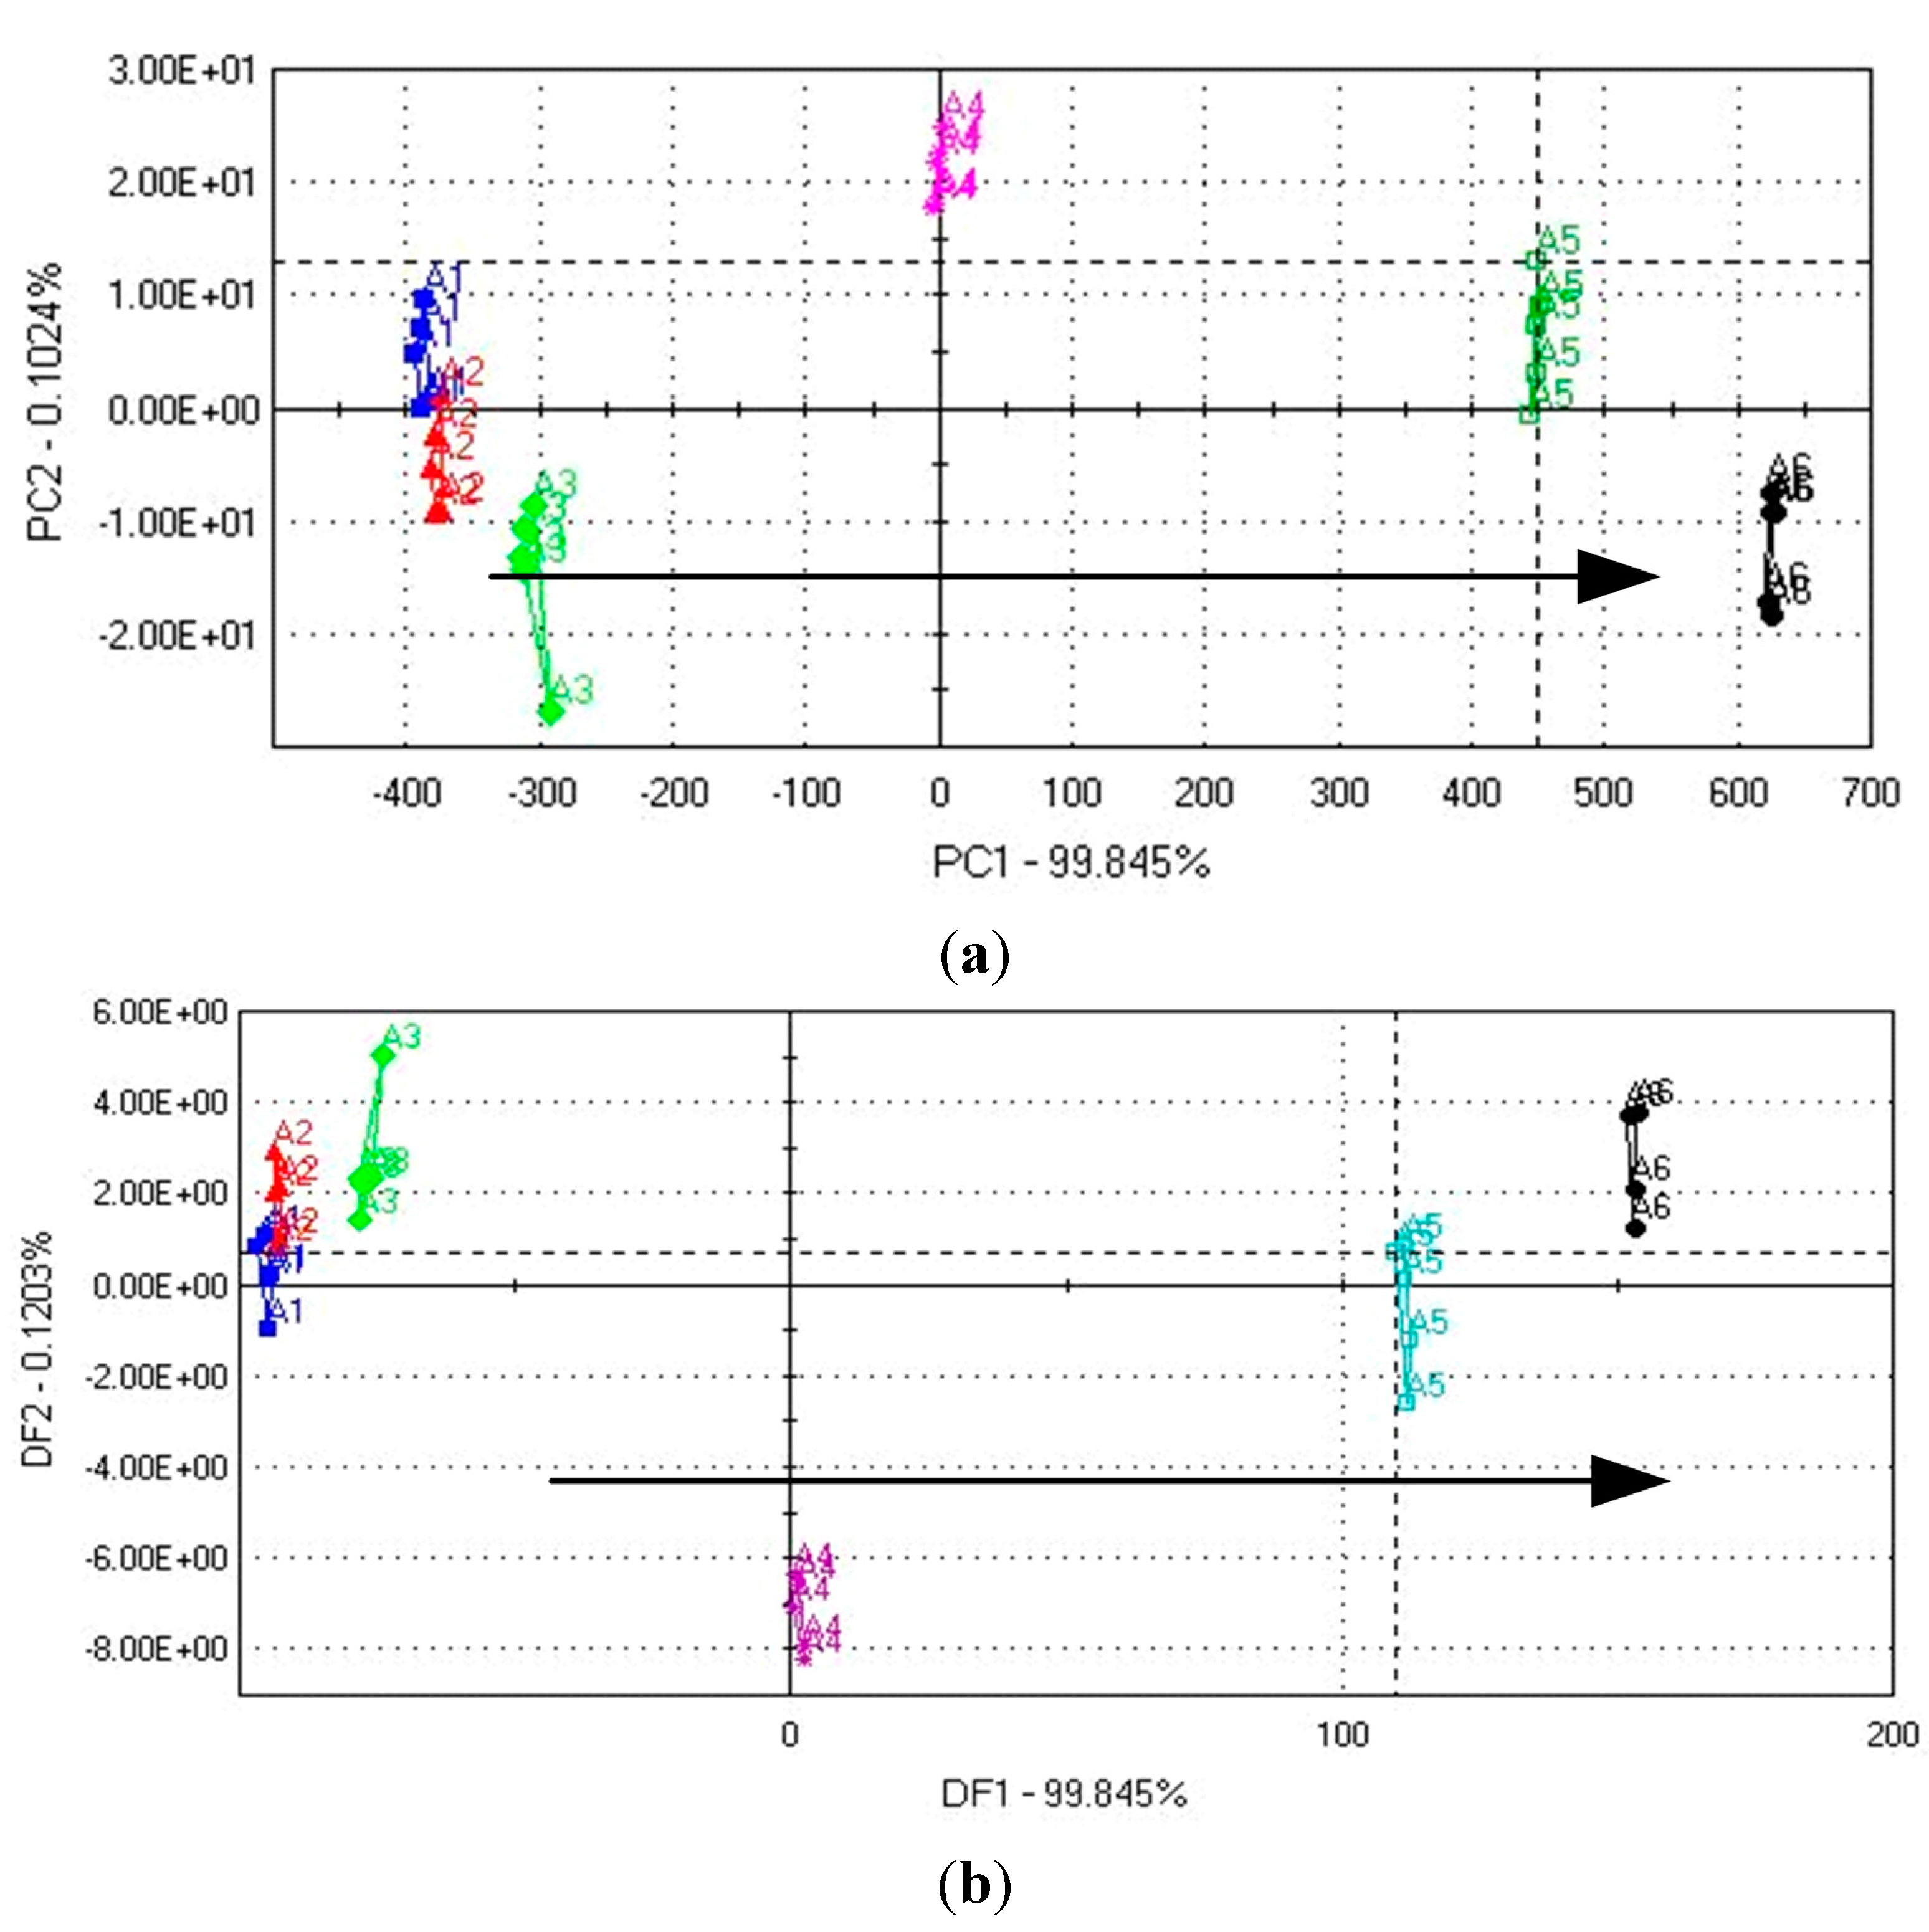
Figure 6a shows the distribution of the peanut meal DEH samples along the first two new coordinates (PC1 and PC2): an accumulated contribution of 99.94% was observed with a DI value of 92. The high contribution value indicated that nearly all the data from the original sensors are presented only by the two new functions. As can be seen, except samples A1 and A2, all other samples were successfully discriminated by analysis with PCA coordinates. The arrow direction on the map represents the increase in taste intensity.
Figure 6b shows similar results by DFA analysis. It shows the distribution of the peanut meal DEH samples along the first two new coordinates (DF1 and DF2): an accumulated contribution of 99.96% was observed with a DI value of 94. As can be seen, except samples A1 and A2, all other samples were discriminated by analysis of DFA coordinates. The arrow direction on the map also represents the increase in taste intensity. DFA is significantly better than PCA because it can leave some samples as unknown, as compared to the expected ones, for projection into the built model to predict classes rather than use all samples to perform classification. Hence, the actual performance of the DFA classification model can be assessed.
The analysis result showed that the electronic tongue demonstrates potential for the qualitative assessment of the taste intensity of the different peanut meal DEH samples. The samples regularly varied according to the PC1/DF1 direction, which was the direction of increasing enzymolysis time. The two methods of the electronic tongue showed consistent taste assessment results. It was also in agreement with the results obtained from sensory analysis and GEC. The intensities of both umami and saltiness of the peanut meal DEH samples (A1–A6) increased with enzymolysis time, thereby resulting in the increase of the total taste intensity.
Figure 6.
Taste discrimination of different peanut meal DEH samples (A1–A6) (a) score map obtained by PCA; (b) score map obtained by DFA.
Figure 6.
Taste discrimination of different peanut meal DEH samples (A1–A6) (a) score map obtained by PCA; (b) score map obtained by DFA.
3.6. Quantitative Taste Prediction of DEH
The taste attributes of peanut meal DEH were complex because a large amount of free amino acids and small-molecule peptides was present in the protein enzymolysis solution. Because of the different composition of free amino acids and peptides, the enzymolysis solution exhibits different tastes. From the information stated above, substances that were soluble in water exhibit umami and saltiness, which was easily detected by sensors; they were the main two taste attributes; also, their intensity scores for peanut meal DEH were predicted by the electronic tongue and were found to be comparable to those obtained by sensory analysis.
To assess whether the electronic tongue was suitable for the prediction of umami and saltiness in peanut meal DEH, it is essential to correlate between prediction scores obtained by the electronic tongue and actual scores obtained by sensory analysis. PLS and RBFNN prediction models were employed. Unlike previous studies that focus on the extraction of qualitative information, herein two quantitative models were built. In each model, two input datasets were extracted for model construction. One type of input variable was selected with the response voltage values obtained from the seven sensors of the electronic tongue, and the other type was the first four PC values. That is, the scores assigned for peanut meal DEH by sensory analysis were modeled from the data of sensors voltage response or from the data of the first four PC values.
3.6.1. PLS Taste Prediction Model
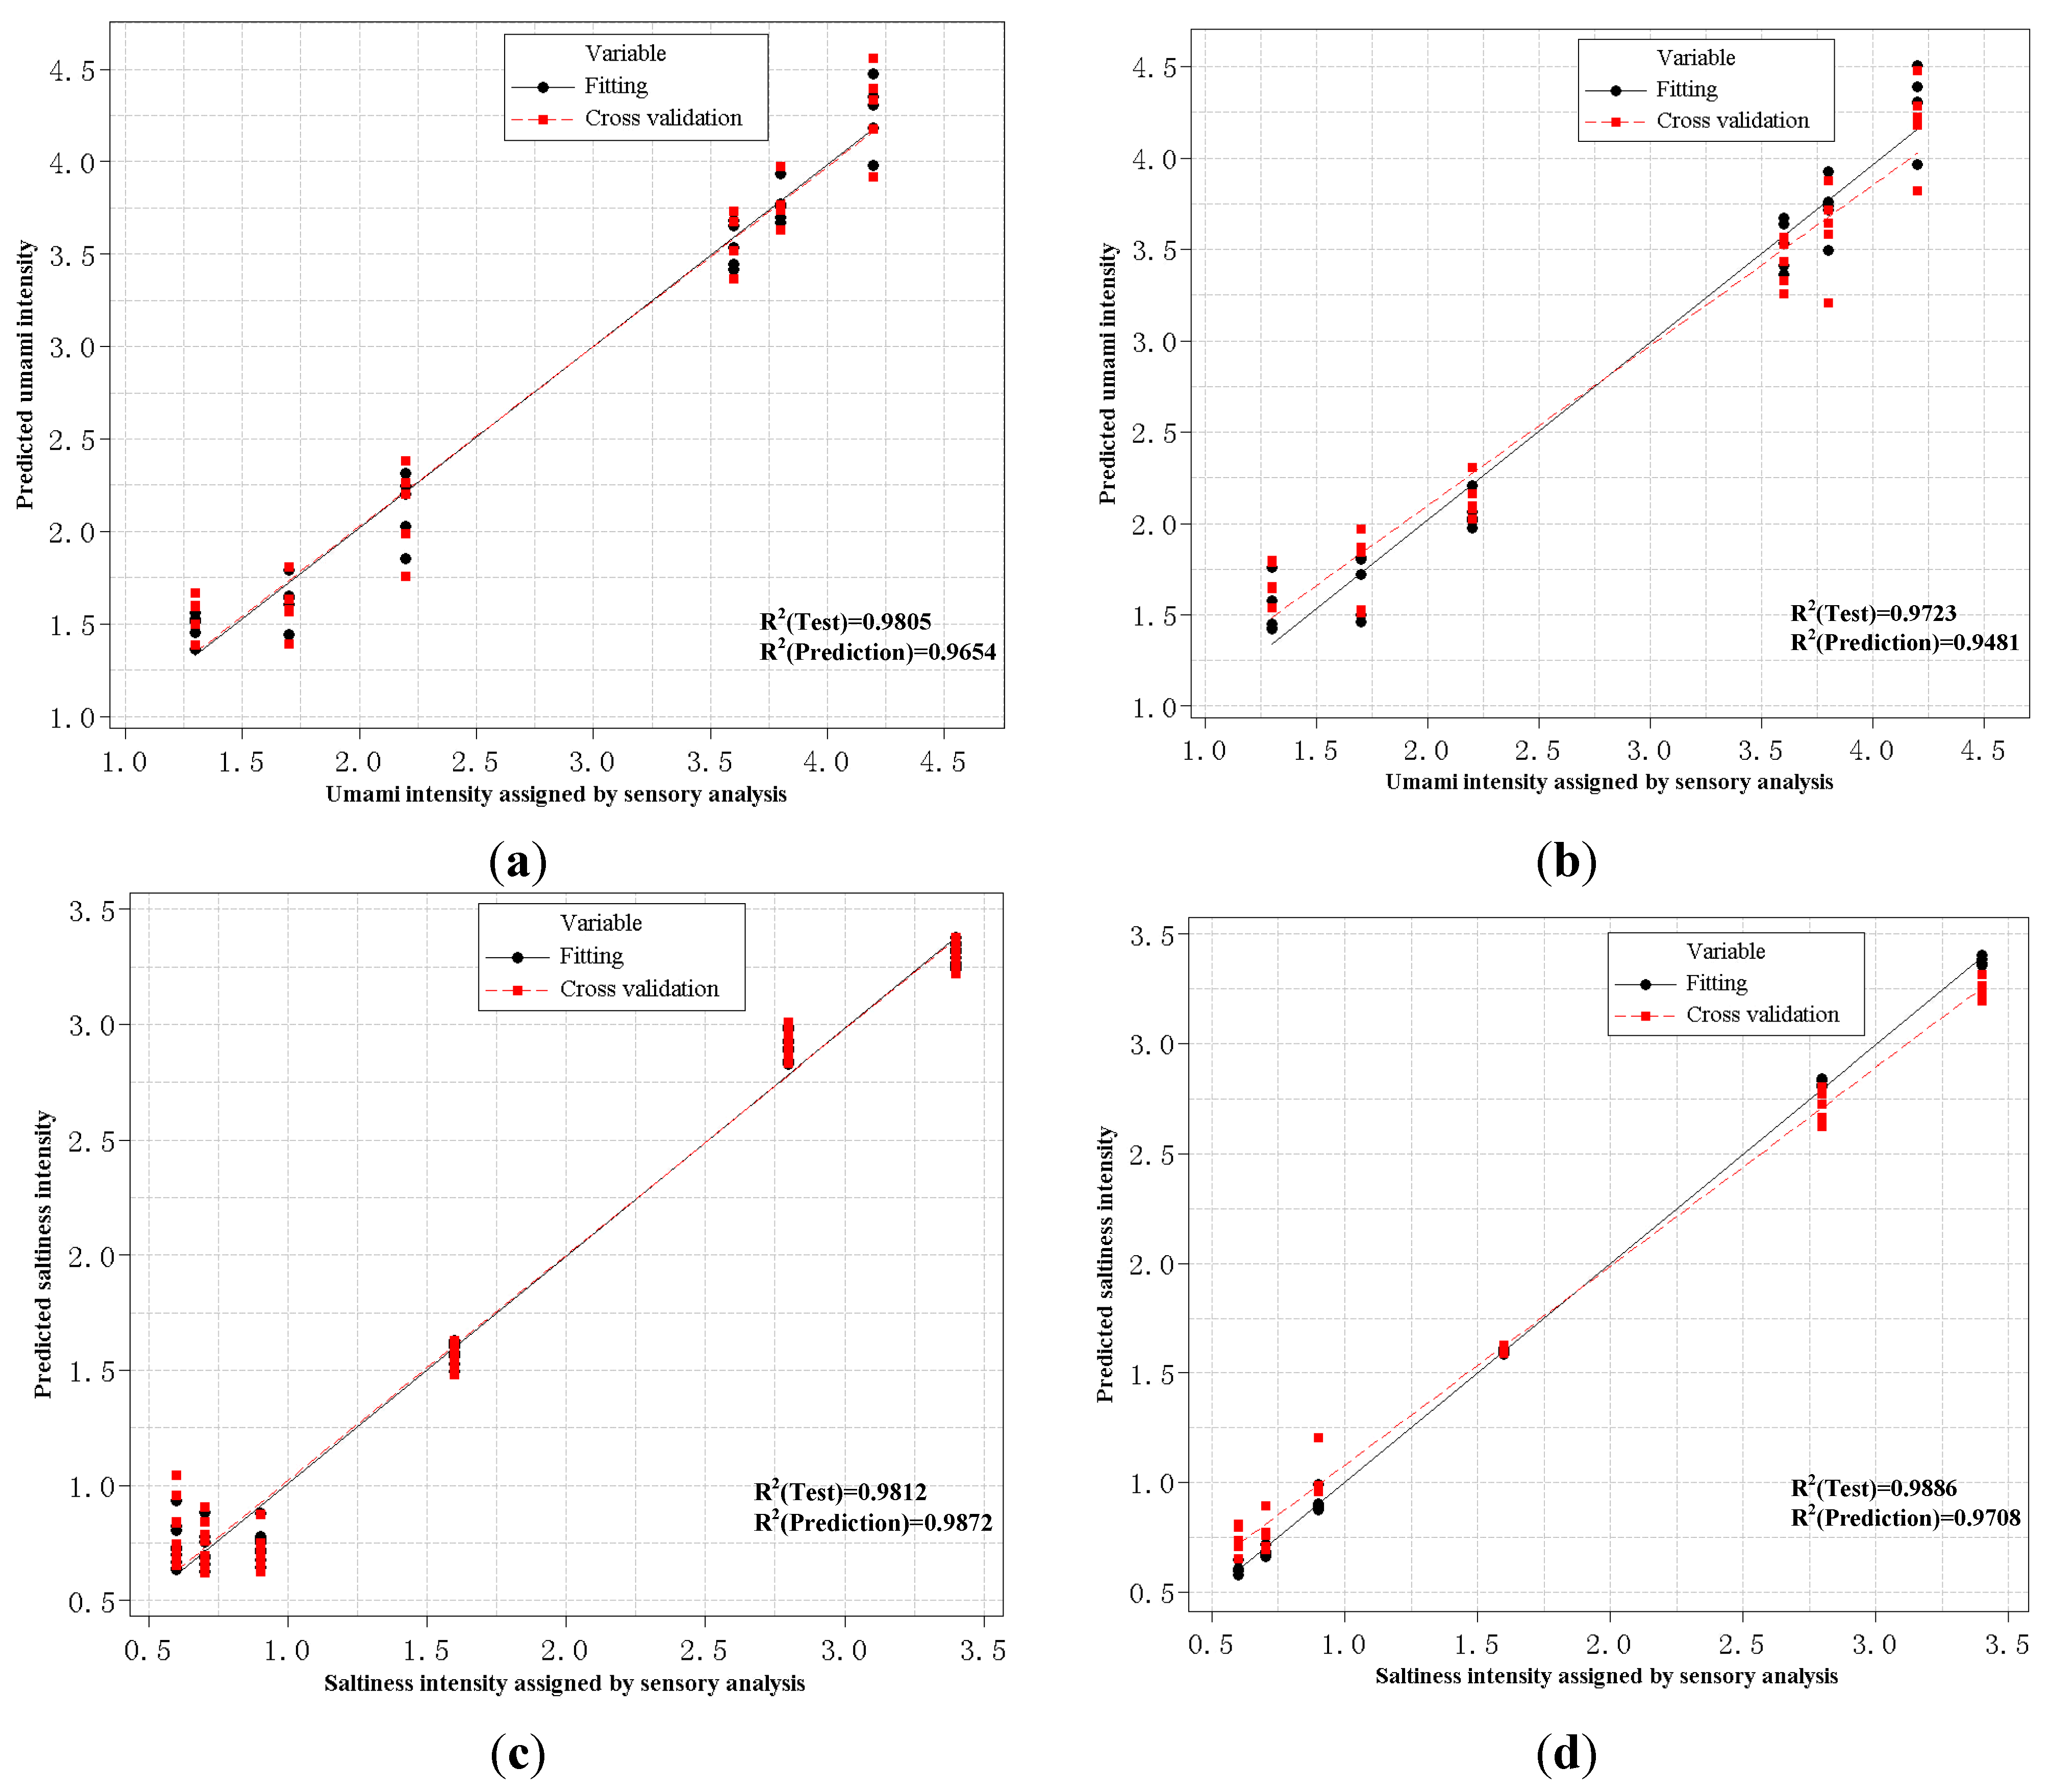
Figure 7a,b show the correlation between the predicted scores by PLS using the electronic tongue and those obtained by sensory analysis with respect to the intensity of umami in peanut meal DEH samples. PLS regression was built by using the response voltage obtained by the seven sensors of the electronic tongue for the peanut meal DEH samples and the scores obtained by sensory analysis. As stated before, the average of last three measurements of each sample was used as the response voltage value of each sensor.
Table 3 lists the prediction formula, and
Figure 7a shows the PLS regression results. A good correlation was observed between the intensity scores of umami predicted by the electronic tongue and the actual scores obtained by sensory analysis with a high
R2 (Test) value of 0.9805 and
R2 (Prediction) value of 0.9654 in the cross-validation test. The two
R2 values are similar, indicating the effectiveness of the taste prediction model: a satisfactory trend was obtained with the regression line being close to the theoretical line. The RMSE of prediction was 0.72374. Then, PLS regression was built by using the first four PC values as independent variables and the scores obtained from sensory analysis. A better trend was observed between the predicted intensity scores of umami and the actual scores obtained by sensory analysis with a high
R2 (Test) value of 0.9723 and
R2 (Prediction) value of 0.9481, albeit a relatively high RMSE of 1.024. From the above analysis, the PLS prediction model using the response voltage from the seven sensors of the electronic tongue as model data input was better than by using the first four PC values. This indicated that the model constructed by using the first four PCs is disadvantageous in that compressed data information obtained by sensor detection.
The same experimental procedure was performed to predict the intensity of saltiness in peanut meal DEH by using the PLS model.
Table 3 lists the prediction formula for saltiness, and
Figure 7c,d show the resultant PLS using input data obtained from the response voltage from the seven sensors of the electronic tongue or the first four PC values. A strong correlation was observed between the predicted scores by the electronic tongue, obtained from the voltage response data, and the actual scores for saltiness obtained by sensory analysis with
R2 (prediction) and
R2 (Test) of 0.9812, 0.9872 and a relatively low RMSE of 0.32548 (
Figure 7c). The resultant PLS regression using the first four PCs as model data input exhibited a relatively worse correlation than the former using the voltage response data with two
R2 of 0.9886, 0.9708 and an RMSE of 0.45234 (
Figure 7d).
Figure 7.
PLS model prediction of intensity scores by the electronic tongue against actual scores as scored by sensory analysis. (a) umami intensity scores using sensors voltage response values as model input; (b) umami scores using the first four PC values as the model input; (c) saltiness scores using sensors voltage response values as the model input; (d) saltiness scores using the first 4 PC values as the model input.
Table 3.
PLS models for prediction of taste intensity scores of DEH.
Table 3.
PLS models for prediction of taste intensity scores of DEH.
| Taste | Input Data | Prediction Formula |
|---|
| umami | voltage response | Y = 76.2667 + 0.0029x1 − 0.0412x2 + 0.0303x3 − 0.0010x4 − 0.0207x5 − 0.0121x6 − 0.0280x7 |
| first 4 PC values | Y = 2.8 + 0.00256PC1 + 0.01402PC2 − 0.03365PC3 − 0.03814PC4 |
| saltiness | voltage response | Y = −29.9924 − 0.0065x1 + 0.0302x2 − 0.0051x3 + 0.0009x4 − 0.016x5 + 0.0245x6 + 0.0068x7 |
| first 4 PC values | Y = 1.5 + 0.00266PC1 − 0.0246PC2 + 0.02367PC3 + 0022PC4 |
From the above analysis of taste prediction models, all four PLS models for taste intensity scores prediction of peanut meal DEH exhibited a good correlation with actual scores obtained by sensory analysis. The two PLS models used to predict the intensity scores for saltiness had stronger predictive capabilities with lower RMSE than those for the intensity scores for umami. In the same prediction of taste intensity scores, the PLS model for the prediction of taste intensity constructed with data from the response voltage values of the seven sensors was better than that constructed using data from the first four PCs with both higher correlation coefficients and relative lower RMSE as no detected data was lost.
3.6.2. RBFNN Taste Prediction Model
RBPNN was applied to further predict the taste intensity scores by the electronic tongue as compared to linear methods caused by its high performance. The two types of input data for RBFNN were selected to be the same as those for PLS. First, the k-means clustering algorithm was adopted to determine a proper data center for the radial basis function of the hidden layer nodes and then an appropriate overlap value and the number of hidden layer nodes were selected using different combination of the two parameters. The optimization range of overlap was 1–3, while the number of hidden layer nodes was 4–10. The optimization goal was the minimum RMSE value of RBFNN. The prediction error results showed that the error of the models decreases with increasing number of hidden layer nodes. However, after the hidden layer nodes increased to a certain number, “overfitting” was observed, leading to an increase in error. Hence, the optimum number of hidden layer nodes for the two types of constructed RBFNN models was determined according to the average minimum RMSE value after three times validation. In one construction of 7-8-1, the lowest average RMSEs of 0.139 and 0.1209 were predicted for umami and saltiness, respectively, with an optimized overlap of 2; the optimum number of the hidden layer nodes was 8. On the other hand, for the other construction of 4-6-1, the lowest average RMSEs of 0.1533 and 0.1793 were predicted for umami and saltiness, respectively, with an overlap of 2, and the optimum number of hidden layer nodes was 6.
Table 4 summarizes the prediction results. It lists the RMSE, maximum error, mean absolute error (MAE), and
R2, and rows having different taste attributes and different input data (using sensor voltage responses and four PCs). It also shows PLS results for comparison.
The prediction ability of the RBFNN model can be seen directly in
Table 4. It shows a comparison of the prediction error for umami or saltiness assigned by using the response voltage values from the seven sensors and the first 4 PCs values; an
R2 of 0.994 and RMSE, Maximum error and MAE of 0.139, 0.1531 and 0.13, respectively, was better than that by the first 4 PCs values, for which an
R2 of 0.992 and RMSE, Maximum error and MAE of 0.1533, 0.2738 and 0.14, respectively. Similarly, the model prediction results for the intensity of saltiness were shown. A strong correlation was observed between the scores predicted by the electronic tongue using the response voltage data and the actual saltiness scores obtained from sensory analysis with an
R2 of 0.998 and RMSE, Maximum error and MAE of 0.1209, 0.2162 and 0.115, respectively. The latter also had an excellent correlation by using the first 4 PCs as model data input with an
R2 of 0.996 but with a relative higher error of 0.1793, 0.2275 and 0.169, respectively.
Table 4.
Comparison of the model for the ability to predict different errors and R2 for DEH.
Table 4.
Comparison of the model for the ability to predict different errors and R2 for DEH.
| Models | Taste Prediction | Input Data | RMSE | Maximum Error | MAE | R2 |
|---|
| PLS | umami | voltage response | 0.7237 | 0.5056 | 0.222 | 0.9805/0.96544 |
| the first 4 PCs | 1.024 | 0.7044 | 0.246 | 0.9723/0.9481 |
| saltiness | voltage response | 0.3255 | 0.241 | 0.117 | 0.9812/0.9872 |
| the first 4 PCs | 0.4523 | 0.4965 | 0.119 | 0.9886/0.9708 |
| RBFNN | umami | voltage response | 0.139 | 0.1531 | 0.13 | 0.994 |
| the first 4 PCs | 0.1533 | 0.2738 | 0.14 | 0.992 |
| saltiness | voltage response | 0.1209 | 0.2162 | 0.115 | 0.998 |
| the first 4 PCs | 0.1793 | 0.2275 | 0.169 | 0.996 |
The assessment results using RBPNN model to predict taste showed that the results obtained from all four RBFNN prediction models well correlated with those obtained from the actual sensory analysis scores. In the same prediction of taste intensity, RBFNN with model input data from the response voltage values of seven sensors exhibited better ability to predict scores than that with model data from the first 4 PCs, caused by the relatively lower RMSE. In the study, RBFNN exhibited the best ability to predict the intensity for saltiness using the input data from the response voltage value of seven sensors, with the lowest RMSE of 0.1209.
A comparison of the taste assessment by the RBPNN and PLS prediction models shown in
Table 4 indicated that RBPNN exhibited a stronger correlation with higher correlation coefficients and better taste prediction ability with a relatively lower error than those of PLS. For the construction of the two taste prediction models, using the response voltage values of the sensors of the electronic tongue, as compared to the first four PCs, was better.
However, despite the good prediction results obtained with both PLS and RBFNN, it is necessary to highlight that prediction results may be overoptimistic if some of the measurements in similar hydrolyzate solutions prepared from similar peanut meal samples were used both for calibration and validation.


