Next Article in Journal
Analysis of Settlement Expansion and Urban Growth Modelling Using Geoinformation for Assessing Potential Impacts of Urbanization on Climate in Abuja City, Nigeria
Next Article in Special Issue
Spatial-Temporal Dynamics of China’s Terrestrial Biodiversity: A Dynamic Habitat Index Diagnostic
Previous Article in Journal
InSAR Detection and Field Evidence for Thermokarst after a Tundra Wildfire, Using ALOS-PALSAR
Previous Article in Special Issue
Integrated Analysis of Productivity and Biodiversity in a Southern Alberta Prairie
 
 
Erratum published on 16 June 2016, see Remote Sens. 2016, 8(6), 475.
Article

Associations of Leaf Spectra with Genetic and Phylogenetic Variation in Oaks: Prospects for Remote Detection of Biodiversity

1
Department of Ecology, Evolution and Behavior, University of Minnesota, Saint Paul, MN 55108, USA
2
Department of Forest and Wildlife Ecology, University of Wisconsin, Madison, WI 53706, USA
3
Environmental & Climate Sciences Department, Brookhaven National Laboratory, Upton, NY 11973, USA
4
Department of Biology, Saint Olaf College, Northfield, MN 55057, USA
5
Departamento de Ingenieria en Ambiente y Desarrollo, University of Zamorano, Zamorano, Honduras
*
Authors to whom correspondence should be addressed.
Remote Sens. 2016, 8(3), 221; https://doi.org/10.3390/rs8030221
Submission received: 13 November 2015 / Revised: 1 February 2016 / Accepted: 22 February 2016 / Published: 9 March 2016
(This article belongs to the Special Issue Remote Sensing of Biodiversity)

Abstract

:
Species and phylogenetic lineages have evolved to differ in the way that they acquire and deploy resources, with consequences for their physiological, chemical and structural attributes, many of which can be detected using spectral reflectance from leaves. Recent technological advances for assessing optical properties of plants offer opportunities to detect functional traits of organisms and differentiate levels of biological organization across the tree of life. Here, we connect leaf-level full range spectral data (400–2400 nm) of leaves to the hierarchical organization of plant diversity within the oak genus (Quercus) using field and greenhouse experiments in which environmental factors and plant age are controlled. We show that spectral data significantly differentiate populations within a species and that spectral similarity is significantly associated with phylogenetic similarity among species. We further show that hyperspectral information allows more accurate classification of taxa than spectrally-derived traits, which by definition are of lower dimensionality. Finally, model accuracy increases at higher levels in the hierarchical organization of plant diversity, such that we are able to better distinguish clades than species or populations. This pattern supports an evolutionary explanation for the degree of optical differentiation among plants and demonstrates potential for remote detection of genetic and phylogenetic diversity.

Graphical Abstract

1. Introduction

Biodiversity loss is a major threat to our planetary life support systems [1,2,3]. Gaps in documenting and monitoring biodiversity are largest in areas where biodiversity is greatest and where existing biodiversity may be most threatened [4], highlighting the need for globally consistent and continuous approaches for assessing changes in biodiversity [5]. Using remote sensing to monitor changes in biodiversity, including in remote and logistically challenging ecosystems around the Earth, is emerging as a promising approach to contribute to an integrated global biodiversity monitoring system [5,6,7,8]. Recent and proposed airborne and satellite platforms equipped with hyperspectral imaging technology [5,9] increase the urgency to understand how we can use these tools effectively to monitor biological variation globally across spatial, temporal and biological scales.
Plant species and lineages have evolved different functional mechanisms to acquire, harness and deploy resources [10,11,12,13]. Differences among plants in their functional attributes have consequences for their spectral properties, given that the chemical, morphological, physiological and structural properties of leaves influence the way electromagnetic energy is reflected, transmitted and absorbed [14,15,16,17,18,19]. A range of functional traits can and have been frequently assessed using hyperspectral remote sensing methods [8,17,20] and considerable progress has been made in linking remote sensing data to biodiversity [14,21,22] based on trait variation among taxa. Critical to these efforts are statistical advances that have been successfully applied to differentiate taxa in specific regions and systems [23,24,25].
Biological diversity occurs at many organizational levels: within individuals, among individuals within populations, among populations within species, among species within lineages (clades), and among lineages at increasing hierarchical levels (Figure 1). Variation in observable traits (i.e., the phenotype) arises from both evolutionarily derived genetic variation and environmental factors. Generally, variation among individuals within populations or species is less than the variation among species, e.g., [26,27]. Likewise, species within a particular clade tend to show greater similarity (and less variation) than is found among species from distantly related clades, e.g., [28,29]. Phenotypic similarity of organisms under common conditions often parallels the extent of shared evolutionary history among organisms [30], which can be modeled simply in the form of a Brownian motion process of evolution [31] (Figure 1). With random changes in the direction of trait values at each time-step, the variation among taxa is directly proportional to the time since divergence from a common ancestor. Despite the generality of this pattern, convergent and divergent evolution, respectively, can cause distantly related species to have more similar form and function, and close relatives to be more distinct, than expected under a Brownian motion model of evolution [32,33].
Spectra are a phenotypic expression of the aggregate signals of chemical and structural composition of leaves that have evolved through time. As a consequence, spectra may be hypothesized to reveal evolutionary relatedness among organisms both within and across lineages. Therefore, we might reasonably expect that spectral variation will provide greater ability to differentiate taxa at deeper levels of the phylogeny and with increasing phylogenetic distance, such that clades can be distinguished more accurately than species or populations. Few attempts have been made to directly link high-dimensional spectral data to phylogenetic information. The attempts that have been published tend to rely on taxonomic hierarchies rather than highly resolved phylogenetic relationships, e.g., [14,21], even though these data are becoming increasingly available (for example, the recent 32,223-species dated tree, [34]).
To the extent that genetically-derived variation dominates plastic (environmentally-derived) variation, there is promise in consistent association of spectra with biological organisms at some hierarchical level in the tree of life. Variation in leaf-level properties due to environmental drivers poses a key challenge to differentiating taxa at any level using spectral information. Other factors include: (1) remote sensing considerations such as spatial and spectral resolution, sun angle and atmospheric effects; (2) within and between pixel variation due to species composition, canopy structure (including density, cover, vegetation size/age, etc.); and (3) convergence in chemical and functional properties among taxa. Here we test the extent to which spectral information can be used to differentiate genotypes and closely related species, while controlling for other sources of variation. We focus exclusively on leaf-level spectral variation within and among species within a single lineage, allowing us to remove the complications associated with spatial resolution, atmospheric and canopy effects, size and age variation, and environmental variation. We test the extent to which spectra can be associated with evolutionary changes at both intra- and interspecific biological scales.
Specifically, we ask:
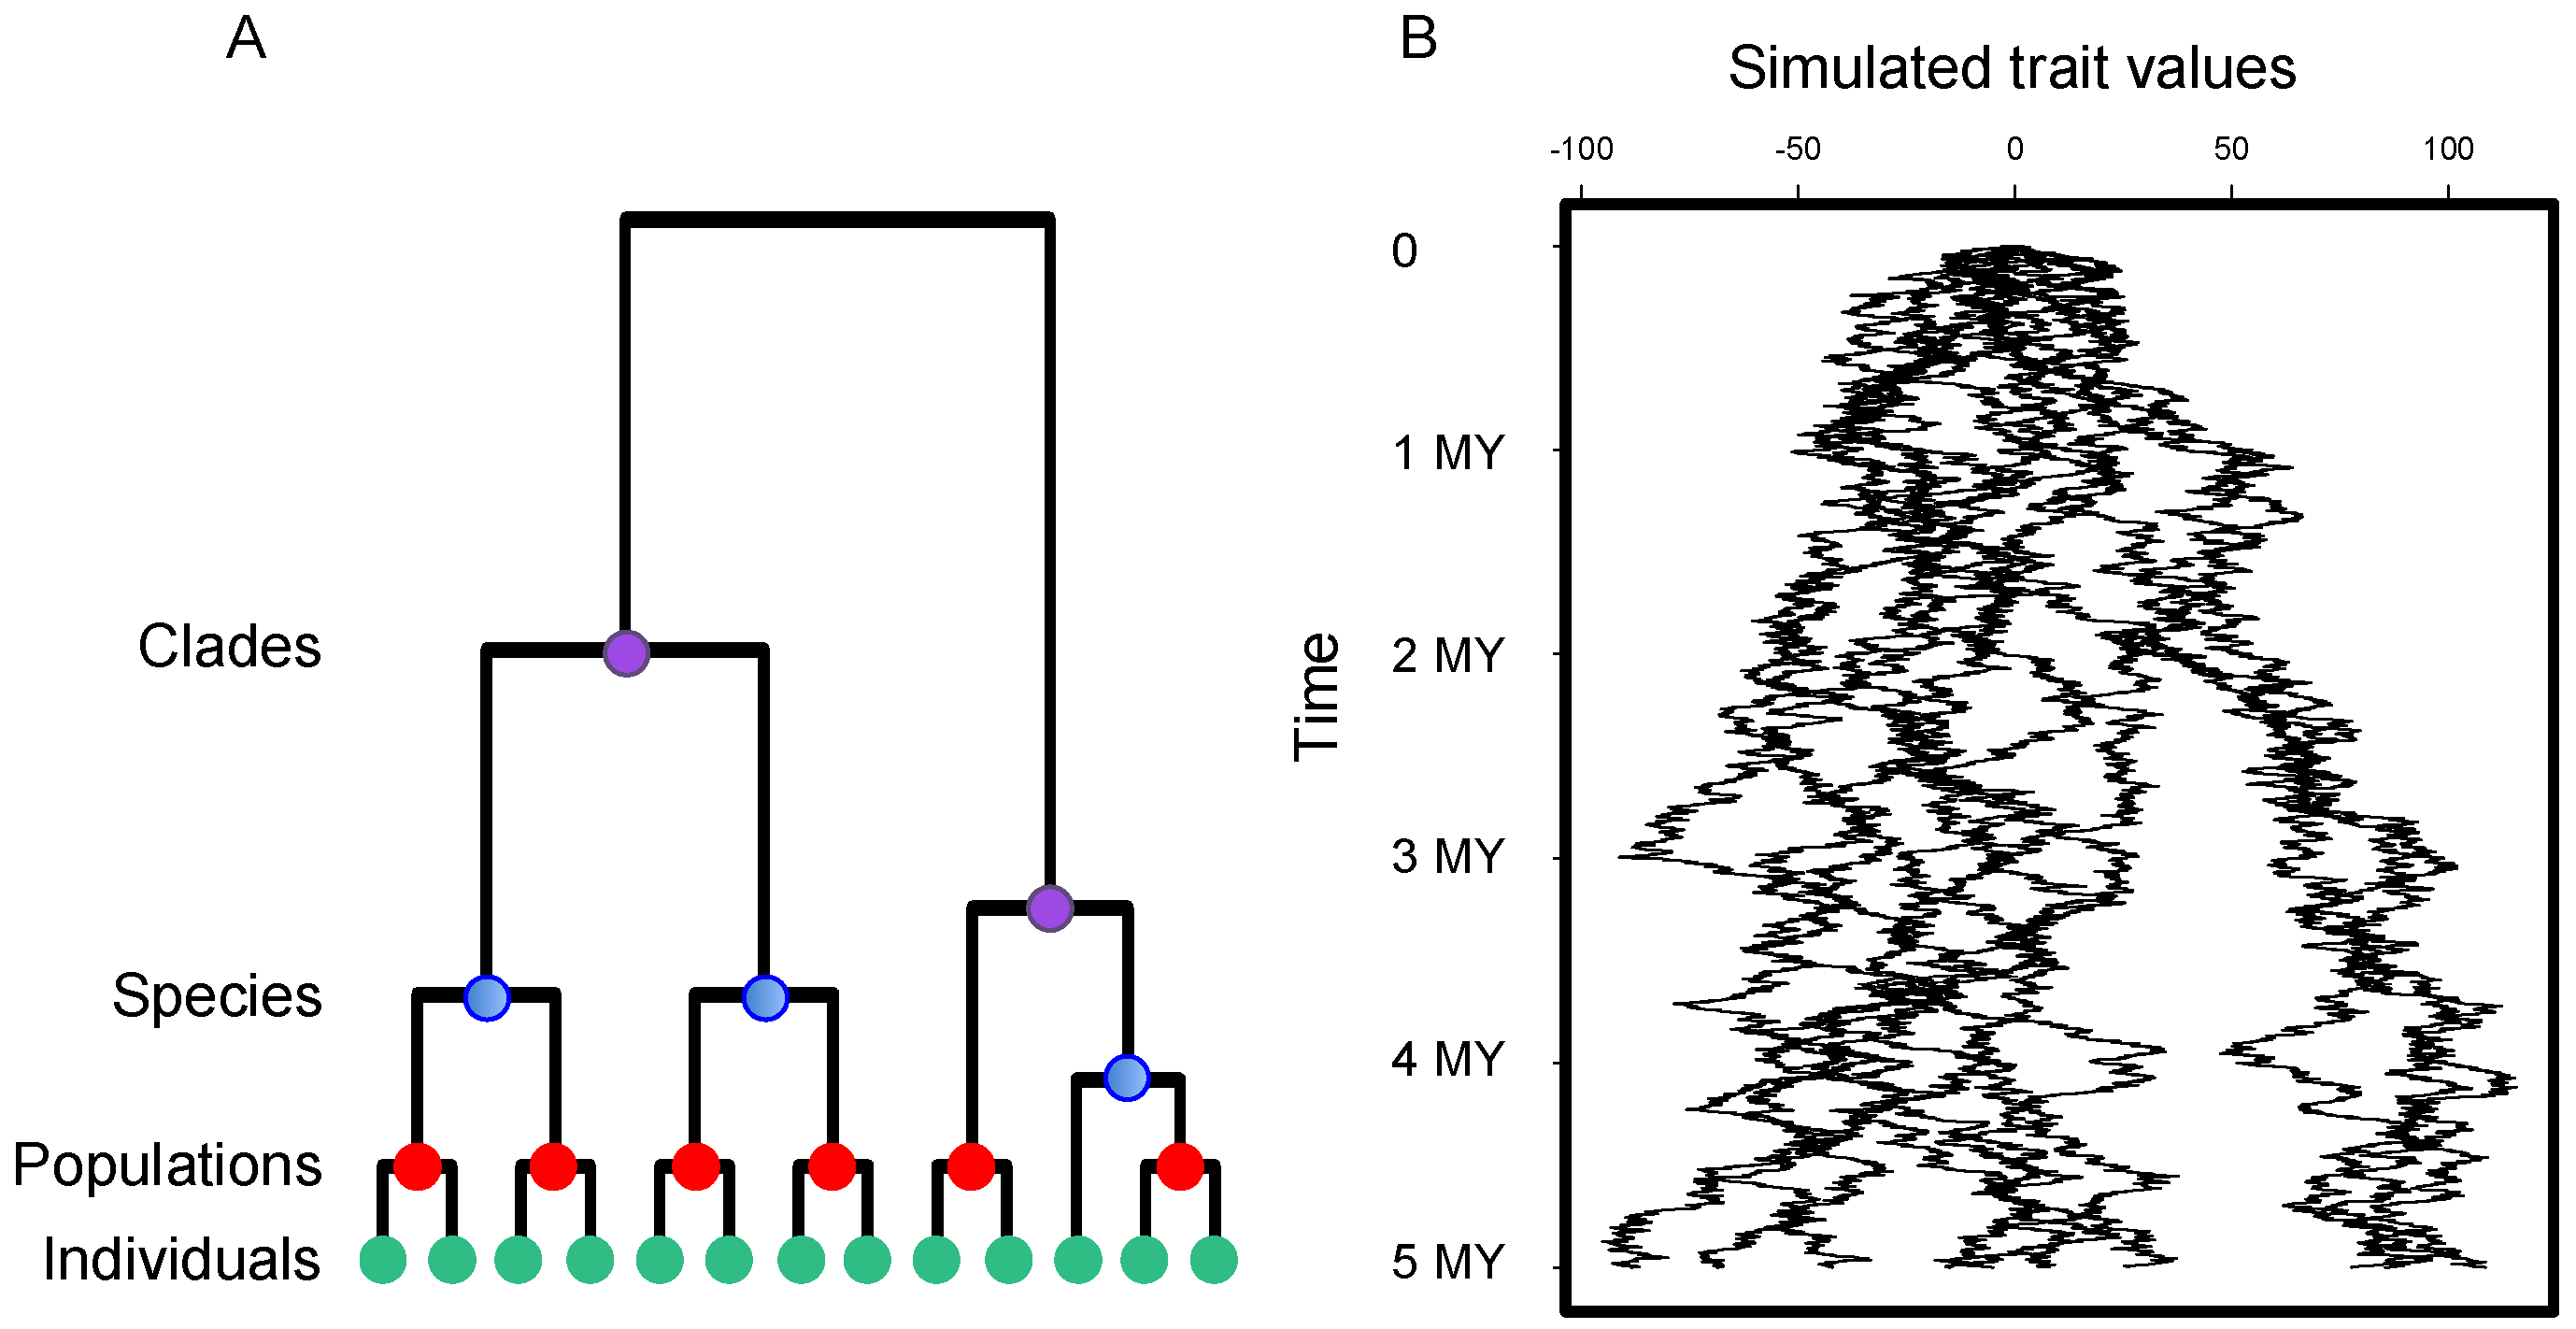
  • Do closely related species tend to have similar spectral profiles?
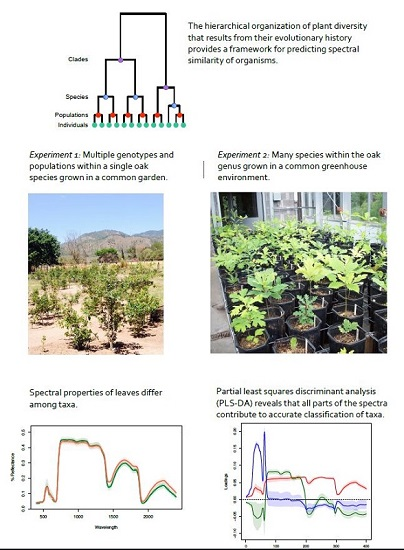
  • Can leaf spectra be used to detect variation: (i) among populations within a single species; (ii) among species within clades; and (iii) among clades? Where in the biological hierarchy are spectral signals best able to differentiate taxa?
  • Does statistical comparison of high dimensional spectral data allow greater accuracy in detection of phylogenetic differences among taxa than estimates of functional traits derived from spectra?
We use two experimental systems. The first is a field experiment in Honduras in which four populations of a single oak species (Quercus oleoides (Q. oleoides)) were grown from seed collected in wild populations across Central America. The second is a system of 28 closely related species within a single phylogenetic lineage (the oaks), in which leaf-level spectra were measured on saplings growing in a controlled greenhouse experiment.
We used partial least squares discriminant analysis (PLS-DA) to test how well plant spectra or, alternatively, spectra-derived traits can statistically distinguish biological taxa at three different evolutionary scales in the hierarchy of plant diversity: lineages, species and populations. We first allowed the PLS-DA to use full spectral data to describe the predictive power for each evolutionary unit, controlling the number of latent variables included in the model. We then used a suite of nine functional traits predicted from spectral data, including structural components (e.g., fiber content and LMA) and chemical components (e.g., chlorophyll and nitrogen concentrations), as input for the PLS-DA model. Using both approaches allowed us to compare the consequences of using dimensional reduction to derived traits, relative to information provided by the full spectrum in a predictive framework. On the one hand, full spectral data may prevent loss of information that could be genetically meaningful, providing information about a comprehensive ensemble of traits, including those that we may not have measured or we may not yet know are important. On the other hand, predicted traits may be better associated with the evolutionary processes underlying differentiation and speciation and thus allow us to eliminate regions of the spectra that are not relevant to differentiating taxa.

2. Materials and Methods

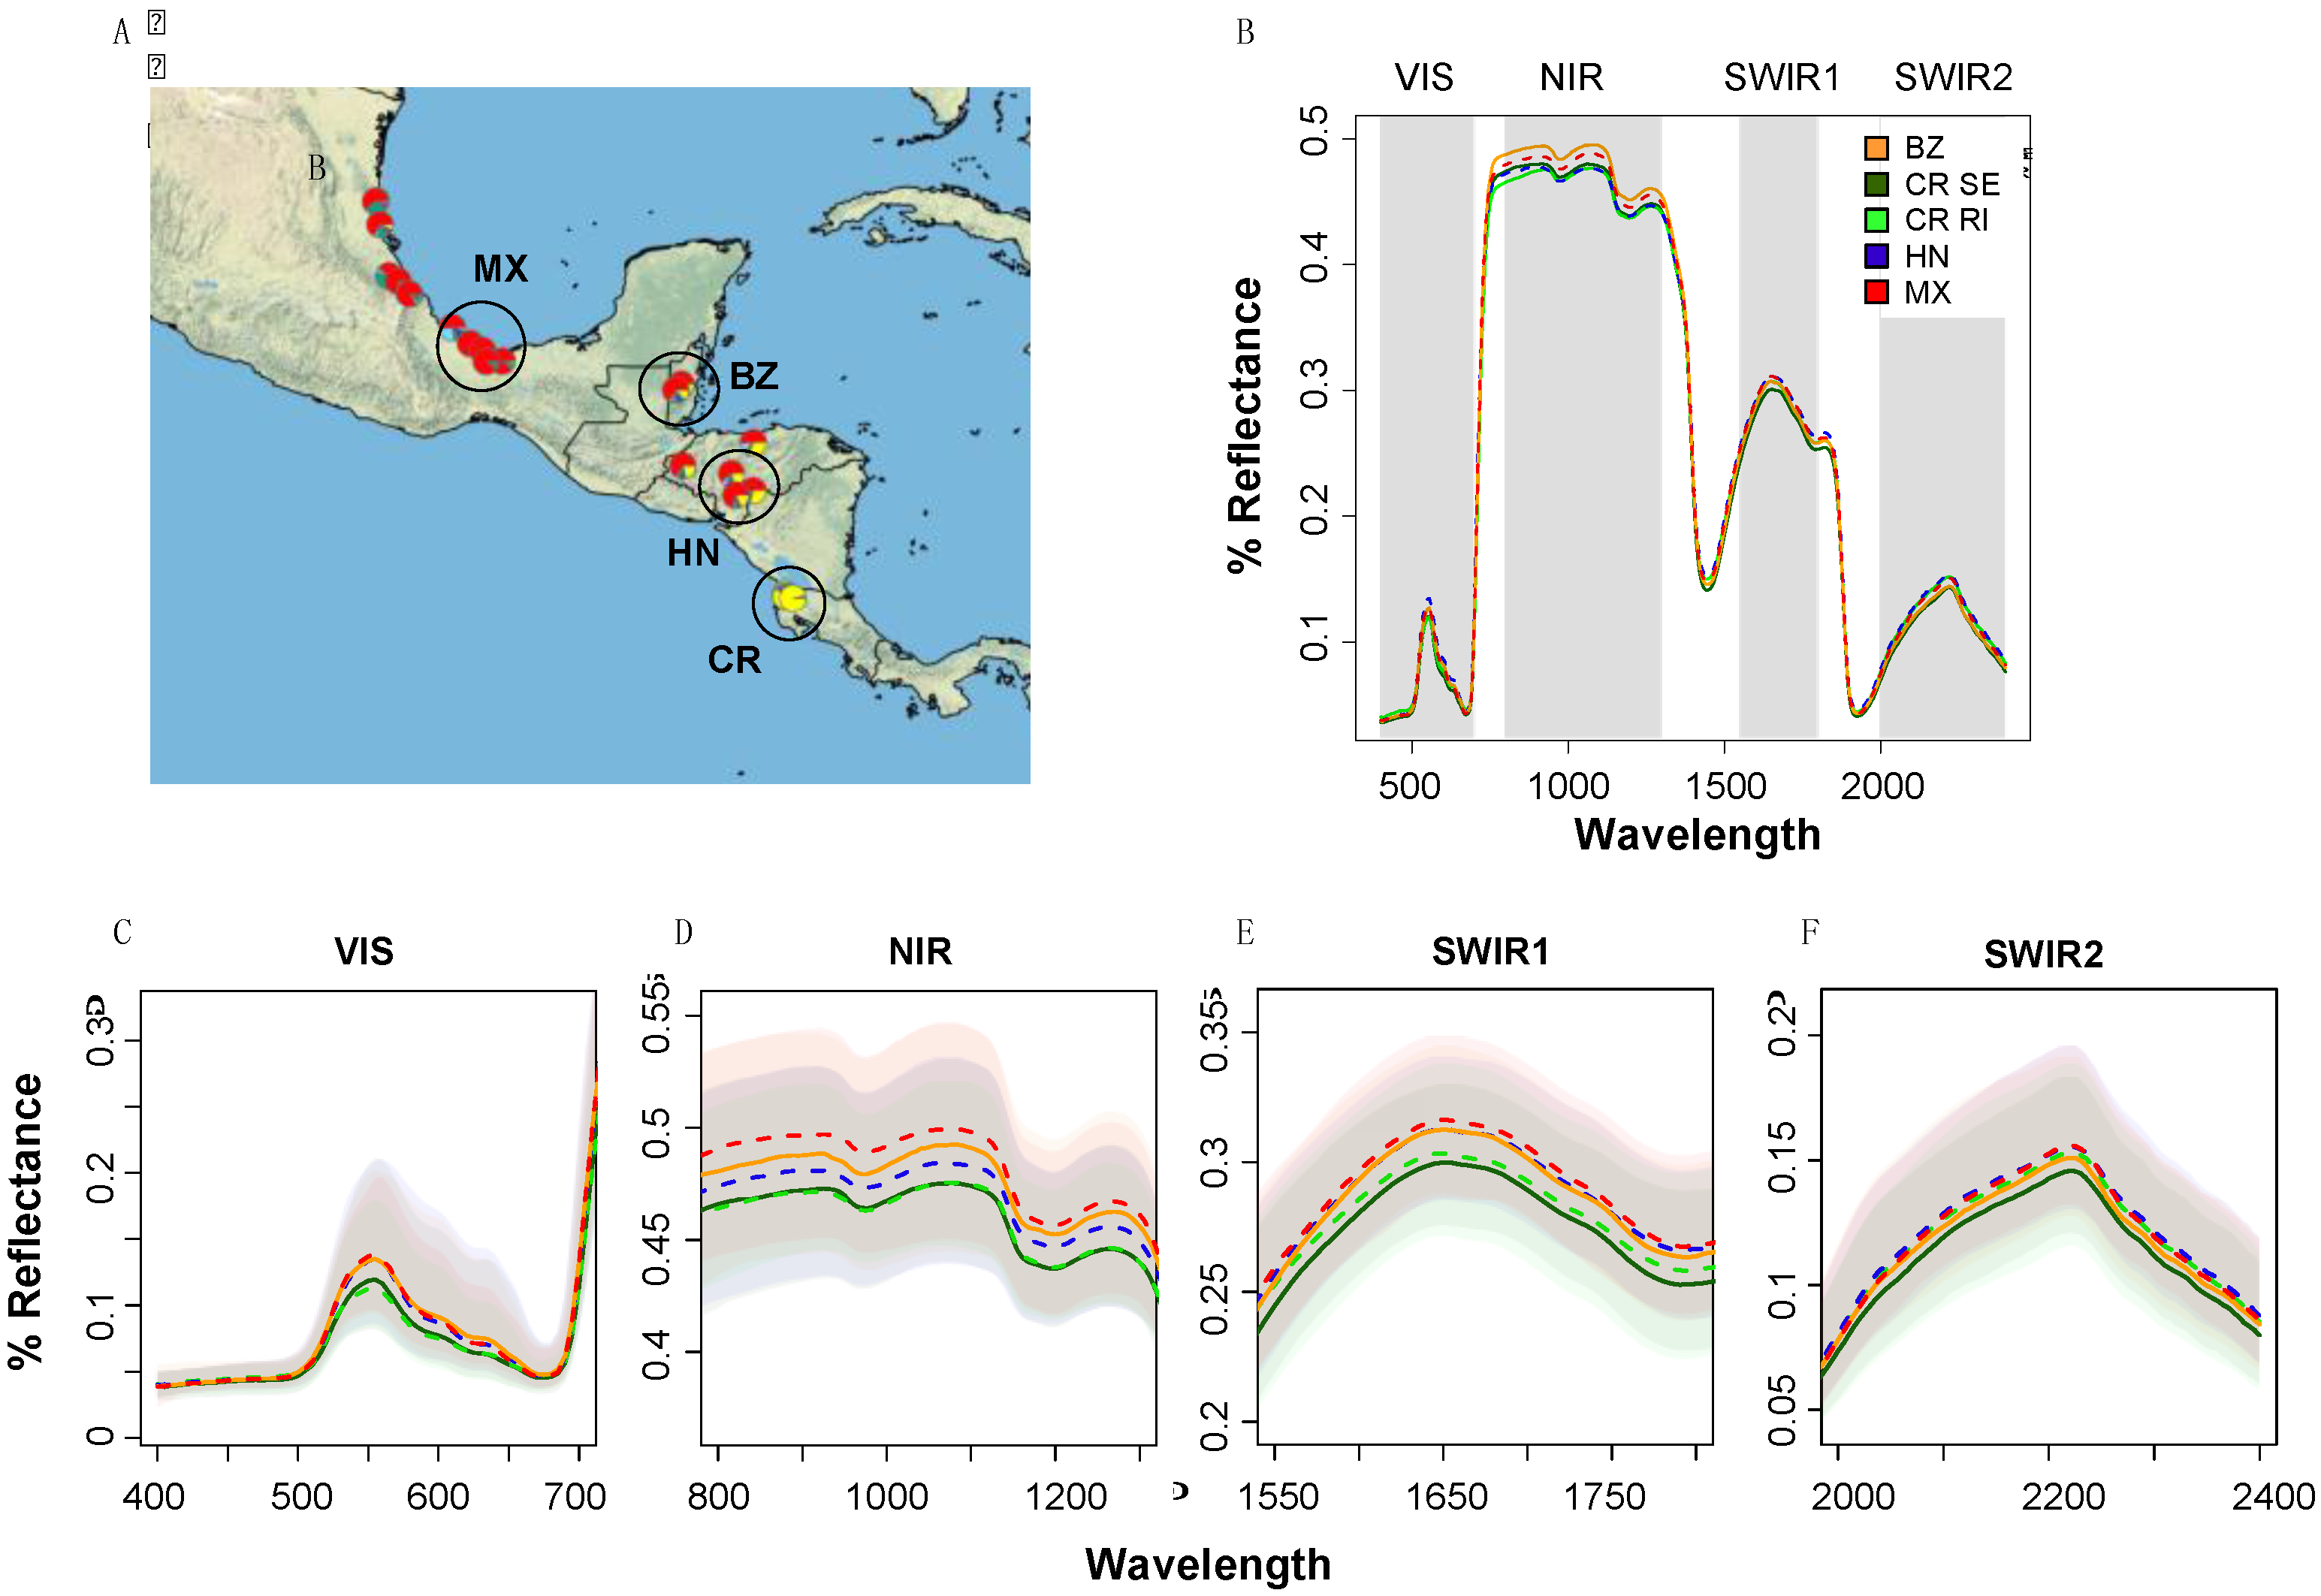
2.1. Experimental System 1: Population-Level Variation within a Single Species (Tropical Live Oak, Quercus oleoides) in a Field Experiment in Zamorano, Honduras

In the first experiment, we examine spectral variation among populations within a single species of oak. We measured spectra of tropical live oak saplings (Quercus oleoides) from five populations across the species range (Mexico, Belize, Honduras, and two populations from a high and a low elevation region in Costa Rica) grown in a common garden at Zamorano University, Honduras. Populations experience contrasting climatic regimes and biotic factors in their sites of origin and may thus have adapted to their contrasting local conditions. Moreover, gene flow is limited among populations given that they are each several hundred kilometers apart, allowing for genetic drift and phenotypic divergence among them [35,36]. As a consequence, we expected that populations might be phenotypically differentiated. Seeds were originally collected in 2009 and 2010, then germinated in a nursery and outplanted in a common garden in a randomized complete block design with maternal lineage represented evenly among blocks and individuals randomized within blocks. Half of the blocks, randomized spatially, were watered up to a total of 25 mm per week, a typical rainfall amount found during the dry season in wetter regions of the species range [36,37]. The remaining blocks were not watered. All blocks were weeded biweekly.
In March 2014, when plants were 2 or 3 years of age, leaf-level spectra were collected on fully mature, recently expanded leaves. Leaf reflectance was measured using a high-spectral-resolution FieldSpec 3 Full-Range (350–2500 nm) spectroradiometer (Analytical Spectral Devices, Boulder, CO, USA). All measurements were taken from the leaf adaxial surface using a leaf-clip assembly that was attached to a plant probe having an internal, calibrated light source. Reflectance was measured on three different areas per leaf, with five spectra measured per area on three leaves from each individual between approximately 10 am and 2 pm. A total of 486 watered individuals and 569 ambient individuals were measured from the five populations. Plant water potential was measured at predawn (PDψ) using a Scholander pressure chamber (Soil Moisture Equipment Corp., Santa Barbara, CA, USA). For a total of 48 subsampled individuals, ambient plants had mean PDψ = −1.53 MPa, ±0.125 MPa SE, while well-watered plants had a mean PDψ = −0.94 MPa ±0.106 MPa SE, demonstrating a clear difference in water status among the treatments. We focused on plants measured under watered conditions for this study, but best comparison to Experiment 2 (below). However, we also examined the extent to which populations could be discriminated under ambient (greater water stress) conditions or when individuals from both treatments were combined.
Nuclear microsatellite markers collected from individuals across the range, reported in a previous study [36], were used to examine neutral genetic variation among regions (Figure 2A). These genetic patterns are of interest in comparison to spectral or trait differences among populations.
Foliar carbon (C), nitrogen (N), fiber, cellulose and lignin concentrations (% dry mass) and leaf mass per area, (LMA, g·m−2) were generated from calibrations from Serbin [38]. Foliar water content was determined using the normalized differential water index (NDWI) and calculated as the relative difference between reflectance at wavelengths 857 and 1241 nm [39]. Foliar chlorophyll content (g·m−2) was calculated as the relative difference between reflectance at wavelengths 750 and 705 nm [40]. The photochemical reflective index (PRI), an index of photosynthetic light-use efficiency [41], was calculated as the relative difference between reflectance at wavelengths 531 and 570 nm. Trait estimates and indices were calculated using the averaged spectra from each leaf then further averaged to provide trait information for each plant.

2.2. Experimental System 2: Greenhouse Experiment with 28 Oak Species from a Range of Geographic Regions and Climatic Zones across North and Central America Grown in a Controlled Environment

The second experiment examined leaf spectral variation in species from multiple clades within a single genus (oaks). Leaf type (or habit) is a major life-history trait that differs among oak species, and is associated with a suite of other functional traits, including leaf lifespan, LMA, leaf nutrient content, photosynthetic rate and freezing tolerance [13,42,43]. Species can be categorized into three major leaf types: (1) deciduous (leaves persist in the canopy only for the growing season); (2) brevi-deciduous (old leaves are exchanged just before flushing annually with a brief period in which the tree has a bare or incomplete canopy); or (3) evergreen (leaves are functional and green all year). Acorns were collected in the fall of 2012 from the U.S. and Mexico from over 28 species and planted in February 2013 in a greenhouse at the University of Minnesota maintained at a constant growing season temperature of 22–32 °C (8–16 °C in the winter). Each species included seeds collected from one to five populations. Plants were transplanted twice; the final transplant was into 1.5 m deep pots. Plants were grown under well-watered and low water conditions. Water potential differences in summer 2014 showed mean PDψ of −0.47 MPa ±0.07 MPa SE for the well-watered treatment and −0.88 MPa ±0.09 MPa SE for the low water treatment. In June of 2014, leaf-level reflectance spectra were collected on two different areas per leaf, with three measurements per area and five spectra averaged per measurement, on two leaves of approximately 7–14 individuals for each of 27 species in the well-watered treatment and for 23 species in the low water treatment. Spectra were collected on fully mature, recently expanded leaves and averaged across leaves from individuals per species for analyses (total sample size was 306 individuals, well-watered; 204 individuals, low water). Trait estimates were calculated from the spectra averaged at the leaf level, as in Experiment 1. We focus analyses on the well-watered plants, which have a higher sample size, but also examine the low water individuals and conduct a combined analysis to understand the impact of environmental variation on species detection accuracy, similar to Experiment 1.

2.3. Phylogenetic Information

The phylogenetic data were contributed by the Oaks of the Americas project [44], which is developing a fully resolved genus-level phylogeny using RADseq data. All vouchers are stored at the University of Minnesota, the Morton Arboretum, and Duke University. Sequencing and analytical procedures are described previously [44]. The Oaks of the Americas phylogeny was pruned to include only the species included in the present study. The species represent all of the four major clades within the American oaks, a monophyletic group of approximately 260 species [45]. From the full genus, which includes approximately 400 species globally, the Asian cycle cup oaks (Quercus subgenus Cyclobalanopsis) and the Mediterranean cerris group of oaks (Quercus section Cerris) are not represented [46].

2.4. Statistical Analyses

We conducted principal coordinates (PCO) analysis on the spectral data using the vegan package in R [47]. This method uses a distance or dissimilarity matrix and transforms a number of possibly correlated variables into a smaller number of uncorrelated variables, or principal coordinates, reducing the dimensionality of the data. We used the minimization of angular distance, which has advantages for spectral data, but obtained very similar results for Bray–Curtis dissimilarities or Euclidean distances. PCO was performed for individuals distinguished by (1) populations within Quercus oleoides; (2) the 28 oak species within the genus; (3) the four clades represented within the genus; and (4) the three leaf types (deciduous, brevi-deciduous and evergreen). For each principal component in the PCO analysis for populations, we used ANOVA to test whether populations could be differentiated, treating population as the main effect. Components that significantly differentiated populations could then be identified and used in visualizing differences. We also used ANOVA to identify components that were useful in differentiation leaf types.
We estimated the phylogenetic signal of the predicted traits and the first and second principal coordinates of the spectral data using the K statistic [48] as implemented in the Phytools R package [49]. A K value of near 1 indicates that the trait variation is proportional to the time since divergence as predicted by a Brownian motion (BM) model of evolution. A BM null model is derived by repeated simulations of Brownian motion evolution. Observed K values less than the 95% distribution of the simulated values indicate that traits are less divergent than expected by Brownian motion [48]. K values are also compared to a null distribution based on a white noise model in which trait values are randomly permuted across the tips of the phylogeny. Significance is tested by comparing the observed K statistic value to the distribution of K statistics estimated from both the white noise and the Brownian motion null models. If observed K values are not different from random expectation (white noise null model), they can be considered convergent or labile. If they are not different from the BM null model, they can be considered conserved. Values greater than the 95% CI for the BM null indicate very highly phylogenetically conserved traits. We chose PCO components with significant phylogenetic signal to visualize differentiation of species and clades.
We then used partial least squares-discriminant analysis (PLS-DA) [50] to determine how well biological units could be classified using either full-spectral data or foliar trait data measured or predicted from spectra. PLS-DA is a statistical approach used with high dimensional data to discriminate groups based on projecting latent variables through the response and predictor variables to both reduce data dimensionality and maximize prediction accuracy. It is an appropriate method for data in which predictor variables have a high degree of collinearity, and it is widely used in several areas including chemometrics [50,51,52,53], metabolomics [54] and functional genomics [55]. The PLS model fits response variables that are indicators of groups of interest to the full spectrum. In this study, full-spectrum data included 400–2400 nm (excluding regions of the spectrum, 350–399 and 2401–2500, with higher noise) subsampled every 5 nm. Subsampling at smaller or large intervals (1, 2 or 10 nm) gave indistinguishable results (results not shown). Trait data included foliar characteristics predicted from spectra listed above. The analyses were applied by repeatedly (300 times) splitting observations by groups evenly (50:50) into training (calibration) and testing (validation) sets. We used the number of correct classifications both in the calibration and the validation sets across 300 iterations to evaluate the accuracy of the tested model. The number of components to allow in the models that would give the best fit to the data was determined by iteratively running the PLS-DA models with increasing numbers of components (Figure S1) and was based on the highest kappa values returned for the validation models. PLS-DA modeling was performed in the R packages caret and vegan.

3. Results

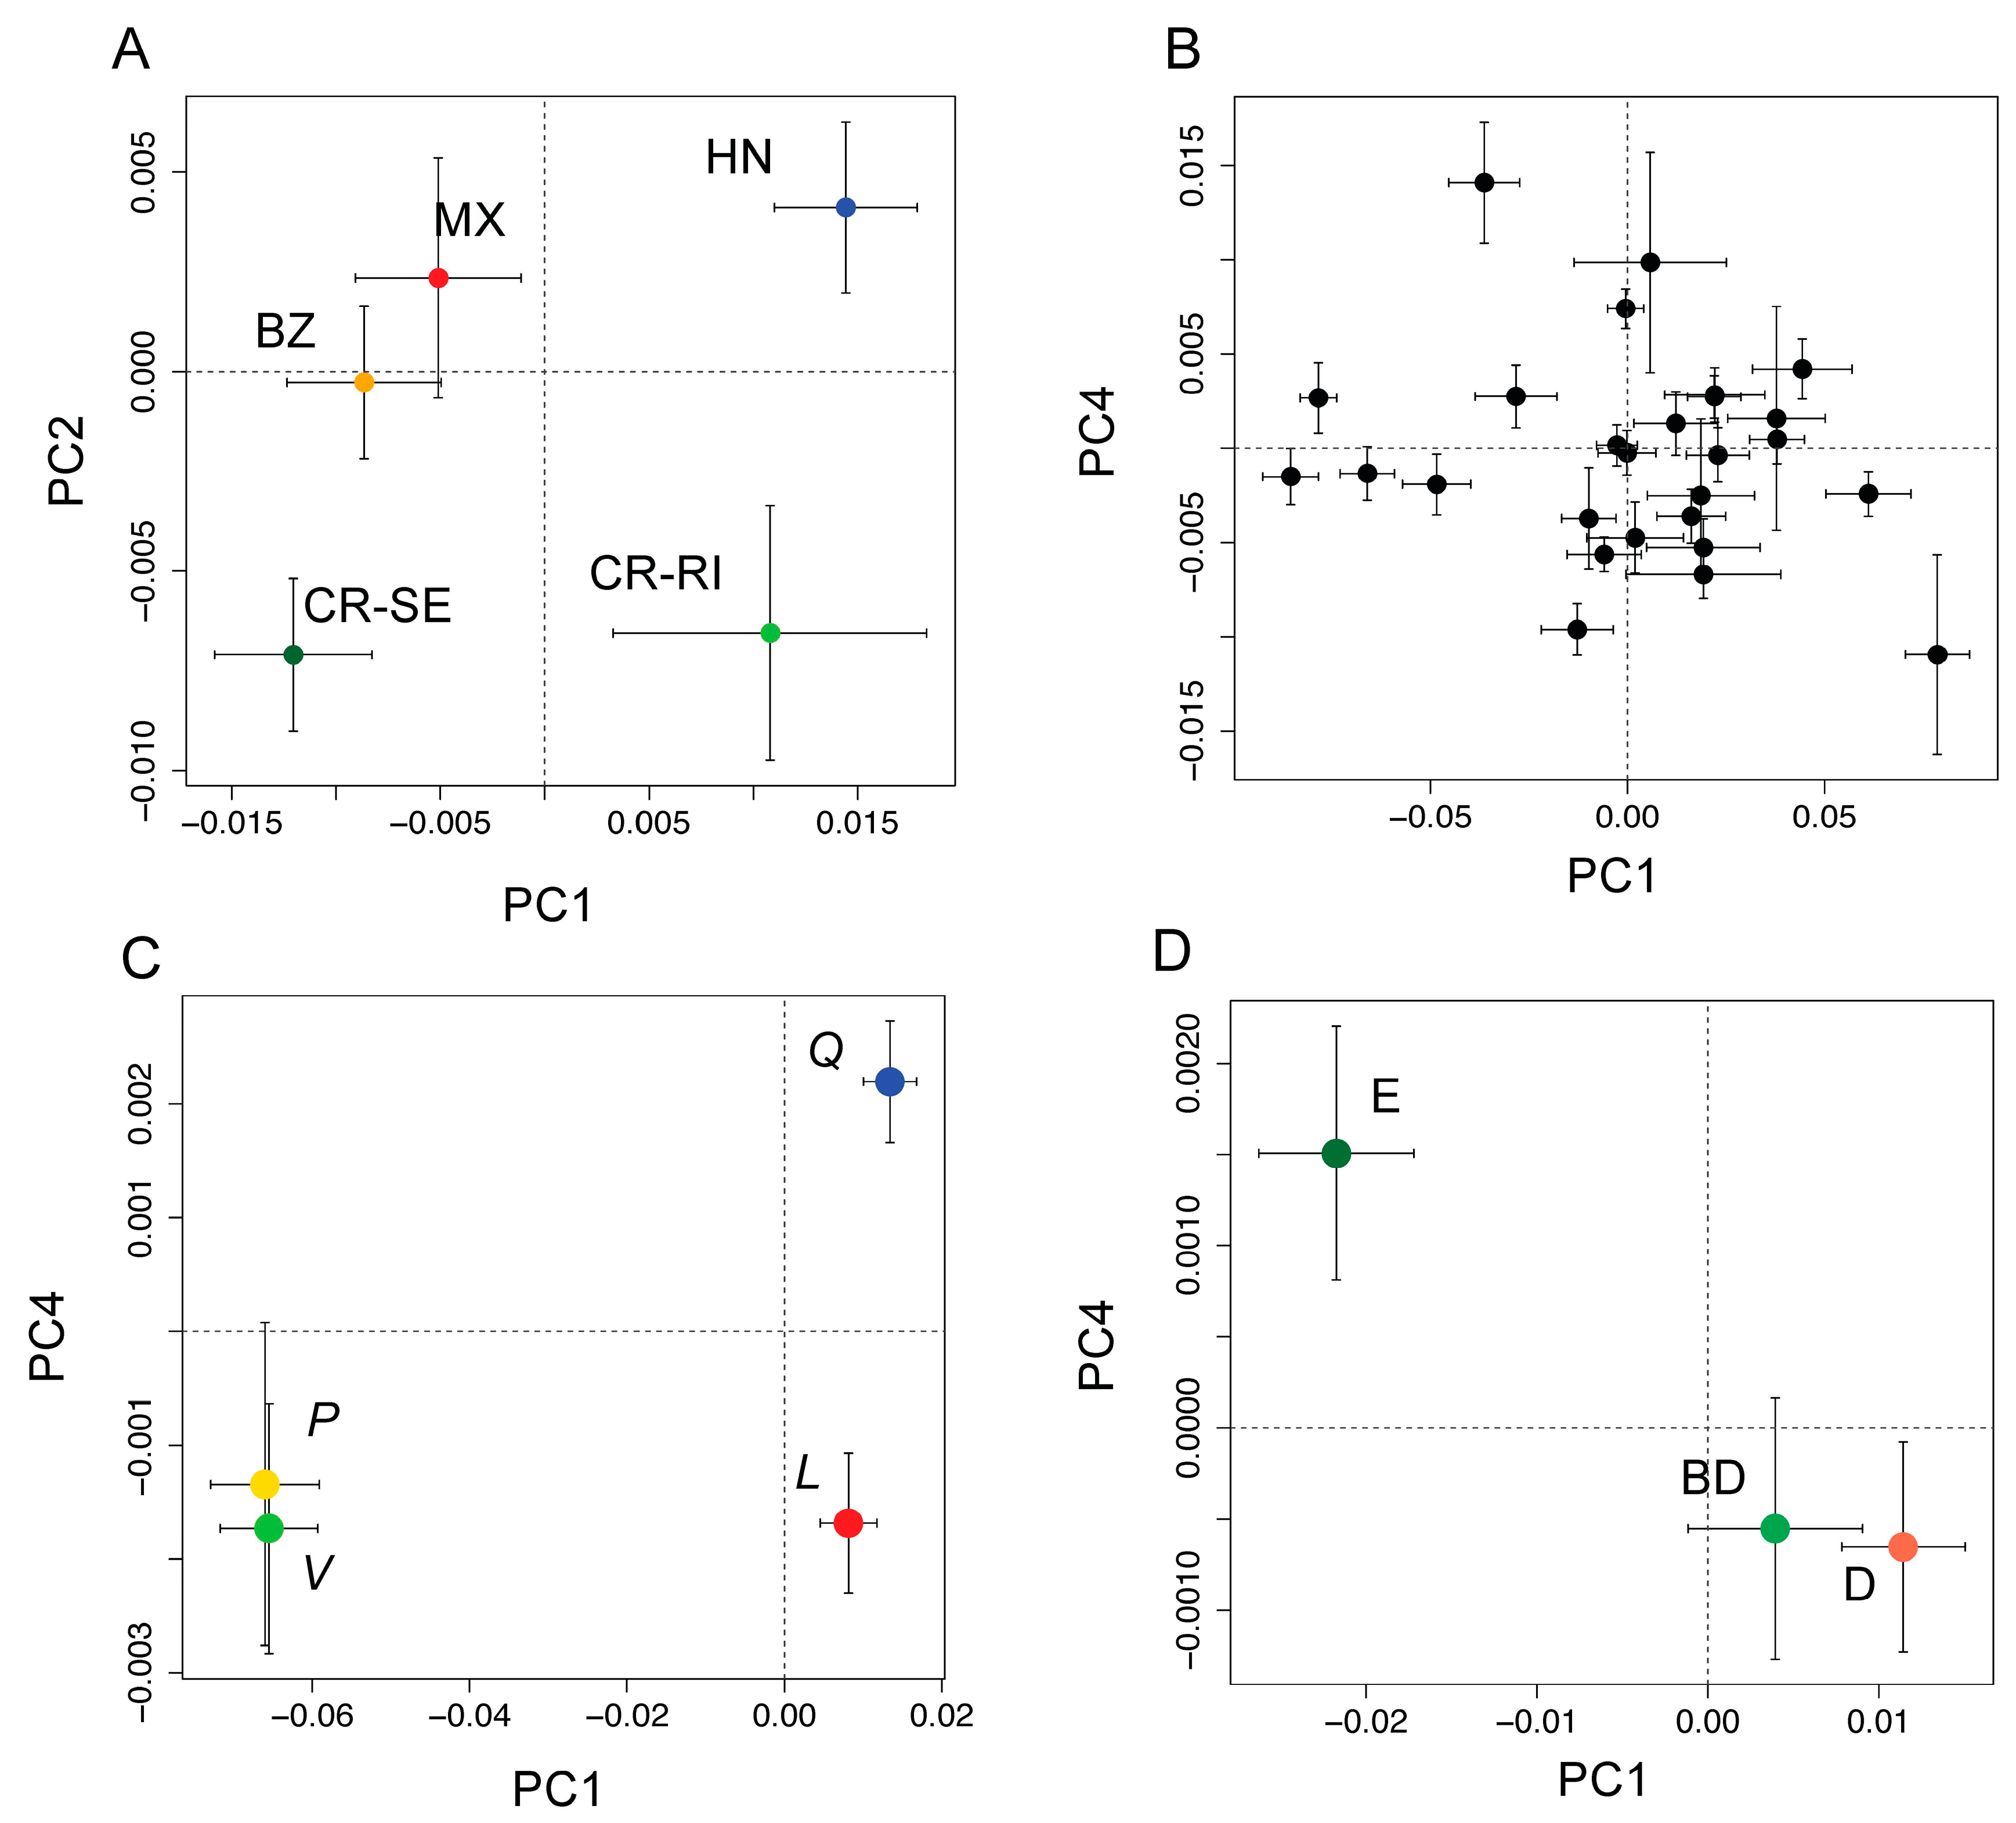
3.1. Detection of Population-Level Variation within a Single Species

In the first experimental system, we show that the four populations of Q. oleoides, which exhibit differentiation based on molecular data (Figure 2A), also demonstrate considerable variation across the major spectral regions (Figure 2B–F). Of the first 20 principal components in the principal coordinates (PCO) analysis using multivariate spectral distance matrices, eight components (1, 2, 3, 5, 7, 13, 14, 19) significantly differentiated populations (Table S1). A bivariate plot of aggregate means per population for PC axes 1 and 2 shows separation between the two Costa Rican populations on the first axis, as well as between the Honduras and Mexico + Belize populations (Figure 3A). The two Costa Rican populations are separated from the other three populations on the second axis, consistent with the differentiation between Costa Rica and the other populations revealed from the neutral genetic markers. There was no clear separation between Belize and Mexico in either the spectral data (Figure 3A) or the genetic data (pie charts in Figure 2A).
The analyses were repeated for the ambient (unwatered) plants growing under more severe water stress. Populations were distinguished with approximately the same level of accuracy (mean Kappa = 0.335, ±0.03 SD for spectra and 0.226 ± 0.029 for traits) for the unwatered plants (Figure S2) as for the watered plants (0.34 ± 0.037 for spectra and 0.226 ± 0.029 for traits; Table 1). We also ran combined analyses with both watered and unwatered plants together. Again, the accuracy for distinguishing the populations was similar, although slightly higher (mean Kappa = 0.4 ± 0.025 SD for spectra and 0.27 ± 0.031 for traits), perhaps due to higher sample size (N = 1055). Interestingly, the two water treatments, themselves, could be predicted with somewhat greater accuracy (mean Kappa = 0.50 ± 0.034 SD for spectra) than the populations (Figure S2). However, the environmental heterogeneity resulting from combining the watering treatments did not reduce accuracy in detecting populations.

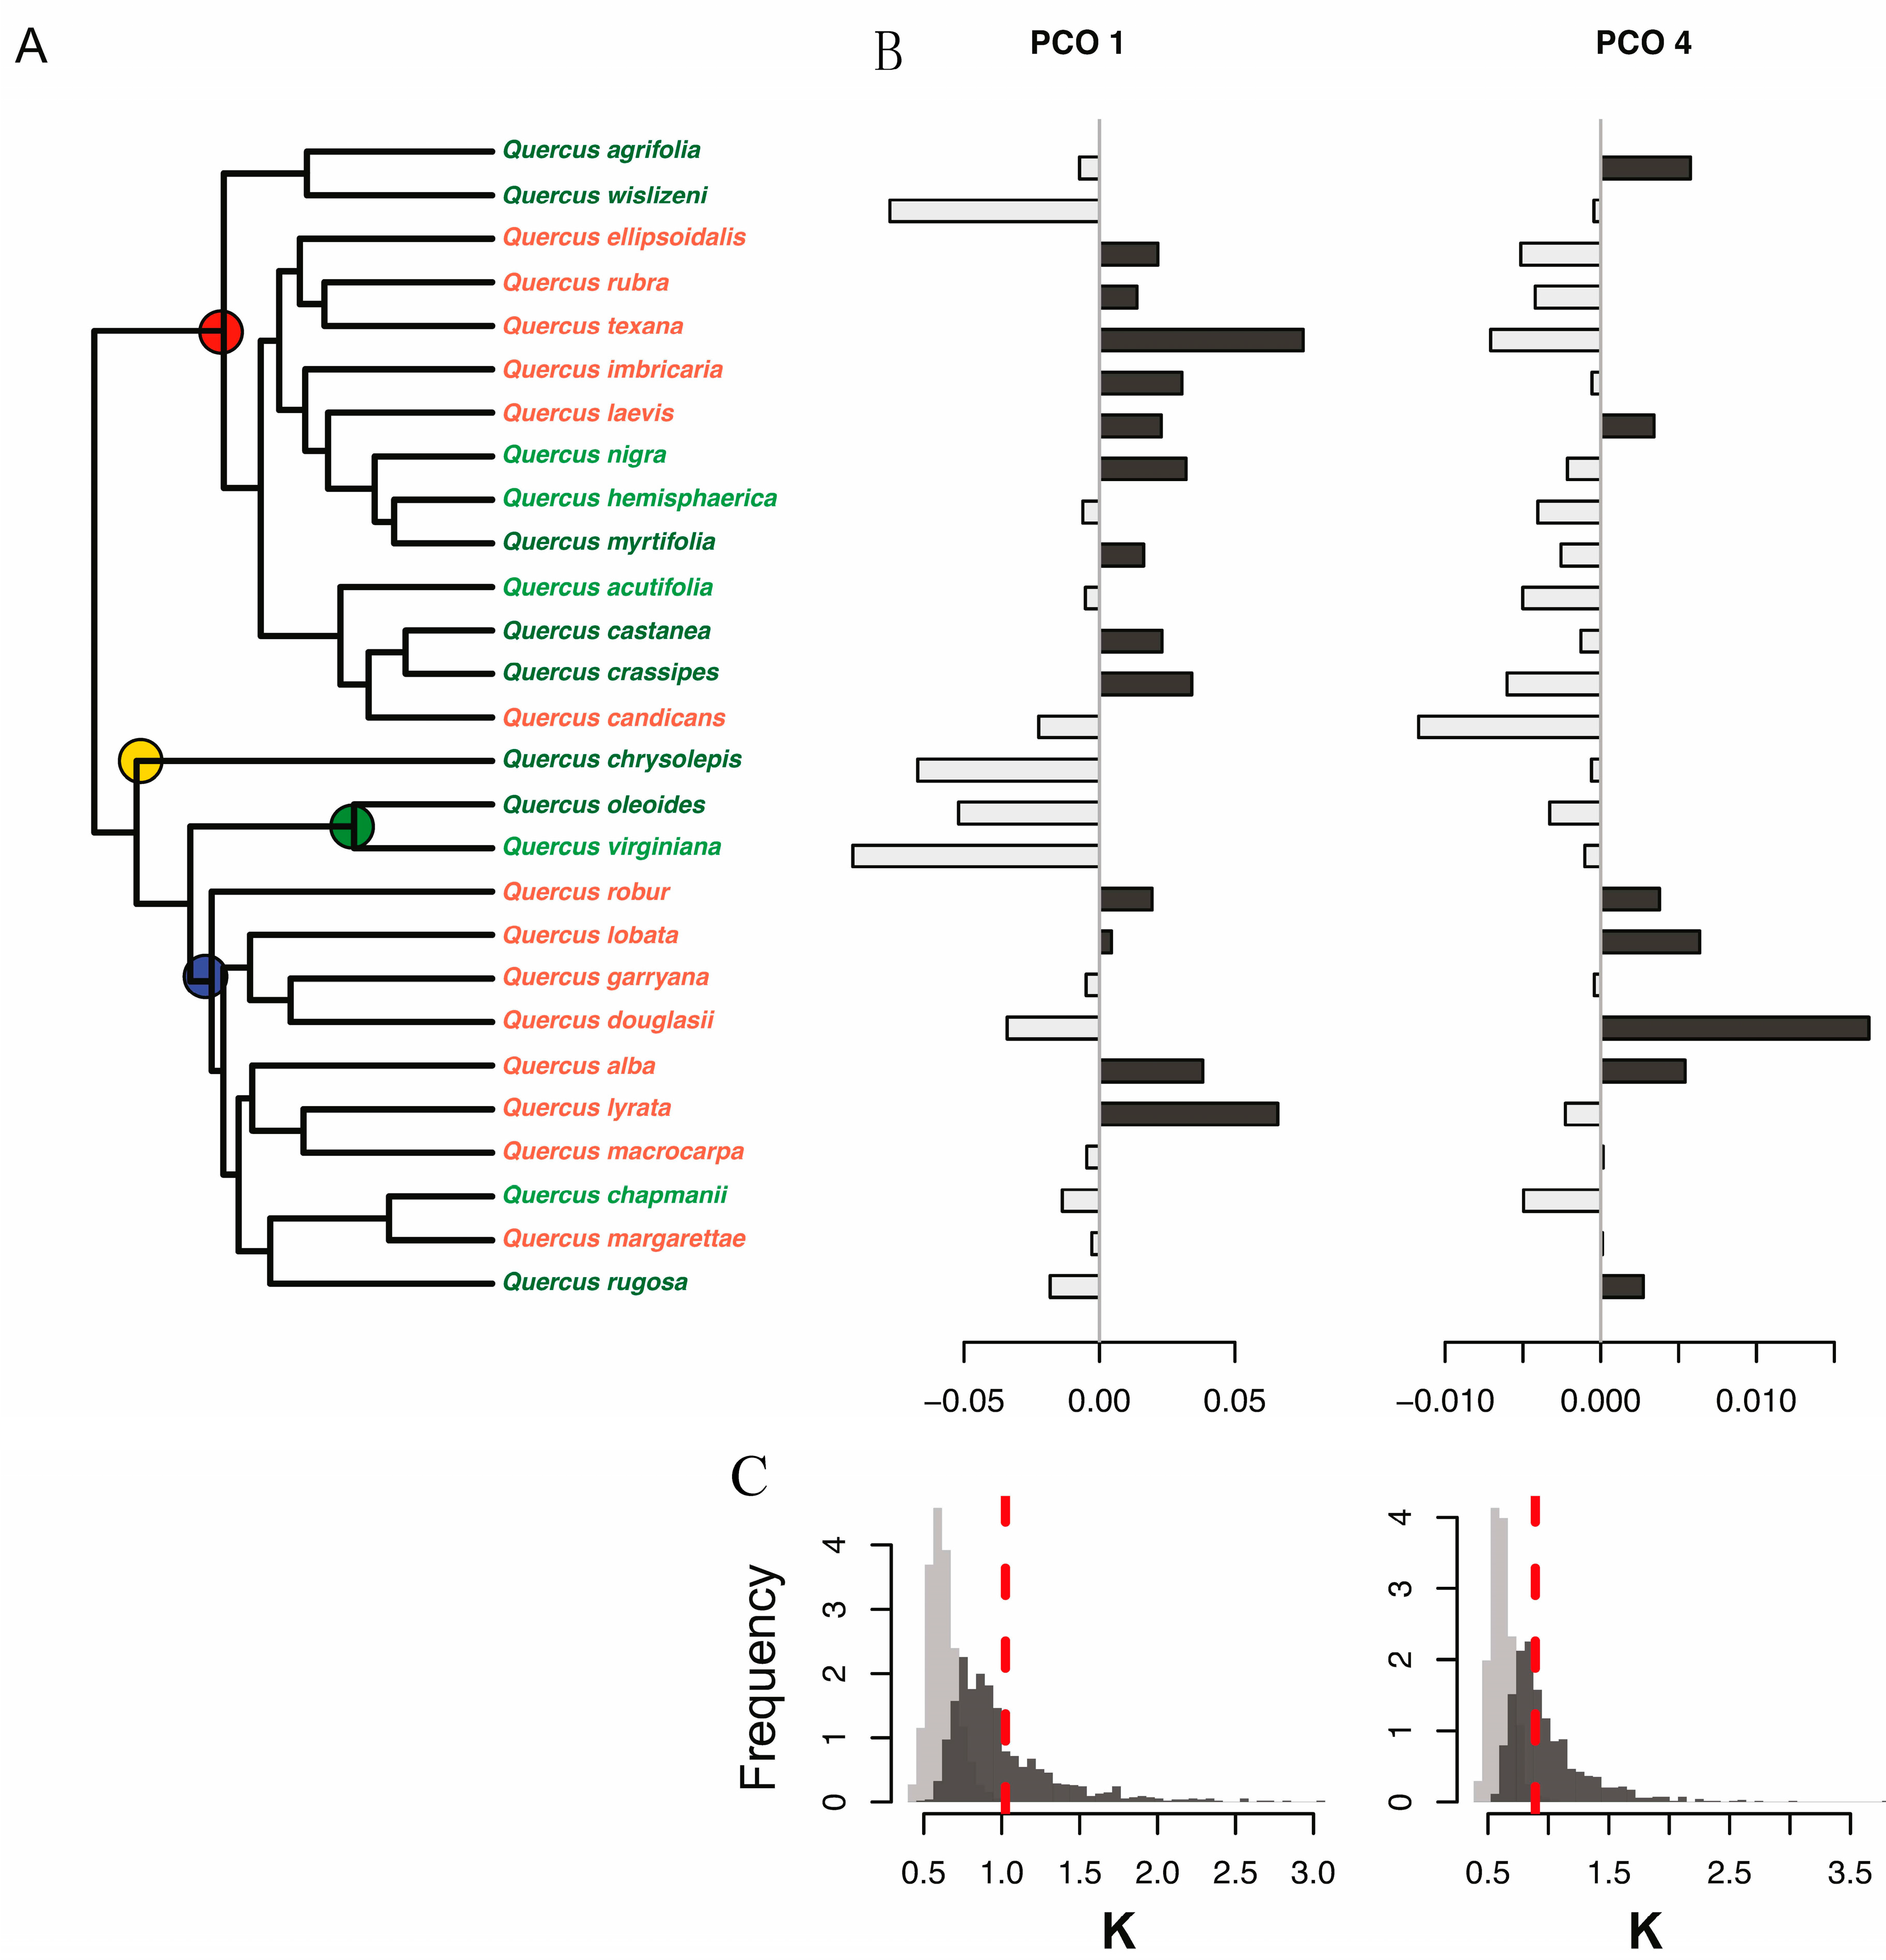
3.2. Detection of Variation among Species at the Phylogenetic Level

At the phylogenetic scale, species were distinguished using spectra with better accuracy (mean Kappa = 0.61, SD = 0.027) than populations. This was true for the well-watered plants (Table 1 and Figure 3, Figure 4 and Figure 5) as well as for the low-water plants (mean Kappa = 0.52, SD = 0.04; Figure S3); combining the treatments again increased accuracy in classifying species (mean Kappa = 0.66, SD = 0.021; S3), perhaps given the higher sample size (N = 510). Of the first 20 spectral principal coordinate scores for species discrimination (well-watered plants, only), four (1, 4, 9, 15) show significant phylogenetic signal (Table S3). Bivariate plots of aggregated species means (±1 SD) for the first and fourth components (Figure 3B), which both have significant K values, show that many but not all species are separated from each other. However, when plotted in relation to the phylogeny (Figure 4A–C), visual inspection reveals reasonably high fidelity to phylogenetic relationships, indicating phylogenetic signal. This is confirmed by the high observed K statistic values relative to null models for the first and fourth principal coordinates of the leaf spectra (Figure 4D,E), indicating that, on average, closely related species tend to have similar spectral profiles. Similarly, five of the traits (or trait indices) inferred from spectra (N, C, fiber, lignin, and NDWI) show strong phylogenetic signal (Table S3) consistent with Brownian motion evolution.

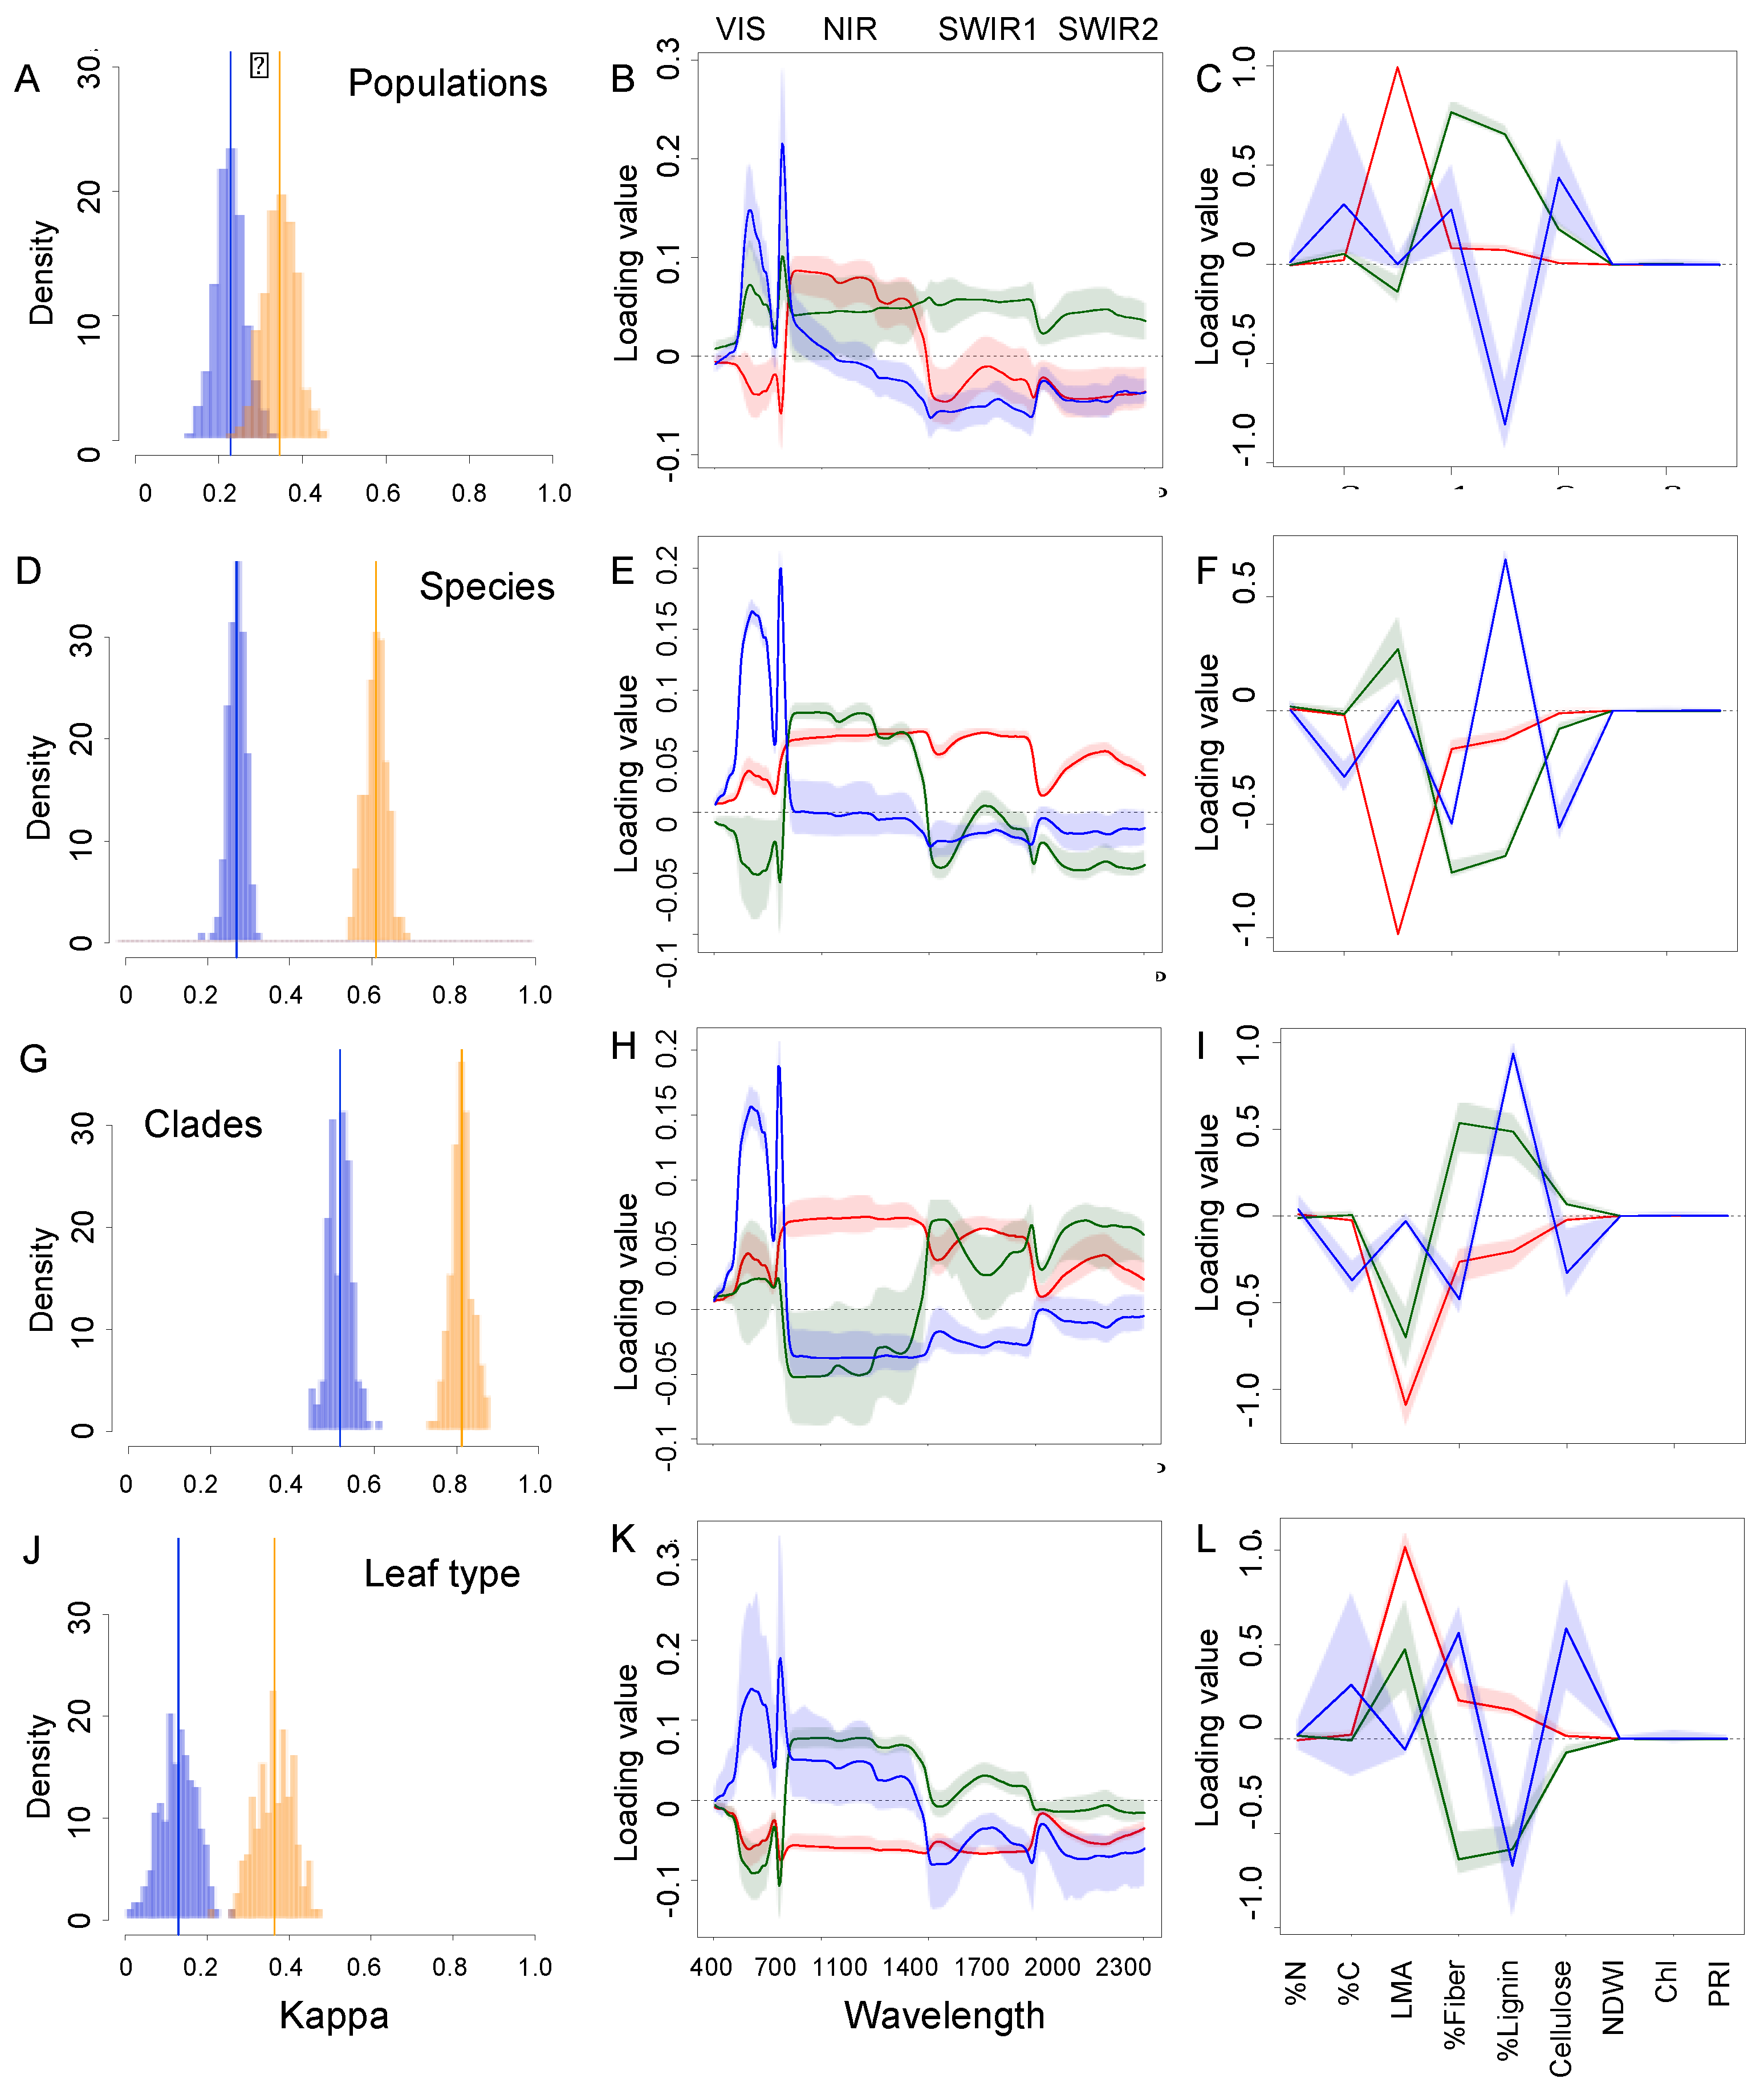
3.3. Comparison of Model Accuracy for Traits and Spectra across the Biological Hierarchy of Diversity

Multivariate PLS-DA models were applied to the full spectral data and to the derived trait data (Figure 5A) to classify individuals to the five populations. Model results show higher kappa scores using the full spectral data (0.342 ± 0.041 SD) compared to predicted trait values (0.225 ± 0.04 SD), indicating that populations were statistically differentiated better using the full spectral profile rather than traits. Likewise, full spectral data also classified species (kappa = 0.61 ± 0.0268), clades (0.813 ± 0.0249) better than trait information (kappa = 0.271 ± 0.021 SD and 0.516 ± 0.028 SD for species and clades, respectively). Leaf type, in which there are only a small number of categories (3), was also better predicted by spectra (kappa = 0.365 ± 0.045 SD) than traits (kappa = 0.13 ± 0.044 SD).
Classification of clades shows higher accuracy (kappa = 0.813 ± 0.024 SD) for the spectral data models than classification of species (kappa = 0.61 ± 0.027), which in turn shows higher classification accuracy than populations (kappa = 0.344 ± 0.042 SD); the same pattern is true for traits (Table 1; Figure 5A,D,G). The same pattern emerged for plants in the drought treatments and when data from drought and watered treatments were combined (Figures S2 and S3). Full spectral data correctly classified oak species with moderate accuracy (kappa = 0.61) while, models based on traits predicted from spectra performed poorly (with kappa = 0.27 (0.021 SD) (Table 1)). However, phylogenetic clades were much more accurately predicted than leaf type using either spectra or traits (Table 1). Classification of clades using full spectra gave the highest accuracy of any of the models, and was more reliable than classifying species or populations (Table 1, Figure 5).

3.4. Most Informative Regions of the Spectra and Traits

Coefficient loading values for each wavelength of the first three PLS components suggest that at any hierarchical level of diversity, the visible, NIR and SWIR regions of the spectrum all contribute to classification models (Figure 5B,E,H,K). Large coefficient loadings different than zero in either the positive or negative direction indicate that a spectral band or trait contributes to classification of taxa. In contrast to spectral regions, not all traits are informative for the first three components. At all diversity levels, the most informative traits are LMA, fiber, lignin, and cellulose. Chlorophyll content, %N and %C, PRI, associated with xanthophyll cycle pigments, and NDWI, associated with water content, show very little contribution (Figure 5C,F,I,L). All regions of the spectrum were also important in classifying leaf type. Again, LMA, fiber, lignin, and cellulose were the most informative traits in classifying leaf type, consistent with the expect associations between these leaf attributes and the degree of deciduousness or evergreenness [13,42].

4. Discussion

In this study, we link high dimensional leaf optical data with phylogenetic and genetic information in experimental conditions where environmental variation and plant size and age are controlled. We show that leaf spectral data show promise for classifying biological taxa at the population level (Figure 2, Figure 3A and Figure 5A), species level (Figure 3B, Figure 4, and Figure 5D) and clade level (Figure 3C and Figure 5G), a critical step in remote sensing of biodiversity.
The PLS-DA approaches used in this study show great potential to distinguish populations, species and clades within a single genus. An important result from this study is that we find much higher accuracy in classifying biological taxa at all hierarchical levels (populations, species and clades) using full-spectrum data than using traits. This is likely because spectra represent a large ensemble of traits given the covariance between physical and chemical properties of leaves and their spectral signatures and thus provide a more complete characterization of leaves than any individual or groups of traits. We also show increasing accuracy in classification with increasing hierarchical levels of biological organization. We find higher accuracy in predicting clades than species (Figure 5; Experiment 2), and classification of species (Figure 5; Experiment 2) shows higher accuracy than classification of populations within species (Figure 5; Experiment 1). These results are consistent with increasing classification accuracy at deeper phylogenetic levels, an expected result based on greater time for divergence among more distantly related taxa (Figure 1). Further research is necessary to understand how well this result can be generalized for other groups and the phylogenetic scales at which the relationship holds. The greater accuracy of classifying clades than other biological units is unlikely to be due to fewer classification categories. When we examine leaf types, an analysis that also includes a small number of categories, we see much lower accuracy. Likewise, populations were less accurately, classified, despite the fact that there were only 5 categories.
Although we focus on only one genus, these results demonstrate the potential contributions of spectroscopy to understanding patterns of biodiversity. An important next step would be to test the extent to which broader clades that originate deeper in the phylogeny can be distinguished spectrally better than narrower clades, species, or populations within species, across the plant tree of life.
To the extent that biological taxa show evolutionary convergence in spectral information given convergence in underlying traits, this increasing classification accuracy deeper in the phylogeny may not hold. For example, evergreen species with thick and long-lived leaves from very different lineages may appear spectrally more similar than more closely related species with contrasting leaf habits and morphology. From the current study, which was conducted within a single genus, it is not possible to assess the phylogenetic level at which spectral information is most informative across a broad range of lineages.
Full-spectrum information provides more power to differentiate taxa than suites of functional traits derived from those spectra. This suggests that there is important classification information in regions of the spectra that are not captured by the relatively small number of traits we used or are not directly linked to functional attributes currently used in this study. This reasoning is supported by the indication that nearly all spectral regions are informative at every biological level (Figure 5). We were only able to derive a small subset of traits from the spectra; yet spectral variation is almost certainly related to additional traits for which calibration equations do not yet exist. We compared predictions based on nine known traits versus predictions from 2001 reflectance “traits”. This difference in available information points to the power of spectra, but also to our lack of comprehensive knowledge of all the factors (“traits”) that cause the variation in spectra. It may also be that functional traits are more convergent than many of the structural or other components of leaves that contribute to the full spectra. In a separate study, a suite of functional traits including gas exchange (maximum photosynthesis and stomatal conductance rates), photochemical efficiency (Fv/Fm), non-photochemical quenching, and specific leaf area did not differ among populations [56]. That full-spectrum information is capable of differentiating these populations makes spectral data relevant to high throughput genotyping approaches.
Spectra showed consistent accuracy in classifying taxa in both watered and drought conditions (Figures S2 and S3). Combining individuals from different treatments did not decrease accuracy but actually increased it, probably as a consequence of higher sample sizes. This result was consistent across both experiments, indicating that genetically-based phenotypic differences among populations, species and clades can be differentiated even when environmental heterogeneity is present.
Ultimately, spectral variation among taxa is generated from phenotypic variation and does not directly measure the underlying genetic or phylogenetic relationships among species. However, spectra represent an aggregated measure of all phenotypic components that influence leaf spectral profiles. Spectral data thus represent a measure of the integrated phenotype of a leaf or of an organism and these data suggest harnessing full-spectrum information to detect taxonomic variation may inform our capacity to detect changes in biodiversity. Spectra may represent a more powerful approach than direct measurements of leaf-level traits (i.e., by destructive sampling and/or chemistry) simply because spectra contain such rich information about leaves and the large range of factors that affect their reflectance. That said, while using full spectra provides more power to distinguish taxa, combining this classification approach with trait information may allow for a deeper understanding of how taxa differ functionally.

Caveats and Limits

We focused on leaf spectra collected in experimental conditions that minimized environmental and ontogenetic variation. Remote sensing of natural systems from air- or spacecraft poses significant challenges. For instance, if it is necessary to sense biological taxa at the scale of individual plants, then spatial resolution becomes a critical consideration. Imaging methods are sensitive to canopy structure, which is not problematic when canopy structure reveals taxonomic differences, but can be problematic in cases where structural variation obscures spectral variation that is detectable at the leaf level [57]. However, leaf level variation in functional attributes has shown to be detectable remotely and distinguishable from canopy structure [17,58,59]. Environmental variation and ontogenetic changes in plants present additional complications for extending classifications to air- or spaceborne platforms. Biological taxa occurring in natural systems vary in size and life stage, and show differential expression of phenotypes based on the environment. However, spectral variation due to environment or phenology may itself be diagnostic of taxonomic differences and thus be informative. In effect, this would greatly increase the dimensionality of the data available, since it might incorporate spectral variation by developmental stage, climate/weather and so forth.
Our analyses also point to the need for continued development of qualitative methods to integrate multiple high-dimensional data sets. We reduced the dimensionality of spectral data using PCO prior to our analyses of phylogenetic signal. Although there are precedents to this approach [60,61], theoretical and simulation studies show that the evolutionary analysis of principal components can yield biased results under some conditions [62]. Unfortunately, no current phylogenetic models can efficiently analyze high-dimensional datasets such as spectral data despite recent methodological advances [63], pointing to an important future research direction.

5. Conclusions

The challenge of monitoring dynamic changes in the Earth’s biodiversity during a time of rapid global environmental change is one that cannot be addressed using traditional ground-based methods alone. Regions of the planet where habitat loss is most accelerated and diversity is highest may not be accessible in vivo or feasible to assess on an ongoing basis. Our work shows that optical data, particularly high-spectral resolution observations, provide important information relevant not only for characterizing plant functional attributes, but also for gleaning phylogenetic and genetic information, all of which can be harnessed for monitoring global changes in biodiversity. Despite the challenges of shifting from leaf-level spectroscopy to remote sensing of the biota using imaging spectroscopy, we show that high spectral resolution spectroscopic methods hold promise for contributing to a dynamic global biodiversity observatory (sensu [5]) for continuous monitoring of the diversity in the Earth’s flora.

Supplementary Materials

The following are available online at www.mdpi.com/2072-4292/8/3/221, Table S1. Analysis of variance for the Quercus oleoides experiment. Populations are treated as the main factor with each spectral PLS component as a response variable. F ratios indicate the variation in component scores among populations relative to variation within populations. Components are shown in bold if P values are less than 0.05, indicating a significant population effect; Table S2. Phylogenetic signal as given by Blomberg’s K of components of the PCO analysis. Observed values of Blomberg’s K are given relative to the mean and SD of the null model, computed using a tip shuffling algorithm. P values less than 0.05, shown in bold, indicate that the observed K value is significantly higher than expected by chance, such that the component shows significant phylogenetic signal. K values around 1 are consistent with a Brownian motion (BM) model of evolution, and the expected mean of the BM simulation is always 1.0. The SD of the expected K value with Brownian motion simulation is also shown for each component; Table S3. Phylogenetic signal as given by Blomberg’s K of traits predicted from spectral data. Headers are the same as in Table S2; Table S4. Analysis of variance for leaf type. Leaf type is treated as the main factor with each spectral PLS component as a response variable. F ratios indicate the variation in component scores among populations relative to variation within populations. Components are shown in bold if P values are less than 0.05, indicating a significant population effect; Figure S1. Kappa scores for PLS-DA model fit as a function of the number of components included in the validation model using full spectral data or traits for (A) population classification within Quercus oleoides; (B) oak species classification; (C) oak clade classification; and (D) leaf type classification. Shown are mean and ±2SD of the kappa values for 300 model jackknife iterations (Leave group out cross validation, LGOCV) for each number of components.

Acknowledgments

We thank Susan Ustin for the invitation to submit the manuscript; John McVay, Andrew Hipp, Paul Manos and Antonio Gonzalez-Rodriguez for use of unpublished phylogenetic information on an ongoing collaborative project on the Oaks of the Americas. The project was funded by the National Science Foundation IOS 0843665, DEB 1146380 (Jeannine Cavender-Bares) and DEB 1342872 (Jeannine Cavender-Bares and Philip A. Townsend), co-funded by the National Aeronautic and Space Agency (NASA) through the Dimensions of Biodiversity program and from the HyspIRI program grant NNX12AQ28G (Philip A. Townsend). We thank Timothy Longwell for managing Experiment 1 in an early phase of the project.

Author Contributions

J.C.-B. conceived of and led the project and wrote the manuscript with help from P.A.T., J.J.C. and J.E.M. J.E.M. analyzed the data and created the figures with help from J.C.-B., J.J.C. and A.S. S.P.S. helped with data processing and calculation of trait values. P.A.T. managed the spectral data collection and helped write the manuscript. C.C.K. collected the data in Experiment 1 with help from E.Z. and J.C.-B. J.J.C. collected the data in Experiment 2, with help from M.A.K., and provided trait values. M.A.K. established and managed Experiment 2. A.C. helped establish Experiment 1. G.P. contributed to the establishment and management of Experiment 1 in Honduras with J.C.-B., A.C., and E.Z.

Conflicts of Interest

The authors declare no conflict of interest.

References

  1. Cavender-Bares, J.; Heffernan, J.; King, E.; Polasky, S.; Balvanera, P.; Clark, W.C. Sustainability and biodiversity. In Encyclopedia of Biodiversity, 2nd ed.; Levin, S.E., Ed.; Academic Press: Amsterdam, The Netherlands, 2013; pp. 71–84. [Google Scholar]
  2. Díaz, S.; Demissew, S.; Carabias, J.; Joly, C.; Lonsdale, M.; Ash, N.; Larigauderie, A.; Adhikari, J.R.; Arico, S.; Báldi, A.; Bartuska, A.; et al. The IPBES conceptual framework—Connecting nature and people. Curr. Opin. Environ. Sustain. 2015, 14, 1–16. [Google Scholar] [CrossRef] [Green Version]
  3. Balvanera, P.; Pfisterer, A.B.; Buchmann, N.; He, J.-S.; Nakashizuka, T.; Raffaelli, D.; Schmid, B. Quantifying the evidence for biodiversity effects on ecosystem functioning and services. Ecol. Lett. 2006, 9, 1146–1156. [Google Scholar] [CrossRef] [PubMed] [Green Version]
  4. Cavender-Bares, J.; Balvanera, P.; King, E.; Polasky, S. Ecosystem service trade-offs across global contexts and scales. Ecol. Soc. 2015, 20, 22. [Google Scholar] [CrossRef]
  5. Jetz, W.; Cavender-Bares, J.; Pavlick, R.; Schimel, D.; Davis, F.W.; Asner, G.P.; Guralnick, R.; Kattge, J.; Latimer, A.M.; Moorcroft, P.; Schaepman, M.E.; et al. Monitoring plant functional diversity from space. Nat. Plants 2016, 2. [Google Scholar] [CrossRef]
  6. Turner, W. Sensing biodiversity. Science 2014, 346, 301–302. [Google Scholar] [CrossRef] [PubMed]
  7. Skidmore, A.K.; Pettorelli, N.; Coops, N.C.; Geller, G.N.; Hansen, M.; Lucas, R.; Mücher, C.A.; O’Connor, B.; Paganini, M.; Pereira, H.M.; et al. Environmental science: Agree on biodiversity metrics to track from space. Nature 2015, 523, 403–405. [Google Scholar] [CrossRef] [PubMed]
  8. Schimel, D.; Pavlick, R.; Fisher, J.B.; Asnor, G.; Saatchi, S.; Townsend, P.; Miller, C.; Frankenberg, C.; Hibbard, K.; Cox, P. Observing terrestrial ecosystems and the carbon cycle from space. Glob. Chang. Biol. 2015, 21, 1762–1776. [Google Scholar] [CrossRef] [PubMed]
  9. National Research Council. Earth Science and Applications from Space: National Imperatives for the Next Decade and Beyond; The National Academies Press: Washington, DC, USA, 2007. [Google Scholar]
  10. Reich, P.B.; Wright, I.J.; Cavender-Bares, J.; Craine, J.M.; Oleksyn, J.; Westoby, M.; Walters, M.B. The evolution of plant functional variation: Traits, spectra, and strategies. Int. J. Plant Sci. 2003, 164, S143–S164. [Google Scholar] [CrossRef]
  11. Reich, P.B. The world-wide “fast–slow” plant economics spectrum: A traits manifesto. J. Ecol. 2014, 102, 275–301. [Google Scholar] [CrossRef]
  12. Wright, I.J.; Reich, P.B.; Westoby, M.; Ackerly, D.D.; Baruch, Z.; Bongers, F.; Cavender-Bares, J.; Chapin, T.; Cornelissen, J.H.C.; Diemer, M.; et al. The worldwide leaf economics spectrum. Nature 2004, 428, 821–827. [Google Scholar] [CrossRef] [PubMed]
  13. Cavender-Bares, J.; Kitajima, K.; Bazzaz, F.A. Multiple trait associations in relation to habitat differentiation among 17 Floridian oak species. Ecol. Monogr. 2004, 74, 635–662. [Google Scholar] [CrossRef]
  14. Asner, G.P.; Martin, R.E.; Carranza-Jimenez, L.; Sinca, F.; Tupayachi, R.; Anderson, C.B.; Martinez, P. Functional and biological diversity of foliar spectra in tree canopies throughout the Andes to Amazon region. New Phytol. 2014, 204, 127–139. [Google Scholar] [CrossRef] [PubMed]
  15. Gamon, J.; Surfus, J. Assessing leaf pigment content and activity with a reflectometer. New Phytol. 1999, 143, 105–117. [Google Scholar] [CrossRef]
  16. Couture, J.; Serbin, S.; Townsend, P. Spectroscopic sensitivity of real-time, rapidly induced phytochemical change in response to damage. New Phytol. 2013, 198, 311–319. [Google Scholar] [CrossRef] [PubMed]
  17. Townsend, P.; Serbin, S.; Kruger, E.; Gamon, J. Disentangling the contribution of biological and physical properties of leaves and canopies in imaging spectroscopy data. Proc. Natl. Acad. Sci. USA 2013, 110, E1074–E1074. [Google Scholar] [CrossRef] [PubMed]
  18. Serbin, S.P.; Singh, A.; McNeil, B.E.; Kingdon, C.C.; Townsend, P.A. Spectroscopic determination of leaf morphological and biochemical traits for northern temperate and boreal tree species. Ecol. Appl. 2014, 7, 1651–1669. [Google Scholar] [CrossRef]
  19. Ustin, S.L.; Gitelson, A.A.; Jacquemoud, S.; Schaepman, M.E.; Asner, G.P.; Gamon, J.A.; Zarco-Tejada, P. Retrieval of foliar information about plant pigment systems from high resolution spectroscopy. Remote Sens. Environ. 2009, 113, S67–S77. [Google Scholar] [CrossRef] [Green Version]
  20. Singh, A.; Serbin, S.P.; McNeil, B.E.; Kingdon, C.C.; Townsend, P.A. Imaging spectroscopy algorithms for mapping canopy foliar chemical and morphological traits and their uncertainties. Ecol. Appl. 2015. [Google Scholar] [CrossRef]
  21. Asner, G.P.; Martin, R.E. Airborne spectranomics: Mapping canopy chemical and taxonomic diversity in tropical forests. Front. Ecol. Environ. 2009, 7. [Google Scholar] [CrossRef]
  22. Asner, G.P.; Martin, R.E.; Tupayachi, R.; Anderson, C.B.; Sinca, F.; Carranza-Jiménez, L.; Martinez, P. Amazonian functional diversity from forest canopy chemical assembly. Proc. Natl. Acad. Sci. USA 2014, 11, 5604–5609. [Google Scholar] [CrossRef] [PubMed]
  23. Féret, J.B.; Asner, G.P. Microtopographic controls on lowland Amazonian canopy diversity from imaging spectroscopy. Ecol. Appl. 2014, 24, 1297–1310. [Google Scholar] [CrossRef]
  24. Féret, J.B.; Asner, G.P. Mapping tropical forest canopy diversity using high-fidelity imaging spectroscopy. Ecol. Appl. 2014, 24, 1289–1296. [Google Scholar] [CrossRef]
  25. White, J.C.; Gómez, C.; Wulder, M.A.; Coops, N.C. Characterizing temperate forest structural and spectral diversity with Hyperion EO-1 data. Remote Sens. Environ. 2010, 114, 1576–1589. [Google Scholar] [CrossRef]
  26. Hulshof, C.M.; Swenson, N.G. Variation in leaf functional trait values within and across individuals and species: An example from a Costa Rican dry forest. Funct. Ecol. 2010, 24, 217–223. [Google Scholar] [CrossRef]
  27. Koehler, K.; Center, A.; Cavender-Bares, J. Evidence for a freezing tolerance—Growth rate trade-off in the live oaks (Quercus series Virentes) across the tropical-temperate divide. New Phytol. 2012, 193, 730–744. [Google Scholar] [CrossRef] [PubMed]
  28. Silvertown, J.; Dodd, M.; Gowing, D.; Lawson, C.; McConway, K. Phylogeny and the hierarchical organization of plant diversity. Ecology 2006, 87, S39–S49. [Google Scholar] [CrossRef]
  29. Donoghue, M.J. A phylogenetic perspective on the distribution of plant diversity. Proc. Natl. Acad. Sci. USA 2008, 105 (Suppl. 1), 11549–11555. [Google Scholar] [CrossRef] [PubMed]
  30. Wiens, J.J.; Ackerly, D.D.; Allen, A.P.; Anacker, B.L.; Buckley, L.B.; Cornell, H.V.; Damschen, E.I.; Davies, T.J.; Grytnes, J.-A.; Harrison, S.P.; et al. Niche conservatism as an emerging principle in ecology and conservation biology. Ecol. Lett. 2010, 13, 1310–1324. [Google Scholar] [CrossRef] [PubMed]
  31. Butler, M.; King, A.A. Phylogenetic comparative analysis: A modeling approach for adaptive evolution. Am. Nat. 2004, 164, 683–695. [Google Scholar] [CrossRef]
  32. Ackerly, D.D. Evolution, origin and age of lineages in the Californian and Mediterranean floras. J. Biogeogr. 2009, 36, 1221–1233. [Google Scholar] [CrossRef]
  33. Cavender-Bares, J.; Ackerly, D.D.; Baum, D.A.; Bazzaz, F.A. Phylogenetic overdispersion in Floridian oak communities. Am. Nat. 2004, 163, 823–43. [Google Scholar] [CrossRef] [PubMed]
  34. Zanne, A.E.; Tank, D.C.; Cornwell, W.K.; Eastman, J.M.; Smith, S.A.; FitzJohn, R.G.; McGlinn, D.J.; O’Meara, B.C.; Moles, A.T.; Reich, P.B.; et al. Three keys to the radiation of angiosperms into freezing environments. Nature 2014, 506, 89–92. [Google Scholar] [CrossRef] [PubMed]
  35. Cavender-Bares, J.; Gonzalez-Rodriguez, A.; Pahlich, A.; Koehler, K.; Deacon, N. Phylogeography and climatic niche evolution in live oaks (Quercus series Virentes) from the tropics to the temperate zone. J. Biogeogr. 2011, 38, 962–981. [Google Scholar] [CrossRef]
  36. Cavender-Bares, J.; Gonzalez-Rodriguez, A.; Eaton, D.A.R.; Hipp, A.A.L.; Beulke, A.; Manos, P.S. Phylogeny and biogeography of the American live oaks (Quercus subsection Virentes): A genomic and population genetics approach. Mol. Ecol. 2015, 24, 3668–3687. [Google Scholar] [CrossRef] [PubMed]
  37. Klemens, J.A.; Deacon, N.J.; Cavender-Bares, J. Pasture recolonization by a tropical oak and the regeneration ecology of seasonally dry tropical forests. In Seasonally Dry Tropical Forests; Island Press/Center for Resource Economics: Washington, DC, USA, 2011; pp. 221–237. [Google Scholar]
  38. Serbin, S. Spectroscopic Determination of Leaf Nutritional, Morphological, and Metabolic Traits. Ph.D. Thesis, The University of Wisconsin, Madison, WI, USA, 2012. [Google Scholar]
  39. Gao, B. NDWI–a normalized difference water index for remote sensing of vegetation liquid water from space. Remote Sens. Environ. 1996, 58, 257–266. [Google Scholar] [CrossRef]
  40. Gitelson, A.A.; Merzlyak, M.N. Spectral reflectance changes associate with autumn senescence of Aesculus hippocastanum L. and Acer platanoides L. leaves. Spectral features and relation to chlorophyll estimation. J. Plant Physiol. 1994, 143, 286–292. [Google Scholar] [CrossRef]
  41. Gamon, J.A.; Penuelas, J.; Field, C.B. A narrow-waveband spectral index that tracks diurnal changes in photosynthetic efficiency. Remote Sens. Environ. 1992, 41, 35–44. [Google Scholar] [CrossRef]
  42. Cavender-Bares, J.; Cortes, P.; Rambal, S.; Joffre, R.; Miles, B.; Rocheteau, A. Summer and winter sensitivity of leaves and xylem to minimum freezing temperatures: a comparison of cooccurring Mediterranean oaks that differ in leaf lifespan. New Phytol. 2005, 168, 597–612. [Google Scholar] [CrossRef] [PubMed]
  43. Cavender-Bares, J.; Holbrook, N.M. Hydraulic properties and freezing-induced cavitation in sympatric evergreen and deciduous oaks with, contrasting habitats. Plant Cell Environ. 2001, 24, 1243–1256. [Google Scholar] [CrossRef]
  44. Hipp, A.L.; Eaton, D.A.; Cavender-Bares, J.; Fitzek, E.; Nipper, R.; Manos, P.S. A framework phylogeny of the american oak clade based on sequenced RAD data. PLoS ONE 2014, 9, e93975. [Google Scholar]
  45. Aldrich, P.R.; Cavender-Bares, J. Quercus. In Wild Crop Relatives: Genomic and Breeding Resources; Springer: Berlin, Germany, 2011; pp. 89–129. [Google Scholar]
  46. Manos, P.S.; Zhou, Z.K.; Cannon, C.H. Systematics of fagaceae: Phylogenetic tests of reproductive trait evolution. Int. J. Plant Sci. 2001, 162, 1361–1379. [Google Scholar] [CrossRef]
  47. Dixon, P. VEGAN, a package of R functions for community ecology. J. Veg. Sci. 2003, 14, 927–930. [Google Scholar] [CrossRef]
  48. Blomberg, S.P.; Garland, T.; Ives, A.R. Testing for phylogenetic signal in comparative data: Behavioral traits are more labile. Evolution 2003, 57, 717–745. [Google Scholar] [CrossRef] [PubMed]
  49. Revell, L.J. Phytools: An R package for phylogenetic comparative biology (and other things). Methods Ecol. Evol. 2012, 3, 217–223. [Google Scholar] [CrossRef]
  50. Chevallier, S.; Bertrand, D.; Kohler, A.; Courcoux, P. Application of PLS-DA in multivariate image analysis. J. Chemom. 2006, 20, 221–229. [Google Scholar] [CrossRef]
  51. Castillo, R.; Otto, M.; Freer, J.; Valenzuela, S. Multivariate strategies for classification of Eucalyptus globulus genotypes using carbohydrates content and NIR spectra for evaluation of their cold resistance. J. Chemom. 2008, 22, 268–280. [Google Scholar] [CrossRef]
  52. Williams, P.; Geladi, P.; Britz, T.; Manley, M. Near-infrared (NIR) hyperspectral imaging and multivariate image analysis to study growth characteristics and differences between species and strains of members of the genus Fusarium. Anal. Bioanal. Chem. 2012, 404, 1759–1769. [Google Scholar] [CrossRef] [PubMed]
  53. Madritch, M.D.; Kingdon, C.C.; Singh, A.; Mock, K.E.; Lindroth, R.L.; Townsend, P.A. Imaging spectroscopy links aspen genotype with below-ground processes at landscape scales. Philos. Trans. R. S. Lond. B Biol. Sci. 2014, 369, 20130194. [Google Scholar] [CrossRef] [PubMed]
  54. Wiklund, S.; Johansson, E.; Sjoestroem, L.; Mellerowicz, E.J.; Edlund, U.; Shockcor, J.P.; Gottfries, J.; Moritz, T.; Trygg, J. Visualization of GC/TOF-MS-based metabolomics data for identification of biochemically interesting compounds using OPLS class models. Anal. Chem. 2008, 80, 115–122. [Google Scholar] [CrossRef] [PubMed]
  55. Gavaghan, C.L.; Wilson, I.D.; Nicholson, J.K. Physiological variation in metabolic phenotyping and functional genomic studies: use of orthogonal signal correction and PLS-DA. FEBS Lett. 2002, 530, 191–196. [Google Scholar] [CrossRef]
  56. Center, A. Physiological and fitness consequences of seasonal rainfall variation in neotropical live oak seedlings (Quercus oleoides): implications for global change. In Department of Plant Biology; University of Minnesota: Minneapolis, MN, USA, 2015; p. 116. [Google Scholar]
  57. Knyazikhin, Y.; Schull, M.A.; Stenberg, P.; Mõttus, M.; Rautiainen, M.; Yang, Y.; Marshak, A.; Carmona, P.L.; Kaufmann, R.K.; Lewis, P.; et al. Hyperspectral remote sensing of foliar nitrogen content. Proc. Natl. Acad. Sci. USA 2013, 110, E185–E192. [Google Scholar] [CrossRef] [PubMed]
  58. Ustin, S.L.; Gamon, J.A. Remote sensing of plant functional types. New Phytol. 2010, 186, 795–816. [Google Scholar] [CrossRef] [PubMed]
  59. Baret, F. Use of reflectance spectral variation to retrieve canopy biophysical characteristics. In Advances in Environmental Remote Sensing; Danson, F., Plummer, S., Eds.; John Wiley: Chichester, UK, 1994; pp. 33–51. [Google Scholar]
  60. Harmon, L.J.; Losos, J.B.; Jonathan Davies, T.; Gillespie, R.G.; Gittleman, J.L.; Bryan Jennings, W.; Kozak, K.H.; McPeek, M.A.; Moreno-Roark, F.; Near, T.J.; et al. Early bursts of body size and shape evolution are rare in comparative data. Evolution 2010, 64, 2385–2396. [Google Scholar] [CrossRef] [PubMed]
  61. Kozak, K.H.; Wiens, J.J. Accelerated rates of climatic-niche evolution underlie rapid species diversification. Ecol. Lett. 2010, 13, 1378–1389. [Google Scholar] [CrossRef] [PubMed]
  62. Uyeda, J.C.; Caetano, D.S.; Pennell, M.W. Comparative analysis of principal components can be misleading. Syst. Biol. 2015, 64, 677–689. [Google Scholar] [CrossRef] [PubMed]
  63. Cybis, G.B.; Sinsheimer, J.S.; Bedford, T.; Mather, A.E.; Lemey, P.; Suchard, M.A. Assessing phenotypic correlation through the multivariate phylogenetic latent liability model. Ann. Appl. Stat. 2015, 9, 969–991. [Google Scholar] [CrossRef]
Figure 1. (A) Hierarchical structure of biological diversity. Individuals (green) are nested within populations (red), which are nested within species (blue), which, in turn, are nested within increasingly inclusive clades (purple). The phylogenetic representation of diversity is shown along the same vertical time axis in A as in B, with all extant individuals have evolved from an original common ancestor; (B) A simple simulation of the process by which organisms reproduce over time giving rise to changing trait values with each new generation. If trait evolution is simulated as a random walk through time (or Brownian motion process), the degree of trait divergence between biological taxa is expected to be proportional to the amount of time they have diverged from a common ancestor. As a consequence, distantly related taxa are expected to be phenotypically more dissimilar. Spectral information could be considered another form of trait (on the y-axis), becoming increasingly dissimilar among groups with greater evolutionary distance.
Remotesensing 08 00221 g001
Figure 2. (A) Quercus oleoides nuclear DNA simple sequence repeats (SSRs) from seven chromosomes group into distinct clusters, or ancestral groups, indicated by colors (from [36]). Four populations are circled showing the locations where seeds were collected for the field experiment. The Costa Rica (CR) populations are distinct from the other populations, although not with each other, and gene flow with the Honduras (HN) population is apparent. The Mexico (MX) population is most distantly related to Costa Rica. Belize is similar to Mexico and Honduras; (B) Comparison of spectra from saplings from four populations grown in a common garden in Honduras; shown are the means for each wavelength per population. Panels (CF) present the % reflectance means of each population within the visible (VIS), near infrared (NIR) and first and second spectral regions of the short-wave infrared (SWIR1 and SWIR2) and show the mean, 50% and 95% quantiles.
Remotesensing 08 00221 g002
Figure 3. (A) Bivariate plot of population means (±1 SE) from a principal coordinates (PCO) analysis PCO using leaf spectra from five populations of Quercus oleoides (BZ = Belize, MX = Mexico, HN = Honduras, CR-SE = Costa Rica, Santa Elena, and CR-RI = Costa Rica, Rincon), showing the first and second axes of variation. The first two components were significantly differentiated by population (see Table S2); (B) PCO scores showing populations means (±1 SE) for the first and fourth principal components as black circles with 95% CI. These were the first two components that had significant phylogenetic signal (see Table S2); (C) PCO scores for the first and fourth principal components shown for the four higher order clades (live oaks, Virentes (V, green symbol); white oaks, section Quercus (Q, blue symbol), red oaks, section Lobatae (L, red symbol), and golden cup oaks, section Protobalanus (P, gold symbol)); (D) PCO scores for leaf type (evergreen (E), deciduous (D) or brevi-deciduous (BD)), showing the first and fourth principle components, the first two components that were significantly differentiated by leaf type (see Table S3).
Remotesensing 08 00221 g003
Figure 4. (A) Molecular phylogeny of 28 oak species showing principal coordinate scores to the right of each species. Leaf habit is indicated by letter codes and coloring of species names, as follows: D = deciduous (red), E = evergreen (dark green), and BD = brevi-deciduous or semi-evergreen (light green). The four recognized higher level clades are indicated with colored circles as follows: red, red oaks (section Lobatae); blue, white oaks (section Quercus); green, live oaks (Virentes); and yellow, golden cup oaks (Protobalanus). Species values for the first and fourth principal coordinate (PCO) axes are shown to the right: PCO1 (B) and PCO4 (C). Positive PCO axis values are shown in dark gray, negative in light gray. Distributions of observed values of Blomberg’s K statistic (red dashed lines) are shown relative to a Brownian motion (BM) model of evolution (dark gray bars) and relative to a white noise model in which phylogenetic relationships are completely randomized (light gray bars) for PCO1 (D) and PCO4 (E) species scores. Observed K values for the PCO1 and PCO4 scores are consistent with a Brownian motion model of evolution and show higher phylogenetic conservatism than expected based on random relationships.
Remotesensing 08 00221 g004
Figure 5. (A) Comparison of the distribution of Kappa scores for 300 iterations of the PLS-DA validation model using predicted trait data (blue bars) or full spectral data (yellow bars); (B) Loadings by wavelength for the first three components of the PLS-DA validation model using spectral data to classify populations within a species. The absolute values of the loadings in each regions of the spectra indicate the degree of information content in distinguishing oak species for a given component. For all graphs in the middle and right columns, solid lines represent means for each component; shaded areas represent the 5% and 95% quantiles; red = component 1, green = component 2, and blue = component 3; (C) Loadings by trait for the first three components of the PLS-DA validation model to classify populations using traits. Lines and shading are the same as in A; (D) Kappa score distributions for the PLS-DA validation models for species classification using trait and full spectra data as in (B); PLS-DA loadings to classify clades using spectra (E) or traits (F); (G) Kappa score distributions for the PLS-DA validation models for clade classification using trait and full spectra data as in (A); PLS-DA loadings to classify species using spectra (H) or (I) traits; (J) Kappa score distributions for the PLS-DA validation models for leaf type classification as in (A); and PLS-DA loadings to classify leaf type using spectra (K) or (L) traits.
Remotesensing 08 00221 g005
Table 1. Summary of the PLS-DA results.
Classification UnitSpectraTraits
Kappa: Mean (SD)# ComponentsKappa: Mean (SD)# Components
Population0.344 (0.042)290.222 (0.033)7
Species0.61 (0.027)600.271 (0.021)8
Clade0.813 (0.025)350.516 (0.028)5
Leaf type0.365 (0.046)440.13 (0.044)8

