2. Materials and Methods
DLR-EnMAP and ASI-PRISMA are two Earth observation satellites that capture hyperspectral data for various applications, including environmental monitoring, agriculture, and land use mapping. While they share some similarities in their mission objectives, there are key differences between them when it comes to their capabilities, specifications, and applications. With the support of the ASI and DLR, hyperspectral datasets have been collected during the second half of July 2023. The ASI-PRISMA dataset considered in this work includes one image of the test area acquired on 15 July 2023; the DLR-EnMAP dataset is composed of two images collected on 14 and 22 July 2023. Both datasets were acquired under similar weather conditions (
Table 1) and the sky was cloud-free during this arid period [
25].
During the same period, a field campaign was deployed (18 July 2023), completing the ground measurements, which started at the beginning of June 2023 and finished in September 2023. This paper is focused on the ground dataset collected in between the satellites’ passes. Ground truth spectra were collected by the spectrometer ASD FieldSpec 3 Pro [
17], in the range of 0.4–2.5 μm, at the SPp (
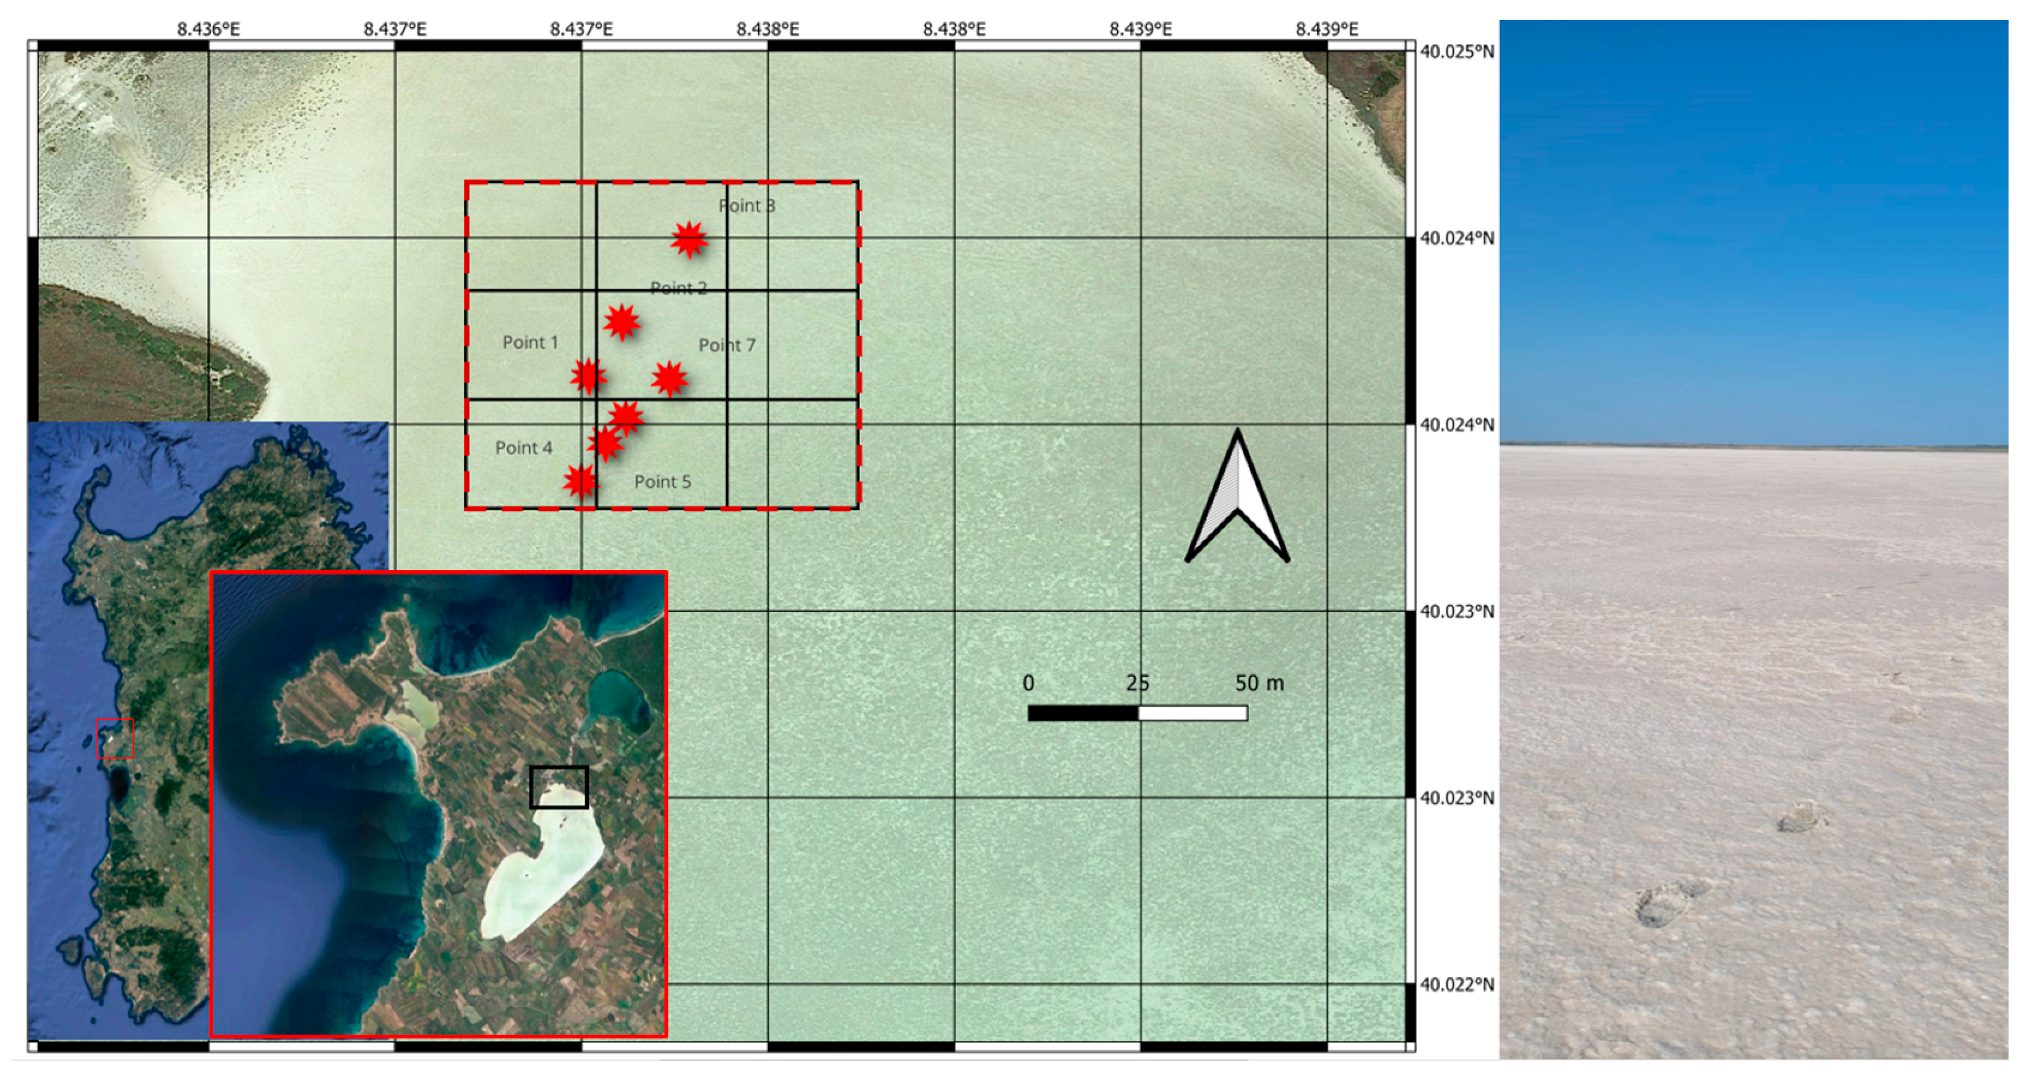
Figure 1).
The SPp is located on the Sinis peninsula (West Sardinia), near the villages of San Vero Milis and Riola Sardo, and it is the largest temporary pond in Sardinia (
Figure 1). It occupies a flat-bottomed interdunal depression where rainwater collects. The basin, with a maximum depth of 1 m and an average depth of 40 cm, is characterized by an absence of tributaries and emissaries, indeed it is an independent basin from the other pond areas present in the area. During the summer period, strong evaporation causes the SPp to fully dry out, presenting itself as a large expanse of salt. This phenomenon is enabled by the presence of greyish-white clay sediments at the bottom of the basin, which make it practically impermeable. This prevents the infiltration of water into the subsoil and, with the subsequent evaporation, it deposits its saline content on the surface of the depression that hosts the pond [
26].
The ASI-PRISMA satellite carries a hyperspectral and panchromatic payload, capturing images with global coverage. Its hyperspectral camera utilizes a prism spectrometer and acquires data in the spectral range of 0.4–2.5 µm. It includes 63 channels in the VNIR (Visible and Near-Infrared) region and 171 channels in the SWIR (Short-Wave Infrared) region. Its spectral resolution (FWHM) is ≤12 nm across all its spectral range. There is an overlap between its VNIR bands 60–63 and SWIR bands 3–6 [
10,
11,
13] (see
Table 2).
ASI-PRISMA is in a sun-synchronous orbit, with an altitude of 614 km and an inclination of 98.19°, and its LTDN (Local Time on Descending Node) is at 10:30 h. From the ASI web portal [
25], under the ASI license, the dataset reported in
Table 1 has been downloaded, and by means of a homemade IDL code it has been uncompressed and, after the removal of both uncalibrated bands and “duplicated” bands [
27], the VNIR-SWIR stack was generated and georeferenced. The used data level is the ASI-PRISMA’s standard Level 2D (L2d), which is used for ground reflectance products, atmospherically corrected by the ASI-PRISMA automatic processor (Ver. 02.05). This automatic atmospheric effect removal procedure is based on MODTRAN v 6.0 [
28], using a multidimensional look-up table (LUT) approach [
29] that provides Geocoded BOA Reflectance values. These data are obtained by applying atmospheric corrections and evaluating the Rayleigh scattering, gaseous absorption, water vapor absorption, and aerosol scattering present. The atmospheric corrections applied by the ASI processor include the corrections for aerosol optical thickness and water vapor and the computation of the Angstrom exponent between channels 550/705 nm and the Cloud Optical Thickness.
The DLR-EnMAP (Environmental Mapping and Analysis Program) is a German Earth observation satellite under the management of the DLR. It employs imaging spectroscopy to diagnostically characterize the Earth’s surface and document environmental changes. The heart of the DLR-EnMAP mission lies in the HSI (Hyperspectral Imager) sensor carried by this polar-orbiting satellite. The HSI functions as a pushbroom imager, capturing the Earth’s reflected signal in the VNIR-SWIR spectral range (420–2450 nm), with global coverage. The DLR-EnMAP samples 224 spectral bands, featuring intervals of 6.5 nm and 10 nm in its VNIR and SWIR channels, respectively. Its ground spatial resolution is 30 m, and its maximum swath width extends to 30 km (
Table 3) [
15].
It operates at an altitude of 653 km and inclination of 98°, equating to a period of 97 min. The used images were collected on 14 and 22 July 2023 (
Table 1). They were obtained through a web portal [
30] and, for the purposes of this work, the L2A has been used. Level 2A includes surface reflectances specifically tailored to land and water applications [
31]. The atmospheric correction process encompasses the creation of sun glint maps for water surfaces through the identification of specular reflections. It also involves the detection and correction of haze and cirrus, the estimation of aerosol optical thickness, columnar water vapor, and the retrieval of surface reflectances after adjacency correction [
31].
To obtain the ground spectra serving as references for comparing the satellite images, a Malvern Panalytical portable spectroradiometer, ASD-FieldSpec-3 Pro, was utilized. This instrument comprises three distinct spectrometers covering the spectral range of 350–2500 nm. The full-width half-maximum (FWHM) of the spectral response of the ASD at 700 nm is 3 nm, at 1400 nm it is 10 nm, and at 2100 nm it is 10 nm. Measurements were conducted using the bare fiber-optic cable with a field of view of 25°, and each measurement site was associated with GPS coordinates. The instrument’s operational details are outlined in the ASD’s documentation from 1994, which was subsequently updated [
17]. Ground truth measurements were paired with a portable GPS, recording coordinates for each spectrum in NMEA0183 format, as according to [
17]. Reflectance measurements were collected on 18 July 2023, which encompassed 105 acquired samples distributed on an area covering approximatively 6 pixels of the ASI-PRISMA and DLR-EnMAP images. Spectralon measurements were taken to convert raw radiance to absolute reflectance. The comparison between surface reflectance values from the ASI-PRISMA and DLR-EnMPAP and the averaged value (aGT), derived from all 105 spectra to assess the ground truth against the remote-sensed data, was evaluated using various statistical parameters. Specifically, the Pearson correlation coefficient was employed to assess the correlation between reflectance estimates, (see Equation (1)), while R
2, which is the determination coefficient as calculated in Equation (2), allows us to evaluate the differences and the spread of the compared datasets.
where
is the covariance between the surface reflectances derived by satellites measurements and ground measurements, respectively, and
and
are the standard deviation of the surface reflectance derived by the satellites’ measurements and ground measurements, respectively.
where
is the reflectance estimated by means of the ASI-PRISMA and DLR-ENMAP and
is the averaged ground truth, respectively, for each spectral band.
3. Results and Discussion
This section presents the outcomes of the comparisons between products gathered from official datasets. Remembering that the standard L1 TOA radiance and L2 BOA reflectance products provided by ASI and DLR were used, analyses of both BOA reflectance and TOA radiance encompass the entire spectrum within the range 400 to 2500 nm. The L2 BOA reflectance values have been compared with the ground truth acquired on the 18 July 2023 from the SPp. Subsequently, the reflectance spectra were assessed and juxtaposed with those obtained from the FieldSpec spectrometer during the field survey.
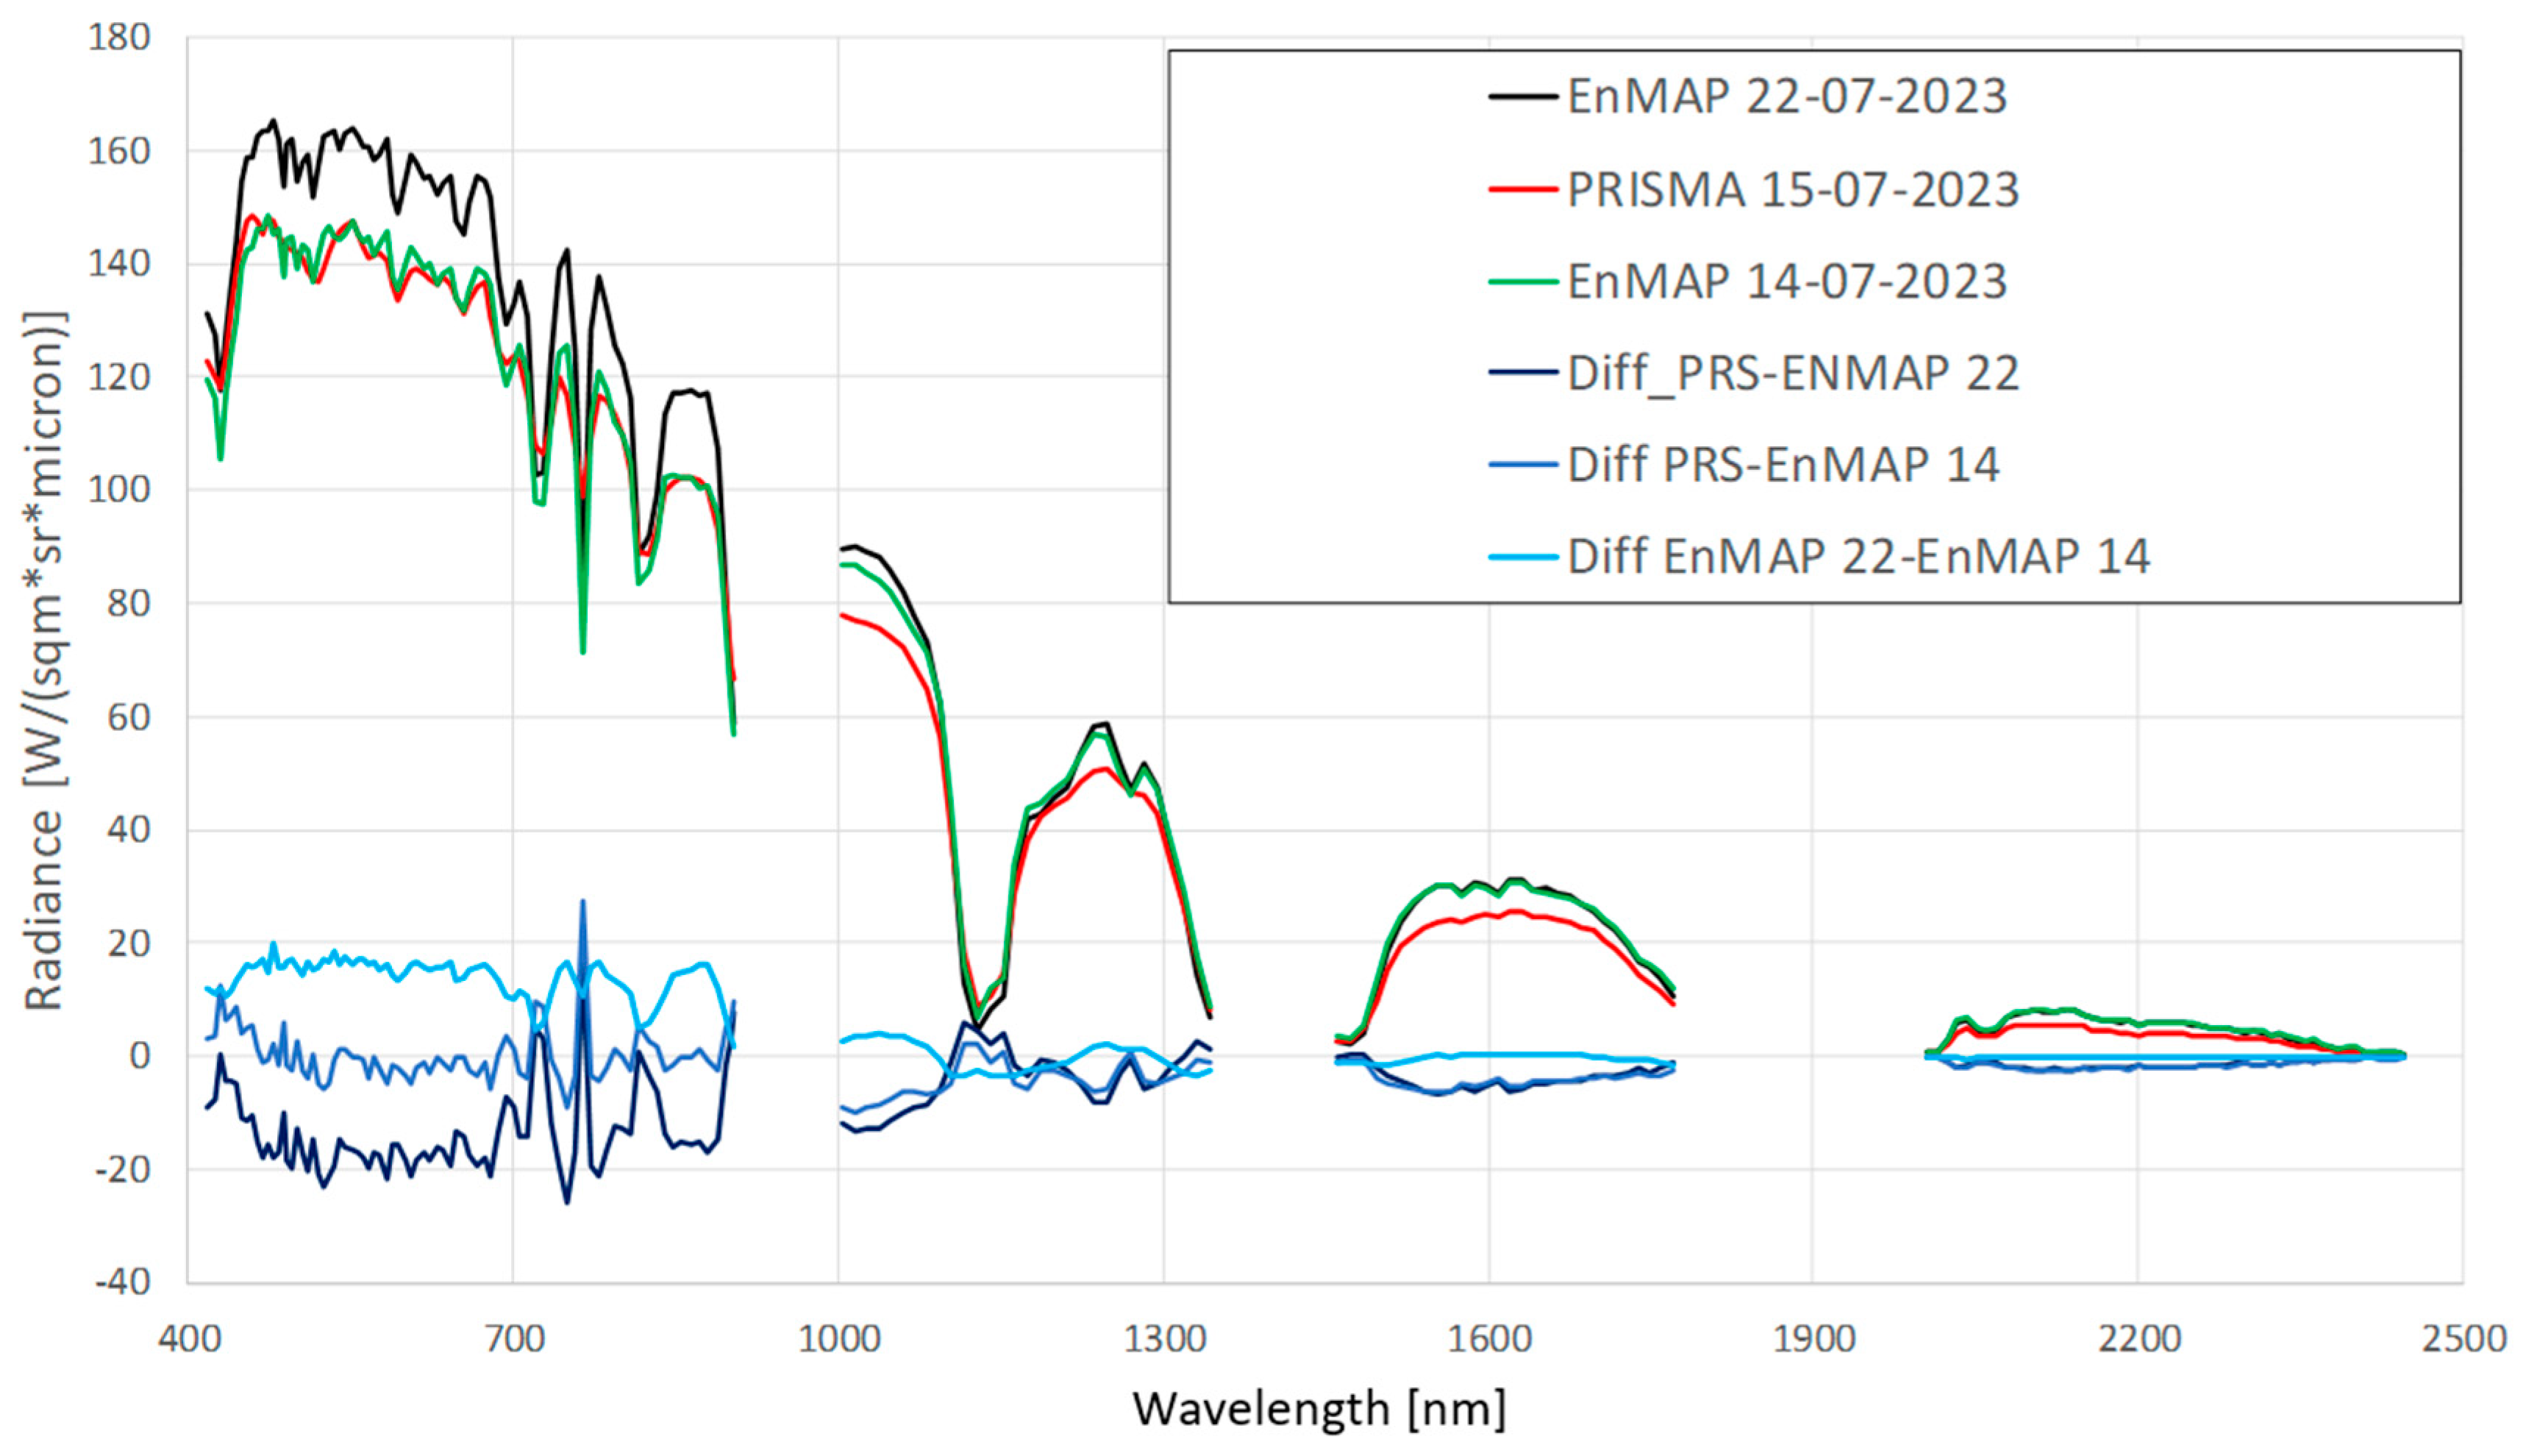
The radiance trends for the DLR-EnMAP and ASI-PRISMA have different behaviors in different sections of the electromagnetic spectrum. In the VNIR region, there is a clear coincidence between 15 July ASI-PRISMA (acquired at 10:15:37 local time) and 14 July DLR-EnMAP (acquired at 10:52:57 local time) data (respectively, the red and green lines in
Figure 2). The 22 July DLR-EnMAP (acquired at 10:59:56 local time) data have, in the VNIR region, higher values (the black line in
Figure 2). On the other hand, the SWIR bands present an overlap between the two DLR-EnMAP radiances, which are slightly overestimated with respect to that of the ASI-PRISMA. Analyzing the differences between these radiances, they are greater in the VNIR region and become almost null in the SWIR region (
Figure 2).
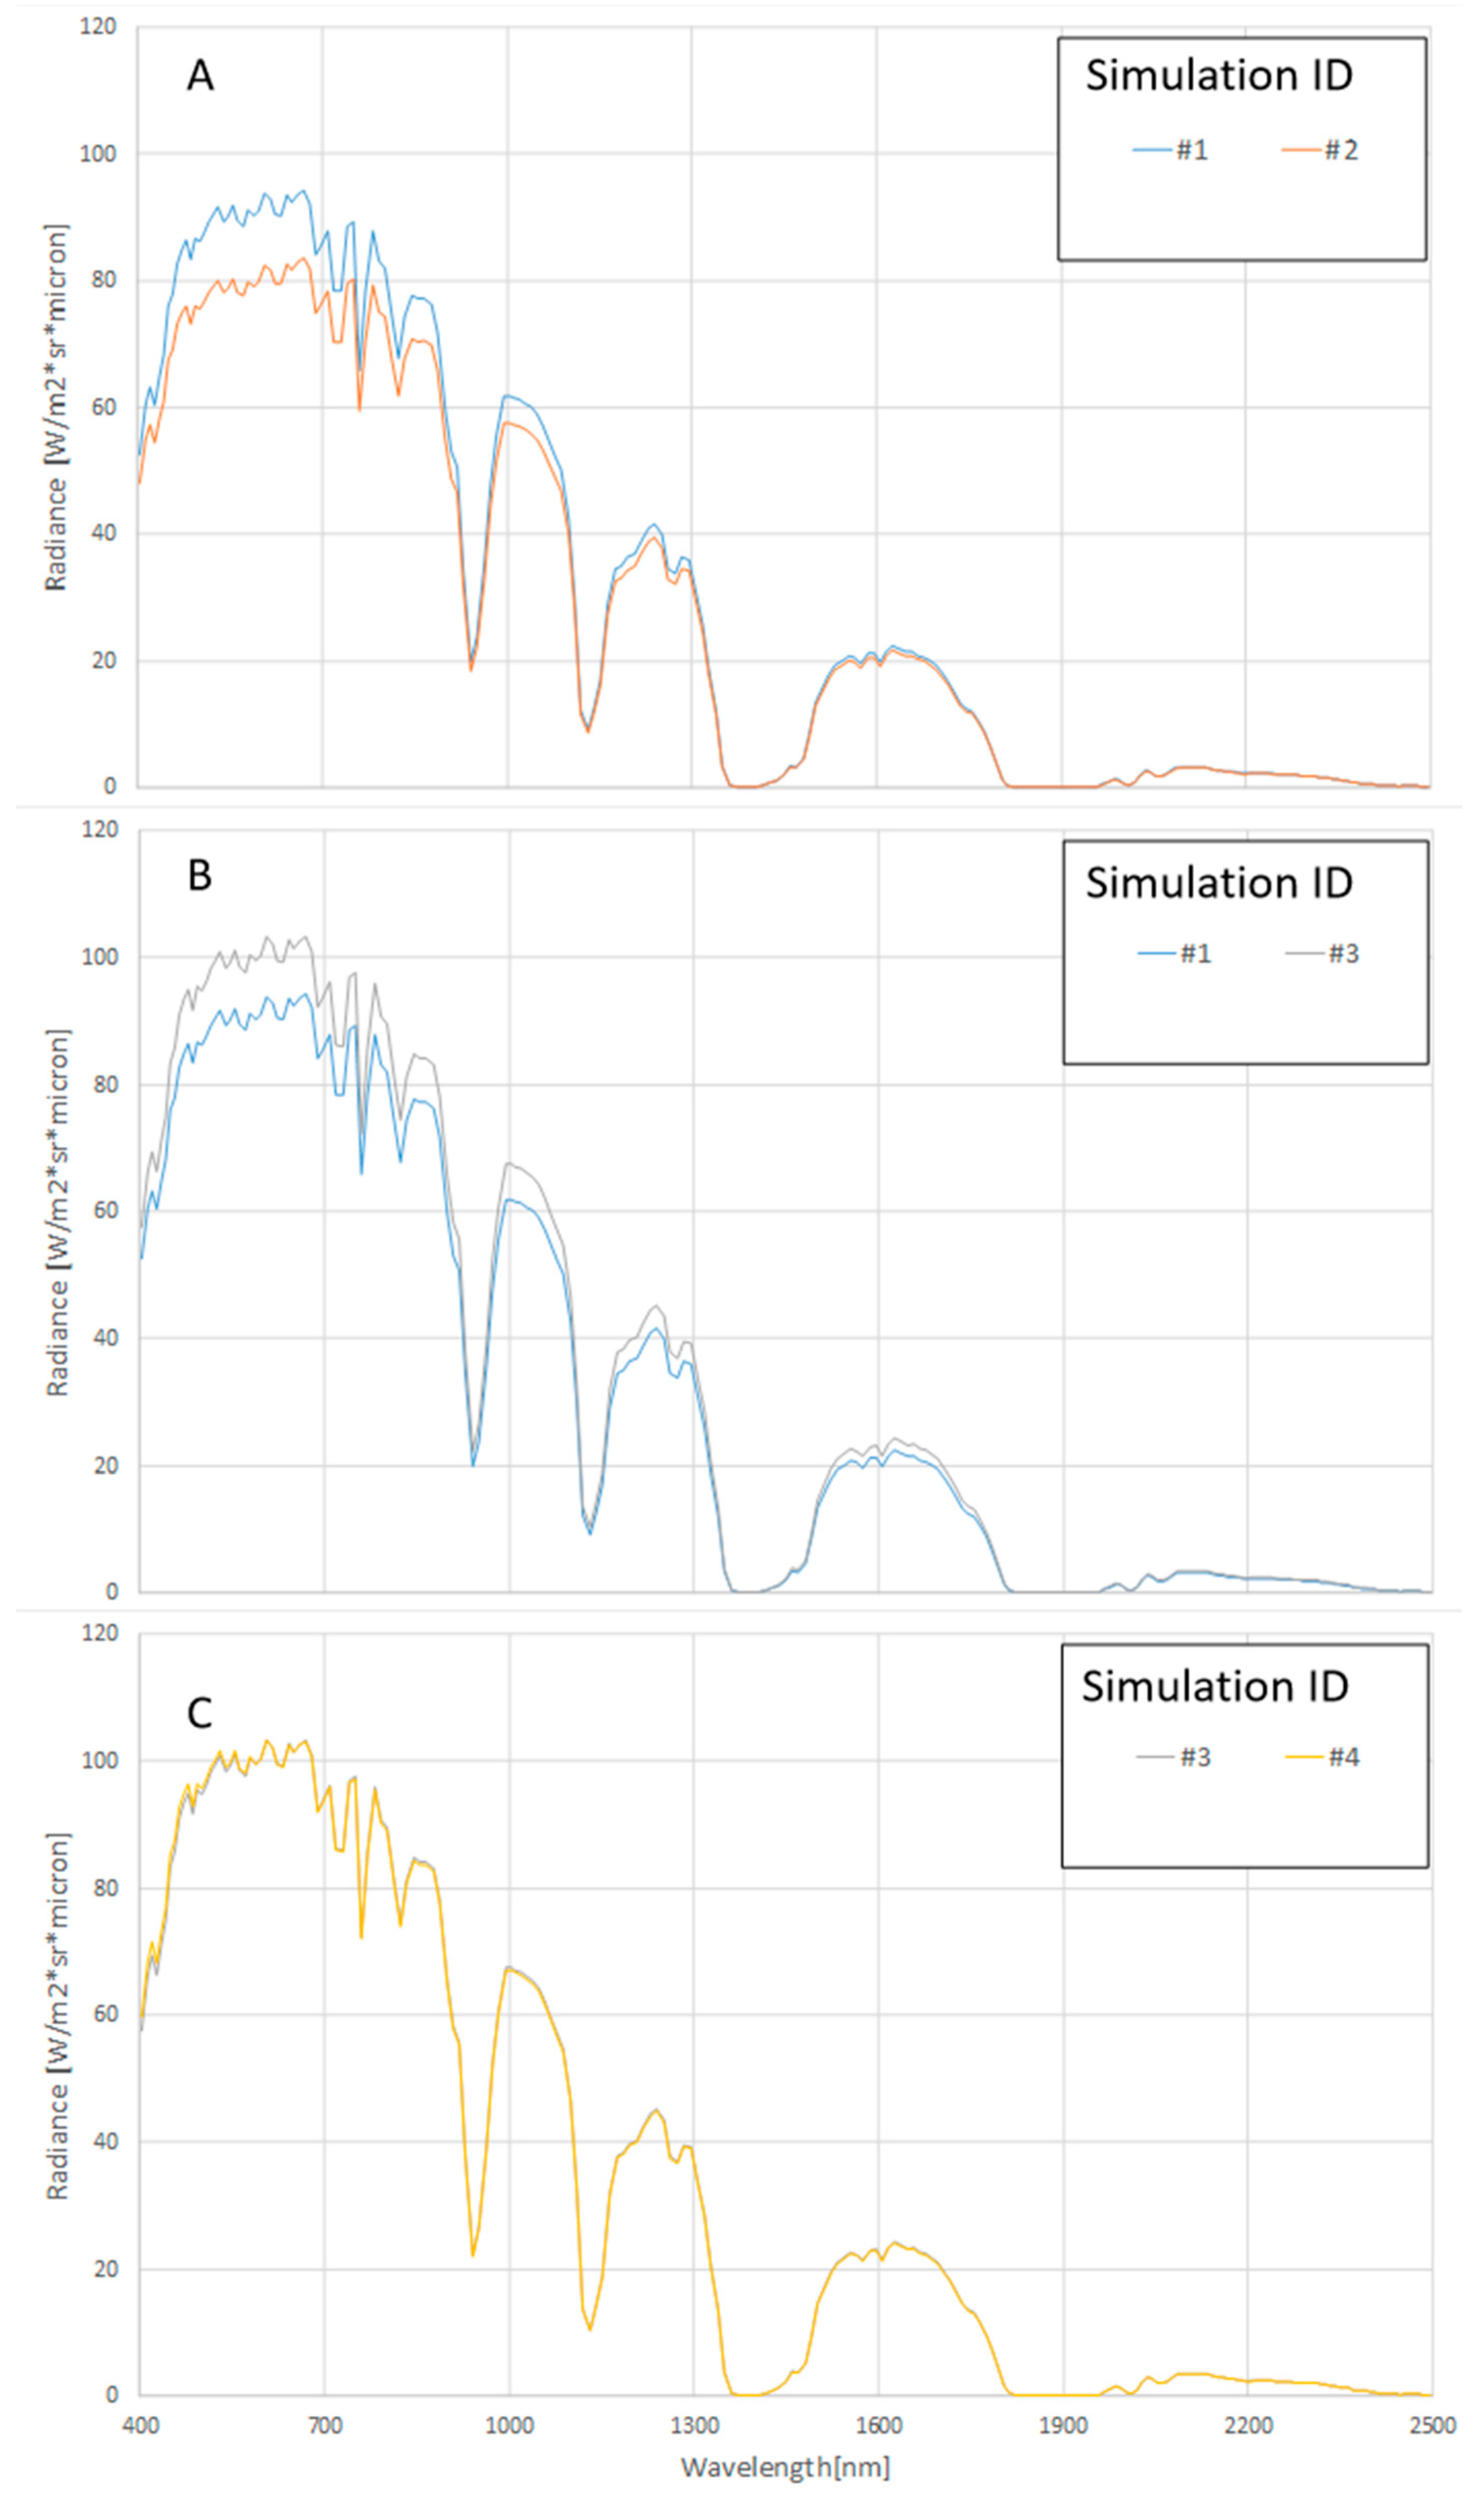
The emphasized differences could be related to two factors: the sun’s irradiance, which varies during the daytime and on different days (as between the 14, 15, and 22 July), and the aerosol loading over the area. A further unestimated contribution could be related to slight differences in atmospheric conditions (i.e., water vapor). With the aim of assessing these differences, several model simulations have been performed by employing the MODTRAN radiative transfer model. The setup for these model simulations is reported in
Table 4.
The results of the simulations, in terms of their TOA radiance, are reported in
Figure 3. The strong effect of the AOT parameter, with radiance differences up to 10 W*m
−2*sr
−1*µm
−1 in the VNIR region, is evident in the entire range of 400–1800 nm (
Figure 3A). Also, the difference in the time of acquisition (10:15 vs. 11:00 L.T.), with a great difference in solar irradiance, leads to important variations in the TOA radiances (
Figure 3B). Finally, the simulations do not indicate any significant effects when only changing the day while holding the other parameters constant (AOT, time, ground reflectance) (
Figure 3C).
It is important to remember that, in this paper, we used standard BOA data as they are furnished by the data providers (both DLR and ASI) and, therefore, we do not control the inversion procedure adopted [
1,
29]. When adopting these procedures and examining the reflectance characteristics at 780 nm, it is evident that the DLR-EnMAP atmospheric removal effect L2 algorithm does not adequately correct for O
2 atmospheric absorption with respect to the ASI-PRISMA algorithm, which achieves a more precise correction. At the same time, the presence of saw-tooth features in the ASI-PRISMA data may be attributed to potential over-correction by the used algorithm.
Regarding the ASI-PRISMA feature at 1260 nm (the red curve) that is not present in the DLR-EnMAP data, it appears to be an excessive correction for CO
2. At this wavelength (1260 nm), this feature is not as pronounced in the PRISMA radiance as observed in the ENMAP data in
Figure 2.
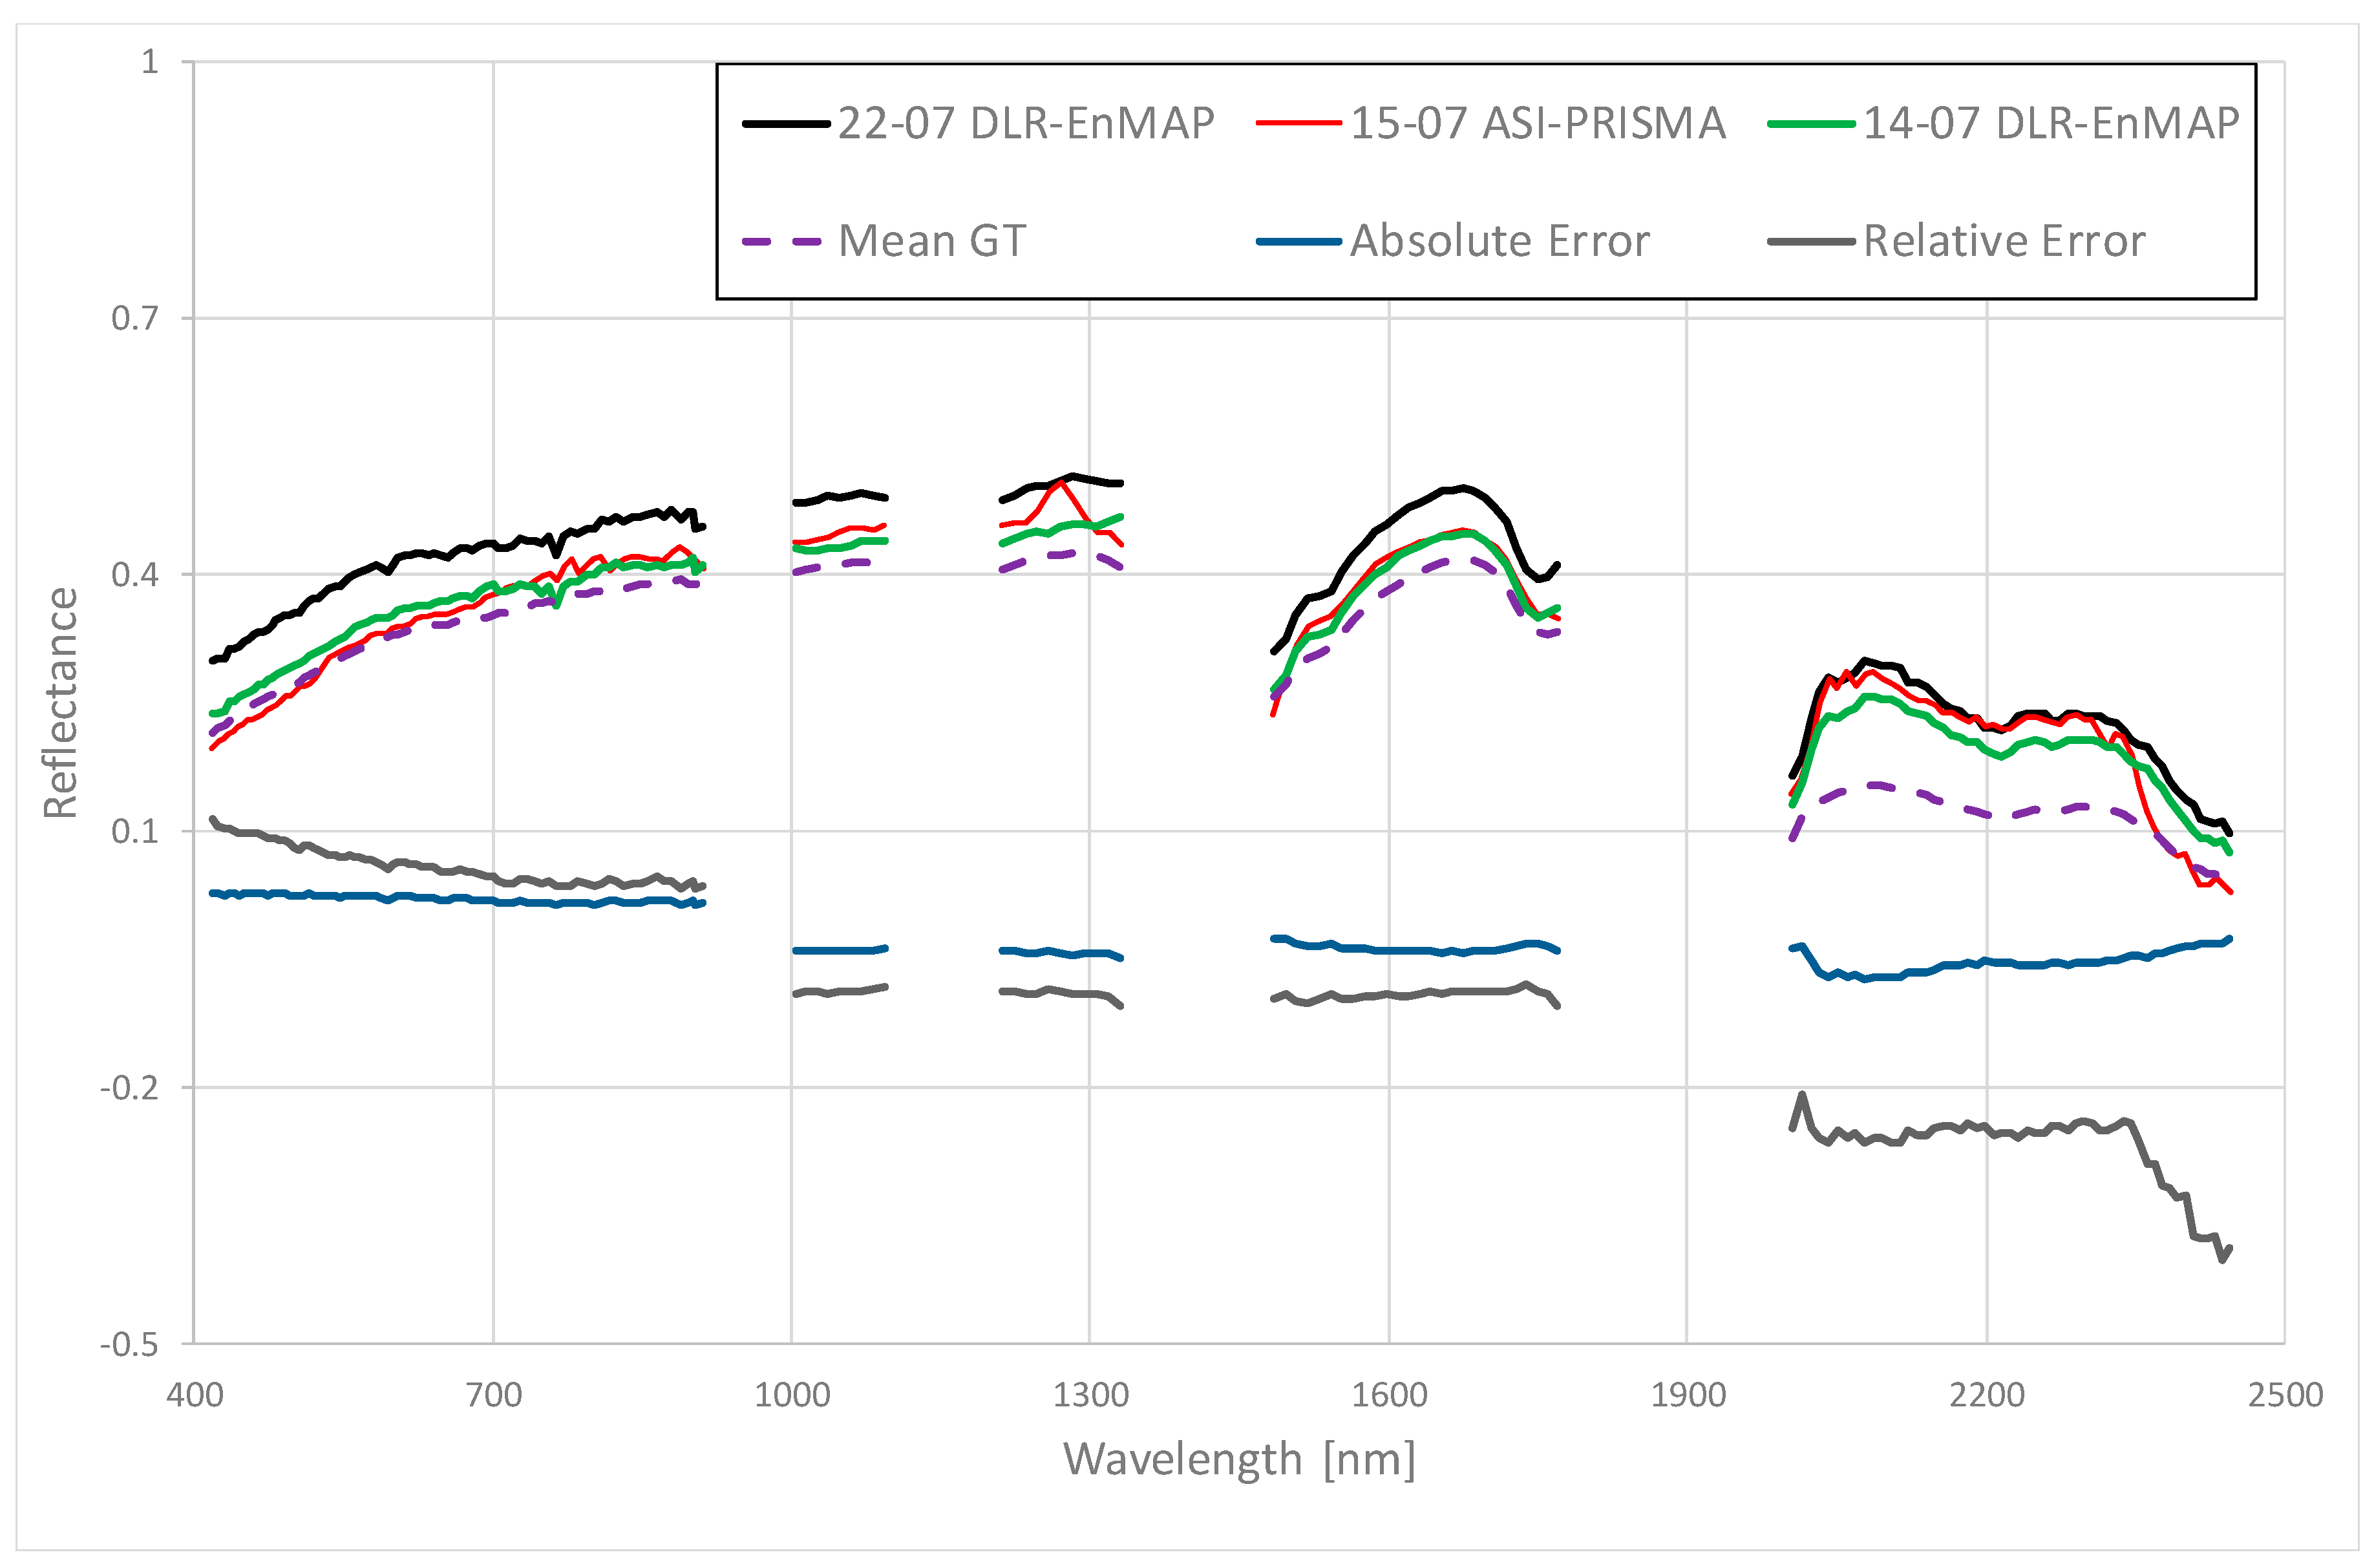
The standard BOA reflectance products (
Figure 4), sampled on the same area of interest (
Figure 1) as where the ground truth was collected, show that the ground reflectance was properly estimated. The three different curves have very similar trends, overlapping each other in different parts of the spectrum. Reported in the same figure are the absolute error, calculated as reported in Equation (3),
and the relative errors, calculated according to Equation (4):
Both errors (absolute and relative) are relevant to the EO data collected.
The two datasets acquired on 14 and 15 July run in parallel, with similar values up to 1800 nm. In the same range, the data acquired on 22 July are slightly overestimated, while, in the 2000–2300 nm spectral range, they run almost parallel with the ASI-PRISMA data included into the two DLR-EnMAP datasets, recording a drop of the ASI-PRISMA signal after 2300 nm.
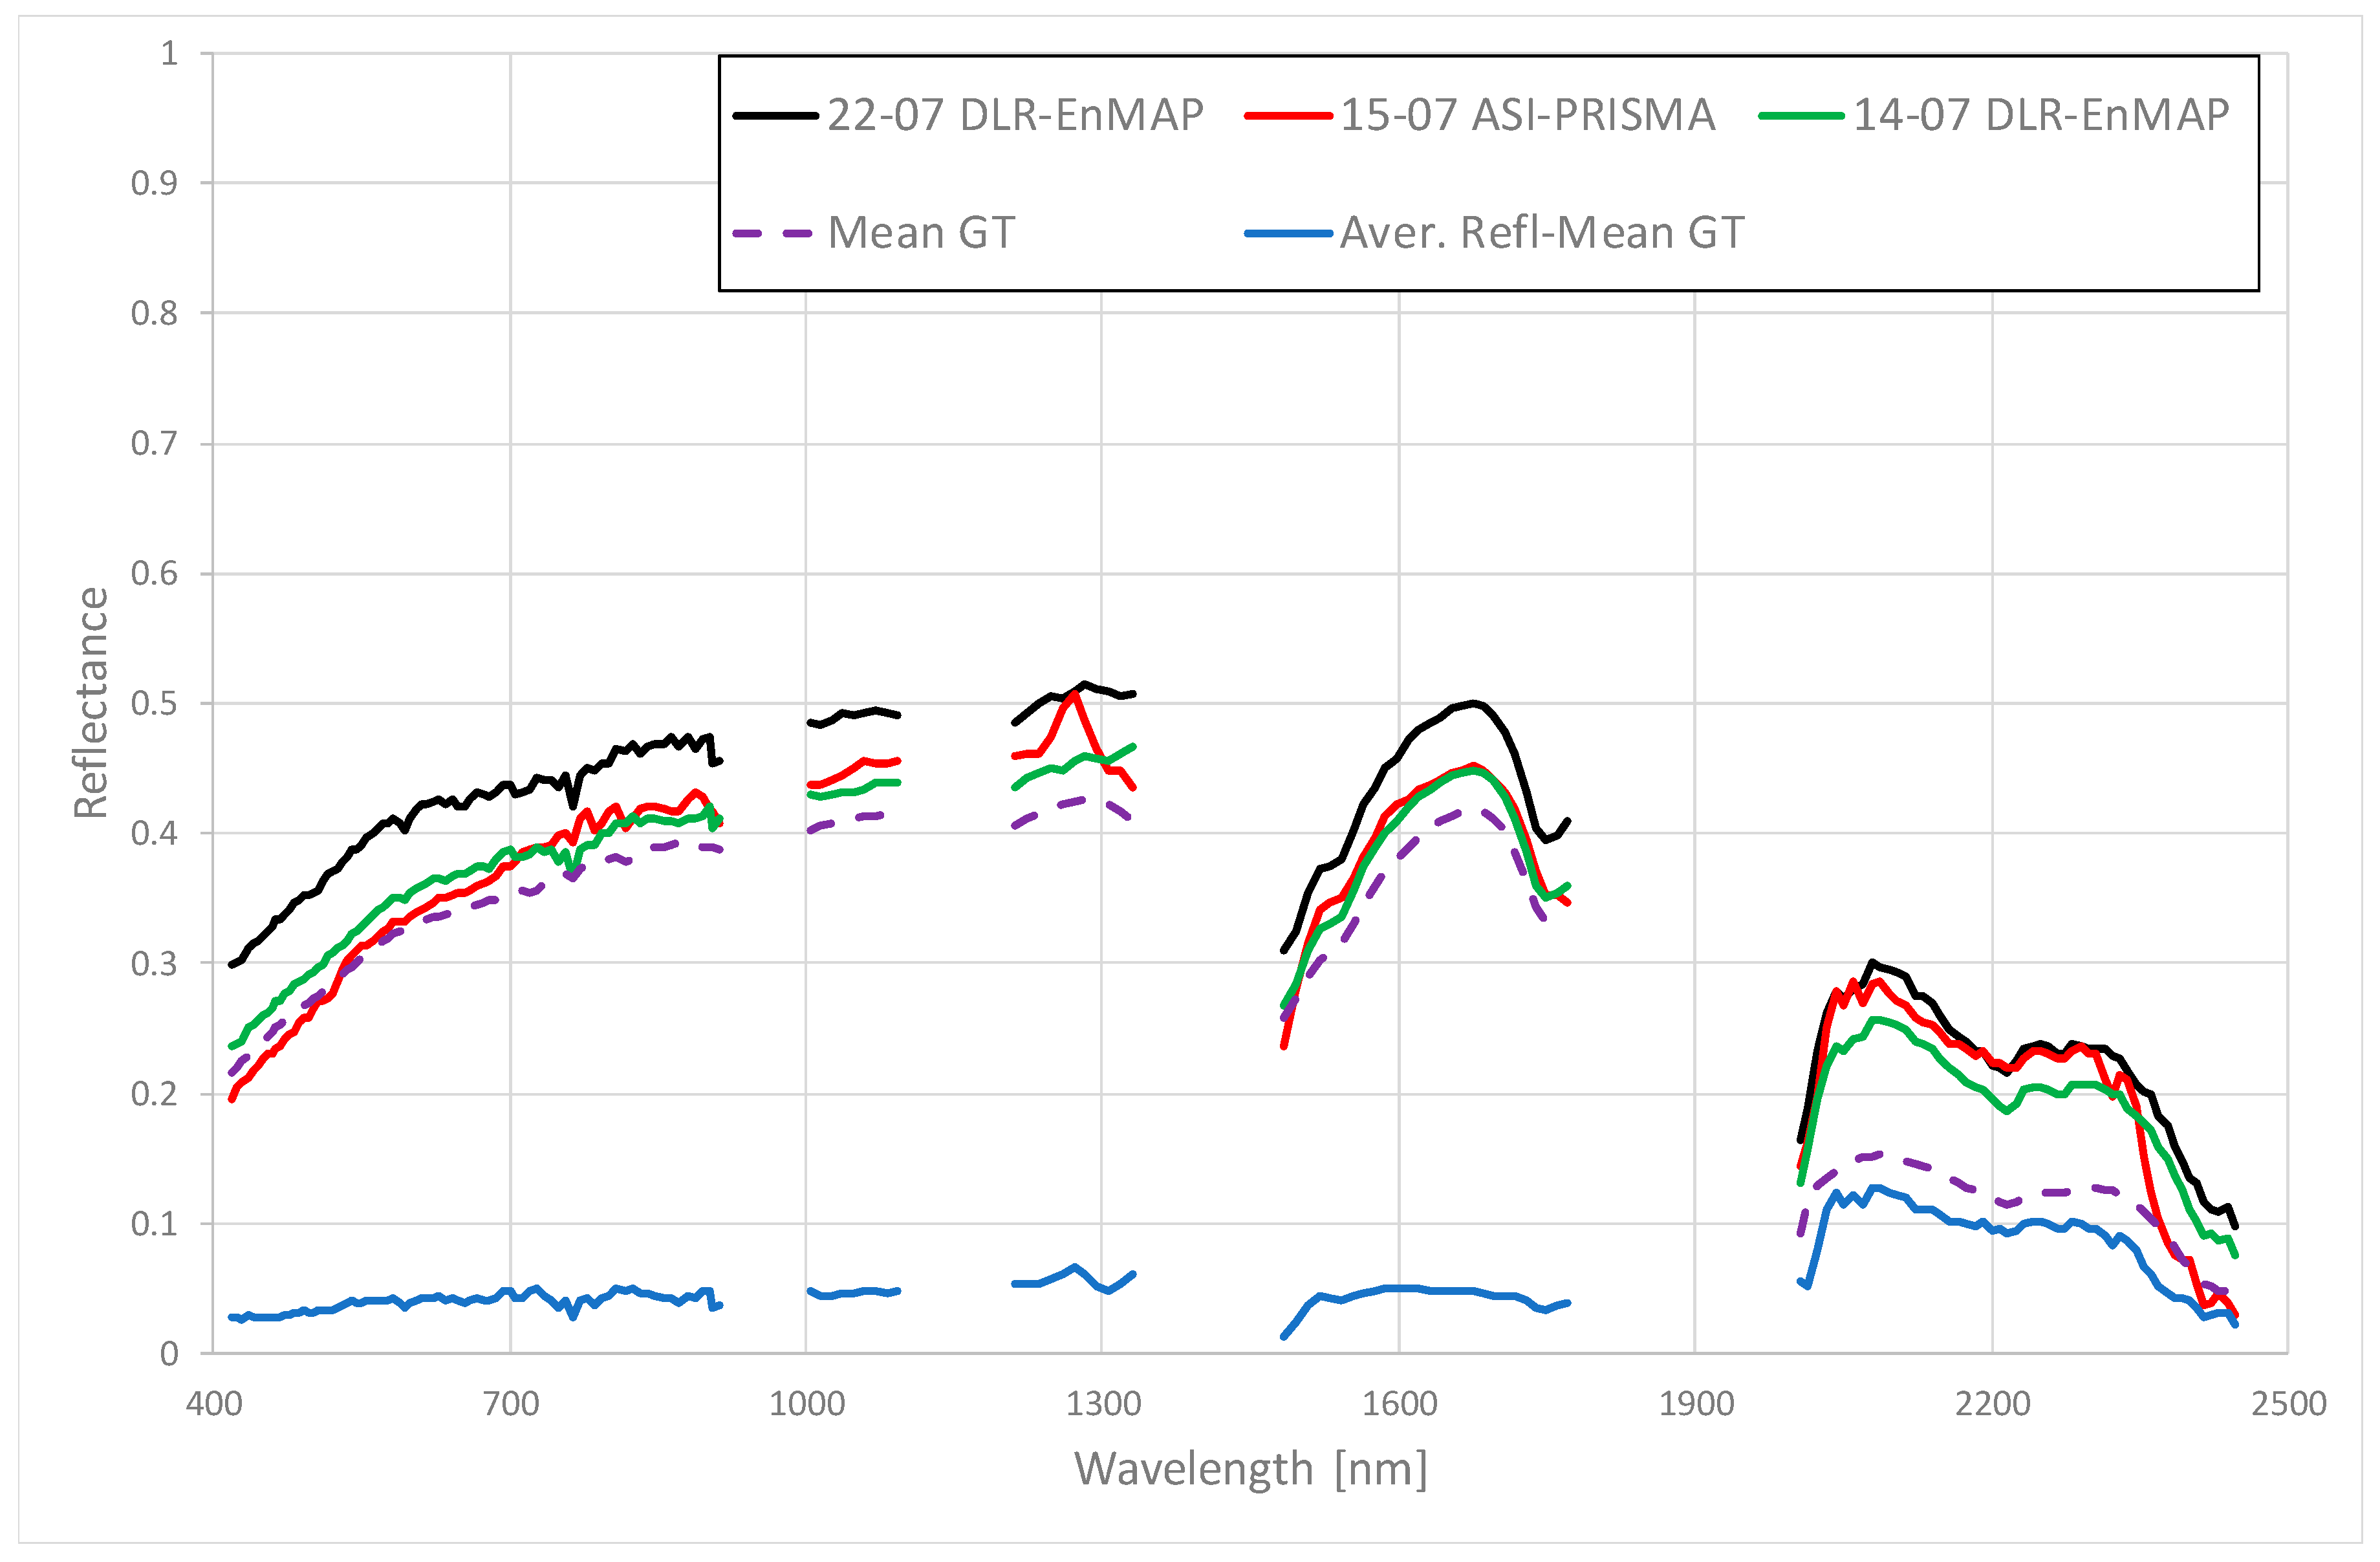
The absolute mean difference between the reflectance values estimated by the ASI-PRISMA and DLR-EnMAP, for the test area, is around −0.015, with a minimum of −0.07 (around 2100 nm) and a maximum of −0.027 at the beginning of the spectral range. The average relative mean difference between the reflectance values estimated by the ASI-PRISMA and DLR-EnMAP, for the test area, is around −0.075, with a minimum of −0.4 close to the end of the SWIR region and a maximum of 0.11 in the first channel of VNIR region (
Figure 4). The difference between the averaged remote-sensed data and the ground truth is 0.05, with the maximum difference reached in the SWIR region (0.12) (
Figure 5).
Although the weather conditions on individual days were not different, the trend over the period of 14–22 July indicates a slight increase in cloud cover. This evolution makes the data for 22 July, although consistent with that of the 14th with respect to the ground acquisitions of the 18, less statistically rigorous.
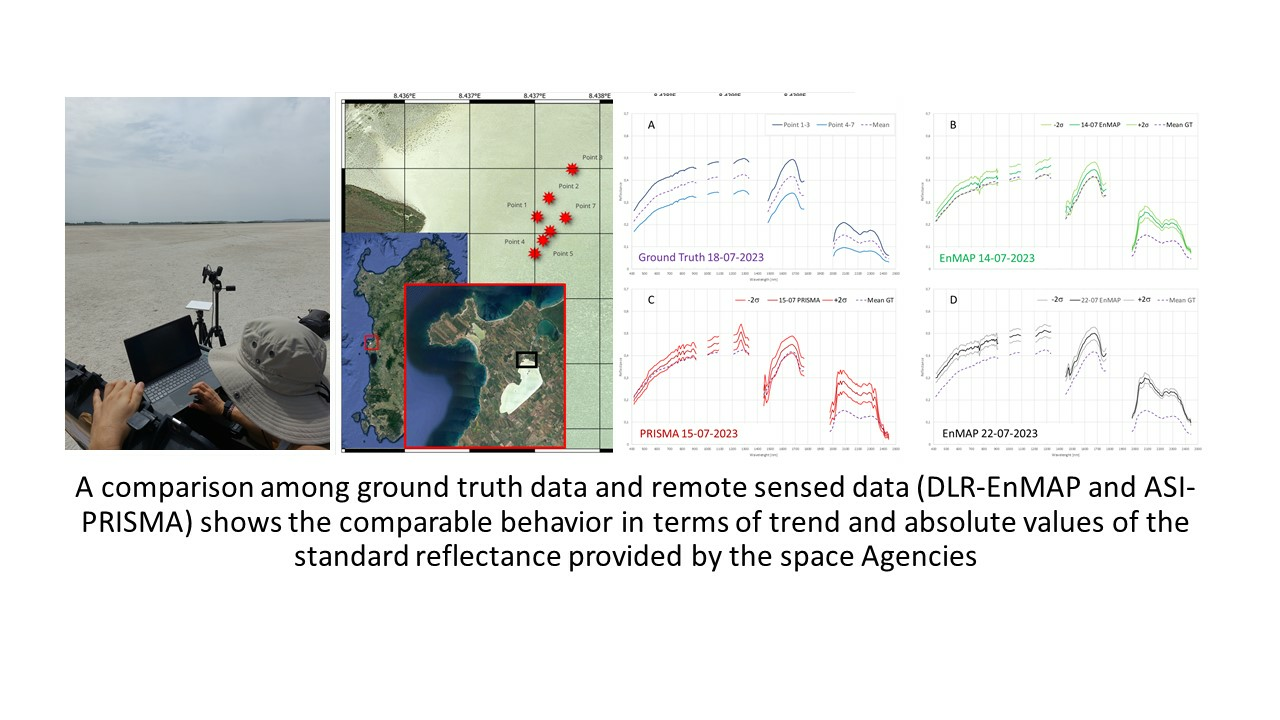
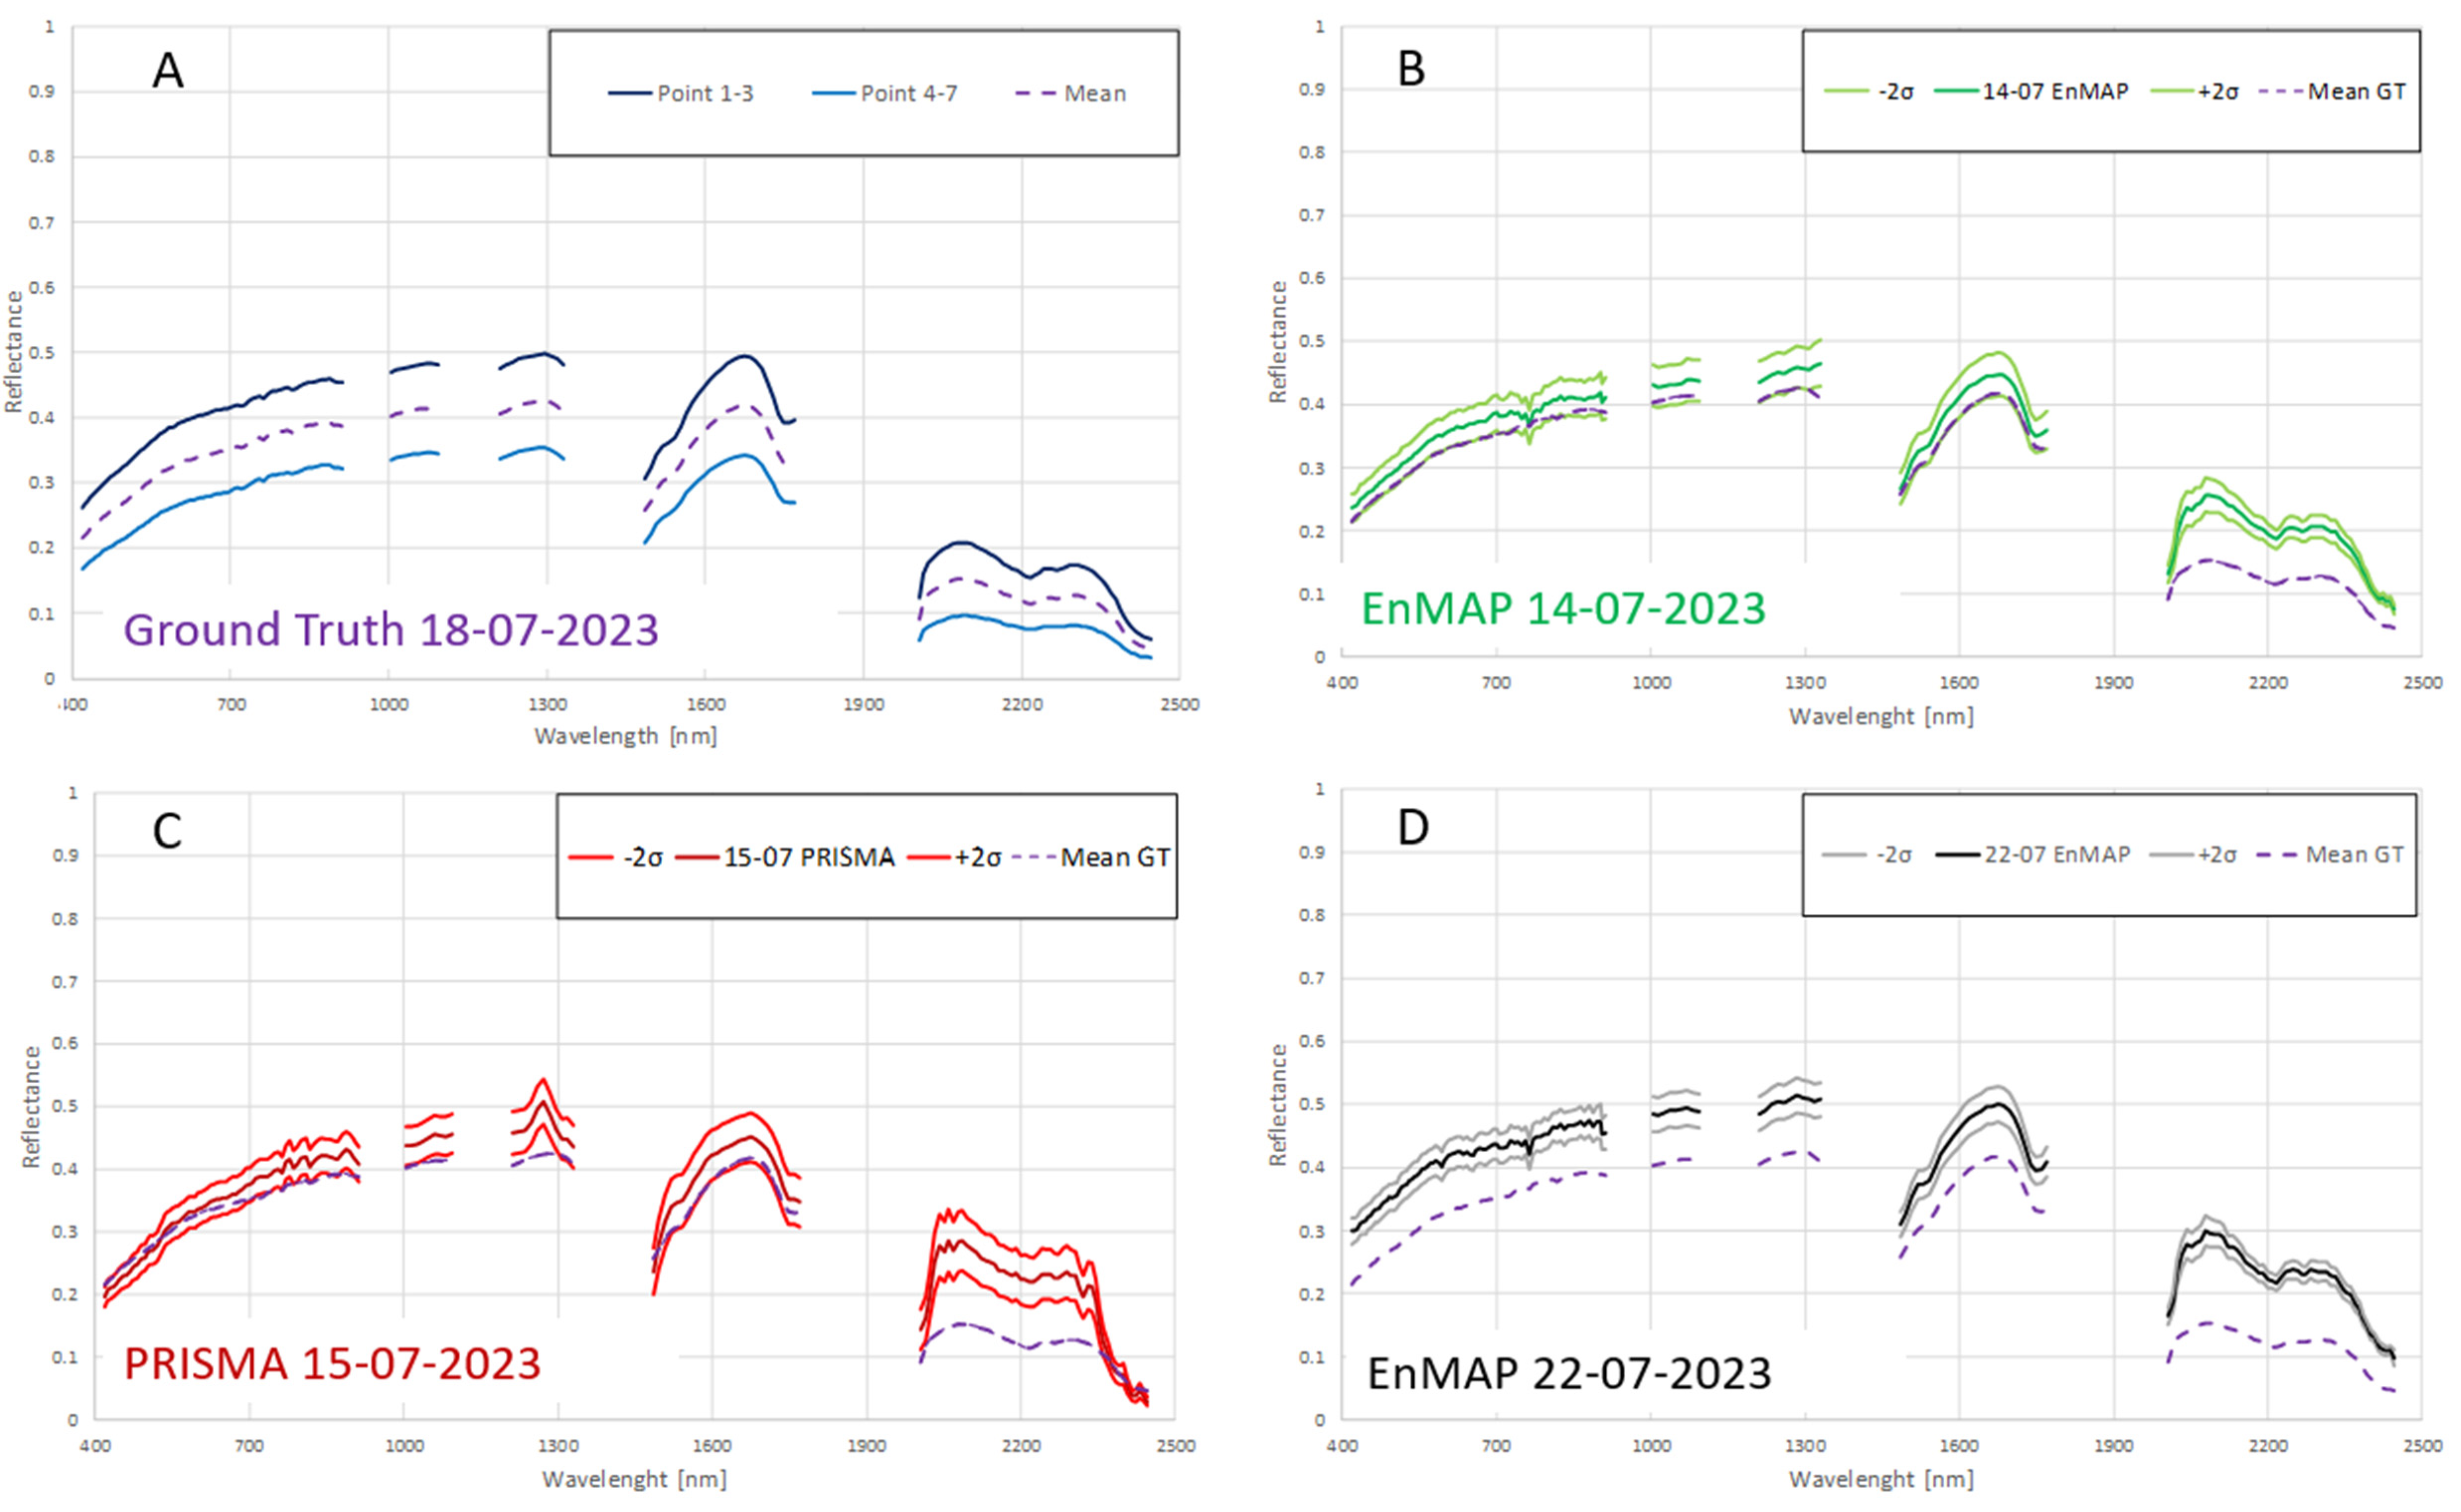
On the 18 July, a field campaign was deployed to collect ground truth data by means of a portable spectroradiometer suitable for acquiring spectra in the same wavelength range as the ASI-PRISMA and DLR-EnMAP. Measurements of reflectances were collected on 18 July 2023 and on this day the weather was excellent, with an absence of cloud over the site and with almost zero knots of wind, allowing for data collection over 7 different sites (
Figure 4), which can be considered numerically adequate considering the small variation in spectral behavior (
Figure 6A) of the area considered (
Figure 1, where a qualitative representation of both the area’s homogeneity and the clear sky is reported).
Table 5 shows the names of the measuring points and the number of spectra acquired.
The spectral data at the sites were obtained using a consistent methodology. For each measurement, the distance between the fiber-optic cable and the target was maintained as constant as possible. This uniform distance was also upheld across various sites. Fifteen samples were collected at each point, and the mean value was calculated from these measurements. Upon analyzing the collected spectra (
Figure 4), it is evident that the sampled sites exhibit similar trends, albeit with varied absolute values. These values peak at 0.5 around 1600 nm and decline below 0.2 in the latter part of the SWIR region.
The weather conditions were constant during the first three samplings, worsening slightly immediately afterwards (points 4–7). Indeed, optimization and white reference (
Table 4) collection ASD procedures have been followed to keep the data, as much as possible, comparable. Because of the coherence in the data, in the following we use the aGT. The dashed purple line represents the average of the 105 samples collected on 18 July 2023 at the SPp.
The ASI-PRISMA data were collected three days before the field survey. Considering all the remote data analyzed, these was the closest in time with respect to the on-the-ground spectral sampling. In
Figure 6 three curves are reported: the dark red represents the mean value of the ASI-PRISMA reflectance value, measured according to the pixel included in the bounding box presented in
Figure 1 and centered on the site position reported in
Table 4; the red curves are representative of ±2σ (STDv).
From 400 nm up to 1750 nm the aGT runs between the ASI-PRISMA mean value and its −2σ, while from 1950 nm and 2300 nm the aGT value is significantly lower than the −2σ ASI-PRISMA trend. In the final SWIR spectral range, the ASI-PRISMA value is overestimated with respect to the aGT (
Figure 4). The ASI-PRISMA image presents a “shark teeth” absorption feature from 780 nm up to 820 nm, due to an improper correction of water vapor not present in the ground truth data. Also, at 1250 nm, the ASI-PRISMA presents a peak which does not correspond to any feature of the aGT data (
Figure 6A). These differences can be attributed to the atmospheric contribution removal process, passing from TOA radiance to BOA reflectance, which can introduce artefacts during the generation of a standard product.
Differences occur between the aGT and the relevant DLR-EnMAP spectra, respectively, the 14th (
Figure 6B) and 22 July (
Figure 6D) datasets; it is possible to underline how nearly parallel the aGT is to the 14 July −2σ DLR-EnMAP data from 400 up to 1750 nm, and, similarly to the ASI-PRISMA data in the SWIR region, there is an overestimation of the remote-sensed data with respect to the aGT. The DLR-EnMAP does not show a signal drop after 2300 nm as the ASI-PRISMA does.
Comparing the aGT with the 22 July DLR-EnMAP data (
Figure 6D), an overestimation of the space data response is constant along the full spectral range, with different absolute values. The mean DLR-EnMAP response and the ±2σ response are, in general, higher than the aGT.
Both DRL images (
Figure 6B,D) present a narrow absorption feature around 780 nm (where ASI-PRISMA presents the “shark teeth”) and also, in these cases, it represents a feature not present in the data collected with the portable spectroradiometer. For this reason it has been attributed to the atmospheric correction procedure adopted to generate the DLR-EnMAP standard surface reflectance product, and in particular to a water vapor removal effect that was not properly performed.
With the aim of comparing the reflectance values of the L2 products, three spectral sectors are considered (see
Table 6) for the DLR-EnMAP on the 14th and the ASI-PRISMA on the 15 July.
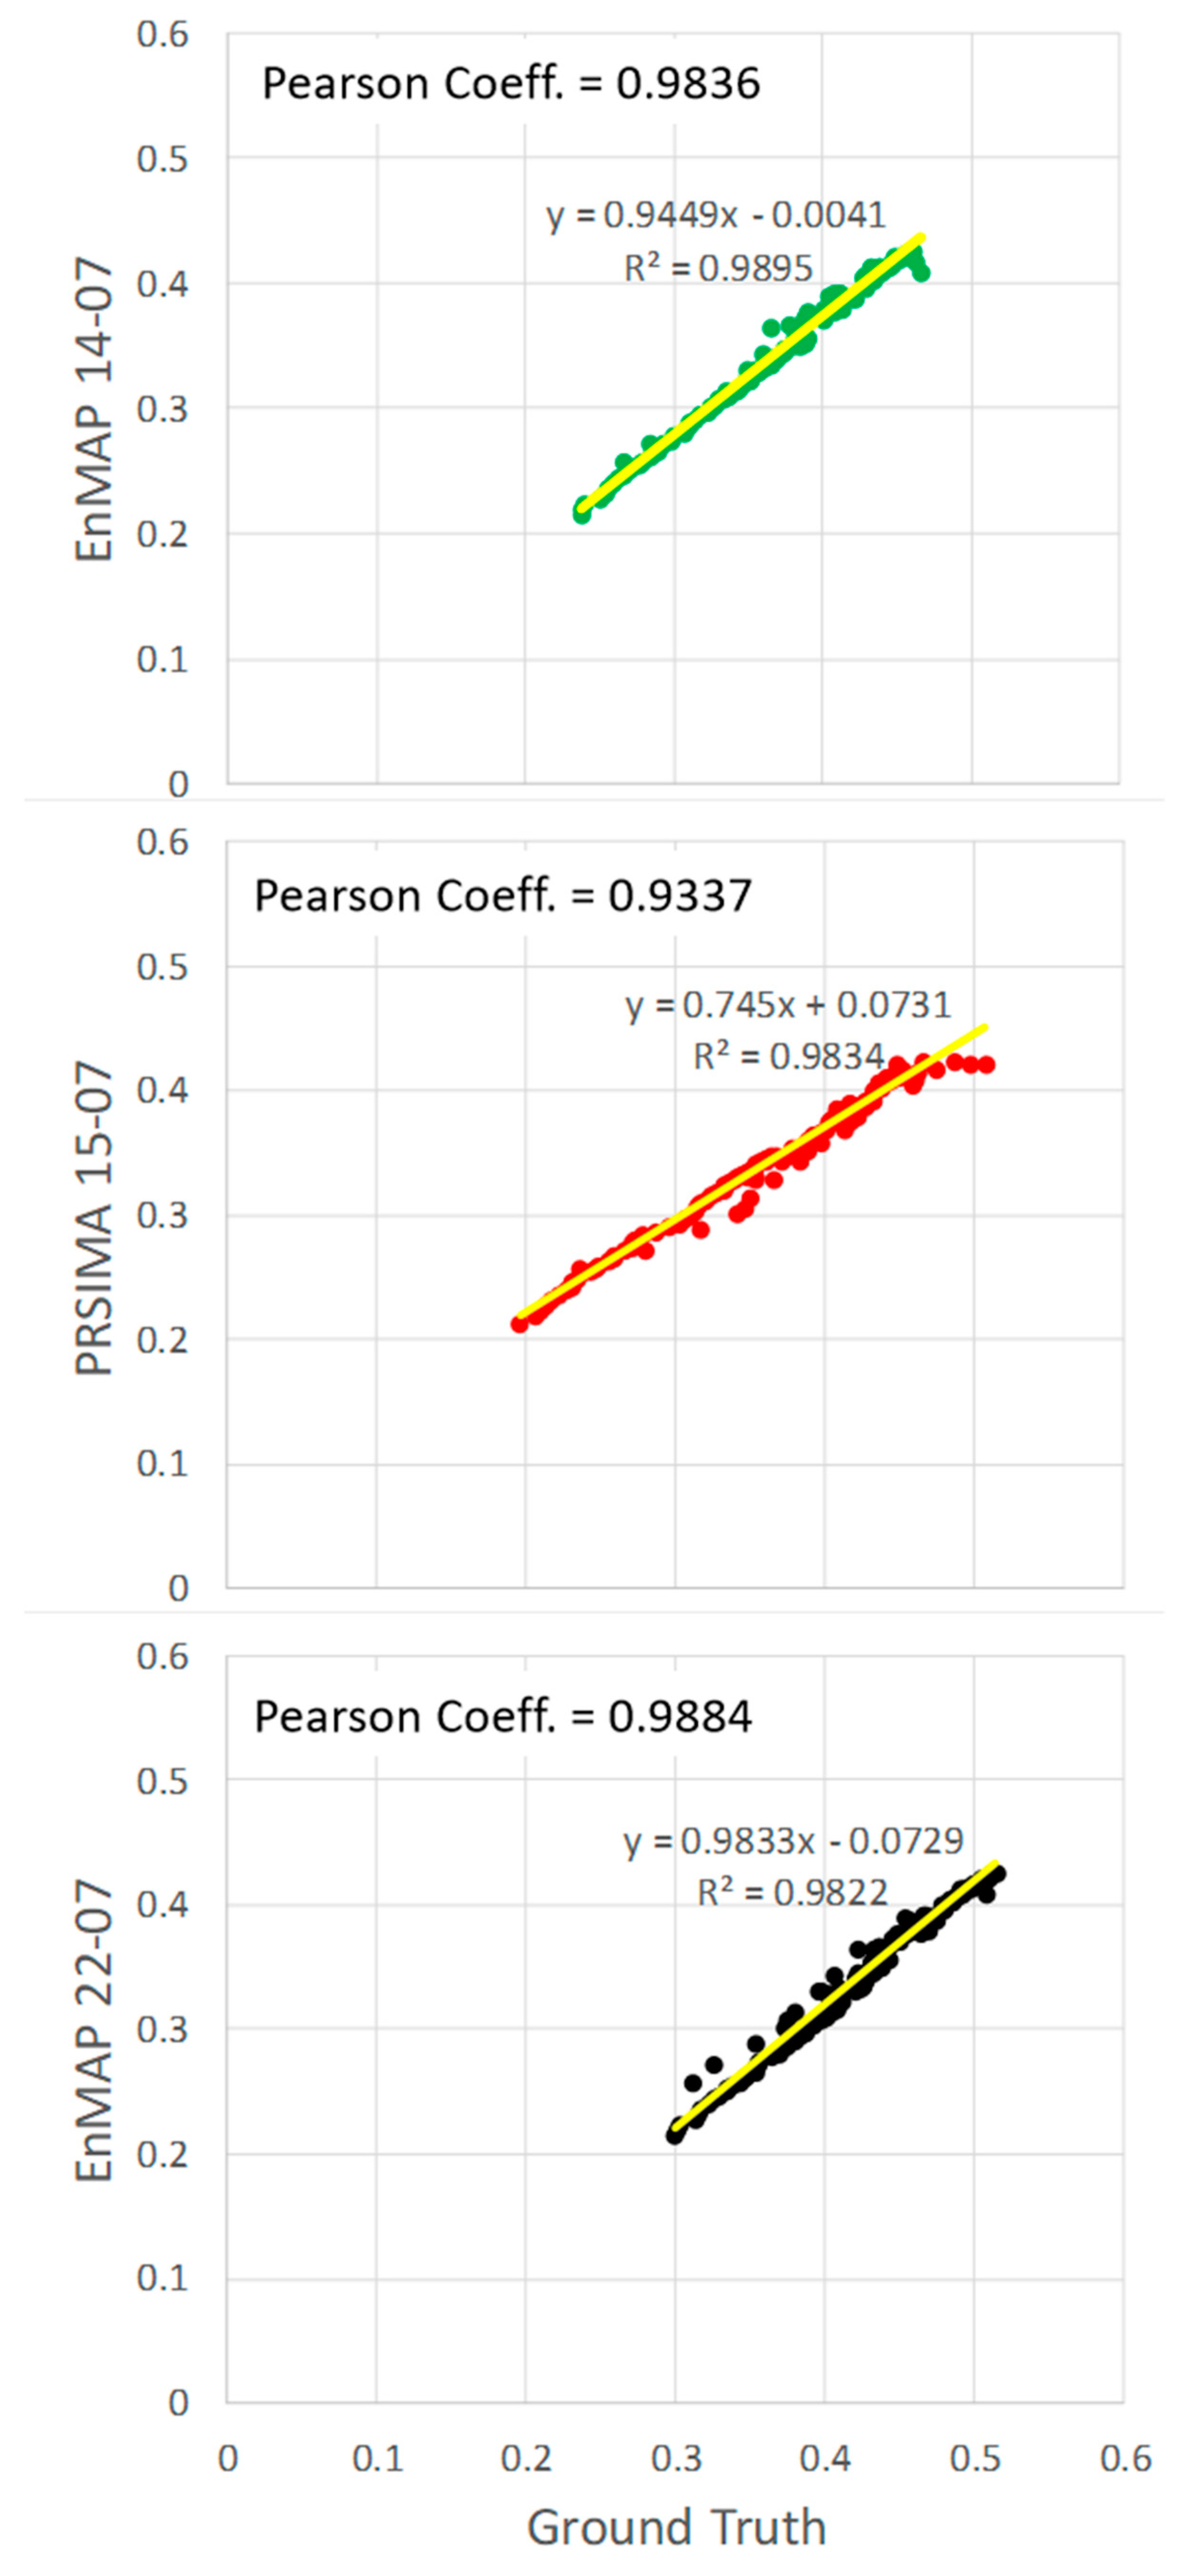
The DLR-EnMAP reflectance overestimates the ASI-PRISMA’s from 400 up to 1790 nm; the overall mean difference is about −0.0009 and is contained in the variability of the DLR-EnMAP values, corresponding to 0.044 (equivalent to 2 standard deviations). Despite the drop in the ASI-PRISMA SWIR signal due to the atmospheric correction procedure applied in the BOA-TOA passage, there is a relative overestimation of the ASI-PRISMA values between 2005 and 2445 nm. Therefore, the reflectance values are quantitatively compared by wavelength-pairing remote-sensed data with the ground truth using the above-mentioned statistical parameters. Scatter plots of the cross comparisons are reported in
Figure 7.
In the scatter plots of the satellite/ground truth reflectance values, the light yellow line indicates the regression line. The inset reports the Pearson coefficient and R
2 values. The resulting values of the Pearson coefficient and R
2 computed for each hyperspectral dataset with respect to the ground truth value are reported in
Table 7.
The Pearson correlation coefficient assesses the linear correlation between two variables, irrespective of scaling factors and offsets. With a value exceeding 0.8, indicating a highly significant correlation, it is noteworthy that all surface reflectance values derived from the various sensors exhibit a very strong correlation.
The most substantial correlations were observed for the DLR-EnMAP 22nd and DLR-EnMAP 14th data, registering at 0.9884 and 0.9836, respectively. Conversely, the weakest correlation (0.9337) was observed for the ASI-PRISMA on 15 July. The decreased correlation observed in the PRISMA data might stem from variations in behavior between the ground truth and BOA data within the visible spectrum range of 400–900 nm. Although the EnMAP reflectance values are higher than the ground truth, they exhibit a similar shape. In contrast, the PRISMA data tend to underestimate the ground truth within the 400–500 nm range and overestimate it within the 500–900 nm range and present a lower correlation due to the presence of an artifact near 1280 nm.
4. Conclusions
We used two types of satellite datasets to compare them with a reference dataset acquired ad hoc. The “Sale ’e Porcus” pond has been used as a reference site due to its suitable morphological and compositional characteristics. The standard reflectance products generated by the Italian and German Space agencies and the ground truth data acquired on the dried pond comprised the backbone of this paper. This comparison of surface reflectances derived from the ASI-PRISMA and DLR-EnMAP shows that the sensors have a very comparable response in terms of the measurements collected by independent instruments. These data have a high value to their correlation coefficient, as highlighted by the statistical indices adopted.
The considered test site is the “Sale ’e Porcus” pond (Sardinia, Italy), which is a flat and homogeneous area of about 3.5 km2. The site is located approximately at sea level, and due to its morphological and compositional characteristics it is suitable also for calibration purposes, as it is totally dried up for several months per year. The spectra profiles of the ASI-PRISMA and DLR-EnMAP’s TOA radiance were compared and the relevant BOA reflectances have been analyzed with respect to the local ground truth data collected on the pond.
The Pearson correlation coefficient is very high for the data from both the VNIR and SWIR spectral ranges. Lower R2 and Pearson coefficient values are attributed to the instruments’ response in the SWIR spectral range and to the capability of these instruments to resolve low reflectance values. Both remote-sensed data overestimated the SWIR response when compared with the ground truth. Among the satellites’ data, the DLR-EnMAP shows higher values with respect to the ASI-PRISMA for the full spectral range.
Apart from the SWIR region, the ground truth lies within or very close to the 14 July DLR-EnMAP and 15 July ASI-PRISMA data, with a variability of ±2σ (STDv) (
Figure 4). The agreement between the reflectance values estimated by the aGT and the entire EO dataset on the SPp, the selected ROI, was contained to a relative mean difference smaller than 0.12 (
Figure 5).
The timings of the satellite measurements are very close to each other, as are those of the ground truth data, which were acquired in a time window close to the satellite passages; this timing ensured very similar atmospheric conditions and no variations in surface conditions.
Finally, the FieldSpec measurements also confirmed the great quality of the ASI-PRISMA and DLR-EnMAP reflectance estimations. The difference between the remote-sensed data and the ground truth is about 0.05.
Although this work was not intended to evaluate the ASI and DLR sensors’ performances, this study highlights the necessity of enlarging this case study by following two main strategies: by enlarging the statistical population by using more remote-sensed data and increasing the statistical weight of the ground truth data and by applying a similar approach to different environmental conditions. Despite the authors’ belief that the SPp is suitable for CAL/VAL purposes, it is necessary to improve our knowledge of local characteristics, especially during the satellites’ passage.


 ,
, 


