
A Remote Sensing Approach to Estimating Cropland Sustainability in the Lateritic Red Soil Region of China

1
Land Engineering and Human Settlement Technology Innovation Center, Xi’an Jiaotong University, Xi’an 710049, China
2
State Key Laboratory of Efficient Utilization of Arid and Semi-Arid Arable Land in Northern China (the Institute of Agricultural Resources and Regional Planning, Chinese Academy of Agricultural Sciences), Beijing 100081, China
3
Aerospace Information Research Institute, Chinese Academy of Sciences, Beijing 100094, China
4
Piesat Information Technology Co., Ltd., Beijing 100195, China
*
Author to whom correspondence should be addressed.
Remote Sens. 2024, 16(6), 1069; https://doi.org/10.3390/rs16061069
Submission received: 22 November 2023
/
Revised: 29 February 2024
/
Accepted: 15 March 2024
/
Published: 18 March 2024
(This article belongs to the Special Issue Land Use Monitoring Based on Remote Sensing and Artificial Intelligence)
Abstract
:Spatiotemporal assessment and a comprehensive understanding of cropland sustainability are prerequisites for ensuring food security and promoting sustainable development. However, a remote sensing-based approach framework that is suitable for large-scale and high-precision assessment and can reflect the overall sustainability of cropland has not yet been developed. This study considered a typical lateritic red soil region of Guangdong Province, China, as an example. Cropland sustainability was examined from three aspects: natural capacity, management level, and food productivity. Ten typical indicators, including soil organic matter, pH, irrigation guarantee capability, multiple cropping index, and food productivity, among others, were constructed using remote sensing technology and selected to represent these three aspects. Based on the indicator system, we assessed the spatiotemporal patterns of cropland sustainability from 2010 to 2020. The results showed that the natural capacity, management level, and food productivity of cropland had improved over the 10 years. The cropland sustainability score increased from 67.95 to 69.08 over this period. The sustainability scores for 68.64% of cropland were increased and were largely distributed in the eastern and western region of the study area. The croplands with declining sustainability scores were mostly distributed in the central region. The prefecture-level regions differed in cropland sustainability, with Zhongshan, Zhuhai, and Qingyuan cities exhibiting the highest values, and Zhanjiang the lowest. Exploring the underlying mechanisms of cropland sustainability and proposing improvement measures can guide decision-making, cropland protection, and efficient utilization, especially in similar lateritic red soil regions of the world.
1. Introduction
Cropland, as the most important natural resource for agricultural production, forms the material basis for human survival and development [1,2]. Evaluating the sustainability of cropland is crucial to ensuring food security and achieving the UN Sustainable Development Goal: Zero Hunger. However, with the continuous growth of the global population and the rapid development of the social economy, the sustainable use of cropland in aspects such as soil quality and productivity are now seriously threatened [3,4]. Previous studies have shown that one-third of the cropland in China’s protected areas could be withdrawn due to inferior sustainability [5]. Thus, ways in which to improve cropland sustainability have attracted increasing attention. Evaluating cropland sustainability can provide stakeholders with useful decision-making information and provide a theoretical basis for sustainable utilization of cropland.
Cropland sustainability is a comprehensive and evolving concept [6]. Early cropland sustainability assessments focused on the productive capacity of cropland. For example, previous studies monitored the growth of crops at different growth stages and used the results to predict crop yields, thereby providing a basis for assessing cropland sustainability [7,8]. However, crop yield is only a limited representation of the productivity of cropland, and it is difficult to infer sustainability from only this aspect. Constructing an indicator system is also necessary for evaluating cropland sustainability [9,10,11]. In these studies, satellite remote sensing, ground sensors, and other technical means can be used to monitor dynamically and evaluate soil quality and the utilization capacity of cropland. However, these existing frameworks only focus on one or a few aspects of cropland sustainability, such as productivity [12,13] and soil quality [14,15]. As a semi-artificial and semi-natural ecosystem, cropland sustainability is a complex concept that combines natural conditions, management factors, the below-ground soil community, and above-ground crop growth [16]. Therefore, there is an urgent need for a cropland sustainability assessment framework that can reflect comprehensive information concerning the natural properties, field management, and crop production capacity.
Selecting reasonable evaluation indices and constructing an index system are the keys to evaluating cropland sustainability [17]. Many previous studies focused on exploring indices that can represent cropland soil quality such as soil fertility [18], soil pH [19], soil organic matter (SOM) [20], and other soil nutrient indicators [21]. Slope is also a key indicator of whether cropland is suitable for farming; when the slope exceeds 25 degrees, the cropland is unsuitable for food production [22,23]. Irrigation and drainage conditions are important indicators of the level of cropland management [24]. Land use intensity has often been used to characterize the ecological environment of cropland [25]. Crop yield, land economic benefits, and farmer income are normally used to reflect the socio-economic benefits of cropland [26]. Although existing studies have scientifically revealed several important factors influencing the sustainable use of cropland, such as natural conditions, soil fertility, and farmland productivity, a comprehensive assessment of cropland sustainability is still lacking and the acquisition of key indicators is often inefficient, especially at the regional scale.
At present, the evaluation methods for cropland sustainability include comprehensive index methods [10,17], pressure–state–response frameworks [27,28], remote sensing-based models [29,30,31], and fuzzy comprehensive evaluation models [32]. The comprehensive index method can evaluate cropland sustainability using multiple factors, and it is convenient to calculate and has strong applicability; however, it is easily affected by subjective factors [16]. Fuzzy comprehensive evaluation models have a multilevel comprehensive evaluation function, but the calculation process is complicated [33]. Pressure–state–response models can quantitatively evaluate cropland sustainability, but they lack mechanical rationality [27]. Remote sensing technology is a cost-effective, rapid, and reproducible method for providing quantitative and spatial distribution information on soil properties [34]. Studies have shown that soil attributes are affected by both time-invariant factors (such as soil type, topography, and slope) and time-variable factors such as precipitation, temperature, vegetation type, and tillage practices [35,36]. Remote sensing technology can be used to infer both invariant and variable factors. Previous studies emphasized that remote sensing technology can significantly improve the efficiency and accuracy of soil attribute estimation [37,38] and can overcome the influence of spatial variability of soil properties [39,40]. For example, a previous study selected 15 vegetation indexes to estimate the temporal and spatial changes in soil pH in typical black soil areas of northeast China [41]. An existing study selected 17 environmental covariates from the aspects of terrain, climate, soil type, land use, land cover, crop growth, and productivity to examine the spatial distribution of soil pH [42]. Most such studies only focused on the prediction of soil attributes of a single period in one area at a regional scale. Few studies have quantified the temporal variation of soil attributes in multiple cropland plots at regional scales through remote sensing.
Lateritic red soil is formed by rapid desilication and aluminum-enriching processes under the influence of the monsoon climate of South Asia. The soil is characterized by strong acidity, heavy viscosity, and low nutrient levels [43,44]. Lateritic red soil covers an area of more than 400,000 square kilometers globally and is primarily concentrated in China [45]. The lateritic red soil region is an important base for grain production in South China because of its superior hydrothermal conditions; the cropland sustainability of this area affects the survival and livelihoods of nearly 200 million people [46]. Improving the cropland sustainability of lateritic red soil is particularly crucial for increasing farmers’ incomes and ensuring food security. However, the cropland in a lateritic red soil region has not been researched in terms of sustainability.
This study considered the cropland in the lateritic red soil region of Guangdong, China, as the study area. A comprehensive cropland sustainability evaluation system was developed (ten typical indicators were selected from three aspects, including soil organic matter, pH, irrigation guarantee capability, utilization intensity, and food productivity), while remote sensing technology was adopted to quantify the spatiotemporal characteristics of cropland sustainability from 2010 to 2020. The purpose of this study was as follows: (1) to propose a universal assessment indicator system and a remote sensing-based framework for cropland sustainability in a lateritic red soil region; (2) to reveal the spatial differences in and temporal dynamics of changes in cropland sustainability in the lateritic red soil region of Guangdong Province over the past decade; (3) to provide a scientific basis for the sustainable development of cropland in a lateritic red soil region, ensuring the efficient use of cropland and increasing grain yield.
2. Materials and Methods
2.1. Study Area
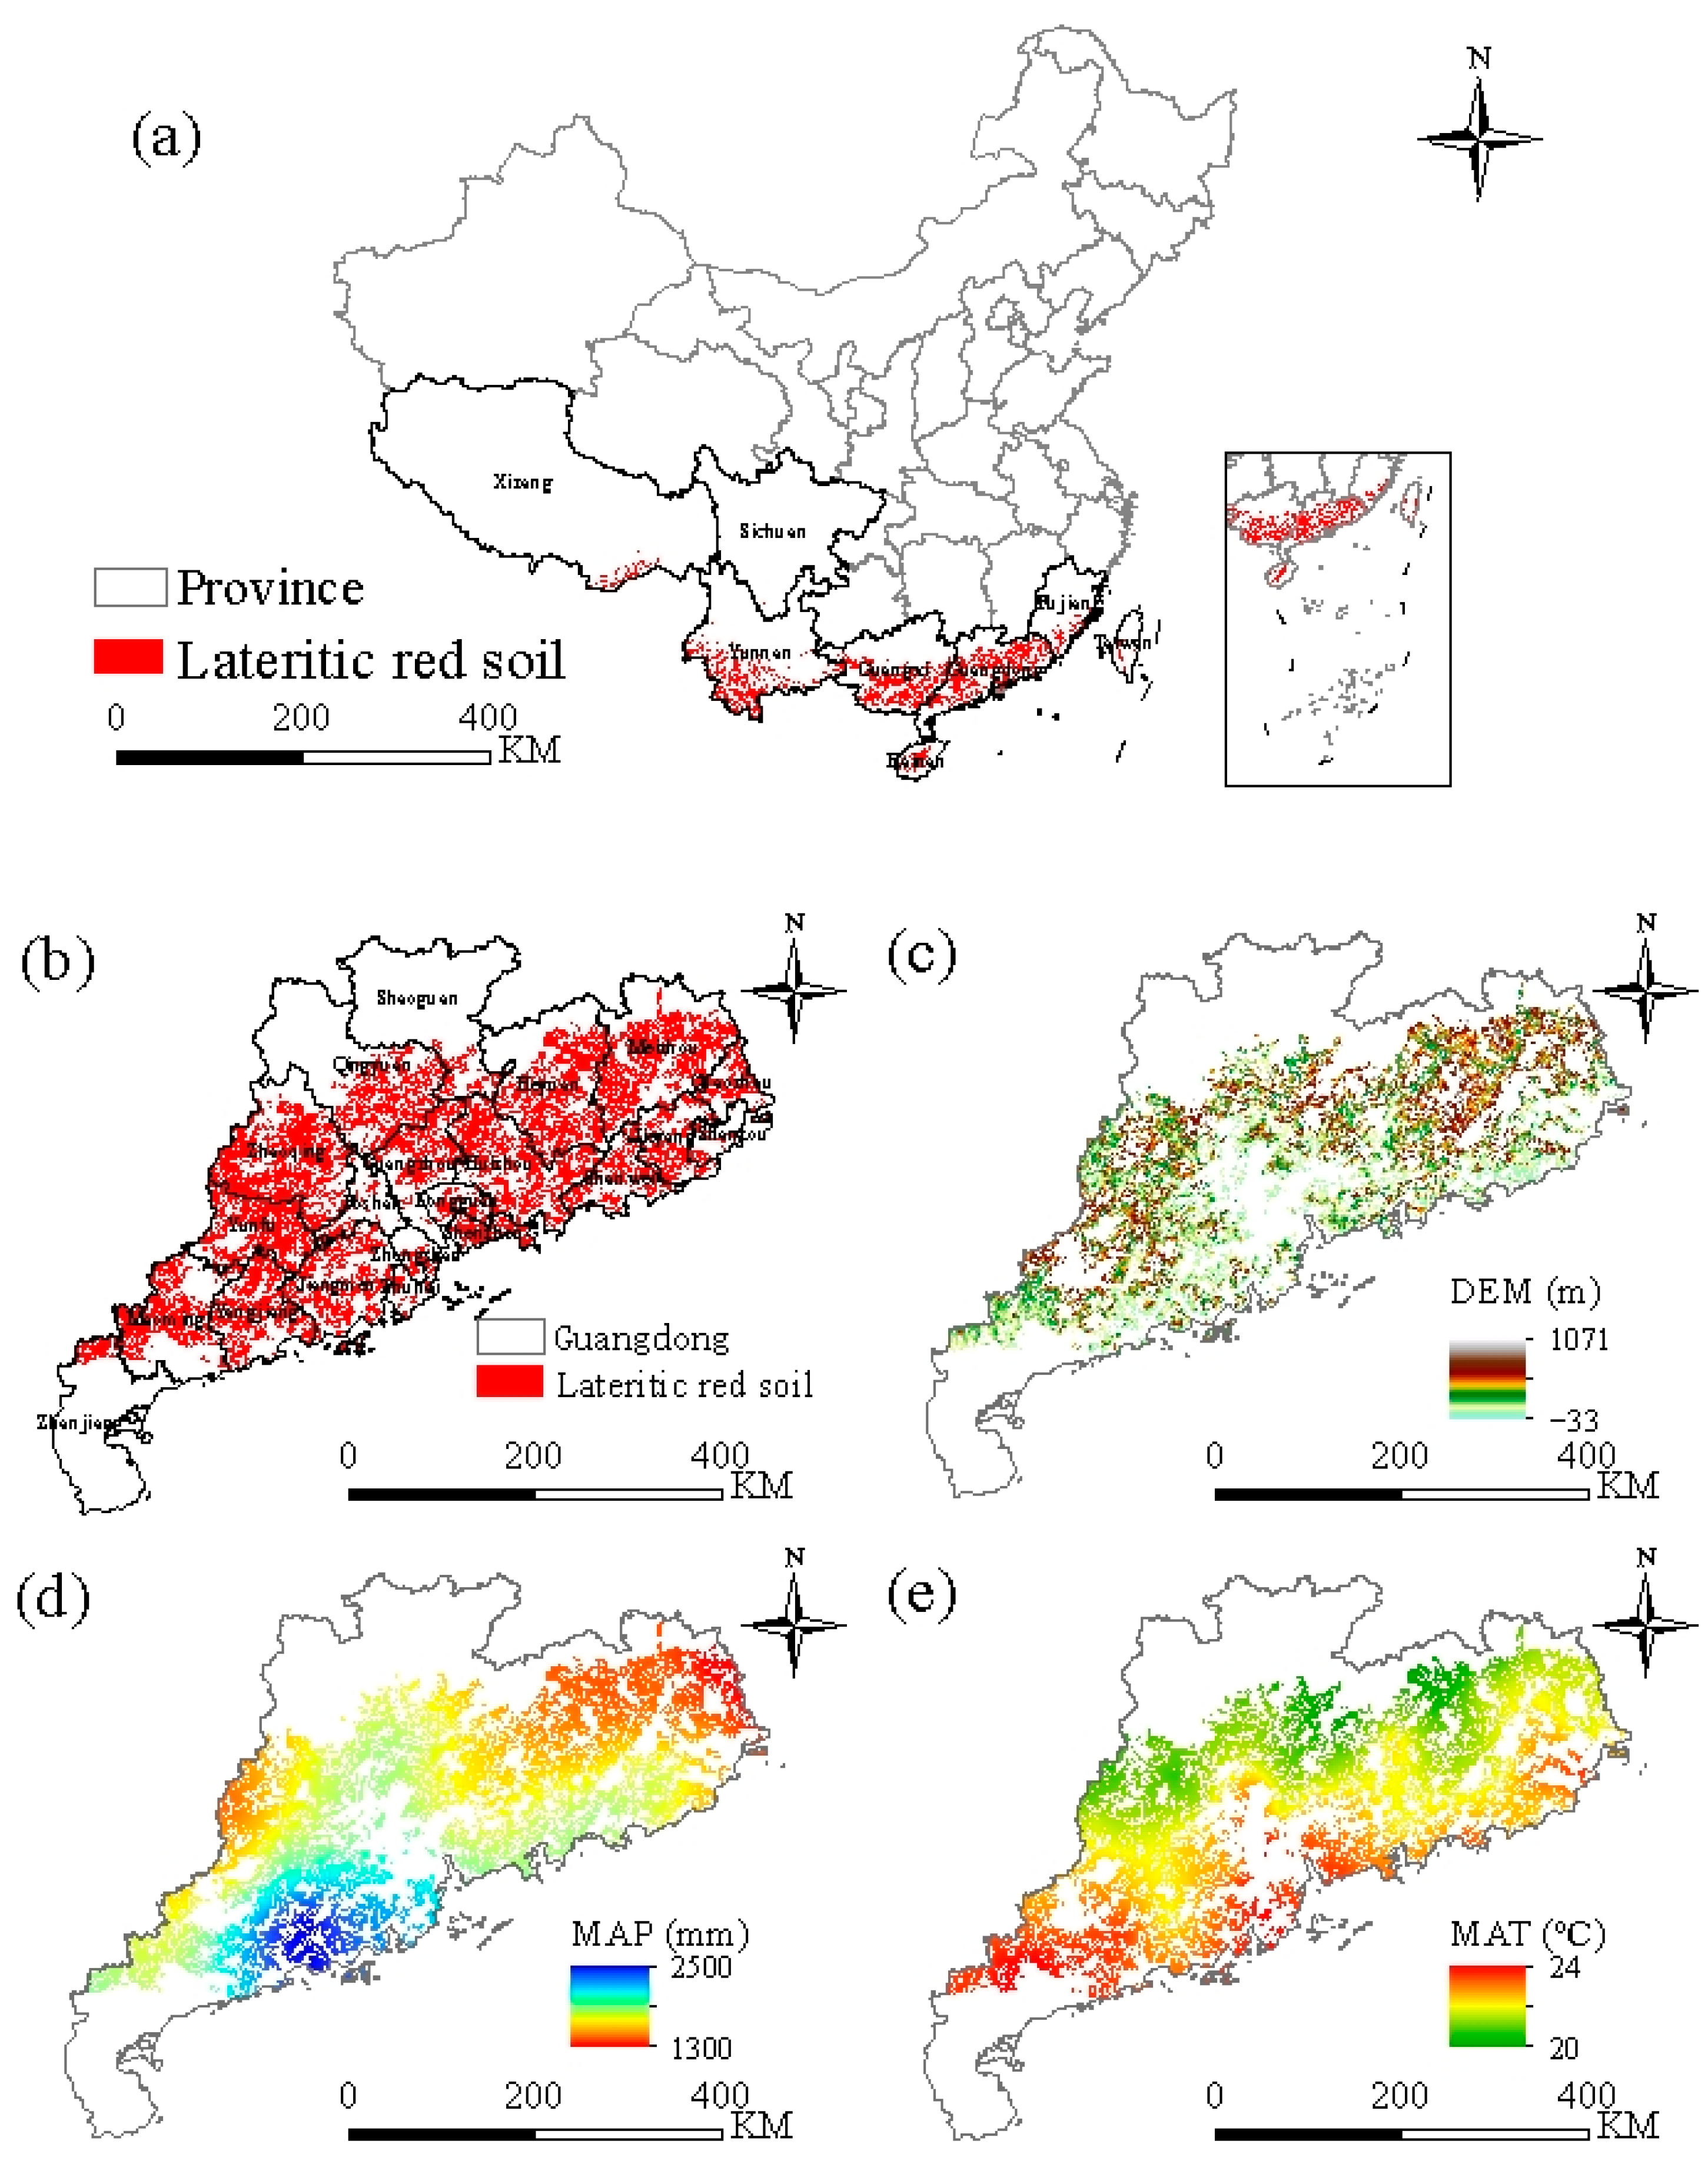
Lateritic red soil is distributed in Guangdong, Guangxi, Fujian, Yunnan, Hainan, and other southern region of China (Figure 1a). Guangdong Province has the largest area, accounting for 37% of the total lateritic red soil region in China [46]. Lateritic red soil is mainly distributed in the middle part of Guangdong province, which covers 21 prefecture-level cities and 76 counties (Figure 1b). The topographic characteristics of the lateritic red soil region in Guangdong Province are generally described as “high in the north and low in the south” (Figure 1c). The mean annual precipitation (MAP) is 1300–2500 mm (Figure 1d), and the mean annual temperature (MAT) is between 20 and 24 degrees (Figure 1e), making the area especially suitable for crop growth. As the main soil resource in Guangdong Province, lateritic red soil has strong potential for agricultural production. However, due to the continuous growth of the population, rapid development of the economy, and intensive farming, the sustainability of cropland in the lateritic red soil region of Guangdong Province is currently being threatened, leading to issues such as soil acidification, nutrient loss, and the thinning of soil layers [43,44]. Therefore, it is essential to evaluate the spatiotemporal patterns of cropland sustainability in a lateritic red soil region for managing and protecting local agricultural resources.
2.2. Data Collection
In this study, the spatial distribution data were derived from the China Land Use/Land Cover Remote Sensing Monitoring data (CNLUCC) for 2010 and 2020. The CNLUCC dataset is based on Landsat TM/ETM and Landsat OLI remote sensing images that are generated by artificial visual interpretation with a spatial resolution of 30 m. Based on the land cover classification system, the dataset includes six first-level types of cultivated land, forest land, grassland, water area, construction land, and unused land. To ensure the classification accuracy of the dataset, a random sampling verification method and the Kappa coefficient were used [47]. The dataset utilized in this research is known for its scientific classification system and high accuracy and has been widely used in scientific research [17]. In this study, the overall classification accuracy of the 2010 and 2020 classification datasets exceeded 90% [47]. The details concerning the data used in this study are shown in Table 1.
In this study, the spatial distribution of cropland in the lateritic red soil region of Guangdong province was extracted from the CNLUCC dataset. We used the MODIS Reprojection Tool to preprocess the MOD 09A1, MOD 16A2, and MOD 17A3 datasets to obtain band reflectance, evapotranspiration data, and net primary productivity (NPP), respectively. Using ArcGIS (version 10.6), the slope of the cropland was calculated based on the digital elevation model (DEM) data. Soil property data and the multiple-cropping index were extracted from the basic soil property dataset of high-resolution China soil information grids and the annual dynamic dataset of global cropping intensity, respectively. Fragstats (version 4.2) was used to calculate the centralized contiguity. In this study, the meteorological data were preprocessed using an outlier test, after which they were interpolated. To unify the evaluation unit, the spatial resolution of all data was resampled to 500 m × 500 m.
2.3. Methodological Framework for Cropland Sustainability
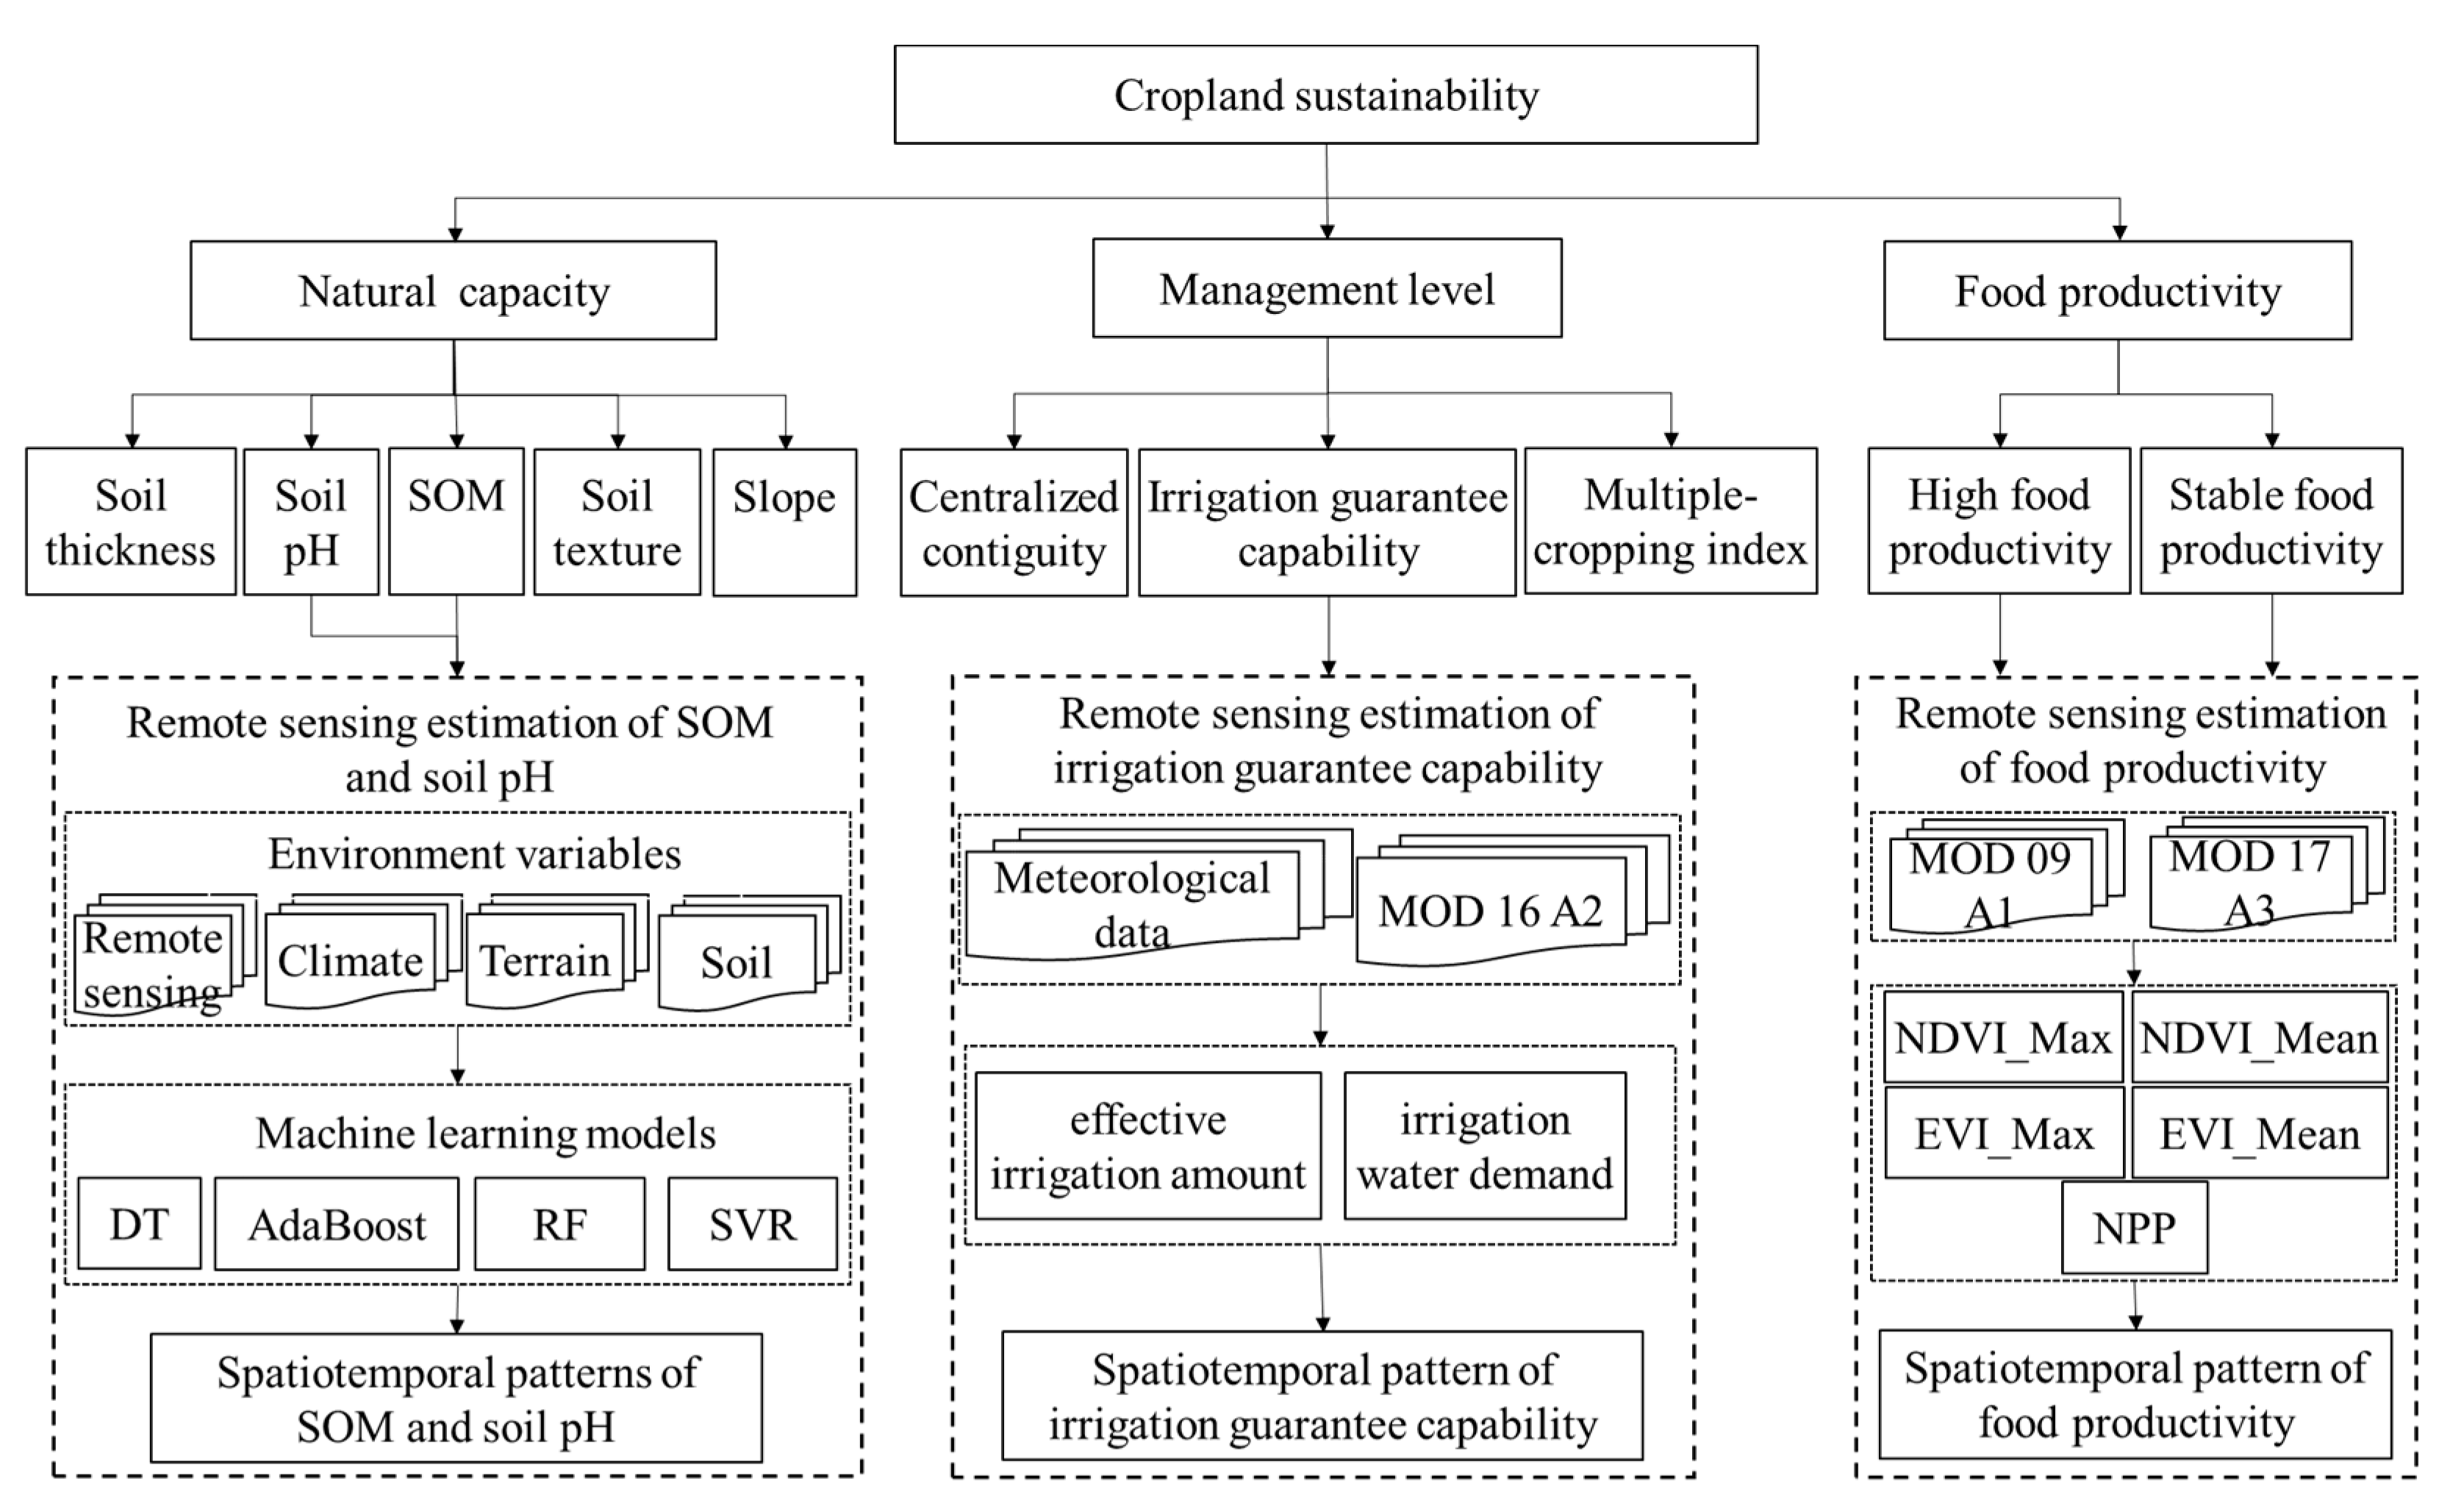
This study evaluated cropland sustainability from three aspects: natural capacity, management level, and food productivity (Figure 2).
Lateritic red soil is characterized by poor fertility, acidity, high viscosity, and a thick soil layer [43,44]. Therefore, SOM, soil pH, soil texture, and soil layer thickness were selected as indicators of the natural capacity of the cropland. SOM can affect the physical, chemical, and biological properties of soil, and thus is the core index for evaluating soil quality [48]. Soil pH is closely related to the availability of soil nutrients in cropland [49]. Soil texture is closely related to soil nutrient content, aeration, and water and fertilizer retention [50]. Soil thickness can affect the cultivability of cropland [51]. In addition, slope is closely related to soil erosion and affects the spatial differences in soil moisture and nutrients [23]. In this study, a higher SOM content, neutral soil pH, finer soil texture, deeper soil thickness, and lesser slope indicated a higher natural capacity of the cropland.
The management level of cropland was evaluated from three aspects: irrigation guarantee capability (IGC), centralized contiguity, and multiple-cropping index. The cropland in the lateritic red soil region consists primarily of paddy fields. Therefore, we selected the IGC as one of the indicators. The IGC represents the infrastructure level of the cropland. The stronger the IGC of cropland, the more advanced is its infrastructure. The cropland in a lateritic red soil region is usually fragmented, and small patches are often abandoned. Thus, the centralized contiguity was selected as one typical index to reflect cropland sustainability. The centralized contiguity is used to represent the degree of spatial aggregation of cropland. Centralized contiguity refers to whether cropland is contiguous and to what degree; a measure that can be calculated by Contig landscape indexes, i.e., indices that can effectively evaluate the spatial connectivity of target objects [52]. The Contig landscape index ranges from 0 to 1. The larger the Contig landscape index, the more concentrated and continuous the cropland. In a lateritic red soil region, cropland is often overutilized due to the favorable hydrothermal conditions. Multiple cropping indices can represent the utilization intensity of cropland [53]. The greater the multiple cropping index, the higher is the intensity of cropland utilization and the lower is the cropland sustainability.
Food productivity is the indicator most directly related to and reflective of cropland sustainability. Given the serious impact of natural disasters on grain production in the lateritic red soil region, high food productivity and stable food productivity were selected as key indicators for evaluating cropland sustainability. High food productivity refers to the average productivity in successive years. Stable food productivity was defined as the coefficient of variation (CV) of productivity in consecutive years. Larger values of highly stable food productivity indicate stronger overall food productivity of cropland.
The grading and scores of evaluation indicators are shown in Table 2. The analytic hierarchy process (AHP) was adopted to build an AHP model, and then the weight coefficients of the indices were calculated by the Delphi method. The results of the weight calculation should pass the consistency test (CR value < 0.1). SOM and soil pH were graded according to the six-level system of international unified classification [23,54]. The classification of surface soil texture was based on the Chinese soil texture classification standards. The grading of soil layer thickness, slope, and irrigation assurance ability referred to the national standard “Croplands Sustainability Grade (GBT33469—2016)”. The classification via the multiple cropping index was based on existing research results [54]. The classification and grading of the degree of concentrated contiguous land, high yield, and stable yield of cropland adopted the natural breakpoint method to minimize the differences within classes and maximize the differences between classes [55].
2.4. Cropland Sustainability Evaluation Based on Remote Sensing
2.4.1. Natural Capacity Evaluation Based on Remote Sensing
In this study, 34 environmental variables were selected from remote sensing, climate, terrain, and soil properties. Four machine learning models, decision tree (DT), adaptive enhanced decision tree (AdaBoost), random forest (RF), and support vector regression (SVR), were used to estimate SOM and soil pH. The feature relative importance of the selected explanatory variables was evaluated using the four machine learning models. According to the results, 15 environmental variables were identified as predictors of SOM and pH (Table 3). A grid search and cross-validation were used to calibrate the parameters of the four machine learning models. The parameter values of each model are shown in Table 4.
2.4.2. Management Level Evaluation Based on Remote Sensing
Based on MOD 16 A2 remote sensing evapotranspiration data and meteorological data, the effective irrigation amount (EIA), and the irrigation water demand (IWD) of cropland were calculated by the crop coefficient method and the Penman formula, respectively. The irrigation guarantee capability (IGC) can be used as an evaluation indicator. The calculation formula is as follows:
where IGC is the irrigation guarantee capacity of cropland; EIA is the EIA of cropland (mm); IWD is the irrigation water requirement of cropland (mm). The value of IGC is in the range of 0–1. The greater the IGC value, the stronger is the irrigation guarantee ability of cropland. When the EIA of cropland is equal to the irrigation water requirement, the IGC value is equal to 1, indicating full irrigation ability. When the EIA of cropland is equal to 0, the IGC value is equal to 0, indicating that the cropland has no irrigation capacity.
IGC = EIA/IWD
2.4.3. Food Productivity Evaluation Based on Remote Sensing
Vegetation indices can effectively characterize plant growth [56,57], and the spatiotemporal variation characteristics of cropland productivity can be determined by using long time series vegetation indexes [8]. Among these, NDVI, EVI, and NPP are the most commonly used indices [58,59].
The MOD 09 A1 surface reflectance data product was used to calculate NDVI and EVI, and then the annual maximum (NDVI_Max) and mean values (NDVI_Mean) of NDVI, the annual maximum (EVI_Max) and mean values (EVI_Mean) of EVI time series of cropland in the lateritic red soil region of Guangdong Province during 2008–2012 and 2018–2022 were calculated by the maximum synthesis method [12] and the average value method. In addition, based on the MOD 17 A3 remote sensing product data, the interannual NPP time series data of cropland in the lateritic red soil region of Guangdong Province for 2008–2012 and 2018–2022 were obtained. Then, the interannual time series data of NDVI_Max, NDVI_Mean, EVI_Max, EVI_Mean, and NPP of cropland in Guangdong Province after smoothing year by year were obtained by Savitzky–Golay filtering.
Linear regression [12] was used to construct a time series model between NDVI_Max, NDVI_Max, NDVI_Max, NDVI_Max, and NPP of cropland and the food production capacity based on provincial statistical data, and a spatial relationship model between these indicators and the ground measured yield data was constructed. According to the correlation test results, the cropland productivity evaluation indicators were screened for significant temporal and spatial relationships to facilitate the conversion of vegetation index values to cropland productivity. The strongest correlation was used to evaluate the cropland productivity of the lateritic red soil region in Guangdong Province in 2010 and 2020.
2.4.4. Comprehensive Index for Cropland Sustainability
The comprehensive index method was used to calculate sustainability. The method comprises three steps: (1) determining the weight coefficients of third-level indicators; (2) assigning values for the third-level indicators; (3) calculating the weighted sum of the third-level indicators. The calculation formula is as follows:
where CSS is the cropland sustainability score; Wi is the weight coefficient of the evaluation index; Si is the score of the evaluation index; n is the number of evaluation indicators. The value range of the cropland sustainability index is [0, 100]. The larger the index, the stronger is the cropland sustainability.
2.5. Accuracy Evaluation Method
In this study, the coefficient of determination (R2), the root mean square error (RMSE), and the mean absolute error (MAE) [15] were used to evaluate the accuracy of predictions for SOM and pH by the four machine learning models. The model with the highest prediction accuracy was selected to estimate the spatial distributions of SOM and pH in the cropland of the study area. The nearer the R2 value is to 1, the closer the RMSE and MAE values are to 0, indicating a higher prediction accuracy of the machine learning model.
Based on the calculated IGC values, this study first measured the IGC values of the measured cropland to determine the classification thresholds of different IGC levels and grade the IGC. In this study, user accuracy (UA), producer accuracy (PA), and overall accuracy (OA) [47] were used to evaluate the accuracy of remote sensing results of IGC of cropland. The closer the UA, PA, and OA values are to 1, the higher is the prediction accuracy of the machine learning model.
3. Results
3.1. Accuracy Verification of Cropland Sustainability Indicators
3.1.1. Accuracy Verification of SOM and Soil pH
The performance results of the four machine learning models for predicting SOM and soil pH are shown in Table 5. The RF model showed the largest R2 value and the smallest RMSE and MAE values. The R2 value of the AdaBoost model was also high, greater than 0.6, while the R2 value of the DT model was the lowest. Overall, the RF model could predict the spatiotemporal patterns of SOM and soil pH in the study area more accurately.
3.1.2. Accuracy Verification of IGC
The confusion matrix results of the IGC remote sensing evaluation are listed in Table 6. In terms of UA and PA, the accuracy result of “fully satisfied” was the highest, while the accuracy result of “basically satisfied” was the lowest. The OA of IGC between the remote sensing evaluation and the ground measurement results was 0.75. Overall, the evaluation results of cropland IGC calculated by MOD16A2 remote sensing evapotranspiration data and meteorological data were reliable.
3.1.3. Accuracy Verification of Food Productivity
The correlations between the annual maximum and mean values of NDVI and the annual maximum and mean values of EVI, NPP, and food production capacity are shown in Table 7. The annual mean of EVI had a strong temporal correlation with statistical food yield (R2 = 0.60) and had the strongest spatial correlation with measured food yield (R2 = 0.58), and thus the annual mean of EVI was adopted to reflect food productivity. The annual mean of EVI for five consecutive years was used to characterize the high food productivity of cropland, and the CV of the annual mean of EVI for five consecutive years was used to characterize the stable food productivity of cropland.
3.2. Spatial Patterns of Cropland Sustainability in the Lateritic Red Soil Region of Guangdong
3.2.1. Spatial Heterogeneity of Cropland Sustainability
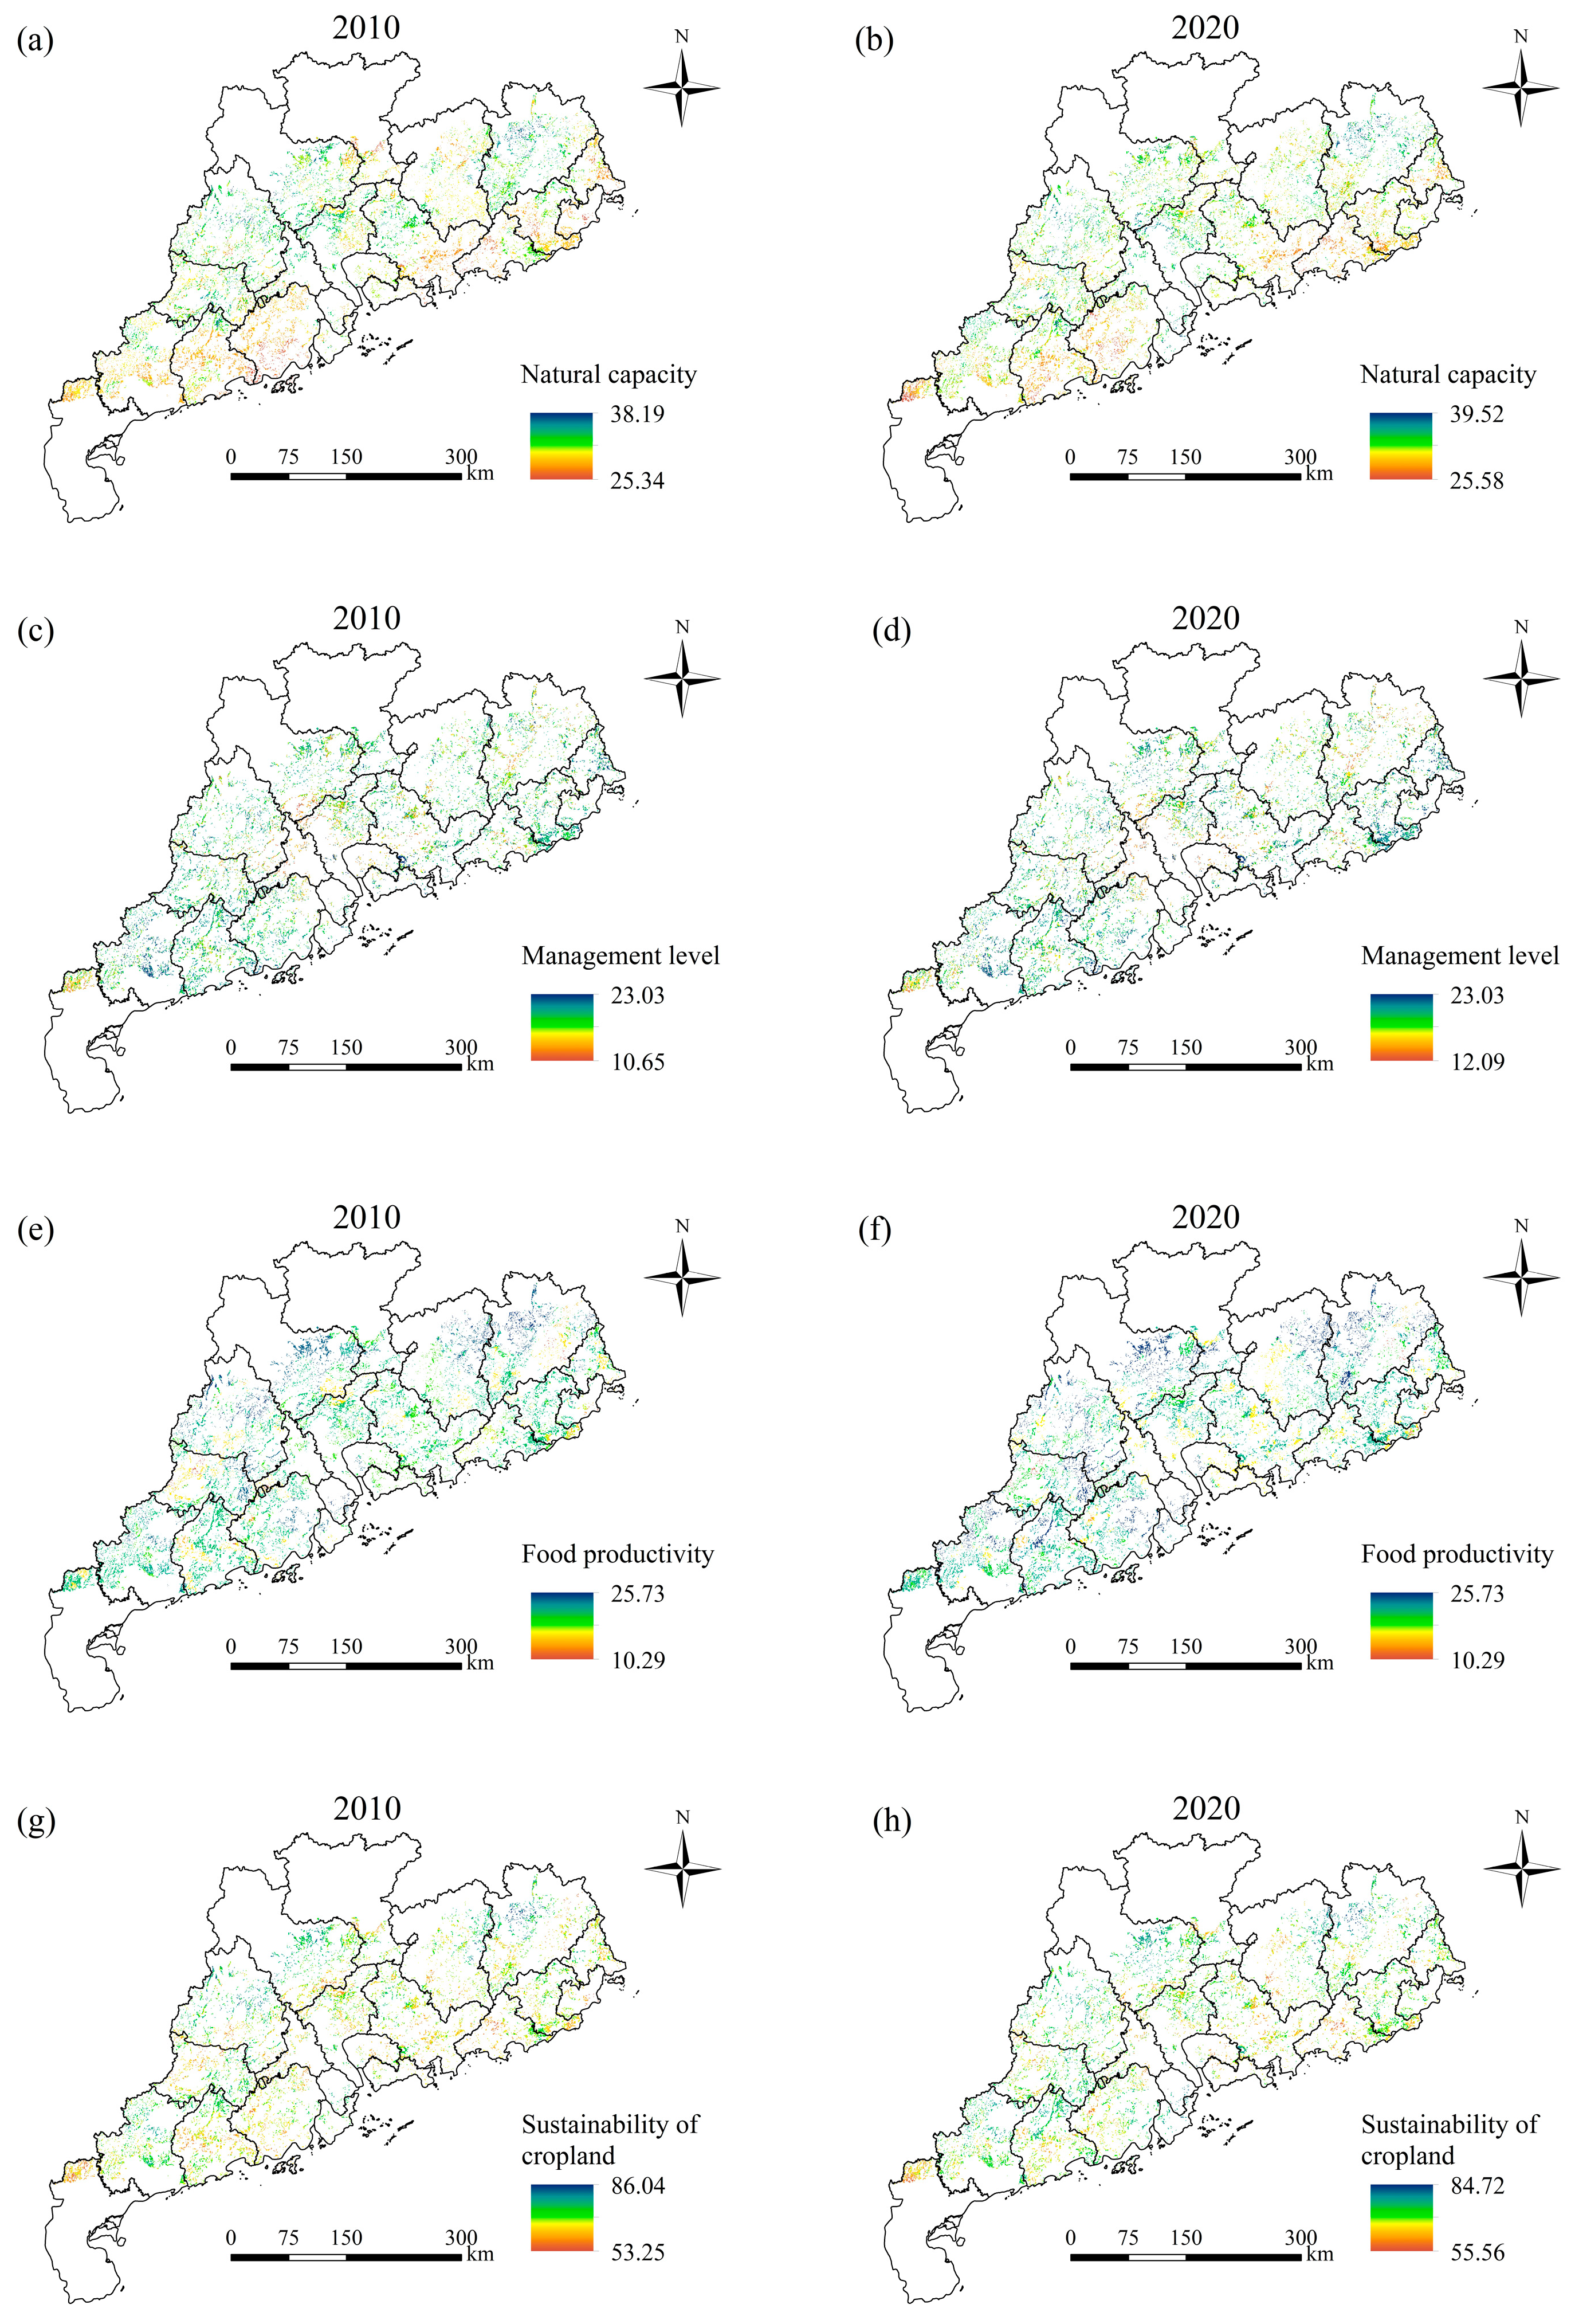
There was a clear change trend in cropland sustainability from 2010 to 2020. The scores for the natural capacity of cropland increased from 30.58 to 31.02. The spatial patterns of the natural capacity of cropland were consistent. The natural capacity of cropland in the northern region was high, while that of cropland in the southern and western region was low (Figure 3a,b). The score for the management level of cropland increased from 18.08 to 18.68. The management level of cropland in the east and west was high, while the management level in the central area was low (Figure 3c,d). The score for food productivity of cropland increased from 19.32 to 19.43; it was high in the eastern and western region, but low in the central region (Figure 3e,f). The score for cropland sustainability increased over the 10 years, from 67.95 to 69.08. Cropland sustainability in the east and northwest was high while being low in the central region (Figure 3g,h).
3.2.2. Cropland Sustainability in Different Prefecture-Level Regions
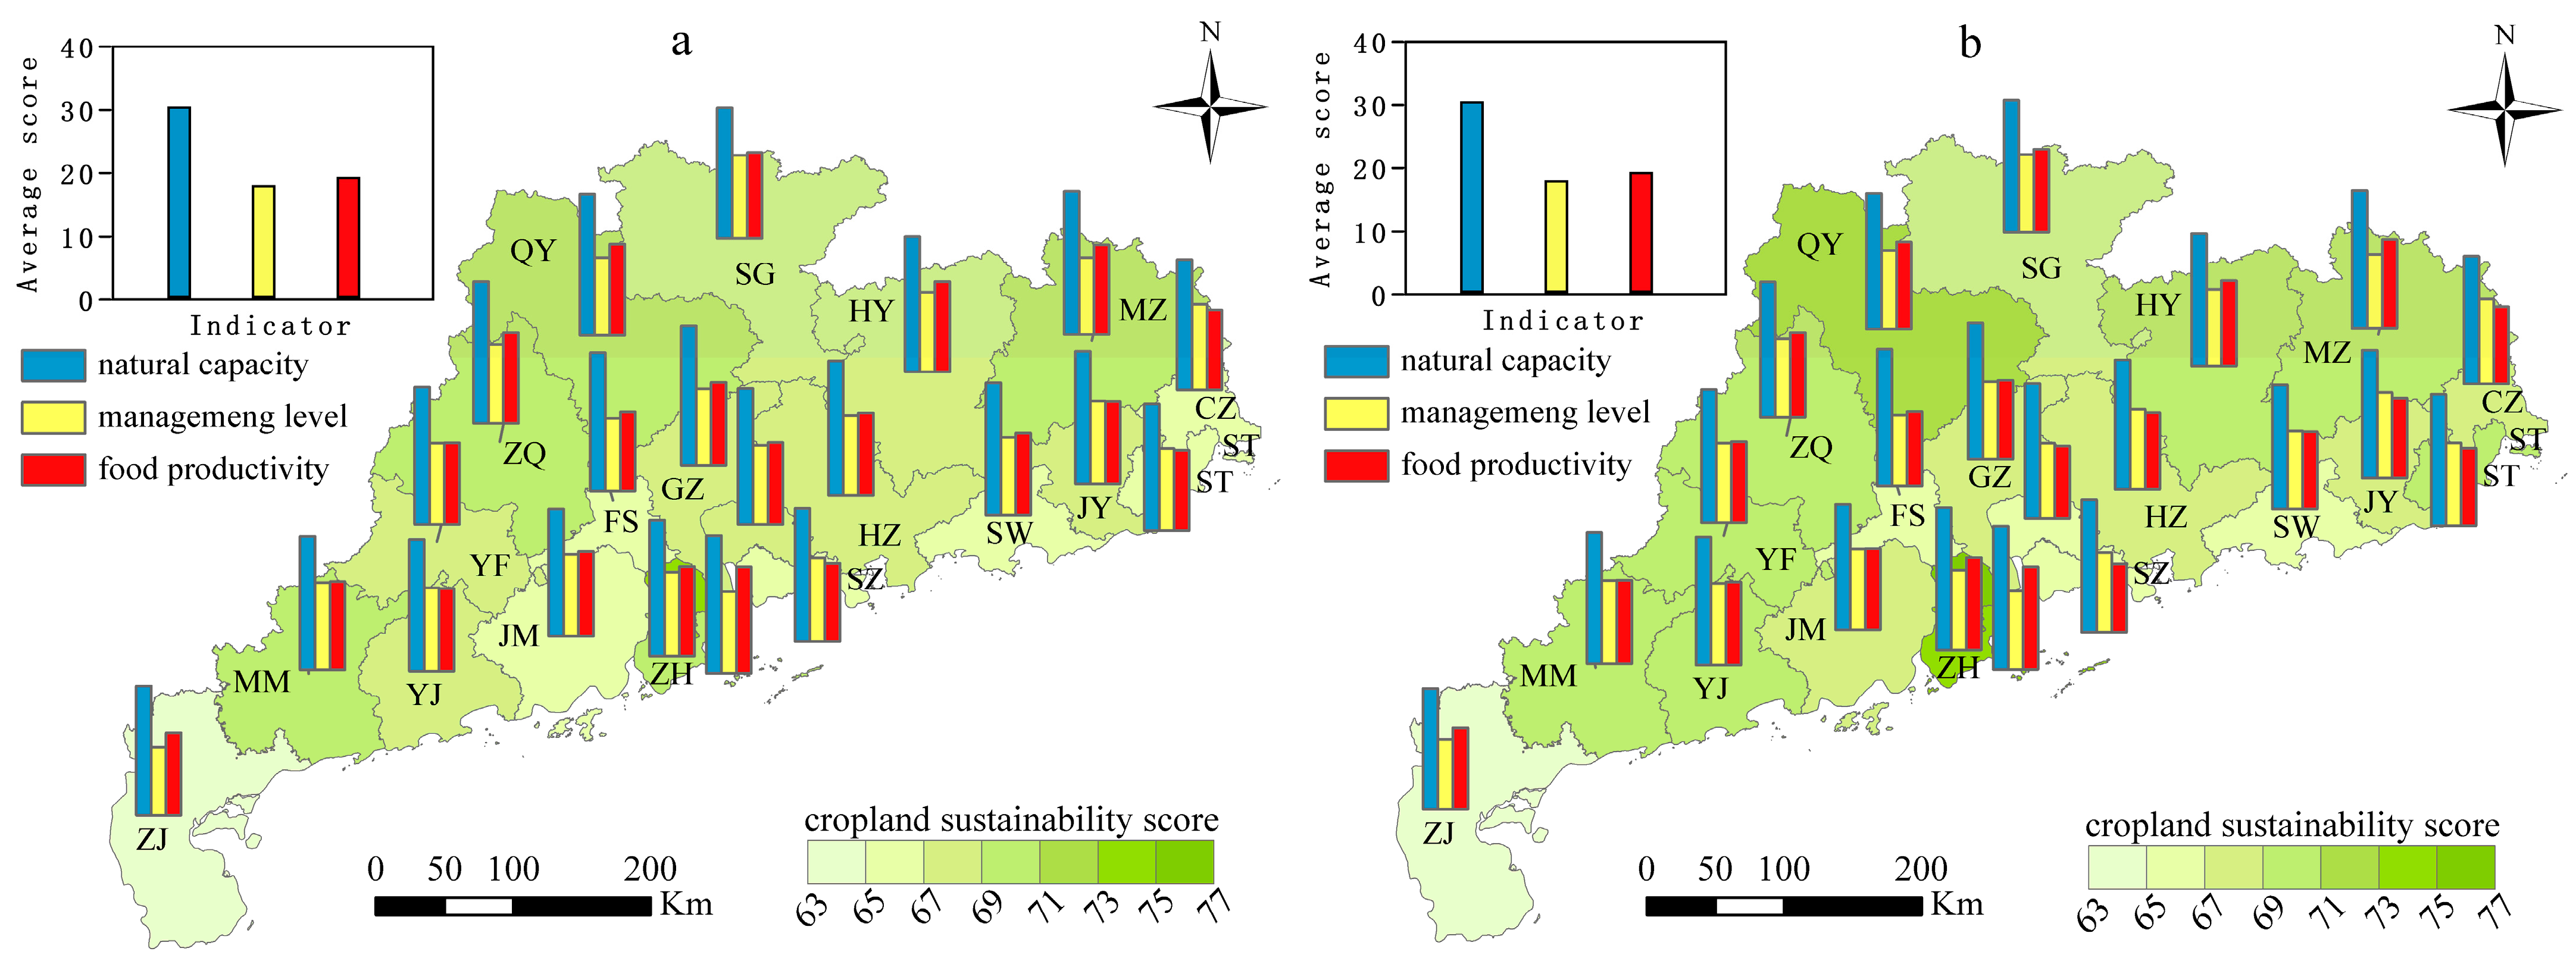
There were differences in cropland sustainability among prefecture-level regions. The score for the natural capacity of cropland in MZ was high, while those in JM and ST were low in 2010. In 2020, the scores for the natural capacity of cropland in ZS and ZH were high, while that of cropland in ZJ was low. In 2010 and 2020, the scores for the management levels were high in CZ, but low in FS and ZJ; the score for food productivity in ZS was higher than that in other regions, and in ZJ was the lowest. The scores for sustainability were highest in ZS and lowest in ZJ (Figure 4a,b).
3.3. Temporal Dynamics of Cropland Sustainability in the Lateritic Red Soil Region of Guangdong
3.3.1. Dynamic Changes in Cropland Sustainability from 2010 to 2020
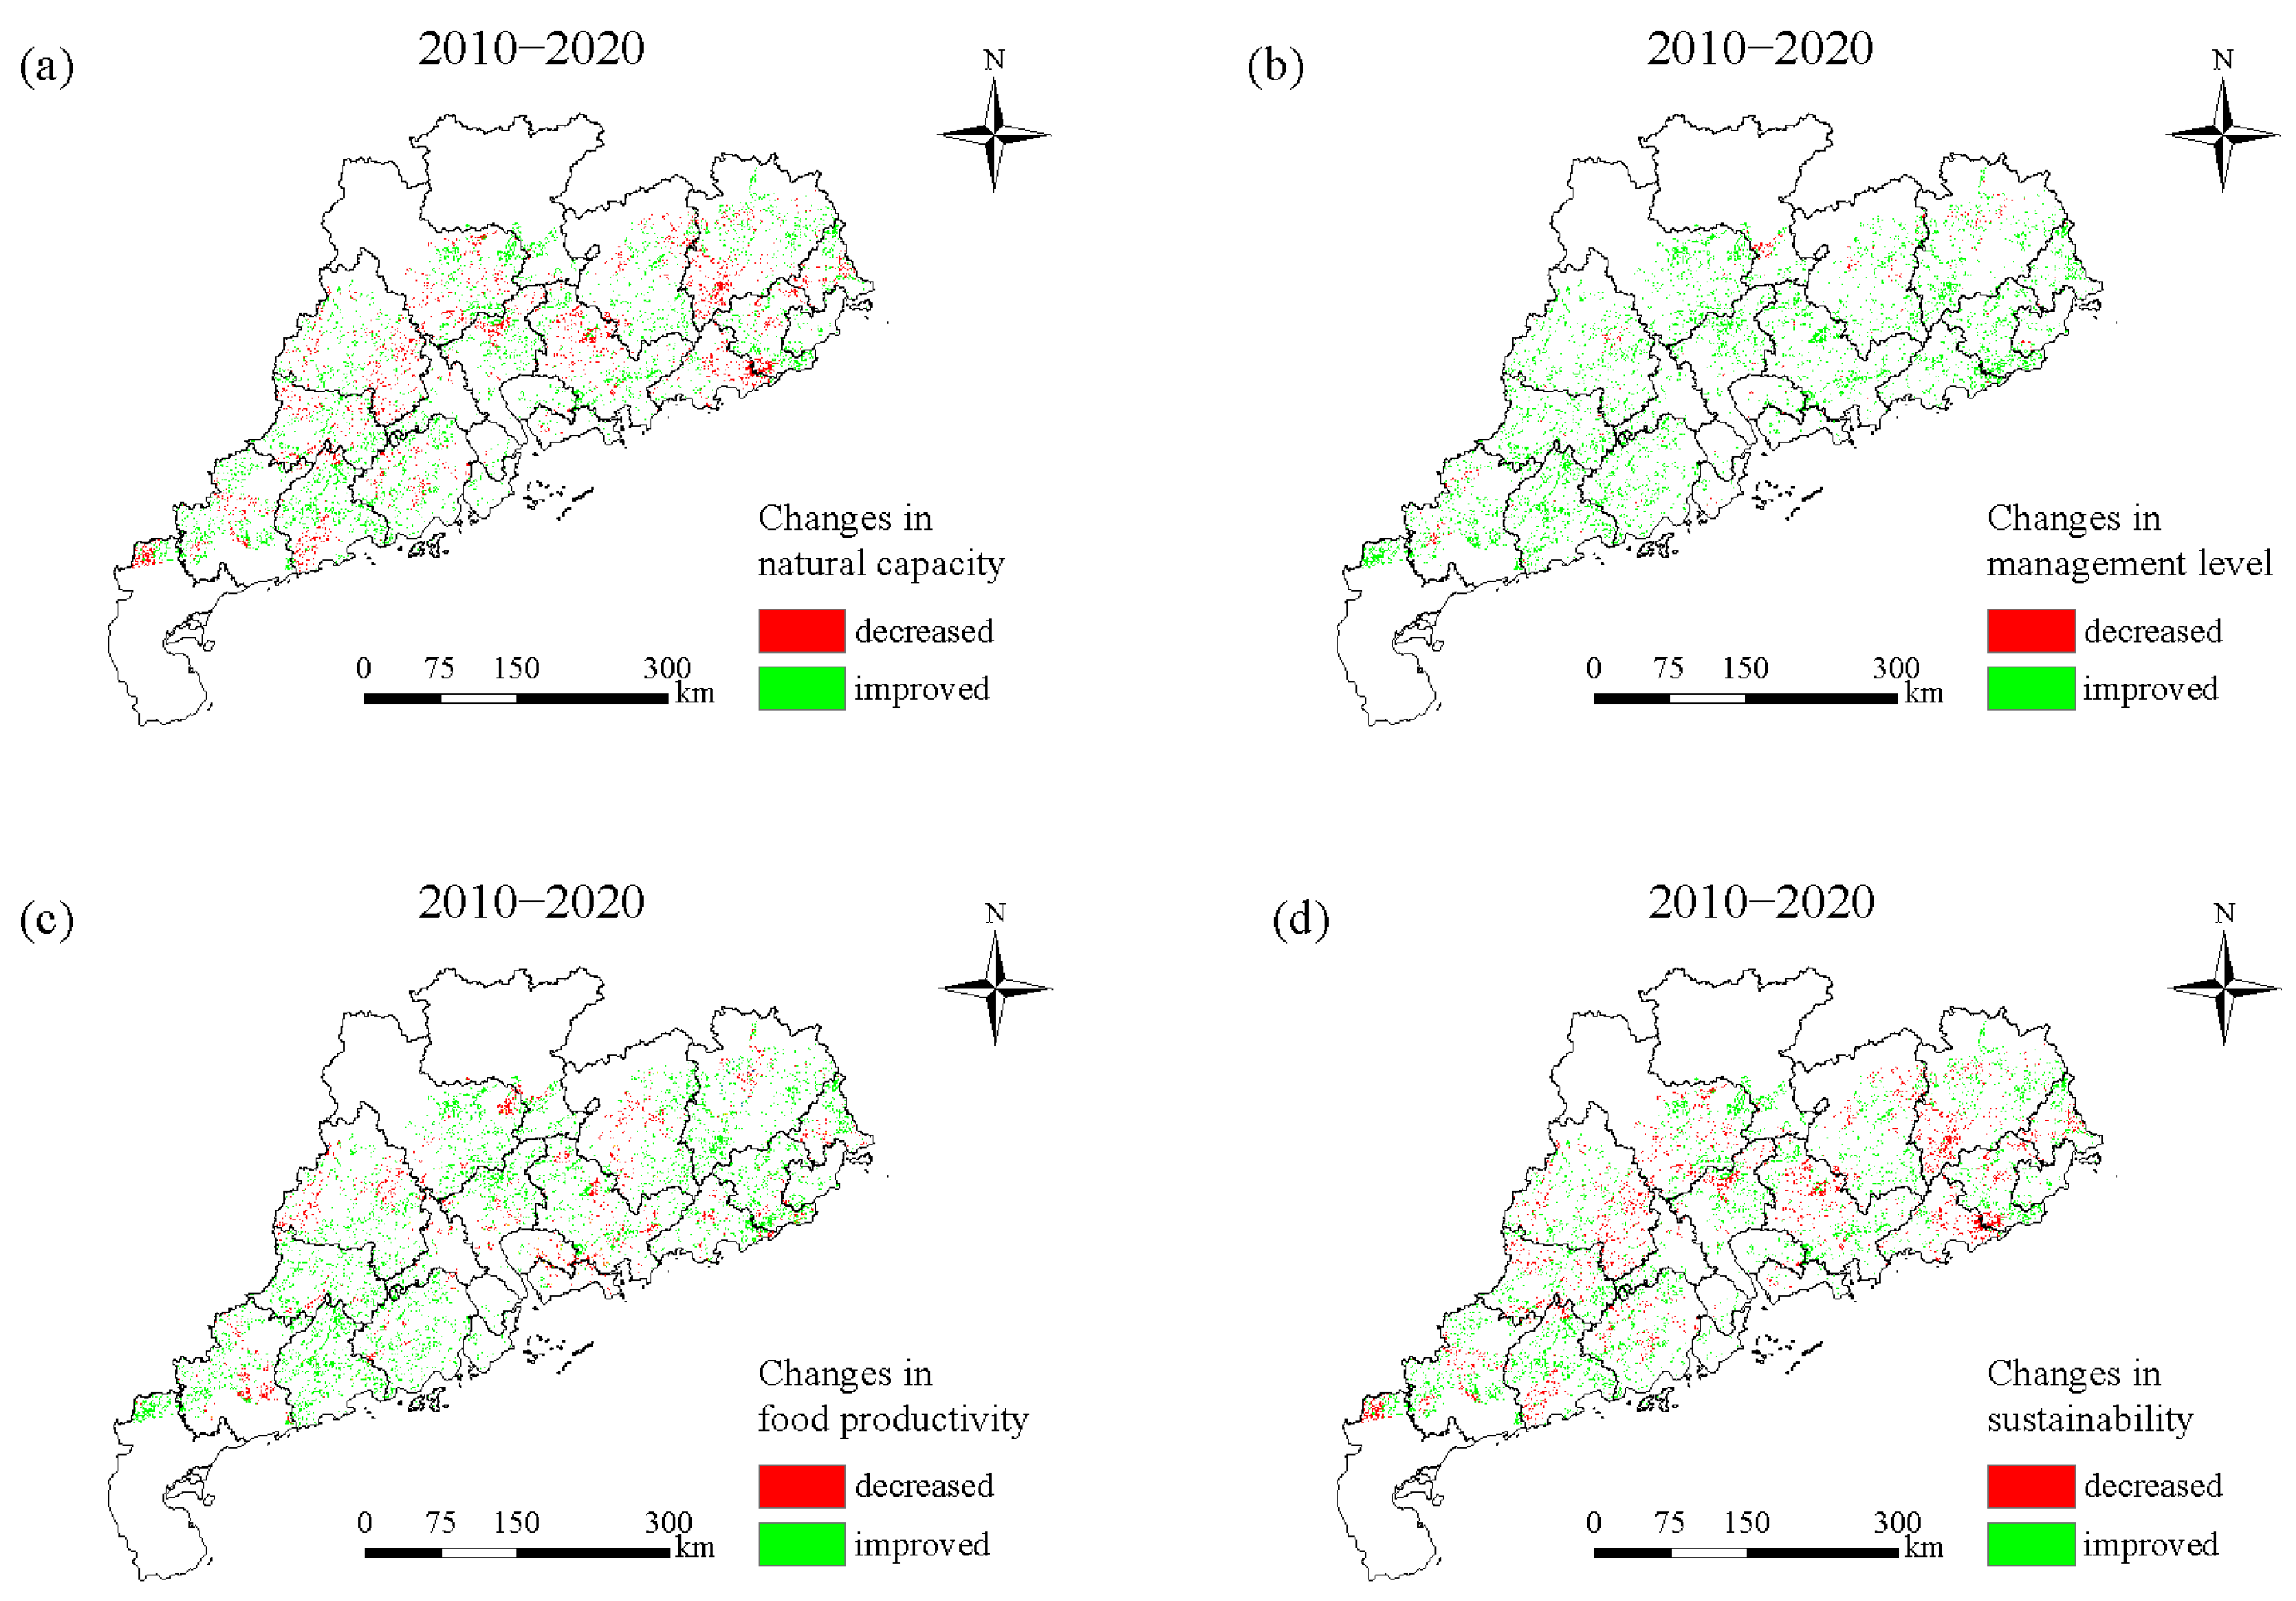
The natural capacity of 62.13% of cropland increased in 2020 compared with 2010 and was widely distributed throughout the study area. The natural capacity of 37.87% of cropland decreased, largely in the eastern and northern regions (Figure 5a). There was an improvement in the management level of 95.21% of cropland (Figure 5b). The food productivity of 79.20% of cropland improved, generally in the eastern and western regions. The food productivity of 20.80% of cropland declined, primarily in the central region (Figure 5c). The sustainability of 68.64% of cropland improved, being largely distributed in the eastern and western parts of Guangdong Province. The sustainability of 31.36% of cropland declined, mainly in the central region (Figure 5d).
3.3.2. Changes in Cropland Sustainability in Different Prefecture-Level Regions
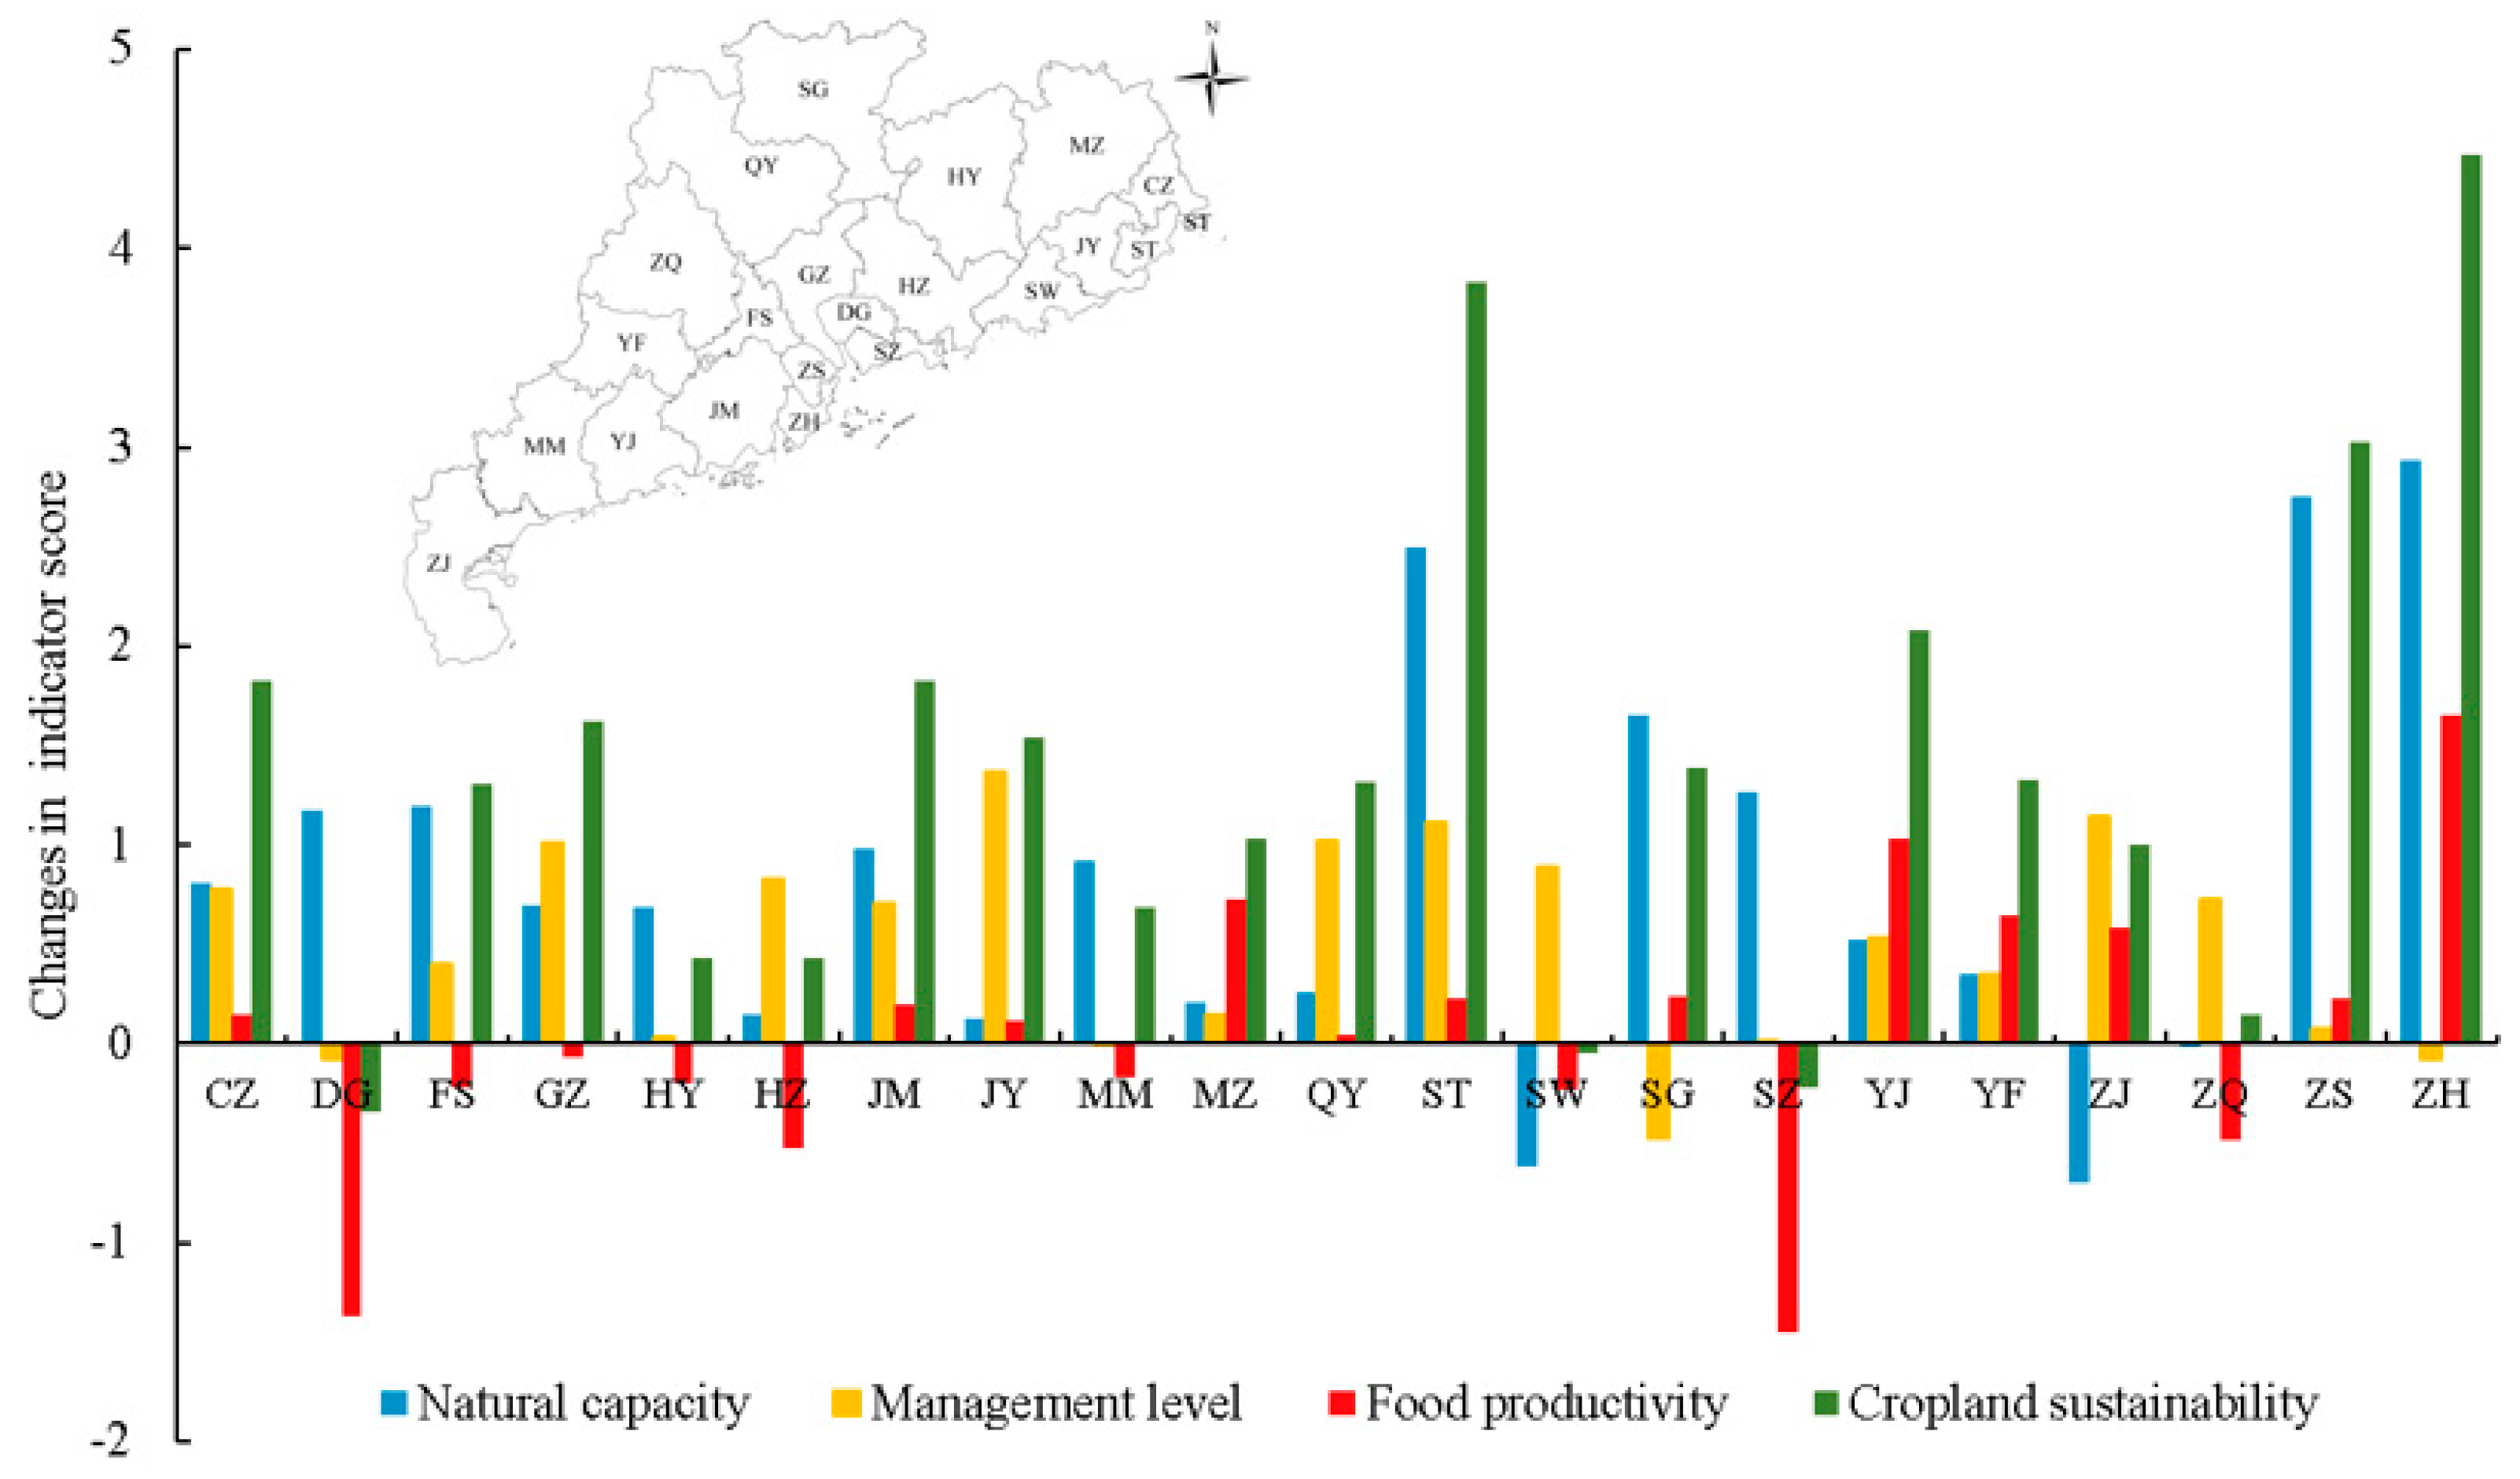
Figure 6 shows the changes in cropland sustainability in different prefecture-level regions between 2010 and 2020. The natural capacity of cropland in ZH, ZS, ST, SG, SZ, and FS significantly increased while slightly decreasing in the ZQ, SW, and ZJ regions. The management level cropland in JY, ZJ, ST, QY, and GZ improved significantly while declining slightly in the MM, ZH, DG, and SG regions. The food productivity of cropland in ZH and YJ improved significantly while declining in SZ and DG. Cropland sustainability improved significantly in the ZH, ST, ZS, and YJ regions while declining in the DG, SZ, and SW regions.
4. Discussion
4.1. Constructing Comprehensive Evaluation Indicators for Cropland Sustainability via Remote Sensing
A comprehensive and efficient assessment framework is the key to determining the spatiotemporal patterns of farmland sustainability. However, previous studies focused on soil quality [14,15], natural conditions [51], or the productivity of cropland [9,12], ignoring other factors such as cropland management. In this study, according to the typical characteristics of lateritic red soil such as low nutrient levels, strong acidity, high viscosity, and a thick soil layer, 10 key indicators, including SOM, soil pH, soil texture, and soil layer thickness, were selected from three aspects—natural capacity, management level, and food productivity—to characterize the sustainability of cropland. The evaluation framework proposed can reflect the sustainability of cropland. The results can aid efforts to improve soil quality and increase food productivity in the lateritic red soil region.
Traditional cropland sustainability evaluation methods tend to over-rely on ground-measured soil data, a process that is time-consuming and labor-intensive and is not suitable for a regional scale [32,60]. Remote sensing technology can improve the efficiency and accuracy of cropland sustainability assessment, especially at large regional scales [17]. However, previous studies focused on monitoring cropland soil fertility or productivity based on remote sensing images [10,11,12] but the advantages of multi-source remote sensing data have not yet been fully exploited. In this study, multi-source remote sensing data, including MOD 09A1, MOD16A2, and MOD17A combined with ground monitoring site data, soil attribute data, and meteorological data, were used to estimate key indicators of cropland sustainability at a regional scale. The analysis revealed the spatiotemporal pattern of cropland sustainability in the lateritic red soil region of Guangdong Province.
The comprehensive index method is often used in the evaluation of indicators, as it can consider multiple indicators or factors to reflect various aspects of a situation [16,49]. By adding the weights of different indicators, a more comprehensive evaluation result can be obtained, avoiding the possible one-sidedness or bias of a single indicator [30,61]. In this study, the weight coefficient of each evaluation index was determined by the expert scoring method and AHP, and thus a more comprehensive index of cropland sustainability in the lateritic red soil region was obtained. The results of this study were consistent with those of existing studies, indicating that the proposed cropland sustainability assessment system was reasonable and feasible; the methodology framework was reliable, and the evaluation results were accurate.
4.2. Underlying Mechanisms of Cropland Sustainability in Lateritic Red Soil Region
Compared with other soil types, lateritic red soil has apparent differences in formation conditions, nutrient content, soil pH, water regulation, and agricultural adaptability [45]. Understanding these differences is key to the rational use of lateritic red soil resources and increasing cropland sustainability. The factors influencing cropland sustainability in a lateritic red soil region are complex, and include soil quality, rational use, economic input, and support of cropland protection policies [62]. Previous studies found that soil fertility and natural conditions in the lateritic red soil region of Guangdong Province had gradually improved [17]. In recent years, Guangdong Province has implemented land improvement projects that have improved the cultivability of cropland and promoted natural conditions of cropland.
Improved management has also contributed to improved cropland sustainability. Optimizing crop planting layout and appropriate land use intensity are potential driving factors for improving cropland sustainability (http://g.mnr.gov.cn/ 20 July 2023). The continuous improvement of road accessibility, irrigation and drainage facilities, and centralized contiguous land has resulted in the improvement of cultivated land quality in the red soil region [17]. Previous studies found that the multiple cropping index of cropland in the lateritic red soil region decreased significantly from 2010 to 2019 [53], indicating that the intensity of cropland use (and thus the potential for sustainable development) had increased.
Social and economic development have also improved cropland sustainability [63]. Economic growth allows the government to have more funds for implementing cropland protection systems and improving the cropland production environment [64]. For example, in recent years, the Guangdong provincial government introduced an agricultural subsidy program, and economic incentives have stimulated farmers’ awareness of protecting cropland, an important factor driving the improvement of cropland sustainability (http://dara.gd.gov.cn/ 12 October 2023). In addition, the construction of well-facilitated cropland has greatly improved the production environment and production capacity of cropland, thereby increasing cropland sustainability. In recent years, Zhuhai City has continued to promote the construction of well-facilitated cropland, which has increased agricultural productivity sustainability (https://www.zhuhai.gov.cn/ 4 October 2023).
4.3. Management Measures and Policy Implications for Improving Cropland Sustainability in a Lateritic Red Soil Region
The low nutrient content is a major feature of lateritic red soils, thus increasing the SOM is conducive to enhancing cropland sustainability. Previous studies showed that applying biofertilizers and biochar modifiers can improve soil structure and properties, enhance soil fertility, and thus increase cropland productivity [65,66]. Strong acidity (low soil pH) is an obstacle limiting productivity in the lateritic red soil region [17]. Excessive use of chemical fertilizers and inefficient planting patterns are the main reasons for the decrease in soil pH [43]. Applying lime and green fertilizer and controlling nitrogen fertilizer consumption can reduce soil acidification and improve soil quality [67].
Efficient cropland management can improve the sustainability of cropland in the lateritic red soil region (http://www.gd.gov.cn/ 24 September 2023). Previous studies showed that the construction of water conservancy facilities and the improvements in the effective utilization of irrigation water can improve cropland sustainability [68,69]. The results of this study demonstrate that the improvement in IGC enhanced cropland sustainability. Vigorously carrying out land leveling projects and building field roads can effectively improve agricultural production conditions and facilitate the implementation of agricultural mechanization, thus enhancing cropland sustainability [70,71]. In addition, reasonable crop rotation is conducive to reducing land use intensity and is an effective measure for ensuring cropland sustainability [7].
Previous studies emphasized that formulating strict cropland quality protection policies and related planning are important measures for increasing cropland sustainability [72,73]. The cropland sustainability in the lateritic red soil region of Guangdong Province improved from 2010 to 2020. One of the reasons is that local governments, having attached increased importance to the protection and improvement of cropland, implemented a series of strict protection measures [74]. In recent years, the Guangdong provincial government issued a series of agricultural machinery purchase and subsidy programs that not only enhanced farmers’ awareness of cropland protection but also improved the level of agricultural mechanization, thus becoming an important factor driving the sustainable use of cropland (http://dara.gd.gov.cn/ 12 October 2023). Therefore, we recommend continuing the existing policies to ensure the continuous improvement of cropland sustainability.
4.4. Limitations and Future Work
Cropland sustainability is a comprehensive concept. In future studies, additional indicators should be further integrated to build a more comprehensive cropland sustainability evaluation system. For example, adding more indicators to the evaluation system, such as total nitrogen, available phosphorus, available potassium, ecological environment, and biodiversity, would enhance the evaluation of cropland sustainability. Due to limitations in terms of data availability, this study only analyzed the spatiotemporal patterns of cropland sustainability in 2010 and 2020 in the lateritic red soil region of Guangdong Province. The intermediate pattern of changes in cropland sustainability was unclear, and it was difficult to confirm whether the changes in cropland sustainability were a definite trend or were part of a weaker trend with large variation. In the future, we plan to carry out a longer time series analysis and more refined assessments, which will allow us to comprehensively reveal the spatiotemporal evolution of cropland sustainability. Simultaneously, we are committed to further exploring the driving mechanisms of cropland sustainability to provide more targeted measures and guidance that can improve cropland sustainability for various stakeholders.
5. Conclusions
In this study, we constructed a comprehensive evaluation indicator system for cropland sustainability from three aspects—natural capacity, management level, and food productivity—and adopted a remote sensing approach to the analysis of spatiotemporal patterns of cropland sustainability in the lateritic red soil region of Guangdong Province from 2010 to 2020. The results showed that the natural capacity of cropland increased over this period from 30.58 to 31.02. The management level score of croplands increased from 18.08 to 18.68, and the food productivity score increased from 19.32 to 19.43. The score for cropland sustainability increased from 67.95 to 69.08. The sustainability of 68.64% of cropland, which had improved in 2020 compared with 2010, was largely distributed in the eastern and western parts of the study area, while in 31.36%, the cropland sustainability scores declined, primarily in the central part of the study area. There were differences among the prefecture-level regions in cropland sustainability, with the highest values located in Zhongshan, Zhuhai, and Qingyuan and the lowest values located in Zhanjiang. This study provides a practical evaluation system and methods for dynamic monitoring of cropland sustainability, and the research results can provide a decision basis for cropland protection. Management measures such as the application of green fertilizer, improvement of field infrastructure, and implementation of stricter cropland protection systems can effectively contribute to cropland sustainability.
Author Contributions
Conceptualization, D.D. and X.S.; methodology, D.D.; software, D.D.; validation, D.D.; formal analysis, D.D. and X.S.; investigation, D.D. and C.W.; resources, Y.Z. and Q.Y.; data curation, D.D. and Y.Z.; writing—original draft preparation, D.D.; writing—review and editing, D.D. and X.S.; visualization, D.D. and C.W.; supervision, X.S. and P.Y.; project administration, X.S. and Q.Y.; funding acquisition, X.S. and P.Y. All authors have read and agreed to the published version of the manuscript.
Funding
This research was funded by the Technology Innovation Center for Land Engineering and Human Settlements, Shaanxi Land Engineering Construction Group Co., Ltd. and Xi’an Jiaotong University (2021WHZ0072), the National Natural Science Foundation of China (U1901601 and 42271113), the National Key Research and Development Program of China (2022YFD2001105), and the Agricultural Science and Technology Innovation Project of the Chinese Academy of Agriculture Sciences.
Data Availability Statement
The data sets used in this study are available at the attached web site.
Acknowledgments
We thank the anonymous reviewers for the provided comments and suggestions that have helped us to improve the paper.
Conflicts of Interest
Author Dingding Duan was employed by the companyPiesat Information Technology. The remaining authors declare that the research was conducted in the absence of any commercial or financial relationships that could be construed as a potential conflict of interest.
References
- Demetriou, D. The assessment of land valuation in land consolidation schemes: The need for a new land valuation framework. Land Use Policy 2016, 54, 487–498. [Google Scholar] [CrossRef]
- Jarosław, J.; Jarosław, T. Spatial differentiation of indicators presenting selected barriers in the productivity of agricultural areas: A regional approach to setting land consolidation priorities. Ecol. Indic. 2018, 93, 718–729. [Google Scholar] [CrossRef]
- Li, J.L.; Wu, W.J.; Ye, X.X.; Jiang, H.; Gan, R.J.; Wu, H.L.; He, J.L.; Jiang, Y.L. Innovative trend analysis of main agriculture natural hazards in China during 1989–2014. Nat. Hazards 2019, 95, 677–720. [Google Scholar] [CrossRef]
- Csikós, N.; Szabó, B.; Hermann, T.; Laborczi, A.; Matus, J.; Pásztor, L.; Szatmári, G.; Takács, K.; Tóth, G. Cropland productivity evaluation: A 100 m resolution country assessment combining earth observation and direct measurements. Remote Sens. 2023, 15, 1236. [Google Scholar] [CrossRef]
- Yang, R.J.; Xiao, W.; Ye, Y.M.; Wang, K.C.; Dong, Y.X.; Chen, S. One-third of cropland within protected areas could be retired in China for inferior sustainability and effects. Sci. Total Environ. 2023, 905, 167084. [Google Scholar] [CrossRef] [PubMed]
- Feng, Z.J.; Hu, Z.Q.; Li, G.S.; Zhang, Y.H.; Zhang, X.; Zhang, H. Improving mine reclamation efficiency for farmland sustainable use: Insights from optimizing mining scheme. J. Clean. Prod. 2022, 379, 134615. [Google Scholar] [CrossRef]
- Smith, A.; Snapp, S.; Dimes, J.; Gwenambira, C.; Chikowo, R. Doubled-up legume rotations improve soil fertility and maintain productivity under variable conditions in maize-based cropping systems in Malawi. Agric. Syst. 2016, 145, 139–149. [Google Scholar] [CrossRef]
- Xu, W.Y.; Jin, J.X.; Jin, X.B.; Xiao, Y.Y.; Ren, J.; Liu, J.; Sun, R.; Zhou, Y.K. Analysis of changes and potential characteristics of cultivated land productivity based on MODIS EVI: A case study of Jiangsu Province, China. Remote Sens. 2019, 11, 2041. [Google Scholar] [CrossRef]
- Sun, X.B.; Li, Q.F.; Kong, X.B.; Cai, W.M.; Zhang, B.L.; Lei, M. Spatial characteristics and obstacle factors of cultivated land quality in an intensive agricultural region of the North China Plain. Land 2023, 12, 1552. [Google Scholar] [CrossRef]
- Wu, B.S.; Liu, M.F.; Wan, Y.F.; Song, Z.J. Evolution and coordination of cultivated land multifunctionality in Poyang lake ecological economic zone. Sustainability 2023, 15, 5307. [Google Scholar] [CrossRef]
- Fan, H. The impact of land remediation projects on the quality grade assessment of cultivated land. Front. Sci. Eng. 2023, 3, 49–52. [Google Scholar] [CrossRef]
- Ma, J.N.; Zhang, C.; Yun, W.J.; Lv, Y.H.; Chen, W.L.; Zhu, D.H. The temporal analysis of regional cultivated land productivity with GPP based on 2000–2018 MODIS data. Sustainability 2020, 12, 411. [Google Scholar] [CrossRef]
- Wu, F.Q.; Mo, C.J.; Dai, X.J.; Li, H.M. Spatial analysis of cultivated land productivity, site condition and cultivated land health at county scale. Int. J. Environ. Res. Public Health 2022, 19, 12266. [Google Scholar] [CrossRef] [PubMed]
- Xia, Z.Q.; Peng, Y.P.; Lin, C.J.; Wen, Y.; Liu, H.M.; Liu, Z.H. A spatial frequency/spectral indicator-driven model for estimating cultivated land quality using the gradient boosting decision tree and genetic algorithm-back propagation neural network. Int. Soil Water Conserv. Res. 2022, 10, 635–648. [Google Scholar] [CrossRef]
- Peng, Y.P.; Liu, Z.H.; Lin, C.J.; Hu, Y.M.; Zhao, L.; Zou, R.Y.; Wen, Y.; Mao, X.Y. A new method for estimating soil fertility using extreme gradient boosting and a backpropagation neural network. Remote Sens. 2022, 14, 3311. [Google Scholar] [CrossRef]
- Zhao, C.; Zhou, Y.; Jiang, J.H.; Xiao, P.N.; Wu, H. Spatial characteristics of cultivated land quality accounting for ecological environmental condition: A case study in hilly area of northern Hubei province, China. Sci. Total Environ. 2021, 774, 145765. [Google Scholar] [CrossRef]
- Duan, D.D.; Sun, X.; Liang, S.F.; Sun, J.; Fan, L.L.; Chen, H.; Xia, L.; Zhao, F.; Yang, W.Q.; Yang, P. Spatiotemporal patterns of cultivated land quality integrated with multi-source remote sensing: A case study of Guangzhou, China. Remote Sens. 2022, 14, 1250. [Google Scholar] [CrossRef]
- Mujiyo; Nariyant, S.; Suntoro; Herawati, A.; Herdiansyah, G.; Irianto, H.; Riptanti, E.W.; Qonita, A. Soil fertility index based on altitude: A comprehensive assessment for the cassava development area in Indonesia. Ann. Agric. Sci. 2022, 67, 158–165. [Google Scholar] [CrossRef]
- Wu, Z.F.; Sun, X.M.; Sun, Y.Q.; Yan, J.Y.; Zhao, Y.F.; Chen, J. Soil acidification and factors controlling topsoil pH shift of cropland in central China from 2008 to 2018. Geoderma 2022, 408, 115586. [Google Scholar] [CrossRef]
- Liu, Y.; Chen, S.C.; Yu, Q.Y.; Cai, Z.J.; Zhou, Q.B.; Bellingrath-Kimura, S.D.; Wu, W.B. Improving digital mapping of soil organic matter in cropland by incorporating crop rotation. Geoderma 2023, 438, 116620. [Google Scholar] [CrossRef]
- Kiani, M.; Hernandez-Ramirez, G.; Quideau, S.; Smith, E.; Janzen, H.; Larney, F.J.; Puurveen, D. Quantifying sensitive soil quality indicators across contrasting long-term land management systems: Crop rotations and nutrient regimes. Agric. Ecosyst. Environ. 2017, 248, 123–135. [Google Scholar] [CrossRef]
- Scholten, T.; Goebes, P.; Kühn, P.; Seitz, S.; Assmann, T.; Bauhus, J.; Bruelheide, H.; Buscot, F.; Erfmeier, A.; Fischer, M. On the combined effect of soil fertility and topography on tree growth in subtropical forest ecosystems-a study from SE China. J. Plant Ecol. 2017, 10, 111–127. [Google Scholar] [CrossRef]
- Yao, M.L.; Shao, D.G.; Lv, C.H.; An, R.H.; Gu, W.Q.; Zhou, C. Evaluation of arable land suitability based on the suitability function-A case study of the Qinghai-Tibet Plateau. Sci. Total Environ. 2021, 787, 147414. [Google Scholar] [CrossRef]
- Golabi, M.; Hasily, M.A.; Nasab, S.B. Study and evaluation of irrigation and drainage networks using analytic hierarchy process in Khuzestan Province: A virtual water approach. Agric. Water Manag. 2020, 241, 106305. [Google Scholar] [CrossRef]
- Greslova, P.; Lastovicka, J.; Stych, P.; Kabrda, J. Land cover flows and land use intensity in the three decades of the post-communist Czechia: Changing trends and driving forces. Anthropocene 2023, 43, 100395. [Google Scholar] [CrossRef]
- Wang, L.; Zhou, Y.; Li, Q.; Xu, T.; Wu, Z.X.; Liu, J.Y. Application of three deep machine-learning algorithms in a construction assessment model of farmland quality at the county scale: Case study of Xiangzhou, Hubei Province, China. Agriculture 2021, 11, 72. [Google Scholar] [CrossRef]
- Cheng, H.R.; Zhu, L.K.; Meng, J.J. Fuzzy evaluation of the ecological security of land resources in mainland China based on the Pressure-State-Response framework. Sci. Total Environ. 2022, 804, 150053. [Google Scholar] [CrossRef]
- Jatav, S.S.; Naik, K. Measuring the agricultural sustainability of India: An application of pressure-state-response model. Reg. Sustain. 2023, 4, 218–234. [Google Scholar] [CrossRef]
- Li, Y.S.; Chang, C.Y.; Wang, Z.R.; Li, T.; Li, J.W.; Zhao, G.X. Identification of cultivated land quality grade using fused multi-source data and multi-temporal crop remote sensing information. Remote Sens. 2022, 14, 2109. [Google Scholar] [CrossRef]
- Yang, W.H.; Peng, Y.P.; Lin, C.J.; Yang, H.; Cheng, X.R.; Wu, X.F.; Wen, Y.; Liu, Z.H. Optimal deployment of cultivated land quality monitoring points based on satellite image-driven assessment and improved spatial simulated annealing. Land Degrad. Dev. 2023, 34, 4614. [Google Scholar] [CrossRef]
- Zhou, W.; Zhao, L.; Hu, Y.M.; Liu, Z.H.; Wang, L.; Ye, C.D.; Mao, X.Y.; Xie, X. Cultivated land quality evaluated using the RNN algorithm based on multisource data. Remote Sens. 2022, 14, 6014. [Google Scholar] [CrossRef]
- Zhong, J.L.; Li, Z.Z.; Zhang, D.; Yang, J.; Zhu, J.X. An evaluation framework for urban ecological compensation priority in China based on meta-analysis and fuzzy comprehensive evaluation. Ecol. Indic. 2023, 158, 111284. [Google Scholar] [CrossRef]
- Zhang, X.Q.; Qiao, W.B.; Lu, Y.H.; Sun, S.F.; Yin, Q.W. Construction and application of urban water system connectivity evaluation index system based on PSR-AHP-Fuzzy evaluation method coupling. Ecol. Indic. 2023, 153, 110421. [Google Scholar] [CrossRef]
- Liu, Y.S.; Zhang, Y.Y.; Guo, L.Y. Towards realistic assessment of cultivated land quality in an ecologically fragile environment: A satellite imagery-based approach. Appl. Geogr. 2010, 30, 271–281. [Google Scholar] [CrossRef]
- Blanchet, G.; Libohova, Z.; Joost, S.; Rossier, N.; Schneider, A.; Jeangros, B.; Sinaj, S. Spatial variability of potassium in agricultural soils of the canton of Fribourg, Switzerland. Geoderma 2017, 290, 107–121. [Google Scholar] [CrossRef]
- Grinand, C.; Le Maire, G.; Vieilledent, G.; Razakarnanarivo, H.; Razafimbelo, T.; Bernoux, M. Estimating temporal changes in soil carbon stocks at ecoregional scale in Madagascar using remote-sensing. Int. J. Appl. Earth Obs. 2017, 54, 1–14. [Google Scholar] [CrossRef]
- Bogunovic, I.; Trevisani, S.; Pereira, P.; Vukadinovic, V. Mapping soil organic matter in the Baranja region (Croatia): Geological and anthropic forcing parameters. Sci. Total Environ. 2018, 643, 335–345. [Google Scholar] [CrossRef] [PubMed]
- Fan, M.M.; Lal, R.; Zhang, H.; Margenot, A.J.; Wu, J.T.; Wu, P.B.; Zhang, L.M.; Yao, J.T.; Chen, F.R.; Gao, C. Variability and determinants of soil organic matter under different land uses and soil types in eastern China. Soil Till. Res. 2020, 198, 104544. [Google Scholar] [CrossRef]
- Dou, X.; Wang, X.; Liu, H.J.; Zhang, X.L.; Meng, L.H.; Pan, Y.; Yu, Z.Y.; Cui, Y. Prediction of soil organic matter using multi-temporal satellite images in the Songnen Plain, China. Geoderma 2019, 356, 113896. [Google Scholar] [CrossRef]
- Meng, X.T.; Bao, Y.L.; Liu, J.G.; Liu, H.J.; Zhang, X.L.; Zhang, Y.; Wang, P.; Tang, H.T.; Kong, F.C. Regional soil organic carbon prediction model based on a discrete wavelet analysis of hyperspectral satellite data. Int. J. Appl. Earth Obs. 2020, 89, 102111. [Google Scholar] [CrossRef]
- Zhang, Y.; Sui, B.; Shen, H.O.; Wang, Z.M. Estimating temporal changes in soil pH in the black soil region of Northeast China using remote sensing. Comput. Electron. Agric. 2018, 154, 204–212. [Google Scholar] [CrossRef]
- Chen, D.; Chang, N.J.; Xiao, J.F.; Zhou, Q.B.; Wu, W.B. Mapping dynamics of soil organic matter in croplands with MODIS data and machine learning algorithms. Sci. Total Environ. 2019, 669, 844–855. [Google Scholar] [CrossRef] [PubMed]
- Tang, X.; Hu, J.S.; Lu, Y.; Qiu, J.C.; Dong, Y.Q.; Li, B. Soil C, N, P stocks and stoichiometry as related to land use types and erosion conditions in lateritic red soil region, south China. Catena 2022, 210, 105888. [Google Scholar] [CrossRef]
- Li, Y.; Mo, Y.Q.; Are, K.S.; Huang, Z.G.; Guo, H.; Tang, C.; Abegunrin, T.P.; Qin, Z.H.; Kang, Z.W.; Wang, X. Sugarcane planting patterns control ephemeral gully erosion and associated nutrient losses: Evidence from hillslope observation. Agric. Ecosyst. Environ. 2021, 309, 107289. [Google Scholar] [CrossRef]
- Shi, X.Z.; Yu, D.S.; Sun, W.X.; Wang, H.J.; Zhao, Q.G.; Gong, Z.T. Reference benchmarks relating to great groups of genetic soil classification of China with soil taxonomy. Chin. Sci. Bull. 2004, 49, 1507–1511. [Google Scholar] [CrossRef]
- Liao, Q.; Hu, Y.M.; Hu, X.F.; Zhao, J.Y.; Wang, L. Spatial variability of topsoil nutrients in typical lateritic red soil areas of Guangdong Province. Bull. Soil Water Conserv. 2015, 35, 322–328. (In Chinese) [Google Scholar] [CrossRef]
- Ning, J.; Liu, J.Y.; Kuang, W.H.; Xu, X.L.; Zhang, S.W.; Yan, C.Z.; Li, R.D.; Wu, S.X.; Hu, Y.F.; Du, G.M. Spatiotemporal patterns and characteristics of land-use change in China during 2010–2015. J. Geogr. Sci. 2018, 28, 547–562. [Google Scholar] [CrossRef]
- Lai, Y.Q.; Wang, H.L.; Sun, X.L. A comparison of importance of modelling method and sample size for mapping soil organic matter in Guangdong, China. Ecol. Indic. 2021, 126, 107618. [Google Scholar] [CrossRef]
- Roelofsen, H.D.; van Bodegom, P.M.; Kooistra, L.; van Amerongen, J.J.; Witte, J.P.M. An evaluation of remote sensing derived soil pH and average spring groundwater table for ecological assessments. Int. J. Appl. Earth Obs. 2015, 43, 149–159. [Google Scholar] [CrossRef]
- Rana, S.; Cheng, X.N.; Wu, Y.F.; Hu, C.W.; Jemim, R.S.; Liu, Z.; Wang, Y.M.; Cai, Q.F.; Geng, X.D.; Guo, X.M. Evaluation of soil and water conservation function in the Wugong mountain meadow based on the comprehensive index method. Heliyon 2022, 8, e11867. [Google Scholar] [CrossRef]
- Peng, L.N.; Hu, Y.; Li, J.Y.; Du, Q.Y. An improved evaluation scheme for performing quality assessments of unconsolidated cultivated land. Sustainability 2017, 9, 1312. [Google Scholar] [CrossRef]
- Lai, Z.Q.; Chang, D.; Li, S.; Li, D. Optimizing land use systems of an agricultural watershed in China to meet ecological and economic requirements for future sustainability. Glob. Ecol. Conserv. 2022, 33, e01975. [Google Scholar] [CrossRef]
- Liu, X.X.; Zheng, J.P.; Yu, L.; Hao, P.Y.; Chen, B.; Xin, Q.C.; Fu, H.H.; Gong, P. Annual dynamic dataset of global cropping intensity from 2001 to 2019. Sci. Data 2021, 8, 283. [Google Scholar] [CrossRef] [PubMed]
- Qian, F.K.; Lal, R.; Wang, Q.B. Land evaluation and site assessment for the basic farmland protection in Lingyuan County, Northeast China. J. Clean. Prod. 2021, 314, 128097. [Google Scholar] [CrossRef]
- Zhao, L.; Ma, R.; Yang, Z.; Ning, K.; Chen, P.; Wu, J. Ecosystem health risk assessment of lakes in the Inner Mongolian Plateau based on the coupled AHP-SOM-CGT model. Ecol. Indic. 2023, 156, 111168. [Google Scholar] [CrossRef]
- Fan, Y.T.; Jin, X.B.; Xiang, X.M.; Gan, L.; Yang, X.H.; Zhang, Z.H.; Zhou, Y.K. Evaluating and predicting the effectiveness of farmland consolidation on improving agricultural productivity in China. PLoS ONE 2018, 13, e0198171. [Google Scholar] [CrossRef] [PubMed]
- Vijith, H.; Dodge-Wan, D. Spatial and temporal characteristics of rainfall over a forested river basin in NW Borneo. Meteorol. Atmos. Phys. 2020, 132, 683–702. [Google Scholar] [CrossRef]
- Eckert, S.; Hüsler, F.; Liniger, H.; Hodel, E. Trend analysis of MODIS NDVI time series for detecting land degradation and regeneration in Mongolia. J. Arid. Environ. 2015, 113, 16–28. [Google Scholar] [CrossRef]
- Garroutte, E.L.; Hansen, A.J.; Lawrence, R.L. Using NDVI and EVI to map spatiotemporal variation in the biomass and quality of forage for migratory elk in the Greater Yellowstone Ecosystem. Remote Sens. 2016, 8, 404. [Google Scholar] [CrossRef]
- Li, Z.; Lun, F.; Liu, M.; Xiao, X.; Wang, C.Y.; Wang, L.L.; Xu, Y.Q.; Qi, W.; Sun, D.F. Rapid diagnosis of agricultural soil health: A novel soil health index based on natural soil productivity and human management. J. Environ Manag. 2021, 277, 111402. [Google Scholar] [CrossRef]
- Uddin, M.G.; Nash, S.; Rahman, A.; Olbert, A.I. A comprehensive method for improvement of water quality index (WQI) models for coastal water quality assessment. Water Res. 2022, 219, 118532. [Google Scholar] [CrossRef]
- Zheng, C.; Guo, Z.X.; Yuan, Y.Z.; Guo., Y.; Chai., M.; Liang., X.Y.; Bi, R.T. Spatial and temporal changes of cropland soil acidification and their influencing factors in different regions of Guangdong Province China. Chin. J. Appl. Ecol. 2019, 30, 593–601. (In Chinese) [Google Scholar] [CrossRef]
- Bucala-Hrabia, A. Long-term impact of socio-economic changes on agricultural land use in the Polish Carpathians. Land Use Policy 2017, 64, 391–404. [Google Scholar] [CrossRef]
- Mitter, H.; Techen, A.K.; Sinabell, F.; Helming, K.; Schmid, E.; Bodirsky, B.L.; Holman, I.; Kok, K.; Lehtonen, H.; Leip, A.; et al. Shared Socio-economic Pathways for European agriculture and food systems: The Eur-Agri-SSPs. Glob. Environ. Chang. 2020, 65, 102159. [Google Scholar] [CrossRef] [PubMed]
- Kavitha, B.; Reddy, P.V.L.; Kim, B.; Lee, S.S.; Pandey, S.K.; Kim, K.H. Benefits and limitations of biochar amendment in agricultural soils: A review. J. Environ. Manag. 2018, 227, 146–154. [Google Scholar] [CrossRef] [PubMed]
- Hosseinzadeh, M.H.; Ghalavand, A.; Boojar, M.M.A.; Modarres-Sanavy, S.A.M.; Mokhtassi-Bidgoli, A. Application of manure and biofertilizer to improve soil properties and increase grain yield, essential oil and ω of purslane (L.) under drought stress. Soil Till. Res. 2021, 205, 104633. [Google Scholar] [CrossRef]
- Shanmugavel, D.; Rusyn, I.; Solorza-Feria, O.; Kamaraj, S.K. Sustainable SMART fertilizers in agriculture systems: A review on fundamentals to in-field applications. Sci. Total Environ. 2023, 904, 166729. [Google Scholar] [CrossRef]
- Li, X.R.; Jiang, W.L.; Duan, D.D. Spatiotemporal analysis of irrigation water use coefficients in China. J. Environ. Manag. 2020, 262, 110242. [Google Scholar] [CrossRef]
- Liu, J.G.; Zang, C.F.; Tian, S.Y.; Liu, J.G.; Yang, H.; Jia, S.F.; You, L.Z.; Liu, B.; Zhang, M. Water conservancy projects in China: Achievements, challenges and way forward. Glob. Environ. Chang. 2013, 23, 633–643. [Google Scholar] [CrossRef]
- Femeena, P.V.; Sudheer, K.P.; Cibin, R.; Chaubey, I. Spatial optimization of cropping pattern for sustainable food and biofuel production with minimal downstream pollution. J. Environ. Manag. 2018, 212, 198–209. [Google Scholar] [CrossRef]
- Paudel, G.P.; Bahadur, K.C.D.; Rahut, D.B.; Justice, S.E.; McDonald, A.J. Scale-appropriate mechanization impacts on productivity among smallholders: Evidence from rice systems in the mid-hills of Nepal. Land Use Policy 2019, 85, 104–113. [Google Scholar] [CrossRef]
- Jiang, G.H.; Zhang, R.J.; Ma, W.Q.; Zhou, D.Y.; Wang, X.P.; He, X. Cultivated land productivity potential improvement in land consolidation schemes in Shenyang, China: Assessment and policy implications. Land Use Policy 2017, 68, 80–88. [Google Scholar] [CrossRef]
- Su, Y.; Qian, K.; Lin, L.; Wang, K.; Guan, T.; Gan, M.Y. Identifying the driving forces of non-grain production expansion in rural China and its implications for policies on cultivated land protection. Land Use Policy 2020, 92, 104435. [Google Scholar] [CrossRef]
- Zhang, R.R.; Ma, W.M.; Liu, J.J. Impact of government subsidy on agricultural production and pollution: A game-theoretic approach. J. Clean. Prod. 2021, 285, 124806. [Google Scholar] [CrossRef]
Figure 1.
Overview map of the study area. (a) Lateritic red soil distribution in China; (b) Lateritic red soil distribution in Guangdong province; (c) Digital elevation model (DEM); (d) Mean annual precipitation (MAP); (e) Mean annual temperature (MAT). CZ: Chaozhou; DG: Dongguan; FS: Foshan; GZ: Guangzhou; HY: Heyuan; HZ: Huizhou; JM: Jiangmen; JY: Jieyang; MM: Maoming; MZ: Meizhou; QY: Qingyuan; ST: Shantou; SW: Shanwei; SG: Shaoguan; SZ: Shenzhen; YJ: Yangjiang; YF: Yunfu; ZJ: Zhanjiang; ZQ: Zhaoqing; ZS: Zhangshan; ZH: Zhuhai.

Figure 2.
Evaluation framework of cropland sustainability. DT: decision tree, AdaBoost: adaptive enhanced decision tree, RF: random forest, SVR: support vector regression, MOD: moderate-resolution imaging spectroradiometer, NDVI: normalized difference vegetation index, EVI: enhanced vegetation index, NPP: net primary production.

Figure 3.
Spatiotemporal patterns of natural capacity, management level, food productivity, and cropland sustainability in the lateritic red soil region in 2010 and 2020. (a) natural capacity of cropland in 2010; (b) natural capacity of cropland in 2020; (c) management level of cropland in 2010; (d) management level of cropland in 2020; (e) food productivity of cropland in 2010; (f) food productivity of cropland in 2020; (g) cropland sustainability in 2010; (h) cropland sustainability in 2020.

Figure 4.
Differences in natural capacity, management level, food productivity and cropland sustainability in different prefecture-level regions in 2010 and 2020. (a) 2010; (b) 2020. CZ: Chaozhou; DG: Dongguan; FS: Foshan; GZ: Guangzhou; HY: Heyuan; HZ: Huizhou; JM: Jiangmen; JY: Jieyang; MM: Maoming; MZ: Meizhou; QY: Qingyuan; ST: Shantou; SW: Shanwei; SG: Shaoguan; SZ: Shenzhen; YJ: Yangjiang; YF: Yunfu; ZJ: Zhanjiang; ZQ: Zhaoqing; ZS: Zhangshan; ZH: Zhuhai.

Figure 5.
Dynamic changes in natural capacity (a), management level (b), food productivity (c), and cropland sustainability (d) from 2010 to 2020.
Figure 5.
Dynamic changes in natural capacity (a), management level (b), food productivity (c), and cropland sustainability (d) from 2010 to 2020.

Figure 6.
Changes in natural capacity, management level, food productivity, and cropland sustainability in different regions from 2010 to 2020. CZ: Chaozhou; DG: Dongguan; FS: Foshan; GZ: Guangzhou; HY: Heyuan; HZ: Huizhou; JM: Jiangmen; JY: Jieyang; MM: Maoming; MZ: Meizhou; QY: Qingyuan; ST: Shantou; SW: Shanwei; SG: Shaoguan; SZ: Shenzhen; YJ: Yangjiang; YF: Yunfu; ZJ: Zhanjiang; ZQ: Zhaoqing; ZS: Zhangshan; ZH: Zhuhai.


Table 1.
Data sources and attributes.
| Indicator | Sources | Year | Attribute | Resolution |
|---|---|---|---|---|
| Soil organic matter (SOM) | Ground measured soil data | 2010/2020 | Point | — |
| Soil pH | ||||
| Soil texture | Basic soil property dataset of high-resolution China Soil Information Grids (http://www.geodata.cn/ 3 March 2023) | 2010–2018 | raster | 1 km × 1 km |
| Soil thickness | ||||
| Slope | DEM (http://www.gscloud.cn/ 19 January 2023) | 2011 | raster | 500 m × 500 m |
| Irrigation guarantee capability | MOD 16 A2 data (https://earthdata.nasa.gov/ 10 April 2023) Meteorological data (http:/data.cma.cn/ 5 April 2023) | 2010/2020 | Raster/point | |
| Centralized contiguity | Remote sensing monitoring data of land use/land cover in China (CNLUCC) (https://www.resdc.cn/ 12 December 2022) | 2010/2020 | raster | 30 m × 30 m |
| Multiple-cropping index | Annual dynamic dataset of global cropping intensity (https://doi.org/10.6084/m9.figshare.14099402 24 March 2023) | 2010/2019 | raster | 250 m × 250 m |
| High food productivity | MOD 09 A1 MOD 17 A3 (https://earthdata.nasa.gov/ 15 August 2023) | 2008–2012 2018–2022 | raster | 500 m × 500 m |
| Stable food productivity |
Table 2.
Indicators and level scores for cropland sustainability.
| First-Level Indicator | Second-Level Indicators | Third-Level Indicators (Unit) | Weights | The Scores for Different Levels | |||||||||
|---|---|---|---|---|---|---|---|---|---|---|---|---|---|
| 100 | 90 | 80 | 70 | 60 | 50 | 40 | 30 | 20 | 10 | ||||
| Cropland sustainability | Natural capacity | SOM (g/kg) | 0.1486 | >40 | 30–40 | 20–30 | 10–20 | 6.0–10 | <6.0 | ||||
| Soil pH | 0.1199 | 6.5–7.5 | 5.5–6.5 | 4.5–5.5 | 3.5–4.5 | ||||||||
| Soil texture | 0.0862 | medium loam | light loam | heavy loam | sandy loam | clay | sand | ||||||
| Soil thickness | 0.0757 | >150 | 100–150 | 60–100 | 30–60 | <30 | |||||||
| Slope | 0.0641 | 0–2 | 2–5 | 5–8 | 8–15 | 15–25 | >25 | ||||||
| Management level | irrigation guarantee capability | 0.1225 | Fully satisfied | satisfied | basically satisfied | not satisfied | |||||||
| Centralized contiguity | 0.0538 | ≥0.5 | 0.3–0.5 | <0.3 | |||||||||
| Multiple-cropping index | 0.0719 | once | twice | three times | |||||||||
| Food productivity | High food productivity | 0.1511 | very high | high | general high | low | very low | ||||||
| stable food productivity | 0.1062 | very stable | stable | general stable | unstable | very unstable | |||||||
Table 3.
Environmental variables for SOM and soil pH estimation of cropland.
| Type | Environmental Variables | Abbreviation | Data Sources | Select |
|---|---|---|---|---|
| Remote sensing | Band reflectance of MODIS B1 | B1_mean | MOD 09 A1 https://earthdata.nasa.gov/ 15 August 2023 | No |
| Band reflectance of MODIS B2 | B2_mean | Yes | ||
| Band reflectance of MODIS B3 | B3_mean | No | ||
| Band reflectance of MODIS B4 | B4_mean | No | ||
| First derivative of reflectance for MODIS B1 band | B1_1st | No | ||
| First derivative of reflectance for MODIS B2 band | B2_1st | No | ||
| First derivative of reflectance for MODIS B3 band | B3_1st | Yes | ||
| First derivative of reflectance for MODIS B4 band | B4_1st | Yes | ||
| Second derivative of reflectance for MODIS B1 band | B1_2nd | No | ||
| Second derivative of reflectance for MODIS B2 band | B2_2nd | No | ||
| Second derivative of reflectance for MODIS B3 band | B3_2nd | No | ||
| Second derivative of reflectance for MODIS B4 band | B4_2nd | No | ||
| Annual mean of NDVI (Normalized Difference Vegetation Index) | NDVI_mean | No | ||
| Annual maximum value of NDVI | NDVI_max | No | ||
| Annual mean of EVI (Enhanced Vegetation Index) | EVI_mean | No | ||
| Annual maximum value of EVI | EVI_max | Yes | ||
| Annual mean of RVI | RVI_mean | No | ||
| Annual maximum value of RVI (Ratio Vegetation Index) | RVI_max | No | ||
| Annual mean of DVI (Difference Vegetation Index) | DVI_mean | No | ||
| Annual maximum value of DVI | DVI_max | No | ||
| Annual mean of SAVI (Soil-adjusted Vegetation Index) | SAVI_mean | No | ||
| Annual maximum value of SAVI | SAVI_max | Yes | ||
| Terrain | Slope | Slope | DEM http://www.gscloud.cn/ 19 January 2023 | Yes |
| Aspect | Aspect | Yes | ||
| Topographic Wetness Index | TWI | Yes | ||
| Climate | Mean annual precipitation | MAP | http:/data.cma.cn/ 5 April 2023 | Yes |
| Mean annual temperature | MAT | Yes | ||
| Soil | Soil Texture | STT | http://www.geodata.cn/ 3 March 2023 | No |
| Soil Bulk Density | SBD | Yes | ||
| Cation Exchange Capacity | CEC | Yes | ||
| Soil silt content | STC | No | ||
| Soil sand content | SDC | Yes | ||
| Soil clay content | SCC | Yes | ||
| Soil Thickness | ST | Yes |
Table 4.
Parameters of the four machine learning models.
| Model | Parameter | Value Range | Step Size | Value |
|---|---|---|---|---|
| DT | max_depth | 10–100 | 10 | 40 |
| min_samples_split | 1–5 | 1 | 1 | |
| min_samples_leaf | 1–5 | 1 | 1 | |
| max_leaf_nodes | 1–5 | 1 | 2 | |
| AdaBoost | n_estimators | 10–100 | 10 | 80 |
| learning_rate | 0.1, 0.01, 0.001, 0.0001 | - | 0.01 | |
| RF | n_estimators | 50–200 | 50 | 150 |
| max_depth | 10–100 | 10 | 80 | |
| min_samples_split | 1–5 | 1 | 2 | |
| min_samples_leaf | 1–5 | 1 | 1 | |
| max_leaf-nodes | 1–5 | 1 | 1 | |
| SVR | kernal | Linear, Poly, RBF, Sigmoid | - | RBF |
| gamma | 0.1, 0.01, 0.001, 0.0001 | - | 0.01 | |
| C | 1–10 | 1 | 10 |
Table 5.
Comparison of model performance for SOM and soil pH remote sensing estimation.
| Model | Indicator | R2 | RMSE | MAE |
|---|---|---|---|---|
| DT | SOM | 0.48 | 3.84 g/kg | 2.25 g/kg |
| Soil pH | 0.48 | 0.41 | 0.32 | |
| AdaBoost | SOM | 0.63 | 2.69 g/kg | 1.62 g/kg |
| Soil pH | 0.61 | 0.33 | 0.24 | |
| RF | SOM | 0.65 | 2.63 g/kg | 1.57 g/kg |
| Soil pH | 0.64 | 0.29 | 0.22 | |
| SVR | SOM | 0.58 | 3.21 g/kg | 1.71 g/kg |
| Soil pH | 0.53 | 0.38 | 0.27 |
Note: DT: decision tree, AdaBoost: adaptive enhanced decision tree, RF: random forest, SVR: support vector regression, SOM: soil organic matter, R2: coefficient of determination, RMSE: root mean square error, MAE: mean absolute error.
Table 6.
Confusion matrix of IGC remote sensing estimation.
| Irrigation Grade | Evaluated Results | UA | PA | OA | |||||
|---|---|---|---|---|---|---|---|---|---|
| Fully Satisfied | Satisfied | Basically Satisfied | Not Satisfied | Total | |||||
| Measured results | Fully satisfied | 376 | 50 | 32 | 20 | 478 | 0.79 | 0.90 | 0.75 |
| Satisfied | 26 | 123 | 14 | 7 | 170 | 0.72 | 0.62 | ||
| Basically satisfied | 9 | 16 | 112 | 32 | 169 | 0.66 | 0.60 | ||
| Not Satisfied | 6 | 10 | 28 | 99 | 143 | 0.69 | 0.63 | ||
| Total | 417 | 199 | 186 | 158 | 960 | ||||
Note: UA: user accuracy, PA: producer accuracy, OA: overall accuracy.
Table 7.
Comparison of the performance of the vegetation indexes and NPP to estimate food productivity.
Table 7.
Comparison of the performance of the vegetation indexes and NPP to estimate food productivity.
| Index | Temporal Correlation with Statistical Yield (R2) | Spatial Correlation with Measured Yield (R2) |
|---|---|---|
| NDVI_Max | 0.51 | 0.56 |
| NDVI_Mean | 0.62 | 0.43 |
| EVI_Max | 0.50 | 0.55 |
| EVI_Mean | 0.60 | 0.58 |
| NPP | 0.45 | 0.36 |
Note: NDVI_Max: annual maximum value of NDVI; NDVI_Mean: annual mean of NDVI; EVI_Max: annual maximum value of EVI; EVI_Mean: annual mean of EVI; NPP: net primary production; R2: coefficient of determination.
Disclaimer/Publisher’s Note: The statements, opinions and data contained in all publications are solely those of the individual author(s) and contributor(s) and not of MDPI and/or the editor(s). MDPI and/or the editor(s) disclaim responsibility for any injury to people or property resulting from any ideas, methods, instructions or products referred to in the content. |
© 2024 by the authors. Licensee MDPI, Basel, Switzerland. This article is an open access article distributed under the terms and conditions of the Creative Commons Attribution (CC BY) license (https://creativecommons.org/licenses/by/4.0/).
Share and Cite
MDPI and ACS Style
Duan, D.; Sun, X.; Wang, C.; Zha, Y.; Yu, Q.; Yang, P. A Remote Sensing Approach to Estimating Cropland Sustainability in the Lateritic Red Soil Region of China. Remote Sens. 2024, 16, 1069. https://doi.org/10.3390/rs16061069
AMA Style
Duan D, Sun X, Wang C, Zha Y, Yu Q, Yang P. A Remote Sensing Approach to Estimating Cropland Sustainability in the Lateritic Red Soil Region of China. Remote Sensing. 2024; 16(6):1069. https://doi.org/10.3390/rs16061069
Chicago/Turabian StyleDuan, Dingding, Xiao Sun, Chenrui Wang, Yan Zha, Qiangyi Yu, and Peng Yang. 2024. "A Remote Sensing Approach to Estimating Cropland Sustainability in the Lateritic Red Soil Region of China" Remote Sensing 16, no. 6: 1069. https://doi.org/10.3390/rs16061069
Note that from the first issue of 2016, this journal uses article numbers instead of page numbers. See further details here.