

Satellite Hyperspectral Nighttime Light Observation and Identification with DESIS

Innovative Imaging & Research Corp., Building 1103, Suite 140 C, Stennis Space Center, MS 39520, USA
*
Author to whom correspondence should be addressed.
Remote Sens. 2024, 16(5), 923; https://doi.org/10.3390/rs16050923
Submission received: 29 January 2024
/
Revised: 29 February 2024
/
Accepted: 29 February 2024
/
Published: 6 March 2024
(This article belongs to the Topic Advances in Earth Observation and Geosciences)
Abstract
:The satellite imagery of nighttime lights (NTLs) has been studied to understand human activities, economic development, and more recently, the ecological impact of brighter night skies. The Visible Infrared Imaging Radiometer Suite (VIIRS) Day–Night Band (DNB) offers perhaps the most advanced nighttime imaging capabilities to date, but its large pixel size and single band capture large-scale changes in NTL while missing granular but important details, such as lighting type and brightness. To better understand individual NTL sources in a region, the spectra of nighttime lights captured by the DLR Earth Sensing Imaging Spectrometer (DESIS) were extracted and compared against near-coincident VIIRS DNB imagery. The analysis shows that DESIS’s finer spatial and spectral resolutions can detect individual NTL locations and types beyond what is possible with the DNB. Extracted night light spectra, validated against ground truth measurements, demonstrate DESIS’s ability to accurately detect and identify narrow-band atomic emission lines that characterize the spectra of high-intensity discharge (HID) light sources and the broader spectral features associated with different light-emitting diode (LED) lights. These results suggest the possible application of using hyperspectral data from moderate-resolution sensors to identify lamp construction details, such as illumination source type and light quality in low-light contexts. NTL data from DESIS and other hyperspectral sensors may improve the scientific understanding of light pollution, lighting quality, and energy efficiency by identifying, evaluating, and mapping individual and small groups of light sources.
1. Introduction
Since the advent of the United States Department of Defense’s Defense Meteorological Satellite Program (DMSP) in the 1970s [1], satellite imagery of nighttime lights (NTLs) has shown that various human activities, taking place on spatiotemporal scales accessible to satellites, correlate with NTL distribution and intensity. These datasets have informed a variety of applications, including monitoring urbanization, socioeconomic activities, conflicts and disasters, energy, greenhouse gases and gas flares, light pollution, and fisheries [2]. NTL imagery is currently available via photos taken by astronauts on the International Space Station (ISS) [3] and by several small satellites [2]. Despite these early or small-scale efforts, a satellite platform with daily revisit times capable of nighttime imaging was unavailable until the launch of the Visible Infrared Imaging Radiometer Suite (VIIRS) in 2011 [4].
Advancements in nighttime imaging capabilities have bolstered substantial scientific interest in NTL data. Reviews of the remote sensing of NTL imaging and applications, for example [5], document the study of NTL’s utility for monitoring human activities, including urbanization [6,7,8], power outages [9], national gross domestic product (GDP) and economic development [10,11,12], ecological and human health impacts (e.g., human circadian rhythm disruptions, fires, and greenhouse gas emissions) [13,14,15,16,17,18], changes in lighting sources (i.e., from high-intensity discharge (HID) to light-emitting diode (LED)), and unbiased measures of conflict [19]. Nonetheless, currently, available NTL sensors are not sufficient by themselves to address many of these research problems due to their large ground sample distance (GSD) and limited number of bands. For example, the VIIRS Day–Night Band (DNB) High Gain Stage (HGS), designed specifically for night imaging, with a single band covering ~500–900 nm at ~750 m GSD, has a high enough dynamic range to detect reflected signals as low as a quarter of the moon’s illumination [20] or less than 25 optical Watts from a Lambertian light source, with Lmin 10−9 W cm−2 sr−1 centered in a pixel with a clear atmosphere. The DNB radiometric calibration was successfully validated with Terra Vega, an SI-traceable point source that is only 1 m in diameter, which demonstrates the DNB’s ability to detect and quantify NTL sources that are much smaller than its GSD [21]. While the DNB substantially improves the spatial resolution, sensitivity, and revisit time of the DMSP [2], and it was calibrated with a ground-based point source akin to NTL [21], its single band and large pixel size still make it impossible to separate and identify distinct types of lights. As a result, the DNB requires additional information about the image’s location and acquisition time to identify the light source. Indeed, most currently available NTL sensors have a spatial resolution upwards of 100 m [5]. While there are a few high-resolution satellites capable of capturing NTL, namely EROS-B (Israel) [22] and Jilin-1 (China) [23], moderate-resolution satellites are adequate for many NTL imaging applications and may be better than their higher-resolution counterparts for complementing the VIIRS DNB by observing trends over a larger region [5].
This lack of NTL spectral content has prompted research into the possibility of examining NTL with a hyperspectral sensor. Experiments aboard the International Space Station (ISS) from 2002 to 2007 [24] were used to conceptualize Nightsat, a multispectral satellite intended to identify light type and quality, although it is still under consideration and has not yet been built. While a hypothetical design of Nightsat’s bands mimicked Landsat 7 Enhanced Thematic Mapper Plus (ETM+) [25], consistent with the theory that multispectral spaceborne systems provide sufficiently detailed night imagery, a hyperspectral approach was considered ideal for many science objectives that depend on high spectral resolutions but were unfeasible at the time because of sensitivity requirements and mission costs [22]. Since the theorization of Nightsat, hyperspectral sensors sufficiently sensitive for imaging NTL have been successfully fielded in space.
In the last decade, the successful discrimination of nighttime lights with airborne and ground-based hyperspectral sensors confirms the potential for spaceborne hyperspectral imagers in identifying the sources of NTL. Kruse et al. [26] conducted an aerial nighttime survey of Las Vegas at an altitude of 1800 m with sensors ranging from 400 to 2500 nm over 360 bands. The team demonstrated that the spectral signatures acquired in the hyperspectral survey match those in the NOAA library and that nighttime light locations can be matched to a daytime base map. The analysis within this paper also emphasizes Las Vegas because of the number and variety of NTLs.
A newly published paper [27] examines the NTL imaging capabilities of the Environmental Mapping and Analysis Program (EnMAP), a hyperspectral mission managed by the German Aerospace Center (DLR) that launched in April 2022. In a similar manner to this paper’s approach, EnMAP acquired NTL imagery over Las Vegas, NV, and used it to verify the sensor spectral calibration and identify the dominant light type using ground truth spectral signatures [27].
In this investigation, the hyperspectral DLR Earth Sensing Imaging Spectrometer (DESIS) is used to extract information on NTLs. DESIS and EnMAP, used by [27], have distinct properties that impact NTL detection and discrimination. Both are hyperspectral imaging systems with over 200 spectral bands. EnMAP has the same swath width (30 km) and GSD (30 m) as DESIS but a much larger spectral range that extends into the shortwave infrared (SWIR). EnMAP’s bands have a wider full width at half maximum (FWHM) of 8.1 nm (2.3× DESIS) and a coarser spectral sampling of 6.5 nm (2.5× DESIS). Although adding an SWIR hyperspectral band is beneficial, a spectral signature in the visible and near-infrared (VNIR) is sufficient for most light emissions. Furthermore, DESIS’s spectral resolution, in terms of both FWHM and spectral sampling, provides an advantage for identifying monochromatic sources, such as atomic emission lines. Of equal importance is its ability to discriminate among white LED sources with different correlated color temperatures.
2. Materials and Methods
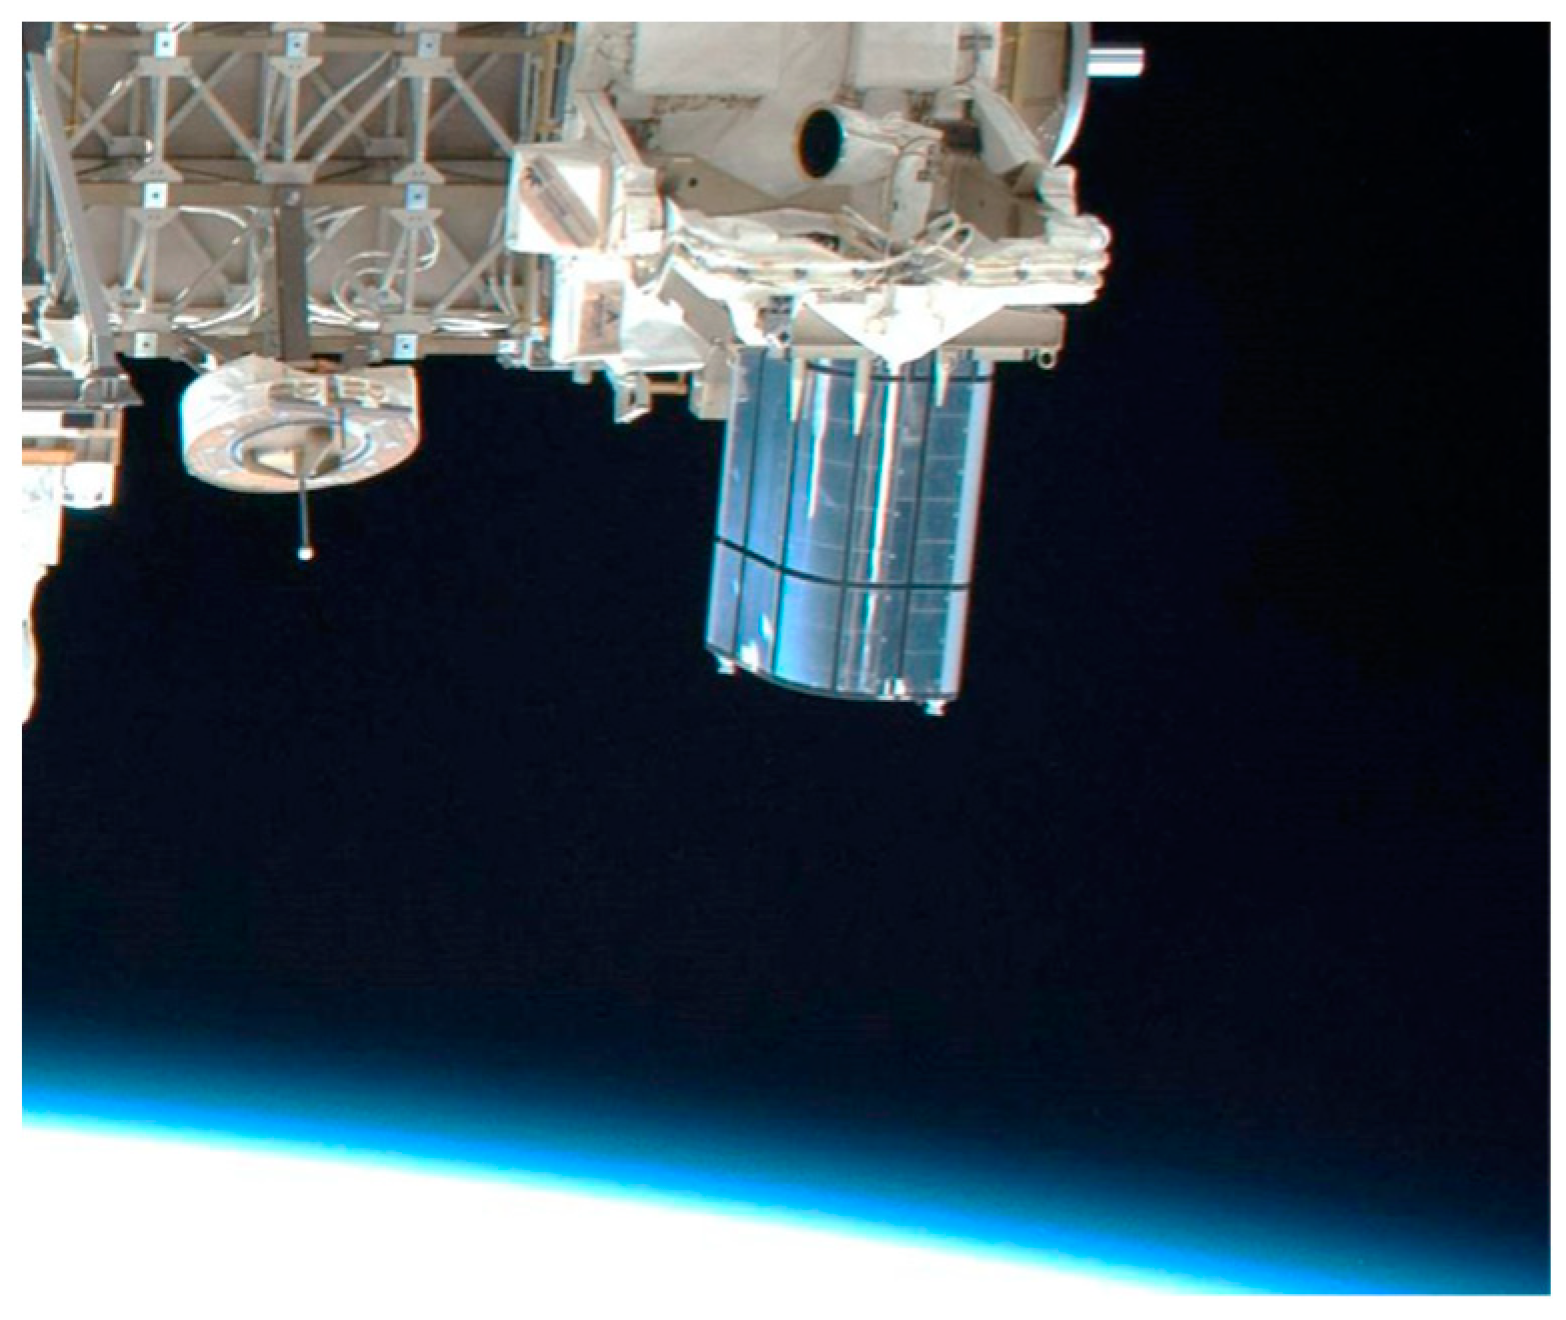
This investigation examined nighttime imagery from the DESIS, a push broom, hyperspectral imaging spectrometer with 235 bands from 400 to 1000 nm at a 2.55 nm spectral sampling interval and 30 m GSD [28,29] that was developed in a collaboration between Teledyne Brown Engineering (TBE) and the DLR (Figure 1). DESIS has operated since 2018 on ISS via the Multi-User System for Earth Sensing (MUSES), a TBE-owned and operated, nadir-facing, precision pointing platform capable of holding up to four sensors and supporting customer-selected acquisitions (Figure 2).
DESIS is the only hyperspectral satellite that is part of NASA’s Commercial Small-Sat Data Acquisition program (CSDA), and it is available to commercial users, as well as NASA and other government agencies, as part of a cooperative agreement between TBE and NASA. Customers can task DESIS to acquire imagery over a submitted area of interest, and TBE reconciles with customer requirements for parameters such as off-nadir angle, sun elevation angle, and cloud cover. Cloud cover is predicted via tools integrating multiple global and regional weather models for optimal accuracy [28]. Planned collects are uplinked and executed automatically, and they are then downlinked by TBE personnel for post-processing and delivery.
Table 1 shows DESIS’s parameters in detail [29,30]. DESIS’s fine spectral resolution and improved GSD compared to other satellite-based night imaging systems (e.g., VIIRS DNB) make detecting and identifying narrow-band atomic emission lines from different NTL sources possible. Given that many applications of NTL data require information about the light type and quantity, integrating hyperspectral imagery into these applications will broaden the utility of NTL data and increase the versatility of DESIS and future hyperspectral imagers.
Table 2 lists the five tiles from four different DESIS nighttime scans used in this investigation. A DESIS tile is a 30 km × 30 km image, and a scan consists of one to several tiles. Two DESIS tiles near Las Vegas were used: one with many lights over the Las Vegas strip and one nearby with minimal light sources. Guangzhou, China, a well-lit area that is similar to Las Vegas, and Kuwait City, Kuwait, which has several interesting lamps, were also selected. Lastly, a region near Ahmedabad, India, containing detectable fires was used.
2.1. Post-Acquisition Processing
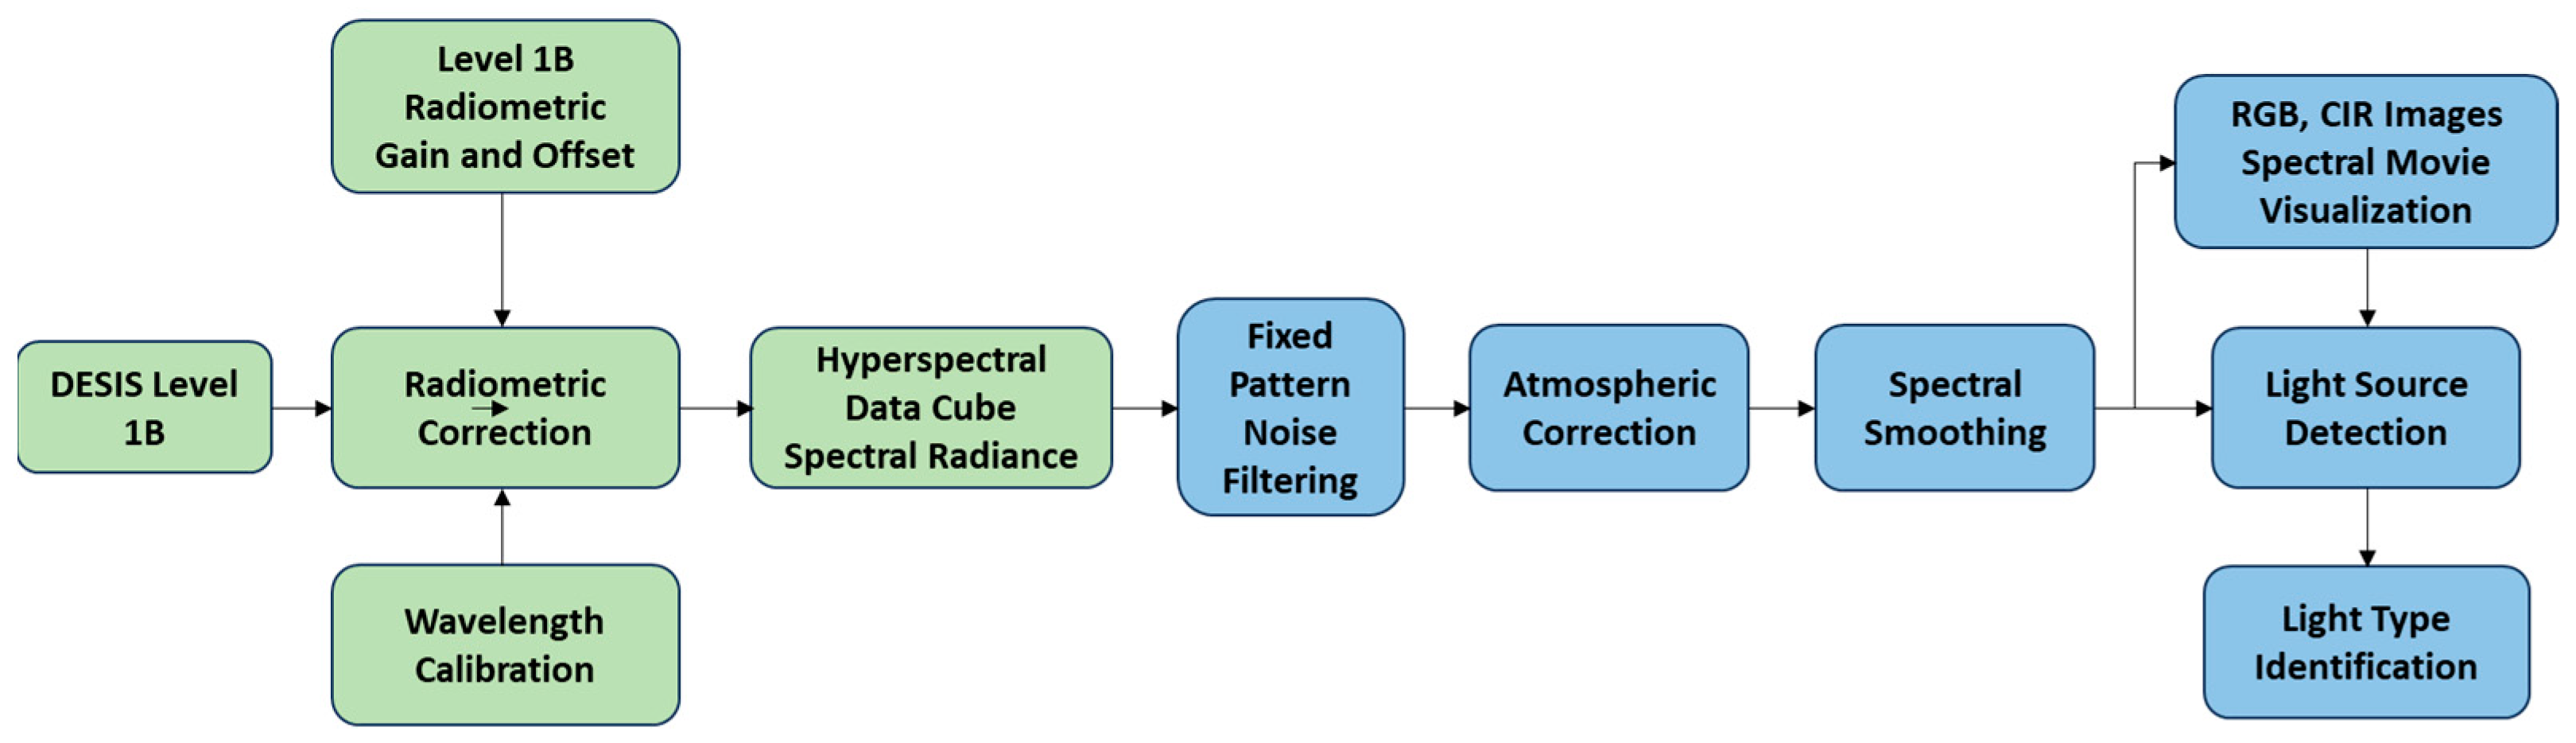
Figure 3 describes the process of identifying NTLs with DESIS imagery. The steps shown in green are performed as part of standard DESIS post-processing [31] and are not discussed within this paper. The steps in blue were performed specifically for this investigation and are detailed below.
2.1.1. Fixed Pattern Noise Filtering
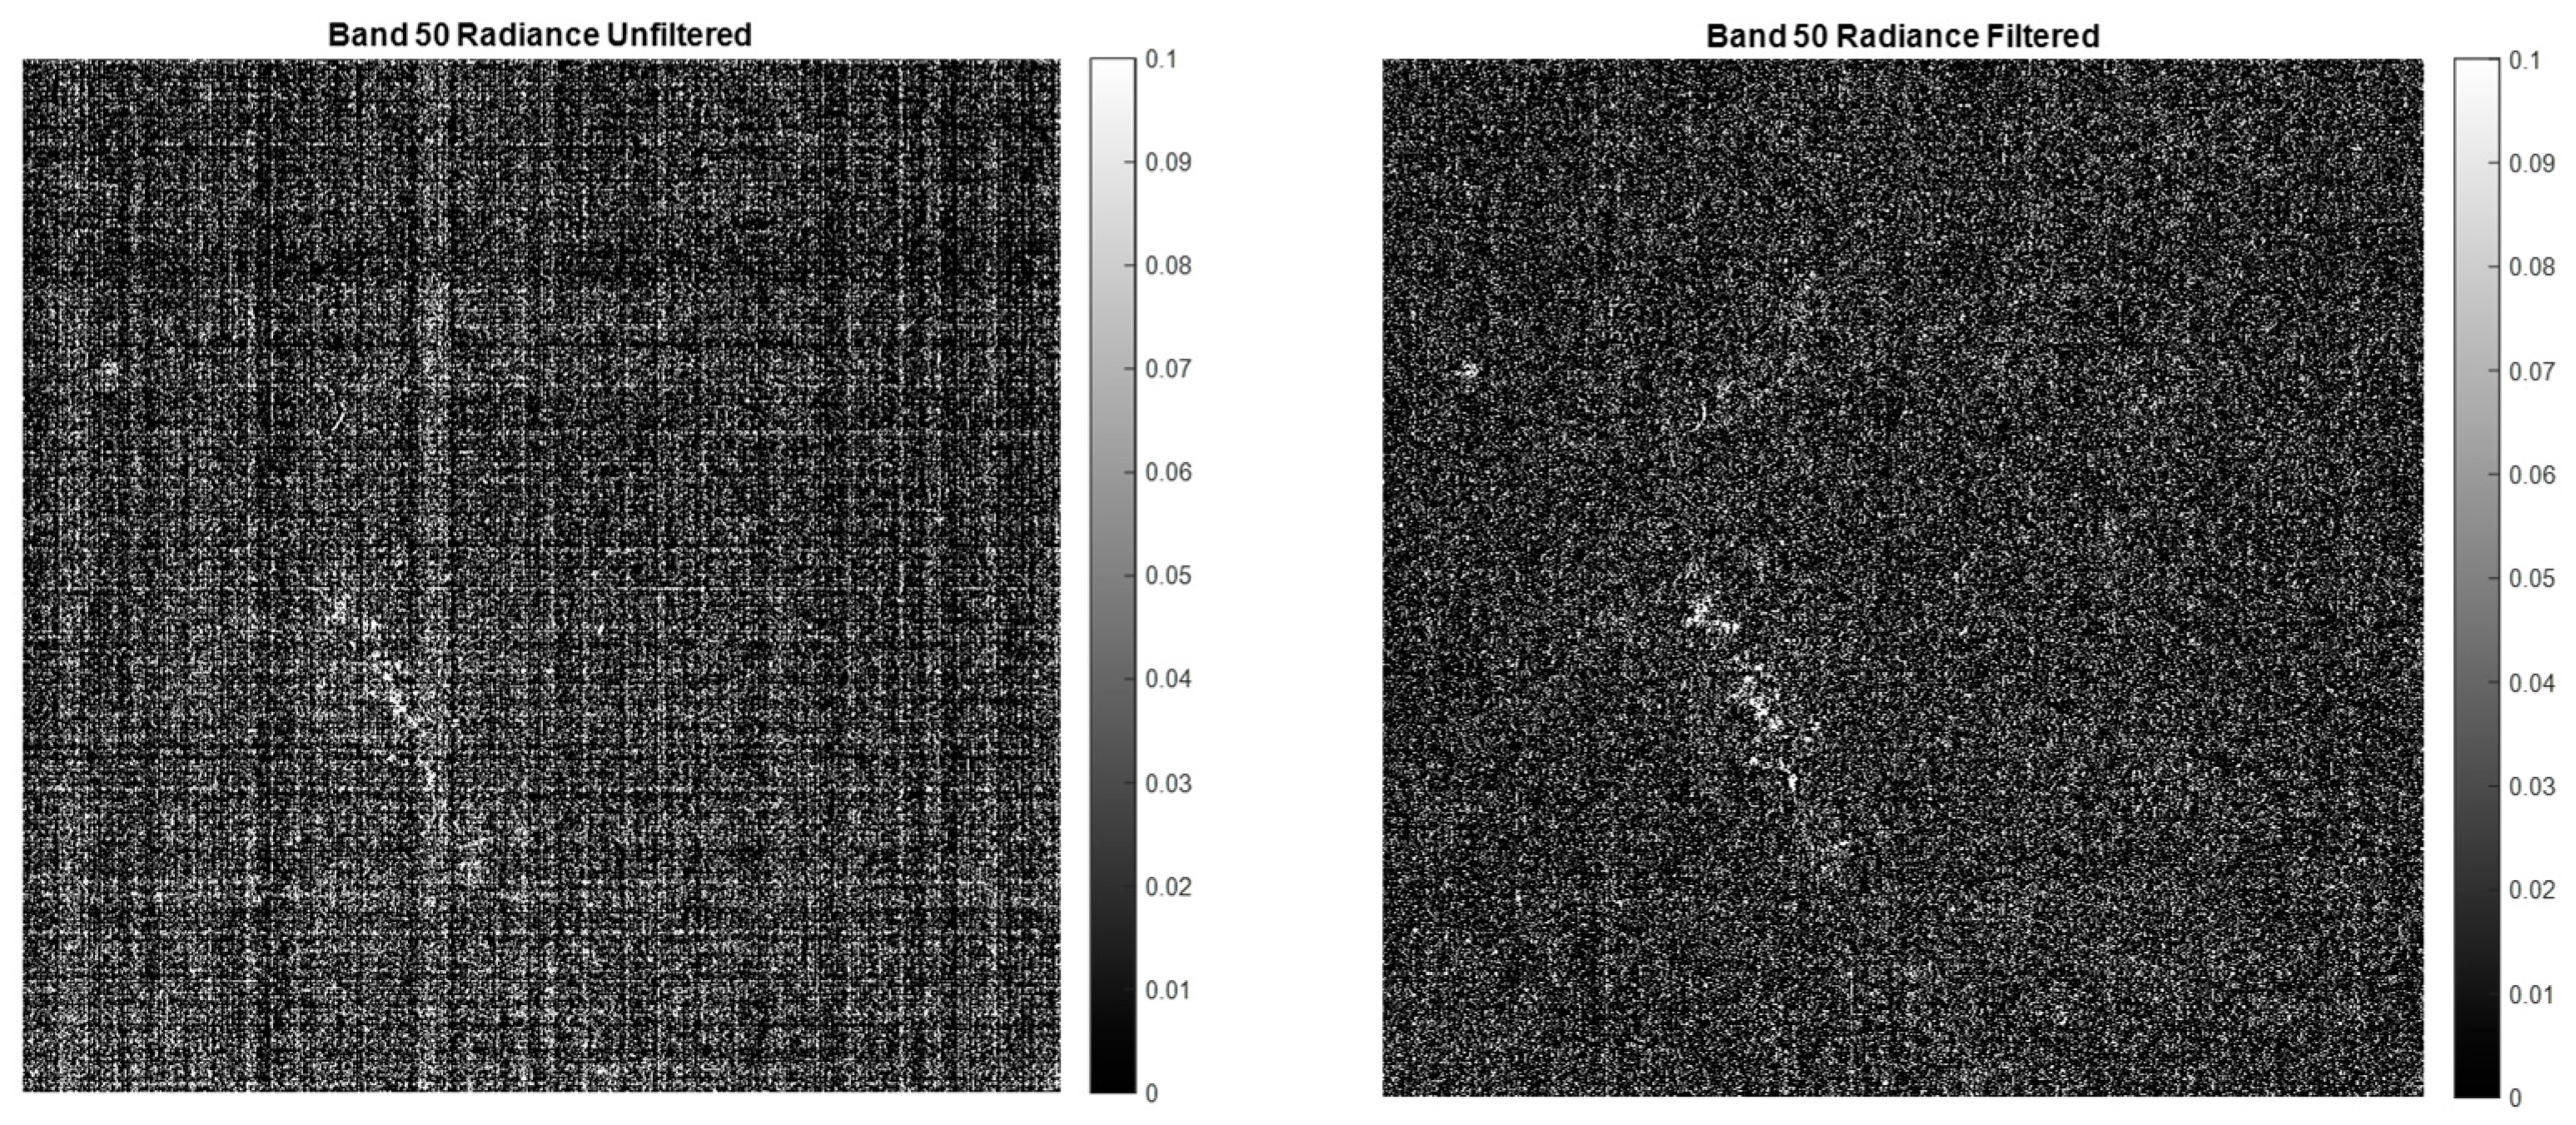
Fixed pattern noise is common in CMOS-based imaging devices such as DESIS. It is caused by amplifiers present in each column, the variation between columns, and the variation between pixels within a column. There is also row-based fixed pattern noise that is smaller than the column-based type. Unlike random noise affecting all illumination levels, fixed pattern noise creates column and row striping. It is especially visible over homogeneous land covers and most pronounced in low-light contexts. Figure 4 (left) shows representative fixed pattern noise from band 50 of the DESIS imagery over Las Vegas (Tile 3 in Table 2) before filtering. The scale extends to 0.1 W m−2 sr−1 μm−1, a very low spectral radiance level consistent with the inherent noise level of the system. While dark frame subtraction removes nearly all the offset, fixed pattern noise can be re-introduced in post-processing.
Fixed pattern noise in DESIS data arises from several sources, including initial sensor calibration and post-acquisition processing to radiance. Sensor calibration likely introduces fixed pattern noise as it is performed at much higher light levels than what is present during night imaging. This can be exaggerated in night-acquired imagery as NTL signals can be <0.1% of those in a daytime scene. Small errors in the regression due to small nonlinearities and inherent fitting errors can show up as gain and offset errors, thus introducing fixed pattern noise.
DESIS Level 1B (L1B) data products, which correct for known systematic effects and convert corrected hyperspectral image digital numbers (DNs) to physical at-sensor radiance values, were selected for this exploratory work. While the gains and offsets applied to convert digital counts to radiance introduce fixed pattern noise, the lower level of processing to Level 1A (L1A) does not correct for spatial distortion from the rolling shutter and was therefore not considered. Level 1C (L1C) geometrically corrected imagery, resampled and transformed to a map projection system, could be used to find bright sources within the night imagery, but the interpolation process used reduces the signal-to-noise ratio (SNR), making de-striping more difficult to achieve.
To filter out (reduce) L1B fixed pattern noise, one-dimensional median filters in the column and row directions were applied and subtracted from the input L1B image. A median filter was applied first to the columns and then to the column-filtered rows. The median filters were the entire length of a column or row (i.e., 1024 pixels), which ignores most night light sources because night lights spatially span a few pixels at most. The median filter could, in principle, remove uniformly extended light sources such as moonlight, but DESIS’s sensitivity (explained in detail in Section 4) is not high enough for observing moonlit scenes. Figure 4 (right) shows an example of a denoised image.
2.1.2. Atmospheric Correction
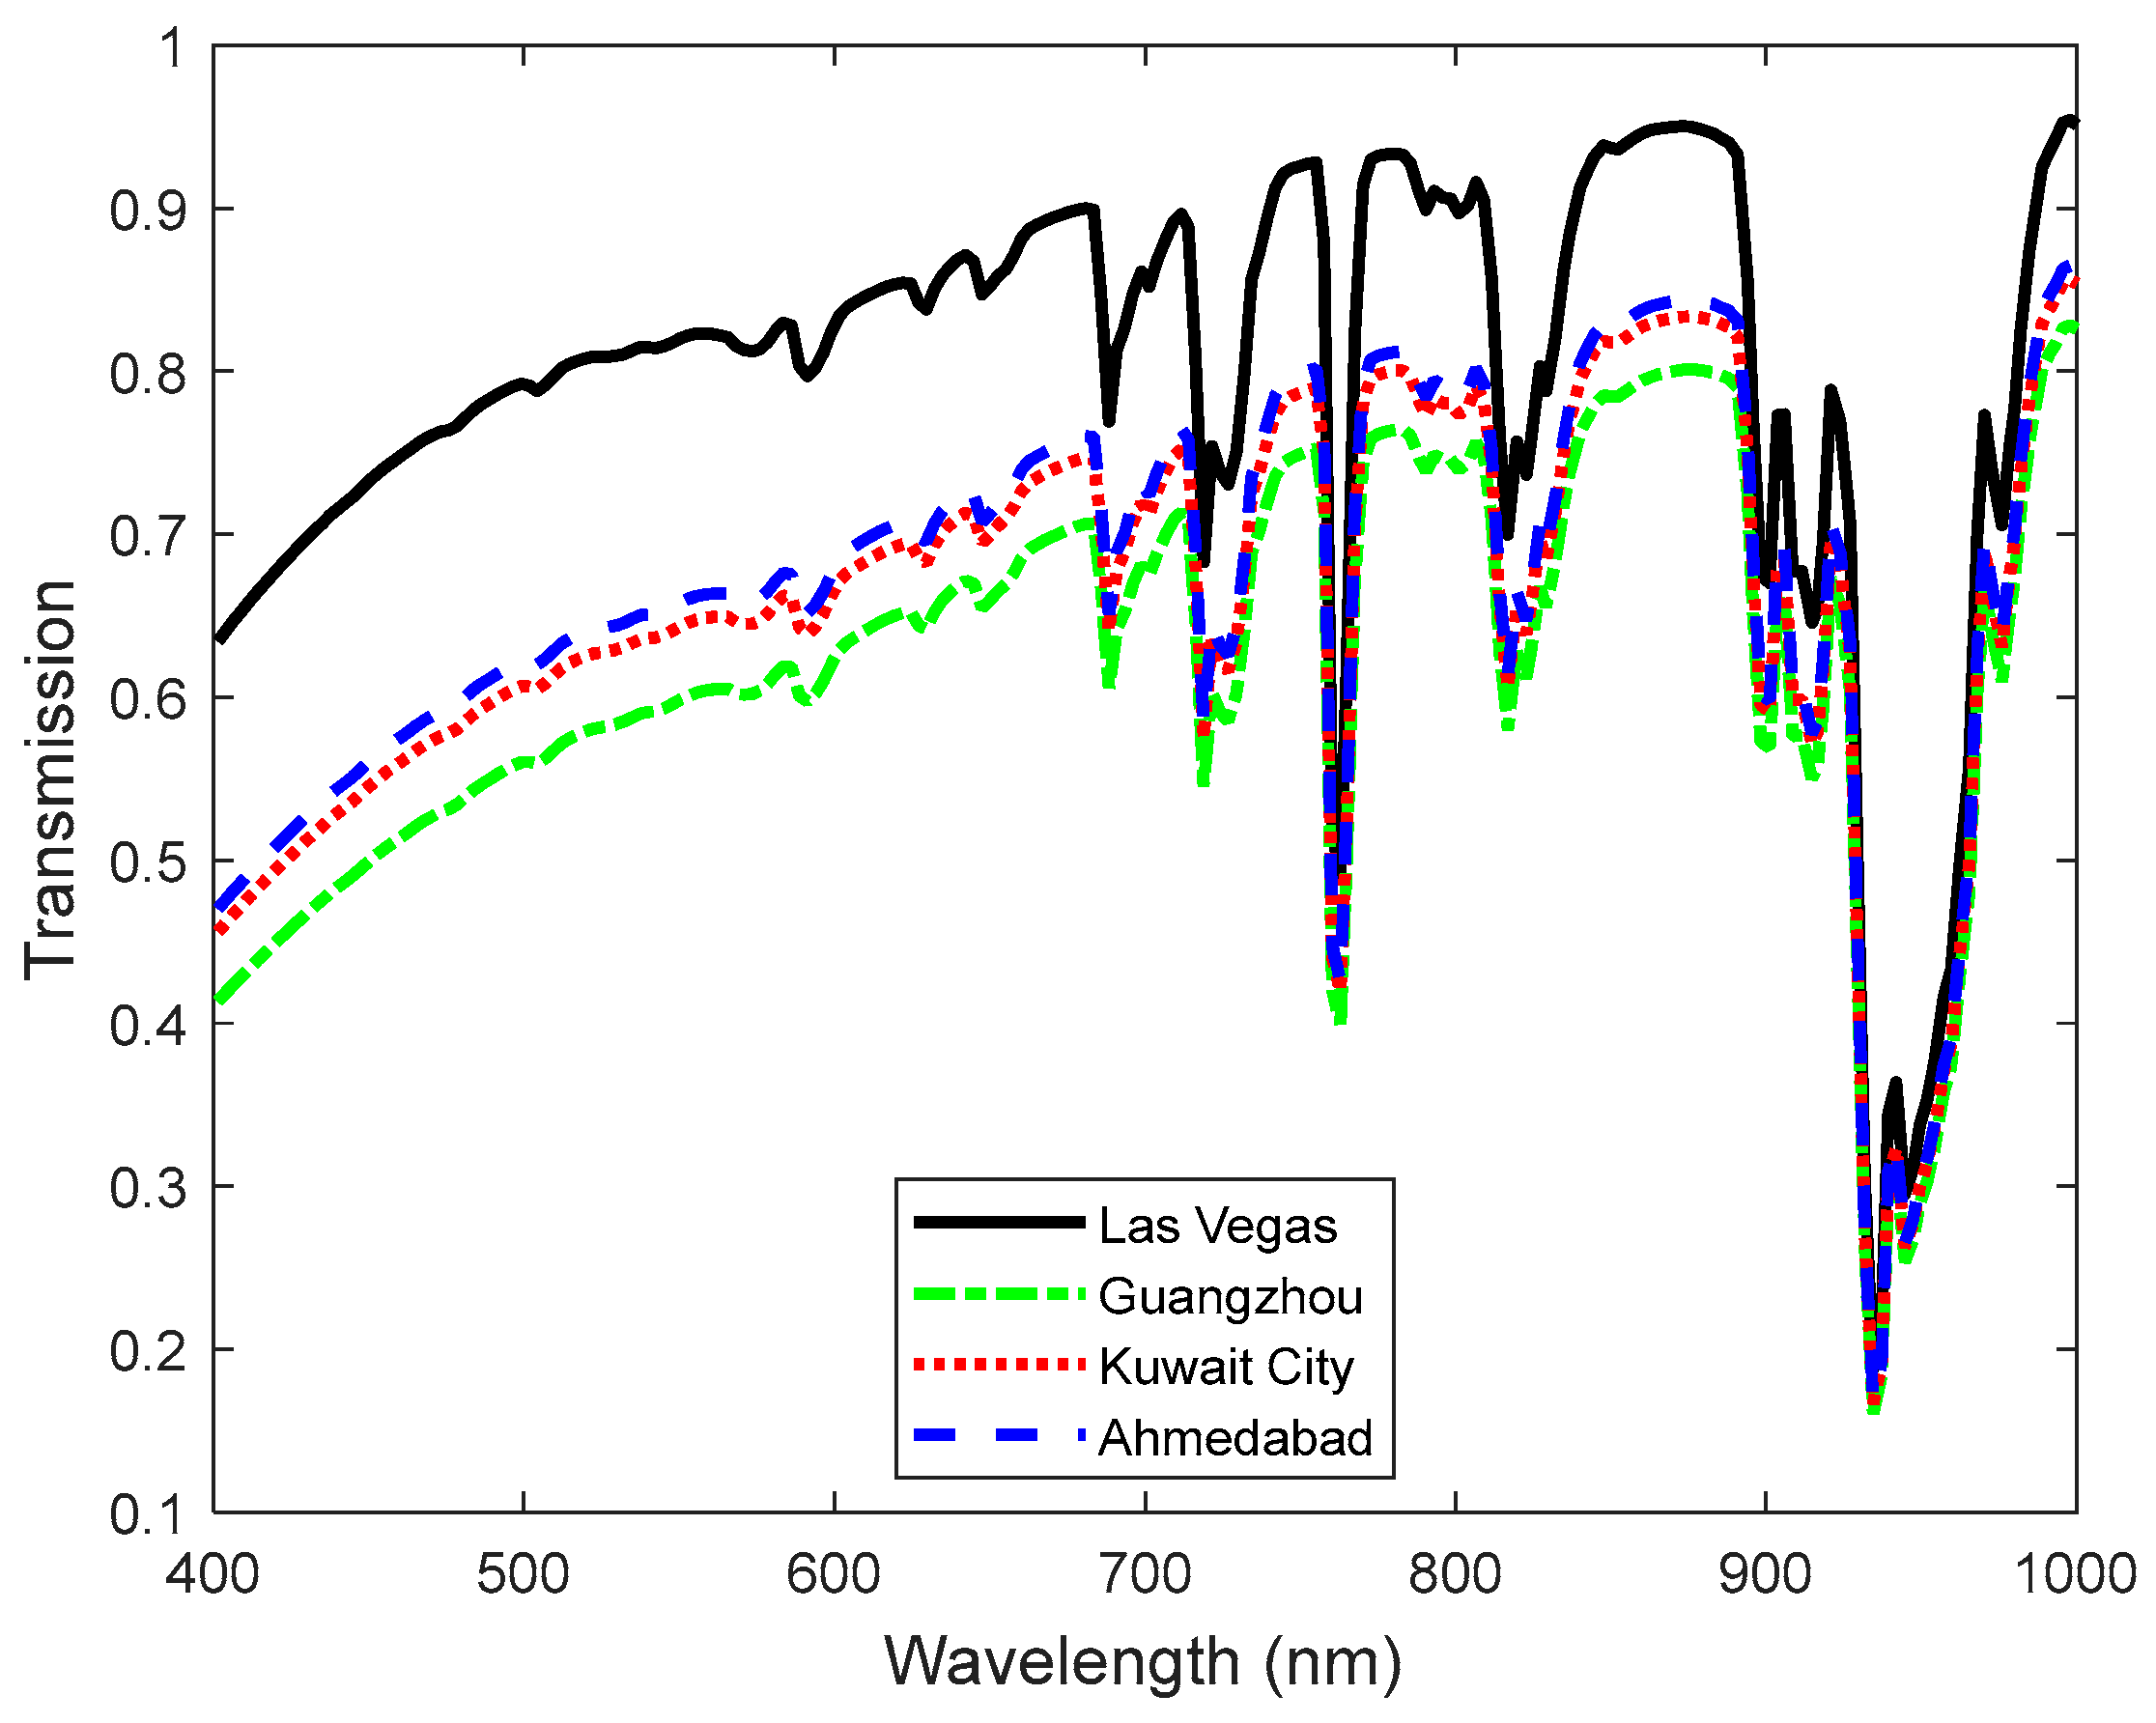
Atmospheric correction to ground-leaving radiance is calculated by dividing top-of-atmosphere (TOA) spectral radiance by ground-to-space atmospheric transmission. The MODTRAN 6 radiative transport code [32] was used to calculate ground-to-space atmospheric transmission based on a mid-latitude summer atmosphere with visibility adjusted to match aerosol optical depths (AODs) as measured that day by VIIRS [33] for Las Vegas (AOD 0.07, visibility 141 km), Guangzhou (AOD 0.38, visibility 19 km), Kuwait City (AOD 0.32, visibility 24 km), and Ahmedabad (AOD 0.29, visibility 26 km). Atmospheric transmission over the 400–1000 nm spectral range using a nominal 3 nm Gaussian FWHM to approximate DESIS’s spectral resolution was calculated (Figure 5) and evaluated at the DESIS band center wavelengths.
2.1.3. Spectral Smoothing
The spectra of artificial light vary depending on the light source. Artificial lights such as LEDs can be spectrally continuous with spectral features tens of nanometers wide, while HID (e.g., high-pressure sodium (HPS), metal halide (MH), mercury vapor) lamps can include several narrow spectral lines associated with atomic emission [34]. For these lamps, the atomic emission line widths depend on the lamp’s internal pressure and can be as small as a fraction of a nanometer. HPS and MH sources tend to have both continuous spectra and narrow atomic emission lines. Given the same spectral radiance and instrument sensitivity, narrow atomic emission lines are best detected with higher-resolution instruments like DESIS. At the same time, continuous sources are better detected with instruments that have a lower spectral resolution and higher SNR.
To attempt to optimize the sensor spectral resolution for different light sources, a hybrid approach was deployed that combines high-resolution 2.55 nm sampled DESIS data with a locally estimated scatterplot smoothing (LOESS) weighted regression algorithm using a second-order polynomial, with a span of 11 spectral samples or ~28 nm to smooth the spectra [35]. LOESS algorithms are flexible and can be used for narrow and broad spectral shapes. The robust iterative form of the algorithm [36] was not used since it overly attenuates narrow atomic emission lines, even though it could be useful for continuous spectra. LOESS smoothing over this 28 nm span reduces the atomic emission line peak amplitudes by only a factor of ~2, while substantially improving the quality of the spectra for continuum emissions.
2.1.4. True Color and Color Infrared Images and Spectral Movies for Visualization
True color and color infrared images and spectral movies were produced to better visualize lighting patterns and types. The processed hyperspectral radiance data (denoised, atmospherically corrected, and spectrally smoothed) were mapped to red, green, and blue display channels to display lights in nighttime scenes in true color (RGB) and color infrared (CIR). To reduce the effects of noise, the mean of a 50 nm wide spectral region centered at 650, 550, and 450 nm was used for the RGB channels, and the same centered at 820, 650, and 550 nm was used for the CIR channels. Since most lights have limited near-infrared (NIR) emission and many HID lamps have a sodium (Na) 820 nm emission line, 820 nm was selected as the red channel for the CIR imagery. The 450 nm blue band, which is approximately centered on the blue pump LED in white light LEDs, was selected for the blue channel.
A spectral movie is a compilation of per-band processed images that progress along the 235 DESIS channels as the movie plays, and it comprises a convenient way to find and identify lights since locations that show a persistent (broadband) illuminated pixel or a spectrally intermittent illuminated pixel (at discrete wavelengths, such as those associated with an emission peak) are strong indications of artificial light.
To make spectral movies, the LOESS spectral filtering method (described above) is applied to the data to smooth the spectra and reduce noise. The spectral channels are mapped to “a” and “b” in the L*a*b* color space [37], and luminosity values are replaced by the spectral radiance for each spectral channel. The updated L*a*b* color space is then mapped to the RGB color space for display purposes. A gamma stretch with a gamma value of 0.7 is applied. The 650 nm color map is used for wavelengths above 650 nm, and the 425 nm color map is used for wavelengths below 425 nm, which causes the longer NIR channels to all appear red.
2.1.5. Light Source Detection
NTL sources were detected by searching a scene for pixels with an SNR above a threshold value (set between 8 and 20) at any wavelength within a selected range. DESIS’s 235 channels increase the possibility of false alarms, necessitating a high SNR threshold. Spectral smoothing can benefit broadband source detection, but since spectral smoothing optimization depends on the detailed spectral shape, a high spectral resolution without spectral smoothing search was conducted. This method detects nearly all broadband (e.g., LEDs) and monochromatic sources (e.g., atomic emissions from HPS or MH lamps).
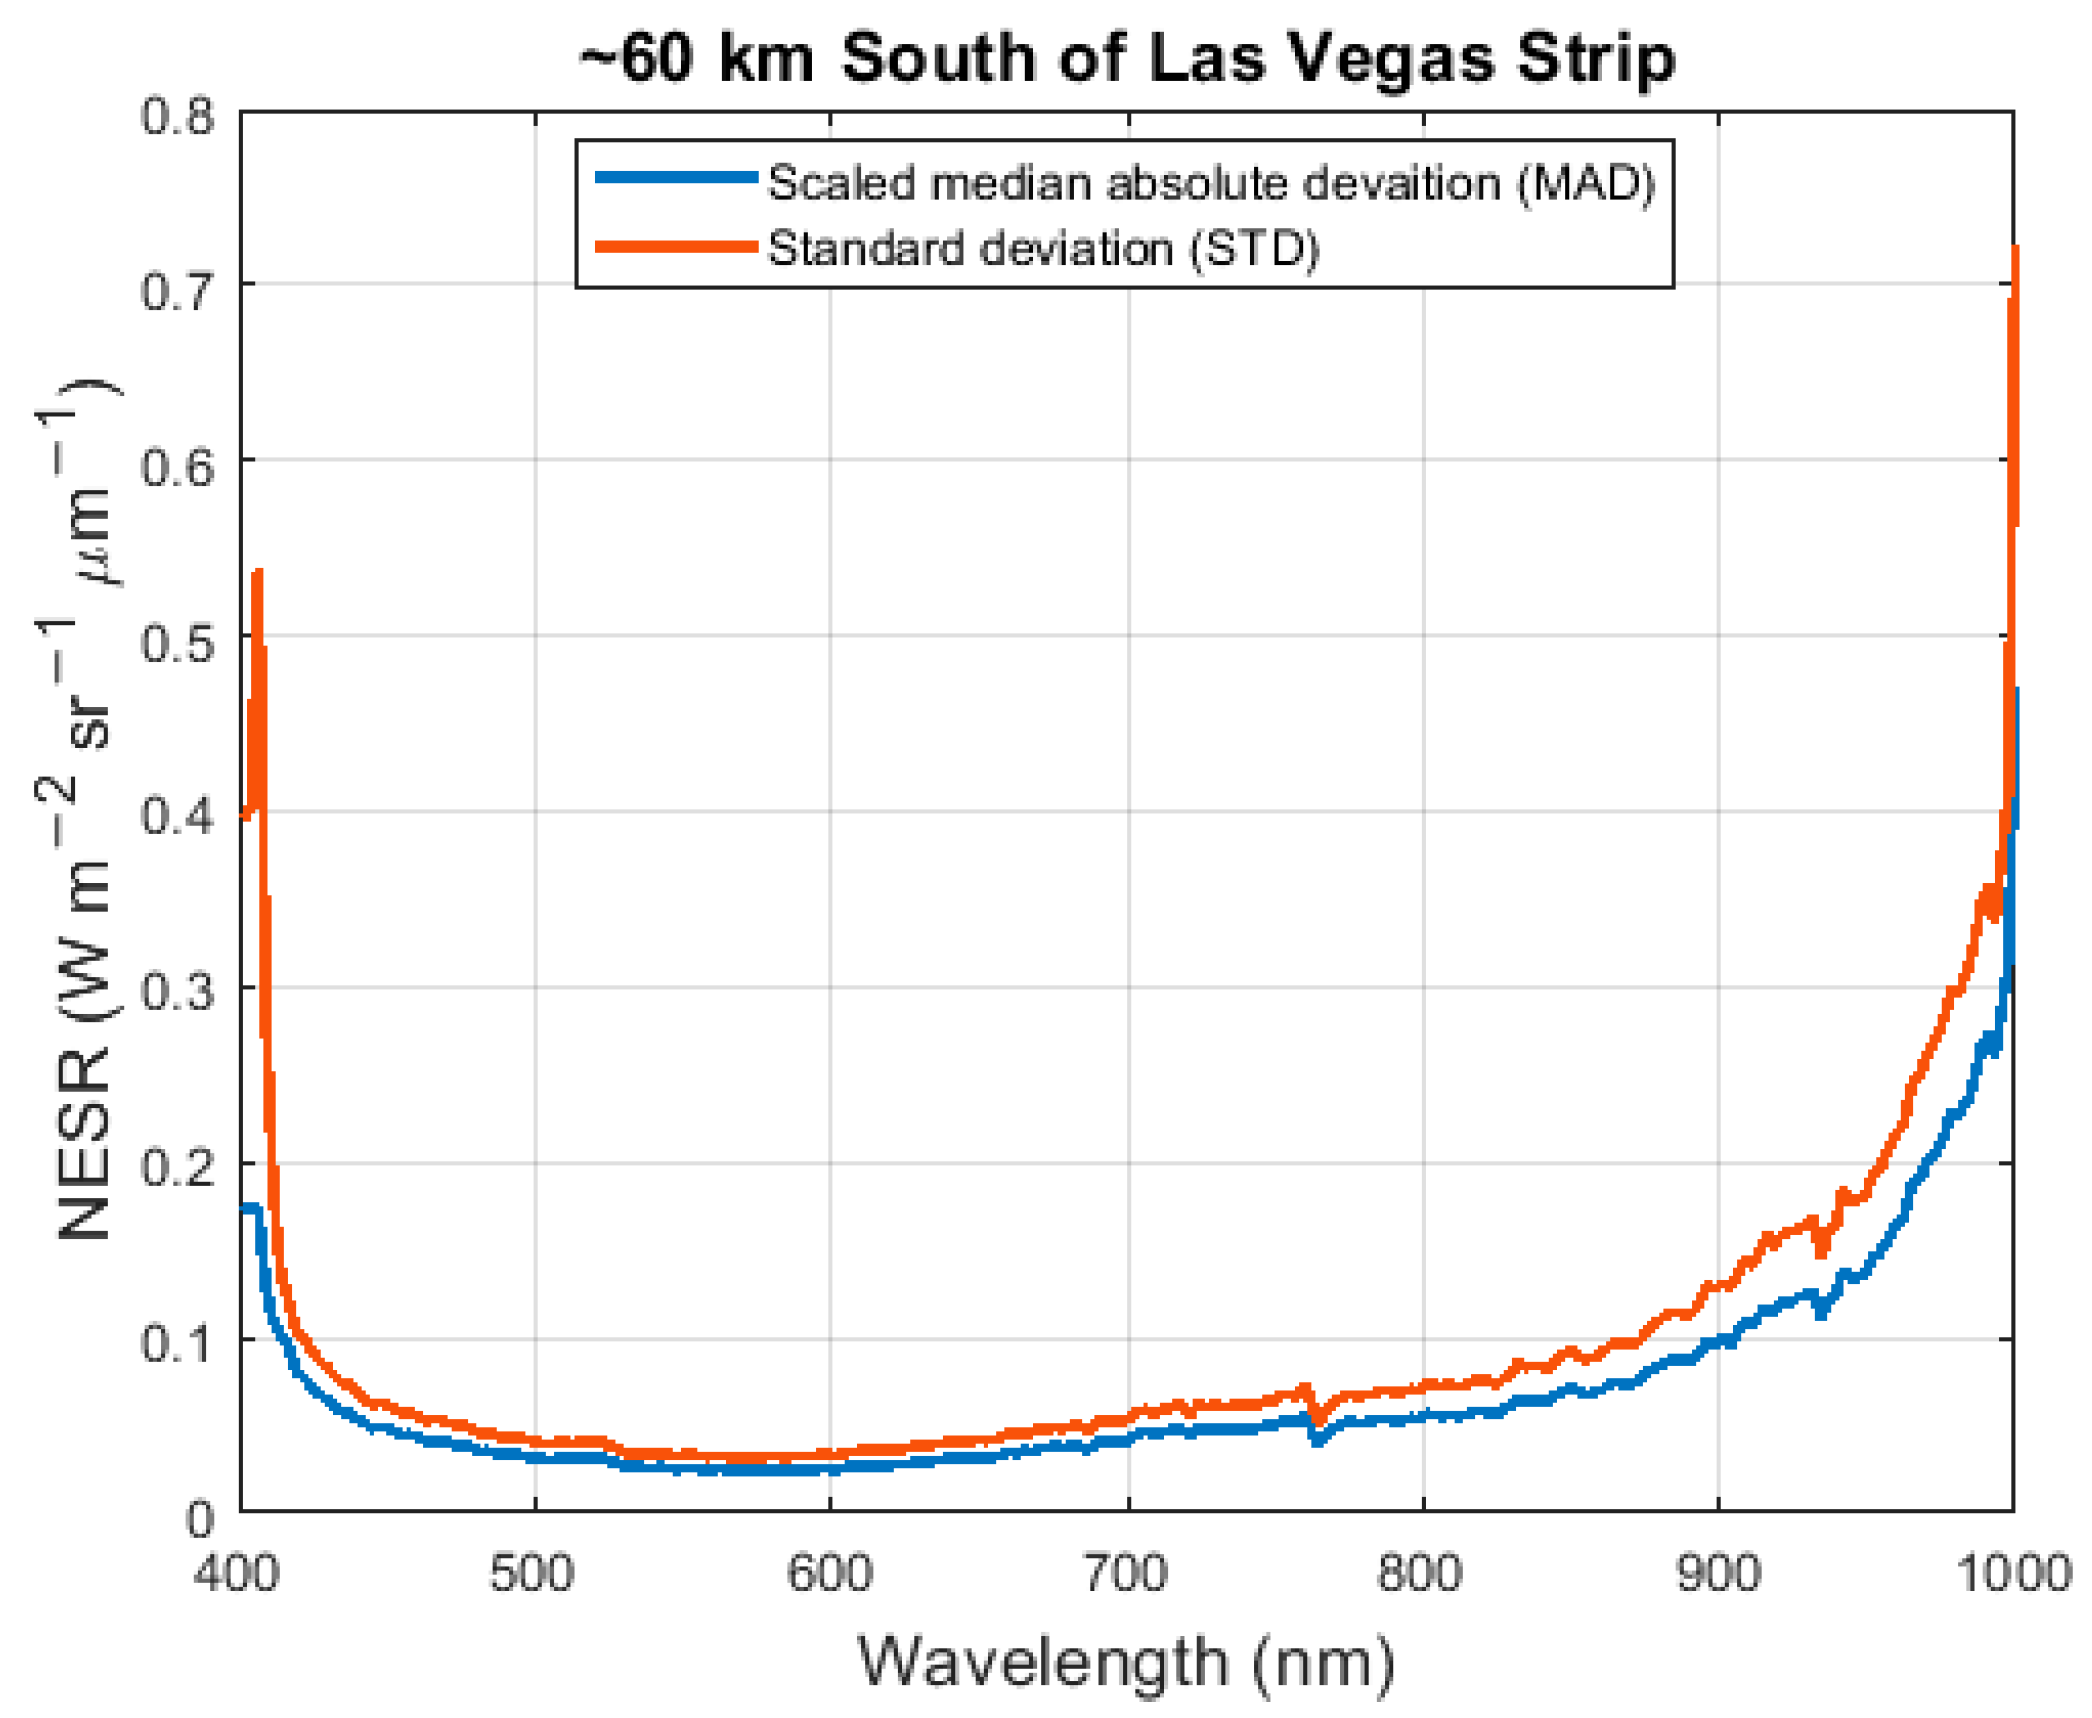
To calculate SNR, each pixel’s spectral radiance is divided by the noise equivalent spectral radiance (NESR) at each band. NESR is estimated based on a scene-level standard deviation (STD) and/or scaled median absolute deviation (MAD) [38]. The STD and scaled MAD for an assumed normal distribution are very similar for dark scenes except at the spectral extremes (e.g., near 400 nm or 1000 nm), where the scaled MAD is more predictable. Figure 6 shows an NESR estimate from a dark L1B spectral radiance scene of a largely undeveloped region ~60 km south of Las Vegas, NV (Tile 3 in Table 2), using both STD and scaled MAD approaches. The scaled MAD estimate for NESR is less influenced by outliers that occur in the least sensitive spectral regions of the instrument (such as the deep blue wavelength region), and while it could be applied to any DESIS nighttime scene, after examining multiple scenes, it was found to be relatively invariant in terms of scene location and time for dark scenes. For this investigation, a scaled MAD approach was applied to a single dark scene to determine NESR, and then it was applied to all scenes. The NTL source search spectral range was limited to 415–900 nm since the NESR grows exponentially above and below this range. The NESR shape is approximately the inverse of DESIS’s sensitivity due to detector and spectral throughput variations. The lowest NESR value occurs around 600 nm, which makes it easier to detect visible light sources.
During this investigation, several night scenes with different artificial lights were assessed. SNR thresholds were employed. While very few lights are detected for threshold values above the upper limit (SNR > 20), their spectra are relatively clean and useful for creating spectral templates to help identify light types. Lower threshold SNRs (SNR < 8) generate many poor-quality spectra, making it more difficult to identify the source type. Searching every wavelength between 415 and 900 nm also increases the probability of having an outlier.
2.1.6. Light-Type Identification
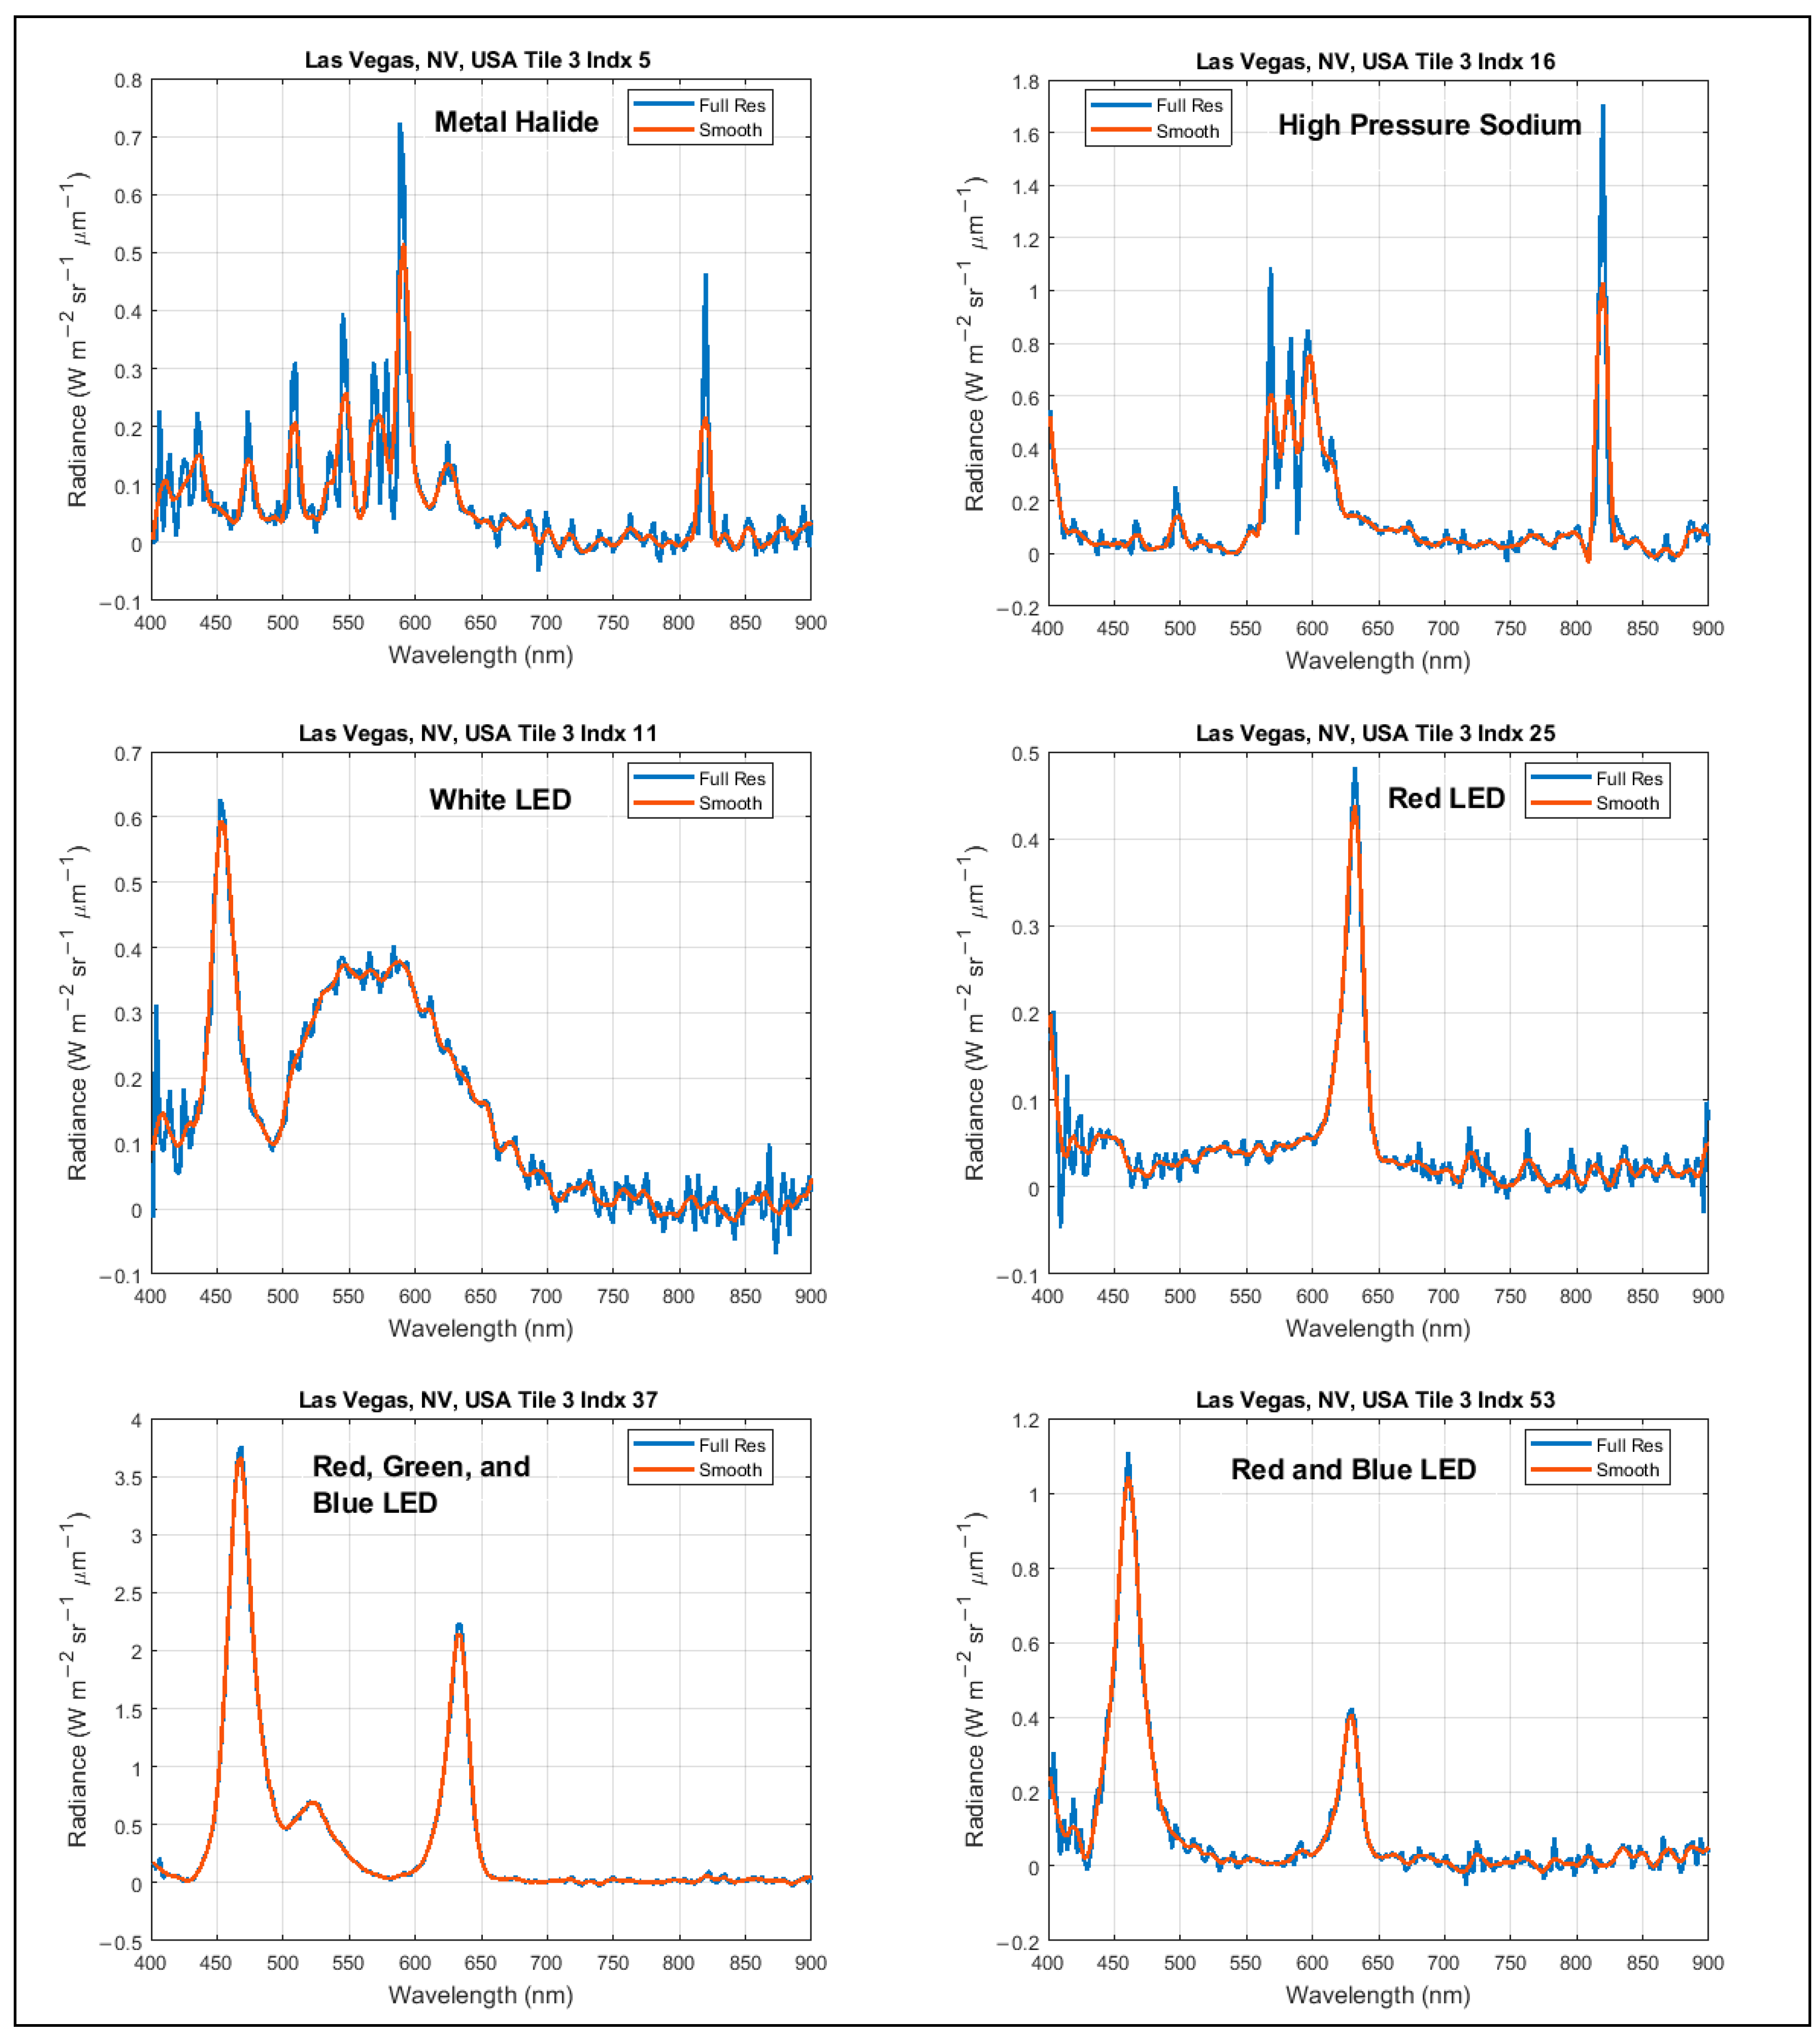
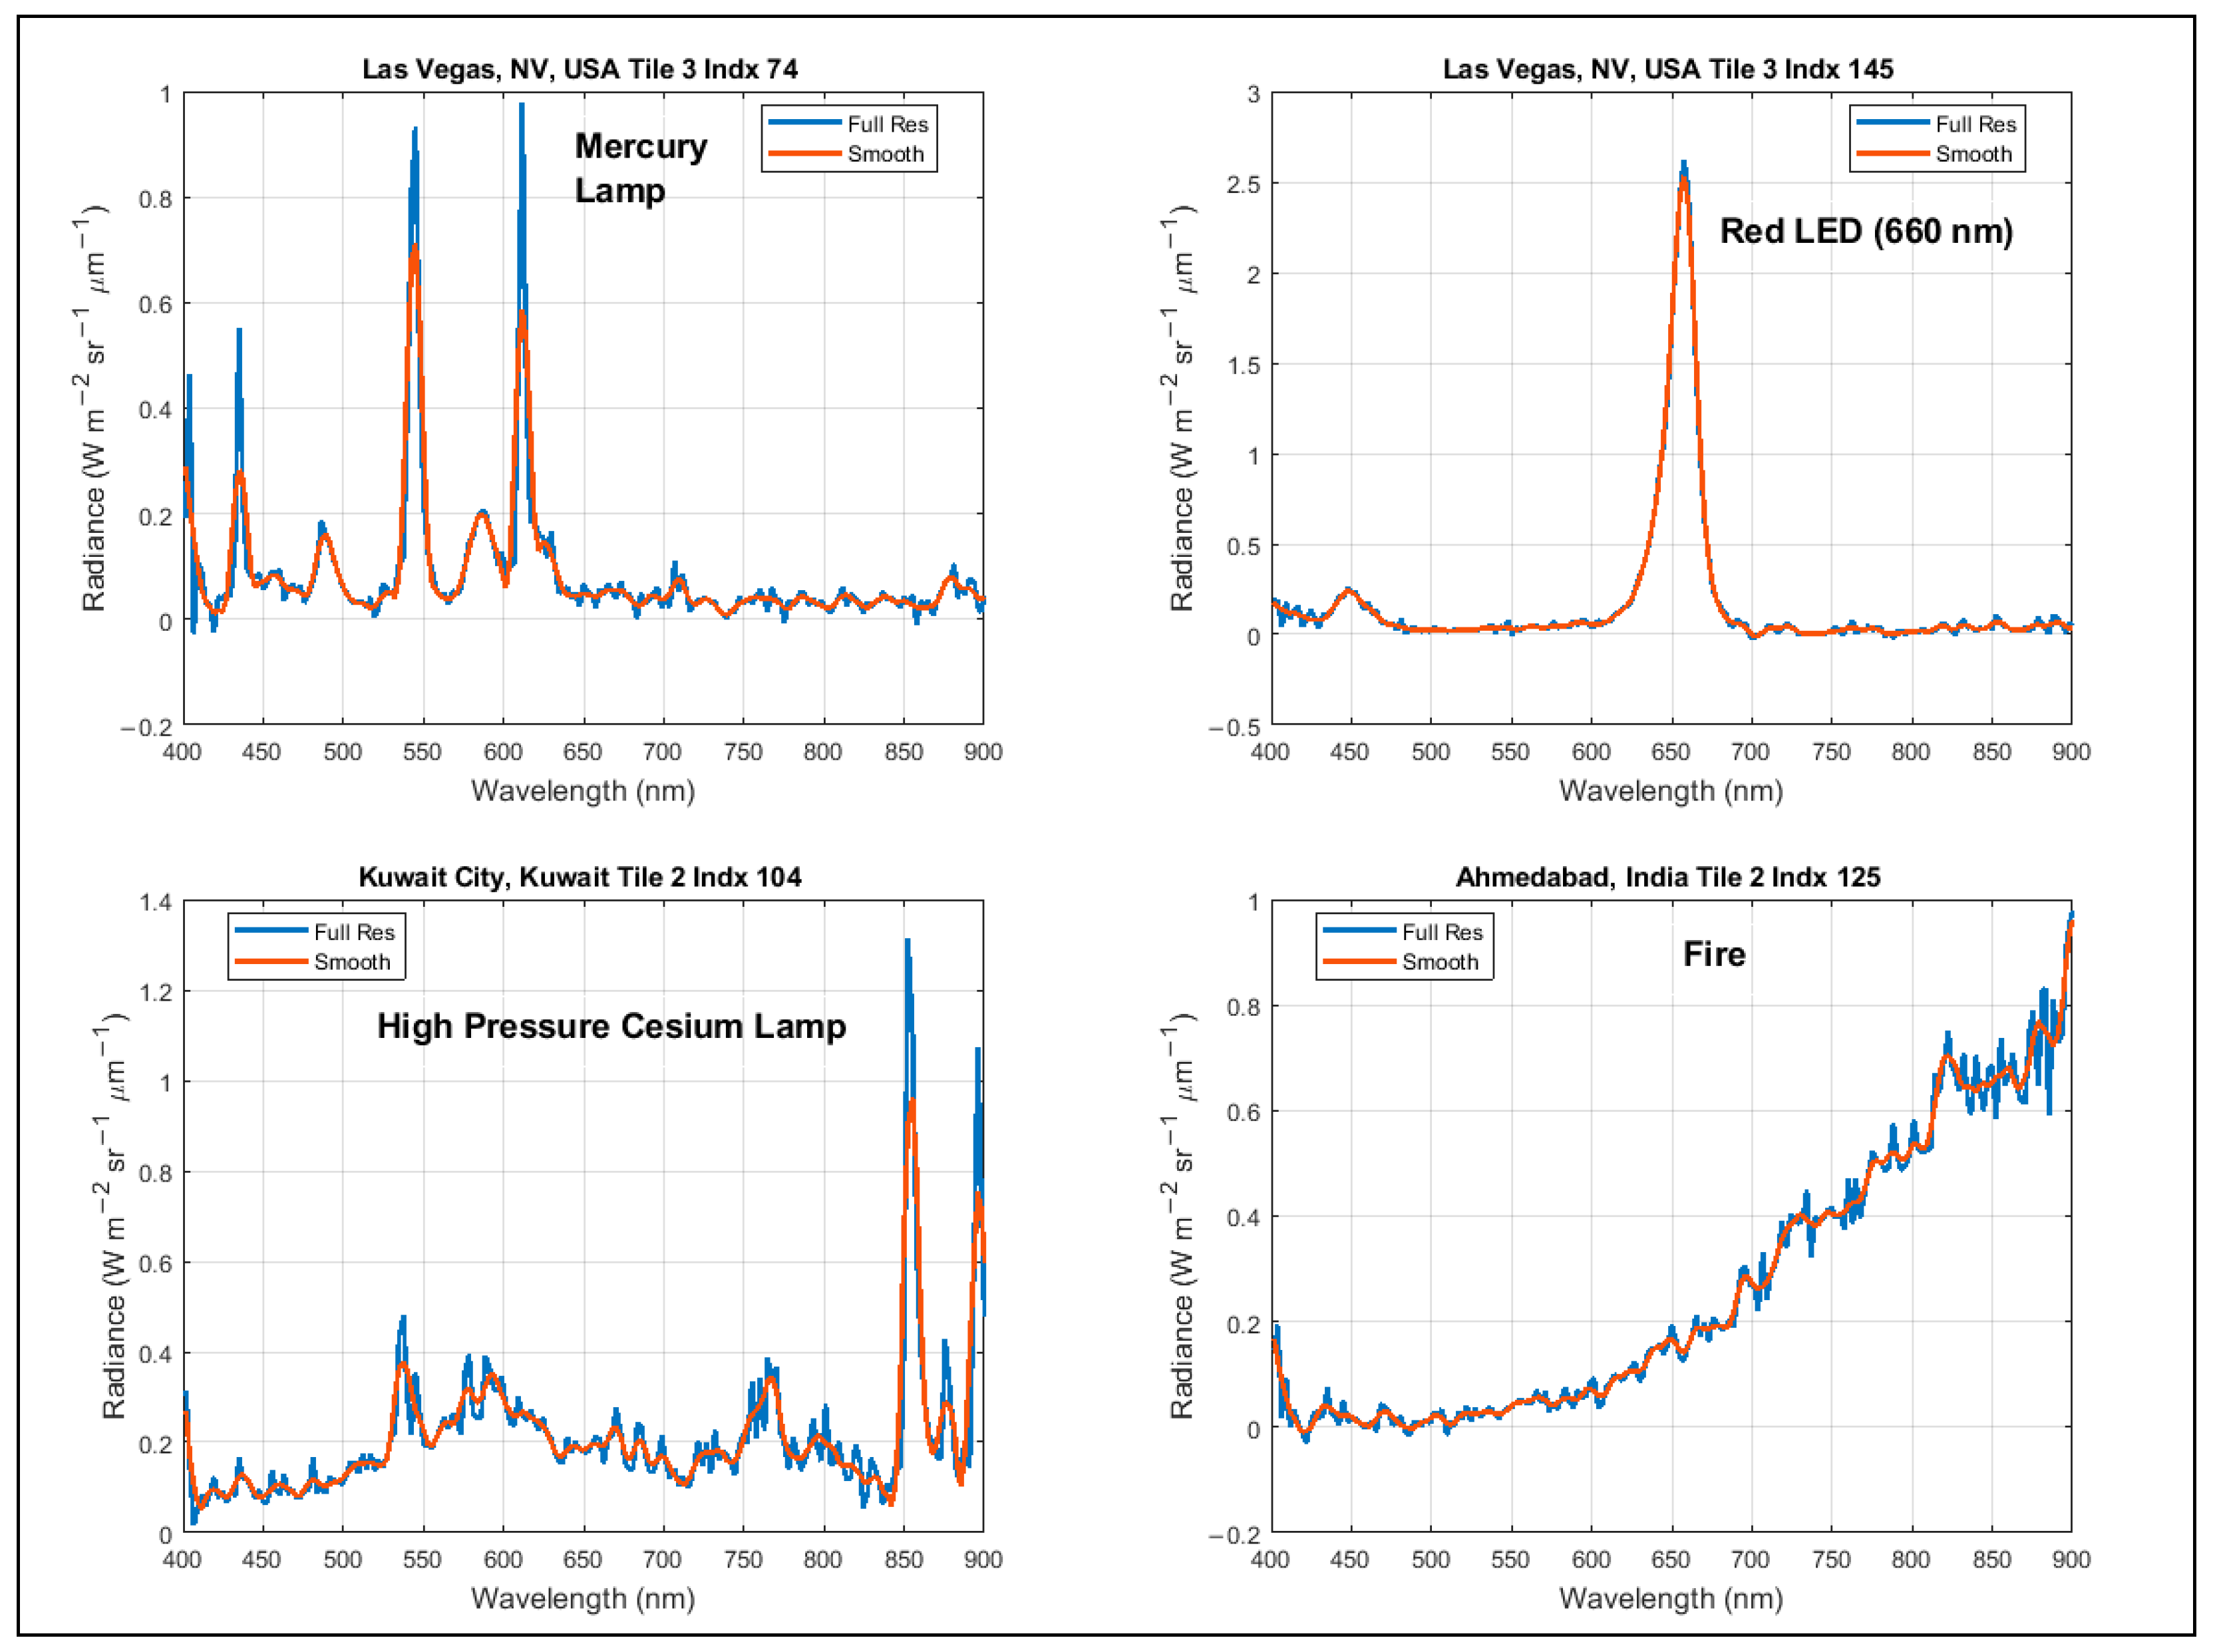
To identify discrete light sources, spectral templates for common light sources were generated by selecting several DESIS high-quality spectra (SNR > 20) for each light type. Figure 7 shows the template spectra derived from Las Vegas (Tile 1 in Table 2) for common light sources, and Figure 8 shows other less common light sources. The native spectra and spectrally smoothed spectra are displayed in the figures.
A fire near Ahmedabad, India, acquired on 1 January 2021, is also shown in Figure 8. The fire’s spectral signature shows a black body (Planck function) shape with most of the emission in the NIR. A simple atmospheric correction that uses an estimated atmosphere (discussed above) corrected the O2 absorption feature.
2.1.7. Ground Truth Validation
Ground truth data from several light sources were collected with two calibrated SI-traceable, high-spectral-resolution Avantes spectrometers fed by fiber optics: AvaSpec models ULS2048-USB2 and ULS2048-EVO. Both instruments have approximately 0.6 nm spectral sampling and resolutions between 1.1 and 1.4 nm, which is much higher than DESIS (2.55 nm spectral sampling and 3.5 nm spectral resolution). The spectrometers were radiometrically calibrated to measure spectral radiance with an Optronics O.L. 455-6SA-2 integrating sphere illuminated with a quartz tungsten halogen lamp. The spectrometer’s wavelength calibration was determined with mercury argon (HgAr) and argon (Ar) pen lamps with known atomic emission lines.
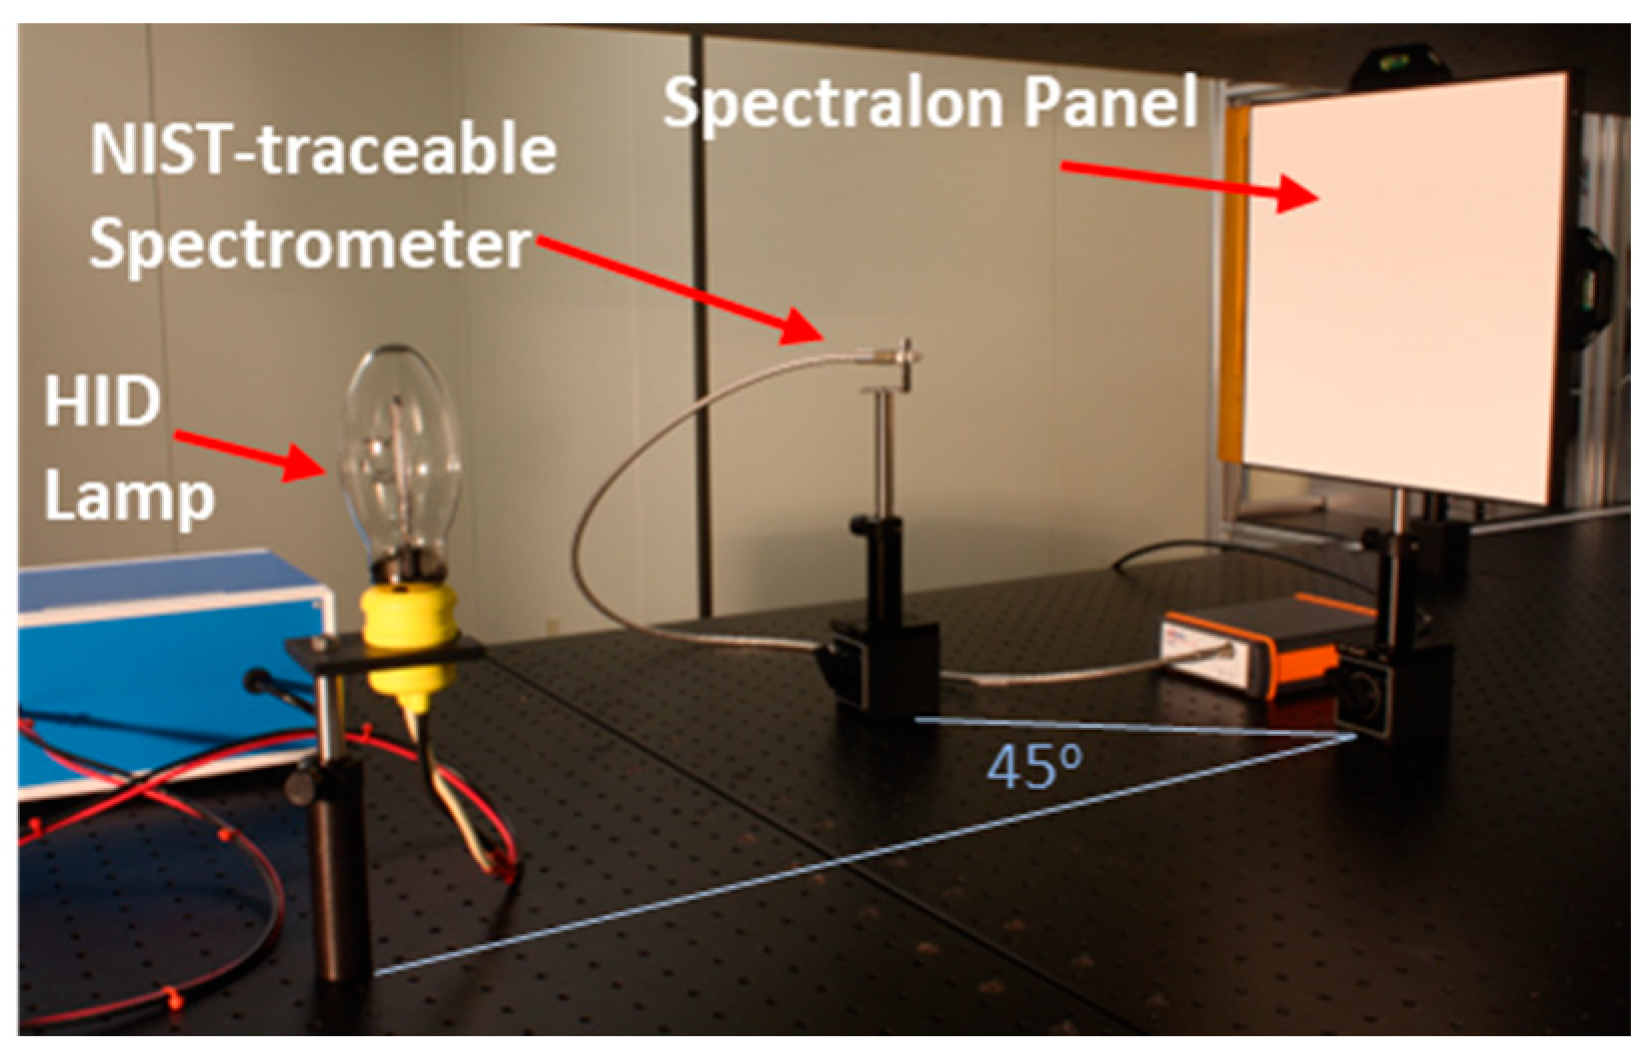
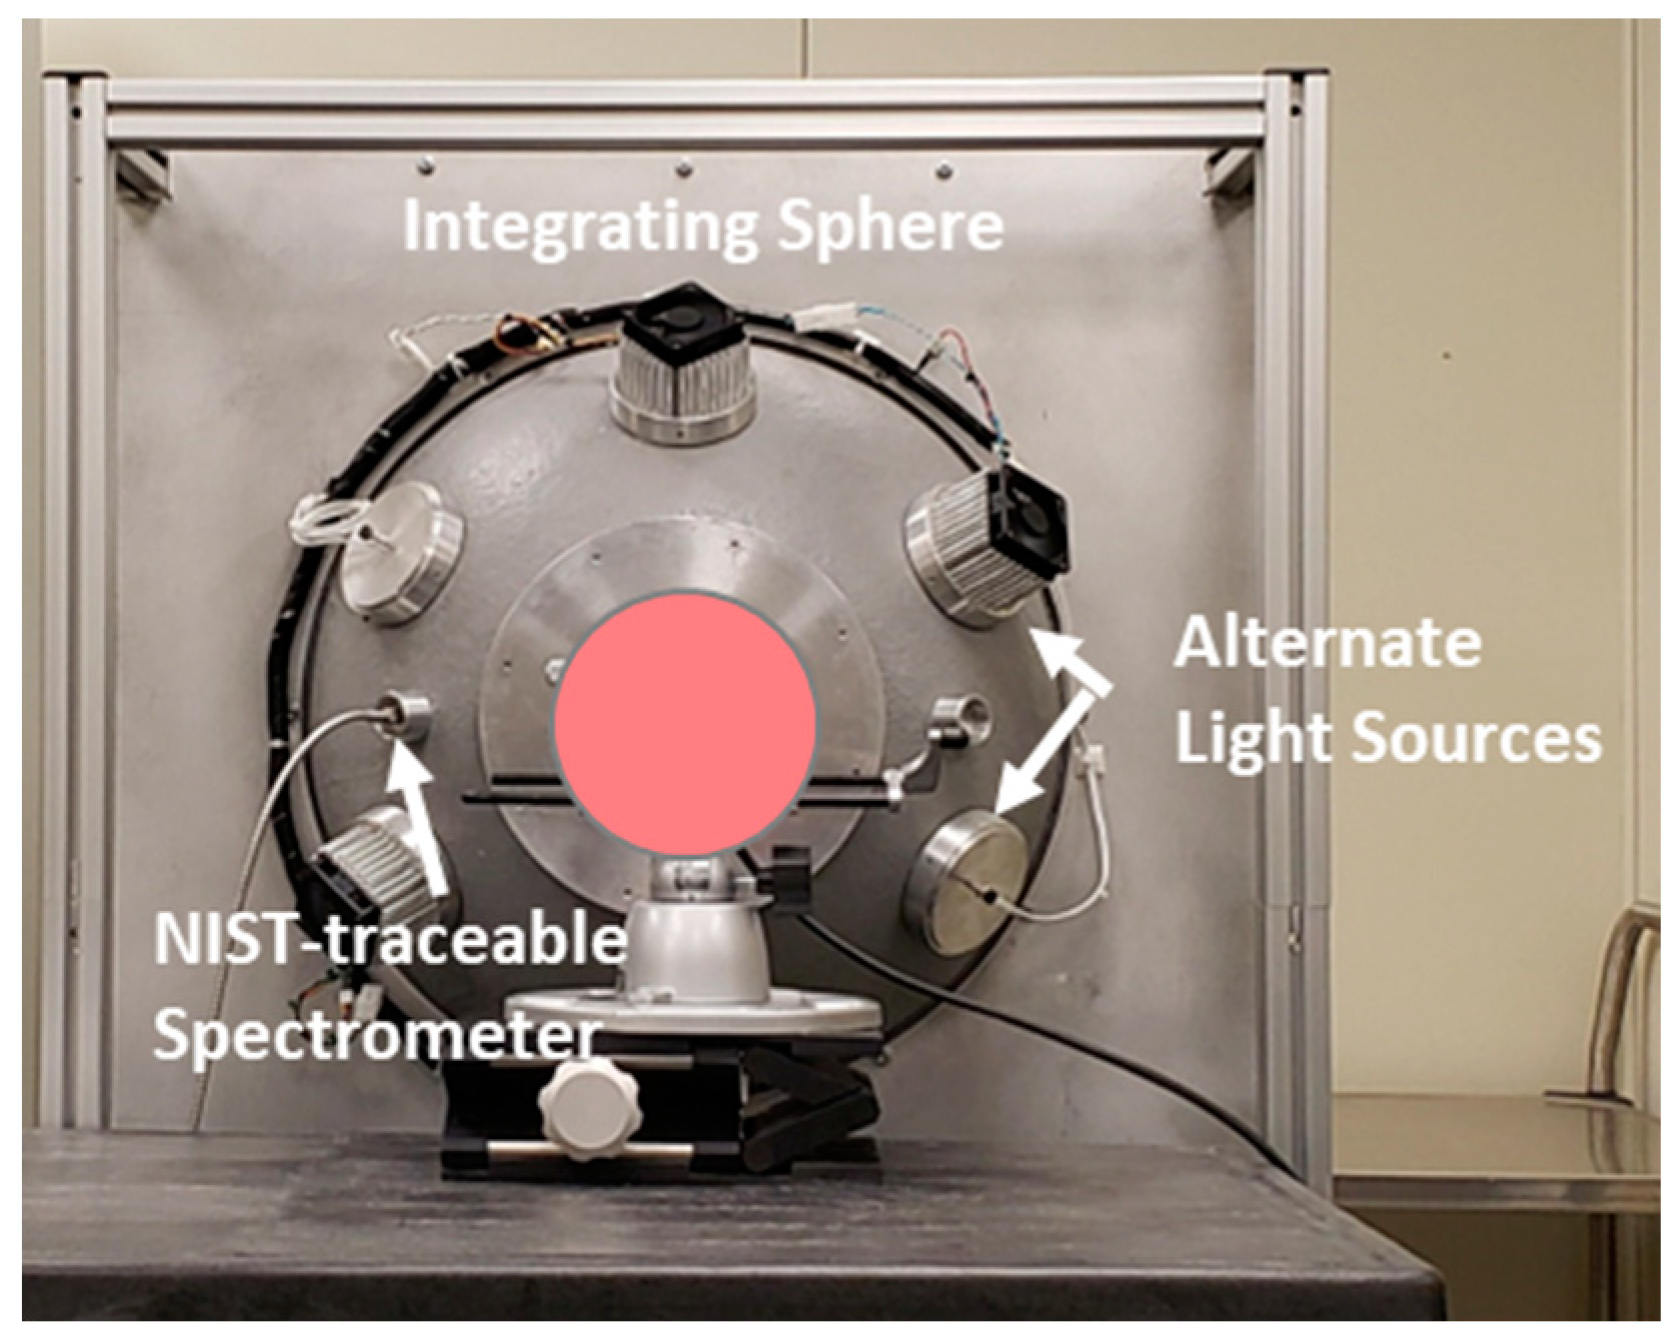
HPS and MH HID lamp signatures were collected in the laboratory using a ~30 cm square SpectralonTM (Labsphere, North Sutton, NH, USA) panel. Figure 9 shows the laboratory setup for measuring the spectrum of the two HID lamps. White and red LED signatures were also collected in the laboratory, but this was carried out using a 500 mm diameter integrating sphere coated with BaSO4 paint instead. Figure 10 shows the laboratory setup used to acquire the LED spectra.
3. Results
Figure 11 shows the resulting DESIS L1B RGB and CIR images of Las Vegas, NV, and Guangzhou, China. Using this band combination display, white light LEDs commonly appear blue in RGB and CIR imagery due to the blue pump and sometimes green in RGB imagery. HPS lamps tend to be yellow in RGB but red in CIR. The imagery within the figure is L1B and not geometrically corrected.
3.1. Comparison of DESIS Imagery with VIIRS
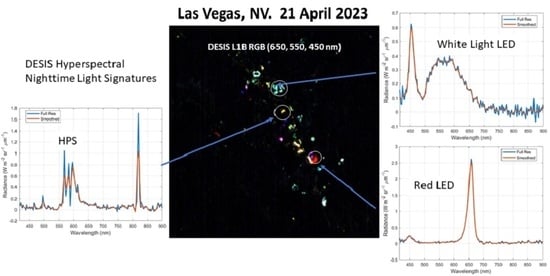
The VIIRS DNB is a well-calibrated instrument capable of measuring accurate measurements of low-light radiances [39,40]. Figure 12 shows the single band (500–900 nm) monochrome VIIRS DNB [41] image and a DESIS RGB (650, 550, 450 nm) orthorectified L1C product over the Las Vegas strip, NV. Both images were acquired on 21 April 2023. The generated VIIRS Black Marble product used in this comparison is the at-sensor TOA nighttime radiance daily Level 3 product (VNP46A1), which was downloaded from NASA’s Earthdata portal (https://search.earthdata.nasa.gov/search, accessed on 28 February 2024).
While the VIIRS DNB cannot detect the blue pump of the white light LED, 750 m GSD data have high sensitivity and exhibit illumination over the region that is not visible in the DESIS image. In contrast, DESIS’s 30 m spatial resolution shows details and light region separation. Spectral information, given by the DESIS dataset, enables light-type identification over the high-illumination Las Vegas region, as shown in the color image.
An example of a spectral movie is shown in the Supplemental Materials.
3.2. Ground Truth Spectra
Figure 13, Figure 14 and Figure 15 show the ground-truth spectra of each light source as measured by the NIST-traceable ground-truth spectrometers and DESIS. The DESIS spectra shown have not been smoothed and were attained at an SNR of >20 and compared closely to the ground-truth spectra. Noting the differences in the red LED lamp spectra shown in Figure 7 and Figure 8, there are many white light and colored LED lamp types. Figure 15 likely shows LED lamp types that are similar but not exactly the same, so their spectra do not agree as well as the spectra within the other figures.
3.3. Light Identification Map
The ground truth-validated high-quality DESIS spectra shown above were then used as light source templates. Correlation coefficients between each light source in a scene and the templates were computed, and the highest correlation coefficient identified each light source. While this simple correlation coefficient approach is valid for pure light sources, many real-world light sources have mixed lighting types, which require a spectral mixing approach.
4. Discussion
Identifying obstacles and predicting performance for night imaging applications has significant implications in designing emerging commercial and space agency hyperspectral imagers.
Hyperspectral images of artificial night lights are far more complex than solar-lit daytime scenes, which are nearly always continuous in the NIR spectrum (some narrow-band molecular absorption features excepted). Sunlit scenes are also spatially extended radiometric sources. At DESIS’s spatial resolution, NTL sources can either be spatially extended or point sources. An individual light source that is a small fraction of a pixel behaves like a point source, radiometrically resembling a star, and it can illuminate one pixel or a portion of several pixels depending on the source’s location on the pixel grid. In contrast, a cluster of multiple light sources or a single source with a large beam spread could illuminate multiple pixels, resulting in an extended source. The radiometrically distinct behaviors of point and extended sources require a method of NTL detection that accounts for both sources of light.
In the spectral domain, artificial light spectra can also range from continuous to monochromatic, corresponding to extended and point sources in the spatial domain. Light from narrow-band lasers or atomic emission lines will primarily fall into a few spectral bands.
To understand the sensitivity of a hyperspectral imaging sensor, one needs to consider the instrument’s spectral sensitivity described by the NESR and the spectral and spatial properties of the light source. The minimum observed optical power, (W), can be defined as the smallest detectable light source for an SNR of unity.
can be defined for a light source illuminating a 100% reflective Lambertian target, where the self-shadowing of light is assumed to be small:
where is the pixel area in m2, is the one-way upward transmission from the ground to space, is the fraction of light captured by a pixel, is the FWHM of the spectral channel, and is the fraction of light captured by a spectral channel. This model assumes that the artificial light is pointed downwards, and all light is reflected off a perfect Lambertian target. A 100% reflective target was chosen since one can scale the results knowing the surface reflectance value.
At the lowest DESIS NESR at 600 nm of 0.034 W·m−2·sr−1·μm−1, of 0.77, and of 900 m2, with and set to unity for an extended and continuous source, is ~0.387 W. can be estimated for other cases where and are not equal to 1 if we approximate values for and for all cases by assuming the Gaussian point spread function (PSF) and spectral responses, as shown in Table 3.
To determine we used an MTF@Nyquist of 0.2 to derive the FWHM, which is appropriate for L1B data and when not considering spatial interpolation or smoothing. By carrying this out, we estimated a value of 0.41. We used a 3 nm FWHM for and determined a value of 0.68.
The values listed are for a nearly ideal case and are relatively small. For detection, these values are scaled by the SNR threshold and the inverse of the surface reflectance, so the values can easily be two orders of magnitude higher. Considering the electrical efficiency of the lamps (the conversion from electrical to optical Watts), light sources typically need to be at kilowatt levels to produce high-quality DESIS spectra.
Night Imaging for Wavelength Calibration/Validation
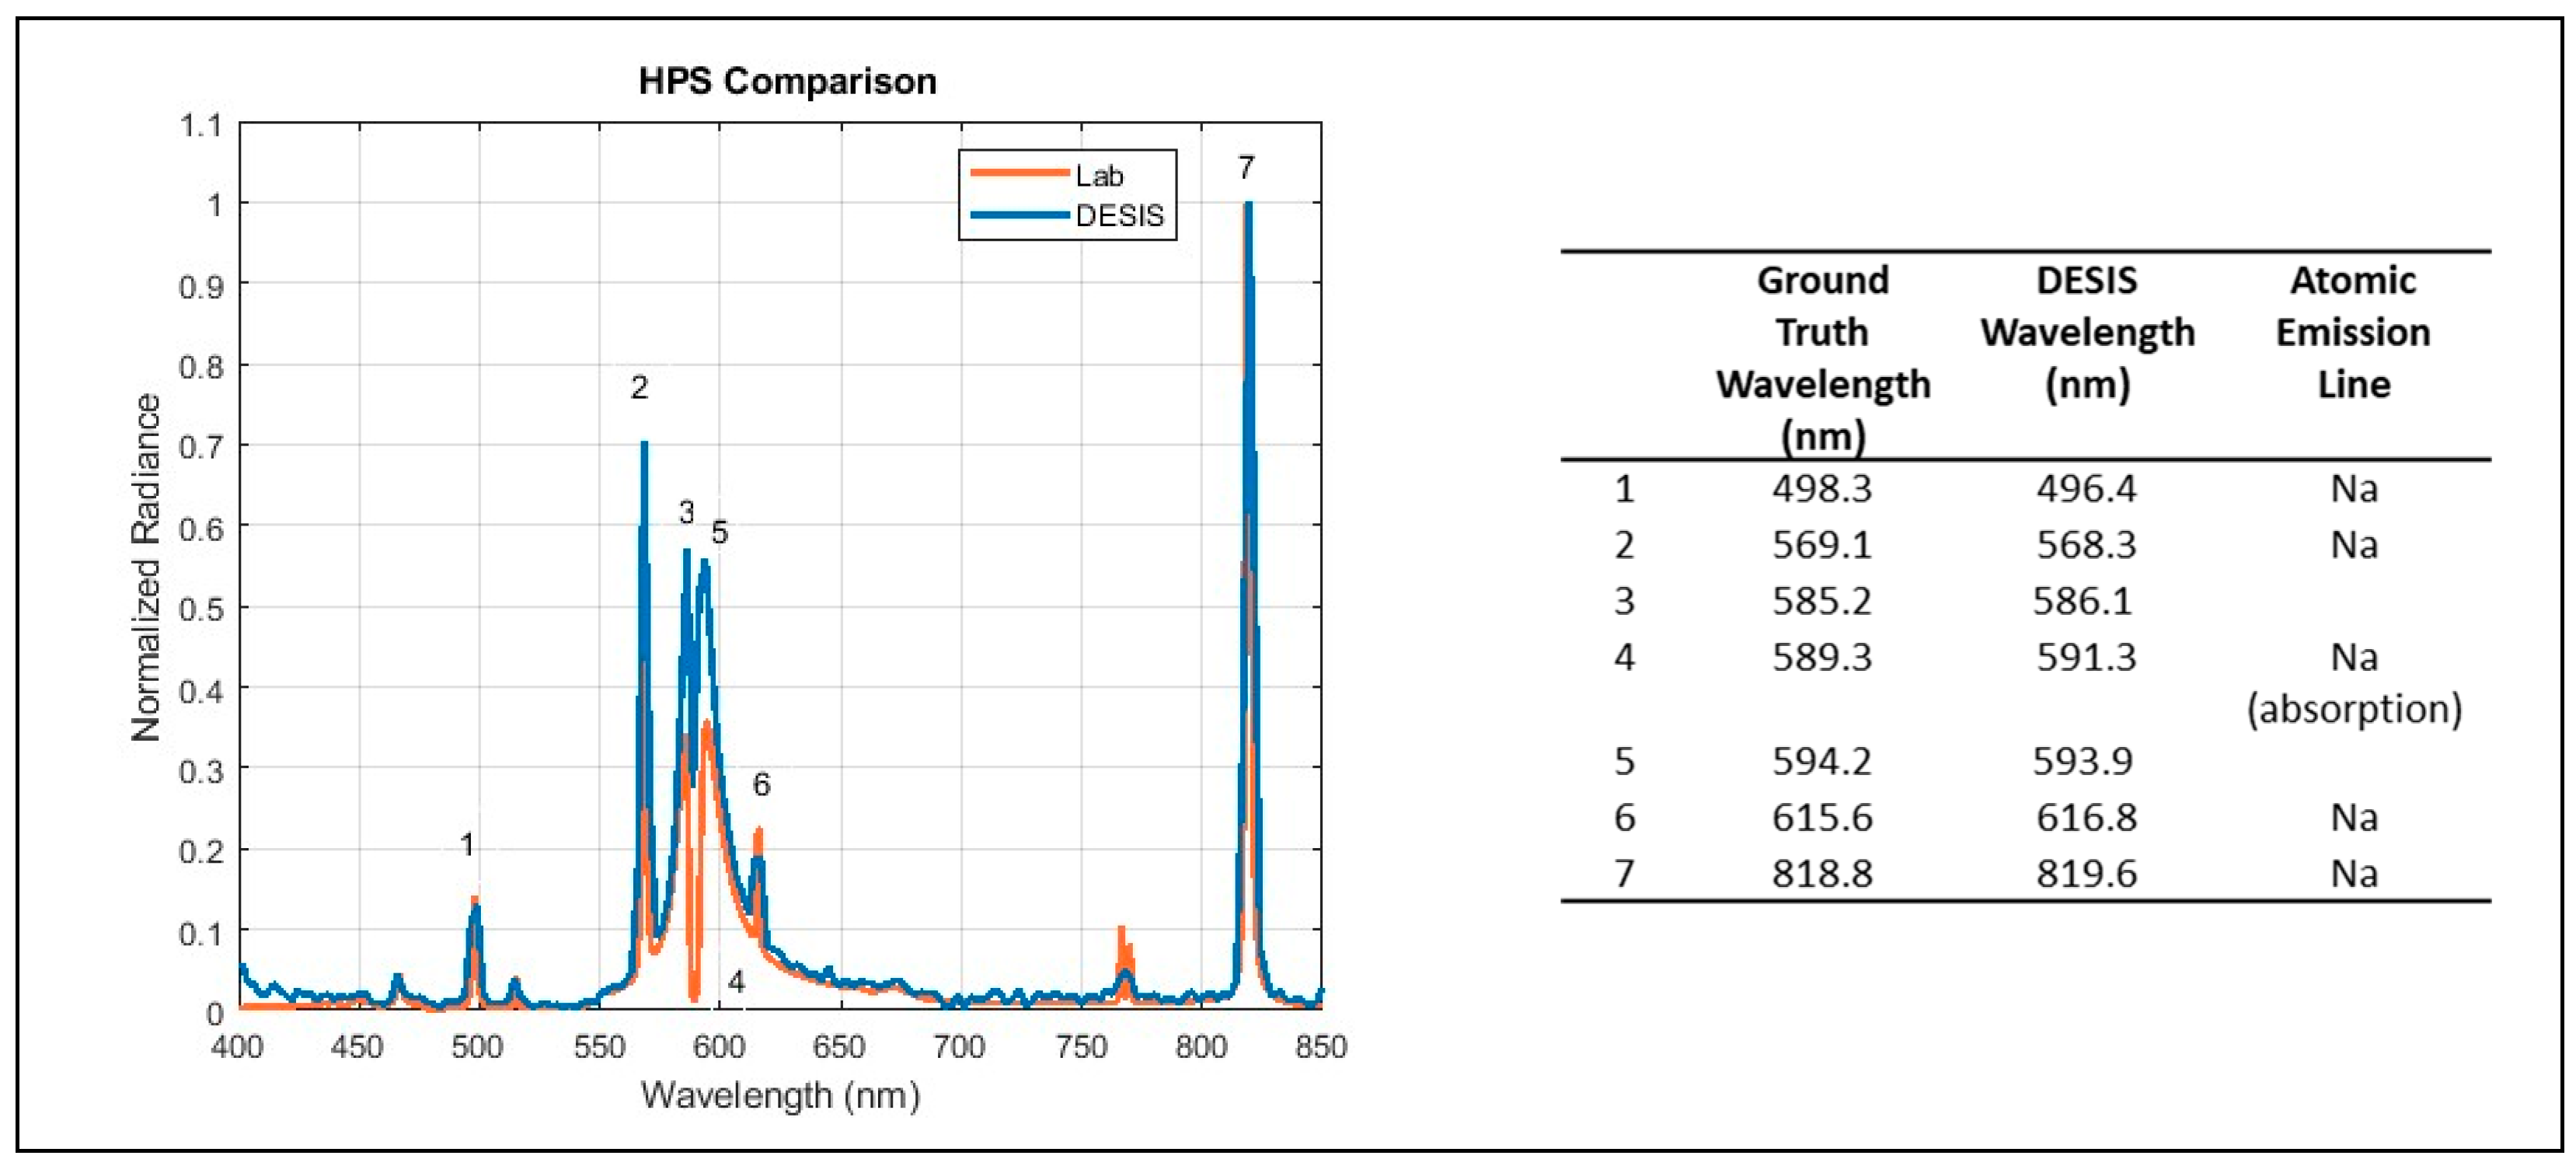
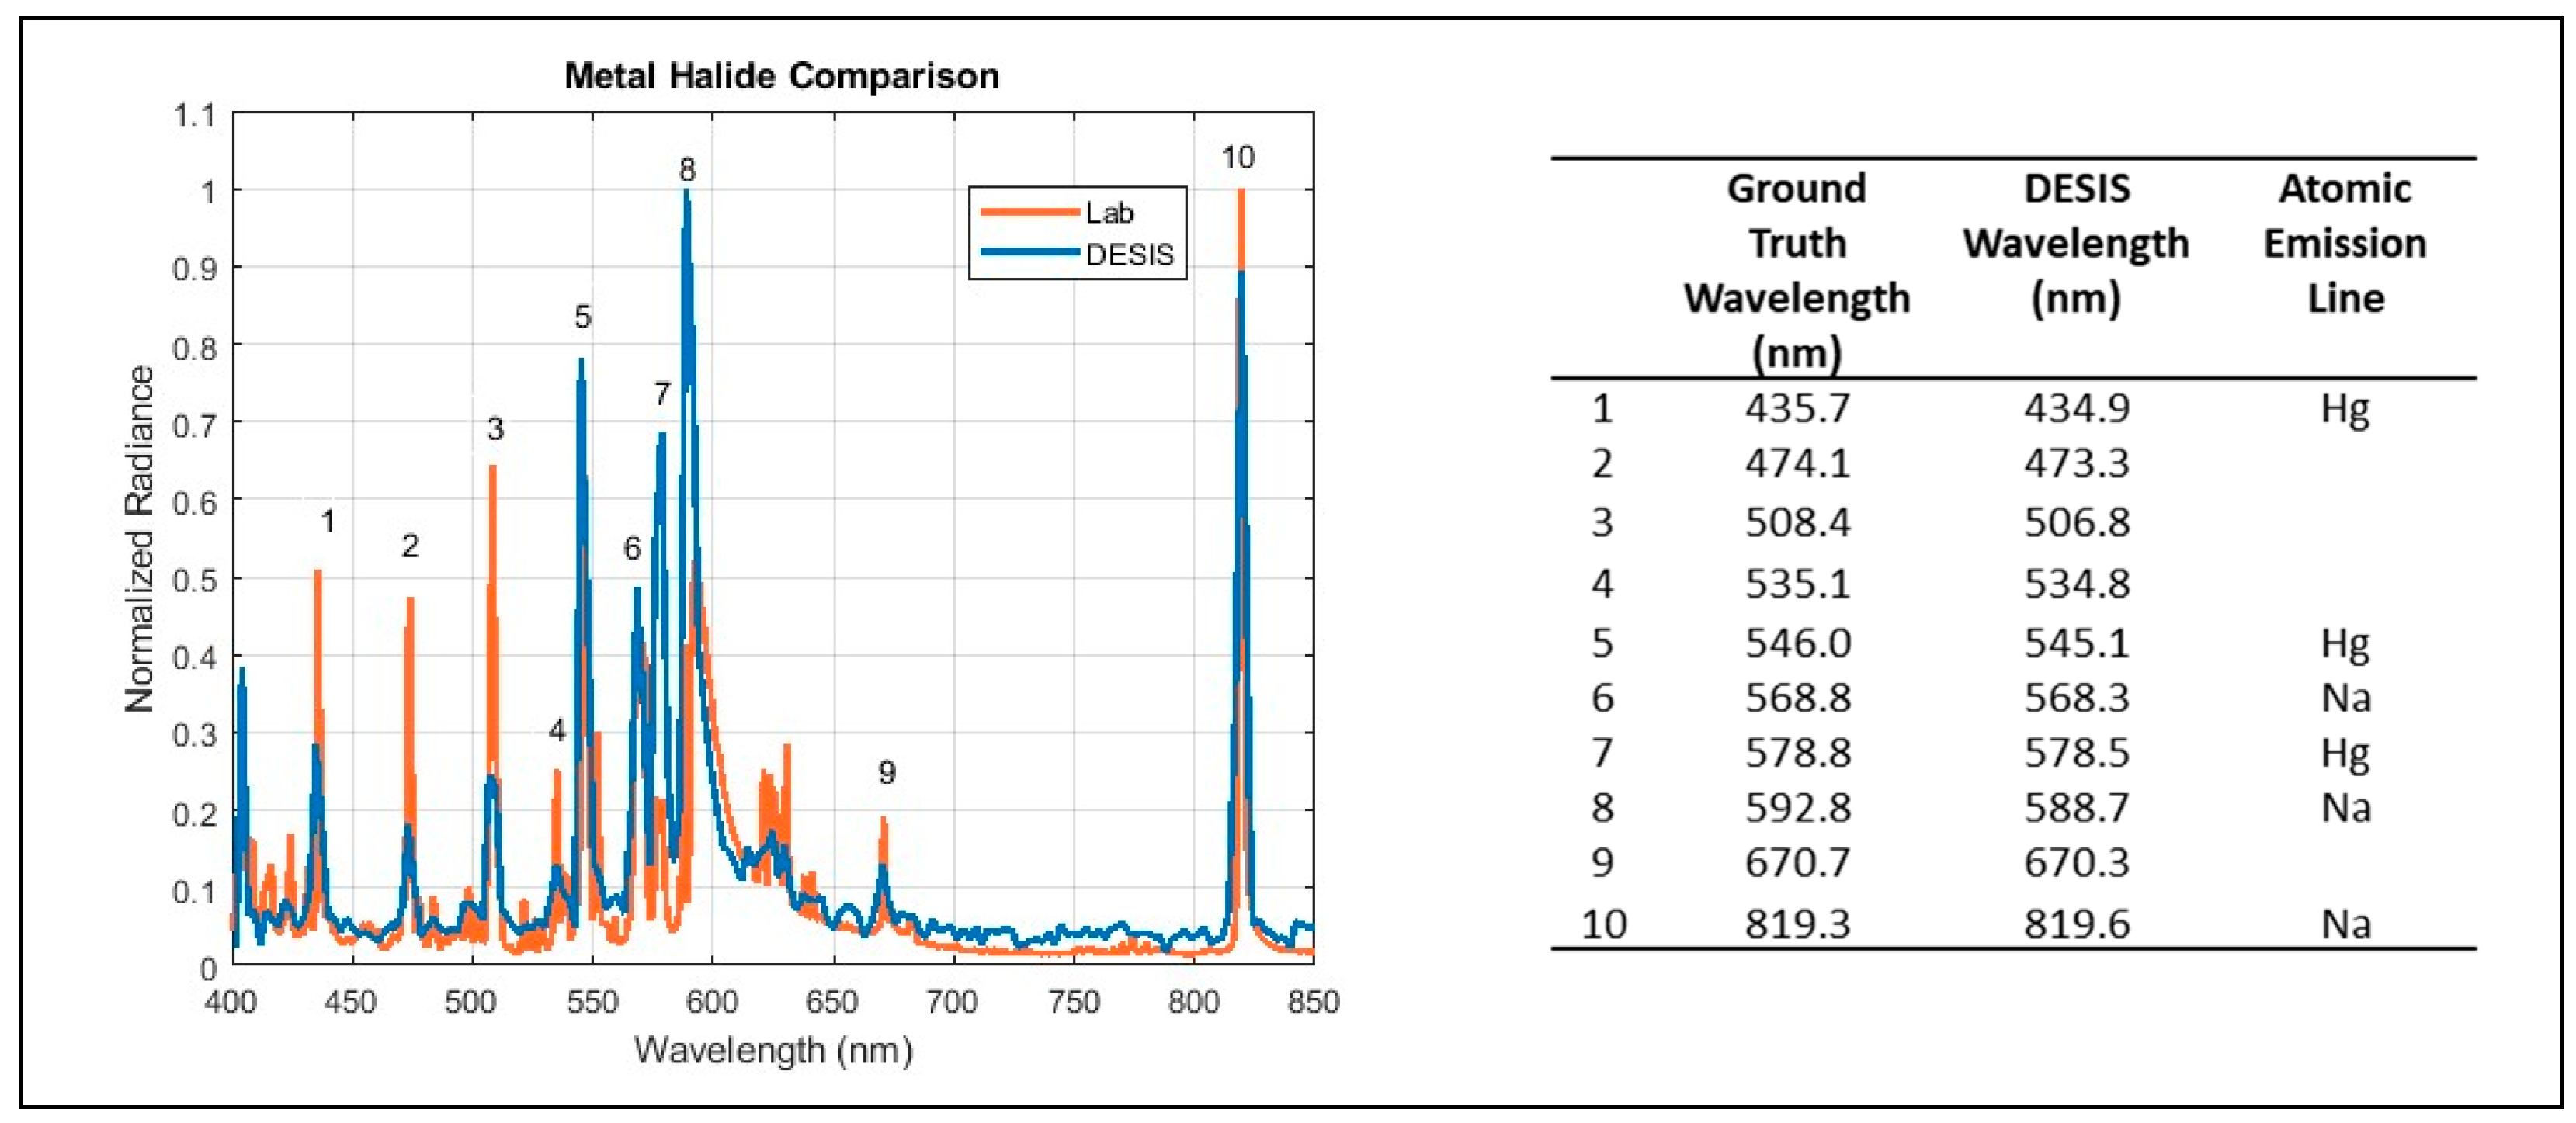
In addition to providing more detailed data about the nature of NTL in different regions, the night imaging of monochromatic sources could also enable wavelength calibration. DESIS and ground-based spectral measurements were compared for well-known light sources to identify their spectral signatures. A wavelength calibration algorithm for DESIS was developed by hand-selecting ground sources with spectra of interest and known atomic emission lines in locations worldwide. For example, high-pressure sodium lamps were identified in Guangzhou, China, while high-pressure cesium (HP-Cs) lamps were identified in Kuwait City.
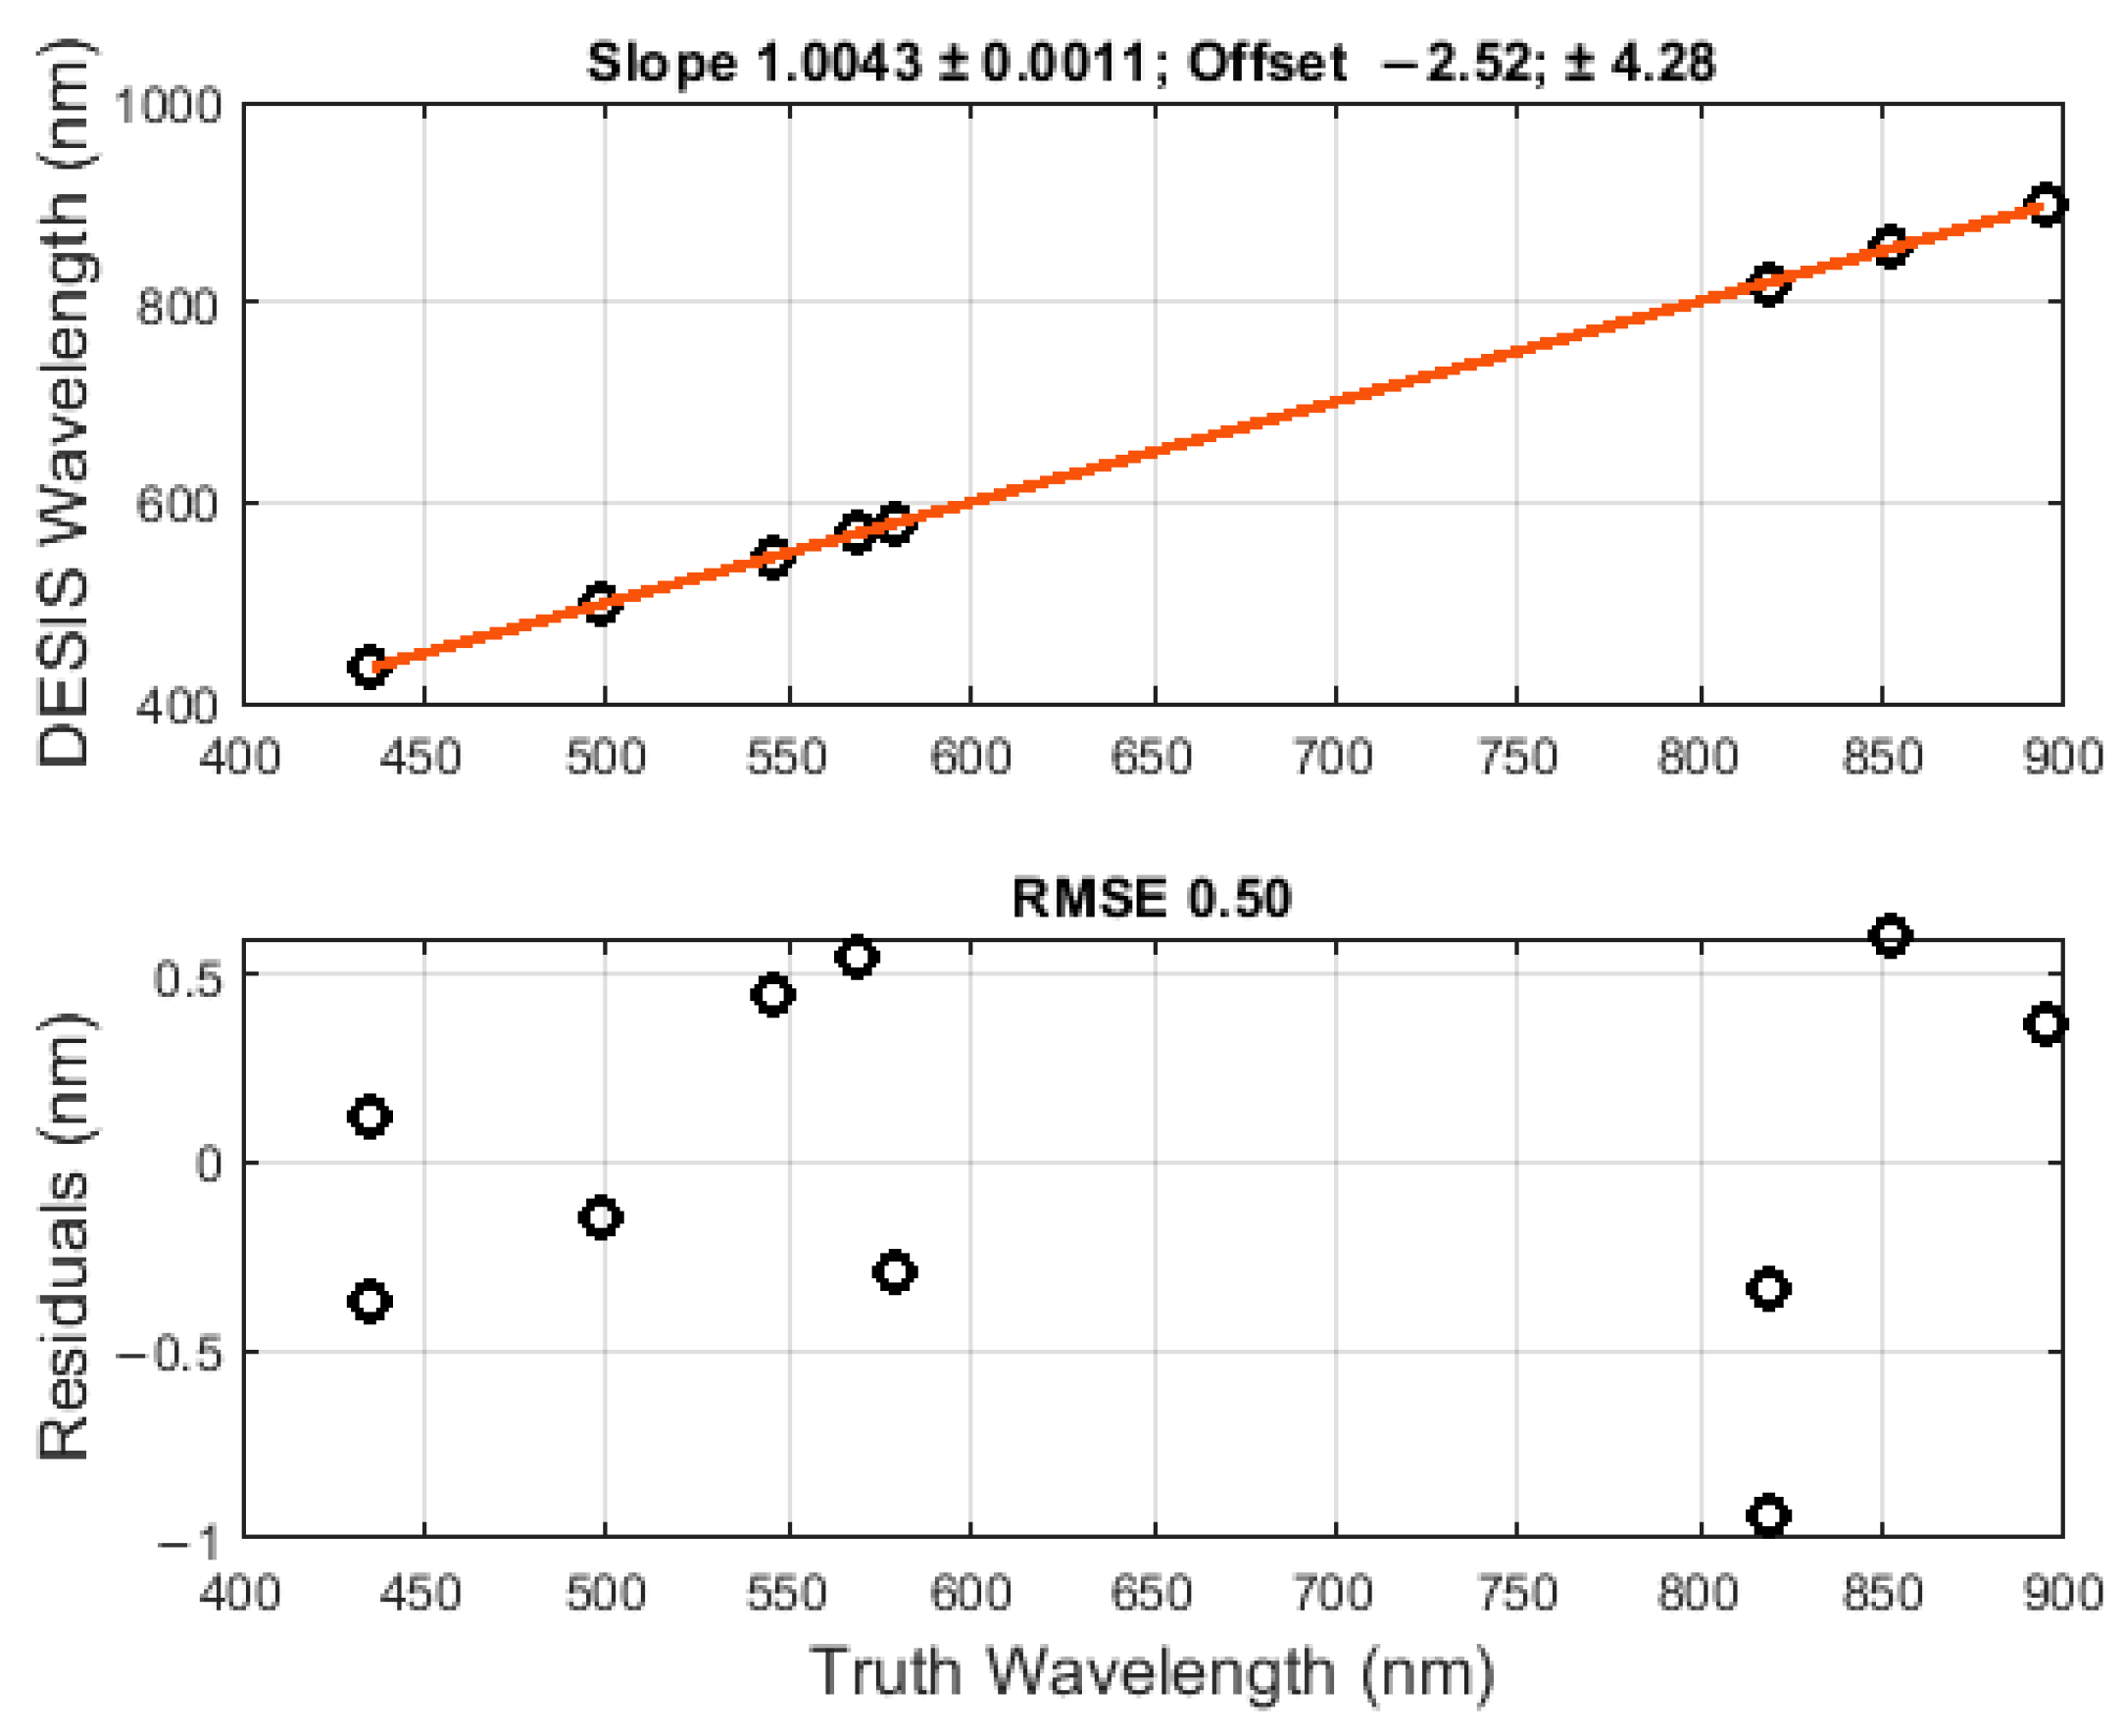
Local peaks are found for selected wavelength regions corresponding to known atomic emission lines and fit a Gaussian (i.e., amplitude, positions, width) plus a constant offset to find the center wavelength. A preliminary DESIS wavelength calibration example with a linear least-square fit can be seen in Figure 18. The RMSE of the residuals is 0.50 nm. The estimated slope is nearly at unity, indicating the DESIS wavelength calibration agreed with the atomic emission lines. The known wavelength peaks, treated as truth, and DESIS-measured wavelength peaks for several spectral features associated with different lamp types used to perform the wavelength calibration are listed in Table 4. With the exception of high-pressure Cs lamps, truth was established by measuring illumination from different lamp types reflected off a Spectralon panel with an NIST-traceable spectrometer. High-pressure Cs’ spectral features were provided by Pichler et al. [42].
5. Conclusions
This study used DESIS nighttime imagery to investigate whether light types could be distinguished from hyperspectral images. Nighttime DESIS collections over Las Vegas, Guangzhou, Kuwait, and Ahmadabad were processed to remove fixed pattern noise and then spectrally smoothed and atmospherically corrected using VIIRS AOD products. For each scene, NTL spectral signatures were compared to the ground truth signatures of HPS, red and white LEDs, and MH lamps. Well-known Na and Hg atomic emission lines were identified in MH lamps and HPS lamps. This information was used to create light-type templates. A correlation coefficient was calculated between the template spectral signatures in the imagery and the ground-truth sources to categorize the lights in each scene. Color-coded maps based on the examined light types were generated for each scene.
Our preliminary results show that currently available hyperspectral data can map light-type distributions, which could improve electrical power and light quality prediction. Because DESIS can detect the point sources of NTL with a relatively high spatial and spectral resolution, our results offer unprecedented granularity and frequency for nighttime imaging. In addition, they offer the potential for wavelength calibration based on atomic emission lines in HID lamps. While not designed to detect NTL, DESIS is one of several relatively new on-orbit hyperspectral systems with superior spectral resolution and high sensitivity. As moderate–high-spatial-resolution hyperspectral satellites become more common, our methodology can be extended and refined for other emerging systems, such as NASA’s Earth Surface Mineral Dust Source Investigation (EMIT) mission and EnMAP, which have superior optical sensitivity to DESIS and may detect dimmer lights.
Supplementary Materials
The following supporting information can be downloaded at https://www.mdpi.com/article/10.3390/rs16050923/s1. Video S1: DESIS nighttime spectral movie of Las Vegas NV.avi.; Table S1: HPS laboratory ground truth data.xlsx; Table S2: MH laboratory ground truth data.xlsx; Table S3: LED laboratory ground truth data.xlsx.
Author Contributions
Conceptualization, R.E.R. and M.P.; methodology, R.E.R., M.P. and K.B.; software, R.E.R.; formal Analysis, R.E.R., M.P. and K.M.; investigation, R.E.R. and M.P.; data curation, K.M and H.R.; writing—original draft preparation, H.R., R.E.R. and M.P.; Writing—review and editing, R.E.R., M.P., H.R. and K.B. All authors have read and agreed to the published version of the manuscript.
Funding
This research received no external funding.
Data Availability Statement
DESIS data can be searched for in a publicly viewable repository: https://teledyne.tcloudhost.com/Account/Login?ReturnUrl=%2F (accessed on 28 February 2024). DESIS data are available, upon NASA approval, to all US government-funded researchers for scientific use through the NASA Commercial Smallsat Data Acquisition (CSDA) Program. Teledyne Brown Engineering provided the DESIS data used in this assessment. DESIS data are from © Teledyne Brown Engineering, Inc. All rights reserved. DESIS derivative products include the copyrighted material of Teledyne Brown Engineering, Inc. All rights reserved.
Acknowledgments
The authors would like to acknowledge valuable comments provided by Rupert Müller with the Remote Sensing Technology Institute, DLR, Oberpfaffenhofen, 82234 Weßling, Germany. The authors would also like to acknowledge DESIS tasking support provided by Heath Lester with Teledyne Brown Engineering.
Conflicts of Interest
Innovative Imaging & Research Corp. is under contract with Teledyne Brown Engineering to review quality and perform scientific assessments of DESIS imagery. As an unbiased, third party, the authors declare no conflicts of interest.
References
- OLS: Operational Linescan System. Available online: https://ngdc.noaa.gov/eog/sensors/ols.html (accessed on 23 March 2023).
- Zhao, M.; Zhou, Y.; Li, X.; Cao, W.; He, C.; Yu, B.; Li, X.; Elvidge, C.; Cheng, W.; Zhou, C. Applications of Satellite Remote Sensing of Nighttime Light Observations: Advances, Challenges, and Perspectives. Remote Sens. 2019, 11, 1971. [Google Scholar] [CrossRef]
- Fisher, K. Gateway to Astronaut Photography of Earth. Available online: https://eol.jsc.nasa.gov/ (accessed on 24 July 2023).
- Nighttime Lights: Backgrounder on VIIRS Day/Night Band and Its Applications. Available online: https://www.earthdata.nasa.gov/learn/backgrounders/nighttime-lights (accessed on 23 March 2023).
- Levin, N.; Kyba, C.C.M.; Zhang, Q.; Sánchez De Miguel, A.; Román, M.O.; Li, X.; Portnov, B.A.; Molthan, A.L.; Jechow, A.; Miller, S.D.; et al. Remote Sensing of Night Lights: A Review and an Outlook for the Future. Remote Sens. Environ. 2020, 237, 111443. [Google Scholar] [CrossRef]
- Stokes, E.C.; Roman, M.O.; Wang, Z.; Shrethsa, R.M.; Yao, T.; Kalb, G. Urban Applications of Nasa’s Black Marble Product Suite. In Proceedings of the 2019 Joint Urban Remote Sensing Event (JURSE), Vannes, France, 22–24 May 2019; pp. 1–4. [Google Scholar]
- Wan, N.; Du, Y.; Liang, F.; Yi, J.; Qian, J.; Tu, W.; Huang, S. Nighttime Light Satellite Images Reveal Uneven Socioeconomic Development along China’s Land Border. Appl. Geogr. 2023, 152, 102899. [Google Scholar] [CrossRef]
- Sanchez de Miguel, A.; Kyba, C.C.M.; Zamorano, J.; Gallego, J.; Gaston, K.J. The Nature of the Diffuse Light Near Cities Detected in Nighttime Satellite Imagery. Sci. Rep. 2020, 10, 7829. [Google Scholar] [CrossRef] [PubMed]
- Wang, Z.; Román, M.O.; Sun, Q.; Molthan, A.L.; Schultz, L.A.; Kalb, V.L. Monitoring Disaster-Related Power Outages Using NASA Black Marble Nighttime Light Product. Int. Arch. Photogramm. Remote Sens. Spat. Inf. Sci. 2018, XLII–3, 1853–1856. [Google Scholar] [CrossRef]
- Stokes, E.C.; Seto, K.C. Characterizing Urban Infrastructural Transitions for the Sustainable Development Goals Using Multi-Temporal Land, Population, and Nighttime Light Data. Remote Sens. Environ. 2019, 234, 111430. [Google Scholar] [CrossRef]
- Henderson, J.V.; Storeygard, A.; Weil, D.N. Measuring Economic Growth from Outer Space; National Bureau of Economic Research: Cambridge, MA, USA, 2009; 53p. [Google Scholar]
- Jing, Y.; Yao, J. Illuminating Economic Growth; International Monetary Fund: Washington, DC, USA, 2019. [Google Scholar]
- Schirmer, A.E.; Gallemore, C.; Liu, T.; Magle, S.; DiNello, E.; Ahmed, H.; Gilday, T. Mapping Behaviorally Relevant Light Pollution Levels to Improve Urban Habitat Planning. Sci. Rep. 2019, 9, 11925. [Google Scholar] [CrossRef]
- Miller, C.R.; Barton, B.T.; Zhu, L.; Radeloff, V.C.; Oliver, K.M.; Harmon, J.P.; Ives, A.R. Combined Effects of Night Warming and Light Pollution on Predator–Prey Interactions. Proc. R. Soc. B 2017, 284, 20171195. [Google Scholar] [CrossRef]
- Delhey, K.; Peters, A. Conservation Implications of Anthropogenic Impacts on Visual Communication and Camouflage. Conserv. Biol. 2017, 31, 30–39. [Google Scholar] [CrossRef]
- Willis, J.P. Protection of Dark-Sky Areas in the United States through Development and Implementation of Warm-Light LED Fixtures. J. Sci. Policy Gov. 2023, 22. [Google Scholar] [CrossRef]
- Jechow, A.; Hölker, F. How Dark Is a River? Artificial Light at Night in Aquatic Systems and the Need for Comprehensive Nighttime Light Measurements. Wiley Interdiscip. Rev. Water 2019, 6, e1388. [Google Scholar] [CrossRef]
- Cho, Y.M.; Ryu, S.H.; Lee, B.R.; Kim, K.H.; Lee, E.; Choi, J. Effects of Artificial Light at Night on Human Health: A Literature Review of Observational and Experimental Studies Applied to Exposure Assessment. Chronobiol. Int. 2015, 32, 1294–1310. [Google Scholar] [CrossRef]
- Li, X.; Chen, F.; Chen, X. Satellite-Observed Nighttime Light Variation as Evidence for Global Armed Conflicts. IEEE J. Sel. Top. Appl. Earth Obs. Remote Sens. 2013, 6, 2302–2315. [Google Scholar] [CrossRef]
- Wolfe, R. Visible Infrared Imaging Radiometer Suite (VIIRS). Available online: https://ladsweb.modaps.eosdis.nasa.gov/missions-and-measurements/viirs/ (accessed on 23 March 2023).
- Ryan, R.; Pagnutti, M.; Burch, K.; Leigh, L.; Ruggles, T.; Cao, C.; Aaron, D.; Blonski, S.; Helder, D. The Terra Vega Active Light Source: A First Step in a New Approach to Perform Nighttime Absolute Radiometric Calibrations and Early Results Calibrating the VIIRS DNB. Remote Sens. 2019, 11, 710. [Google Scholar] [CrossRef]
- Levin, N.; Johansen, K.; Hacker, J.M.; Phinn, S. A new source for high spatial resolution night time images—The EROS-B commercial satellite. Remote Sens. Environ. 2014, 149, 1–12. [Google Scholar] [CrossRef]
- Guk, E.; Levin, N. Analyzing spatial variability in night-time lights using a high spatial resolution color Jilin-1 image–Jerusalem as a case study. ISPRS J. Photogramm. Remote Sens. 2020, 163, 121–136. [Google Scholar] [CrossRef]
- Elvidge, C.D.; Cinzano, P.; Pettit, D.R.; Arvesen, J.; Sutton, P.; Small, C.; Nemani, R.; Longcore, T.; Rich, C.; Safran, J.; et al. The Nightsat Mission Concept. Int. J. Remote Sens. 2007, 28, 2645–2670. [Google Scholar] [CrossRef]
- Elvidge, C.D.; Keith, D.M.; Tuttle, B.T.; Baugh, K.E. Spectral Identification of Lighting Type and Character. Sensors 2010, 10, 3961–3988. [Google Scholar] [CrossRef] [PubMed]
- Kruse, F.A.; Elvidge, C.D. Identification and Mapping of Night Lights’ Signatures Using Hyperspectral Data; Shen, S.S., Lewis, P.E., Eds.; SPIE: Orlando, FL, USA, 2011; p. 80480T. [Google Scholar]
- Bachmann, M.; Storch, T. First Nighttime Light Spectra by Satellite—By EnMAP. Remote Sens. 2023, 15, 4025. [Google Scholar] [CrossRef]
- Alonso, K.; Bachmann, M.; Burch, K.; Carmona, E.; Cerra, D.; de los Reyes, R.; Dietrich, D.; Heiden, U.; Hölderlin, A.; Ickes, J.; et al. Data Products, Quality and Validation of the DLR Earth Sensing Imaging Spectrometer (DESIS). Sensors 2019, 19, 4471. [Google Scholar] [CrossRef] [PubMed]
- Krutz, D.; Müller, R.; Knodt, U.; Günther, B.; Walter, I.; Sebastian, I.; Säuberlich, T.; Reulke, R.; Carmona, E.; Eckardt, A.; et al. The Instrument Design of the DLR Earth Sensing Imaging Spectrometer (DESIS). Sensors 2019, 19, 1622. [Google Scholar] [CrossRef]
- Sebastian, I.; Krutz, D.; Eckardt, A.; Venus, H.; Walter, I.; Günther, B.; Neidhardt, M.; Reulke, R.; Müller, R.; Uhlig, M.; et al. On-Ground Calibration of DESIS: DLR’s Earth Sensing Imaging Spectrometer for the International Space Station (ISS). In Proceedings of the Optical Sensing and Detection V; Berghmans, F., Mignani, A.G., Eds.; SPIE: Strasbourg, France, 2018; p. 1. [Google Scholar]
- DLR. “ATBD L1A, L1B, L1C, L2A Processors”, PAV-DLR-TN-004, Issue 1.3, 2015. Available online: https://www.tbe.com/en-us/what-we-do/markets/geospatial-solutions/DESIS/Documents/DESIS_Processing_Chain_and_Technical_Guide_atbd.pdf (accessed on 3 October 2023).
- Berk, A.; Conforti, P.; Kennett, R.; Perkins, T.; Hawes, F.; Van Den Bosch, J. MODTRAN® 6: A Major Upgrade of the MODTRAN® Radiative Transfer Code. In Proceedings of the 2014 6th Workshop on Hyperspectral Image and Signal Processing: Evolution in Remote Sensing (WHISPERS), Lausanne, Switzerland, 24–27 June 2014; pp. 1–4. [Google Scholar]
- Levy, R.C.; Munchak, L.A.; Mattoo, S.; Patadia, F.; Remer, L.A.; Holz, R.E. Towards a Long-Term Global Aerosol Optical Depth Record: Applying a Consistent Aerosol Retrieval Algorithm to MODIS and VIIRS-Observed Reflectance. Atmos. Meas. Tech. 2015, 8, 4083–4110. [Google Scholar] [CrossRef]
- Flesch, P. Light and Light Sources; Springer: Berlin/Heidelberg, Germany, 2006; ISBN 978-3-540-32684-7. [Google Scholar]
- Cleveland, W.S. Visualizing Data; Hobart Press: Summit, NJ, USA, 1993; ISBN 978-0-9634884-0-4. [Google Scholar]
- Cleveland, W.S. Robust Locally Weighted Regression and Smoothing Scatterplots. J. Am. Stat. Assoc. 1979, 74, 829–836. [Google Scholar] [CrossRef]
- Malacara, D. Color Vision and Colorimetry: Theory and Applications, 2nd ed.; SPIE: Bellingham, WA, USA, 2011; ISBN 978-0-8194-8398-0. [Google Scholar]
- Pham-Gia, T.; Hung, T.L. The Mean and Median Absolute Deviations. Math. Comput. Model. 2001, 34, 921–936. [Google Scholar] [CrossRef]
- Cao, C.; Bai, Y. Quantitative analysis of VIIRS DNB nightlight point source for light power estimation and stability monitoring. Remote Sens. 2014, 6, 11915–11935. [Google Scholar] [CrossRef]
- Ma, S.; Yan, W.; Huang, Y.; Jiang, J.; Hu, S.; Wang, Y. Calibration method of low-light sensor based on bridge lights. J. Atmos. Ocean. Technol. 2016, 33, 1123–1134. [Google Scholar] [CrossRef]
- Kalb, V. NASA’s Black Marble: Advancing the Science of the Earth at Night. Available online: https://blackmarble.gsfc.nasa.gov/ (accessed on 23 March 2023).
- Pichler, G.; Živčec, V.; Beuc, R.; Mrzljak, Ž.; Ban, T.; Skenderović, H.; Günther, K.; Liu, J. UV, Visible and IR Spectrum of the Cs High Pressure Lamp. Phys. Scr. 2003, T105, 98. [Google Scholar] [CrossRef]
Figure 1.
MUSES and DESIS on orbit. © Teledyne Brown Engineering, Inc., Huntsville, AL, USA. All rights reserved.
Figure 1.
MUSES and DESIS on orbit. © Teledyne Brown Engineering, Inc., Huntsville, AL, USA. All rights reserved.

Figure 2.
MUSES platform during final testing at TBE. © Teledyne Brown Engineering, Inc., Huntsville, AL, USA. All rights reserved.
Figure 2.
MUSES platform during final testing at TBE. © Teledyne Brown Engineering, Inc., Huntsville, AL, USA. All rights reserved.

Figure 3.
DESIS nighttime workflow. The steps shown in green are part of standard DESIS post-processing, while the steps shown in blue are performed specifically for this research.
Figure 3.
DESIS nighttime workflow. The steps shown in green are part of standard DESIS post-processing, while the steps shown in blue are performed specifically for this research.

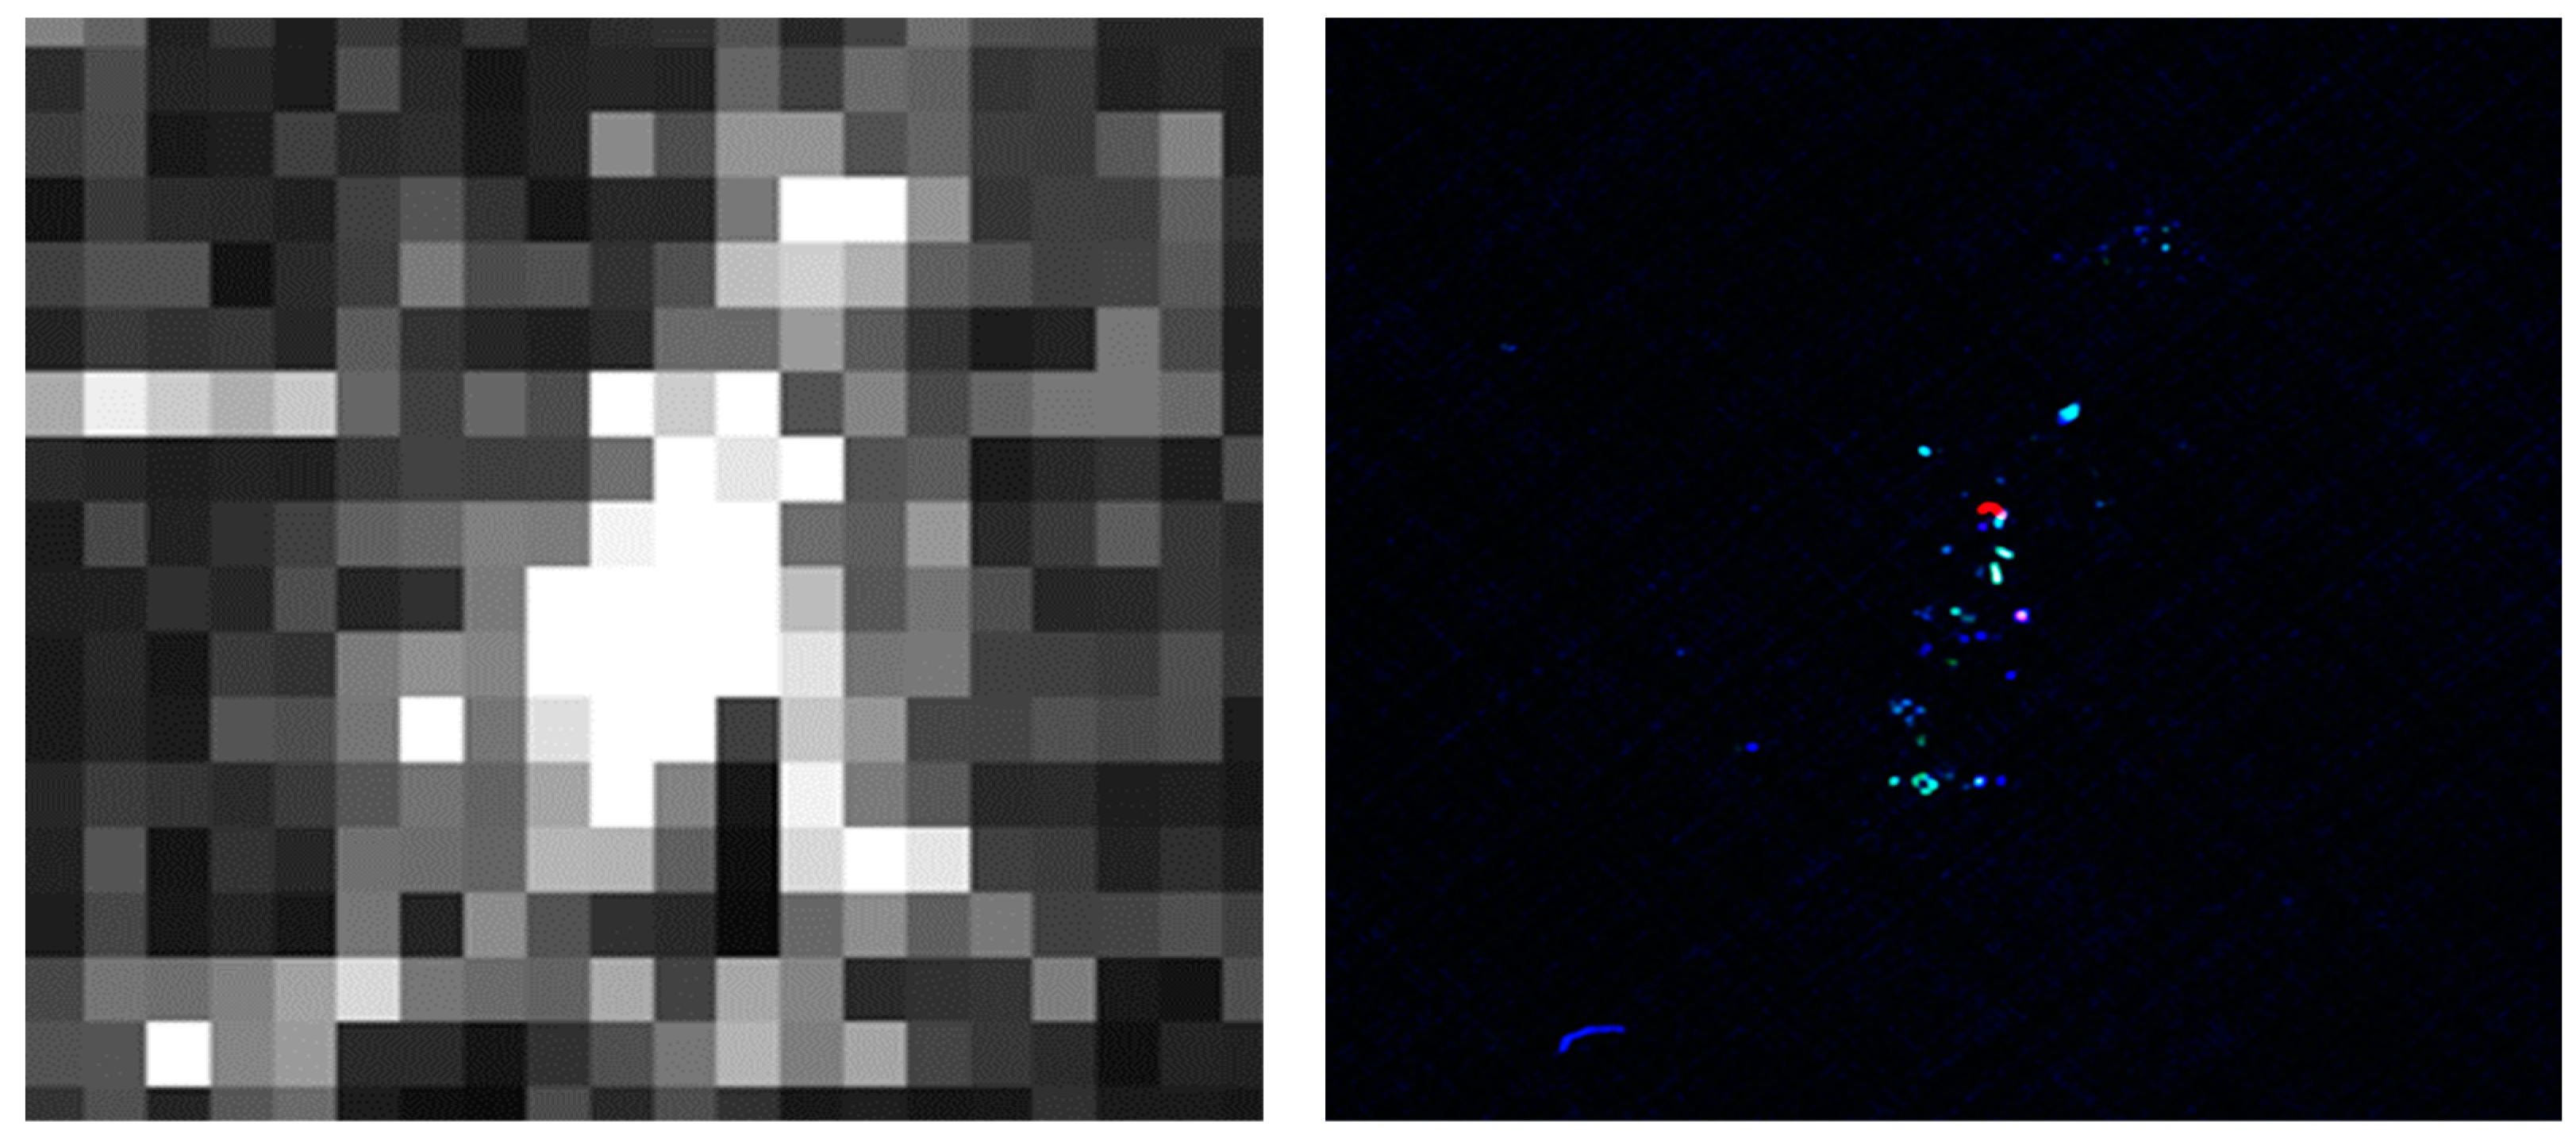
Figure 4.
Level 1B imagery of DESIS band 20 at center wavelength 527.1 nm before (left) and after (right) applying fixed pattern noise filtering. The imagery was stretched to highlight the fixed pattern noise in both the row and column directions. Includes copyrighted material of Teledyne Brown Engineering, Inc. All rights reserved.

Figure 5.
Atmospheric transmission used to perform DESIS atmospheric correction. A nominal 3 nm Gaussian FWHM was used to approximate DESIS’s spectral resolution.
Figure 5.
Atmospheric transmission used to perform DESIS atmospheric correction. A nominal 3 nm Gaussian FWHM was used to approximate DESIS’s spectral resolution.

Figure 6.
DESIS NESR plot generated by approximating NESR using a scaled median absolute deviation (MAD) approach and a standard deviation (STD) approach.
Figure 6.
DESIS NESR plot generated by approximating NESR using a scaled median absolute deviation (MAD) approach and a standard deviation (STD) approach.

Figure 7.
Example DESIS-acquired template spectra for several lights found within imagery: MH (top left); HPS (top right); white LED (middle left); red LED (middle right); red, green, and blue LED (lower left); and red and blue LED (lower right). Includes copyrighted material of Teledyne Brown Engineering, Inc. All rights reserved.

Figure 8.
Example DESIS-acquired spectra for less common lights found within imagery: Hg lamp (upper left), red LED (upper right), high-pressure cesium (HP-Cs) lamp (lower left), and a fire (lower right). Includes copyrighted material of Teledyne Brown Engineering, Inc. All rights reserved.
Figure 8.
Example DESIS-acquired spectra for less common lights found within imagery: Hg lamp (upper left), red LED (upper right), high-pressure cesium (HP-Cs) lamp (lower left), and a fire (lower right). Includes copyrighted material of Teledyne Brown Engineering, Inc. All rights reserved.

Figure 9.
Laboratory setup used to acquire the HID lamp signatures. The panel was mounted vertically on an optical table. The spectrometer fiber was pointed towards the panel at ~45 deg off normal. The lamp was centered directly in front of the panel to illuminate it evenly. The HID lamp shown is an HPS lamp.

Figure 10.
Spectrometer lab setup used to acquire red and white LED signatures. Measurements were made in a 0.5 m diameter sphere illuminated with different LEDs. The spectrometer fiber was mounted in a separate port to make the measurements.
Figure 10.
Spectrometer lab setup used to acquire red and white LED signatures. Measurements were made in a 0.5 m diameter sphere illuminated with different LEDs. The spectrometer fiber was mounted in a separate port to make the measurements.

Figure 11.
Full 30 km × 30 km DESIS L1B night image tile of Las Vegas, NV, in RGB (top left) and CIR (top right), and Guangzhou, China, in RGB (bottom left) and CIR (bottom right). RGB is displayed as 650, 550, and 450 nm. CIR is displayed as 820, 650, and 550 nm. These images are processed relative to L1B, meaning they have not been orthorectified. Includes copyrighted material of Teledyne Brown Engineering, Inc. All rights reserved.


Figure 12.
VIIRS DNB TOA nighttime radiance (left) and DESIS orthorectified L1C RGB (right) imagery over Las Vegas, NV. Both are scaled at 1:105,204 and represent a 9 km × 10.1 km region. Includes copyrighted material of Teledyne Brown Engineering, Inc. All rights reserved.
Figure 12.
VIIRS DNB TOA nighttime radiance (left) and DESIS orthorectified L1C RGB (right) imagery over Las Vegas, NV. Both are scaled at 1:105,204 and represent a 9 km × 10.1 km region. Includes copyrighted material of Teledyne Brown Engineering, Inc. All rights reserved.

Figure 13.
Comparison of DESIS and ground truth spectra of an HPS lamp taken in the lab using the setup shown in Figure 9. Ground-truth-measured wavelengths associated with atomic emission lines closely compare with those measured by DESIS. Includes copyrighted material of Teledyne Brown Engineering, Inc. All rights reserved. Ground truth data is included in the supplemental data as Table S1.

Figure 14.
Comparison of DESIS and ground truth spectra of an MH lamp taken in the lab using the setup shown in Figure 9. Ground-truth-measured wavelengths associated with atomic emission lines closely compare with those measured by DESIS. Includes copyrighted material of Teledyne Brown Engineering, Inc. All rights reserved. Ground truth data is included in the supplemental data as Table S2.

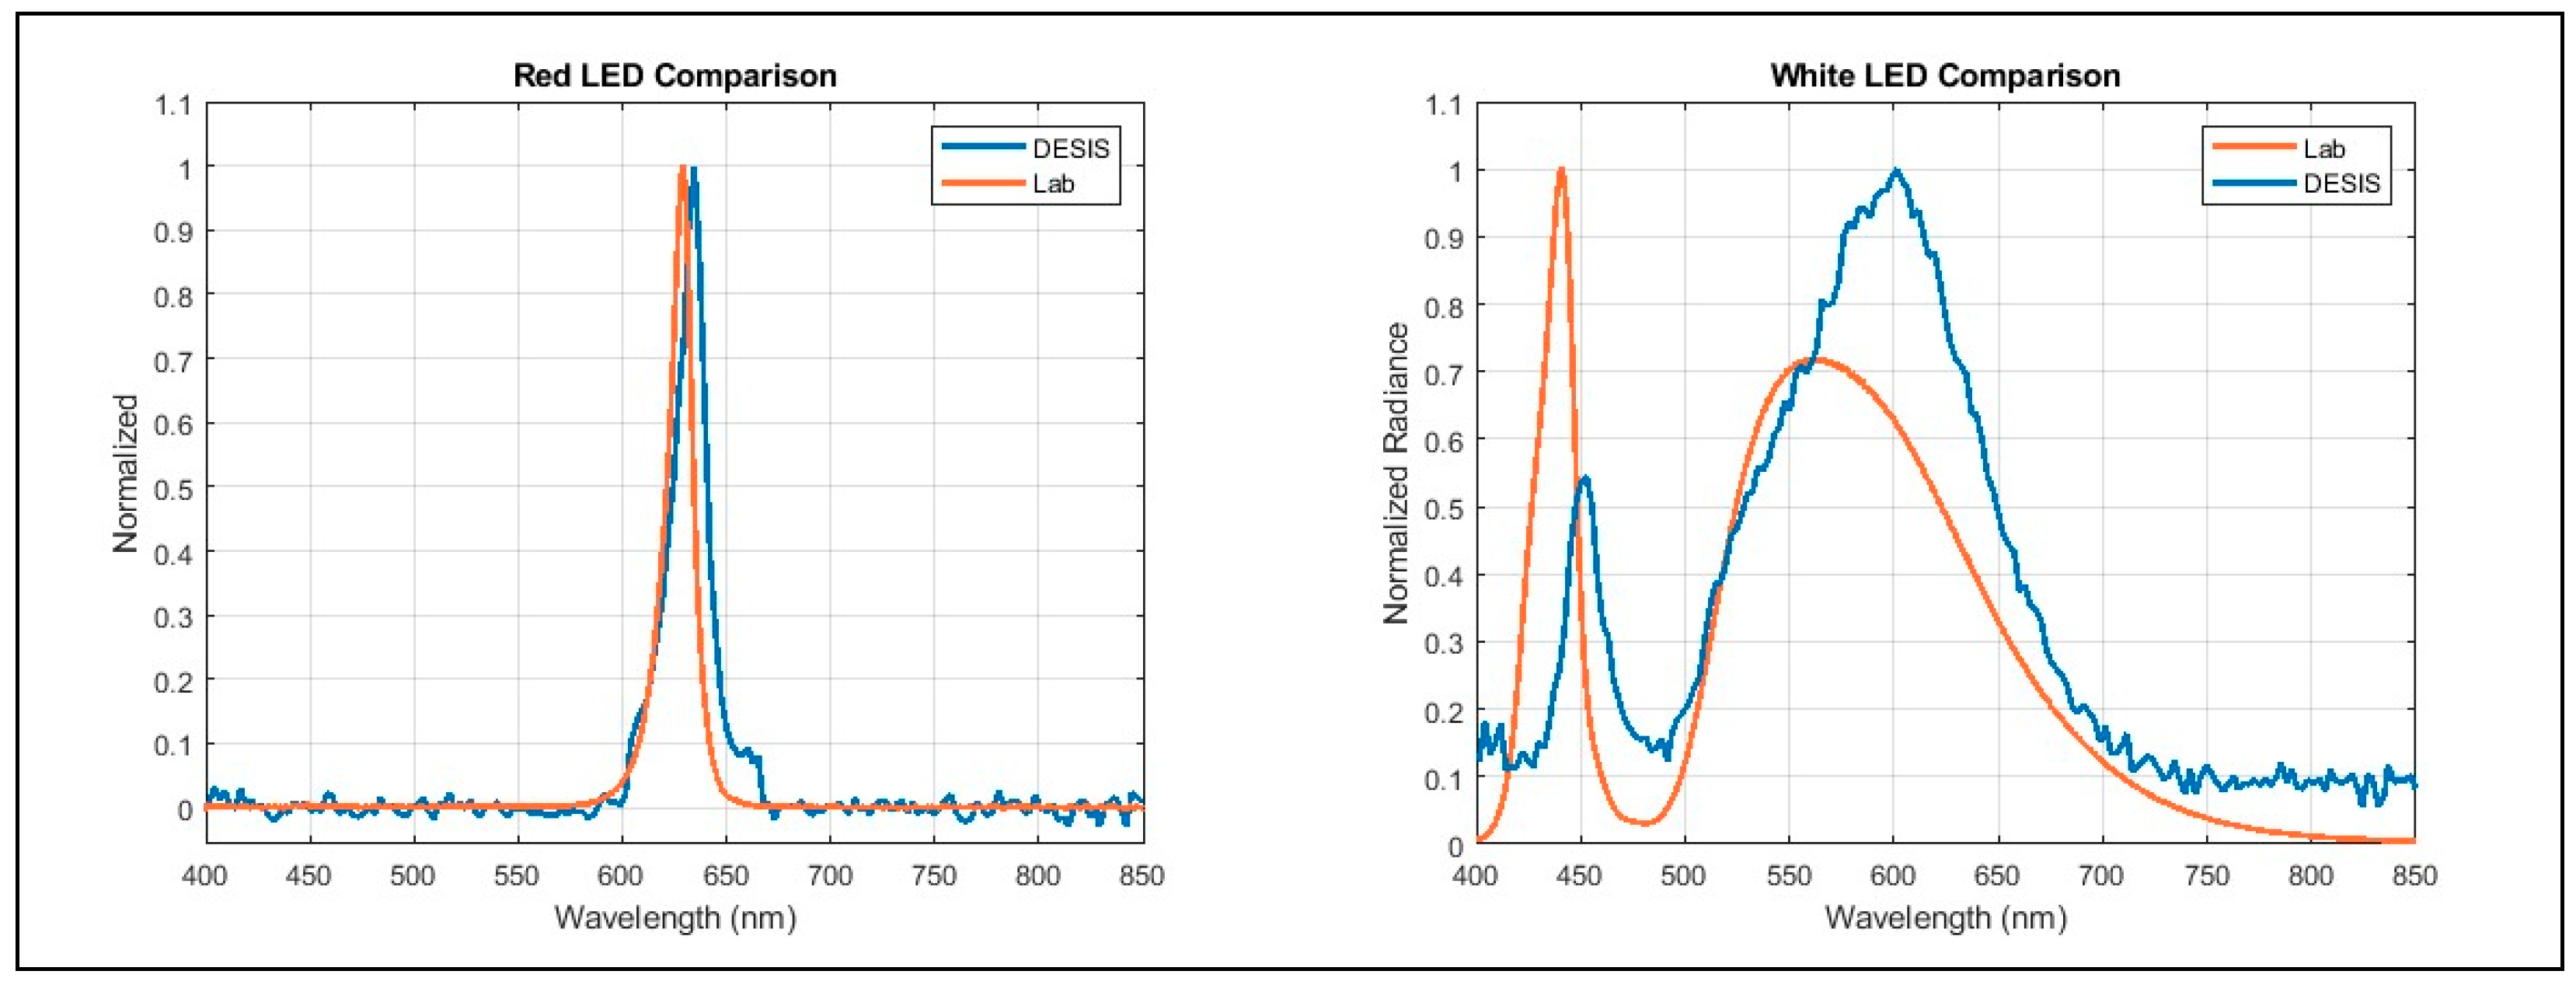
Figure 15.
Comparison of DESIS and ground truth spectra taken in the lab for red LED (left) and white LED (right) lamps using the setup shown in Figure 10. While it is clear from the comparison that red and white LEDs are being imaged from DESIS, LED lamp spectra can vary significantly. Includes copyrighted material of Teledyne Brown Engineering, Inc. All rights reserved. Ground truth data is included in the supplemental data as Table S3.

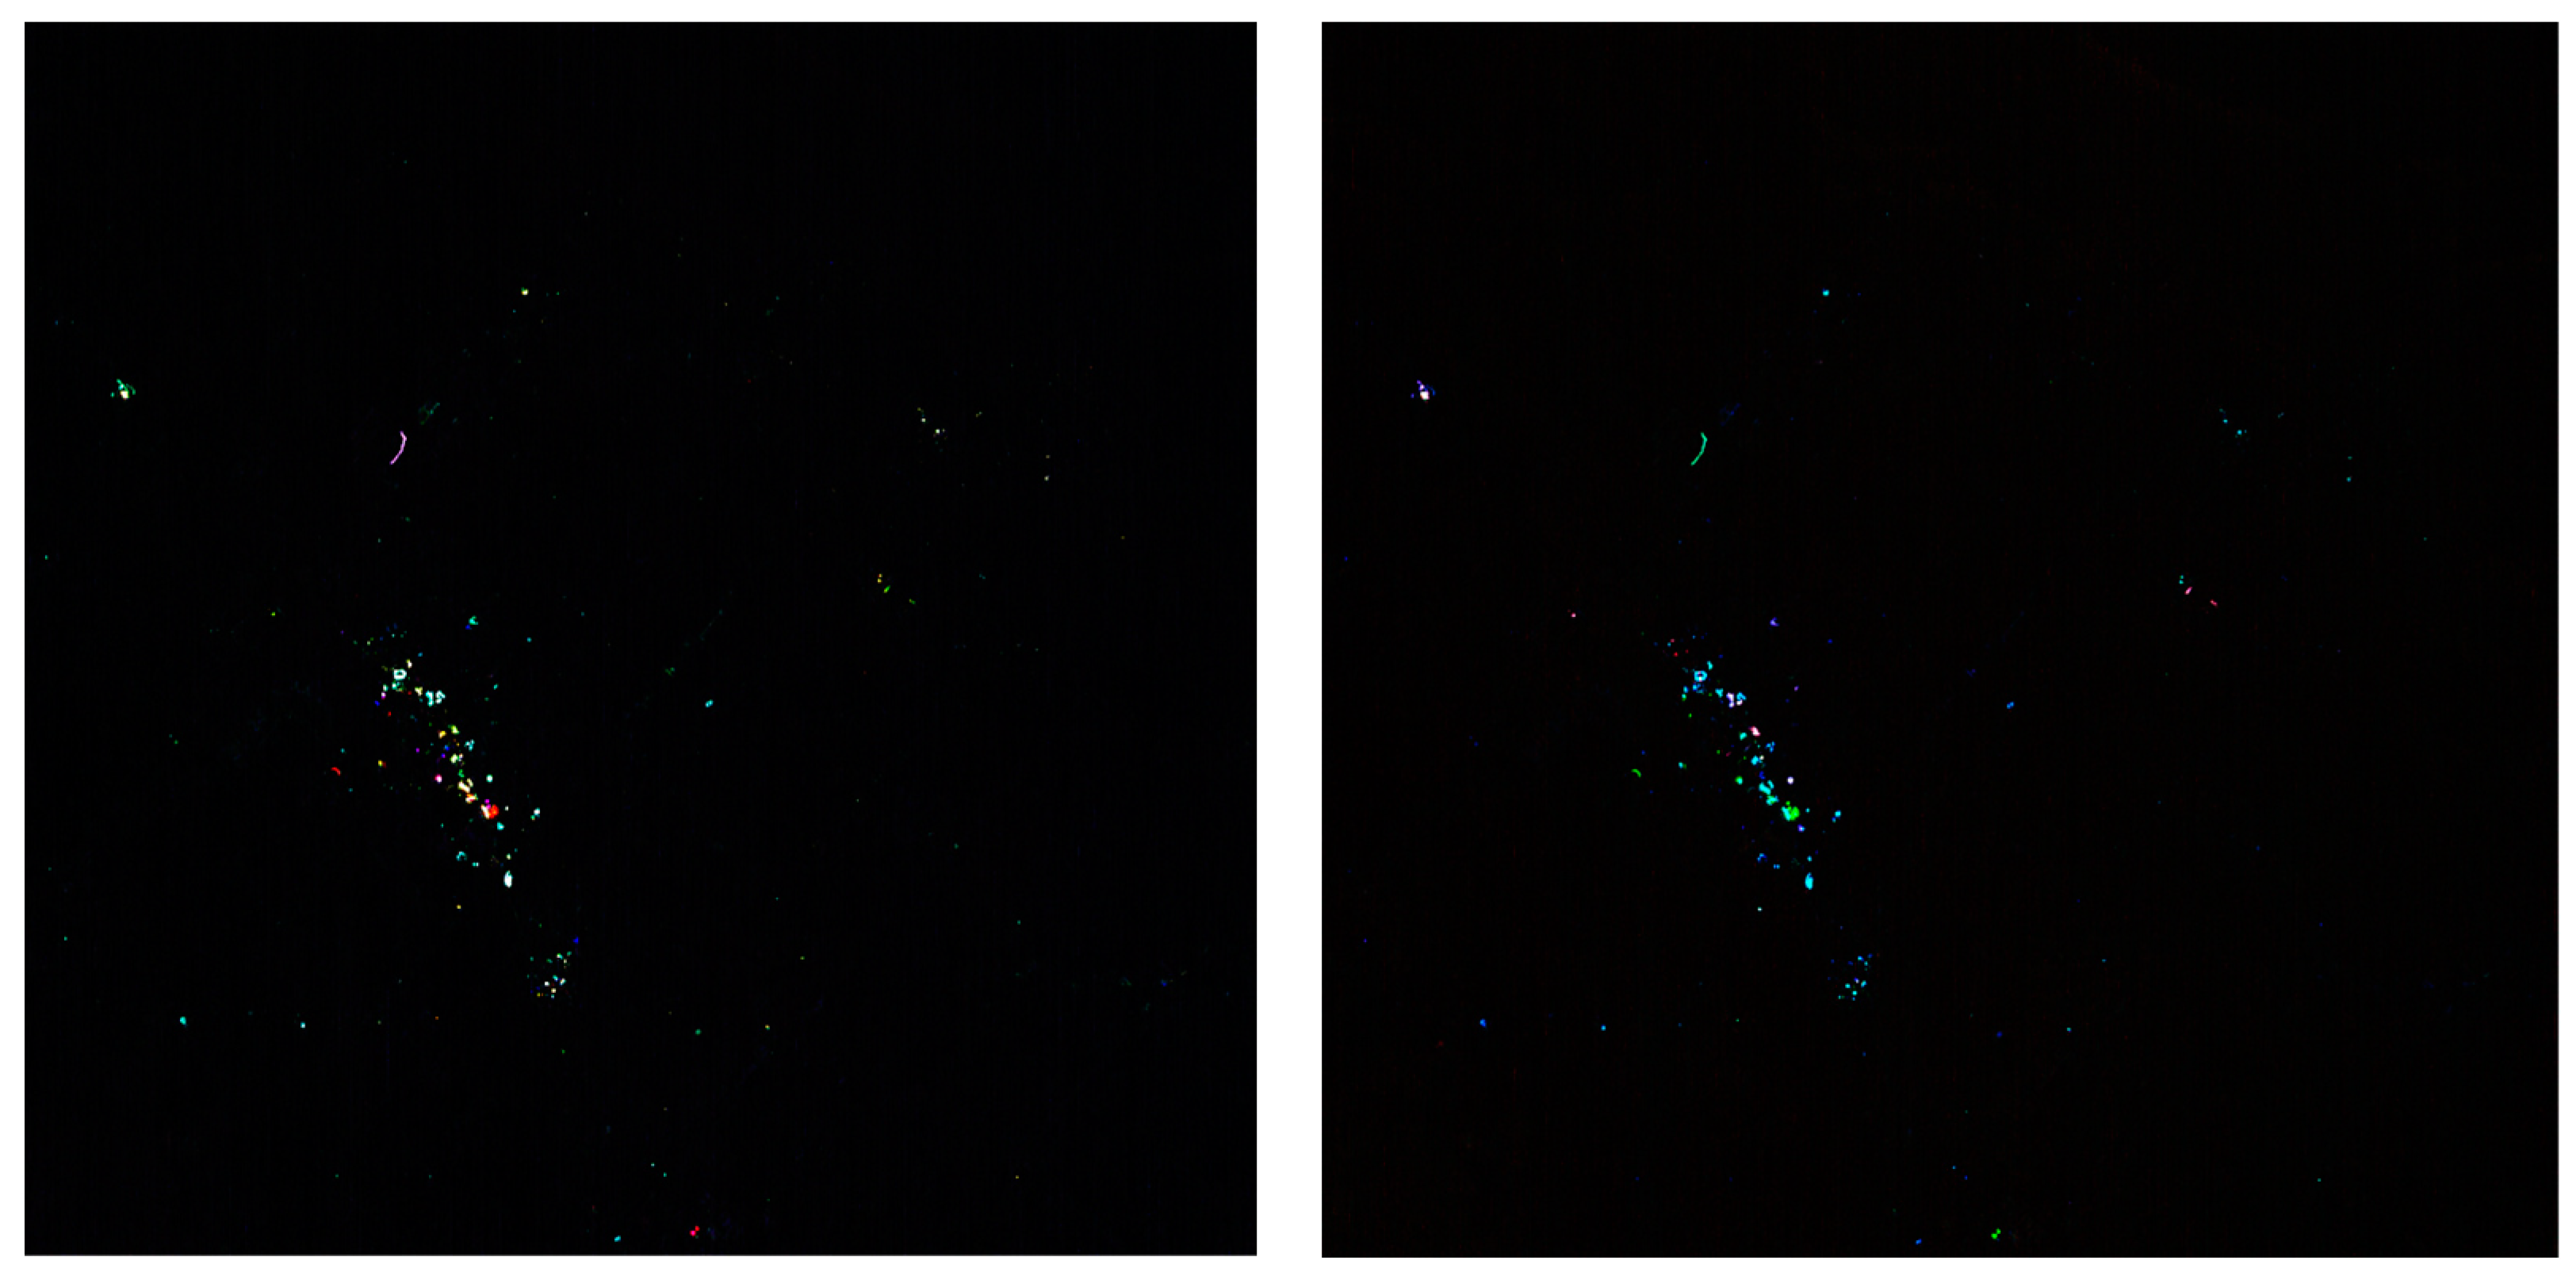
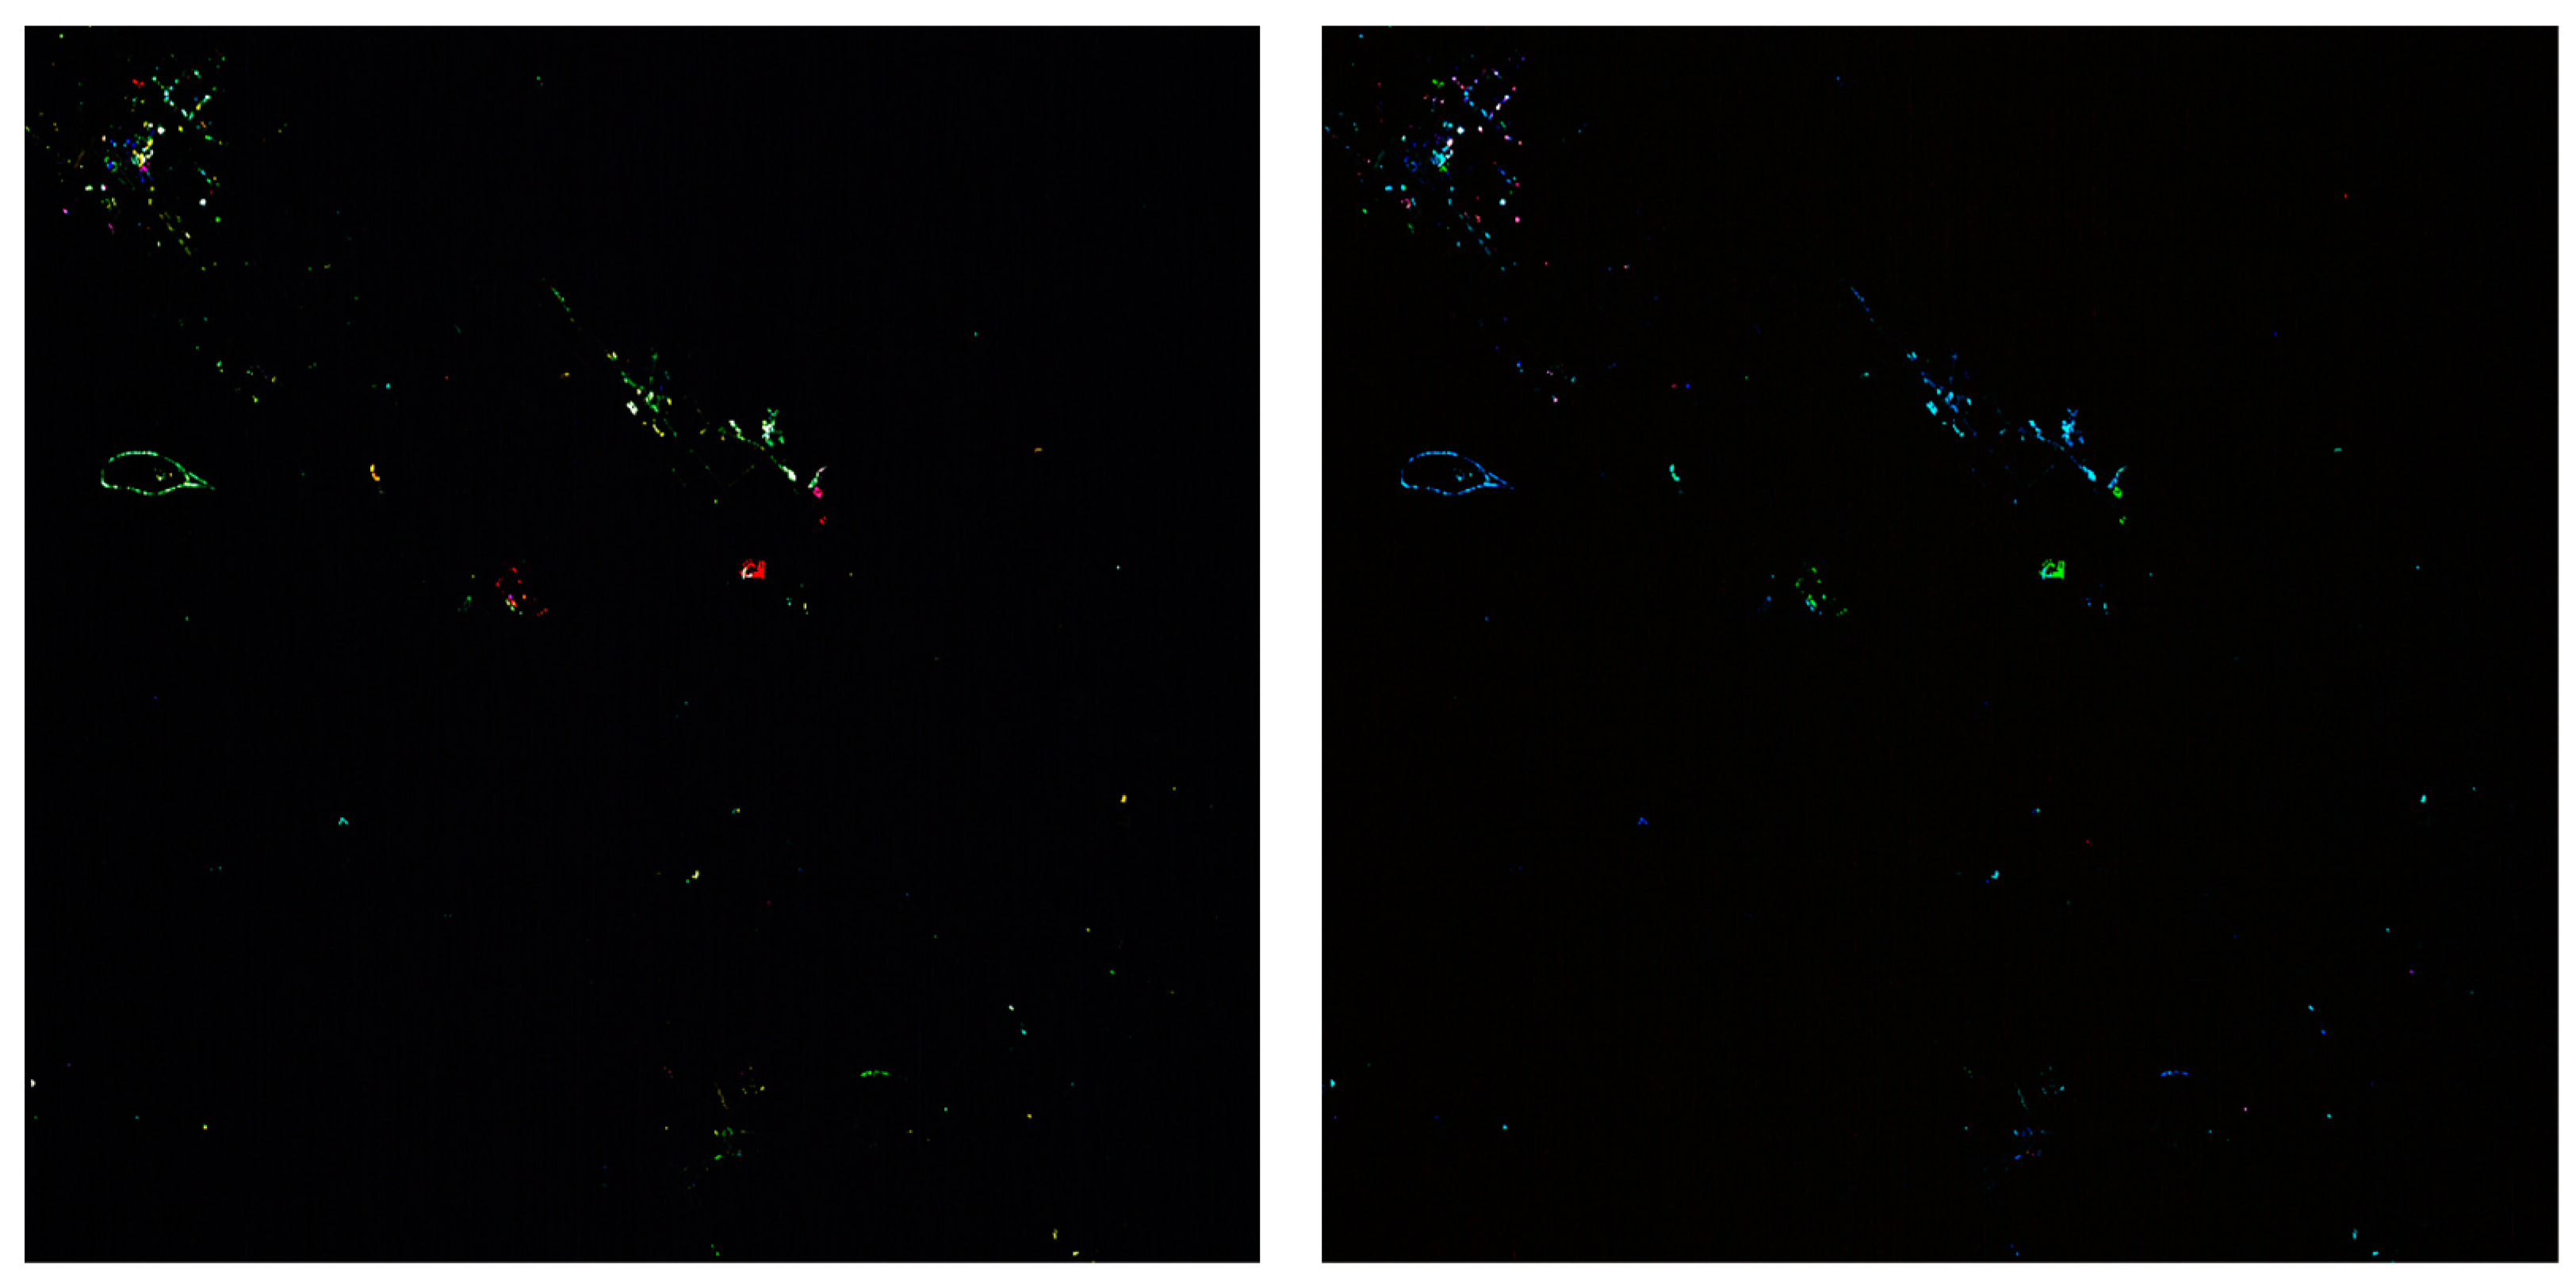
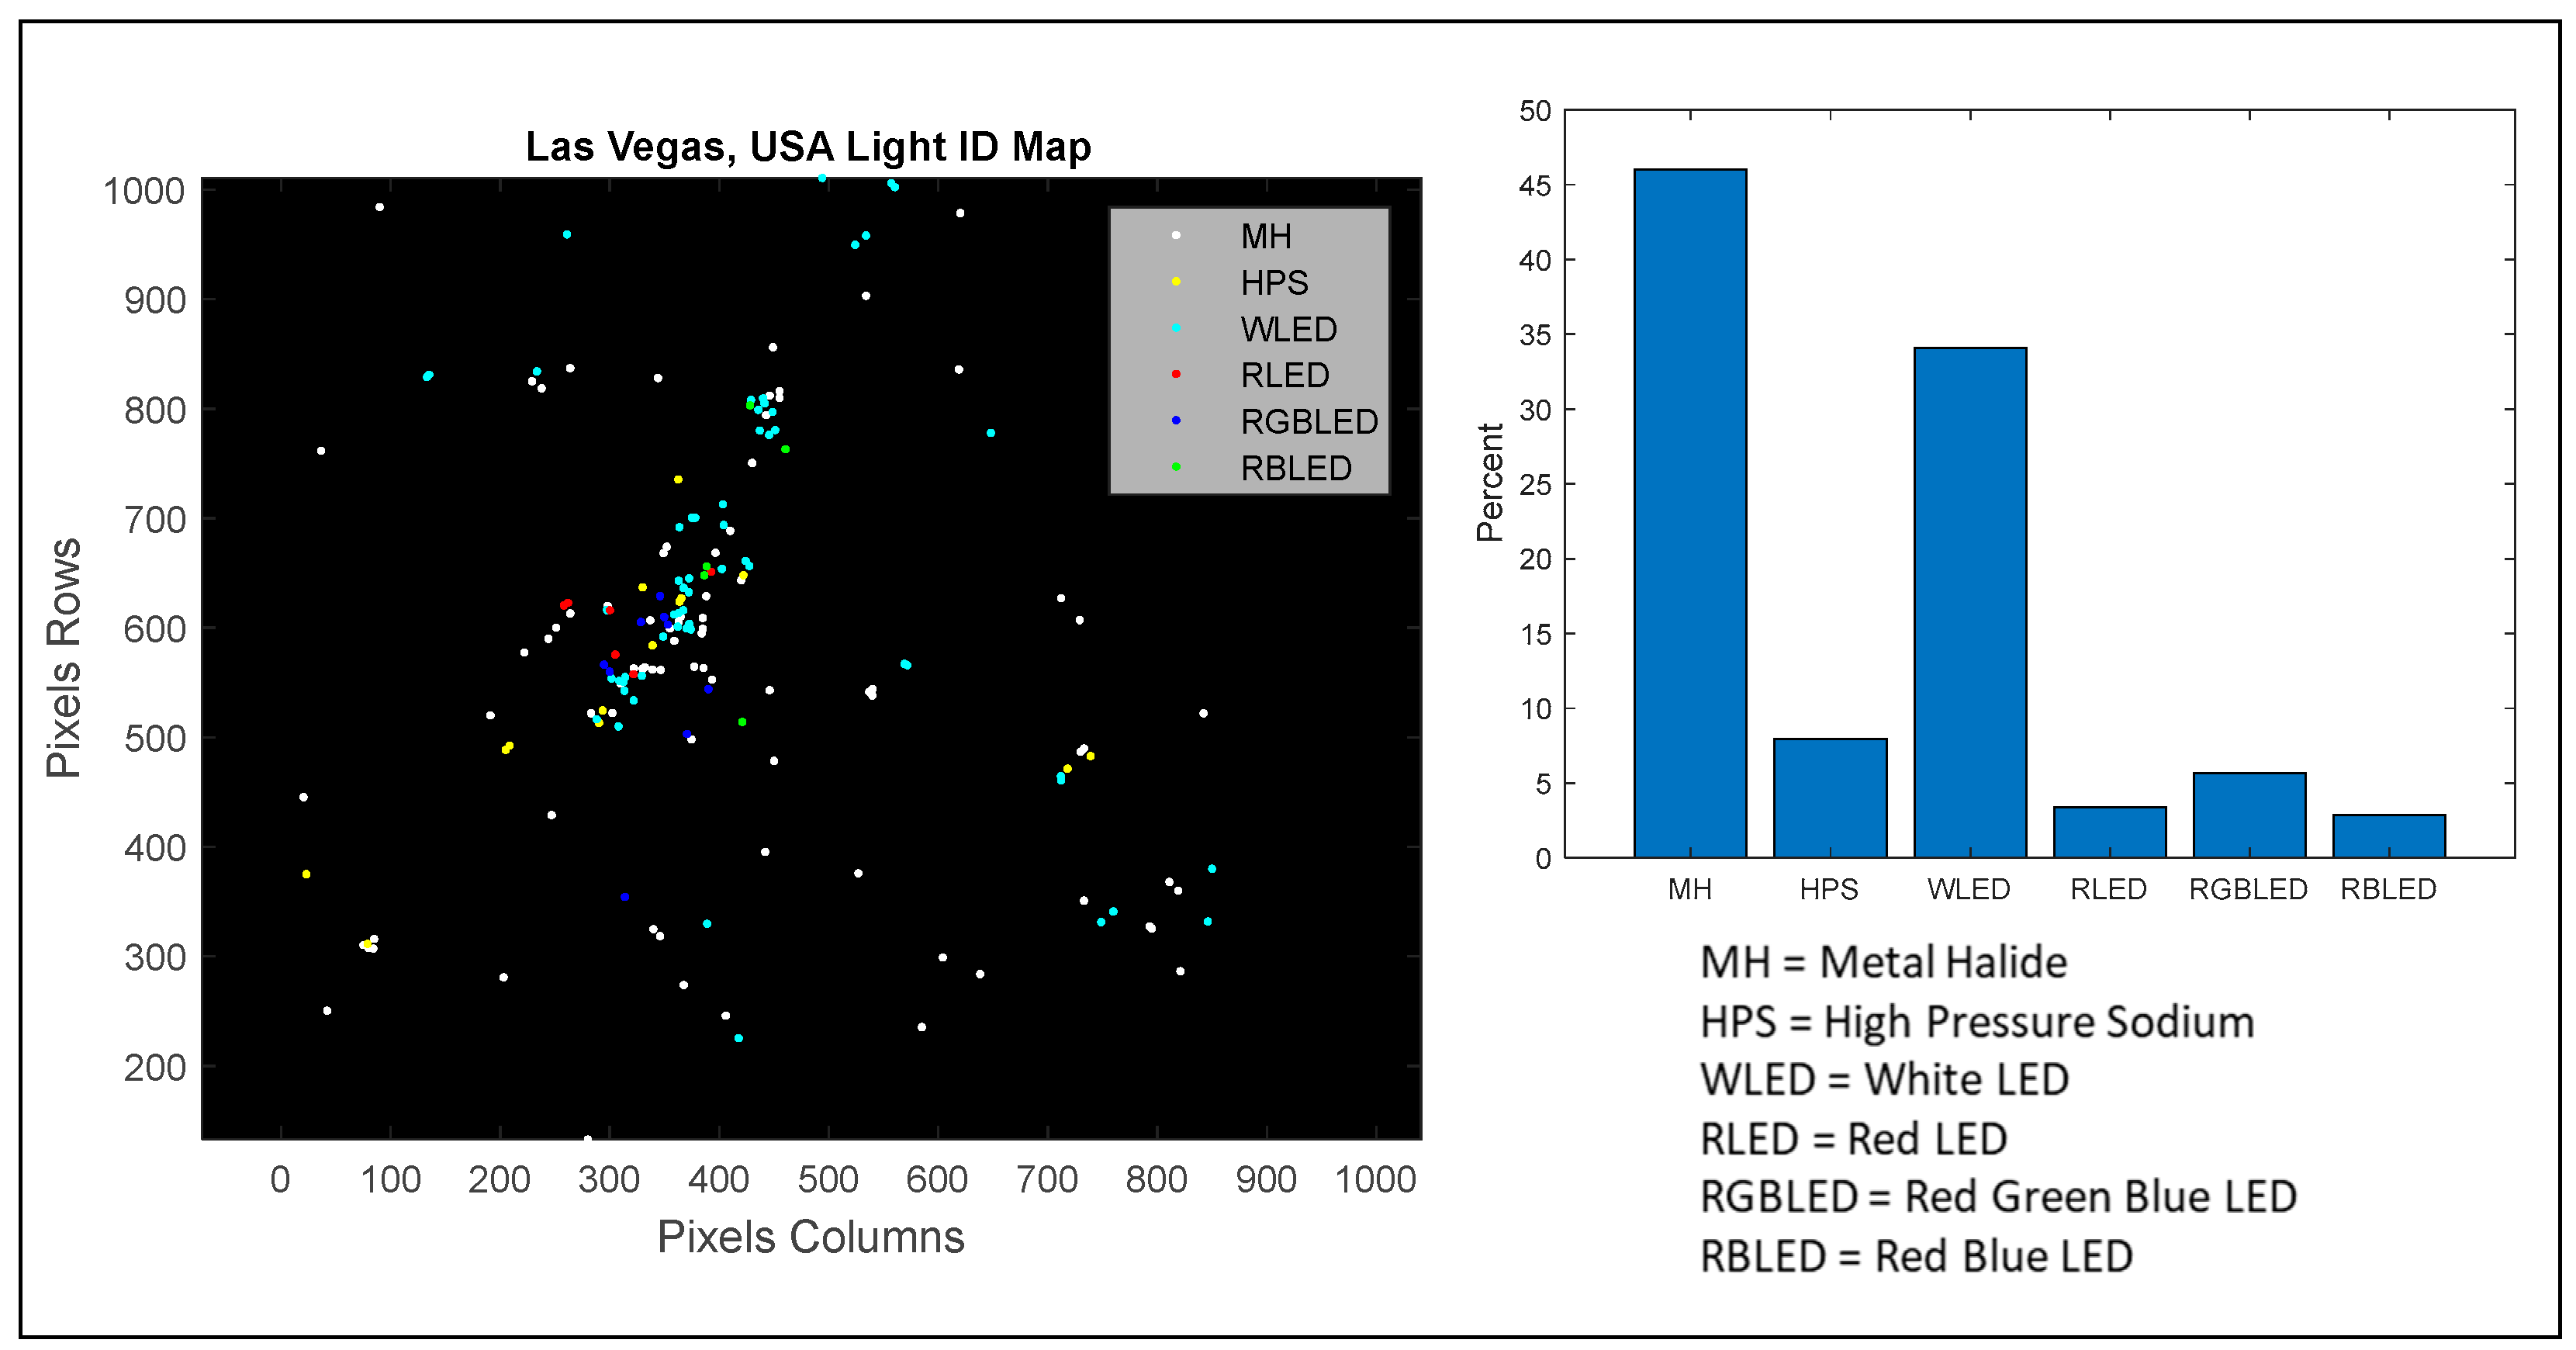
Figure 16.
Las Vegas, NV, light identification map shown as an L1B image (left) and bar graph of scene percentages of each light type (right). In this example, MH and white LEDs dominate the NTLs observed within the scene. Includes copyrighted material of Teledyne Brown Engineering, Inc. All rights reserved.

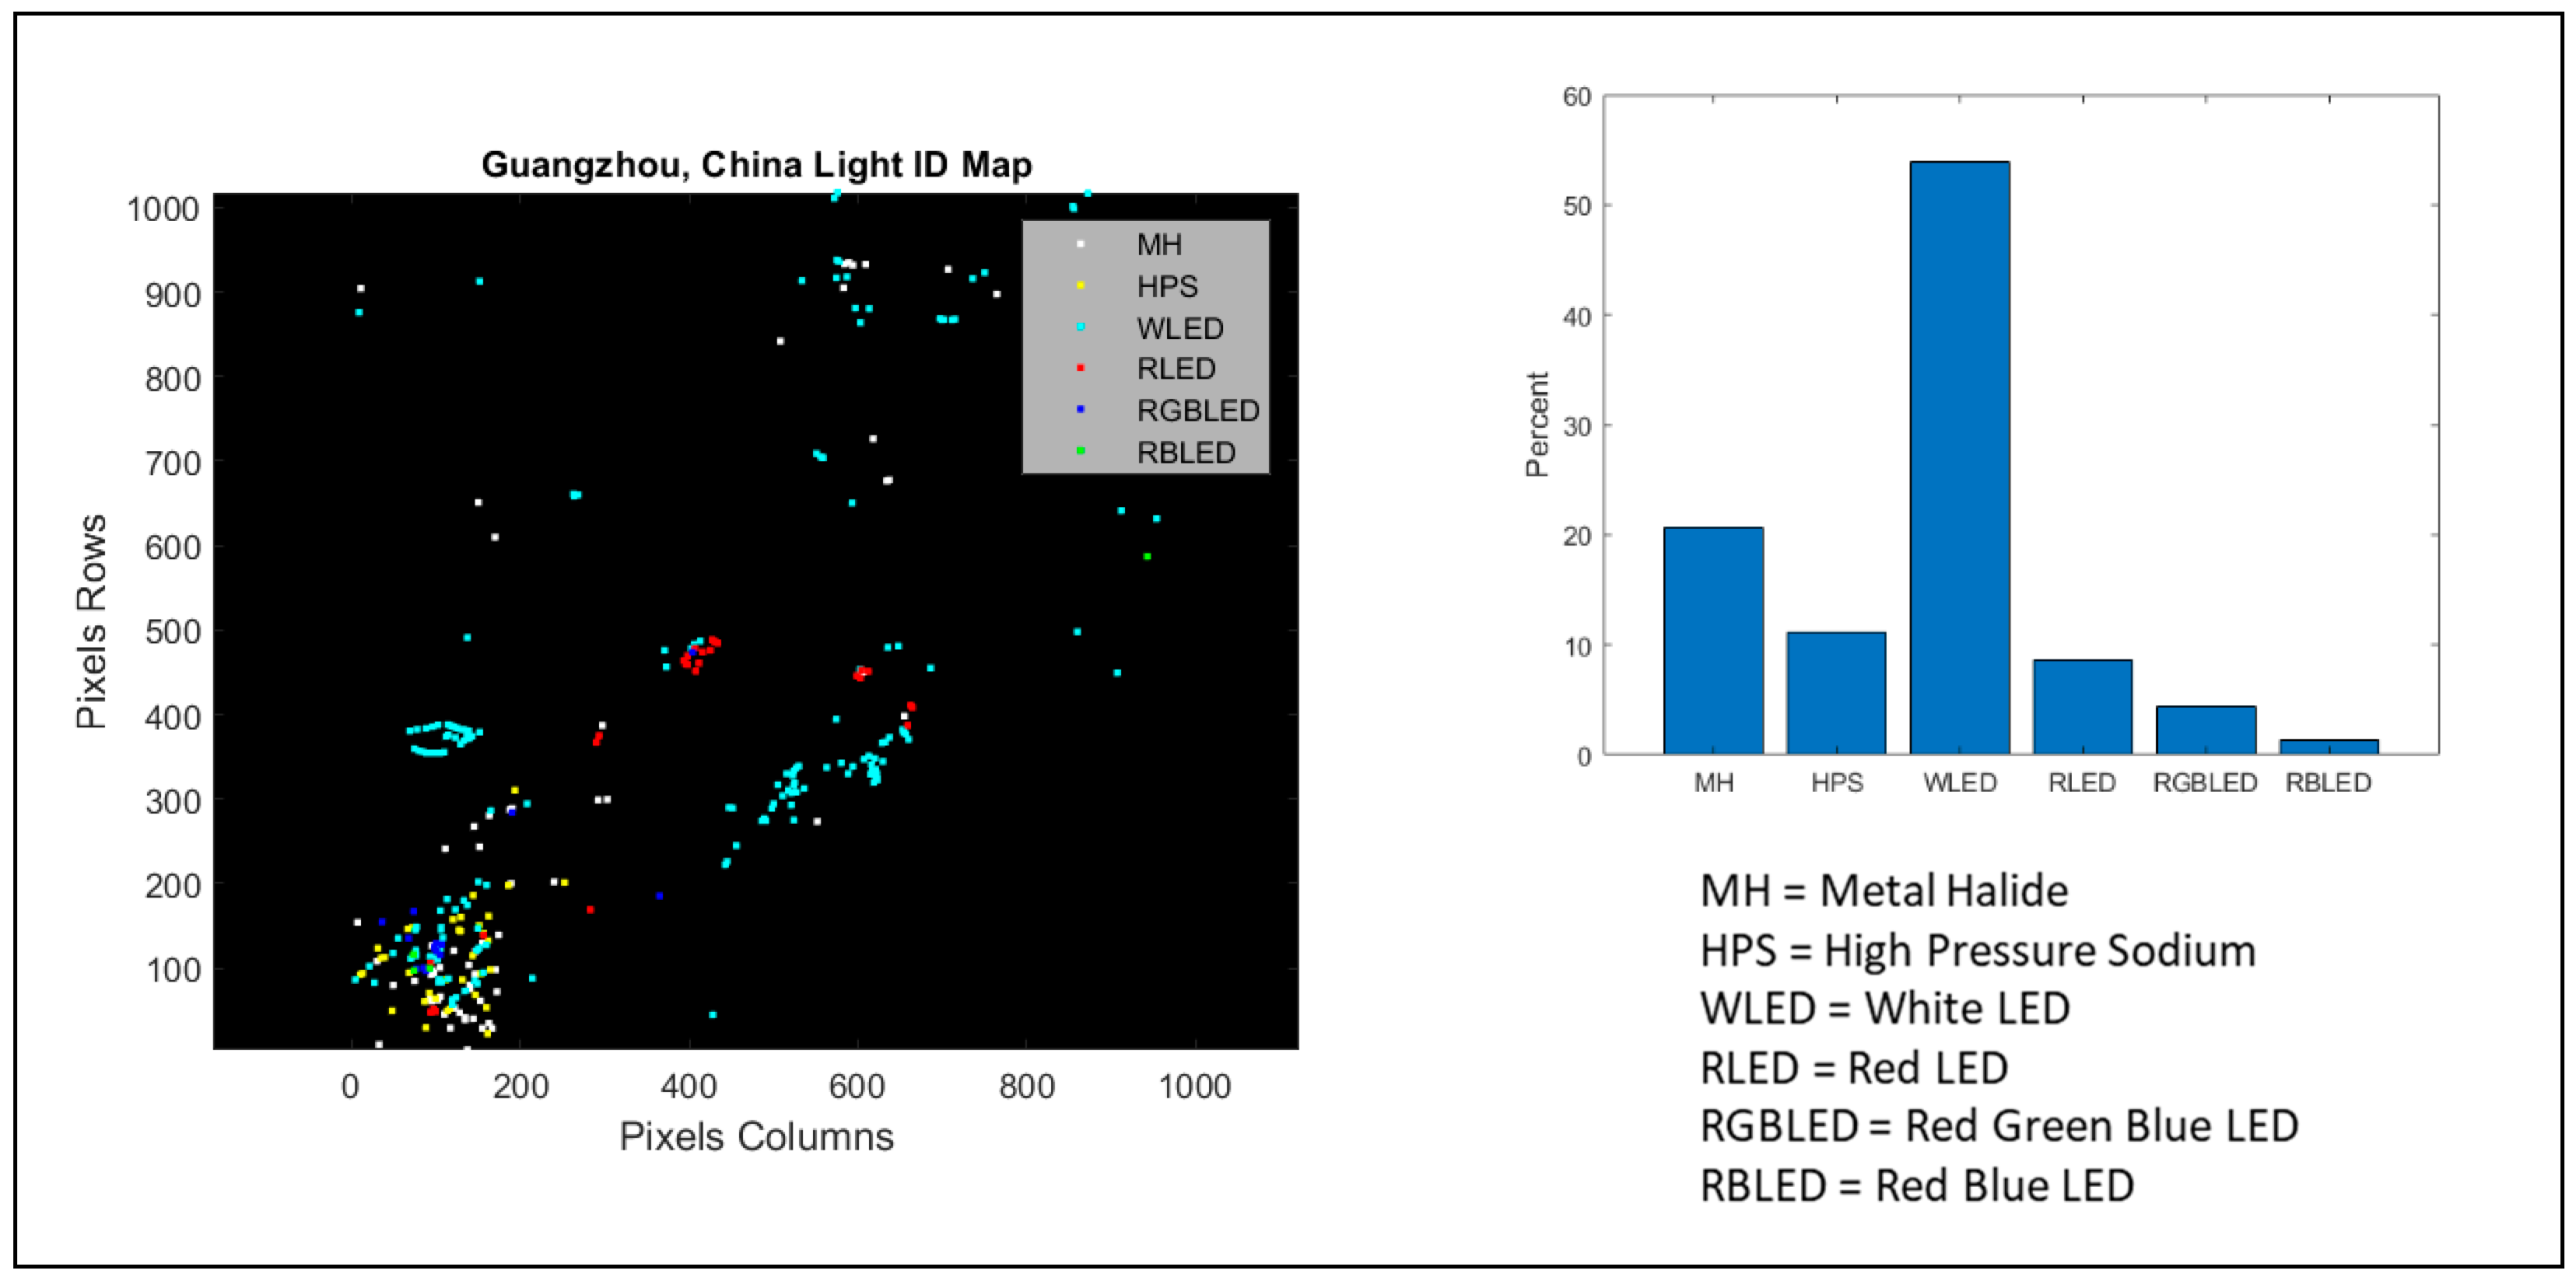
Figure 17.
Guangzhou, China, light identification map shown as an L1B image (left) and bar graph of scene percentages of each light type (right). In this example, white LEDs dominate the NTLs observed within the scene. Includes copyrighted material of Teledyne Brown Engineering, Inc. All rights reserved.

Figure 18.
DESIS night image wavelength calibration. The estimated near-unity slope indicates that the DESIS wavelength calibration agrees with atomic emission line spectral locations. No clear pattern is seen in the residuals. Includes copyrighted material of Teledyne Brown Engineering, Inc. All rights reserved.


Table 1.
Relevant DESIS parameters.
| Parameter | Value |
|---|---|
| Orbit (km) Inclination angle (deg) | 400 51.6 (on ISS) |
| F#/focal length (mm) | 2.8/320 (telecentric) |
| Effective aperture diameter (mm) | 114 |
| Exposure time (ms) | 3.77 |
| Field of view (FOV) (deg) Instantaneous field of view (IFOV) (deg) | 4.1 0.004 |
| Ground sampling distance (m) | 30 |
| Ground swath (km) | 30 |
| Spectral range (nm) | 400–1000 |
| Spectral sampling (nm) | 235 bands @ 2.55 with a programmable binning factor (1 to 4) |
| FWHM (nm) | ~3.5 |
| Quantization (bits) | 12-bit quantization + 1 bit for gain |
| Signal-to-noise ratio (SNR) (Albedo 0.3, solar zenith angle 45°, @550 nm) | 195 (no binning) |
| Modulation transfer function (MTF) @Nyquist | >20% |
| On-board calibration | Shutter for dark signal non-uniformity (DSNU), LED array for photo response non-uniformity (PRNU) |
| Independent pointing (deg) | ±15 (along-track) |
Table 2.
DESIS nighttime datasets used in this assessment.
| Scan | Tile | Location | Acquisition Date | Center Lat. (deg) | Center Long. (deg) | Elevation (m) |
|---|---|---|---|---|---|---|
| 848134532 | 1 | Las Vegas, NV, USA | 04/21/2023 | 35.8 | −115.7 | 812 |
| 848134532 | 3 | Las Vegas, NV, USA | 04/21/2023 | 36.1 | −115.2 | 676 |
| 204211242 | 3 | Guangzhou, China | 02/04/2021 | 23.1 | 113.5 | 23 |
| 914201628 | 2 | Kuwait City, Kuwait | 09/14/2020 | 29.4 | 48.0 | 9 |
| 128211807 | 2 | Ahmedabad, India | 01/28/2021 | 23.1 | 72.5 | 76 |
Table 3.
Minimal optical power for extended, point, continuous, and monochromatic light sources at ~600 nm.
Table 3.
Minimal optical power for extended, point, continuous, and monochromatic light sources at ~600 nm.
| Spatial | Spectral | Fp | Fs | (W) |
|---|---|---|---|---|
| Extended | Continuous | 1 | 1 | 0.387 |
| Extended | Monochromatic | 1 | 0.68 | 0.570 |
| Point | Continuous | 0.41 | 1 | 0.945 |
| Point | Monochromatic | 0.41 | 0.68 | 1.389 |
Table 4.
Atomic emission line spectral locations as measured by DESIS in the identified scene compared to truth. Truth was obtained by measuring lamp spectra using an NIST-traceable spectrometer and Spectralon panel for all elements except Cs.
Table 4.
Atomic emission line spectral locations as measured by DESIS in the identified scene compared to truth. Truth was obtained by measuring lamp spectra using an NIST-traceable spectrometer and Spectralon panel for all elements except Cs.
| Source No. | Lamp | Element | DESIS Scene | Truth (nm) | DESIS (nm) |
|---|---|---|---|---|---|
| 1 | MH | Hg | Guangzhou | 435.7 | 434.9 |
| 2 | MH | Hg | Las Vegas | 435.7 | 435.2 |
| 3 | HPS | Na | Guangzhou | 498.3 | 497.8 |
| 4 | MH | Hg | Las Vegas | 546.0 | 546.3 |
| 5 | MH | Na | Guangzhou | 568.8 | 569.3 |
| 6 | MH | Hg | Guangzhou | 578.8 | 578.5 |
| 7 | HPS | Na | Guangzhou | 818.8 | 819.5 |
| 8 | MH | Na | Guangzhou | 819.3 | 819.4 |
| 9 | HP Cs | Cs | Kuwait | 852.1 | 853.9 |
| 10 | HP Cs | Cs | Kuwait | 894.4 | 896.1 |
Disclaimer/Publisher’s Note: The statements, opinions and data contained in all publications are solely those of the individual author(s) and contributor(s) and not of MDPI and/or the editor(s). MDPI and/or the editor(s) disclaim responsibility for any injury to people or property resulting from any ideas, methods, instructions or products referred to in the content. |
© 2024 by the authors. Licensee MDPI, Basel, Switzerland. This article is an open access article distributed under the terms and conditions of the Creative Commons Attribution (CC BY) license (https://creativecommons.org/licenses/by/4.0/).
Share and Cite
MDPI and ACS Style
Ryan, R.E.; Pagnutti, M.; Ryan, H.; Burch, K.; Manriquez, K. Satellite Hyperspectral Nighttime Light Observation and Identification with DESIS. Remote Sens. 2024, 16, 923. https://doi.org/10.3390/rs16050923
AMA Style
Ryan RE, Pagnutti M, Ryan H, Burch K, Manriquez K. Satellite Hyperspectral Nighttime Light Observation and Identification with DESIS. Remote Sensing. 2024; 16(5):923. https://doi.org/10.3390/rs16050923
Chicago/Turabian StyleRyan, Robert E., Mary Pagnutti, Hannah Ryan, Kara Burch, and Kimberly Manriquez. 2024. "Satellite Hyperspectral Nighttime Light Observation and Identification with DESIS" Remote Sensing 16, no. 5: 923. https://doi.org/10.3390/rs16050923
Note that from the first issue of 2016, this journal uses article numbers instead of page numbers. See further details here.