Article

Evaluation of ICESat-2 Significant Wave Height Data with Buoy Observations in the Great Lakes and Application in Examination of Wave Model Predictions

1
Cooperative Institute for Great Lakes Research, School for Environment and Sustainability, University of Michigan, 4840 S State Rd., Ann Arbor, MI 48108, USA
2
Climate & Space Sciences and Engineering, University of Michigan, 2455 Hayward St., Ann Arbor, MI 48109, USA
3
NOAA Great Lakes Environmental Research Laboratory, 4840 S State Rd., Ann Arbor, MI 48108, USA
4
Great Lakes Research Center, Michigan Technological University, 1400 Townsend Drive, Houghton, MI 49931, USA
*
Author to whom correspondence should be addressed.
Remote Sens. 2024, 16(4), 679; https://doi.org/10.3390/rs16040679
Submission received: 4 January 2024 / Revised: 8 February 2024 / Accepted: 9 February 2024 / Published: 14 February 2024

Abstract

:
High waves and surges associated with storms pose threats to the coastal communities around the Great Lakes. Numerical wave models, such as WAVEWATCHIII, are commonly used to predict the wave height and direction for the Great Lakes. These predictions help determine risks and threats associated with storm events. To verify the reliability and accuracy of the wave model outputs, it is essential to compare them with observed wave conditions (e.g., significant wave height), many of which come from buoys. However, in the Great Lakes, most of the buoys are retrieved before those lakes are frozen; therefore, winter wave measurements remain a gap in the Great Lakes’ data. To fill the data gap, we utilize data from the Inland Water Surface Height product of the Ice, Cloud, and Land Elevation Satellite-2 (ICESat-2) as complements. In this study, the data quality of ICESat-2 is evaluated by comparing with wave conditions from buoy observations in the Great Lakes. Then, we evaluate the model quality of NOAA’s Great Lakes Waves-Unstructured Forecast System version 2.0 (GLWUv2) by comparing its retrospective forecast simulations for significant wave height with the significant wave height data from ICESat-2, as well as data from a drifting Spotter buoy that was experimentally deployed in the Great Lakes. The study indicates that the wave measurements obtained from ICESat-2 align closely with the in situ buoy observations, displaying a root-mean-square error (RMSE) of 0.191 m, a scatter index (SI) of 0.46, and a correlation coefficient of 0.890. Further evaluation suggests that the GLWUv2 tends to overestimate the wave conditions in high wave events during winter. The statistics show that the RMSE in 0–0.8 m waves is 0.257 m, while the RMSE in waves higher than 1.5 m is 0.899 m.
Key Contribution: This study will fill a critical data gap of wave conditions for the Great Lakes during winter by verifying the accuracy of the satellite ICESat-2 ATL13 significant wave height data.

1. Introduction

Coastal communities face potential dangers due to the formidable waves and powerful surges that accompany storms. These natural phenomena present significant risks, endangering the safety and well-being of those residing in coastal areas of the North American Great Lakes (hereafter referred to as the Great Lakes). For example, with winds hitting 20 m/s in Muskegon, Michigan, Lake Michigan’s eastern shore, waves surpassed 3 m in height on 5 December 2017 [1]. This severe storm followed another record of extreme weather in Lake Superior in October, when a buoy in Lake Superior north of Marquette, Michigan, recorded a highest wave of 8.8 m during a high wave event on 24 and 25 October 2017, according to the National Data Buoy Center (NDBC) database. Two people were swept into the lake at Black Rocks, a lookout point in Presque Isle Park north of Marquette [2]. Given these circumstances, the quality of numerical wave models such as WAVEWATCHIII® (hereafter WW3) [3] holds great significance, as it plays a pivotal role as the foundation of NOAA’s operational Great Lakes Waves-Unstructured Forecast System version 2.0 (GLWUv2) [4,5] in providing wave forecast guidance and warnings for the Great Lakes region. Accurate forecasts enable coastal communities to take precautionary measures to safeguard their properties against potential damages.
In the Great Lakes region, most of the in situ observations of significant wave height (SWH) used to evaluate GLWUv2 are provided by NDBC buoys. However, the buoys are regularly retrieved from the lakes during winter to avoid damage from the ice cover. Therefore, the lack of buoy data in winter leaves the accuracy of the wave model unverified for winter periods. To fill this gap in wave model evaluation, wave data detected by satellites are utilized as an alternative data source.
The ATL13 Along Track Inland Surface Water Data provided by the Ice, Cloud, and Land Elevation Satellite-2 (ICESat-2 ATL13) contains SWH measurements over inland water bodies, including the Great Lakes region [6]. The data offer a potential source for evaluating the accuracy and effectiveness of GLWUv2 in SWH predictions within the Great Lakes for the following three reasons: First, the ICESat-2 ATL13 data products provide the SWH data over unfrozen areas of the Great Lakes during the winter, which makes it competent in complementing the winter data gaps. Second, the ICESat-2 produces a high density of SWH data along its operational track. According to the data over the Great Lakes region in this study, the density of the SWH is approximately 11.8 data points per kilometer. The inland water heights are processed in segments that contain a minimum of approximately 100 signal photons to ensure the segment accurately characterizes the water surface. As such, the segments vary in length from approximately 30 m to 100 m [6]. Therefore, the ICESat-2 ATL13 data products provide the information about water surface conditions at an unprecedentedly high resolution compared with other satellite measurements, such as those produced by the China–France Oceanography Satellite (CFOSAT), whose spatial resolution (nadir beam) is around 70 to 80 km [7], and the Global Navigation Satellite System-Reflectometry (GNSS-R) data, which provide SWH estimates at a resolution of 27.8 km × 27.8 km (0.25° × 0.25°) [8]. Third, the data products from ICESat-2 demonstrate high precision. As presented in the Algorithm Theoretical Basis Document for ATL13 [9], the overall ensemble error per 100 inland water photons is estimated as 6.1 cm, derived from the root-mean-square of five error sources: radial orbit error, tropospheric delay error, forward scattering error, geolocation knowledge uncertainty, and ATLAS (Advanced Topographic Laser Altimeter System) ranging precision per photon. Therefore, it is worth exploring the potential of the ATL13 data products of ICESat-2 in physical wave model verification for the Great Lakes.
Although it has been over 5 years since ICESat-2’s launch (15 September 2018), the SWH data in its ATL13 product have not been broadly explored and applied for examining wave conditions over large water bodies. Most studies regarding the ICESat-2 ATL13 product focus on its inland water orthometric height data, while its SWH data are only treated as auxiliary information. For example, Luo et al. [10] estimated lake water level on the Tibetan Plateau by subtracting the SWH from the orthometric height of the ATL13 dataset. They evaluated how taking SWH into consideration would affect estimating the change rates of water level. Similarly, Liu et al. [11] used the ICESat-2 ATL13 product to monitor the lake water levels in the Yellow River Basin by also subtracting the SWH from the orthometric water level to obtain the true water level, but found this greatly increased the standard deviation of the water level measurements and thus increased the uncertainty of the water volume change calculation, compared to disregarding the effect of SWH. An et al. [12] evaluated the performance of seven ongoing satellite (ICESat-2 included) altimetry missions for measuring inland water levels of the Great Lakes, and concluded that the stability of the average deviation (bias) of the ICESat-2 is the best in inland water level measurements, but the mean root-mean-square error (RMSE) of ICESat-2 is slightly higher than satellites Jason-3 and Sentinel-6. They also pointed out that ICESat-2 has an exceptionally high spatial resolution among the seven satellites. However, their study did not explore the use of SWH data of the ICESat-2 ATL13 product for studying wave conditions in the Great Lakes.
Despite their promising potential, the SWH data of the ICESat-2 ATL13 product remain unexamined. It is necessary to assess their data quality and accuracy before being applied in evaluating the numerical wave model prediction results. Some studies have conducted similar work and investigated the data quality of SWH data provided by other satellites. According to Yang and Zhang’s study [13], the RMSE is about 0.2–0.3 m for the comparison of satellite Sentinel-3A SWH with NDBC buoy data, and that of satellite Sentinel-3B is about 0.18–0.3 m, across the global ocean. Li et al. [14] assessed the performance of the SWH data of the China–France Oceanography Satellite (CFOSAT) in the South China Sea, a unique sea area characterized by a semi-enclosed basin and multi-reef terrain. Compared against observations from mooring or buoy sites, they found that the average correlation coefficient is as high as 0.87, and the average RMSE is 0.47 m in the relatively open and deep areas of the South China Sea. However, the SWH data would be affected by coastlines, topography, and monsoons in certain cases. Moreover, Durrant et al. [15] validated SWH data from Jason-1 and Envisat satellite altimetry against NDBC buoy data across the globe. The Jason-1 SWH was reported to have a bias of −0.010 m, an RMSE of 0.227 m, and a correlation coefficient of 0.983, and the Envisat SWH was reported to have a bias of 0.036 m, an RMSE of 0.219 m, and a correlation coefficient of 0.986. In addition, Peng and Jin [8] estimated the global ocean SWH using space-borne CYGNSS GNSS-R data through the relationship between the square root of the signal-to-noise ratio data of the CYGNSS delayed Doppler map and the SWH, then compared it with buoy-measured data from NDBC. The correlation coefficient between the estimated value and the SWH observation of a buoy is 0.9539, the bias is −0.0496 m, and the RMSE is 0.2761 m. Although all of the above four studies focused on ocean waves, none of them evaluated satellite SWH measurements, particularly in the Great Lakes. Actually, such research remains fairly rare based on our search among academic articles.
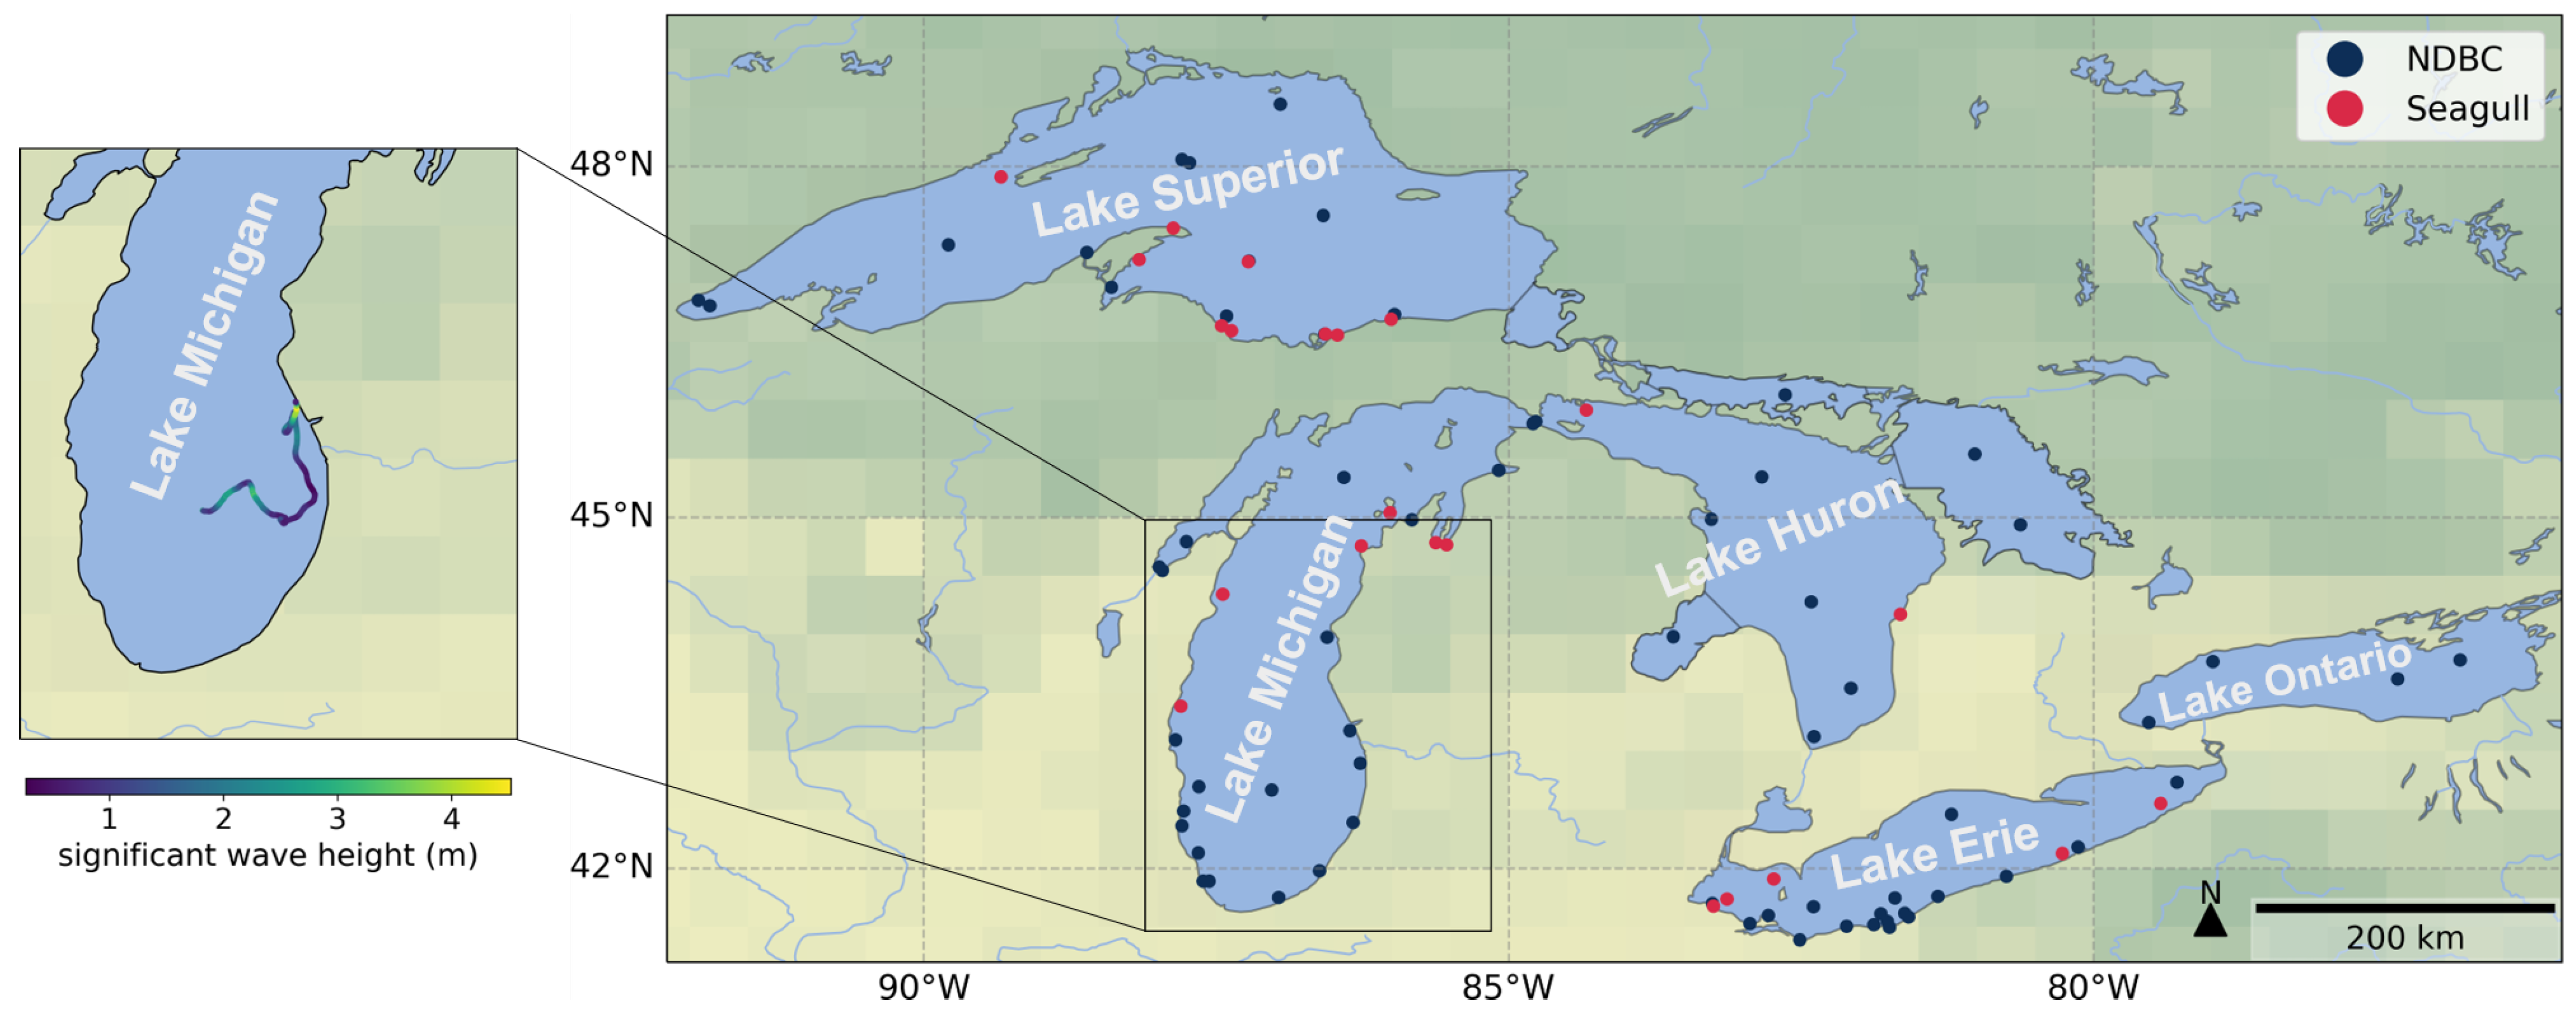
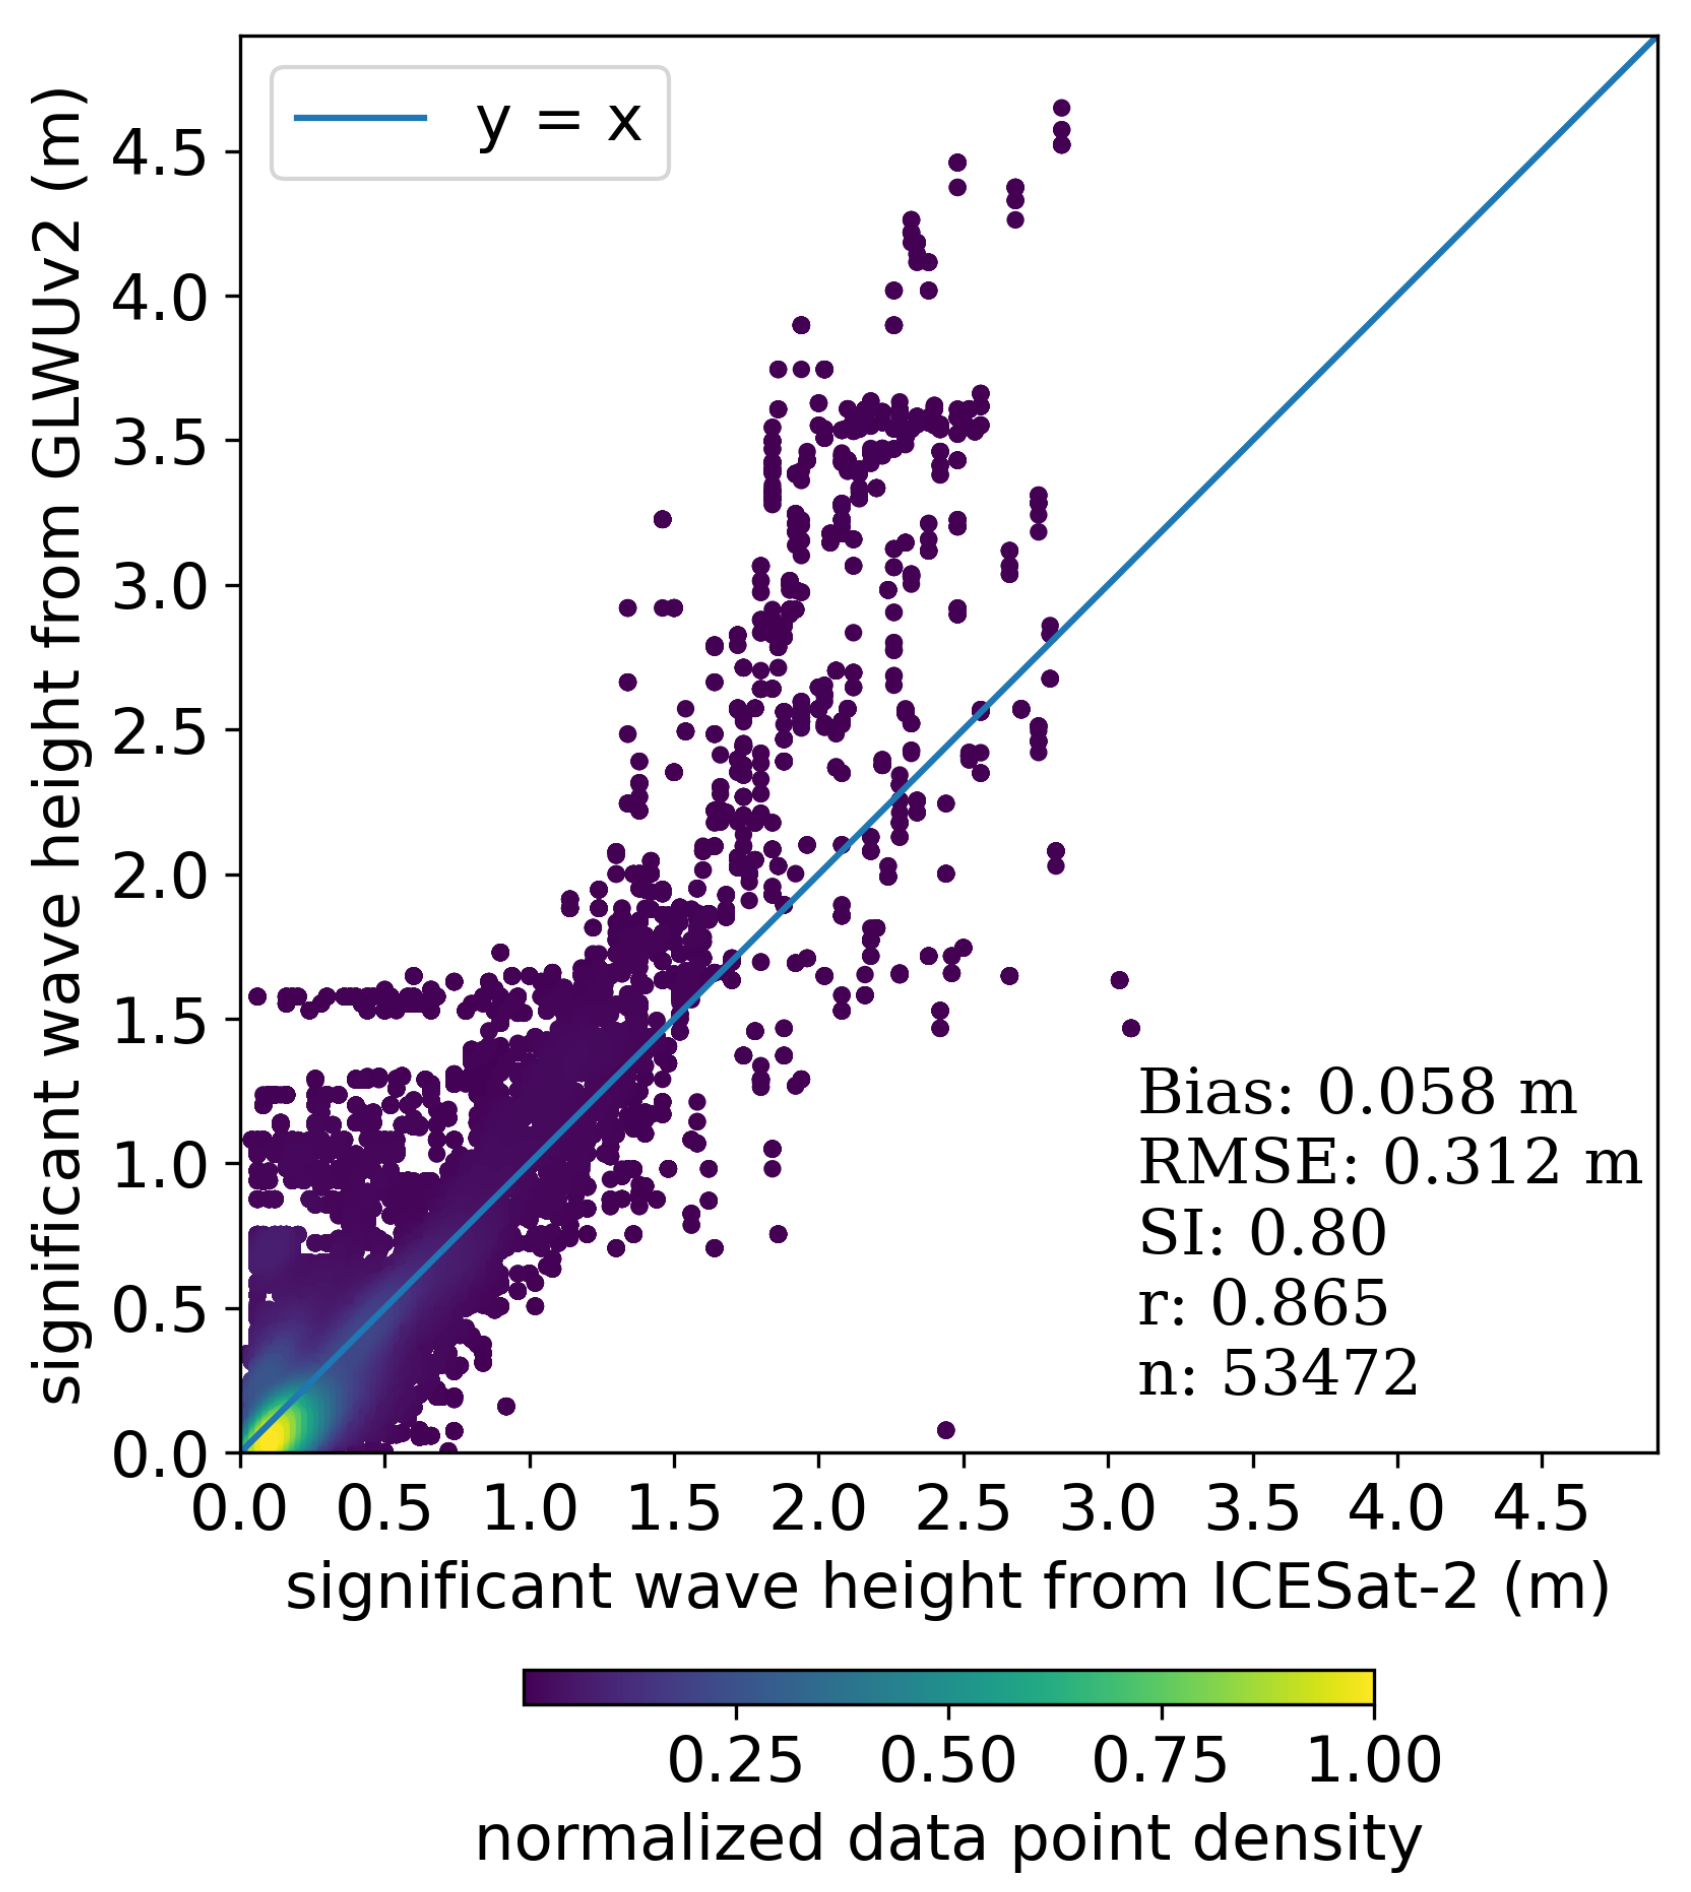
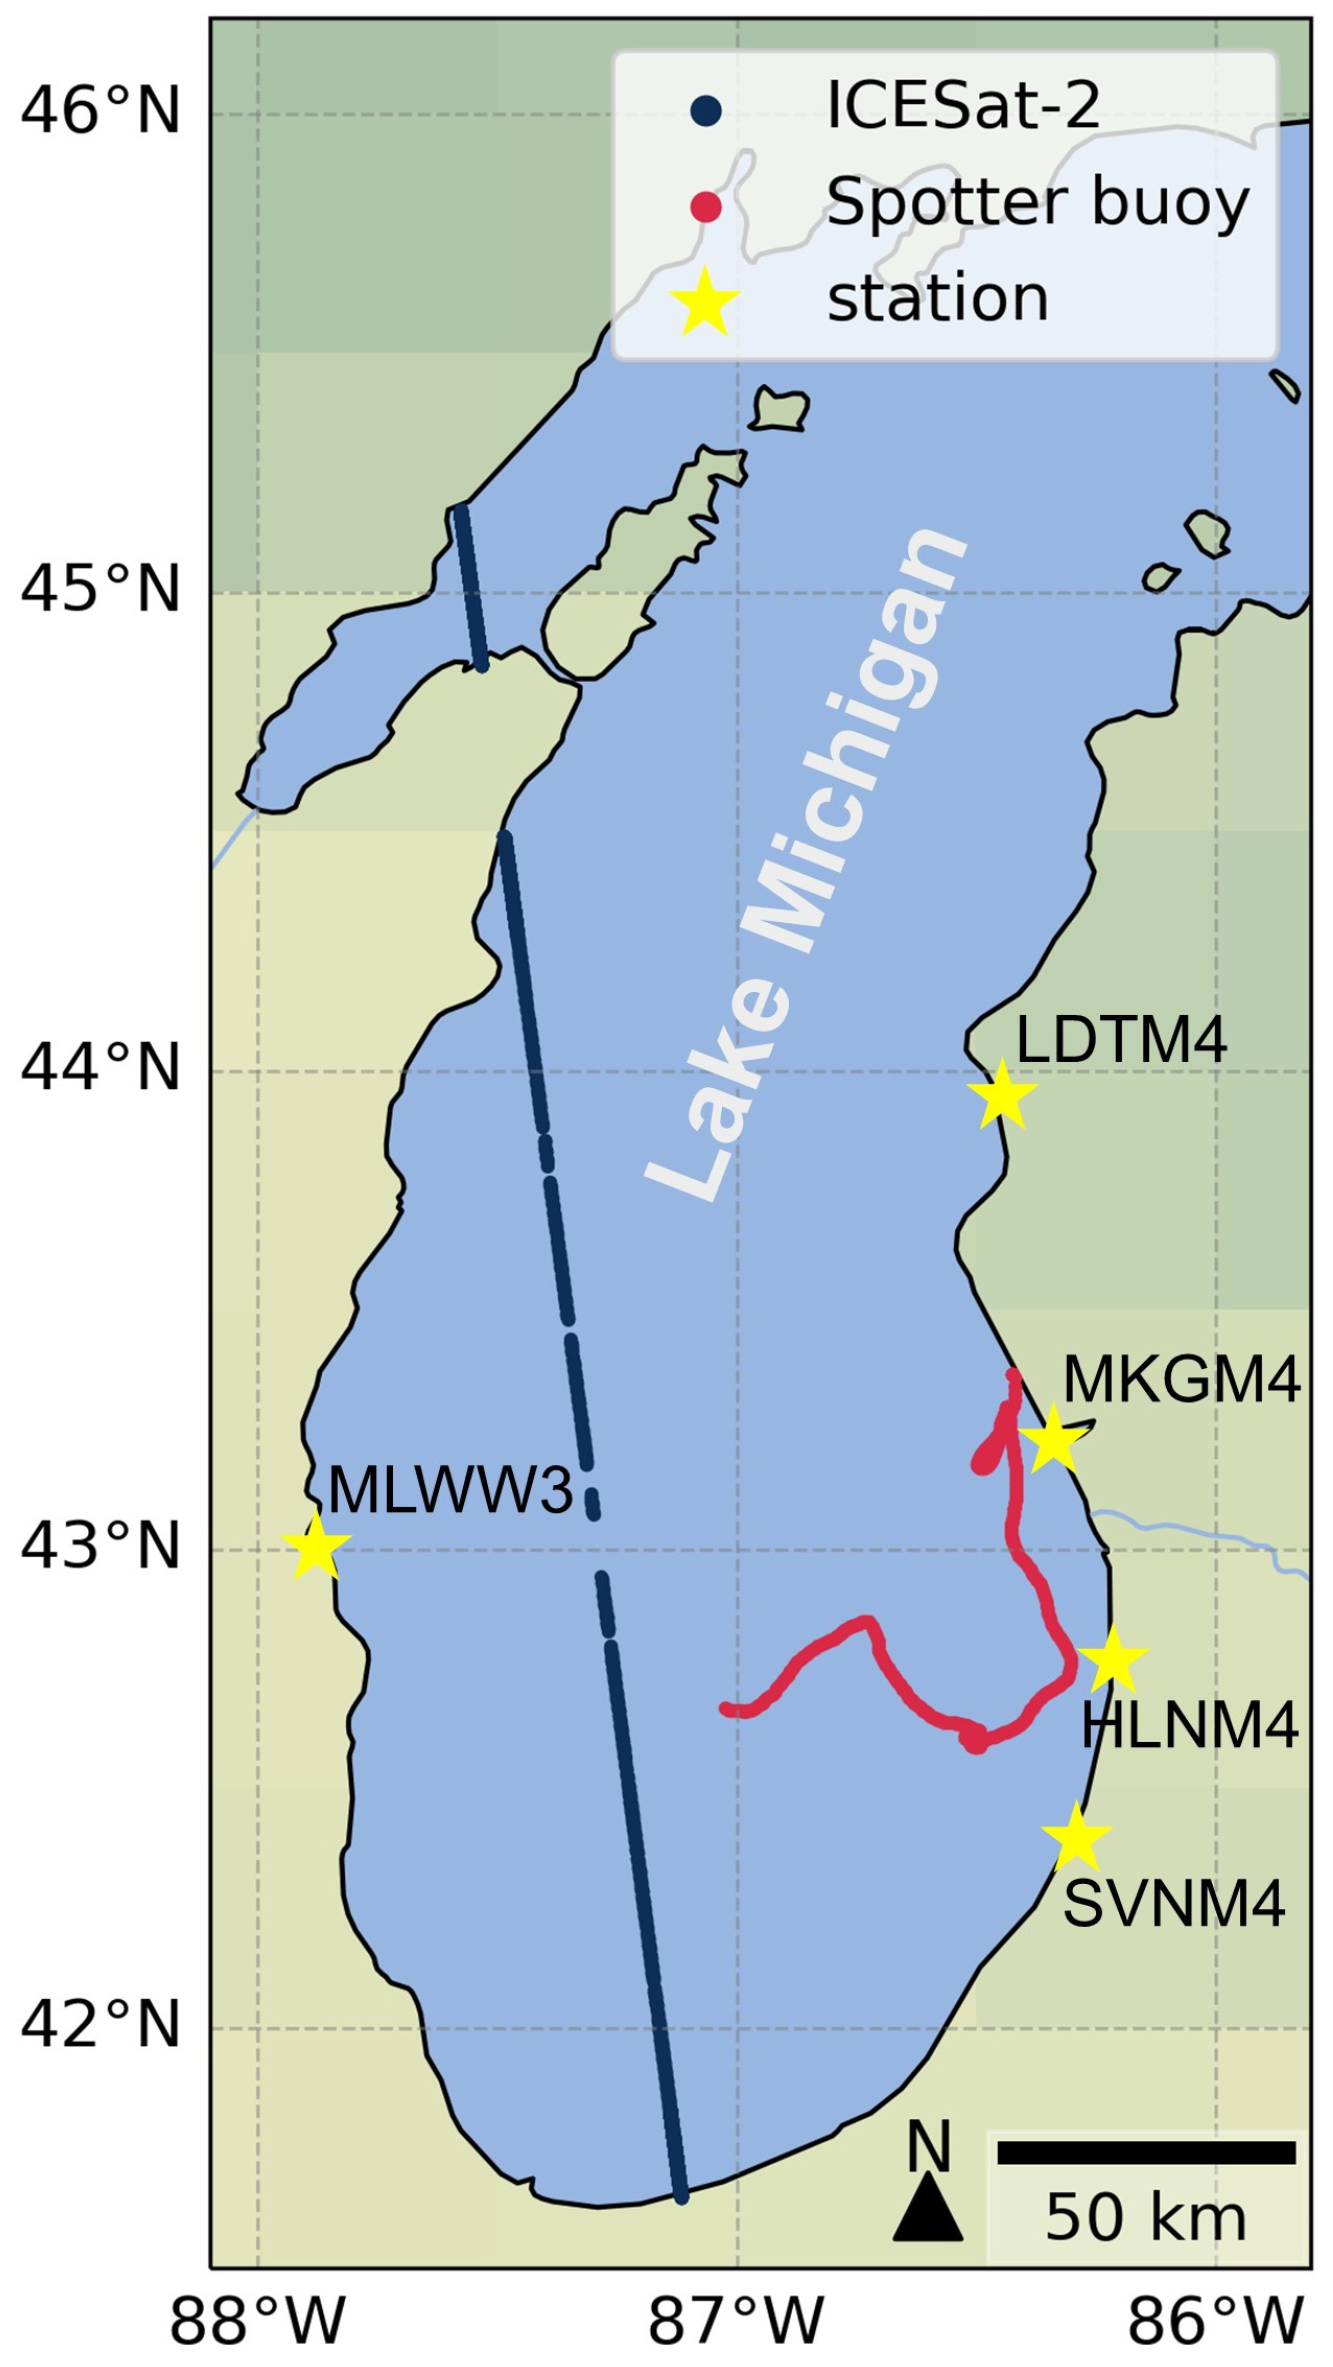
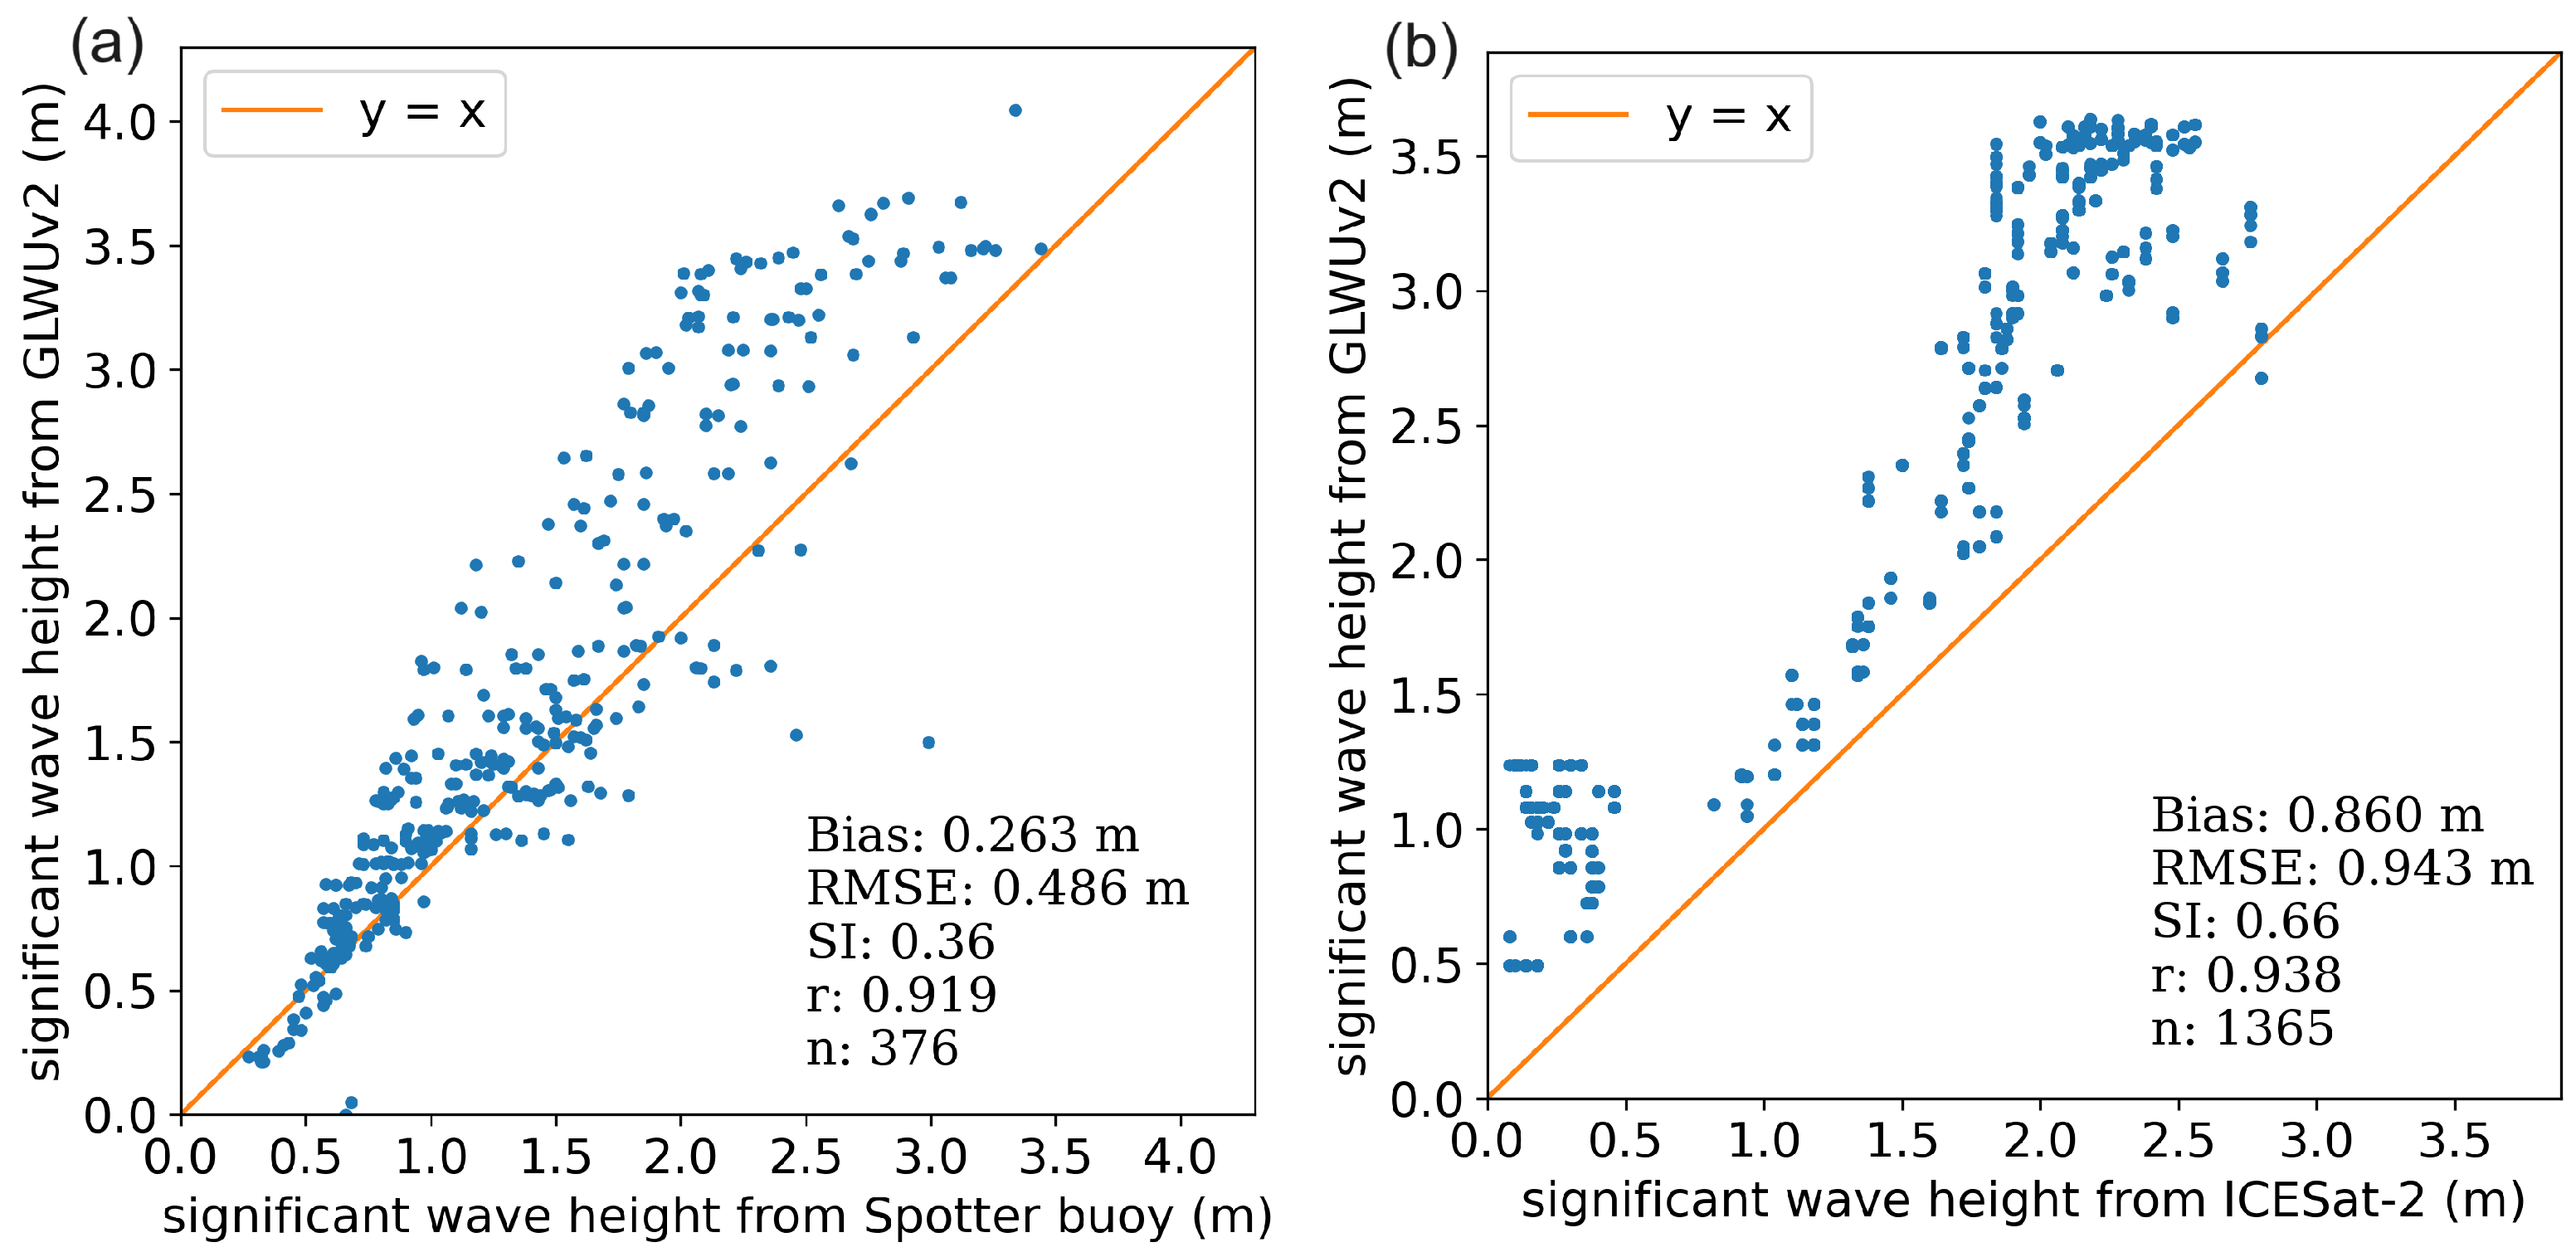
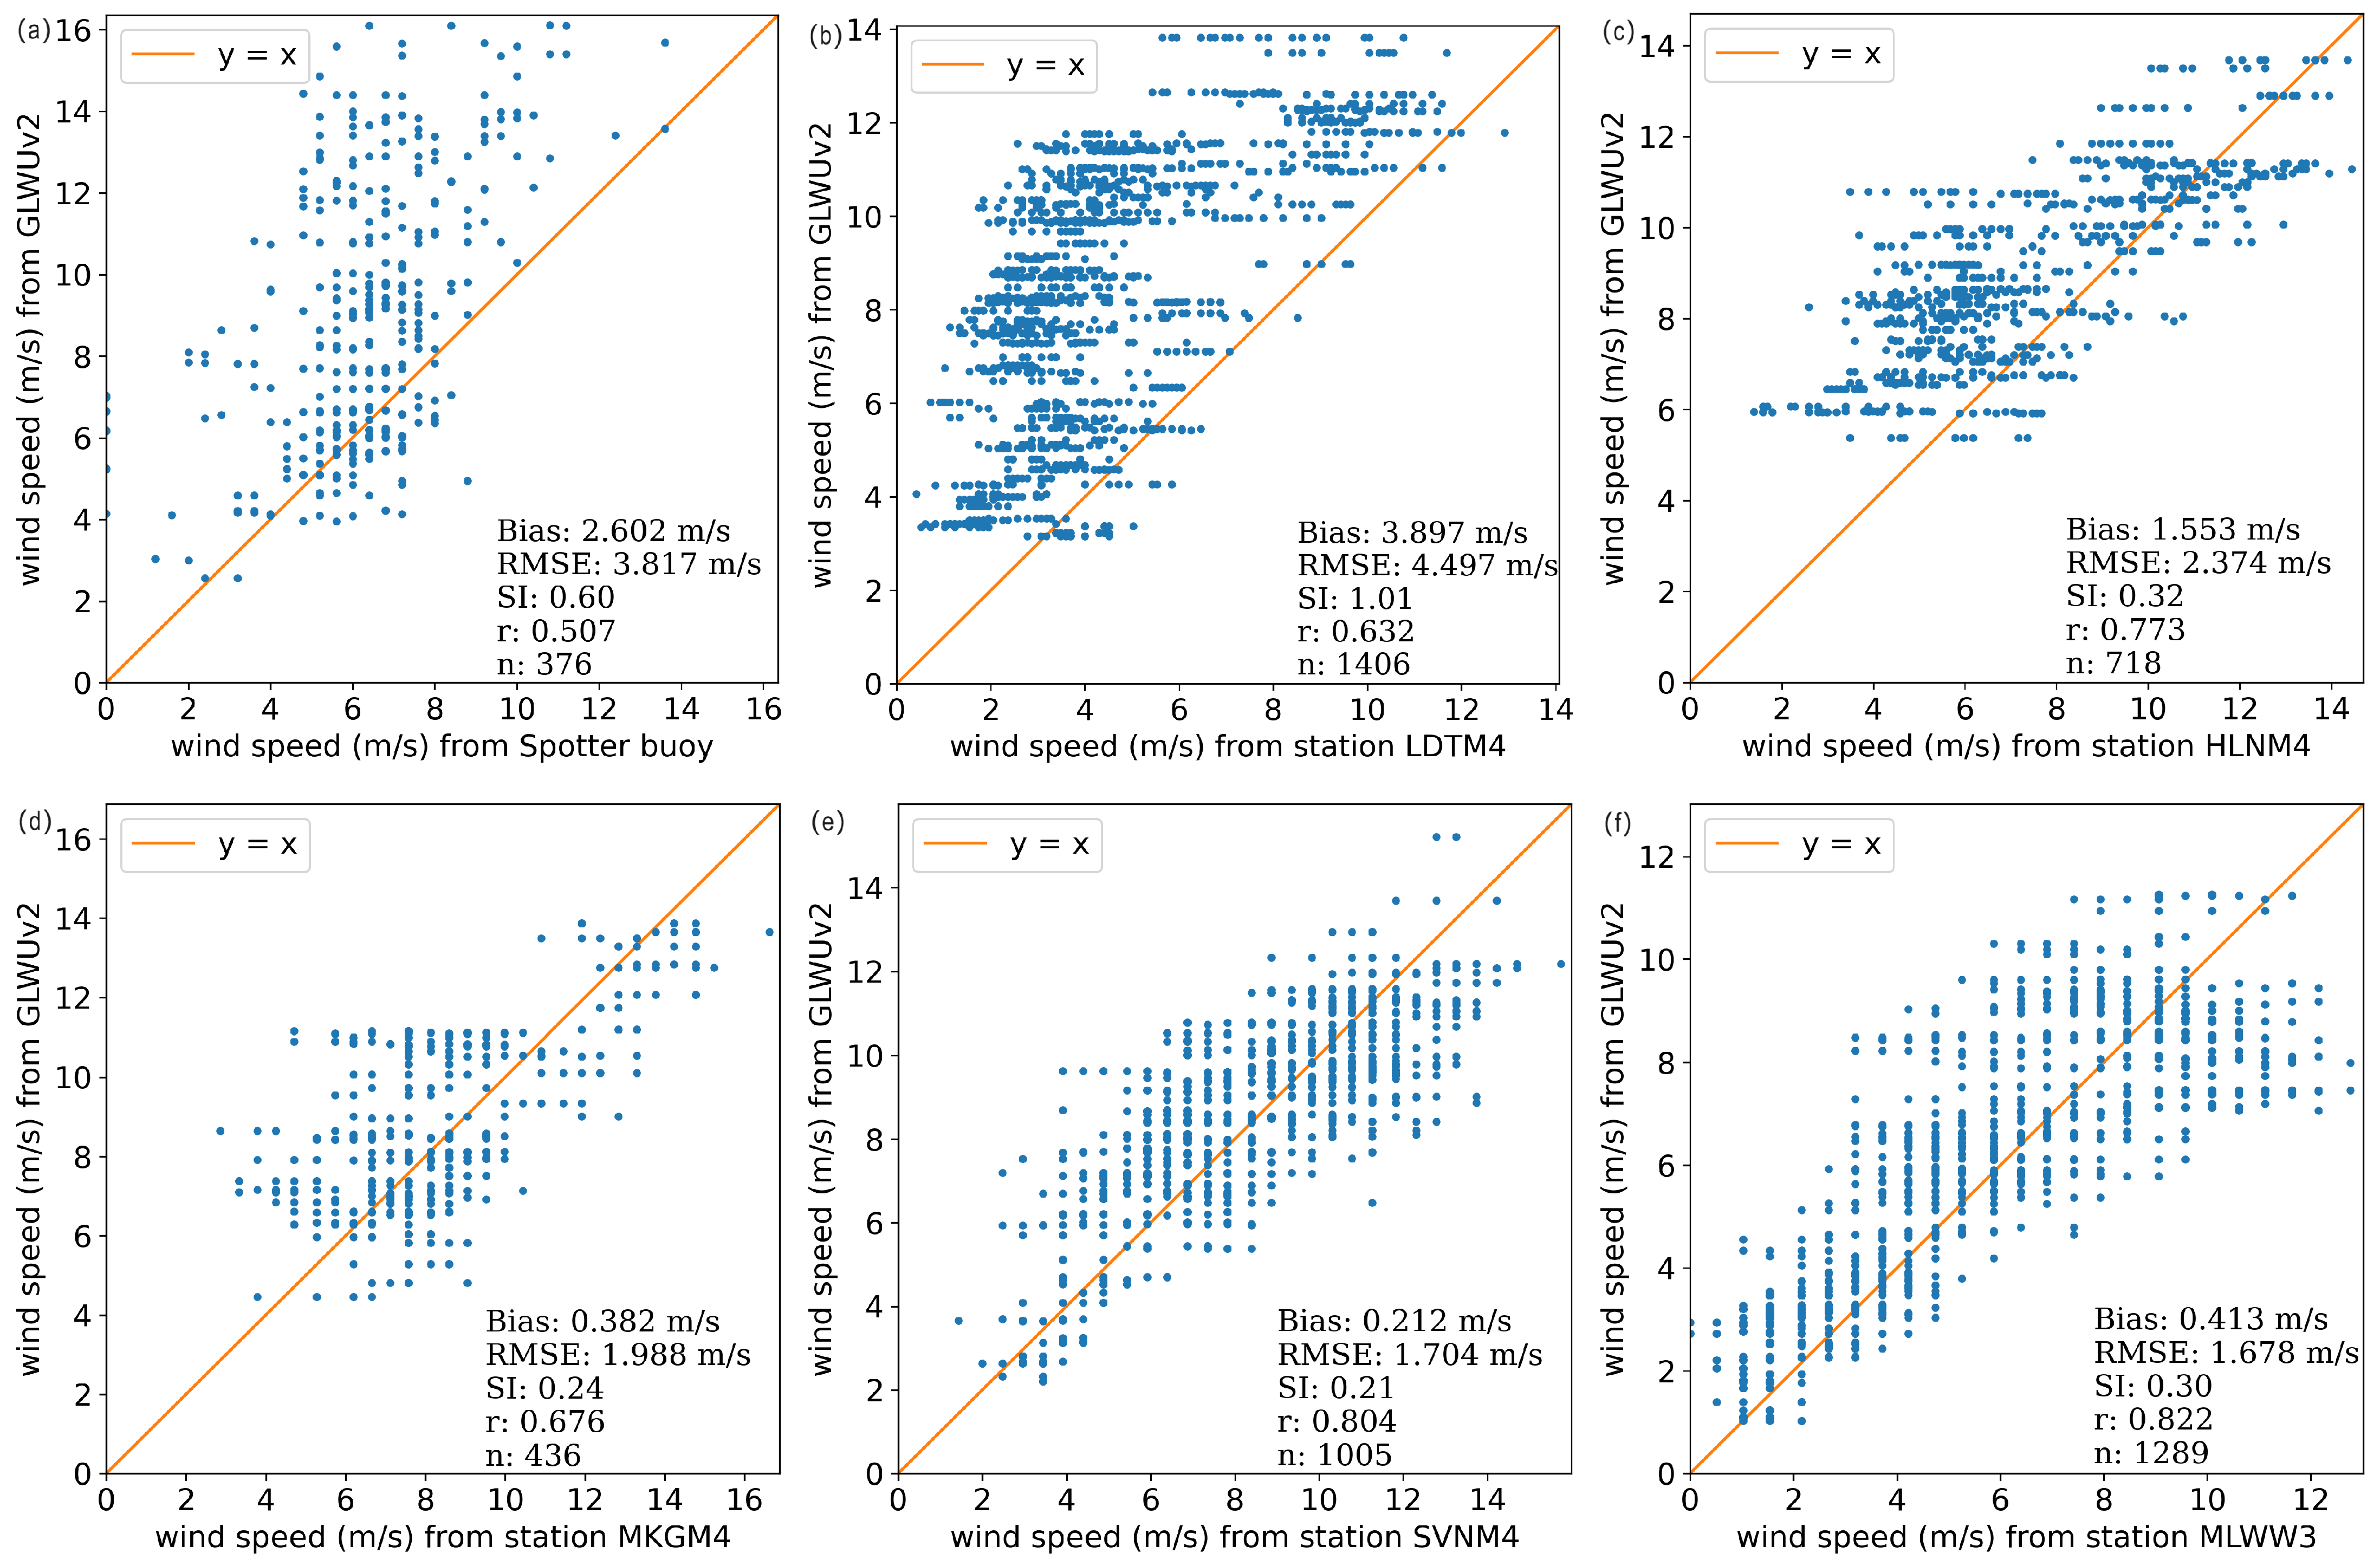
Based on the reasons above, this study evaluated the quality of the ICESat-2 ATL13 significant wave height data in the Great Lakes region using the regular buoy measurements sourced from the National Data Buoy Center (NDBC) and the Seagull platform of the Great Lakes Observing System (Seagull GLOS), within two time intervals: April 2021 to December 2021, and May 2022 to October 2022. Then, this study assessed the model quality of GLWUv2 by comparing its retrospective forecast simulations with the ICESat-2 ATL13 significant wave height data in the Great Lakes, and also with emerging low-cost Spotter buoys that have enabled rare winter wave measurements in recent years. This study will fill a critical data gap of wave conditions for the Great Lakes during winter by verifying the accuracy of the ICESat-2 ATL13 significant wave height data. The work will ultimately contribute by providing better wave predictions that improve the preparedness of the people and industries of the Great Lakes communities for dangerous high wave conditions.

2. Materials and Methods

2.1. Study Area

Our study focused on the Great Lakes, which are the largest freshwater system on Earth by area and the second largest by total volume, containing 21% of the world’s surface freshwater and more miles of coastline than the combined Atlantic and Pacific Ocean coastlines in the contiguous United States. The Great Lakes consist of Lake Superior, Michigan, Huron, Erie, Ontario, and the connecting channels (Figure 1). The Great Lakes megalopolis is the most populated and largest megalopolis in North America, containing an estimated population of 53,768,125 as of 2000 and is projected to reach a population of about 63 million by 2025 [16], which indicates that the safeguarding of the Great Lakes coastal communities is imperative.

2.2. Data

2.2.1. ICESat-2 ATL13 Data

The Inland Water Surface Height product (ATL13) of the Ice, Cloud, and Land Elevation Satellite-2 (ICESat-2) was used in this study. The ICESat-2 was launched on 15 September 2018, carrying a photon-counting laser altimeter that allows scientists to measure the elevation of ice sheets, glaciers, sea ice and more. The ATL13 contains along-track surface water products for inland water bodies, including lakes, reservoirs, rivers, bays, estuaries, and a 7 km near-shore buffer [6].
The Advanced Topographic Laser Altimeter System (ATLAS) on the satellite ICESat-2 is measuring the surface with 6 laser beams (3 pairs). Each pair consists of one strong beam and one weak beam, different in their transmit energy. The ground tracks corresponding to the 3 pairs are noted as pair track 1, pair track 2, and pair track 3. The two beams within each pair are approximately 90 m apart in the across-track direction and 2.5 km in the along-track direction. The ICESat-2 observatory changes its orientation approximately twice per year, thereby affecting the naming of the 6 beams. Along the direction of travel, depending on their relative position, the three beams on the left of each pair are noted as GTXL, the other three on the right as GTXR, which is a consistent principle (GTX means ground track number). Accordingly, we use GT1R when the ICESat-2 observatory is in forward orientation, and GT3L when it is in backward orientation, as listed in Table 1.

2.2.2. In Situ Observations

The SWH data from the ICESat-2 ATL13 product are first verified using the in situ buoy observations. Most of the regular real-time buoy datasets are available from the National Data Buoy Center and the Seagull platform of the Great Lakes Observing System. These regular buoy measurements are limited to non-winter seasons because buoys are retrieved in the late fall to avoid damage from ice cover. Recently, drifting wave buoys were experimentally deployed in the Great Lakes over the winter. These drifting wave buoys, called Spotter buoys, are low-cost, solar powered metocean buoys developed by Sofar Ocean Technologies, Inc., San Francisco, CA, USA [17]. Spotter buoys have been used in studies understanding wave conditions in the marginal ice zone of the Arctic Ocean [18] and other coastal oceans [19]. For the verification work, we utilized the regular buoy data for late summer–fall when high wind conditions are secondly frequent following winter [20] and therefore SWH tends to be higher. The distribution of the regular buoys is shown in Figure 1. Their basic information including buoy ID, coordinates, sampling time interval, water depth, number of observed samples used in the study, lake, and data source (NDBC or Seagull) is listed in Table A1. For the wintertime verification, we utilized the Spotter buoy data from the experimental deployment during 10–18 February 2022 in Lake Michigan. The trajectory of the drifting Spotter buoy is shown in the corner of Figure 1.
Finally, wind data from the Coastal Marine Automated Network (C-MAN) at Ludington MI (station ID: LDTM4), Holland MI (station ID: HLNM4), Muskegon MI (station ID: MKGM4), South Haven MI (station ID: SVNM4), and Milwaukee WI (station ID: MLWW3) were used for comparison with the GLWUv2 wind forcing data. The wind speed data from the stations were height-adjusted to 10 m based on the log wind profile assumption [21].

2.2.3. Wave Model Outputs

The NOAA’s Great Lakes Waves-Unstructured Forecast System version 2.0 (GLWUv2) is based on the WAVEWATCHIII® (WW3) model [3,4,5], which is a physics-based, third-generation wave model where four-wave nonlinear interaction and various other source terms are explicitly modeled in frequency directional space. The current version of WW3 is 6.07. GLWUv2 is implemented on an unstructured grid with resolution ranging from 250 m near the coast to 2.5 km in deep waters. The model is forced by wind fields from the National Digital Forecast Database (NDFD). Considering that the GLWUv2 became operational in May 2023, and the ICESat-2 data are still unavailable for the winter from December 2023 to February 2024, in this study, the retrospective forecast simulation results for January and February in 2022 are used as a proxy for hindcast to evaluate the model quality. GLWUv2 runs on hourly forecast cycles daily, with twenty short cycles out to 48 h and four long cycles out to 150 h. Because the main purpose of this comparison is to examine the best available model estimates for the SWH, in this study, we only use the first-6-h prediction results starting from 1:00 UTC, 7:00 UTC, 13:00 UTC, and 19:00 UTC of each day, thereby constituting the continuous hourly data for each day.

2.3. Data Comparison Methods

Due to the limited distribution of buoys across the Great Lakes region and the ability of buoy observations to reflect the wave conditions only within certain spatial scale, the ideal comparison should be made between buoy data points and ICESat-2 data points that coincide in time and space. The following method is employed to accomplish this matching process:
Each trajectory of ICESat-2 ATL13 over the Great Lakes contains 102–103 data points spanning within several seconds due to its high spatiotemporal resolution. The ICESat-2 data point of the closest distance (less than 25 km) to the buoys and the temporally linear-interpolated buoy data point are paired together. As a result, a total of 554 data pairs were obtained during April 2021–October 2022.
Subsequently, the paired data were visually plotted on maps with colors denoting the magnitude of the significant wave height. They were also compared visually by a scatter plot. Then, the ICESat-2 SWH data were evaluated by the statistical analysis of the SWH difference, including the bias, root-mean-square error (RMSE), correlation coefficient (r), and scattering index (SI), defined as follows:
Bias = 1 n i = 1 n ( y i x i ) ,
RMSE = 1 n i = 1 n ( y i x i ) 2 ,
SI = RMSE x ¯ ,
r = i = 1 n ( x i x ¯ ) ( y i y ¯ ) i = 1 n ( x i x ¯ ) 2 · i = 1 n ( y i y ¯ ) 2 ,
where n represents total number of matched pairs; y i represents ICESat-2 SWH measurements; y ¯ represents ICESat-2 SWH average; x i represents the buoy SWH observations; and x ¯ represents buoy SWH average.
Similarly, the same comparative approach was extended to examine GLWUv2’s SWH retrospective forecast results. This assessment involved comparisons of GLWUv2 SWH outputs with both ICESat-2 SWH measurements and drifting Spotter buoy observations. In each matched data pair, the GLWUv2 data point was also rigorously selected as the closest counterpart. Consequently, a total of 53,472 matched data pairs were obtained from the matching with ICESat-2 SWH measurements during the period of 1 January to 28 February 2022, and the matching with the Spotter buoy observations yielded 376 matched data pairs during the period of 10–18 February 2022.

3. Results and Discussion

3.1. Data Quality Evaluation of ICESat-2 ATL13 SWH Data

Figure 2 shows comparisons of SWH between ICESat-2 measurements and regular buoy observations on different example days. Illustrated by the color gradient, the data points indicate that the SWH measured by ICESat-2 agrees with regular buoy observations.
The SWH comparisons between ICESat-2 measurements and buoy observations from April 2021 to October 2022 were collected and plotted on an x-y coordinate system. As shown in Figure 3a, the straight line y = x is used for reference. We note that most of the points are located surrounding the y = x line, indicating that the ICESat-2 can achieve a reasonable measurement of the SWH in the Great Lakes.
As shown in Table 2, the RMSE for ICESat-2 SWH in all the data pairs collectively is 0.191 m, and the correlation coefficient is 0.890. We also split the data pairs into three groups based on the distance between the ICESat-2 measurement and its corresponding buoy observation. The three groups are noted as 0–9.2 km, 9.2–16.7 km, and 16.7–25.0 km. In this way, the three groups are equal in sample size. The RMSE and correlation coefficient of each of the three groups are also listed in Table 2, which indicates that the ICESat-2 SWH measurements presented reasonable agreement with buoy SWH observations. In addition, the RMSE does not vary significantly as the distance increases within the 25 km range, which shows that distance within 25 km will not affect the capacity of ICESat-2 SWH measurement to be used as a proxy of buoy SWH observation.
In order to focus particularly on high waves, we consider waves with SWH higher than 0.8 m as high waves. Based on this criterion, the matched data pairs with buoy SWH values larger than 0.8 m will be selected to do a further accuracy analysis, thereby evaluating the ICESat-2 SWH data quality particularly in the high wave events. The results are shown in the Figure 3b scatter plot. The statistical results for all the data pairs in high wave events as well as each group are listed in Table 3. From Table 2 and Table 3, it is evident that the ICESat-2 SWH measurements have a larger RMSE and a lower correlation coefficient for high waves, compared to those for all measurements.

3.2. Evaluation of the GLWUv2 SWH Outputs Using ICESat-2 Measurements

The retrospective SWH prediction results of GLWUv2 in winter (January and February 2022) were compared with the ICESat-2 SWH measurements by spatially plotting the data points on maps. Figure 4 illustrates such comparisons in two low wave scenarios and two high wave scenarios. The color gradient pervasive in the lakes displays the magnitude of the SWH predicted by GLWUv2, round dots in the same color pattern represent ICESat-2 SWH data points, while the gray area in each image represents lake surface ice coverage. In the low wave scenarios, depicted in Figure 4a,b, the GLWUv2 SWH predictions align well with ICESat-2 measurements, as indicated by the similar background colors to the round dots in the red box area. However, in the high wave scenarios, depicted in Figure 4c,d, GLWUv2 tends to overestimate SWH.
We also use a scatter plot to better visualize the comparison of GLWUv2 SWH predictions with ICESat-2 SWH measurements during January and February 2022, as shown in Figure 5. The straight line y = x is still used as reference for the comparison. We note that most of the scattered dots follow the trend of this line. The RMSE is 0.312 m, and the correlation coefficient is 0.865. However, GLWUv2’s noticeable overestimation of the SWH occurs where SWH is higher than 1.5 m. In order to analyze the retrospective prediction accuracy of GLWUv2 SWH in different wave height ranges, the data pairs are divided into three groups based on the ICESat-2 SWH values, which are 0 < S W H 0.8 m, 0.8 < S W H 1.5 m, and S W H > 1.5 m. The bias, RMSE, SI, and correlation coefficient of the GLWUv2 SWH predictions for the three groups are listed in Table 4. The bias and RMSE of GLWUv2 SWH both increase with increasing ICESat-2 SWH values. In addition, the correlation coefficient becomes lower than 0.5 for the scenario of SWH larger than 1.5 m, indicating that the GLWUv2 cannot produce a satisfying prediction for high waves. Though such bias in high waves should be addressed in the future modeling work, in actual forecasting operations, overestimation is more acceptable than underestimation for the objective of not underestimating the risks and threats associated with high wave events to the coastal communities around the Great Lakes.

3.3. Evaluation of the GLWUv2 SWH Prediction Using Drifting Spotter Buoy Observations

Having served as the exclusive buoy data source for winter wave conditions, the solitary Spotter buoy, deployed experimentally in Lake Michigan from 10 to 18 February 2022, offers a unique opportunity to directly scrutinize GLWUv2’s significant wave height (SWH) predictions. The Spotter buoy’s trajectory during this period is shown in red in Figure 6. A total of 376 valid Spotter buoy records were matched with the GLWUv2 predictions for this period, forming the visual comparison via scatter plots. As indicated in Figure 7a, it remains evident that GLWUv2 leans towards overestimating SWH in instances of higher waves, while aligning well with Spotter buoy observations in cases of lower waves. The calculated RMSE is 0.486 m, and the bias is 0.263 m.
This performance discrepancy prompted further investigation into whether the model’s overestimation for SWH can be reconfirmed when compared against ICESat-2 measurements within the same region in Lake Michigan. Due to no ICESat-2 data being available for this region during the Spotter buoy deployment (10–18 February 2022), we opted to compare GLWUv2 results to ICESat-2 measurements for the next available ICESat-2 track, which was on 20 February 2022. The locations of ICESat-2 measurements are illustrated in dark blue in Figure 6. The results, as depicted in Figure 7b, reinforce the observation: GLWUv2 consistently yields higher SWH estimates than those measured by ICESat-2, particularly for higher waves. This consistent trend across both comparisons—GLWUv2 versus Spotter buoy and GLWUv2 versus ICESat-2—underscores the model’s inclination to overestimate SWH.
Since the SWH simulations of GLWUv2 are highly impacted by wind speed in the forcing data (NDFD), a bias in wind speed inevitably leads to an overestimation in the projected SWH values. Therefore, we further evaluated the NDFD wind speed data against the Spotter buoy wind speed data. As depicted in Figure 8a, the majority of the wind speed data surpass the wind speed records collected from the Spotter buoy in Lake Michigan between 10 and 18 February 2022, and its bias in wind speed is 2.602 m/s.
However, when comparing the NDFD wind speed data with the wind speed records obtained from five nearby meteorological observation stations at the lake shore (locations shown in Figure 6) during the same period, the high bias in wind speed is not as evident, except for station LDTM4, where the bias is 3.897 m/s, while at stations HLNM4, MKGM4, SVNM4, and MLWW3, the biases are 1.553 m/s, 0.382 m/s, 0.212 m/s, and 0.413 m/s, respectively. The results are shown in Figure 8b–f. The large bias that occurred at the station LDTM4 could have resulted from its location, the back of the inland small lake (Pere Marquette Lake), surrounded by buildings. This could disturb the wind field around the station, resulting in a lowering of the wind speed, which was not represented by NDFD.
Given the above analysis, it is possible that GLWUv2’s overestimation of SWH during 10–18 February 2022 is due to a local high bias in wind speed in the NDFD wind speed data.

4. Conclusions

Based on a thorough assessment of data quality spanning from April 2021 to October 2022, it is evident that ICESat-2’s measurements of significant wave heights align closely with regular buoy observations in the Great Lakes, exhibiting a root-mean-square error (RMSE) of 0.191 m. This robust consistency substantiates the utility of ICESat-2 data for validating significant wave height predictions generated by GLWUv2 during winter in the Great Lakes region. The findings reveal that GLWUv2 demonstrates proficiency in predicting significant wave heights below 1.5 m, while it sometimes tends to overestimate waves higher than that. The overall RMSE for GLWUv2’s significant wave height predictions is 0.312 m. Furthermore, an in-depth comparison of GLWUv2’s SWH outputs with data from a drifting Spotter buoy in Lake Michigan during 10–18 February 2022 also corroborates the model’s overprediction for significant wave height during high wave events. Incorporating the analysis from the perspective of wind speed, such overestimation for significant wave height can be attributed, in part, to a local high bias in the NDFD wind speed data since wind speed serves as a crucial input for significant wave height estimation. The verified utility of the ICESat-2 ATL13 significant wave height product in the Great Lakes contributes to filling wintertime data gaps in the region, which are critical for advancing our understanding of the Great Lakes’ wintertime limnology.

Author Contributions

Conceptualization, A.F.-M.; methodology, L.L.; software, L.L. and A.F.-M.; validation, L.L.; writing—original draft preparation, L.L.; writing—review and editing, A.F.-M., L.L., R.M., D.T. and H.H.; visualization, L.L.; supervision, A.F.-M.; funding acquisition, A.F.-M. All authors have read and agreed to the published version of the manuscript.

Funding

This research was funded by the National Oceanic and Atmospheric Administration (NOAA) awarded to the Cooperative Institute for Great Lakes Research (CIGLR) through the NOAA Cooperative Agreement with the University of Michigan grant number NA22OAR4320150. This CIGLR contribution number is 1234.

Data Availability Statement

The ICESat-2 data presented in this study are openly available in ATLAS/ICESat-2 L3A Along Track Inland Surface Water Data at DOI: 10.5067/ATLAS/ATL13.005. Publicly available datasets were analyzed in this study. The NDBC buoy significant wave height data and the meteorological station wind data can be found here: https://www.ndbc.noaa.gov/ (accessed on 15 December 2023). The buoy data from Seagull platform of the Great Lakes Observing System can be found here: https://glos.org/priorities/seagull/ (accessed on 15 December 2023). The retrospective forecast simulation data from NOAA’s Great Lakes Waves-Unstructured Forecast System version 2.0 presented in this study are available on request from the corresponding author.

Acknowledgments

We thank Saeideh Banihashemi for providing retrospective forecast simulation outputs of the NOAA’s Great Lakes Waves-Unstructured Forecast System version 2.0.

Conflicts of Interest

The authors declare no conflict of interest. The funders had no role in the design of the study; in the collection, analyses, or interpretation of data; in the writing of the manuscript; or in the decision to publish the results.

Abbreviations

The following abbreviations are used in this manuscript:
SWHSignificant wave height
GLWUv2The NOAA’s Great Lakes Waves-Unstructured Forecast System version 2.0
WW3WAVEWATCHIII®
ICESat-2The Ice, Cloud, and Land Elevation Satellite-2
RMSERoot-mean-square error
NDBCNational Data Buoy Center
NDFDNational Digital Forecast Database
HWEHigh wave events

Appendix A

Table A1. Basic information of regular buoys used in this study.
Buoy IDLatitudeLongitudeTime Interval/minWater Depth/mObservation #LakeSource
4502746.860−91.93010526SuperiorNDBC
4502846.814−91.82910492SuperiorNDBC
4500647.335−89.79360194.515SuperiorNDBC
4502347.270−88.6075257SuperiorNDBC
4502546.969−88.3985288SuperiorNDBC
4500148.061−87.7936024713SuperiorNDBC
4518048.034−87.7303023910SuperiorNDBC
4500447.585−86.58560237.515SuperiorNDBC
C4513648.535−86.953607SuperiorNDBC
C4515446.050−82.640607HuronNDBC
C4513745.545−81.015603HuronNDBC
C4514344.940−80.627607HuronNDBC
4500345.351−82.8406013512HuronNDBC
4516244.988−83.27020206HuronNDBC
4500844.283−82.4166054.39HuronNDBC
4516343.985−83.5962012.512HuronNDBC
C4514943.542−82.075607HuronNDBC
4520943.129−82.39110142HuronNDBC
4517545.825−84.772512MichiganNDBC
4519445.804−84.7923019.812MichiganNDBC
4501444.795−87.75930135MichiganNDBC
4501343.100−87.85030208MichiganNDBC
4519942.703−87.649600.55MichiganNDBC
4518742.491−87.779108MichiganNDBC
4518642.368−87.795109MichiganNDBC
4517442.135−87.655109MichiganNDBC
4519841.892−87.5631098MichiganNDBC
4517041.755−86.968101910MichiganNDBC
4502641.982−86.6191020.710MichiganNDBC
4516842.397−86.3311020.410MichiganNDBC
4502942.900−86.272102710MichiganNDBC
4516143.182−86.3602022.56MichiganNDBC
4502443.981−86.55610246MichiganNDBC
4518344.982−85.831307MichiganNDBC
4502245.405−85.08710366MichiganNDBC
4500245.344−86.41160181.411MichiganNDBC
4500742.674−87.02660159.115MichiganNDBC
C4513242.463−81.215609ErieNDBC
4516541.702−83.26110810ErieNDBC
4520241.532−82.941104.92ErieNDBC
4520141.601−82.781107.61ErieNDBC
4520341.393−82.512103ErieNDBC
4500541.677−82.398609.812ErieNDBC
4520441.508−82.115102ErieNDBC
4519641.521−81.880109ErieNDBC
4517641.550−81.7656016.611ErieNDBC
4520541.501−81.748103ErieNDBC
4520641.585−81.583103ErieNDBC
4519741.619−81.6171010ErieNDBC
4516441.748−81.6986022.616ErieNDBC
4520741.762−81.331103ErieNDBC
4520841.934−80.747104ErieNDBC
4516742.185−80.135202ErieNDBC
C4514242.740−79.290606ErieNDBC
C4513943.250−79.530606OntarioNDBC
C45159-NWLakeOntario43.770−78.980608OntarioNDBC
4501243.621−77.40160143.314OntarioNDBC
C45135-PrinceEdwardPoint43.785−76.8686011OntarioNDBC
SPOT-181047.914−89.339302SuperiorSeagull
SPOT-059247.207−88.162306SuperiorSeagull
SPOT-070047.477−87.870307SuperiorSeagull
SPOT-181447.192−87.226304SuperiorSeagull
SPOT-181646.642−87.453305SuperiorSeagull
SPOT-136046.598−87.372305SuperiorSeagull
SPOT-136246.570−86.568305SuperiorSeagull
SPOT-117946.560−86.466307SuperiorSeagull
SPOT-136146.696−86.004305SuperiorSeagull
SPOT-141544.346−87.446302MichiganSeagull
SPOT-141243.392−87.804305MichiganSeagull
SPOT-127544.758−86.261303MichiganSeagull
SPOT-198145.045−86.015302MichiganSeagull
SPOT-140744.788−85.624302MichiganSeagull
SPOT-140844.769−85.534302MichiganSeagull
SPOT-108045.921−84.337306HuronSeagull
UWRAEON1-2244.175−81.653205HuronSeagull
SPOT-141341.741−83.136305ErieSeagull
RBS-TOL41.680−83.250603ErieSeagull
UWSS-RAEON2-2141.913−82.736204ErieSeagull
WALNUT42.132−80.270204ErieSeagull
BSC142.560−79.430105ErieSeagull

References

  1. Airgood, B. Lake Michigan Waves Building to 14 Feet Tall Near Shore. Available online: https://www.mlive.com/news/grand-rapids/2017/12/waves_over_10_feet_tall_on_lak.html (accessed on 11 October 2023).
  2. Lewis, C. Huge Waves Hit Lake Michigan’s Eastern Shore, after Lake Superior Waves Set Record in October. Available online: https://www.jsonline.com/story/weather/2017/12/07/huge-waves-hit-lake-michigans-eastern-shore-after-lake-superior-waves-set-record-october/930623001/ (accessed on 11 October 2023).
  3. The WAVEWATCH III Development Group (WW3DG). User Manual and System Documentation of WAVEWATCH III Version 6.07; Tech. Note 333; NOAA/NWS/NCEP/MMAB: College Park, MD, USA, 2019; 465p + Appendices. Available online: https://github.com/NOAA-EMC/WW3/wiki/Manual (accessed on 11 October 2023).
  4. Alves, J.H.; Tolman, H.; Roland, A.; Abdolali, A.; Ardhuin, F.; Mann, G.; Chawla, A.; Smith, J. NOAA’s Great Lakes Wave Prediction System: A Successful Framework for Accelerating the Transition of Innovations to Operations. Bull. Am. Meteorol. Soc. 2023, 104, E837–E850. [Google Scholar] [CrossRef]
  5. Abdolali, A.; Banihashemi, S.; Alves, J.H.; Roland, A.; Hesser, T.J.; Anderson Bryant, M.; McKee Smith, J. Great Lakes wave forecast system on high-resolution unstructured meshes. Geosci. Model Dev. 2024, 17, 1023–1039. [Google Scholar] [CrossRef]
  6. Jasinski, M.F.; Stoll, J.D.; Hancock, D.; Robbins, J.; Nattala, J.; Morison, J.; Jones, B.M.; Ondrusek, M.E.; Pavelsky, T.M.; Parrish, C.; et al. ATLAS/ICESat-2 L3A Along Track Inland Surface Water Data, Version 5, User Guide; NASA National Snow and Ice Data Center Distributed Active Archive Center: Boulder, CO, USA, 2021. [CrossRef]
  7. Tison, C.; Hauser, D. SWIM Products Users Guide: Product Description and Algorithm Theoretical Baseline Description. 2018. Available online: https://www.aviso.altimetry.fr/fileadmin/documents/data/tools/SWIM_ProductUserGuide.pdf (accessed on 11 October 2023).
  8. Peng, Q.; Jin, S. Significant Wave Height Estimation from Space-Borne Cyclone-GNSS Reflectometry. Remote Sens. 2019, 11, 584. [Google Scholar] [CrossRef]
  9. Jasinski, M.; Stoll, J.; Hancock, D.; Robbins, J.; Nattala, J.; Pavelsky, T.; Morrison, J.; Jones, B.; Ondrusek, M.; Parrish, C.; et al. Algorithm Theoretical Basis Document (ATBD) for Along Track Inland Surface Water Data, ATL13, Release 5; Technical Report; NASA Goddard Space Flight Center: Greenbelt, MD, USA, 2021; p. 124. [CrossRef]
  10. Luo, S.; Song, C.; Zhan, P.; Liu, K.; Chen, T.; Li, W.; Ke, L. Refined estimation of lake water level and storage changes on the Tibetan Plateau from ICESat/ICESat-2. Catena 2021, 200, 105177. [Google Scholar] [CrossRef]
  11. Liu, C.; Hu, R.; Wang, Y.; Lin, H.; Zeng, H.; Wu, D.; Liu, Z.; Dai, Y.; Song, X.; Shao, C. Monitoring water level and volume changes of lakes and reservoirs in the Yellow River Basin using ICESat-2 laser altimetry and Google Earth Engine. J. Hydro-Environ. Res. 2022, 44, 53–64. [Google Scholar] [CrossRef]
  12. An, Z.; Chen, P.; Tang, F.; Yang, X.; Wang, R.; Wang, Z. Evaluating the Performance of Seven Ongoing Satellite Altimetry Missions for Measuring Inland Water Levels of the Great Lakes. Sensors 2022, 22, 9718. [Google Scholar] [CrossRef] [PubMed]
  13. Yang, J.; Zhang, J. Validation of Sentinel-3A/3B Satellite Altimetry Wave Heights with Buoy and Jason-3 Data. Sensors 2019, 19, 2914. [Google Scholar] [CrossRef] [PubMed]
  14. Li, B.; Li, J.; Tang, S.; Shi, P.; Chen, W.; Liu, J. Evaluation of CFOSAT Wave Height Data with In Situ Observations in the South China Sea. Remote Sens. 2023, 15, 898. [Google Scholar] [CrossRef]
  15. Durrant, T.H.; Greenslade, D.J.M.; Simmonds, I. Validation of Jason-1 and Envisat Remotely Sensed Wave Heights. J. Atmos. Ocean. Technol. 2009, 26, 123–134. [Google Scholar] [CrossRef]
  16. Hagler, Y. Defining U.S. Megaregions; Technical Report; Regional Plan Association: New York, NY, USA, 2009; Available online: https://rpa.org/work/reports/defining-u-s-megaregions (accessed on 11 October 2023).
  17. Raghukumar, K.; Chang, G.; Spada, F.; Jones, C.; Janssen, T.; Gans, A. Performance Characteristics of “Spotter,” a Newly Developed Real-Time Wave Measurement Buoy. J. Atmos. Ocean. Technol. 2019, 36, 1127–1141. [Google Scholar] [CrossRef]
  18. Kodaira, T.; Waseda, T.; Nose, T.; Sato, K.; Inoue, J.; Voermans, J.; Babanin, A. Observation of on-ice wind waves under grease ice in the western Arctic Ocean. Arct. Chall. Sustain. Proj. (ArCS) 2021, 27, 100567. [Google Scholar] [CrossRef]
  19. Lancaster, O.; Cossu, R.; Boulay, S.; Hunter, S.; Baldock, T.E. Comparative Wave Measurements at a Wave Energy Site with a Recently Developed Low-Cost Wave Buoy (Spotter), ADCP, and Pressure Loggers. J. Atmos. Ocean. Technol. 2021, 38, 1019–1033. [Google Scholar] [CrossRef]
  20. Ashtine, M.; Bello, R.; Higuchi, K. Assessment of wind energy potential over Ontario and Great Lakes using the NARR data: 1980–2012. Renew. Sustain. Energy Rev. 2016, 56, 272–282. [Google Scholar] [CrossRef]
  21. Hicks, B.B. Wind profile relationships from the ‘wangara’ experiment. Q. J. R. Meteorol. Soc. 1976, 102, 535–551. [Google Scholar] [CrossRef]
Figure 1. The locations of the regular buoys in the Great Lakes, and the trajectory of the drifting Spotter buoy in Lake Michigan during 10–18 February 2022 (zoomed in image on the left).
Remotesensing 16 00679 g001
Figure 2. The ICESat-2 ATL13 significant wave height (SWH) measurements compared with regular buoy observations on 8 example days.
Remotesensing 16 00679 g002
Figure 3. The significant wave height comparisons between ICESat-2 measurements and buoy observations. (a) All matched data pairs. The statistical parameters are listed in Table 2. (b) Matched data pairs in high wave events (SWH > 0.8 m). The statistical parameters are listed in Table 3.
Remotesensing 16 00679 g003
Figure 4. The GLWUv2 significant wave height retrospective forecast in comparison with ICESat-2 significant wave height measurements for two low wave scenarios (a) Lake Huron and Lake Erie on 22 January 2022, (b) Lake Ontario on 1 February 2022, and two high wave scenarios (c) Lake Huron on 23 January 2022, (d) Lake Huron on 27 February 2022. Dark red (invalid values) at the edge of the gray area (ice coverage) has no meaning and was removed from the comparison.
Remotesensing 16 00679 g004
Figure 5. The significant wave height comparisons between GLWUv2’s retrospective predictions and ICESat-2 measurements in winter (January and February 2022). The color gradient indicates that most of the data points gather at low wave height.
Remotesensing 16 00679 g005
Figure 6. Trajectory of the drifting Spotter buoy (red) from 10 to 18 February 2022 in Lake Michigan, as well as the locations where ICESat-2 (dark blue) took measurements on 20 February 2022. The latter is the next available ICESat-2 track following the period of Spotter buoy deployment in Lake Michigan. The locations of the meteorological observation stations are denoted as yellow stars.
Remotesensing 16 00679 g006
Figure 7. (a) Significant wave height prediction of GLWUv2 compared to the Spotter buoy observations during 10–18 February 2022 in Lake Michigan. (b) Significant wave height prediction of GLWUv2 compared to ICESat-2 measurements on 20 February 2022 in Lake Michigan.
Remotesensing 16 00679 g007
Figure 8. Wind speed forcing data for GLWUv2 (NDFD) compared to wind speed records from (a) the Spotter buoy, (b) the meteorological observation station LDTM4, (c) station HLNM4, (d) station MKGM4, (e) station SVNM4, and (f) station MLWW3 during 10–18 February 2022 in Lake Michigan. The locations of the stations are shown in Figure 6.
Remotesensing 16 00679 g008
Table 1. Beams we chose during different periods and their corresponding ICESat-2 orientation.
PeriodOrientationBeam Used
1 April 2021–1 October 2021ForwardGT1R
2 October 2021–7 June 2022BackwardGT3L
9 June 2022–11 October 2022ForwardGT1R
Table 2. Accuracy analysis of ICESat-2 SWH measurements versus buoy SWH observations using all matched data pairs.
GroupBiasRMSESIrn
All data0.074 m0.191 m0.460.890554
0–9.2 km0.077 m0.188 m0.470.888186
9.2–16.7 km0.063 m0.198 m0.480.898184
16.7–25.0 km0.082 m0.186 m0.440.888184
Table 3. Accuracy analysis of ICESat-2 SWH measurements versus buoy SWH observations using matched data pairs in high wave events (HWE).
GroupBiasRMSESIrn
All data (HWE)−0.077 m0.340 m0.260.71661
0–8.5 km (HWE)−0.104 m0.299 m0.230.67720
8.5–18 km (HWE)−0.150 m0.395 m0.280.78121
18–25 km (HWE)0.028 m0.315 m0.260.65420
Table 4. Accuracy analysis of GLWUv2 SWH retrospective predictions at different ranges of ICESat-2 SWH.
GroupBiasRMSESIrn
All data0.058 m0.312 m0.800.86553,472
0–0.8 m0.033 m0.257 m1.060.53646,446
0.8–1.5 m0.107 m0.329 m0.300.6045045
>1.5 m0.511 m0.899 m0.450.4511981
Disclaimer/Publisher’s Note: The statements, opinions and data contained in all publications are solely those of the individual author(s) and contributor(s) and not of MDPI and/or the editor(s). MDPI and/or the editor(s) disclaim responsibility for any injury to people or property resulting from any ideas, methods, instructions or products referred to in the content.

