
PU-CTG: A Point Cloud Upsampling Network Using Transformer Fusion and GRU Correction

1
Fujian Institute of Research on the Structure of Matter, Chinese Academy of Sciences, Fuzhou 350117, China
2
School of Computer and Cyberspace Security, Fujian Normal University, Fuzhou 350117, China
3
Quanzhou Institute of Equipment Manufacturing Haixi Institutes, Chinese Academy of Sciences, Quanzhou 362216, China
4
University of Chinese Academy of Sciences, Beijing 100049, China
5
School of Geospatial Information, Information Engineering University, Zhengzhou 450052, China
*
Author to whom correspondence should be addressed.
†
These authors contributed equally to this work.
Remote Sens. 2024, 16(3), 450; https://doi.org/10.3390/rs16030450
Submission received: 6 November 2023
/
Revised: 14 January 2024
/
Accepted: 19 January 2024
/
Published: 24 January 2024
(This article belongs to the Section AI Remote Sensing)
Abstract
:Point clouds are widely used in remote sensing applications, e.g., 3D object classification, semantic segmentation, and building reconstruction. Generating dense and uniformly distributed point clouds from low-density ones is beneficial to 3D point cloud applications. The traditional methods mainly focus on the global shape of 3D point clouds, thus ignoring detailed representations. The enhancement of detailed features is conducive to generating dense and uniform point clouds. In this paper, we propose a point cloud upsampling network to improve the detail construction ability, named PU-CTG. The proposed method is implemented by a cross-transformer-fused module and a GRU-corrected module. The aim of the cross-transformer module is to enable the interaction and effective fusion between different scales of features so that the network can capture finer features. The purpose of the gated recurrent unit (GRU) is to reconstruct fine-grained features by rectifying the feedback error. The experimental results demonstrate the effectiveness of our method. Furthermore, the ModelNet40 dataset is upsampled by PU-CTG, and the classification experiment is applied to PointNet to verify the promotion ability of this network.
1. Introduction
Point clouds are used extensively in remote sensing fields such as classification [1,2], building reconstruction [3,4,5,6], and autonomous driving [7,8]. In recent years, thanks to the development of deep neural networks, the research on point clouds has been greatly accelerated. However, in view of the limitations of the real world, such as occlusion, construction complexity, and distances in the scanning process, point clouds are often sparse and nonuniform. Such situations pose huge challenges during point cloud applications [9]. The upsampling technique contributes to the establishment of high-resolution data, which can improve the performance of point clouds in downstream tasks.
For a sparse and inhomogeneous point cloud, the task of upsampling is to input a sparse point cloud and output a dense one, while the basic shape, uniformity, and other characteristics of the point cloud need to be maintained. Since PointNet [10] pioneered the direct extraction of features from disordered points, deep learning-based architectures have been widely employed in the 3D vision domain. The success of several follow-up works [11,12,13,14,15] has shown the enormous potential of this method. Based on the architecture of PointNet++ [16], PU-Net [17] concatenated features of different scales in a weighted manner at the patch level and then used the convolutional layer for feature expansion. Subsequently, MPU [18] used a progressive upsampling approach, repeating three upsampling stages to gradually refine the coarse point cloud. PU-GAN [19] introduced generative adversarial networks as a framework to ensure the uniformity of the point cloud as much as possible. However, these methods still give priority to maintaining the integrity of the overall shape and have limitations in detail-building.
In this paper, to improve the ability of detail construction in the upsampling process, we present the point cloud upsampling network PU-CTG, which is based on a generative adversarial architecture. The method we propose produces dense point clouds through the generator and ensures the fidelity of outputs by the discriminator. For the generator, first of all, we design a multiscale feature extraction and fusion (MEF) unit based on a cross-transformer module to integrate the multiscale features that were extracted in a progressive manner so that the minutiae can be better captured. Then, to increase the diversity of the generated points, the number of features is extended by combining the hierarchical upsampling unit with the folding operation [20]. Finally, we use the gated recurrent unit (GRU) [21] to correct the point features during feature expansion. GRU can filter out repetitive and useless information, making the development of fine-grained features more accurate. On the other hand, the discriminator works as a classification model, which supervises the generator to learn the real distribution of the model by distinguishing the ground truth from the generated point clouds.
To verify the capability of PU-CTG, we perform experiments on the PU-GAN dataset and PU1K dataset [22] for quantitative and qualitative evaluation. Furthermore, our method is also tested on real scanned data from the KITTI dataset [23] and the TUM-MLS-2016 dataset [24]. We use the recently studied density-aware Chamfer distance (DCD) [25] as one of the loss functions to constrain the network training. Compared to the Chamfer distance and the earth mover’s distance, it is more efficient in calculation. Moreover, more attention is given to the overall structure and local details. We compare PU-CTG with state-of-the-art methods and perform a series of ablation experiments to assess the effectiveness of each module. In general, our contribution can be summarized as follows:
- We propose a multiscale feature extraction and fusion (MEF) unit based on a cross-transformer module containing an attention mechanism and position encoding. The features at different scales are input simultaneously for effective integration so that the detailed information can be further captured.
- We introduce a gated recurrent network (GRU) with error correction for the expanded features. This can keep critical information in the calibration to promote the formation of fine-grained features.
- We design the up-feature operation, which employs a simple hierarchical upsampling and folding operation [20] to increase the number of points. The operation seeks to enhance the diversity of generated points.
- The proposed method is evaluated on benchmark datasets, and the experimental results show the effectiveness of our method. Finally, we demonstrate the assistance of upsampling in point cloud classification.
The remainder of this article is organized as follows: Section 2 reviews previous related work. Section 3 describes the proposed method in detail, and Section 4 shows the upsampling results on different datasets and discusses the limits of the proposed method. Finally, Section 5 summarizes the paper.
2. Related Work
In this section, research on point cloud upsampling can be divided into two main categories: traditional methods based on optimization and methods based on deep learning.
2.1. Optimization-Based Point Cloud Upsampling
Early research works focused on optimization methods using a priori knowledge. Ref. [26] firstly assumed that the surface of the point cloud is smooth. Based on this assumption, the upsampling points are obtained through Voronoi diagrams. Taking the noise and outliers contained in the set of input points into account, ref. [27] introduced the locally optimal projection operator (LOP) and the L1 norm, which is fault-tolerant. These methods show good upsampling performance on 3D objects with smooth surfaces but perform poorly on complex shapes or sharp edges because of their assumption that the surface of the point cloud is smooth. Ref. [28] focused on the noise and non-uniformities of the point cloud and proposed a weighted locally optimal projection (WLOP) with iterative normal estimation to adjust the coordinates of the output point cloud. The effect of this method is affected by the calculation of normal vectors and is subject to a certain degree of randomness due to the parameter settings such as the density parameter and the angle threshold in the experiment. Based on previous work, ref. [29] further investigated a progressive method for upsampling based on edge perception. On this basis, ref. [30] proposed a novel formulation based on the density of the original input points, accelerated by an improved weighting operator for WLOP. Subsequently, ref. [31] introduced the concept of deep points as a new point cloud representation to fill in the missing parts by jointly optimizing both ends of the deep points.
Overall, optimization-based traditional methods mainly achieve upsampling by designing a priori conditions and iteratively optimizing the generated points. Although these methods have achieved some results, they all rely heavily on the design of a priori conditions and lack the ability to autonomously extract a priori knowledge from data.
2.2. Learning-Based Point Cloud Upsampling
As deep learning approaches show great potential in 3D vision, researchers are beginning to work on designing end-to-end deep learning networks that autonomously extract information from data to achieve upsampling.
The earliest work using deep learning methods focused on 3D reconstruction from 2D images. Ref. [32] accomplished the process of 3D reconstruction from a single image by designing a conditional shape sampler that predicts multiple possible point cloud models based on the input image. However, the parameters that can be learned in the network are linearly related to the number of generated points, which does not scale well. It is difficult to deal with a large number of points based only on the 3D distance metric as an optimization criterion. Later, ref. [33] used 2D convolution operations to shape the 3D model from multiple perspectives and utilized pseudo-rendered depth images in conjunction with 2D projections to capture correlations between the generated point clouds for upsampling in a more computationally convenient manner. Subsequently, ref. [34] represented the 3D shape as a collection of parameterized surface elements. It approximates the target localization by mapping a set of squares to a surface in 3D space, infers the representation of the surface, and completes the reconstruction from the image to the 3D model. However, these methods focus on reconstruction starting from 2D images and are not upsampled with point cloud data as input. Many times the acquired point cloud data do not correspond to the 2D image.
For point cloud data, Pu-Net [17] gradually extracts the multi-resolution information in the hierarchy based on the PointNet++ [16] architecture and learns the local and global features of the point cloud. It has been a pioneer in deep learning networks for point cloud upsampling using only point cloud data as input, laying out the way in which subsequent upsampling networks are trained based on Patch block data. In contrast, ref. [35] later designed an upsampling network based on PointNet’s [10] point generation model, but in which the whole model is used as the network input for training. Compared to the method of processing data into patch blocks, using the whole model as input can only be applied to low-resolution models and is not suitable for high-resolution models with many points. As the first attempt to upsample point cloud data using a deep learning network, Pu-Net accomplished the task of upsampling from sparse to dense point clouds. However, the generated point cloud model is too coarse, and the edges of the model cannot be detected during the upsampling process, resulting in objects with unsmooth corners that are prone to irregular undulations. To address these problems, in a follow-up work, they designed EC-Net [36], an upsampling network for edge perception, which is improved by formulating an edge joint loss function that minimizes the distance from the point to the edge. However, it is clear that this approach requires rather expensive edge annotations for training. The training time also tends to be too long. Thus, the method is not applicable to large data.
Immediately after, inspired by the multi-step approach [37] in the image neural network super-resolution technique [38], ref. [18] designed a progressive upsampling network MPU. With the same patch block database, the MPU subdivides an upsampling network into multiple sub-networks. Compared to Pu-Net, MPU focuses on the detailed part of the model. However, this progressive approach consisting of multiple sub-networks suffers from low efficiency due to the complexity of the training process. Subsequently, ref. [19] proposed a new upsampling framework, PU-GAN, which for the first time applied generative adversarial networks to point cloud upsampling to make predictions from a global perspective with an adversarial learning strategy. Unlike traditional convolutional neural networks (CNNs), generative adversarial networks (GANs) are able to motivate generators to produce higher quality samples by training generators and discriminators against each other [39]. Although PU-GAN has been greatly improved compared to previous works, the ability to construct detailed parts is still limited, and it is still easy to generate noise at boundaries. There are also upsampling networks that employ other ideas for implementation. For example, PUGeo-Net [40] introduced normals as an additional supervision for the network and upsampling by learning the first and second fundamental forms of local geometry. PMP-Net++ [41] is further applied to the upsampling task by performing point cloud complementation based on the new strategy of shifting the points to capture the topological relationship between incomplete and complete point clouds. Today’s point cloud upsampling networks are data-driven, and most of them achieve far better results than traditional methods. However, due to the prioritization of homogeneity and holism, these networks are still limited in their ability to build detail and still generate a lot of noise at the seams or boundaries of the model.
3. Overall Architecture of PU-CTG
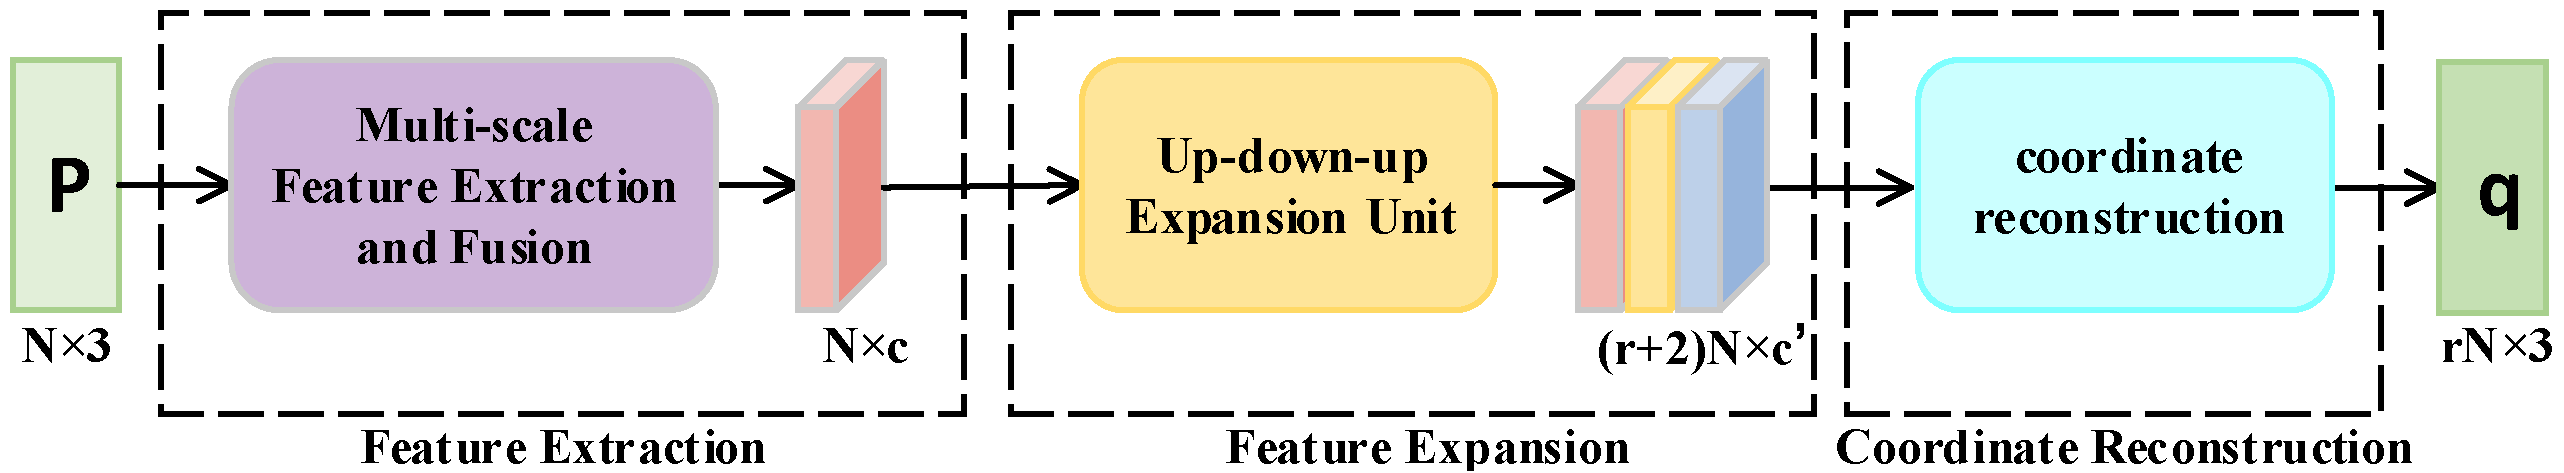
The PU-CTG is based on the GAN architecture. The target of the generator is to produce dense outputs from sparse inputs by upsampling with discriminator constraints. As shown in Figure 1, our generator follows the rules of feature extraction, feature expansion, and coordinate reconstruction to process the input point clouds. For low-resolution input point clouds, the purpose of the feature extraction component is to extract high-dimensional features from them. Then, the feature expansion enlarges the number of points to extend the extracted features. As the last stage, coordinate reconstruction regresses 3D coordinates from the expanded features to construct high-resolution point clouds.
Specifically, first, the feature extraction unit extracts features at different scales from the input point cloud in a progressive manner. Inspired by MPU [18], we designed the multiscale feature extraction and fusion (MEF) unit based on a cross-transformer to integrate features across different layers. After that, the feature expansion aims to dilate the extracted features of to , where N represents the number of input points, and c and represent the number of feature channels at different stages. During this process, the gated recurrent unit (GRU) will correct the expanded feature according to the feedback error. In addition, a feature expansion operation incorporating a simple hierarchical upsampling and folding operation will improve the generated point diversity. Finally, we exploit MLPs to obtain the coordinates of the new point clouds. In fact, we create the features of during expansion and keep the further points using Farthest Point Sampling after MLPs in the coordinate reconstruction to improve the uniformity. The above modules will be illustrated in Section 3.1 and Section 3.2.
3.1. Multiscale Feature Extraction and Fusion (MEF) Unit
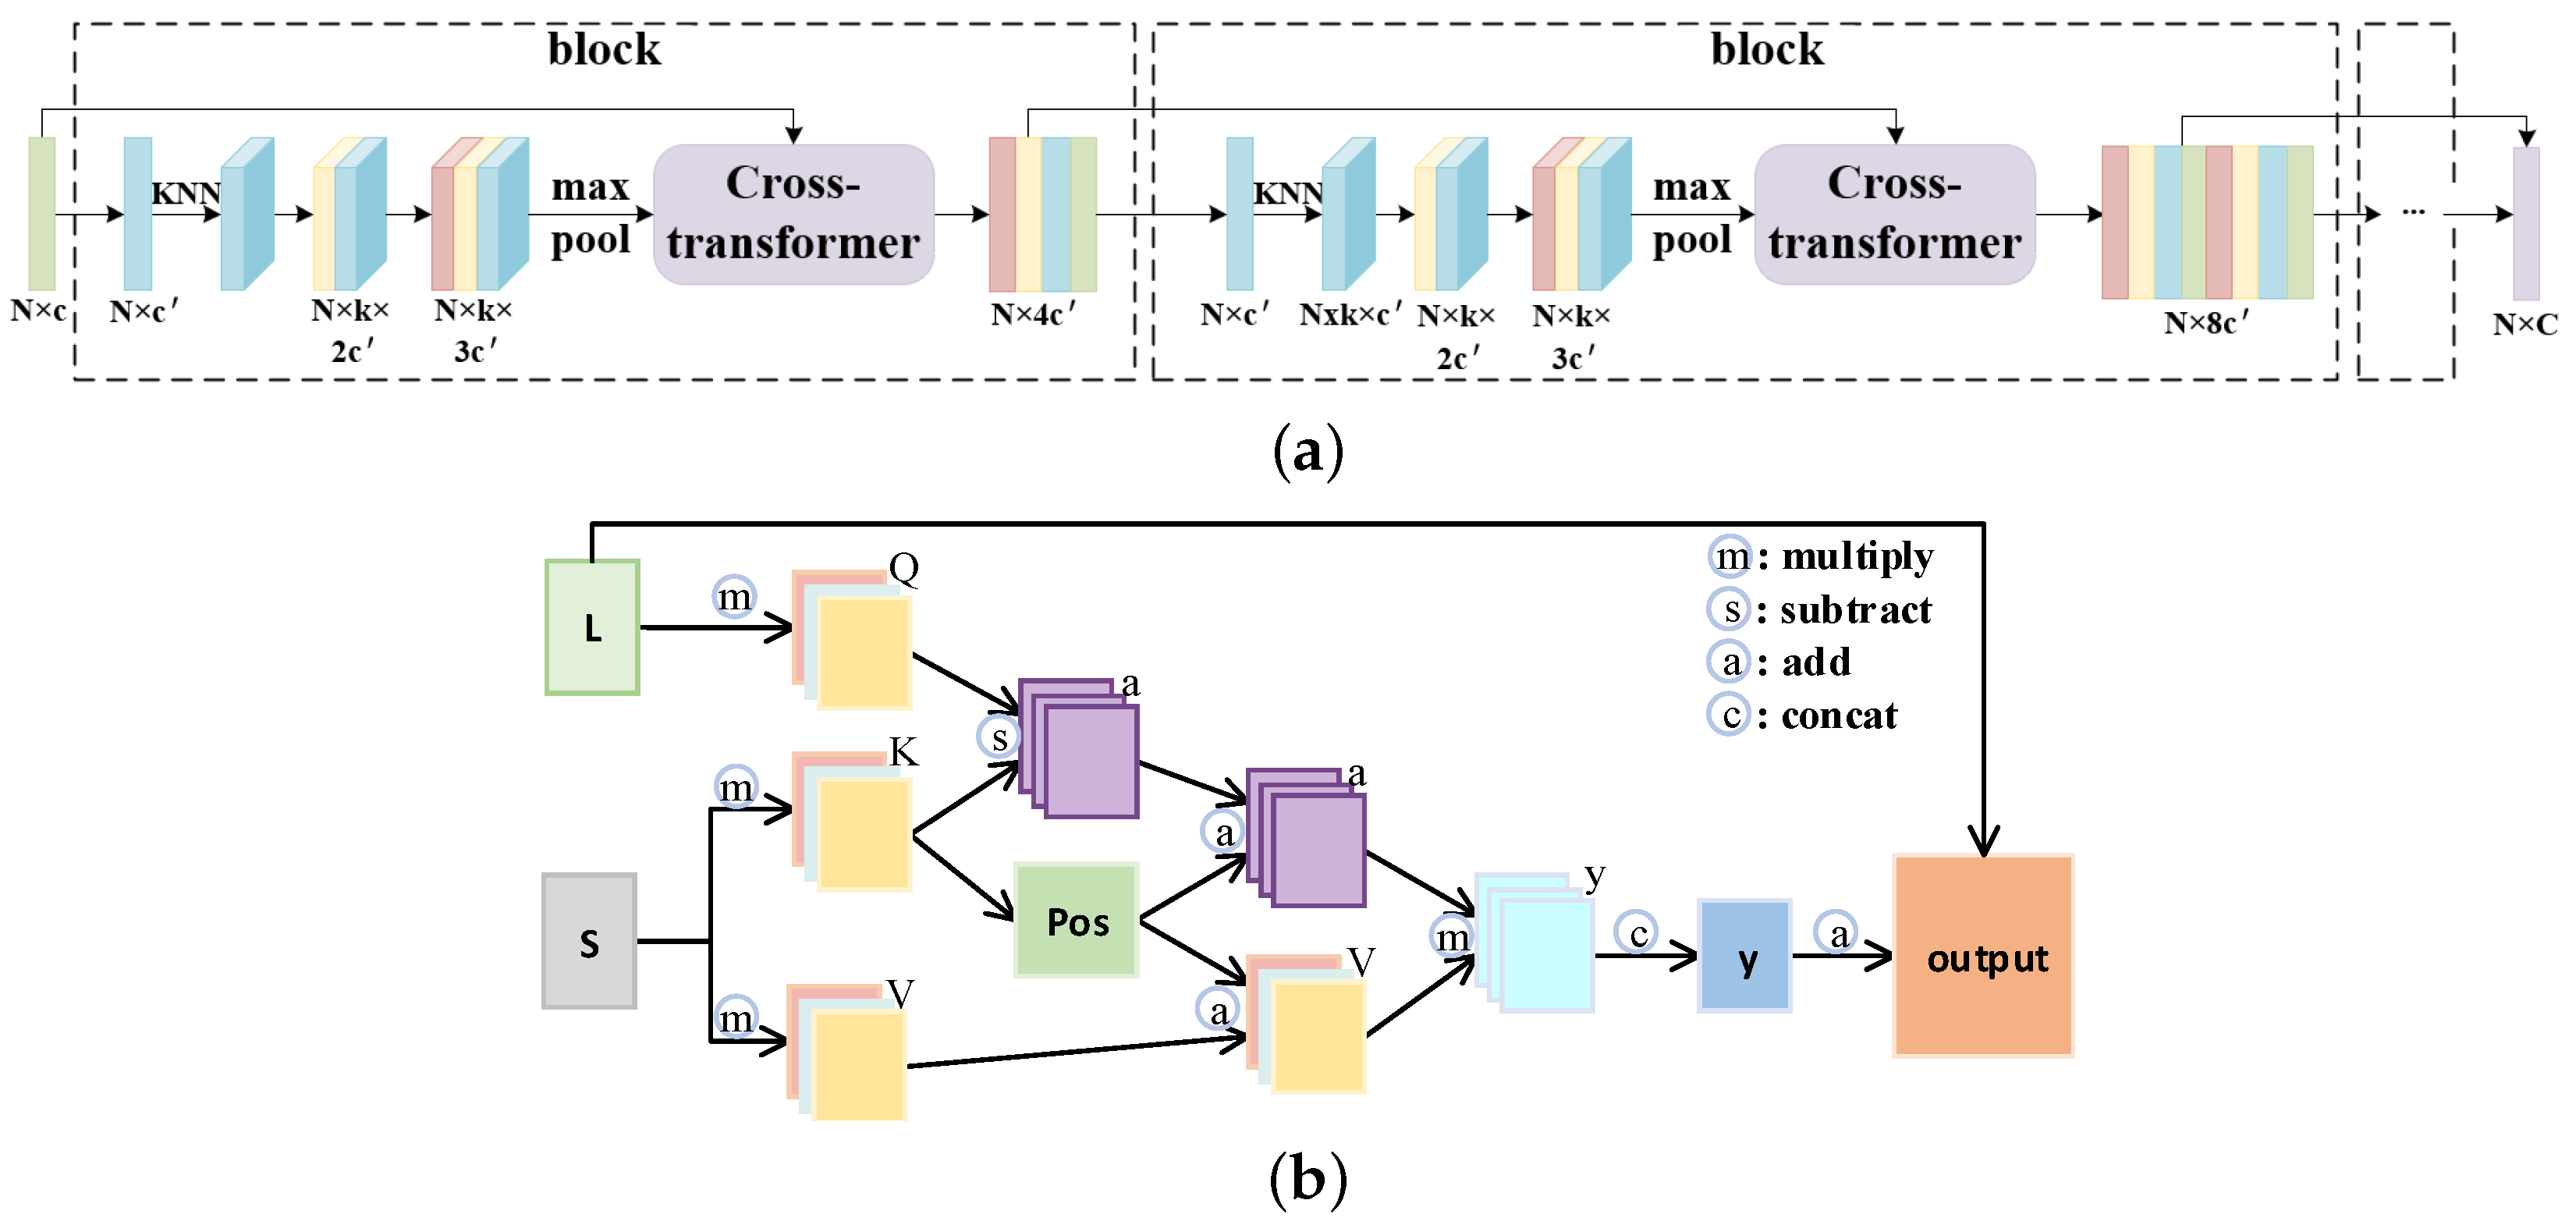
To extract features, MPU [18] constructs an architecture composed of a sequence of dense blocks. They compute the local neighborhood dynamically by the k-nearest neighbors (KNN) based on feature similarity and extract features from it in each block. As the receptive field changes in blocks of different densities, the extracted features are multiscale. Effective feature fusion is the key for learning information from multiscale features. Thus, we build the multiscale feature extraction and fusion (MEF) unit. In MEF, a cross-transformer is designed to connect the different blocks. An illustration of MEF is shown in Figure 2. Specifically, the principle of the cross-transformer mechanism is shown in Figure 2b. First, the features of two blocks at different scales are used as the two input two-dimensional feature matrices. Then, the large-scale feature is adopted to initialize the query matrix q, while the small-scale feature is used to initialize the key matrix k and value matrix v:
where , and are trainable matrices, is a projection function to align feature channels, and and are the feature matrices of large-scale blocks and small-scale blocks, respectively. Moreover, we use multiple heads to focus on the information of different subspaces and enhance the expressiveness of the model. By using the multi-head attention mechanism, each head can solve for a set of q, k, and v matrices. These matrices are then individually concatenated to obtain the matrices Q, K, and V. Following the practice of Point Transformer [42,43], we use subtraction instead of dot multiplication for the interaction between Q and K. Therefore, the attention score y is calculated according to the scaled dot-product attention:
where is the position encoding, which guides the network to capture the spatial relationships between different local features, and is the scaling factor. Similarly, following the experiment of [42], is calculated according to the coordinates of every two points and from the input:
Finally, the output t of the cross-transformer is defined as follows:
where and are the projection and back-projection functions for dimension alignment. Through the cross-transformer, the features of blocks at different scales are effectively fused. Then, the correlation between one another is fully utilized so that the output features can contain richer semantic information.
3.2. Up-Down-Up Expansion Unit
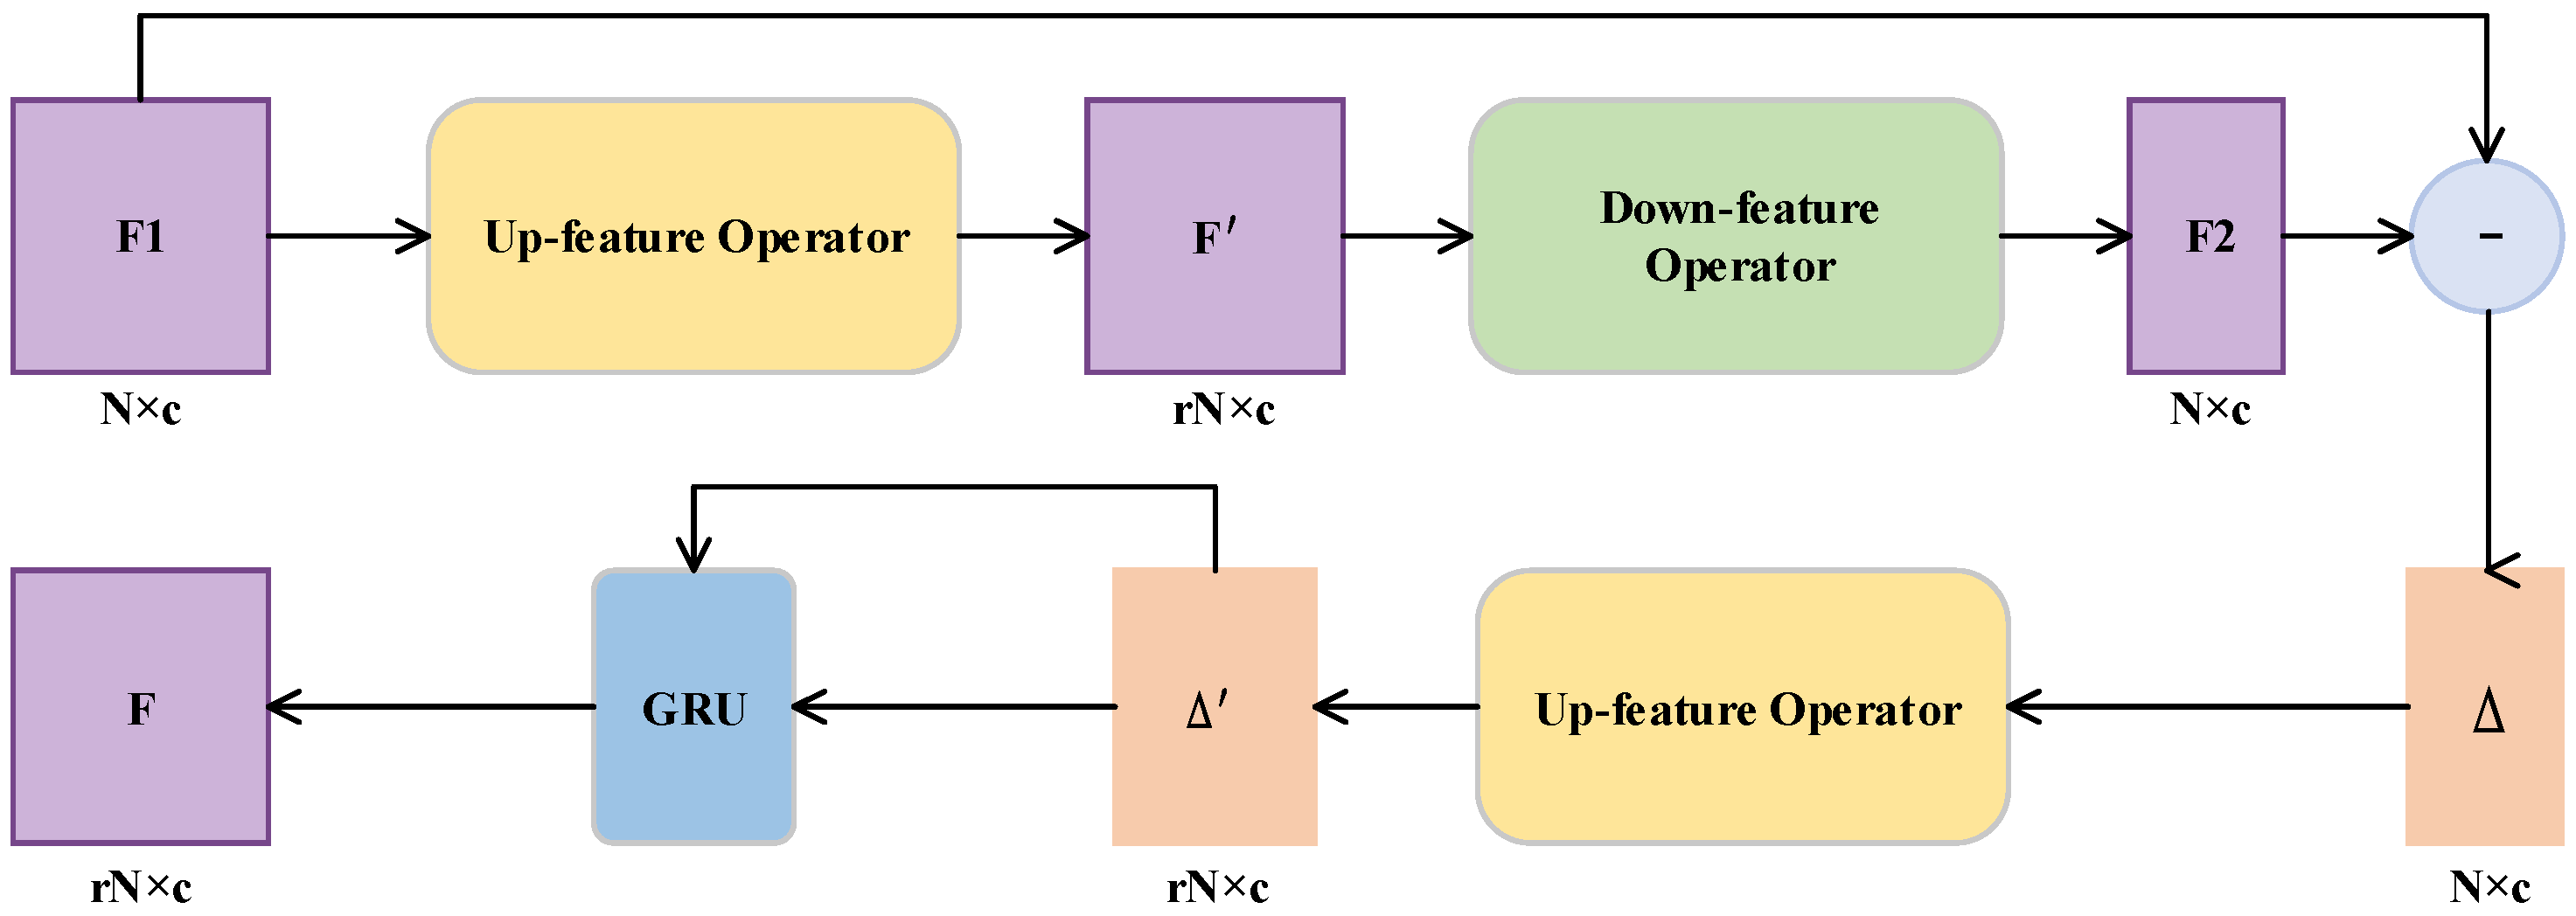
For the expansion of point features, PU-GAN constructed an up-down-up expansion unit, including two up-feature operators and one down-feature operator. The overall process is shown in Figure 3. Based on this strategy, we propose constructing up-feature operators by combining hierarchical upsampling and folding operations, which enhance the diversity of points. Significantly, we introduce the gated recurrent unit (GRU) after the second up-feature operator to correct the feedback error more precisely.
3.2.1. Up-Feature Operator
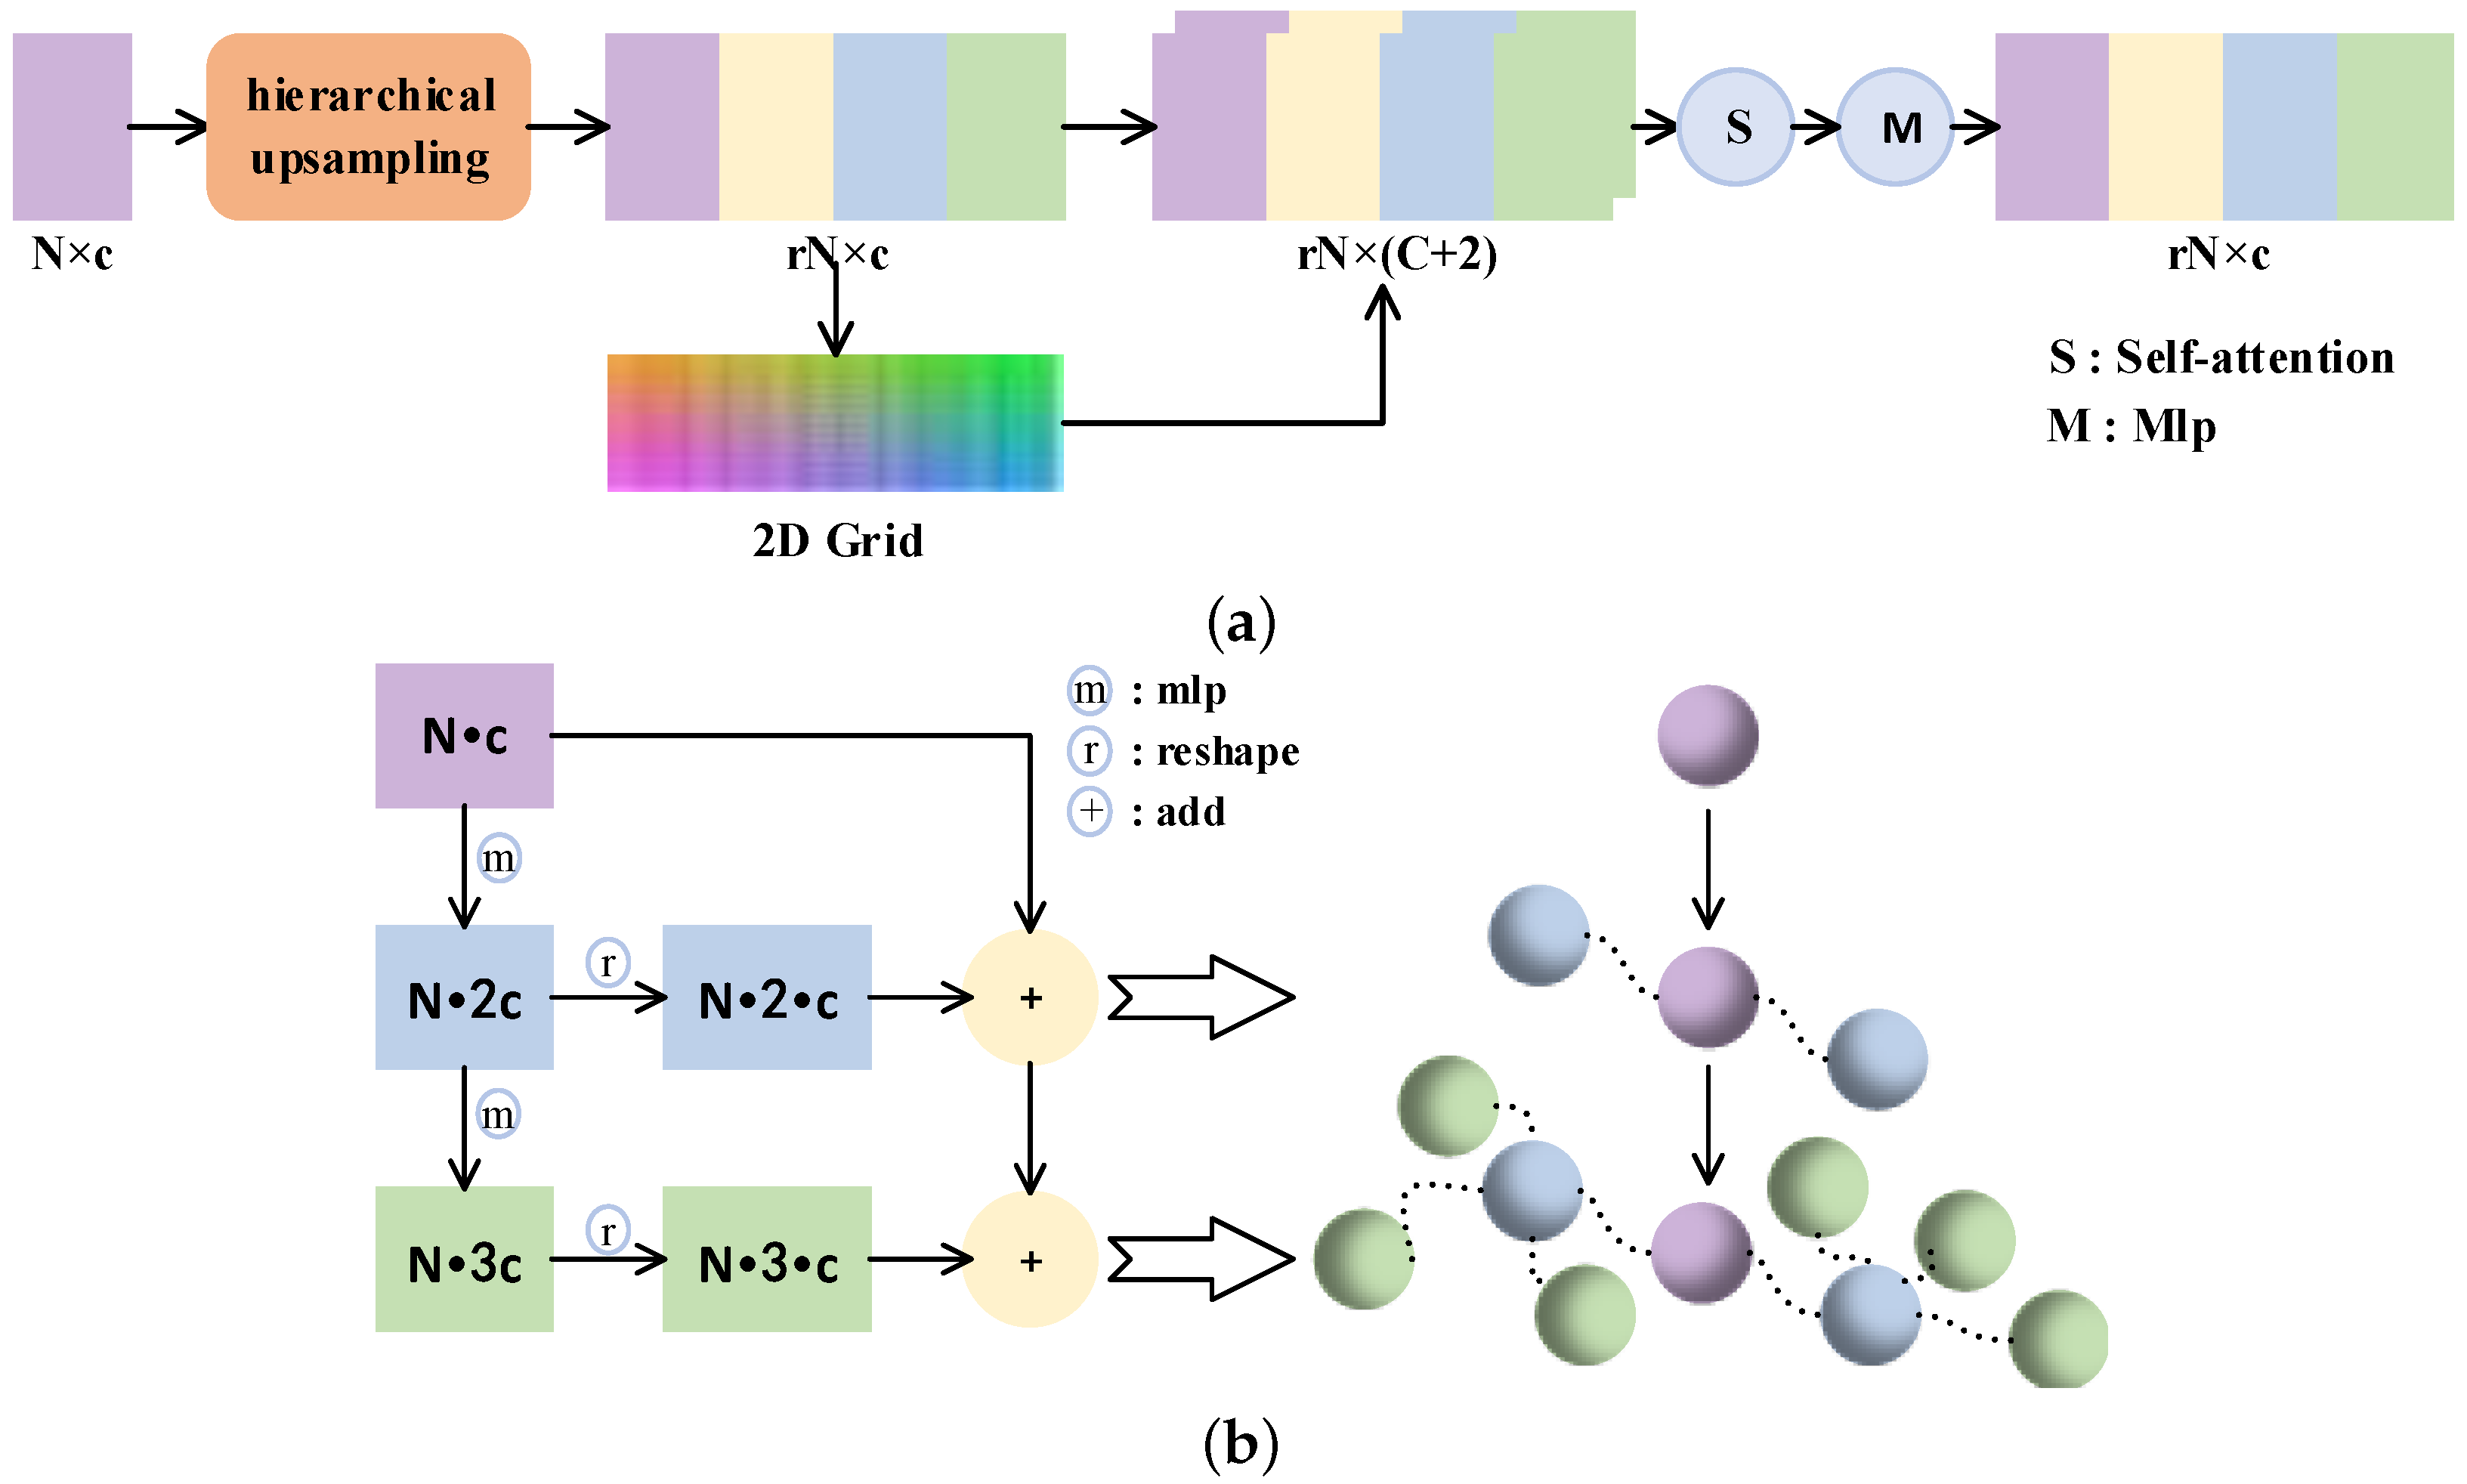
To upsample the point features r times, we build the up-feature operation by first hierarchical upsampling and then folding. As shown in Figure 4b, hierarchical upsampling is divided into two steps. The first stage is the top-down feature expansion part. For the input feature matrix, two feature matrices and are obtained through MLPs. The next is fusion, where and are added to the original features after deformation. By means of hierarchical upsampling, the input features are propagated from general geometry information to detail points, which further promotes the generation of fine-grained features.
After that, we take the 2D grid mechanism in [20], where the upsampled features are appended to the 2D vector to increase the variations again. Finally, the features are integrated by self-attention, and then the output is generated by a set of MLPs.
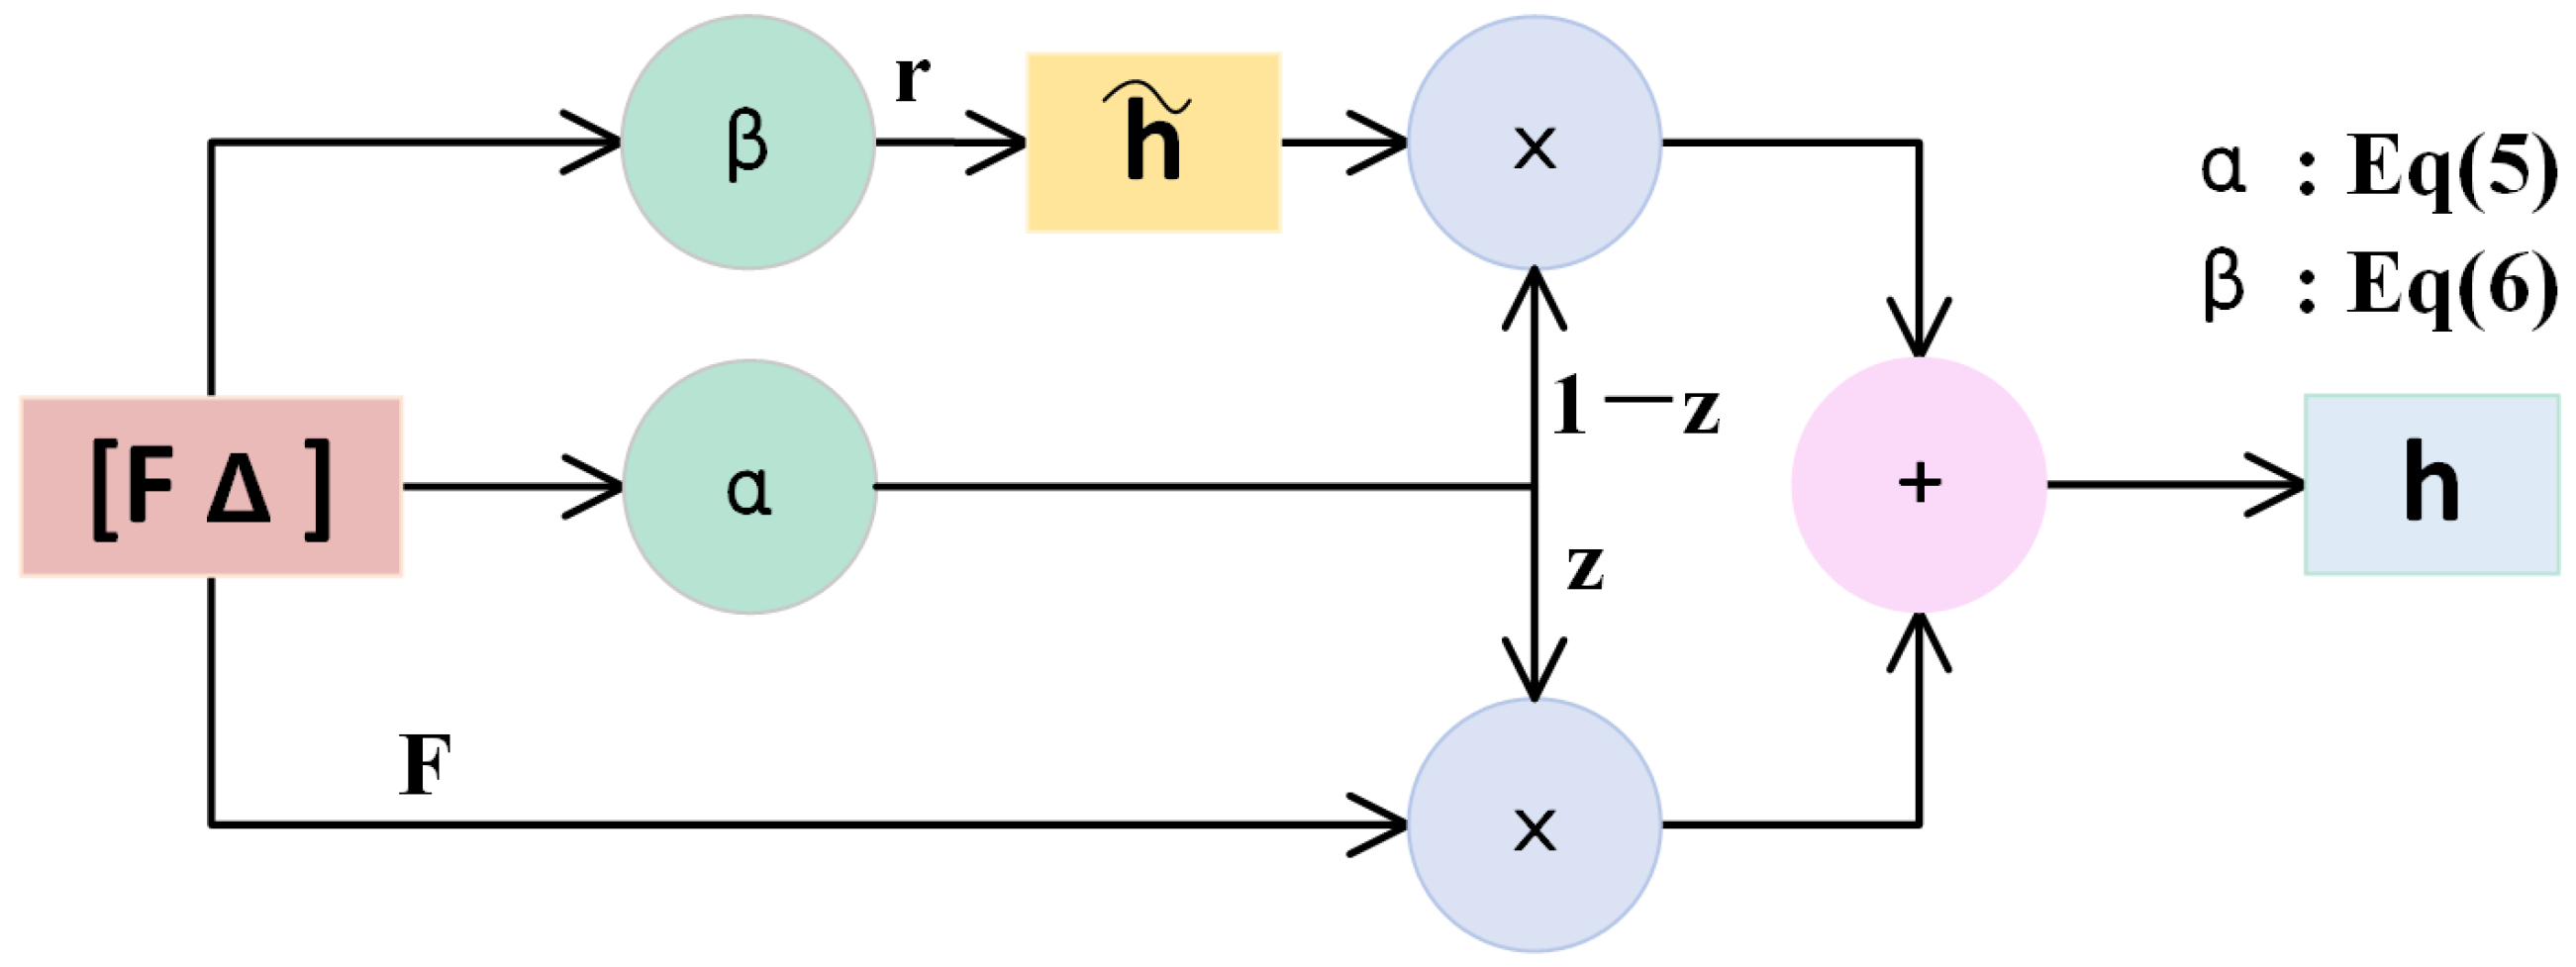
3.2.2. Gated Recurrent Unit (GRU)
In Figure 3, the difference upsampled should be selectively memorized or forgotten for the result of the first upsampling , since this strategy, as shown in Figure 5, mimics the gated recurrent unit’s (GRU) choosing to remember or forget information. By calculating the update gate z and the reset gate r, the features are further corrected. The standard GRU takes the features in different time series as input. Instead, we treat and the difference as our inputs so that the update gate z and the reset gate r are calculated as follows:
where and are trainable matrices, and are the bias vectors, is the sigmoid activation layer, and : is the concatenation between two feature matrices. Therefore, the output h is defined as:
where contains the preserved information from the difference by the reset gate r, and ⊙ represents the Hadamard product. The calculation of can be formulated as:
where is the ReLU activation layer. By updating gate z and resetting gate r, repeated and useless features can be filtered out, and useful features can be retained. Such a strategy can more accurately correct the feature and improve the quality of fine-grained features compared with addition, and we take the corrected feature h as the final upsampling feature F.
4. Experimental Results and Discussion
4.1. Experimental Setup and Datasets
We trained the PU-CTG for 120 epochs using the Adam optimizer [44] with the two time-scale update rule (TTUR). The learning rates of the generator and discriminator are set as 0.001 and 0.0001, respectively. After 30,000 iterations, we gradually reduce both rates by a decay rate of 0.7 per 30,000 iterations until . Our network is implemented based on TensorFlow 2.0 and trained on an NVIDIA RTX A6000 GPU with a batch size of 28. The model is evaluated on the PU-GAN dataset [19] and the PU1K dataset [22]. In addition, performance on real scanned data is evaluated on the KITTI [23] and TUM-MLS-2016 datasets [24].
PU-GAN is an earlier point cloud upsampling dataset covering a rich variety of objects, which includes 147 3D meshes from PU-Net [17], MPU [18], and the Visionair repository. Among them, 120 3D meshes are used for training, and the remaining 27 3D meshes are used for testing. PU1K is a new dataset covering 50 categories of objects, containing 1147 3D meshes from ShapeNetCore [45] mostly, where 1020 3D meshes are for training, and the remaining 270 are for testing. Compared to PU-GAN’s dataset, PU1K is more challenging and diverse. The strategy for data preparation is the same as that of PU-GAN [19]. The KITTI dataset contains common real-world objects captured from autonomous driving, and the TUM-MLS-2016 dataset is based on large-scale urban point cloud mapping the TUM campus with an area of approximately 0.2 km2 for the city scene segmentation task.
4.2. Loss Function
In this work, the loss function for PU-CTG consists of GAN loss, reconstruction loss, uniformity loss, and repulsion loss. Since the GAN architecture is used, we consequently introduce the GAN loss. To make the output point cloud uniformly distributed, we introduce the uniformity loss and the repulsion loss. Encouraging the generated points to lie on the target surface and be more realistic, we use the density-aware Chamfer distance (DCD) proposed recently as the reconstruction loss:
where is a hyperparameter, n is the query frequency for pairing between two point sets, x and y are the generated point cloud and ground truth, respectively, and are defined as:
Compared with CD, DCD is a more intensive similarity measure that can detect differences in density distribution. On the other hand, it not only considers the overall structure and local details more comprehensively but also has more computational efficiency than EMD. Otherwise, the other loss function settings are the same as PU-GAN [19]. Finally, our joint loss of generator and discriminator loss are:
where and are the weights of each loss function, which are set as 0.1, 1, 10, and 100.
4.3. Experimental Results and Evaluation
We evaluate PU-CTG by quantitative comparison with three evaluation metrics: (i) point-to-face (P2F) distance using the testing models, (ii) Chamfer distance (CD), and (iii) Hausdorff distance (HD).
4.3.1. Quantitative and Qualitative Results on PU-GAN’s Dataset
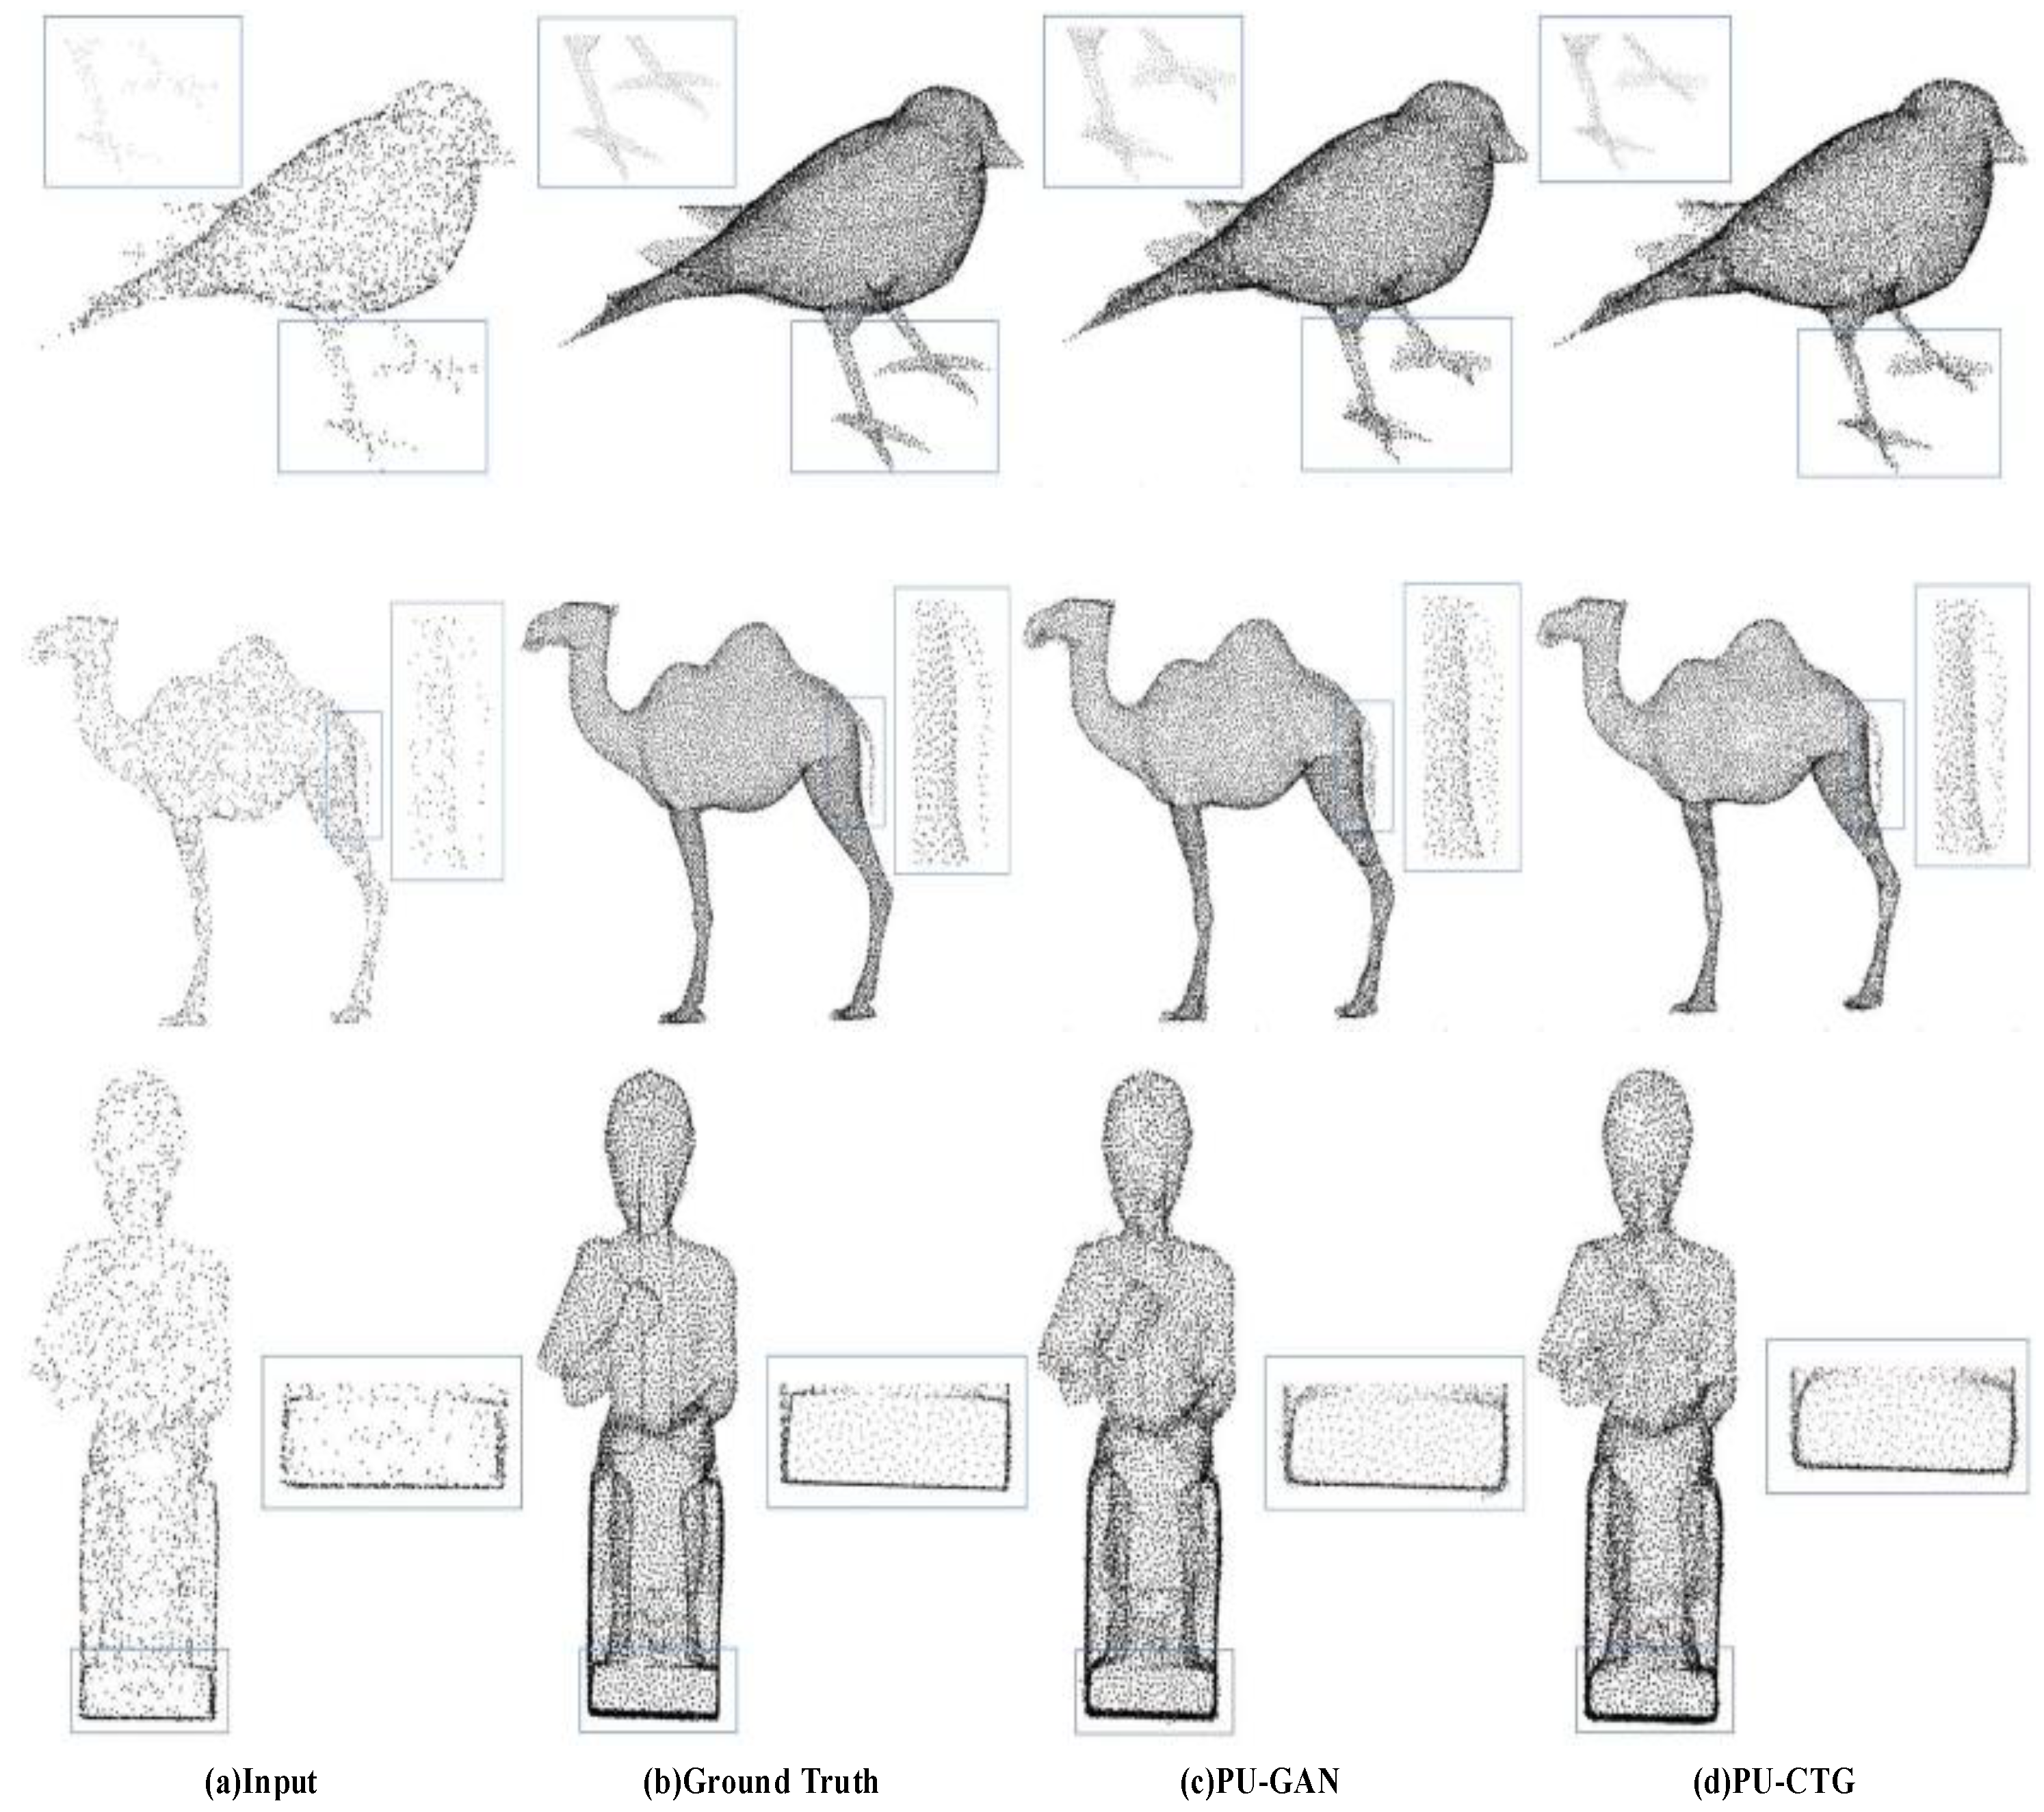
As shown in Table 1, PU-CTG is compared with four state-of-the-art point set upsampling methods. For the Chamfer distance (CD) and Hausdorff distance (HD), the PU-CTG results reach the lowest values and achieve the best performance. For point-to-face distance (P2F), PU-CTG achieves suboptimal results that are very close to PU-GAN. For the quantitative results, we further prove the better performance of PU-CTG considering the upsampling shown in Figure 6. The results of PU-GAN and PU-CTG on the same model are visually illustrated. For example, from the results of PU-GAN, we found that there is still considerable noise at the bottom of the statue. In addition, gaps in the bird’s paws and the camel’s tail were also observed. In contrast, PU-CTG significantly reduces the noise in the same area. In particular, PU-CTG generates higher-quality edges for the statue. In terms of time consumption, PU-CTG decreases the time for calculating based on PU-GAN. However, compared to PU-GAN and PU-CTG, PU-Net has the lowest computation time due to the simplicity of its structure, which also leads to its inferior performance.
4.3.2. Quantitative Results on the PU1K Dataset
We also compare our network with PU-Net and MPU on the PU1K dataset. Perhaps, because of the unstable nature of the inherent GAN architecture in PU-GAN, the results from the code made available by its authors are unable to be reproduced. Therefore, we do not compare it with PU-GAN on PU1K. Table 2 shows the quantitative results of the comparisons. Our model shows relatively better performance on generalization. When the error of all methods increases, a better improvement has been made by PU-CTG in all metrics than with all other methods.
4.4. Upsampling Real-Scanned Data
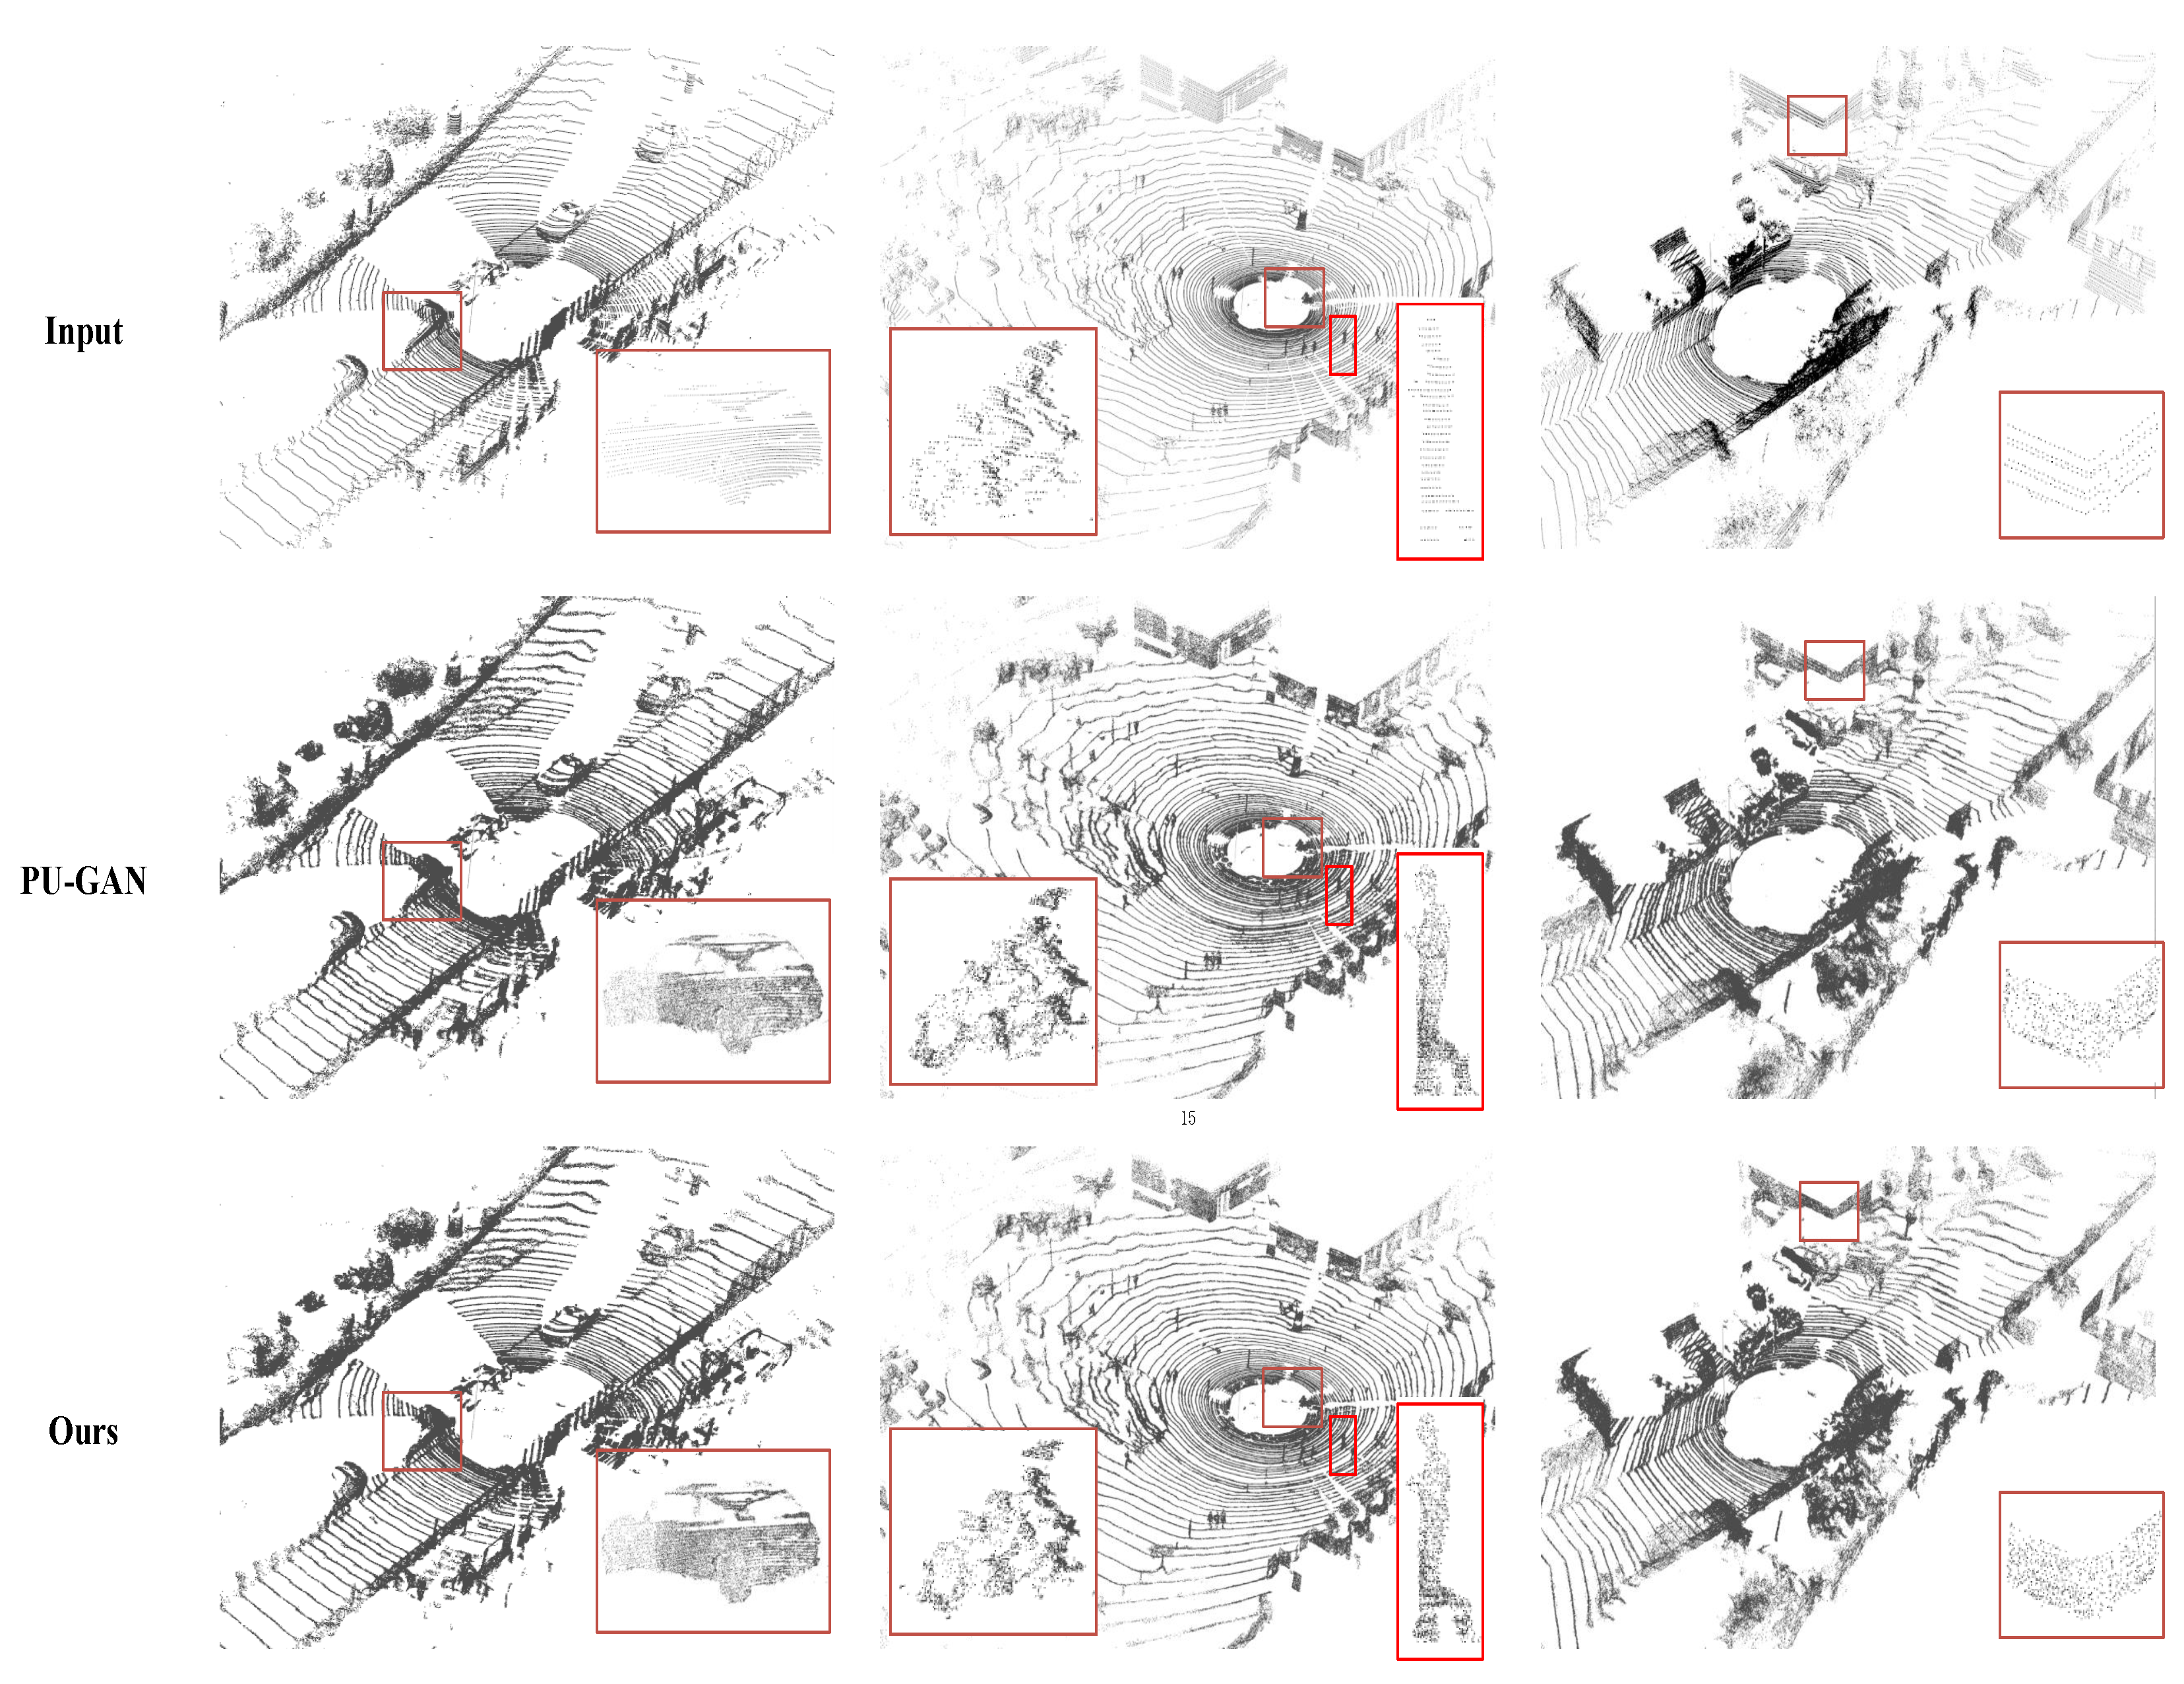
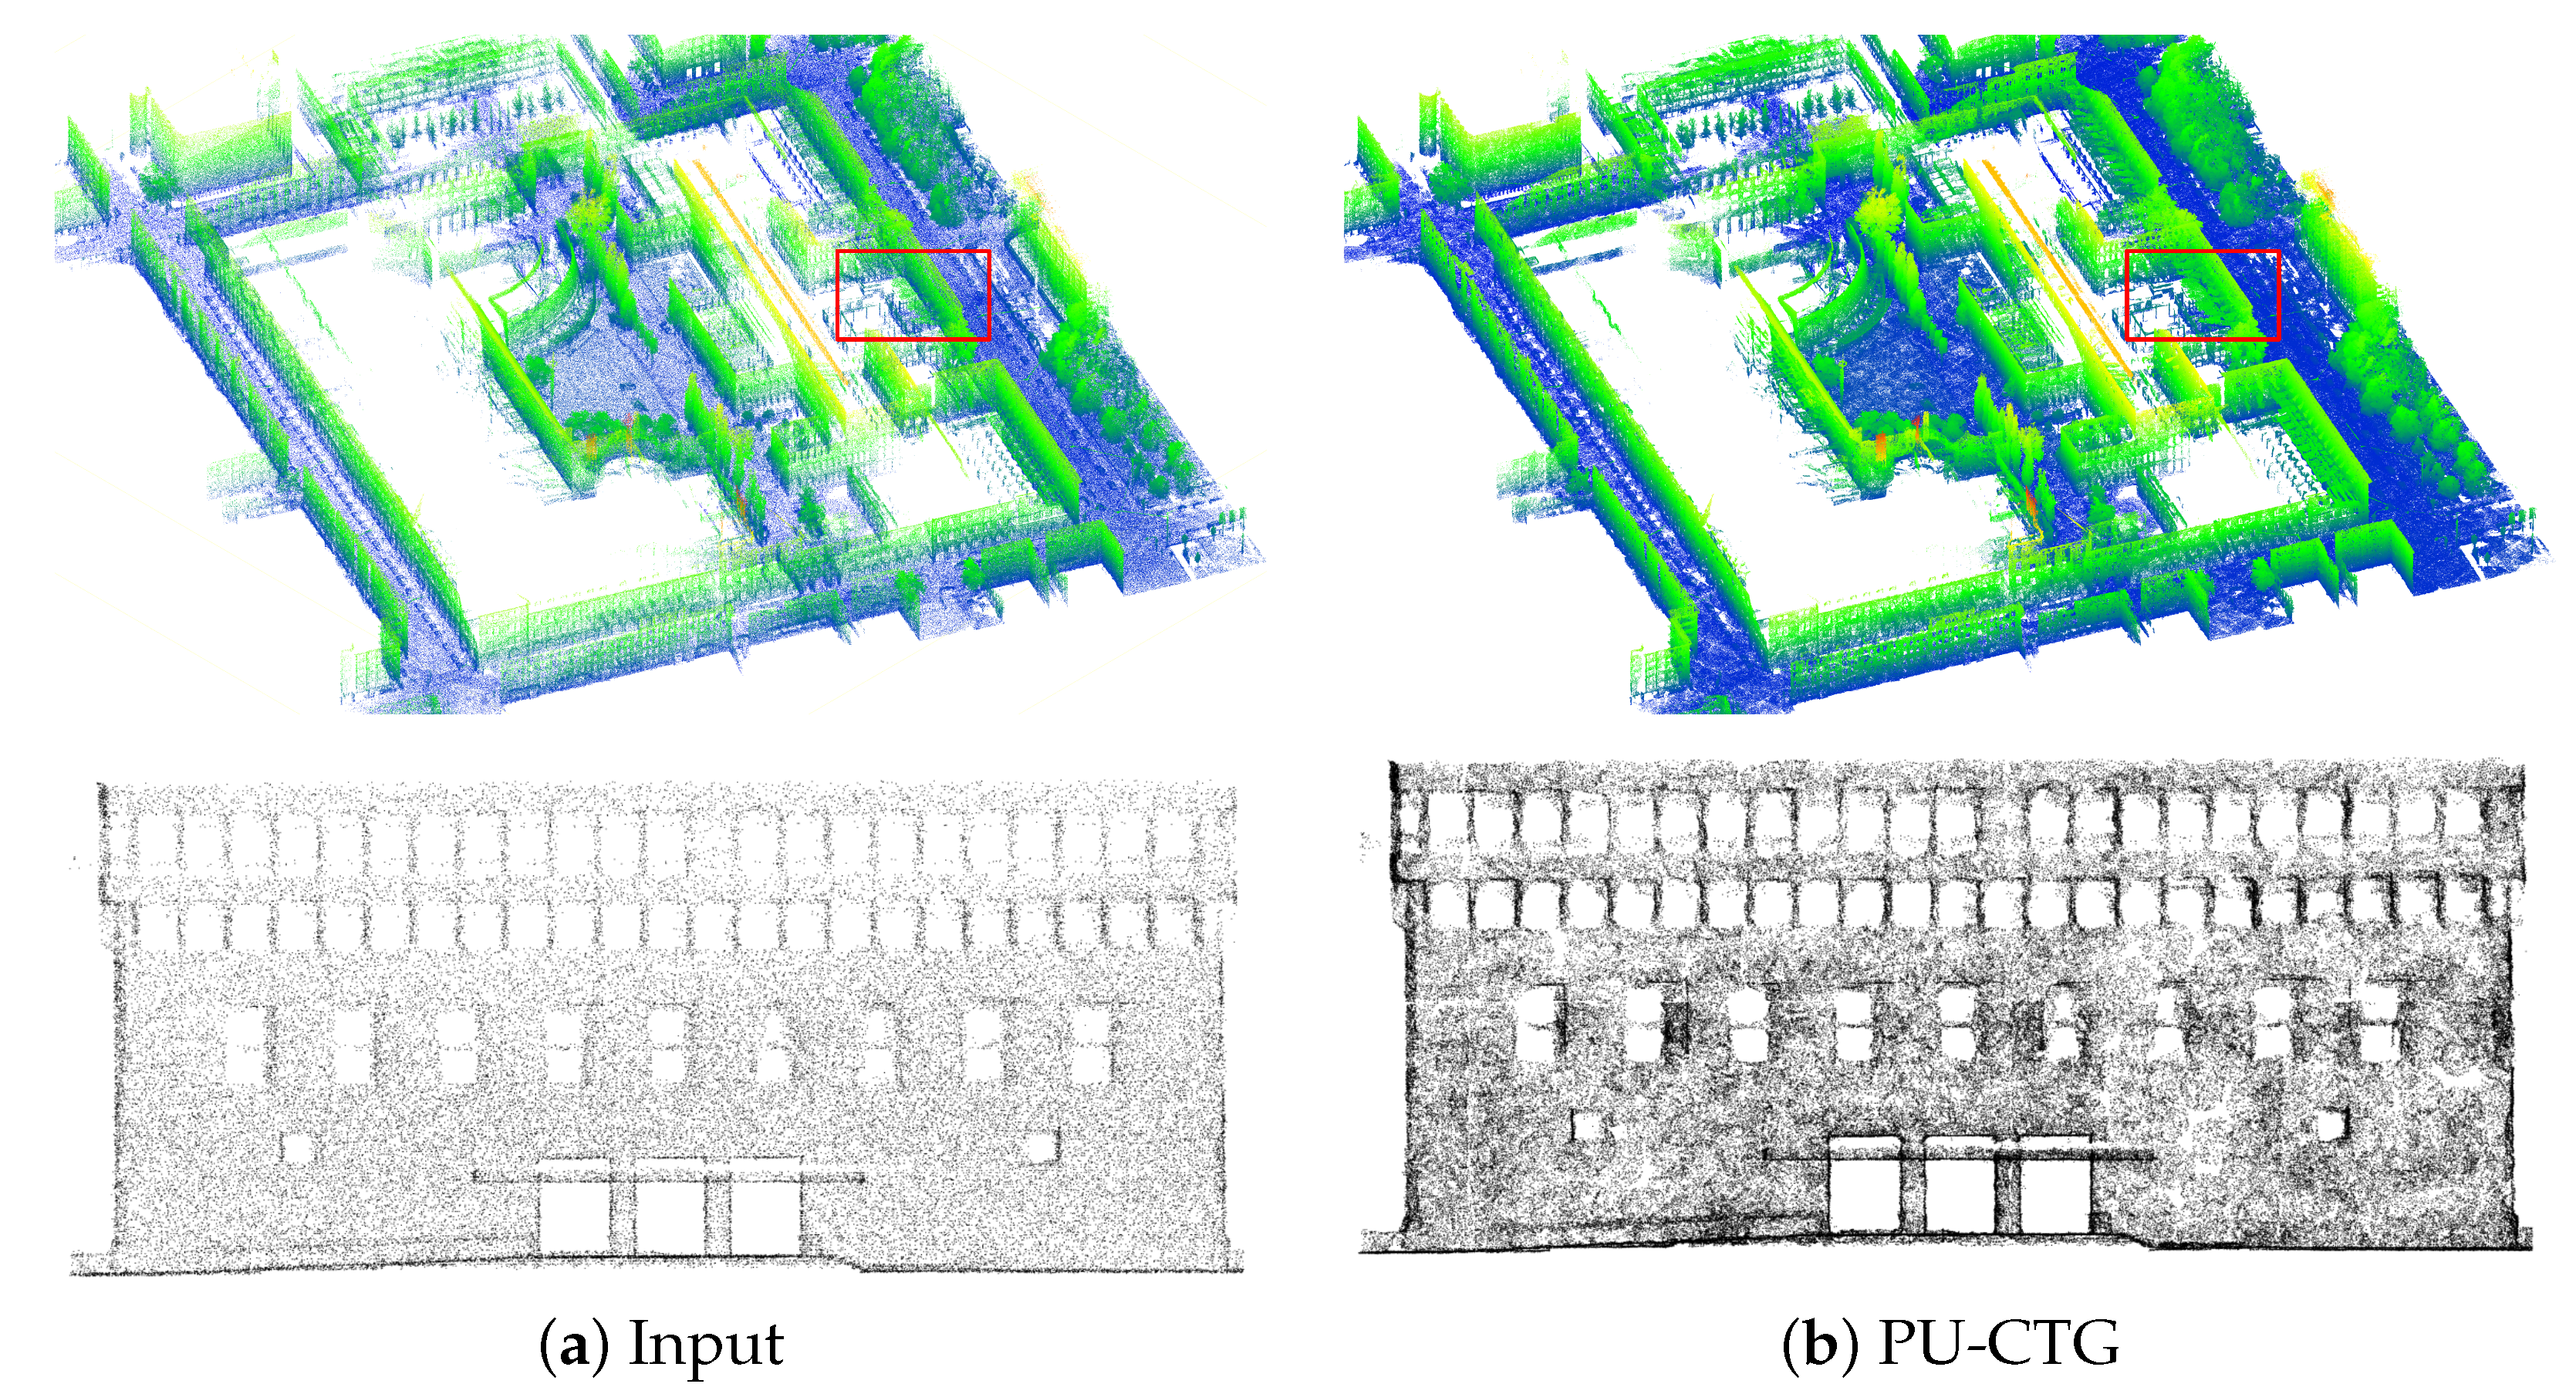
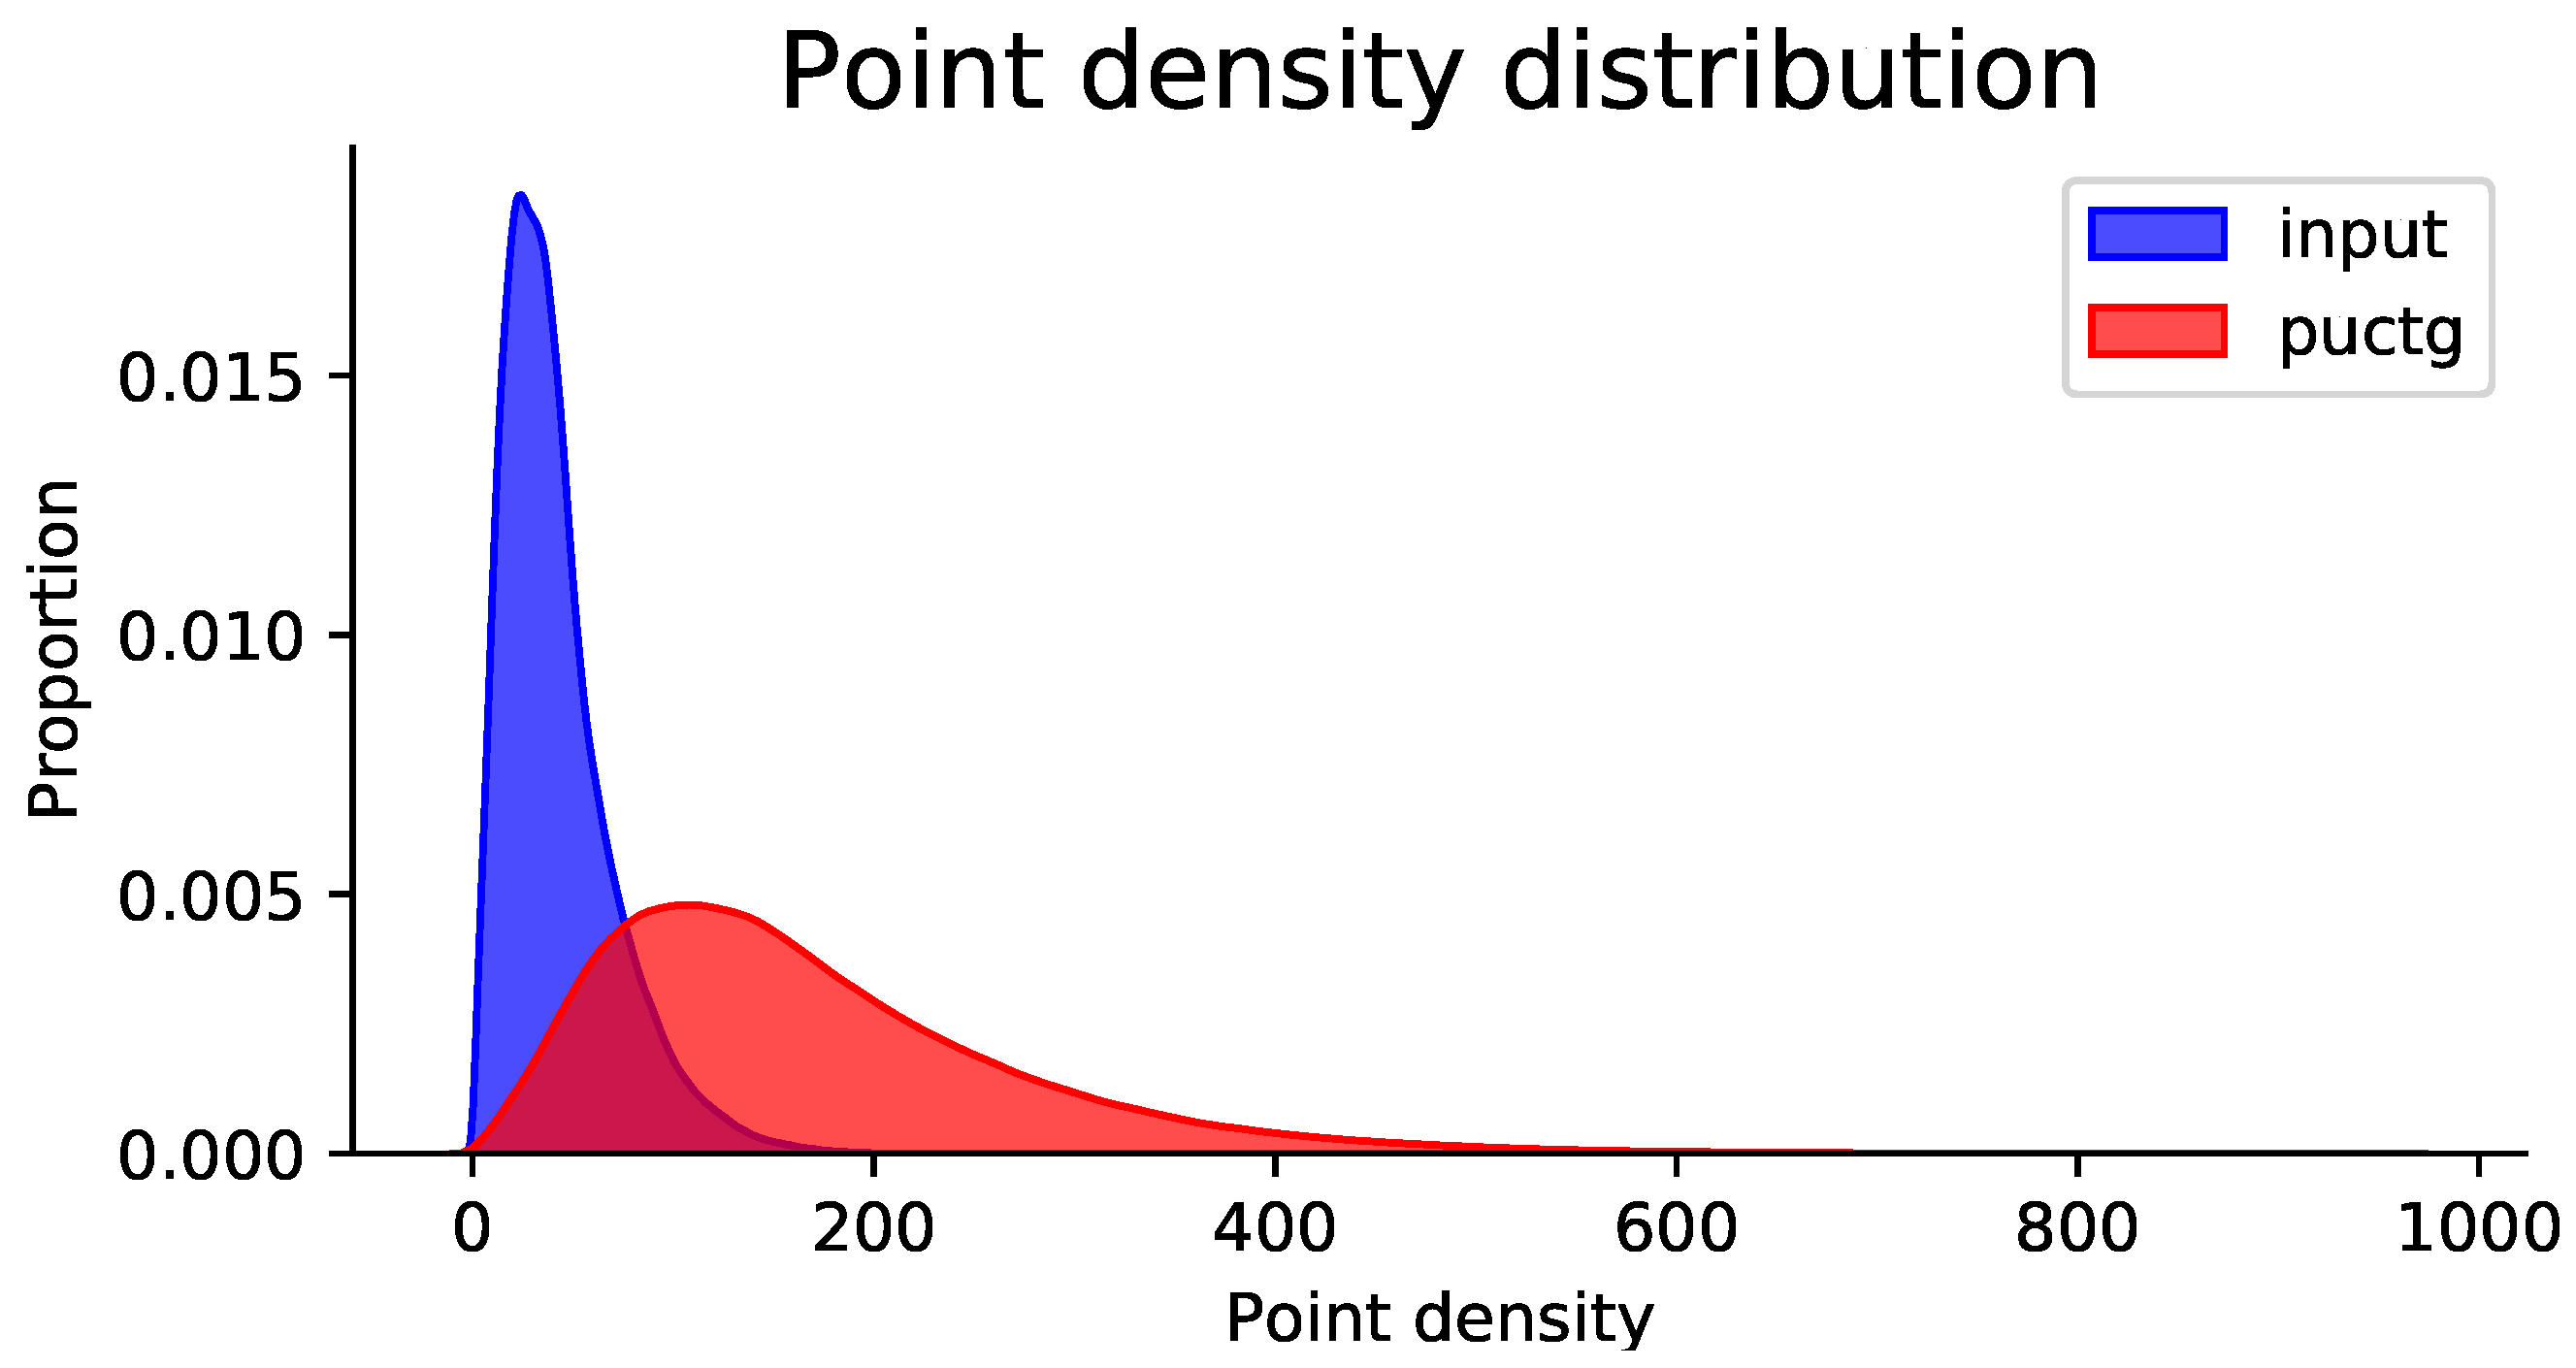
For evaluating performance on real-scanned data, our proposed method is also tested on the KITTI dataset [23] and the TUM-MLS-2016 dataset [24]. Figure 7 compares the performance of PU-CTG and PU-GAN [19] on the KITTI dataset. Both models are trained on PU-GAN’s dataset for fair comparison, and then each point cloud, which is divided into many patches, is quadruple upsampled by both models, respectively. Starting from the first line, it can be observed that the input raw point cloud is sparse and non-uniform due to hardware and environmental limitations, e.g., vehicles, cyclists, and pedestrians. After upsampling, the point cloud becomes denser and more detailed in terms of local geometric information with fewer occlusion-induced holes. Compared to PU-GAN, our results fill more holes caused by occlusions while producing point clouds with sharper boundaries. The results on the TUM-MLS-2016 dataset presented in Figure 8 further demonstrate the superiority of our method on point clouds directly mapping large-scale urban scenes. For the panorama and local, our method preserves the hole and boundary information well. Figure 9 illustrates the point density distribution before and after upsampling on the TUM-MLS-2016 dataset, which indicates that the point density is significantly increased after upsampling by PU-CTG and can still remain relatively homogeneous. The produced dense and uniform point clouds containing more geometric details may contribute to improved performance in downstream tasks, e.g., point cloud classification and segmentation.
4.5. Ablation Study
To evaluate the effects of our components, including MEF, GRU, the hierarchical upsampling operator, and loss of DCD, we removed each of them from the network or replaced them with the methods in PU-GAN (such as using EMD instead of DCD).
Table 3 shows the evaluation results of CD and HD. The absence of each component from PU-CTG leads to poor overall performance. MEF adds a cross-transformer between blocks at different scales, capturing contextual information and effectively performing feature fusion. GRU achieves the correction of error on features by eliminating irrelevant and repetitive features. Hierarchical upsampling of features before the folding operation increases the diversity of points. Using DCD as reconstruction loss instead of EMD can better balance the overall structure and local details of the model.
4.6. Discussion of Point Cloud Classification
Point cloud upsampling is also helpful for object recognition in 3D reconstruction. In this work, we conduct classification experiments on PointNet [10] and KPConv [46] using the ModelNet40 [47] dataset before and after upsampling, separately. For PointNet with global features, we trained it on two sparse datasets (with 512 points and 2048 points) and two dense ones (with 2048 points and 8192 points) upsampled by PU-CTG. After training on these data, the same result was tested. The overall classification accuracy of one group increased from 82.4% (by 512 sparse points) to 83.91% (by 2048 dense points), and the other group increased from 88.57% (by 2048 sparse points) to 89.64% (by 8192 dense points). Similarly for KPConv, by incorporating local features, the overall classification accuracy increased from 88.80% (by 1024 sparse points) to 91.11% (by 4096 dense points). It has been proven that PU-CTG helps improve the classification performance.
4.7. Effects of Additive Noise and Input Sizes
4.7.1. Upsampling Point Sets of Varying Noise Levels
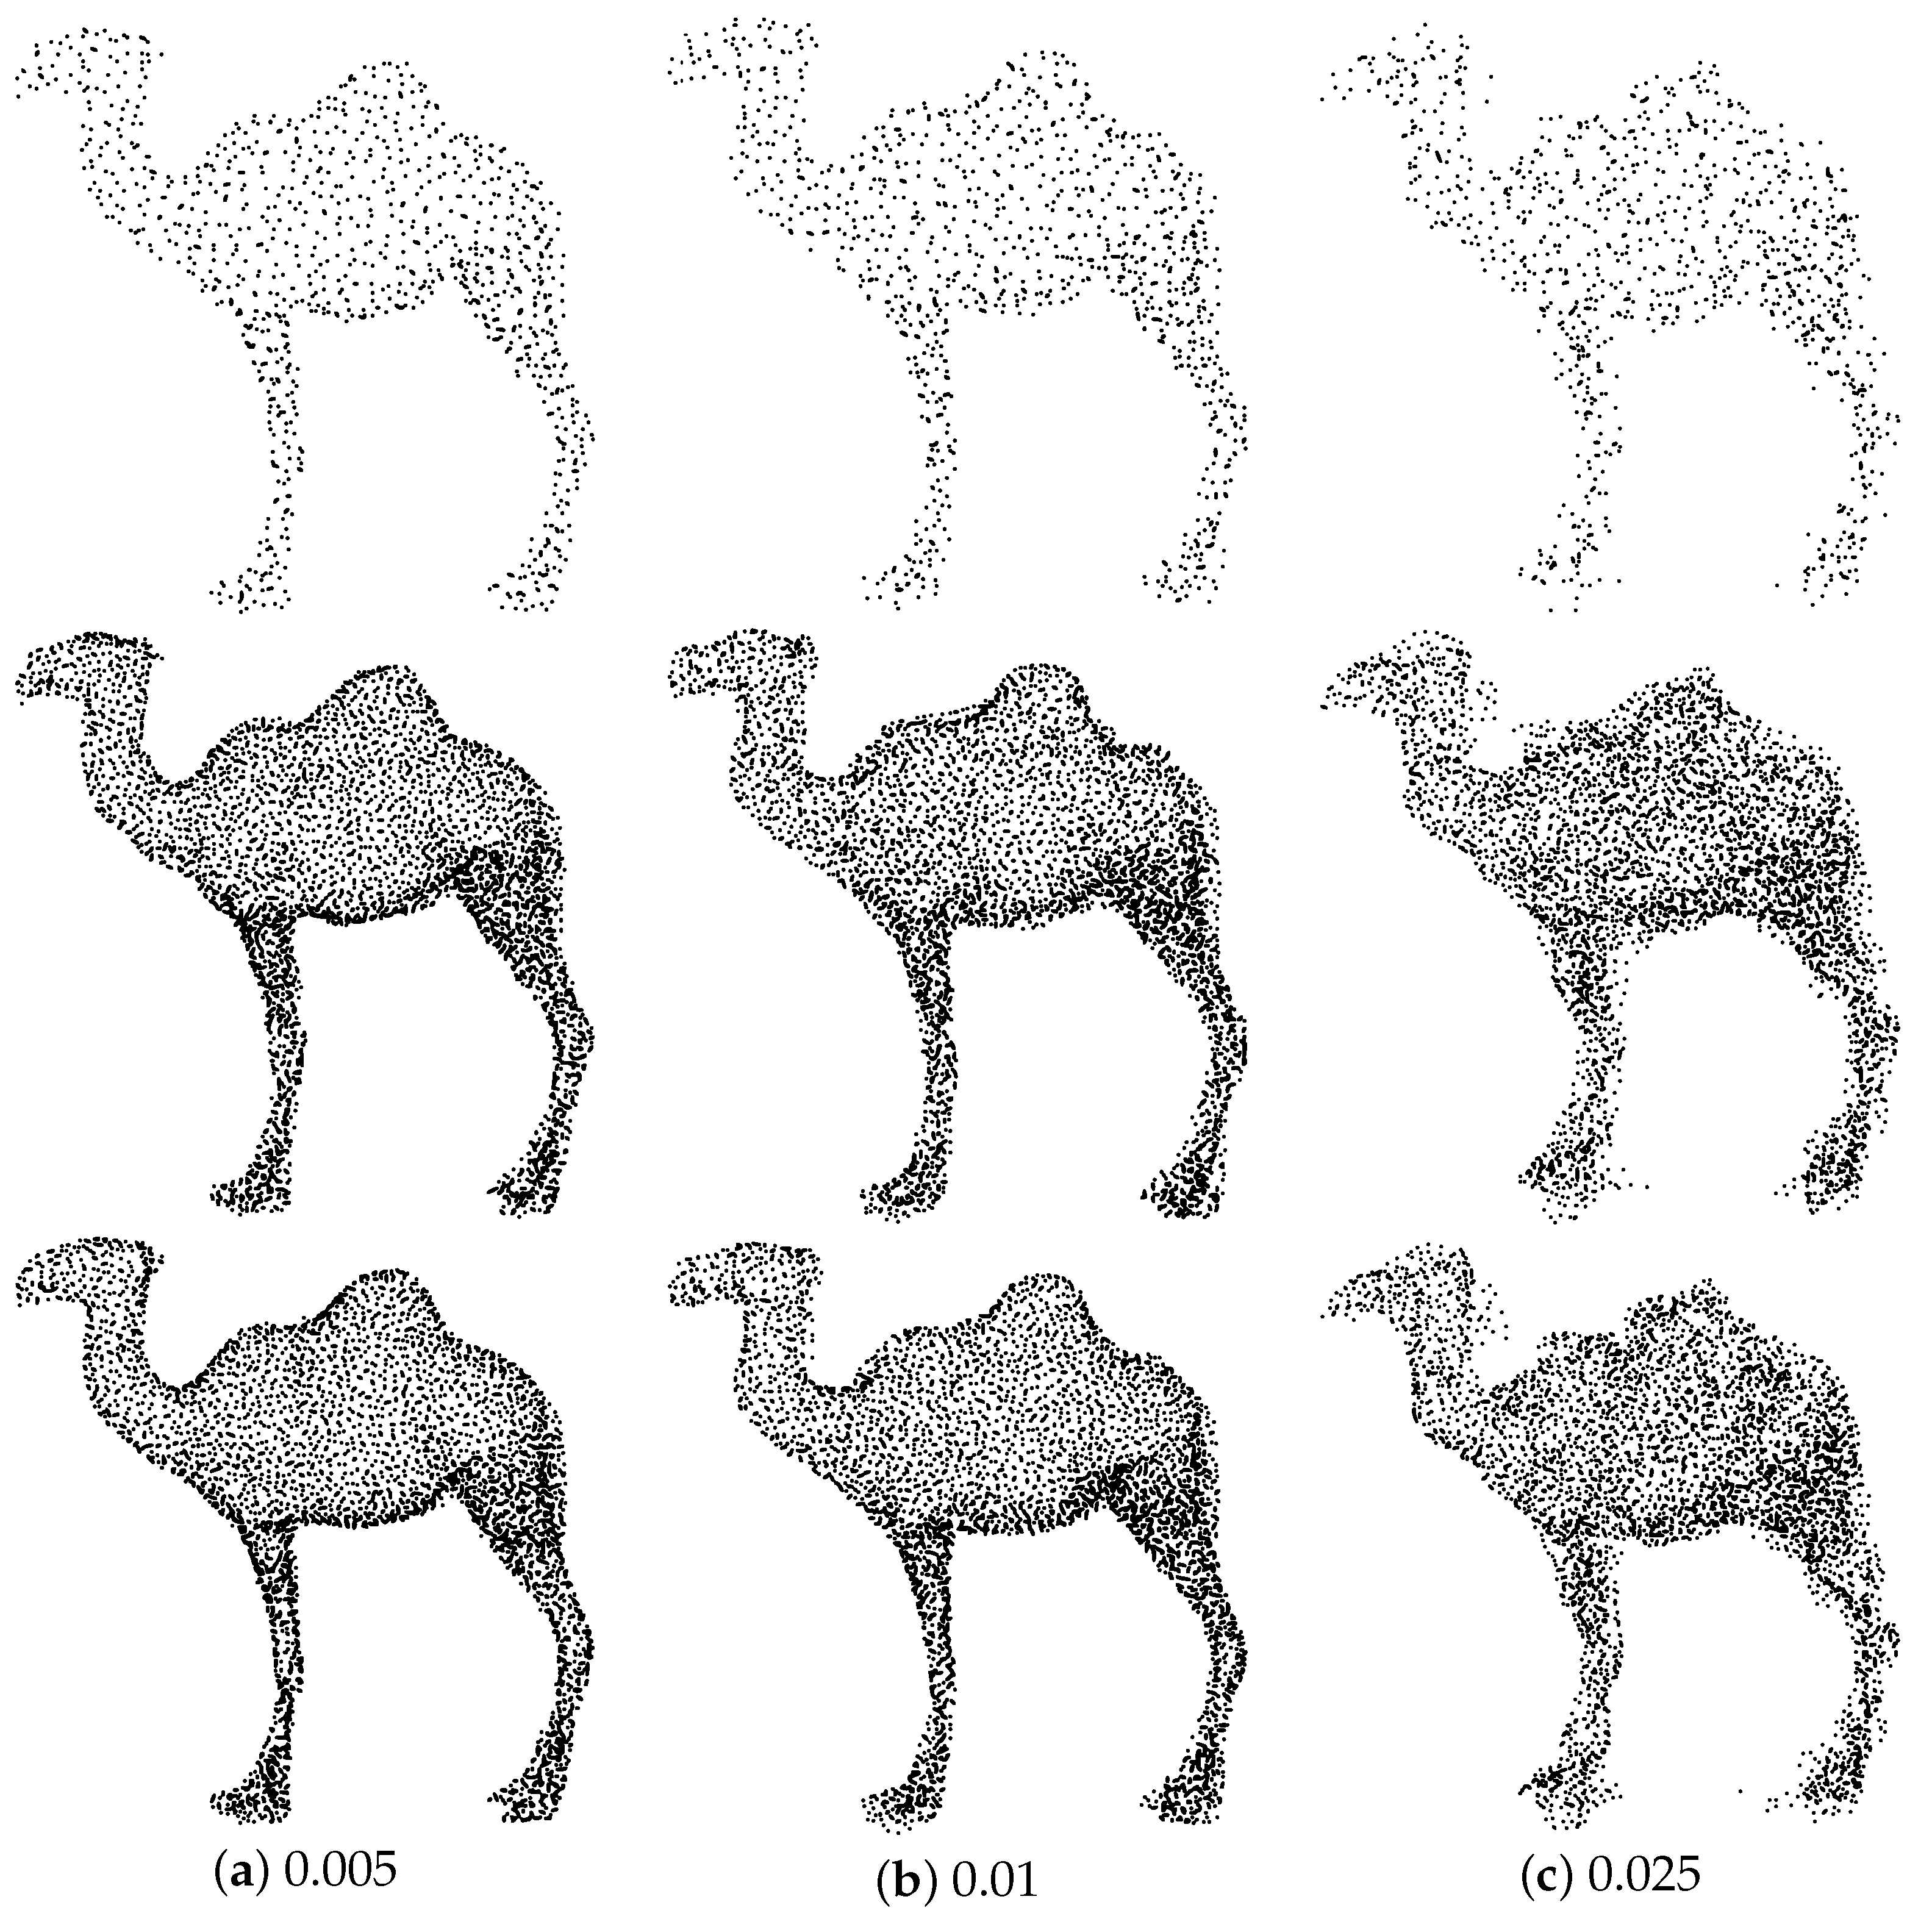
To exemplify the robustness of our method to noise, we add Gaussian noise of different levels to the input point cloud, including 0.005, 0.01, 0.015, and 0.025. The quantitative comparison results are shown in Table 4. It can be seen that, as the level of noise increases, both the PU-GAN and our method simultaneously degrade in performance. However, our method presents a much lower downward trend. This gap increases at larger noise level and shows that our method has better robustness to noise than PU-GAN. Figure 10 illustrates the qualitative results, which further demonstrates the reliability and robustness of the proposed method when encountering noise. PU-CTG can better combat noise and restore some detailed parts.
4.7.2. Upsampling Point Sets of Varying Sizes
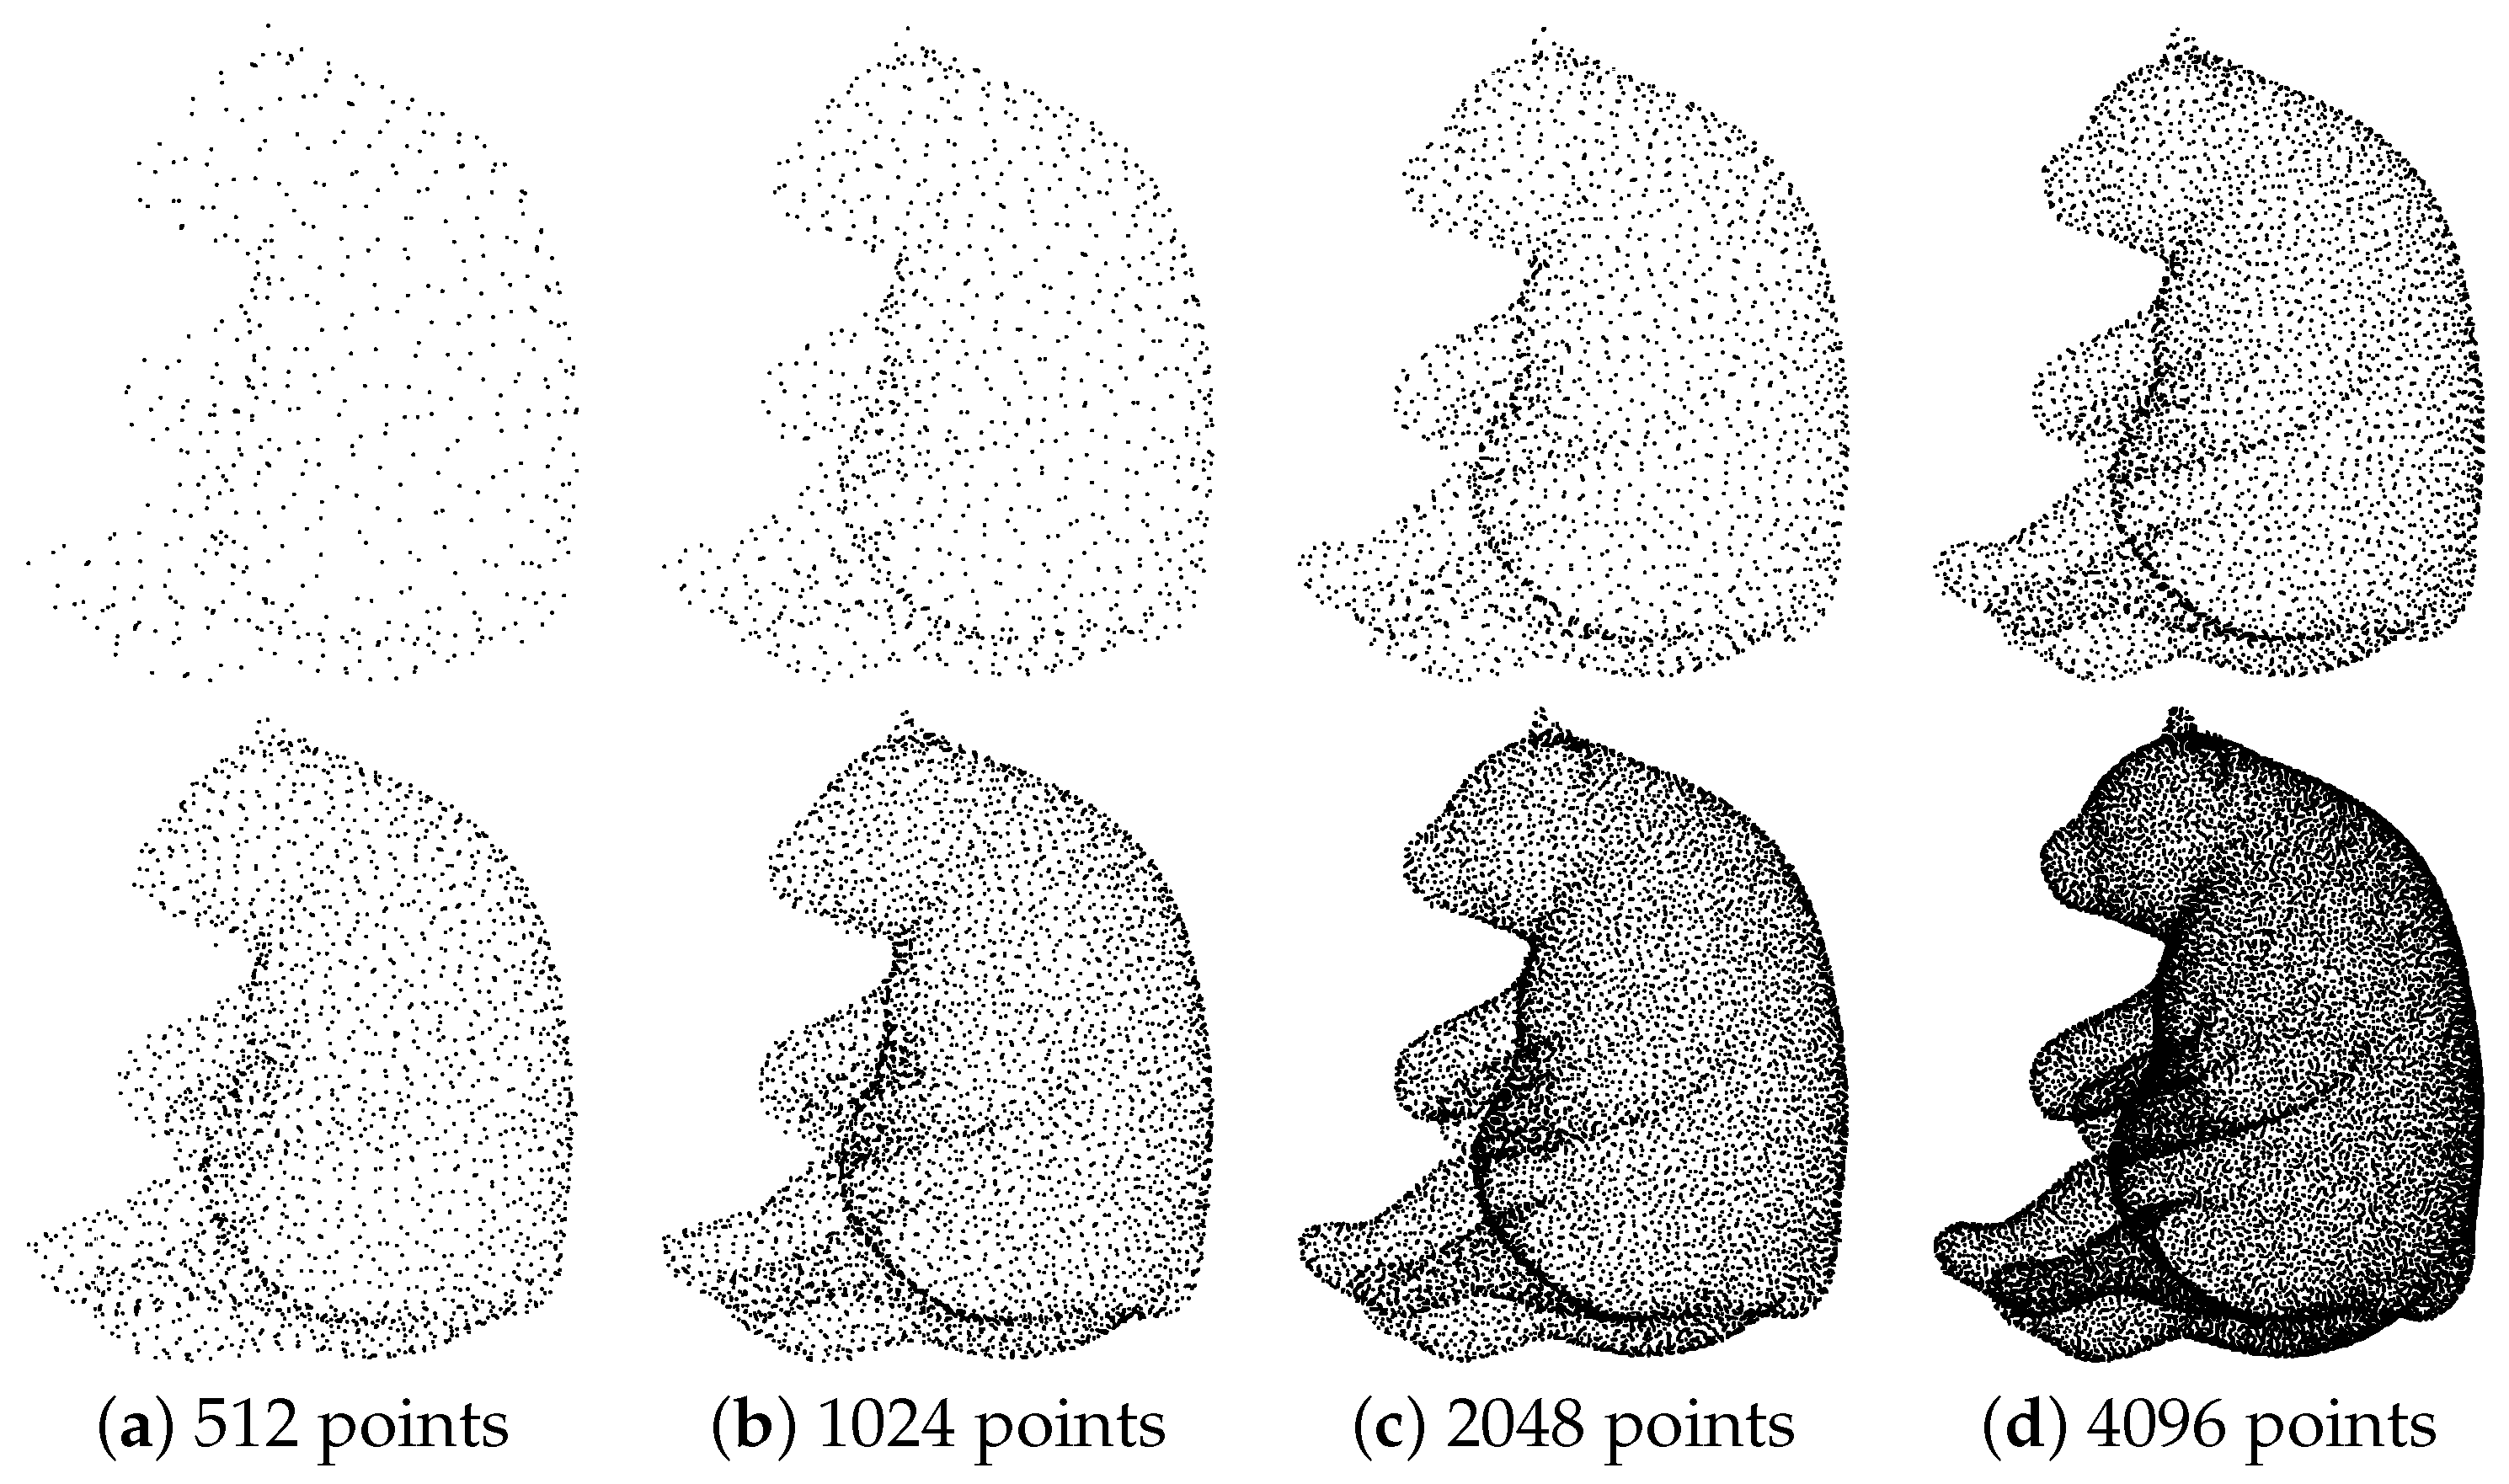
Figure 11 shows the qualitative results of our method for point clouds of different sizes. The results of upsampling may be worse, compared to those with more points, on point clouds with fewer points. However, PU-CTG still maintains a good upsampling result with only 512 points of input. Certainly, on dense point clouds, our method gives better results.
4.8. Effects of Generating 3D Meshes
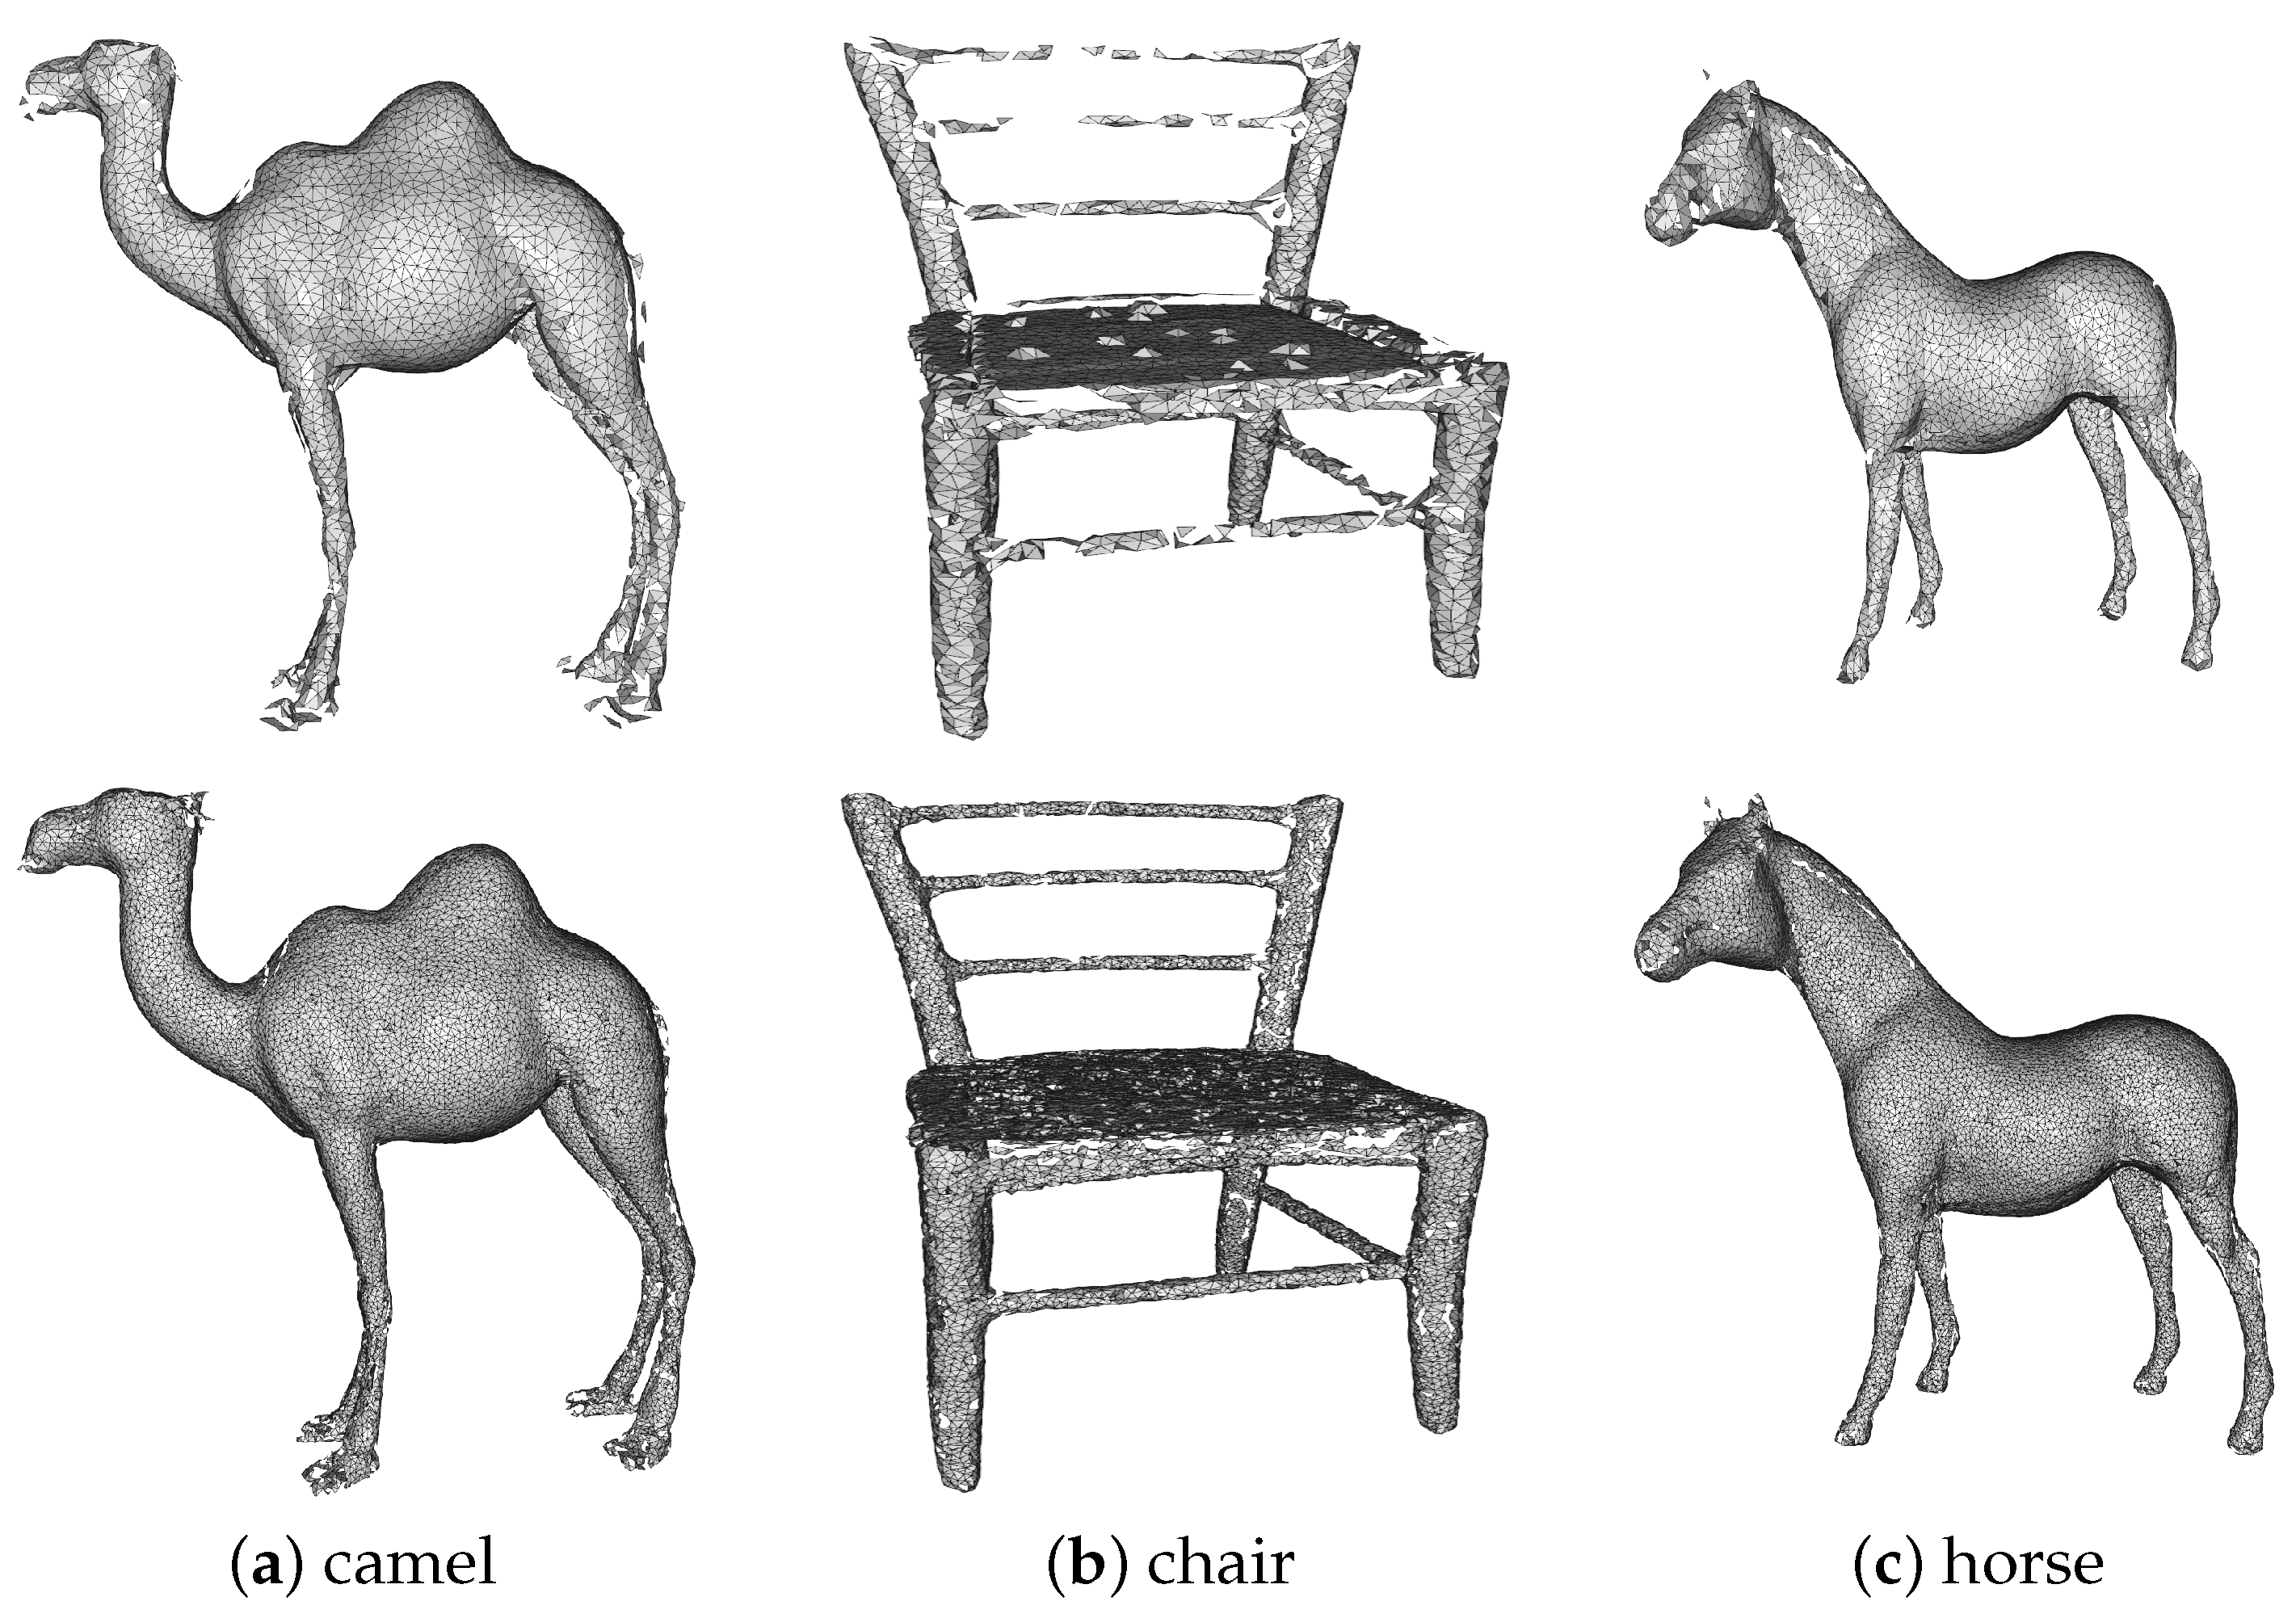
To further validate the effectiveness of the proposed upsampling method, we compare the 3D meshes generated by the point clouds before and after upsampling, respectively. Figure 12 illustrates the results of the mesh generated from the upsampled point cloud. The mesh generated after upsampling retains a more complete shape and more detailed information than before upsampling. For example, in the case of the camel and the horse, the mesh generated after upsampling has much finer detail, such as in the feet and head, while maintaining a relatively more complete overall shape.
4.9. Limitations
Point cloud upsampling is a generic upstream operation, and it is not designed to target a specific downstream task. Hence, during upsampling, we try to maintain the basic shape of the point cloud and output a uniformly dense point cloud. However, we do not always want to output a uniformly distributed point cloud in all scenarios. In some tasks, it is desired to upsample more points on curved surfaces than on planar surfaces because points on curved surfaces are usually richer in spatial information. In this case, we can consider taking curvature information into account in the patch extraction stage to extract more patches where the curvature is high instead of sampling uniformly over the whole surface of the point cloud.
5. Conclusions
In this paper, we proposed a new GAN-based point cloud upsampling network called PU-CTG. To better extract and integrate the features of multiscale blocks, we designed the cross-transformer to construct a feature extraction unit. The module uses the features in different blocks as input. Position encoding is calculated from raw coordinates to guide the module in learning the spatial relationships between different local features. We simulate the GRU module to adjust the features. Repetitive and useless features will be dropped as much as feasible in this module. The detailed information will be refined during the feature fusion and correction. In addition, we use the operation of hierarchical upsampling followed by the 2D grid to expand the features, which will further promote diversity of generated points in the replication process. In the training phase, we quote the state-of-the-art DCD as the reconstruction loss to optimize, prompting the generated points to lie on the target surface. The experimental results prove the validity of PU-CTG. Our work further extends the improvement of upsampling for classification tasks. We demonstrate that creating high-resolution data instead of raw data can help improve the performance of the classification task. In the future, we will continue to improve the performance of upsampling for the sake of providing new auxiliary options for point cloud classification.
Author Contributions
Methodology, G.A., T.L. and Y.L.; software, G.A., T.L. and Y.L.; validation, T.L. and Y.L.; investigation, B.C.; data curation, B.C.; writing—original draft preparation, G.A., T.L. and Y.L.; writing—review and editing, T.L. and Y.L.; visualization, T.L. and Y.L.; supervision, L.F. and J.Y. All authors have read and agreed to the published version of the manuscript.
Funding
This research was funded by the National Natural Science Foundation of China (No. 42101359).
Data Availability Statement
The data presented in this study are available on request from the corresponding author. The data are not publicly available due to privacy restrictions.
Conflicts of Interest
The authors declare no conflicts of interest.
References
- Zhang, Z.; Sun, L.; Zhong, R.; Chen, D.; Zhang, L.; Li, X.; Wang, Q.; Chen, S. Hierarchical Aggregated Deep Features for ALS Point Cloud Classification. IEEE Trans. Geosci. Remote Sens. 2021, 59, 1686–1699. [Google Scholar] [CrossRef]
- Qiu, S.; Anwar, S.; Barnes, N. Dense-resolution network for point cloud classification and segmentation. In Proceedings of the IEEE/CVF Winter Conference on Applications of Computer Vision, Virtual, 11–17 October 2021; pp. 3813–3822. [Google Scholar]
- Shahzad, M.; Zhu, X.X. Reconstruction of building façades using spaceborne multiview TomoSAR point clouds. In Proceedings of the 2013 IEEE International Geoscience and Remote Sensing Symposium-IGARSS, Melbourne, Australia, 21–26 July 2013; pp. 624–627. [Google Scholar]
- Shahzad, M.; Zhu, X.X. Robust reconstruction of building facades for large areas using spaceborne TomoSAR point clouds. IEEE Trans. Geosci. Remote Sens. 2014, 53, 752–769. [Google Scholar] [CrossRef]
- Li, Z.; Shan, J. RANSAC-based multi primitive building reconstruction from 3D point clouds. ISPRS J. Photogramm. Remote Sens. 2022, 185, 247–260. [Google Scholar] [CrossRef]
- Wang, F.; Zhou, G.; Hu, H.; Wang, Y.; Fu, B.; Li, S.; Xie, J. Reconstruction of LoD-2 Building Models Guided by Façade Structures from Oblique Photogrammetric Point Cloud. Remote Sens. 2023, 15, 400. [Google Scholar] [CrossRef]
- Yu, Y.; Li, J.; Guan, H.; Wang, C.; Yu, J. Semiautomated extraction of street light poles from mobile LiDAR point-clouds. IEEE Trans. Geosci. Remote Sens. 2014, 53, 1374–1386. [Google Scholar] [CrossRef]
- Wu, C.; Lin, Y.; Guo, Y.; Wen, C.; Shi, Y.; Wang, C. Vehicle Completion in Traffic Scene Using 3D LiDAR Point Cloud Data. In Proceedings of the IGARSS 2022—2022 IEEE International Geoscience and Remote Sensing Symposium, Kuala Lumpur, Malaysia, 17–22 July 2022; pp. 7495–7498. [Google Scholar]
- Dai, J.; Zhang, Y.; Bi, D.; Lan, J. MUAN: Multiscale Upsampling Aggregation Network for 3-D Point Cloud Segmentation. IEEE Geosci. Remote Sens. Lett. 2022, 19, 7004805. [Google Scholar] [CrossRef]
- Qi, C.R.; Su, H.; Mo, K.; Guibas, L.J. Pointnet: Deep learning on point sets for 3D classification and segmentation. In Proceedings of the IEEE Conference on Computer Vision and Pattern Recognition, Honolulu, HI, USA, 21–26 July 2017; pp. 652–660. [Google Scholar]
- Wang, Z.; Zhang, L.; Zhang, L.; Li, R.; Zheng, Y.; Zhu, Z. A deep neural network with spatial pooling (DNNSP) for 3-D point cloud classification. IEEE Trans. Geosci. Remote Sens. 2018, 56, 4594–4604. [Google Scholar] [CrossRef]
- Li, M.; Hu, Y.; Zhao, N.; Guo, L. LPCCNet: A lightweight network for point cloud classification. IEEE Geosci. Remote Sens. Lett. 2019, 16, 962–966. [Google Scholar] [CrossRef]
- Li, Y.; Ma, L.; Zhong, Z.; Cao, D.; Li, J. TGNet: Geometric graph CNN on 3-D point cloud segmentation. IEEE Trans. Geosci. Remote Sens. 2019, 58, 3588–3600. [Google Scholar] [CrossRef]
- Wang, F.; Zhang, X.; Jiang, Y.; Kong, L.; Wei, X. PatchCNN: An explicit convolution operator for point clouds perception. IEEE Geosci. Remote Sens. Lett. 2020, 18, 726–730. [Google Scholar] [CrossRef]
- Li, Y.; Li, X.; Zhang, Z.; Shuang, F.; Lin, Q.; Jiang, J. DenseKPNET: Dense kernel point convolutional neural networks for point cloud semantic segmentation. IEEE Trans. Geosci. Remote Sens. 2022, 60, 5702913. [Google Scholar] [CrossRef]
- Qi, C.R.; Yi, L.; Su, H.; Guibas, L.J. Pointnet++: Deep hierarchical feature learning on point sets in a metric space. Adv. Neural Inf. Process. Syst. 2017, 30, 5105–5114. [Google Scholar]
- Yu, L.; Li, X.; Fu, C.W.; Cohen-Or, D.; Heng, P.A. Pu-net: Point cloud upsampling network. In Proceedings of the IEEE Conference on Computer Vision and Pattern Recognition, Salt Lake City, UT, USA, 18–23 June 2018; pp. 2790–2799. [Google Scholar]
- Wang, Y.; Wu, S.; Huang, H.; Cohen-Or, D.; Sorkine-Hornung, O. Patch-based progressive 3D point set upsampling. In Proceedings of the IEEE/CVF Conference on Computer Vision and Pattern Recognition, Long Beach, CA, USA, 15–20 June 2019; pp. 5958–5967. [Google Scholar]
- Li, R.; Li, X.; Fu, C.W.; Cohen-Or, D.; Heng, P.A. PU-GAN: A point cloud upsampling adversarial network. In Proceedings of the IEEE/CVF International Conference on Computer Vision, Seoul, Republic of Korea, 27 October–2 November 2019; pp. 7203–7212. [Google Scholar]
- Yang, Y.; Feng, C.; Shen, Y.; Tian, D. Foldingnet: Point cloud auto-encoder via deep grid deformation. In Proceedings of the IEEE Conference on Computer Vision and Pattern Recognition, Salt Lake City, UT, USA, 18–23 June 2018; pp. 206–215. [Google Scholar]
- Cho, K.; Van Merriënboer, B.; Gulcehre, C.; Bahdanau, D.; Bougares, F.; Schwenk, H.; Bengio, Y. Learning phrase representations using RNN encoder-decoder for statistical machine translation. arXiv 2014, arXiv:1406.1078. [Google Scholar]
- Qian, G.; Abualshour, A.; Li, G.; Thabet, A.; Ghanem, B. PU-GCN: Point cloud upsampling using graph convolutional networks. In Proceedings of the IEEE/CVF Conference on Computer Vision and Pattern Recognition, Nashville, TN, USA, 20–25 June 2021; pp. 11683–11692. [Google Scholar]
- Geiger, A.; Lenz, P.; Stiller, C.; Urtasun, R. Vision meets Robotics: The KITTI Dataset. Int. J. Robot. Res. 2013, 32, 1231–1237. [Google Scholar] [CrossRef]
- Zhu, J.; Gehrung, J.; Huang, R.; Borgmann, B.; Sun, Z.; Hoegner, L.; Hebel, M.; Xu, Y.; Stilla, U. TUM-MLS-2016: An annotated mobile LiDAR dataset of the TUM city campus for semantic point cloud interpretation in urban areas. Remote Sens. 2020, 12, 1875. [Google Scholar] [CrossRef]
- Wu, T.; Pan, L.; Zhang, J.; Wang, T.; Liu, Z.; Lin, D. Density-aware chamfer distance as a comprehensive metric for point cloud completion. arXiv 2021, arXiv:2111.12702. [Google Scholar]
- Alexa, M.; Behr, J.; Cohen-Or, D.; Fleishman, S.; Levin, D.; Silva, C.T. Computing and rendering point set surfaces. IEEE Trans. Vis. Comput. Graph. 2003, 9, 3–15. [Google Scholar] [CrossRef]
- Lipman, Y.; Cohen-Or, D.; Levin, D.; Tal-Ezer, H. Parameterization-free projection for geometry reconstruction. ACM Trans. Graph. 2007, 26, 22-es. [Google Scholar] [CrossRef]
- Huang, H.; Li, D.; Zhang, H.; Ascher, U.; Cohen-Or, D. Consolidation of unorganized point clouds for surface reconstruction. ACM Trans. Graph. 2009, 28, 1–7. [Google Scholar] [CrossRef]
- Huang, H.; Wu, S.; Gong, M.; Cohen-Or, D.; Ascher, U.; Zhang, H. Edge-aware point set resampling. ACM Trans. Graph. 2013, 32, 1–12. [Google Scholar] [CrossRef]
- Preiner, R.; Mattausch, O.; Arikan, M.; Pajarola, R.; Wimmer, M. Continuous projection for fast L1 reconstruction. ACM Trans. Graph. 2014, 33, 1–13. [Google Scholar] [CrossRef]
- Wu, S.; Huang, H.; Gong, M.; Zwicker, M.; Cohen-Or, D. Deep points consolidation. ACM Trans. Graph. 2015, 34, 1–13. [Google Scholar] [CrossRef]
- Fan, H.; Su, H.; Guibas, L.J. A point set generation network for 3D object reconstruction from a single image. In Proceedings of the IEEE Conference on Computer Vision and Pattern Recognition, Honolulu, HI, USA, 21–26 July 2017; pp. 605–613. [Google Scholar]
- Lin, C.H.; Kong, C.; Lucey, S. Learning efficient point cloud generation for dense 3D object reconstruction. In Proceedings of the AAAI Conference on Artificial Intelligence, New Orleans, LA, USA, 2–7 February 2018; Volume 32. [Google Scholar]
- Groueix, T.; Fisher, M.; Kim, V.G.; Russell, B.C.; Aubry, M. A papier-mâché approach to learning 3D surface generation. In Proceedings of the IEEE Conference on Computer Vision and Pattern Recognition, Salt Lake City, UT, USA, 18–23 June 2018; pp. 216–224. [Google Scholar]
- Zhang, W.; Jiang, H.; Yang, Z.; Yamakawa, S.; Shimada, K.; Kara, L.B. Data-driven upsampling of point clouds. Comput. Aided Des. 2019, 112, 1–13. [Google Scholar] [CrossRef]
- Yu, L.; Li, X.; Fu, C.W.; Cohen-Or, D.; Heng, P.A. Ec-net: An edge-aware point set consolidation network. In Proceedings of the European Conference on Computer Vision (ECCV), Munich, Germany, 8–14 September 2018; pp. 386–402. [Google Scholar]
- Zhao, Y.; Li, G.; Xie, W.; Jia, W.; Min, H.; Liu, X. GUN: Gradual upsampling network for single image super-resolution. IEEE Access 2018, 6, 39363–39374. [Google Scholar] [CrossRef]
- Kim, J.; Lee, J.K.; Lee, K.M. Accurate image super-resolution using very deep convolutional networks. In Proceedings of the IEEE Conference on Computer Vision and Pattern Recognition, Las Vegas, NV, USA, 27–30 June 2016; pp. 1646–1654. [Google Scholar]
- Wu, J.; Zhang, C.; Xue, T.; Freeman, B.; Tenenbaum, J. Learning a probabilistic latent space of object shapes via 3D generative-adversarial modeling. Adv. Neural Inf. Process. Syst. 2016, 29, 82–90. [Google Scholar]
- Qian, Y.; Hou, J.; Kwong, S.; He, Y. PUGeo-Net: A geometry-centric network for 3D point cloud upsampling. In Proceedings of the European Conference on Computer Vision, Virtual, 23–28 August 2020; pp. 752–769. [Google Scholar]
- Wen, X.; Xiang, P.; Han, Z.; Cao, Y.P.; Wan, P.; Zheng, W.; Liu, Y.S. PMP-Net++: Point cloud completion by transformer-enhanced multi-step point moving paths. IEEE Trans. Pattern Anal. Mach. Intell. 2022, 45, 852–867. [Google Scholar] [CrossRef] [PubMed]
- Vaswani, A.; Shazeer, N.; Parmar, N.; Uszkoreit, J.; Jones, L.; Gomez, A.N.; Kaiser, Ł.; Polosukhin, I. Attention is all you need. Adv. Neural Inf. Process. Syst. 2017, 30, 6000–6010. [Google Scholar]
- Shajahan, D.A.; Varma, M.; Muthuganapathy, R. Point transformer for shape classification and retrieval of urban roof point clouds. IEEE Geosci. Remote Sens. Lett. 2021, 19, 6501105. [Google Scholar] [CrossRef]
- Kingma, D.P.; Ba, J. Adam: A method for stochastic optimization. arXiv 2014, arXiv:1412.6980. [Google Scholar]
- Chang, A.X.; Funkhouser, T.; Guibas, L.; Hanrahan, P.; Huang, Q.; Li, Z.; Savarese, S.; Savva, M.; Song, S.; Su, H.; et al. Shapenet: An information-rich 3D model repository. arXiv 2015, arXiv:1512.03012. [Google Scholar]
- Thomas, H.; Qi, C.R.; Deschaud, J.E.; Marcotegui, B.; Goulette, F.; Guibas, L.J. KPConv: Flexible and Deformable Convolution for Point Clouds. In Proceedings of the IEEE/CVF International Conference on Computer Vision (ICCV), Seoul, Republic of Korea, 27 October–2 November 2019. [Google Scholar]
- Wu, Z.; Song, S.; Khosla, A.; Yu, F.; Zhang, L.; Tang, X.; Xiao, J. 3D shapenets: A deep representation for volumetric shapes. In Proceedings of the IEEE Conference on Computer Vision and Pattern Recognition, Boston, MA, USA, 7–12 June 2015; pp. 1912–1920. [Google Scholar]
Figure 1.
Generator architecture. The number of input points N is 256; the upsampling rate r is 4; and the number of feature channels, c and , is 480 and 128, respectively.
Figure 1.
Generator architecture. The number of input points N is 256; the upsampling rate r is 4; and the number of feature channels, c and , is 480 and 128, respectively.

Figure 2.
The multiscale feature extraction and fusion unit (a), cross-transformer (b).

Figure 3.
Up-down-up expansion unit.

Figure 4.
The up-feature operator (a) and the hierarchical upsampling (b).

Figure 5.
The gated recurrent unit.

Figure 6.
Comparing upsampling results of PU-GAN (c) and PU-CTG (d) for the same input (a) and ground truth (b).
Figure 6.
Comparing upsampling results of PU-GAN (c) and PU-CTG (d) for the same input (a) and ground truth (b).

Figure 7.
Upsampling results of our proposed method on the KITTI dataset. Some cases are magnified, e.g., vehicles, cyclists, and pedestrians, indicated by the red frames.
Figure 7.
Upsampling results of our proposed method on the KITTI dataset. Some cases are magnified, e.g., vehicles, cyclists, and pedestrians, indicated by the red frames.

Figure 8.
Upsampling results of the TUM-MLS-2016 dataset. (Top row: Panorama; bottom row: Local detail indicated by the red frame).
Figure 8.
Upsampling results of the TUM-MLS-2016 dataset. (Top row: Panorama; bottom row: Local detail indicated by the red frame).

Figure 9.
Point density distribution of upsampling on the TUM-MLS-2016 dataset.

Figure 10.
Upsampling results by applying PU-GAN to inputs with a noise level of 0.005 (a), 0.01 (b), and 0.025 (c). (From the first to the last row, in order, are input, PU-GAN, and PU-CTG).
Figure 10.
Upsampling results by applying PU-GAN to inputs with a noise level of 0.005 (a), 0.01 (b), and 0.025 (c). (From the first to the last row, in order, are input, PU-GAN, and PU-CTG).

Figure 11.
Upsampling point sets of varying sizes (top row: input; bottom row: PU-CTG).

Figure 12.
3D meshes generated by upsampling point clouds (top row: input; bottom row: PU-CTG).


Table 1.
Quantitative comparison of PU-CTG vs. state-of-the-art on PU-GAN’s dataset.
| Methods | P2F (10) | CD (10) | HD (10) | Time(s) |
|---|---|---|---|---|
| EAR [29] | 5.82 | 0.52 | 7.37 | - |
| PU-Net [17] | 6.84 | 0.72 | 8.94 | 0.35 |
| MPU [18] | 3.96 | 0.49 | 6.11 | - |
| PU-GAN [19] | 2.33 | 0.28 | 4.64 | 0.63 |
| PU-CTG | 2.36 | 0.24 | 3.45 | 0.52 |
Table 2.
Quantitative comparison of PU-CTG vs. state-of-the-art on PU1K.
| Methods | CD (10) | HD (10) |
|---|---|---|
| PU-Net [17] | 1.16 | 15.17 |
| MPU [18] | 0.94 | 13.33 |
| PU-CTG | 0.69 | 10.50 |
Points for input and ground truth are 2048 and 8096.
Table 3.
Quantitative comparisons: removing each specific component from the full PU-CTG pipeline (top four rows) vs. the full PU-CTG pipeline (last row).
Table 3.
Quantitative comparisons: removing each specific component from the full PU-CTG pipeline (top four rows) vs. the full PU-CTG pipeline (last row).
| CD (10) | HD (10) | |
|---|---|---|
| MEF | 0.30 | 4.21 |
| GRU | 0.29 | 4.50 |
| Hierarchical Upsampling | 0.29 | 4.76 |
| DCD | 0.26 | 4.71 |
| Full Pipeline | 0.24 | 3.45 |
Table 4.
Quantitative comparison on the point cloud with varying noise levels.
| Methods | Level = 0.005 | Level = 0.01 | Level = 0.015 | Level = 0.025 | ||||
|---|---|---|---|---|---|---|---|---|
| CD (10) | HD (10) | CD (10) | HD (10) | CD (10) | HD (10) | CD (10) | HD (10) | |
| PU-GAN | 1.13 | 7.48 | 1.33 | 9.76 | 1.64 | 12.29 | 2.23 | 20.45 |
| PU-CTG | 0.97 | 6.25 | 1.13 | 7.76 | 1.36 | 9.60 | 2.02 | 16.80 |
Disclaimer/Publisher’s Note: The statements, opinions and data contained in all publications are solely those of the individual author(s) and contributor(s) and not of MDPI and/or the editor(s). MDPI and/or the editor(s) disclaim responsibility for any injury to people or property resulting from any ideas, methods, instructions or products referred to in the content. |
© 2024 by the authors. Licensee MDPI, Basel, Switzerland. This article is an open access article distributed under the terms and conditions of the Creative Commons Attribution (CC BY) license (https://creativecommons.org/licenses/by/4.0/).
Share and Cite
MDPI and ACS Style
Li, T.; Lin, Y.; Cheng, B.; Ai, G.; Yang, J.; Fang, L. PU-CTG: A Point Cloud Upsampling Network Using Transformer Fusion and GRU Correction. Remote Sens. 2024, 16, 450. https://doi.org/10.3390/rs16030450
AMA Style
Li T, Lin Y, Cheng B, Ai G, Yang J, Fang L. PU-CTG: A Point Cloud Upsampling Network Using Transformer Fusion and GRU Correction. Remote Sensing. 2024; 16(3):450. https://doi.org/10.3390/rs16030450
Chicago/Turabian StyleLi, Tianyu, Yanghong Lin, Bo Cheng, Guo Ai, Jian Yang, and Li Fang. 2024. "PU-CTG: A Point Cloud Upsampling Network Using Transformer Fusion and GRU Correction" Remote Sensing 16, no. 3: 450. https://doi.org/10.3390/rs16030450
Note that from the first issue of 2016, this journal uses article numbers instead of page numbers. See further details here.