
Detection of Benggang in Remote Sensing Imagery through Integration of Segmentation Anything Model with Object-Based Classification
1
School of Geography and Planning, Sun Yat-sen University, Guangzhou 510006, China
2
College of Physics and Optoelectronic Engineering, Harbin Engineering University, Harbin 150001, China
3
Guangdong Research Institute of Water Resources and Hydropower, Guangzhou 510635, China
*
Author to whom correspondence should be addressed.
Remote Sens. 2024, 16(2), 428; https://doi.org/10.3390/rs16020428
Submission received: 30 November 2023
/
Revised: 9 January 2024
/
Accepted: 16 January 2024
/
Published: 22 January 2024
(This article belongs to the Special Issue Monitoring Land Use Efficiency and Urban Expansion within the Context of the UN 2030 Agenda for Sustainable Development)
Abstract
:Benggang is a type of erosion landform that commonly occurs in the southern regions of China, posing significant threats to local farmland and human safety. Object-based classification (OBC) can be applied with high-resolution (HR) remote sensing images for detecting Benggang areas on a large spatial scale, offering essential data for aiding in the remediation efforts for these areas. Nevertheless, traditional image segmentation methods may face challenges in accurately delineating Benggang areas. Consequently, the extraction of spatial and textural features from these areas can be susceptible to inaccuracies, potentially compromising the detection accuracy of Benggang areas. To address this issue, this study proposed a novel approach that integrates Segment Anything Model (SAM) and OBC for Benggang detection. The SAM was used to segment HR remote sensing imagery to delineate the boundaries of Benggang areas. After that, the OBC was employed to identify Benggang areas based on spectral, geometrical, and textural features. In comparison to traditional pixel-based classification using the random forest classifier (RFC-PBC) and OBC based on the multi-resolution segmentation (MRS-OBC), the proposed SAM-OBC exhibited superior performance, achieving a detection accuracy of 85.46%, a false alarm rate of 2.19%, and an overall accuracy of 96.48%. The feature importance analysis conducted with random forests highlighted the GLDV Entropy, GLDV Angular Second Moment (ASM), and GLCM ASM as the most pivotal features for the identification of Benggang areas. Due to its inability to extract and utilize these textural features, the PBC yielded suboptimal results compared to both the SAM-OBC and MRS-OBC. In contrast to the MRS, the SAM demonstrated superior capabilities in the precise delineation of Benggang areas, ensuring the extraction of accurate textural and spatial features. As a result, the SAM-OBC significantly enhanced detection accuracy by 34.12% and reduced the false alarm rate by 2.06% compared to the MRS-OBC. The results indicate that the SAM-OBC performs well in Benggang detection, holding significant implications for the monitoring and remediation of Benggang areas.
1. Introduction
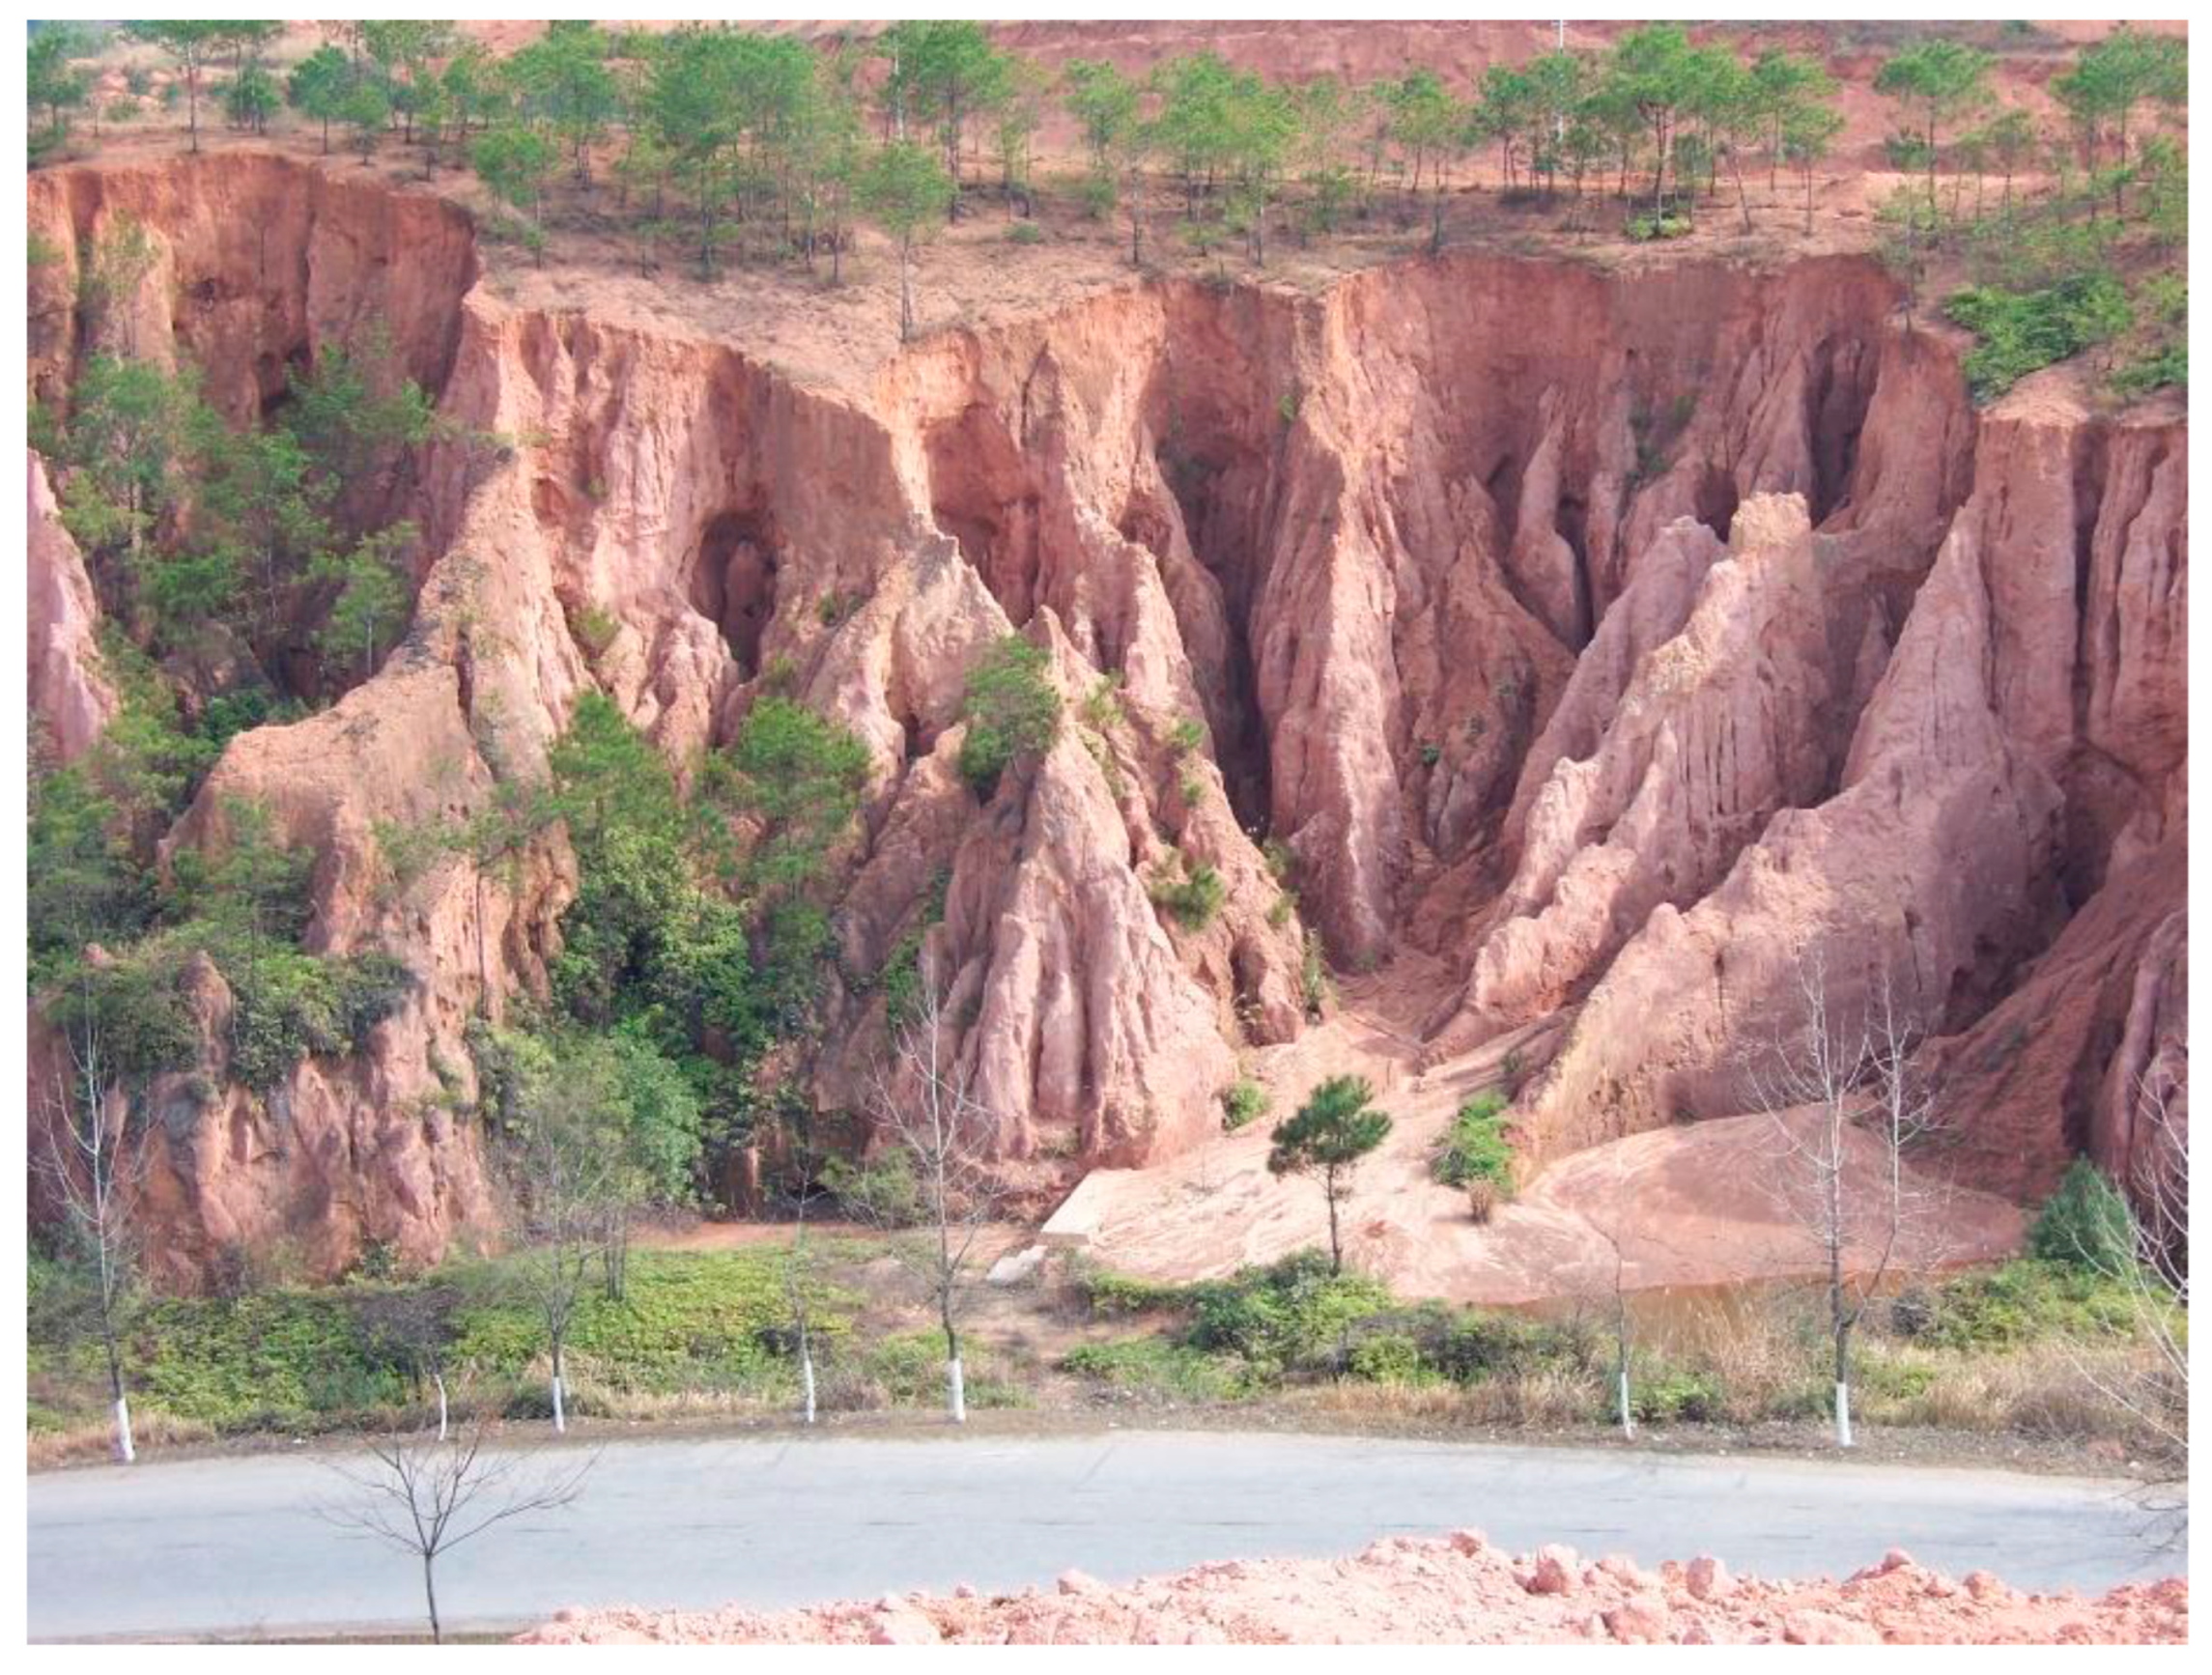
Benggang (Figure 1), a special type of erosion landform caused by surface currency and gravity, is prevalent in the southern regions of China and has been often referred to as an “ecological ulcer” [1]. There are some similar erosion landforms, such as “Calanchi” in Italy, “Crumbling” in Japan, and “Lavaka” in Madagascar in southern Africa [2]. Although these landforms are not completely consistent with Benggang in the material conditions and development mechanisms [3], this water-driven soil erosion poses a serious threat to global land degradation [4]. Fine particles in the accumulated material within Benggang areas are susceptible to runoff erosion during precipitation [5,6]. Consequently, Benggang is at risk of collapse during heavy rainfall, leading to significant harm to both personnel and land resources. The Chinese government has placed significant emphasis on the prevention and control of Benggang erosion. The notice issued by the Office of the Ministry of Water Resources of China in 2021 concerning the implementation plan for soil and water conservation during the “14th Five-Year Plan” period explicitly underscores the establishment of a prevention belt in the southern mountainous and hilly areas [7]. This strategy places a particular emphasis on the control of Benggang and the comprehensive management of soil erosion in small watersheds [8].
The identification of Benggang areas is the primary task in preventing and controlling Benggang, as well as mitigating its associated ecological and environmental issues. While there is a substantial body of research focused on on-site measurements using technologies such as 3D laser scanning and Real-Time Kinematic (RTK) positioning systems [10,11,12,13,14], the number of studies employing remote sensing methods for large-scale monitoring of these collapses is significantly fewer in comparison. Traditional Benggang survey techniques primarily involve manual surveys, which are straightforward but time-consuming and resource-intensive, making them unsuitable for long-term monitoring [15,16]. Remote sensing techniques can repetitively monitor land surfaces at a large spatial scale, holding great potential for detecting Benggang areas. Many researchers have investigated the capability of remotely sensed images for the detection of Benggang area [17,18,19,20]. These investigations collectively demonstrate that high-resolution (HR) images acquired by satellites and unmanned aerial vehicles (UAVs) offer an abundance of spatial details, enabling accurate identification of Benggang areas [21].
Traditional methods for Benggang detection in HR images rely on visual interpretation [17,18,22,23]. While this approach can yield high accuracy, it is extremely time-consuming and labor-intensive, presenting significant challenges for large-scale Benggang detection. In response to the challenges posed by visual interpretation, automatic classification techniques have been applied to automate the identification of Benggang areas in HR images [22]. Nevertheless, these classifiers were usually operated at a pixel level, suffering from the salt-and-pepper noise [24], and solely relying on the spectral information of HR images. Due to the analogous spectral features shared between Benggang areas and other land cover types such as barren land, harvested farmland, and mining zones, pixel-based classification (PBC) is highly likely to encounter challenges in effectively discriminating Benggang from these land cover categories [25].
To tackle the problems of PBC, object-based classification (OBC) has been used to detect Benggang areas [22]. Typical Benggang systems generally consist of five parts [26], which are, from top to bottom: upper catchment, collapsing wall, colluvial deposit, scour channel, and alluvial fans. Among these, the collapsing wall is the most active part of mass movements, characterized by a concentrated distribution of severe slides, collapses, and slumps. The scour channel, on the other hand, is the site for transporting sediments and runoff erosion [27]. Due to their dynamic factors and physical properties, these two areas exhibit distinct gully shapes [28], and the deeper the main gully, the more high-angle joints there are along the same trend [29]. This results in collapsing gullies displaying distinct textural features in remote sensing images, which is a key feature that aids in their identification in high-resolution images [30].
Leveraging OBC allows for the extraction and utilization of textural and spatial features, which can yield superior results compared to pixel-based approaches [25]. However, accurately delineating an entire Benggang area as a single image object remains a significant challenge, restricting the extraction of accurate textural information. Commonly used image segmentation methods such as multi-resolution segmentation (MRS) frequently produce fragmented segmentation results to delineate accurate boundaries of land parcels [31]. This inadvertent division of Benggang areas into multiple objects undermines the comprehensiveness and accuracy of textural information, ultimately constraining the accuracy of Benggang area detection.
Recently, META AI. introduced a cutting-edge model known as the Segment Anything Model (SAM) [32]. The SAM stands out as a state-of-the-art solution, showcasing its ability to effectively segment individual objects from their background while also demonstrating zero-shot generalization capabilities. Despite the absence of remote sensing images in its training dataset, the SAM has demonstrated remarkable performance in the segmentation of remote sensing imagery [33]. The SAM has been applied in several remote sensing applications, including an improvement in the Cropland Data Layer by applying Sentinel-2 data [34], universal crater detection [35], etc. Therefore, SAM holds immense potential for achieving precise Benggang area delineation without necessitating additional specialized training, which can be the most time-consuming part of traditional methods to extract Benggang [36]. The objective of this study was to propose a novel approach that combines the SAM with OBC to detect Benggang areas in HR images.
2. Study Area and Data
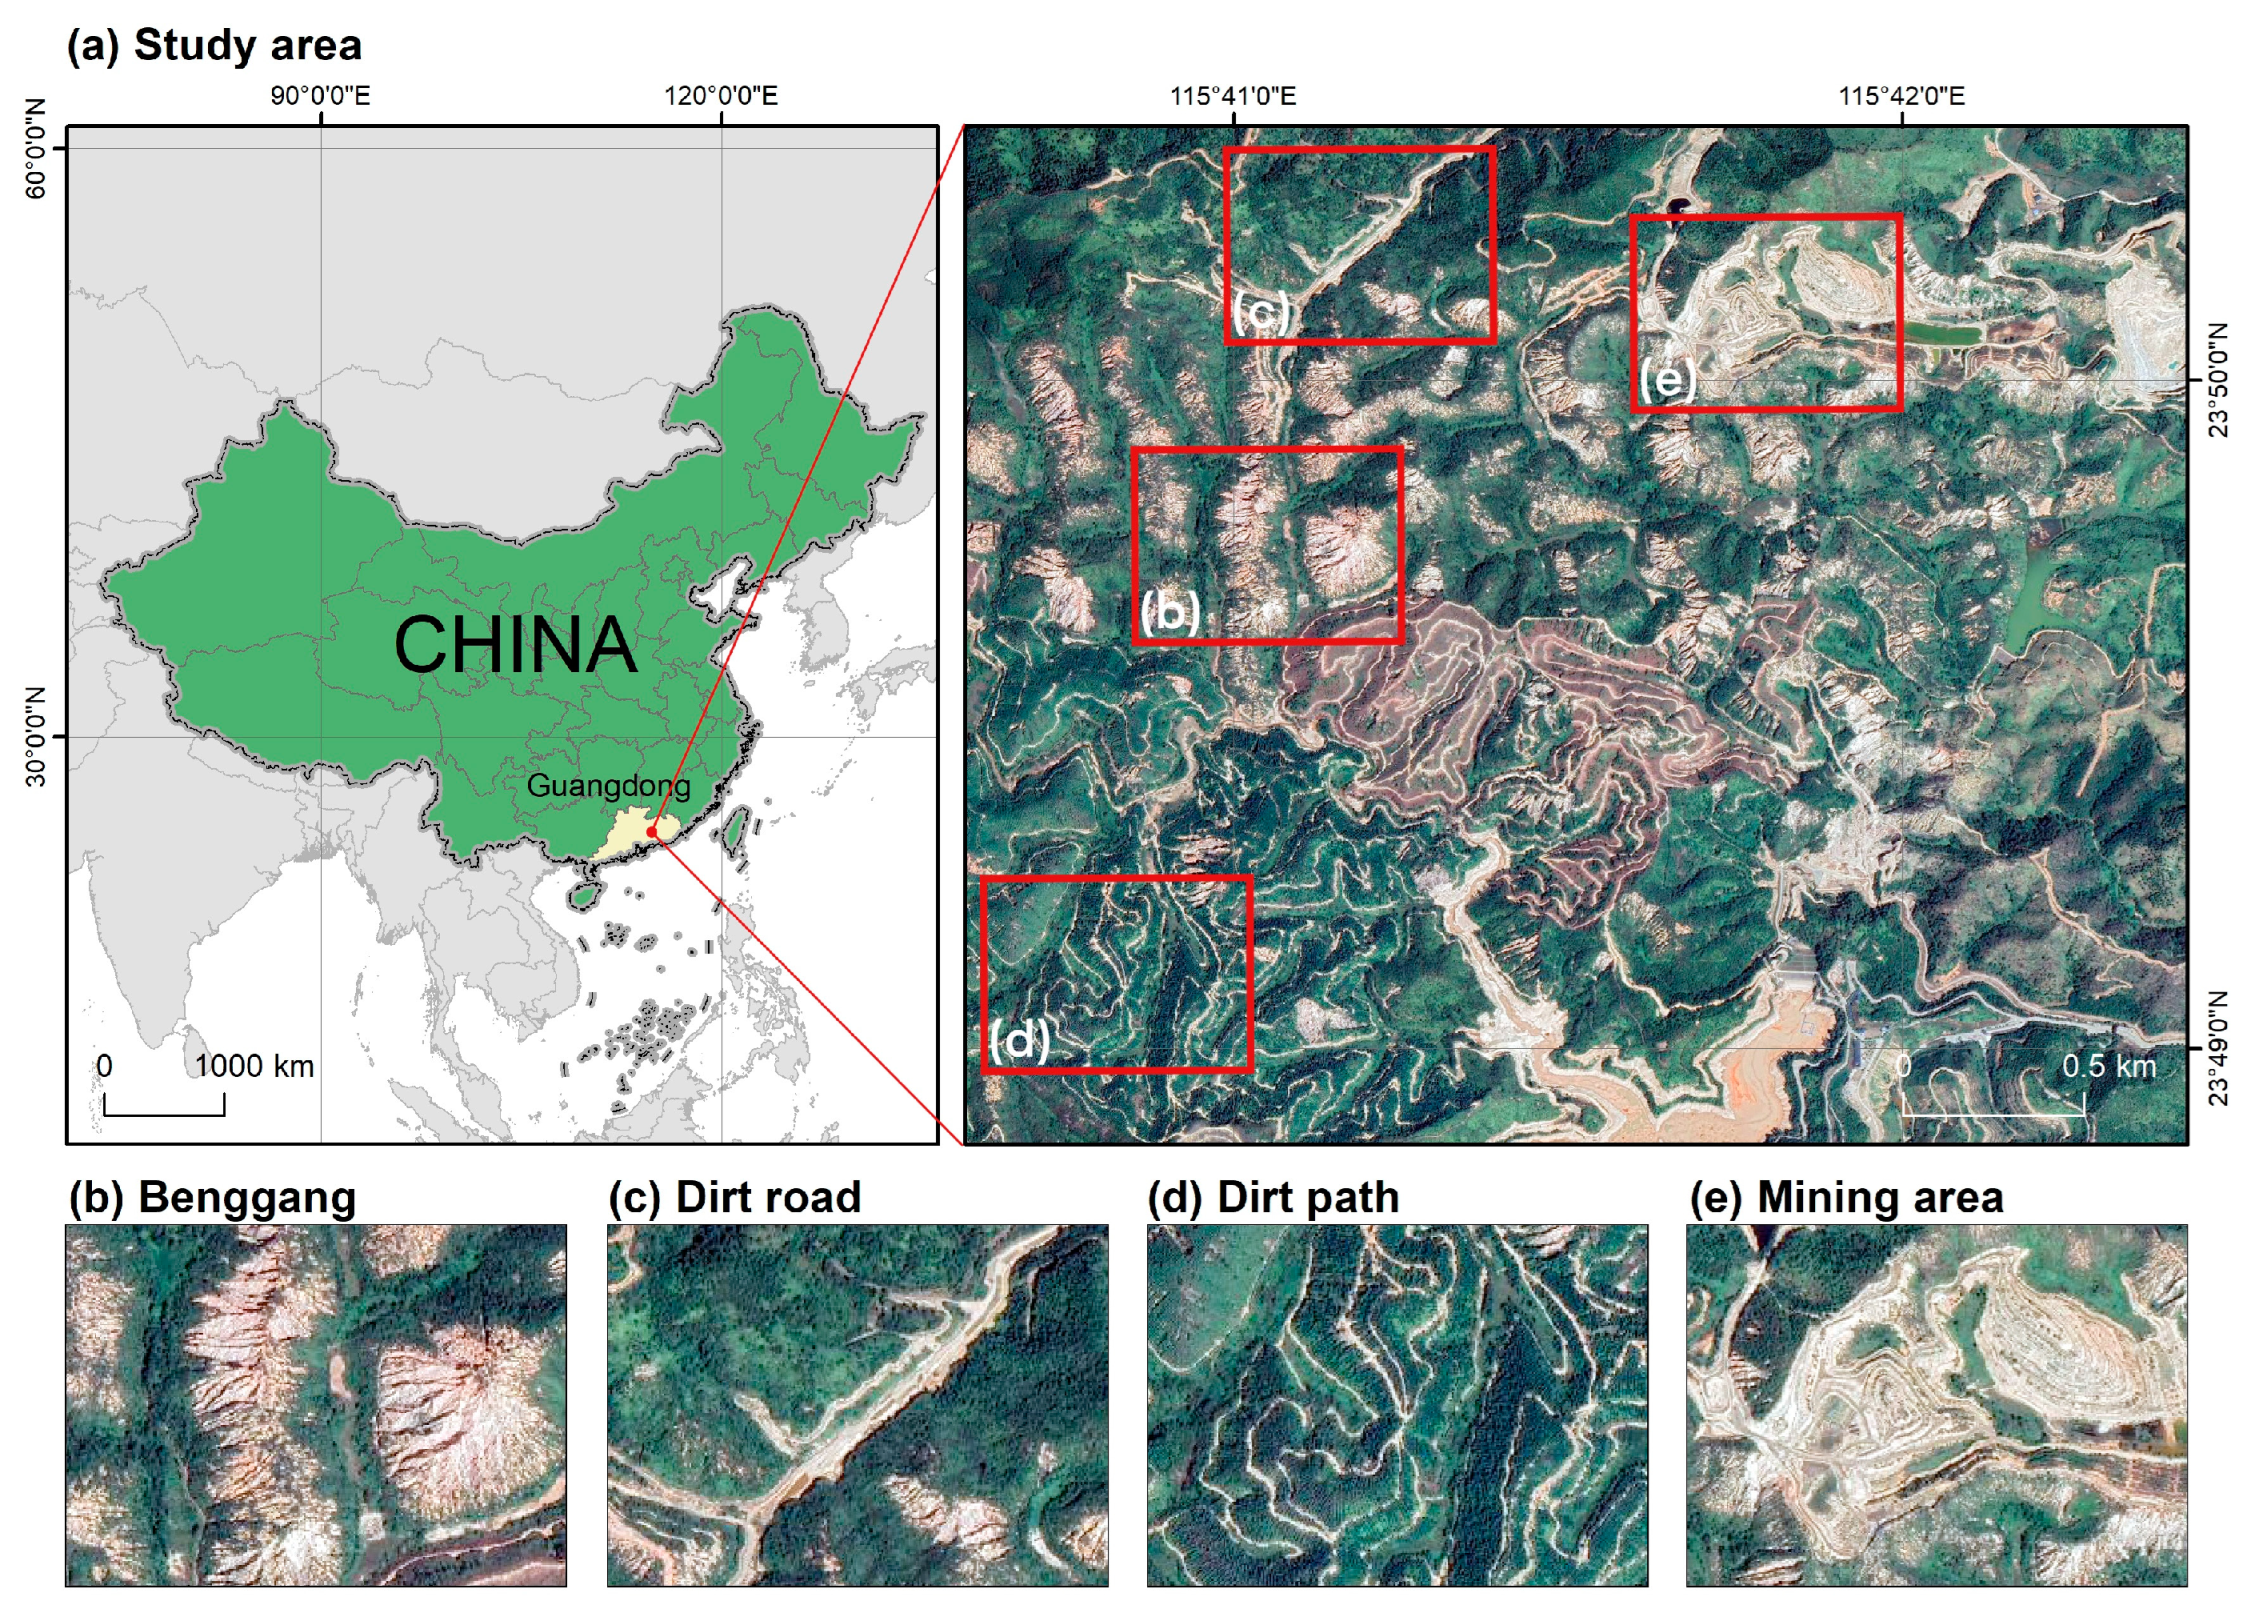
The study area is Wuhua County, which is located in Meizhou City, Guangdong Province, China. Guangdong province hosts a significant number of Benggang sites, totaling 107,900, covering 82,760 hectares, which represents 53.6% of all Benggang sites in the southern China red soil region [37,38]. In this region, Wuhua County stands out as a classical Benggang distribution area, the severity of Benggang erosion of which is extremely rare in the southern region and even in the entire country [39]. The climate in this area is a subtropical maritime monsoon climate, with an average annual temperature of 20.5 °C and an average annual precipitation of 1496.5 mm, providing favorable climatic conditions for Benggang development. The granite weathering crust is thick, ranging from 40 to 60 m in thickness, and is densely distributed, providing ample material basis for Benggang development [40]. Additionally, this area is characterized by hills below 500 m in altitude, with a widespread distribution of red soil [41]. Human activities are frequent in this area, leading to intensive Benggang development and severe soil erosion. The area affected by Benggang erosion is 190 km2, with a total of 22,117 Benggangs, among which 38% of the Benggangs have a depth and width of more than 10 m, with a Benggang density of approximately 116 per km2, making it one of the most densely distributed areas of Benggang in southern China [42].
A HR satellite imagery from Google Maps, captured on 20 October 2022, was obtained showing the concentrated distribution of Benggang in Wuhua County (Figure 2). The data source is Image 2023 CNES/Airbus, with a spatial resolution of 2.18 m, featuring RGB three spectral bands. There are also a certain number of mining areas, bare land, dirt roads, and high soil content water with similar spectral information to Benggang included in the image, making it an ideal area for developing and testing Benggang detection methods.
3. Methodology
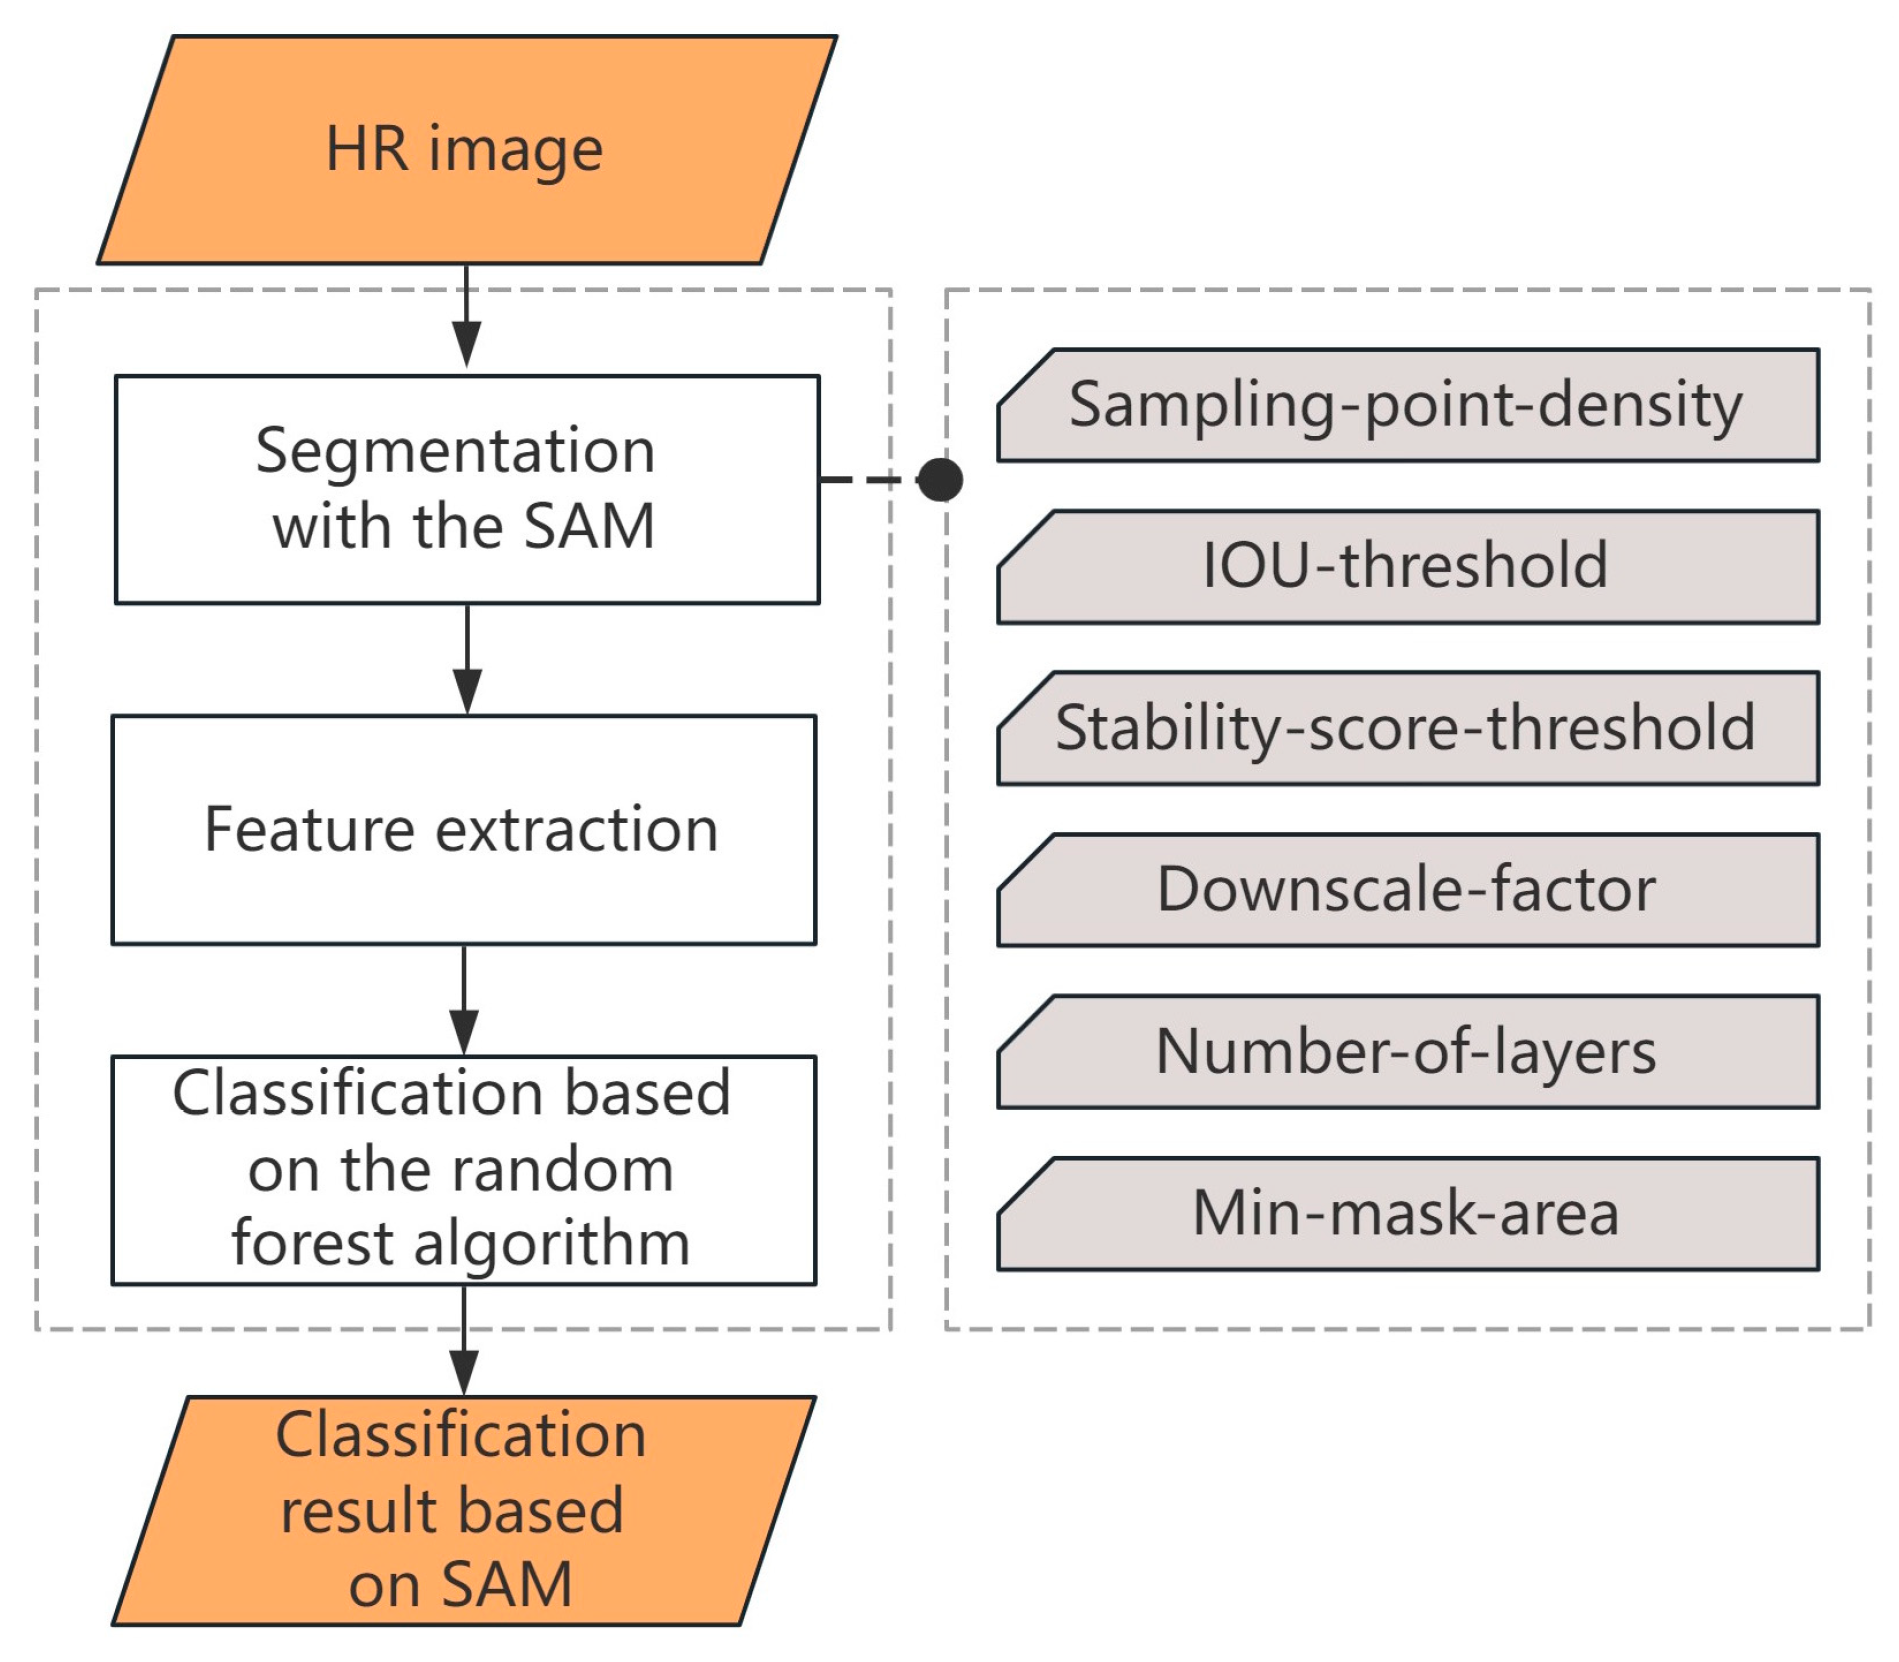
A new approach that integrates the SAM and OBC was proposed for detecting Benggang areas in HR images. The proposed approach consists of three main parts (Figure 3): image segmentation, feature extraction, and classifications based on random forests. Firstly, in the segmentation stage, the images were imported into the SAM, and six parameters were adjusted to achieve the best segmentation results while preserving the integrity of the Benggang objects as much as possible. Secondly, the segmentation results yielded by the SAM were converted to vector polygon format and for image segmentation in eCognition software (Version 9.0.1; Build 2543 × 64) [43], which is commonly used to conduct OBC [44]. A variety of textural, geometrical, and spectral features were extracted using the eCognition software from all the image objects. Finally, these features were then input into a random forest classifier to develop binary classification, resulting in Benggang detection results.
3.1. Image Segmentation Using the SAM
The architecture of SAM mainly consists of three parts [32]. The first part is the image encoder, which is used to compute image embeddings. Masked Autoencoders are employed in this part, pre-trained with Vision Transformer, to handle HR inputs minimally. The second part is the prompt encoder, responsible for computing prompt embeddings. Lastly, the mask decoder is utilized for real-time mask prediction. The mask decoder effectively maps image embeddings, prompt embeddings, and output tokens to masks.
There are two optional modes of this model. The first mode is interactive segmentation, which allows users to input bounding boxes, points, or text prompts to perform segmentation. It differs from the sample selection in eCognition classification, where selecting a certain number of samples can divide all objects of that category. In interactive segmentation, only the specified object is segmented, without segmenting other objects of the same category. Therefore, when dealing with large amounts of data and numerous objects in remote sensing images, the interactive supervised method is not suitable for segmentation. The second mode is fully automatic segmentation, where the model performs segmentation on all identified objects in the entire image after setting the given six parameters to reasonable values. In the experiments, the parameters were iteratively adjusted to their optimal values using variable step size (Table 1). If the optimal parameter values yielded results like the default values, the default values were preferred.
The sampling point density was tested with a step of 20, ranging from 100 to 500 in 21 different results. The more sampling points used, the denser and more detailed the segmented masks became, but the computation time increased. In the experiment, when the value was less than 300, a significant number of details were lost. The range between 300 and 400 showed good results, with minor differences in segmentation between adjacent images. When the sampling point density reached 360, the saturation point was basically achieved. Therefore, a value of 360 was chosen for subsequent experiments. The IOU threshold was tested with a step of 0.05, ranging from 0.50 to 1.00 in 10 different results. Prior to 0.85, there were many fragmented and inaccurate masks. At a threshold of 0.90, many valid masks were already lost, while a threshold of 0.85 retained a few invalid masks. By decreasing the step size to 0.01 and experimenting between 0.85 and 0.9, the best results were observed at 0.86 and 0.87, with a loss of valid masks starting at 0.88. Therefore, a default value of 0.86 was chosen for the next experiments. The stability score threshold was tested with a step of 0.05, ranging from 0.50 to 1.00 in 10 different results. As the stability score threshold increased, the overall size of the masks decreased. When it reached 1.00, only a few small area masks were left. Results before 0.85 had poorly fitting mask boundaries, while good performance was observed between 0.9 and 0.95. By decreasing the step size to 0.01 and experimenting between 0.9 and 0.95, a value of 0.92 was chosen for subsequent experiments. The number of layers was set to 1 in this study. This parameter was used to store segmented results at different scales. However, since only one layer of precise segmentation of rockfall boundaries was needed, this parameter was set to 1 and no further optimization was performed. The default value of the downscale factor was 2. Values of 1 and 4 were also tested, but no significant effects were observed. Therefore, the default value of 2 was used. The minimum mask region area was tested with a step of 10, ranging from 0 to 450. When the minimum area was set to 0, masks were not discarded due to fragmentation, resulting in a large number of invalid masks with fragmented edges. When the minimum mask area was set to 300, some smaller rockfall areas were already classified as background and could not be segmented. This phenomenon became even more severe at an area of 400. Based on the characteristics of this image, a balance between the number of fragmented masks and the number of undetected objects, a value of 200 was chosen for the subsequent experimental group. Finally, the optimal segmentation parameters were determined through iterative optimization and visual interpretation (Table 1).
The SAM experiment was conducted on a remote server GPU with the following operating environment: Driver Version: 470.94, CUDA Version: 11.4, Python: 3.8.16, PyTorch: 1.7, torchvision: 0.8. The input data was the HR satellite imagery, and the output result was a dictionary containing mask information, including the region and ID of each mask. The segmentation result could be directly viewed using the plot function in PyCharm. To segment Benggang area in eCognition, the dictionary was outputted as a raster file. Each mask had independent pixel values, with a background value of zero. In ArcGIS, the raster image was georeferenced with the satellite imagery to ensure pixel alignment and converted to vector polygons for easier import and further classification in eCognition.
3.2. Feature Extraction
To obtain SAM-based segmentation result, the vector polygons file was imported into eCognition as a thematic layer to conduct chessboard segmentation on the HR image. Based on the objects segmented, we selected 3 types of features from 11 major categories: spectral features, geometrical features, and textural features, totaling 42 kinds of ones. Spectral features are primarily used to distinguish bare soil (such as landslides, dirt roads, mining areas, etc.) from other types of land surface (vegetation, water bodies, impermeable surfaces, etc.); textural and geometrical features are then utilized to differentiate Benggang from other types of bare land. These features were the inherent parameters of eCognition and are briefly listed as follows:
- 8 (3 bands × 2 + 2) features related to the spectrum (e.g., Mean of each layer, Standard Deviation of each layer and Max. Diff.);
- 22 features related to geometry (e.g., area, border, length, and shape index);
- 12 features related to texture (e.g., gray level co-occurrence matrix (GLCM) Homogeneity, GLCM Contrast, gray-level difference vector (GLDV) Entropy, GLDV Mean).
For a complete list of the features, please refer to Appendix A.
3.3. Benggang Identification Using the Random Forest Algorithm
Random Forest (RF) is a decision tree ensemble model that has high interpretability and reliability. It is constructed by randomly selecting feature sets and using training data bootstrapping [45]. RF has been applied in land cover classification using multispectral and hyperspectral remote sensing data. Compared to individual decision trees, RF is relatively stable when dealing with insufficient training data and noise. Moreover, the variables identified as most important for classification by RF are consistent with expectations [46].
In eCognition, Benggang object samples and non-Benggang object samples (including bare soil, mines, roads, farmland, forests, grasslands, and water bodies) were selected. For specific quantities, please refer to Table 2. Features of all sample objects were calculated and extracted. Then, the random forest classifier was used, and features including 8 spectral-related, 22 geometry-related and 12 texture-related ones were used for training the classifier and classifying the segmentation results.
4. Results
4.1. Benggang Detection Results Obtained with the Proposed Method
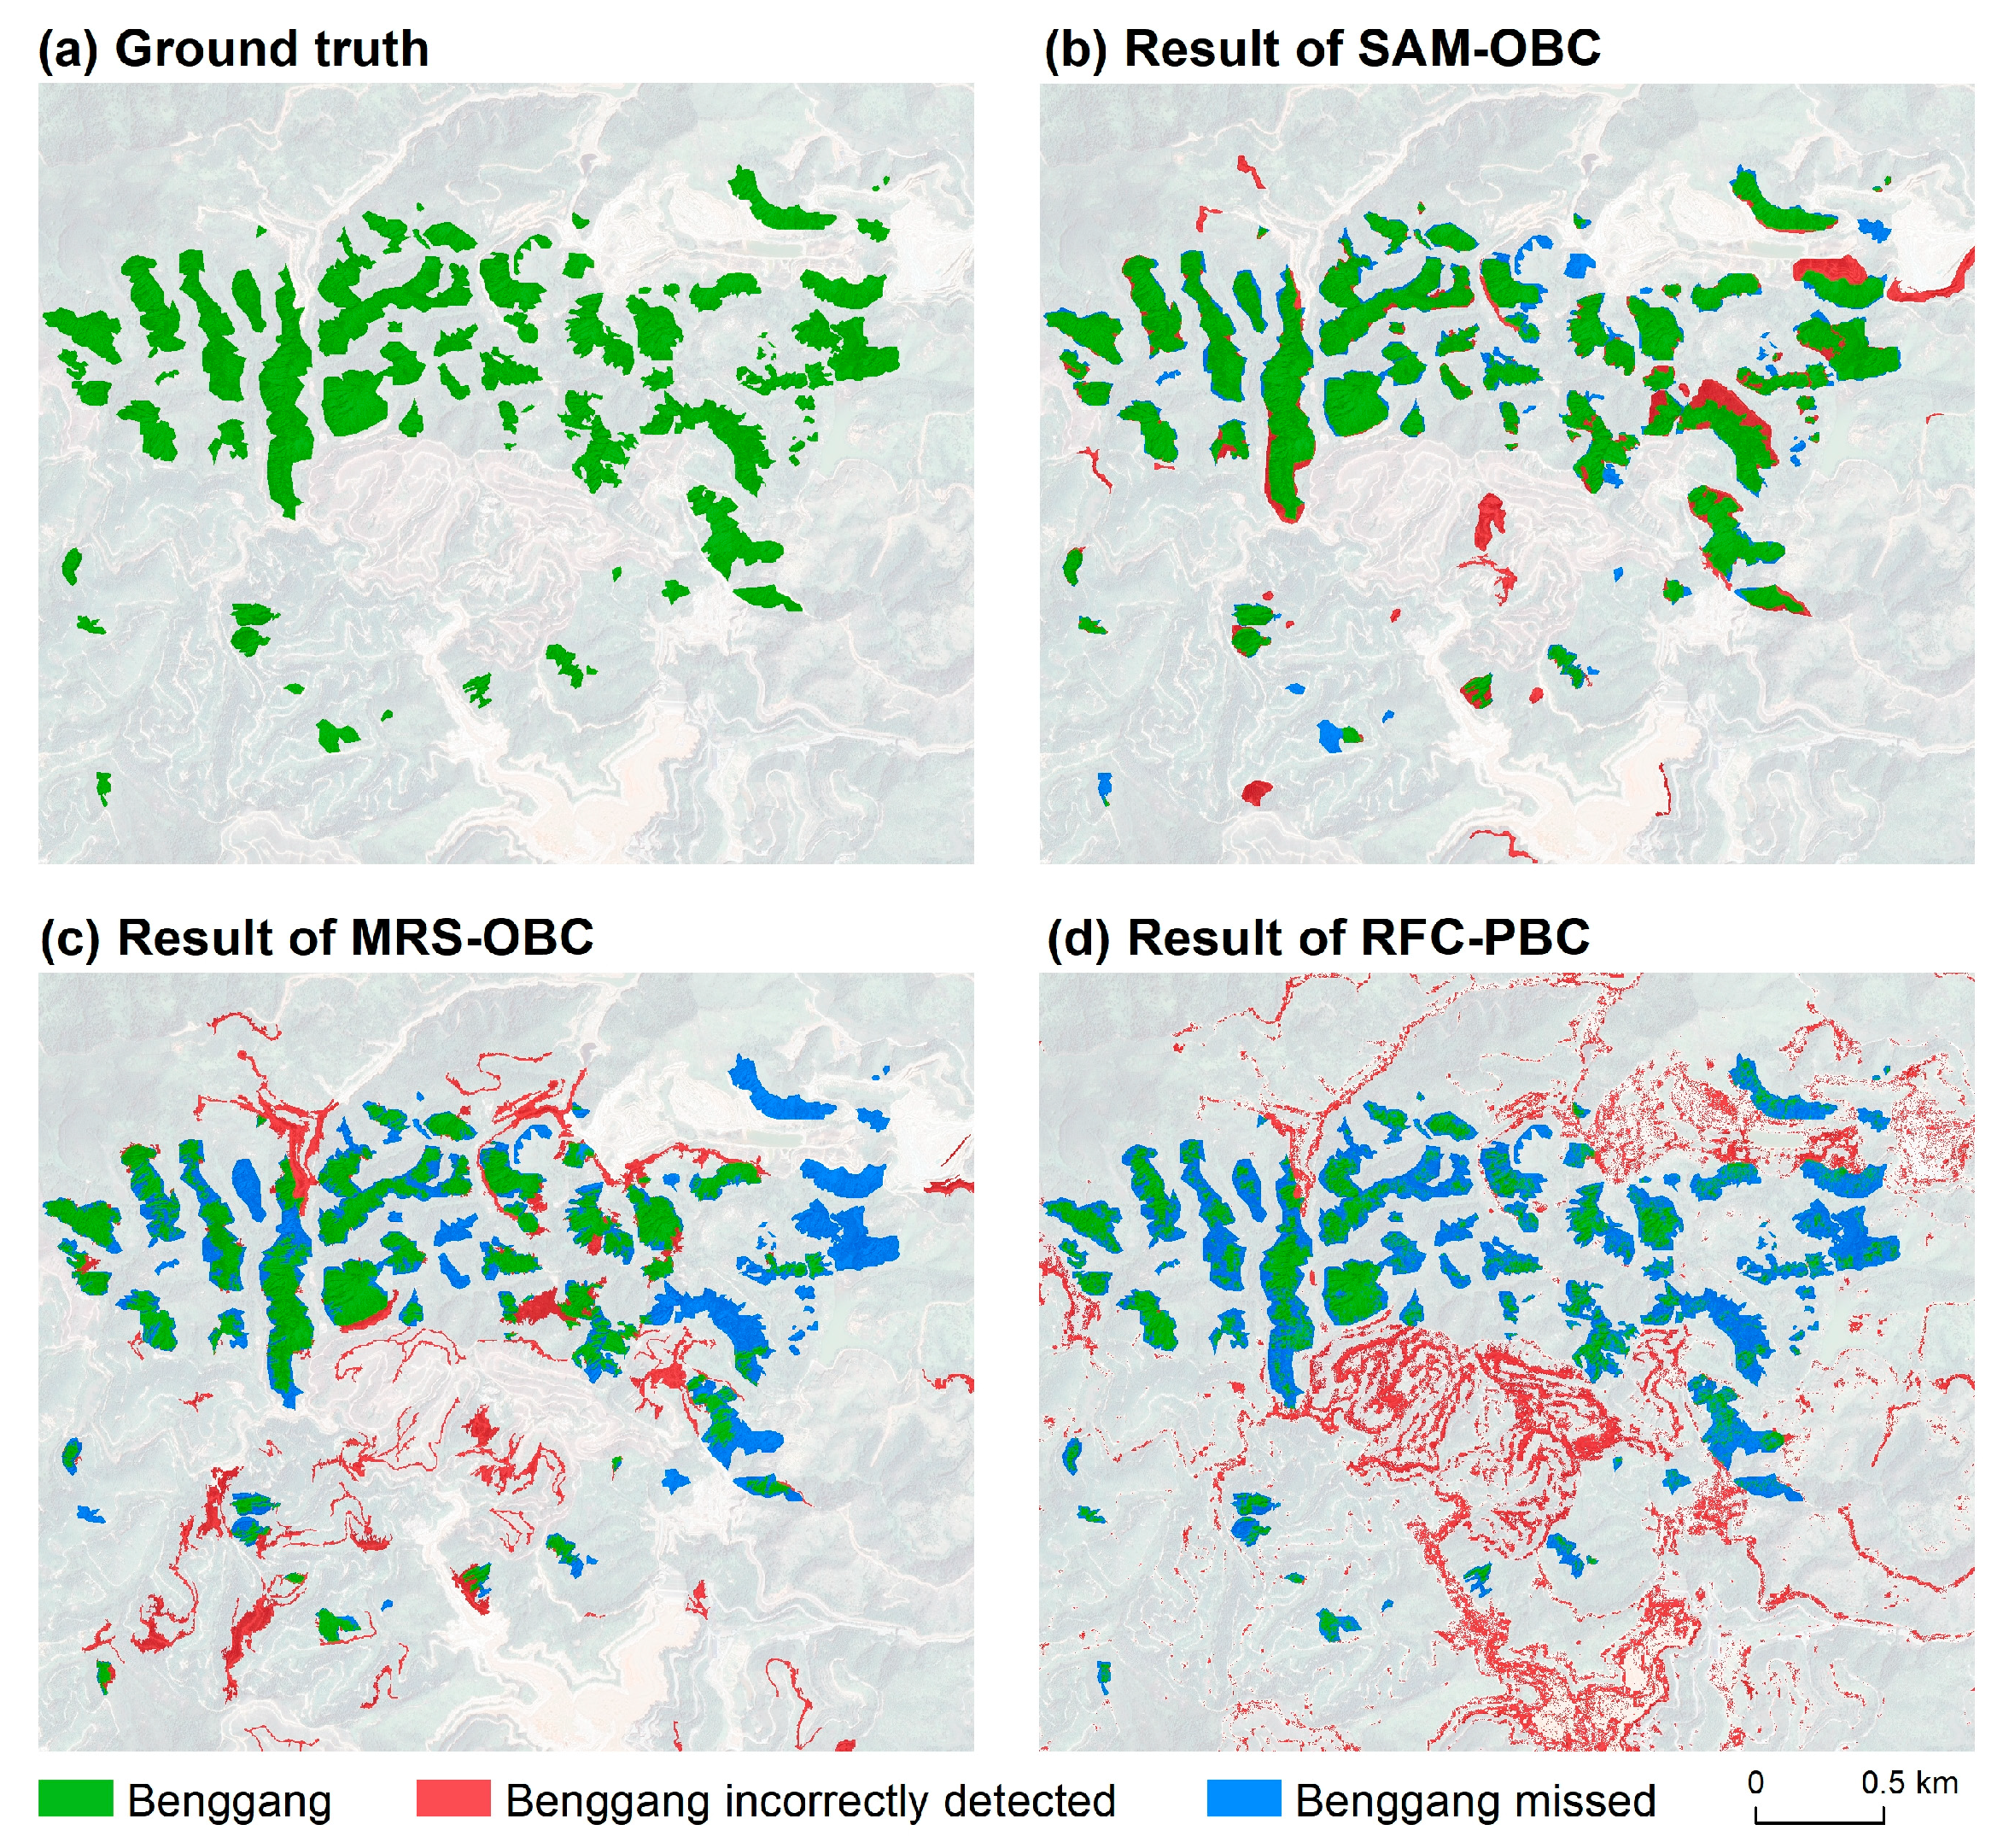
To assess the accuracy of Benggang detection, we generated a binary image as the ground truth (Figure 4a). This image was generated through visual interpretation and manual delineation, aiming to align the boundary of the Benggang areas as closely as possible to the actual surface collapse edges. The delineation process aimed for the most refined Benggang outlines to achieve the most rigorous accuracy evaluation results.
Benggang areas detected with the proposed method are shown in Figure 4b. The classification results were compared with the ground truth, and a confusion matrix was generated to calculate detection accuracy, false alarm rate, and overall accuracy. The detection accuracy measures the proportion of correctly identified positive instances in a dataset. It represents how well a model can identify the positive cases correctly. The false alarm rate measures the proportion of negative instances that are incorrectly classified as positive. It indicates the rate at which false positives occur. The overall accuracy is a general measure that calculates the proportion of correctly classified instances, both positive and negative, in a dataset. It represents the overall correctness of a classification model. In addition, the Kappa coefficient was also calculated to measure the agreement between predicted and actual values in Benggang detection results. The results produced by the SAM-OBC achieved 85.46% detection accuracy, a false alarm rate of only 2.19%, an overall accuracy of 96.48%, and a Kappa coefficient of 0.82 (Table 3).
4.2. Comparison between the Proposed Method with Other Commonly Used Methods
The proposed SAM-OBC was compared with two commonly used methods: the OBC based on MRS (MRS-OBC) and the PBC based on random forest classifier (RFC-PBC). In the MRS-OBC, the image segmentation was performed using the MRS, in which three parameters (scale parameter, shape, and compactness) were adjusted to ensure the best segmentation results of the MRS as well. The MRS is one of the most popular segmentation algorithms, which is performed by analogy with segmentation evaluation [47]. The MRS has three adjustable parameters: scale parameter, shape, and compactness. The scale parameter controls the size of the segmentation objects. The choice of this parameter, in relation to the size of the study area, affects the accuracy of the segmentation results [48]. In this study, we tried different scale values between 100 and 400 with a step size of 50 and found that a scale value of 200 produced the most reasonable object sizes. The shape parameter is used to adjust the weighting of shape and pixel values. A higher shape value assigns more weight to the shape and less weight to pixel values. We set the default value for shape as 0.1 to achieve the best segmentation differentiating bare land, including Benggang, from non-bare land. The compactness parameter is used to adjust the degree of shape fragmentation in the segmentation results. A larger value produces more complete shapes, while a smaller value produces more fragmented shapes. We experimented with 9 values for compactness, ranging from 0.1 to 0.9 with a step size of 0.1, and found that a value of 0.5 resulted in the best segmentation of Benggang. We used the Random Forest model to perform classification for all three methods. For the two OBC methods, we employed the RFC in eCognition on the scale of objects, while for the PBC method, we used the RFC tool in ENVI on the scale of pixels [49].
The results of the three methods (i.e., RFC-PBC, MRS-OBC, and SAM-OBC) are presented in Figure 4. The SAM-OBC exhibited a close resemblance to the ground truth (Figure 4b), with a few small Benggang areas being missed while most misclassifications were due to slight misalignments between the detected Benggang edges and the actual boundaries. In contrast, the results from the other two methods were notably inferior. The MRS-OBC achieved a detection accuracy of only 51.34%, with numerous Benggang areas being missed, including some large ones. Despite correctly identifying most dirt roads, dirt paths, and mining areas with similar spectral features to Benggang, a considerable number of false positives were observed, leading to a false alarm rate of 4.25%. The result of RFC-PBC suffered from a serious “salt and pepper” effect, as shown in Figure 4d, resulting in a detection accuracy of only 36.83%. Most instances of missed detection were attributed to sparse vegetation interference within the Benggang areas, where pixels along the Benggang edges were misclassified as non-Benggang. However, nearly all land parcels (e.g., bare land, mining area, dirt path, and water bodies with high soil content) with spectral characteristics like Benggang were misclassified as Benggang, resulting in a false alarm rate of 8.84%.
4.3. Importance of Features Used in Classification
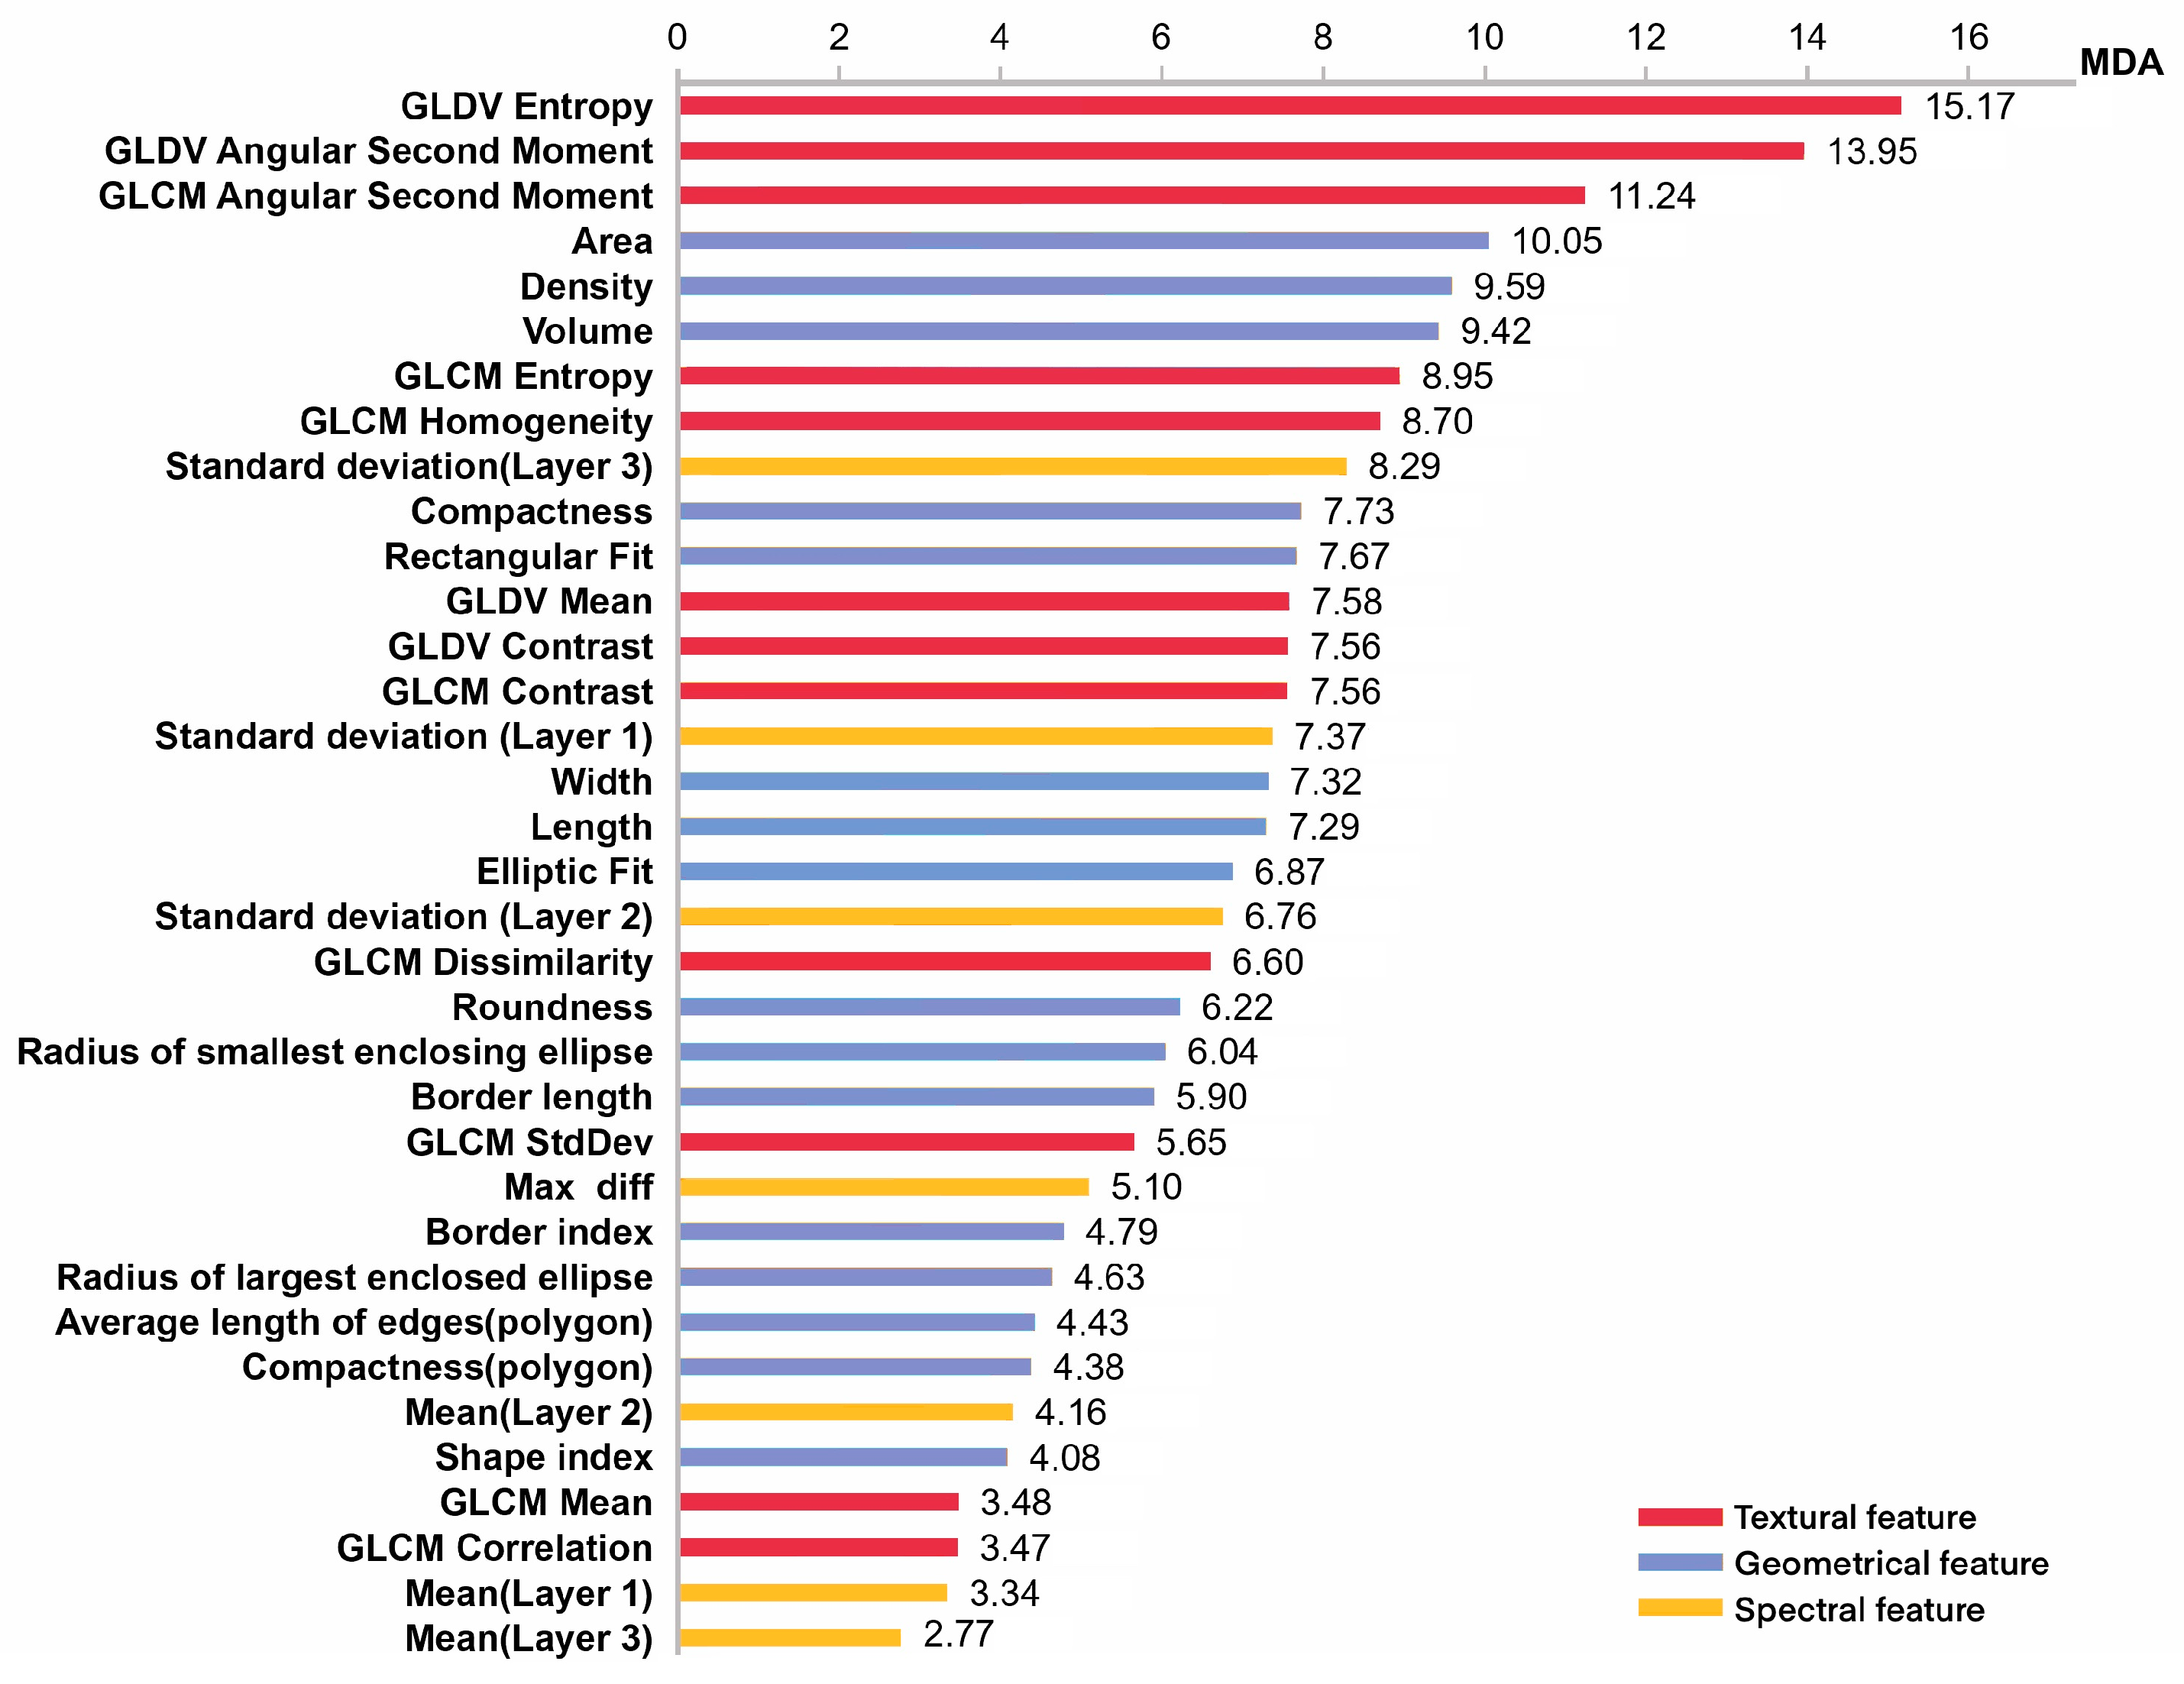
To reveal the contribution of the various features to the Benggang detection, the feature importance was evaluated using RF which provides variable importance measures related to the ensemble tree structure and offers stable variable ranking using a voting strategy [50]. The importance of features used in classification was calculated using the RF module in the R language, and it was evaluated based on mean decrease accuracy (MDA) provided by the model. This metric measures the importance of features by averaging the decrease in prediction accuracy when the features are permuted. A higher MDA value indicates that the feature plays a significant role in improving the model performance. If permuting a feature leads to a significant decrease in the model’s prediction accuracy, it suggests that the feature is important for accurate predictions. This metric provides rankings of feature importance in the RF, which can be applied to identify the features that contribute the most to model performance and select the most relevant features for further classification tasks.
To evaluate the importance of different features in classification and verify the significance of texture as a feature for classification, we selected some Benggang samples in ground truth, generated by visual interpretation and manual delineation, and extracted their features. The RF was used to calculate their MDA. In the MDA top 35 feature ranking chart (Figure 5) output by the RF, there were 12 textural features, 16 geometrical features, and 7 spectral features. Among them, the top three features were all textural features, two of which were the GLDV features under the eCognition texture after haralick directory, and the other one was GLCM features.
GLDV is a feature descriptor vector obtained through statistical calculations on the gray-level co-occurrence matrix (GLCM). GLCM is a statistical tool used to describe the relationship between different pixel gray levels in an image. It captures the spatial relationship between gray levels by calculating the frequency of occurrence of pixel pairs with specific gray-level differences [51]. Each element in GLCM represents the frequency of occurrence of pixel pairs with a specific gray-level difference. Although GLCM provides information about the direction, spacing, and magnitude of changes in image gray levels, it does not directly provide distinctive texture characteristics. Therefore, statistical properties are extracted from the gray-level co-occurrence matrix to quantitatively describe textural features. Haralick defined 14 textural features [51], including Entropy and Angular Second Moment (ASM).
The features we used were calculated in eCognition, in which the GLCM and GLDV were calculated based on the pixels of an object and were computed for each input layer. The calculation formula and the interpretation of its parameters are as follows:
- i is the row number;
- j is the column number;
- Pi,j is the normalized value in the cell i, j;
- N is the number of rows or columns;
- Vk is the image object level, k = 1,…n.
4.4. Contribution of Textural and Geometrical Features in Benggang Detection
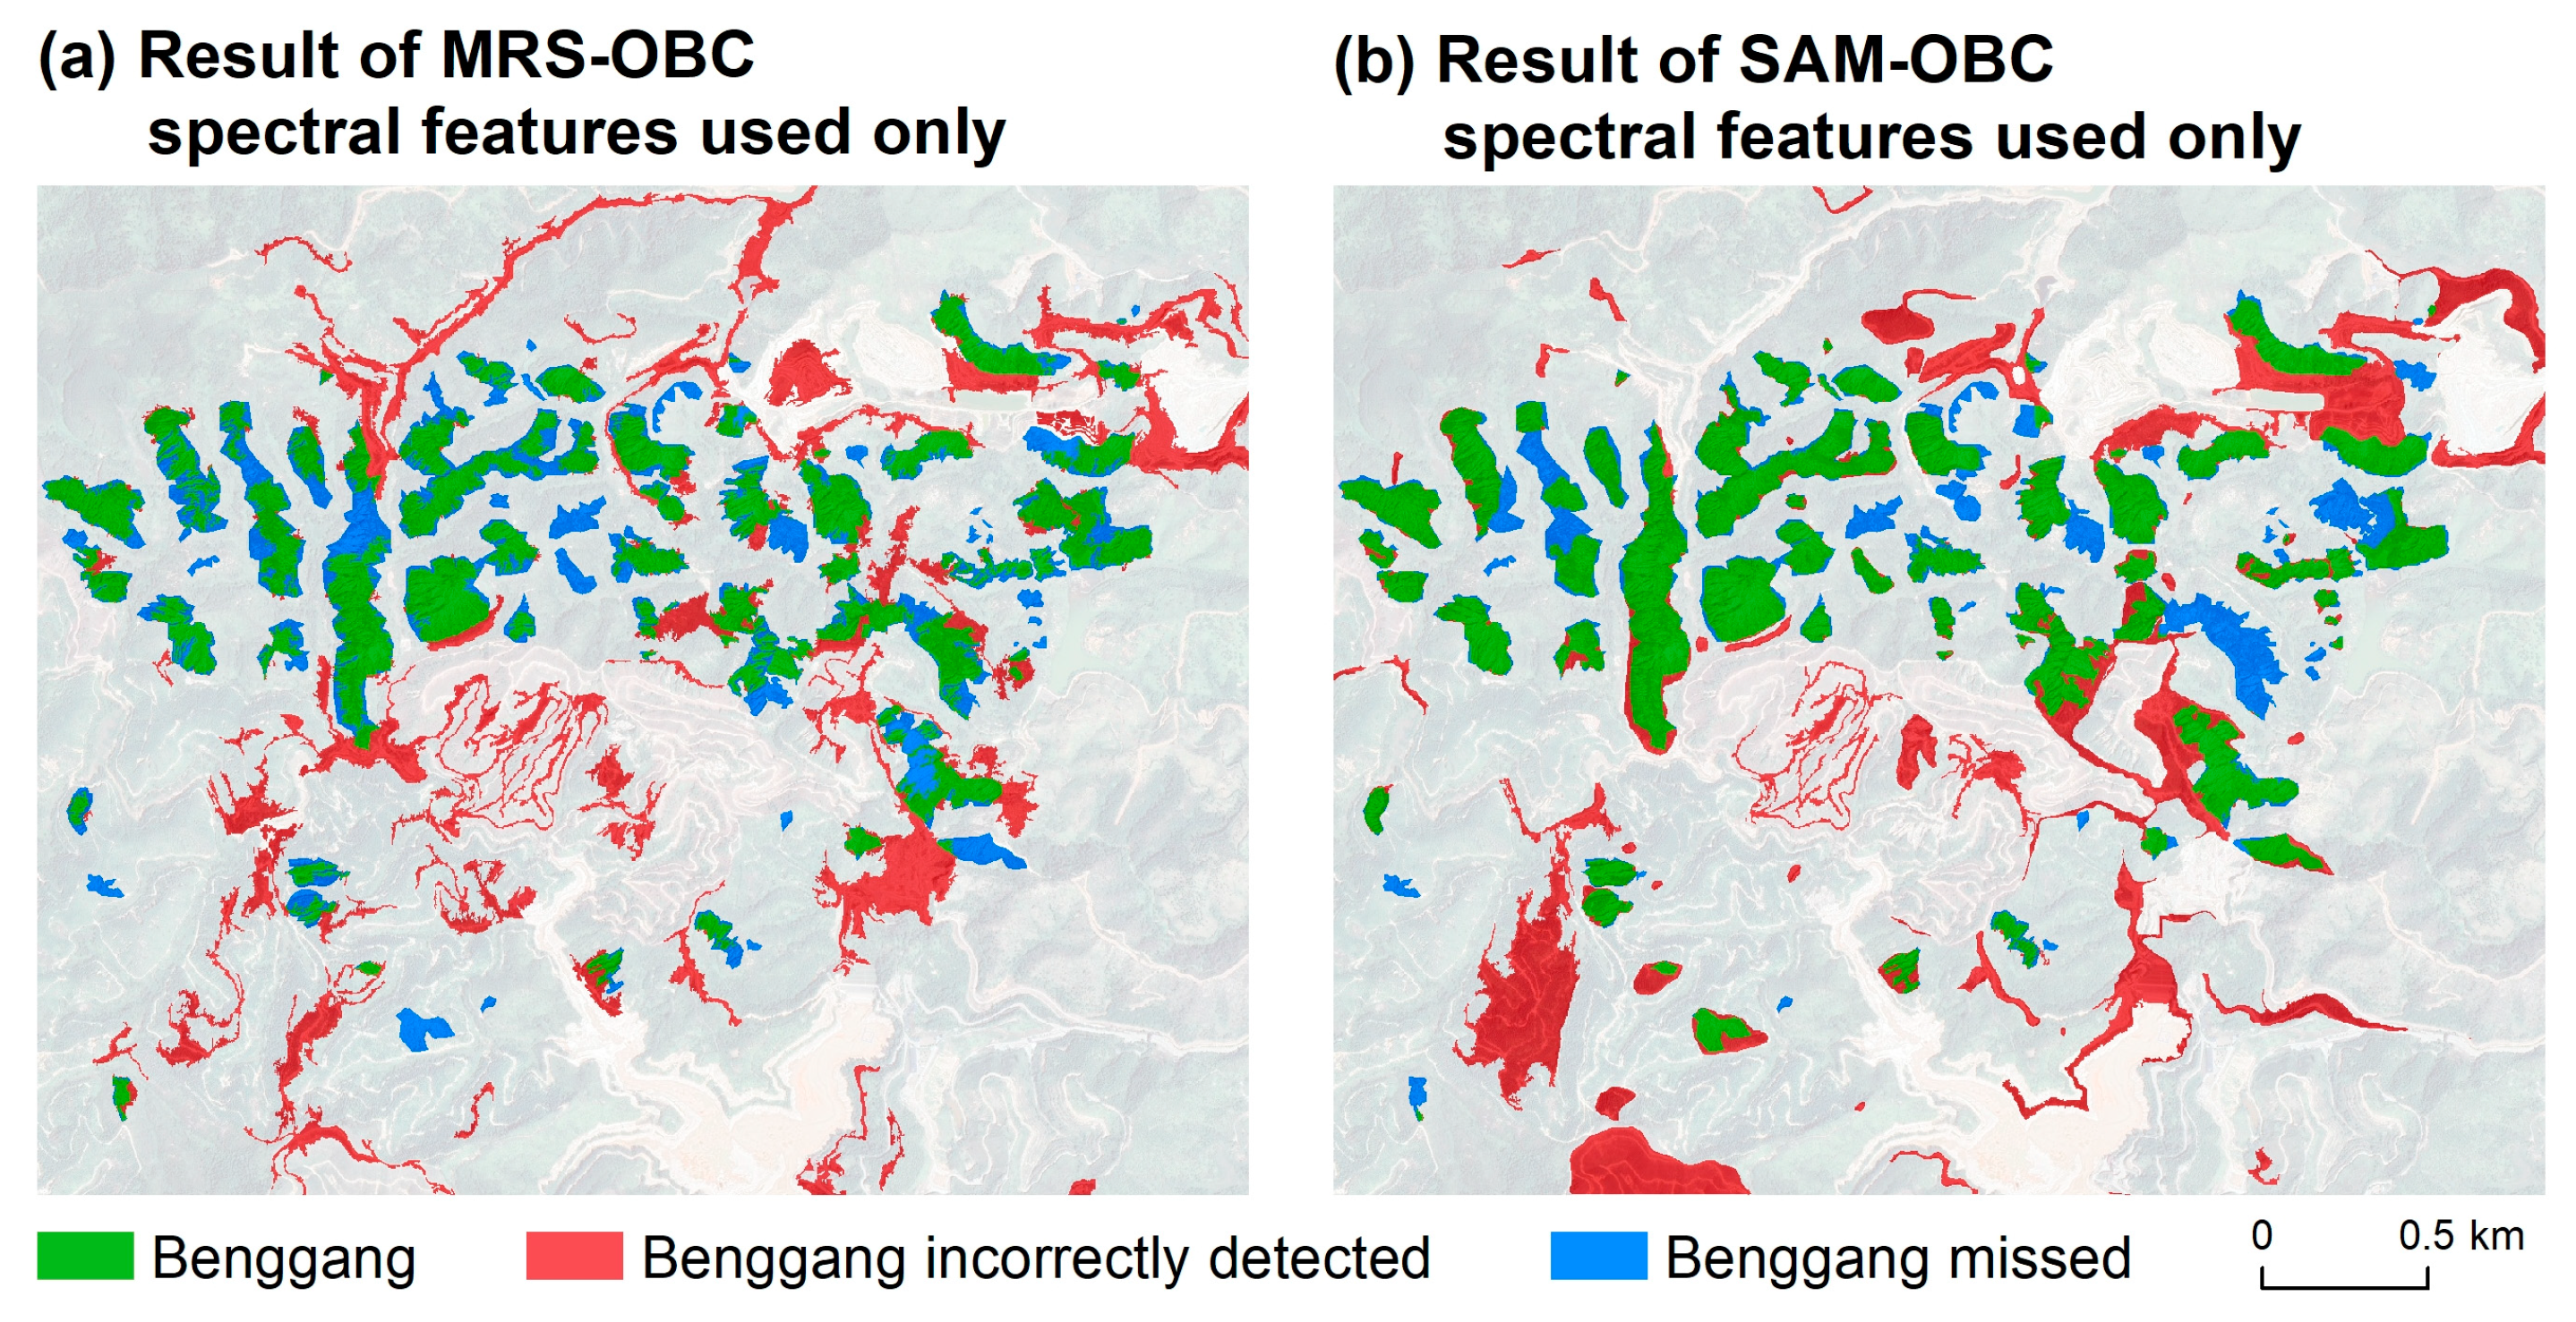
To more vividly demonstrate the significance of textural and geometrical features in classification, another set of comparative experiments was conducted. Both MRS and SAM were used to segment the same image, but during classification, textural and geometrical features were not utilized; instead, only spectral features were employed to classify the segmented objects, as shown in Figure 6. Compared to the classification results that incorporated textural and geometrical features (Figure 4b,c), more Benggang instances were missed, and more background areas were mistakenly classified as Benggang, leading to a marked decline in various accuracy metrics (Table 4). Notably, the accuracy of MRS-OBC actually increased when only spectral features were used, and this phenomenon will be discussed in Section 5.1.
5. Discussion
5.1. Contribution of the SAM to Benggang Identification
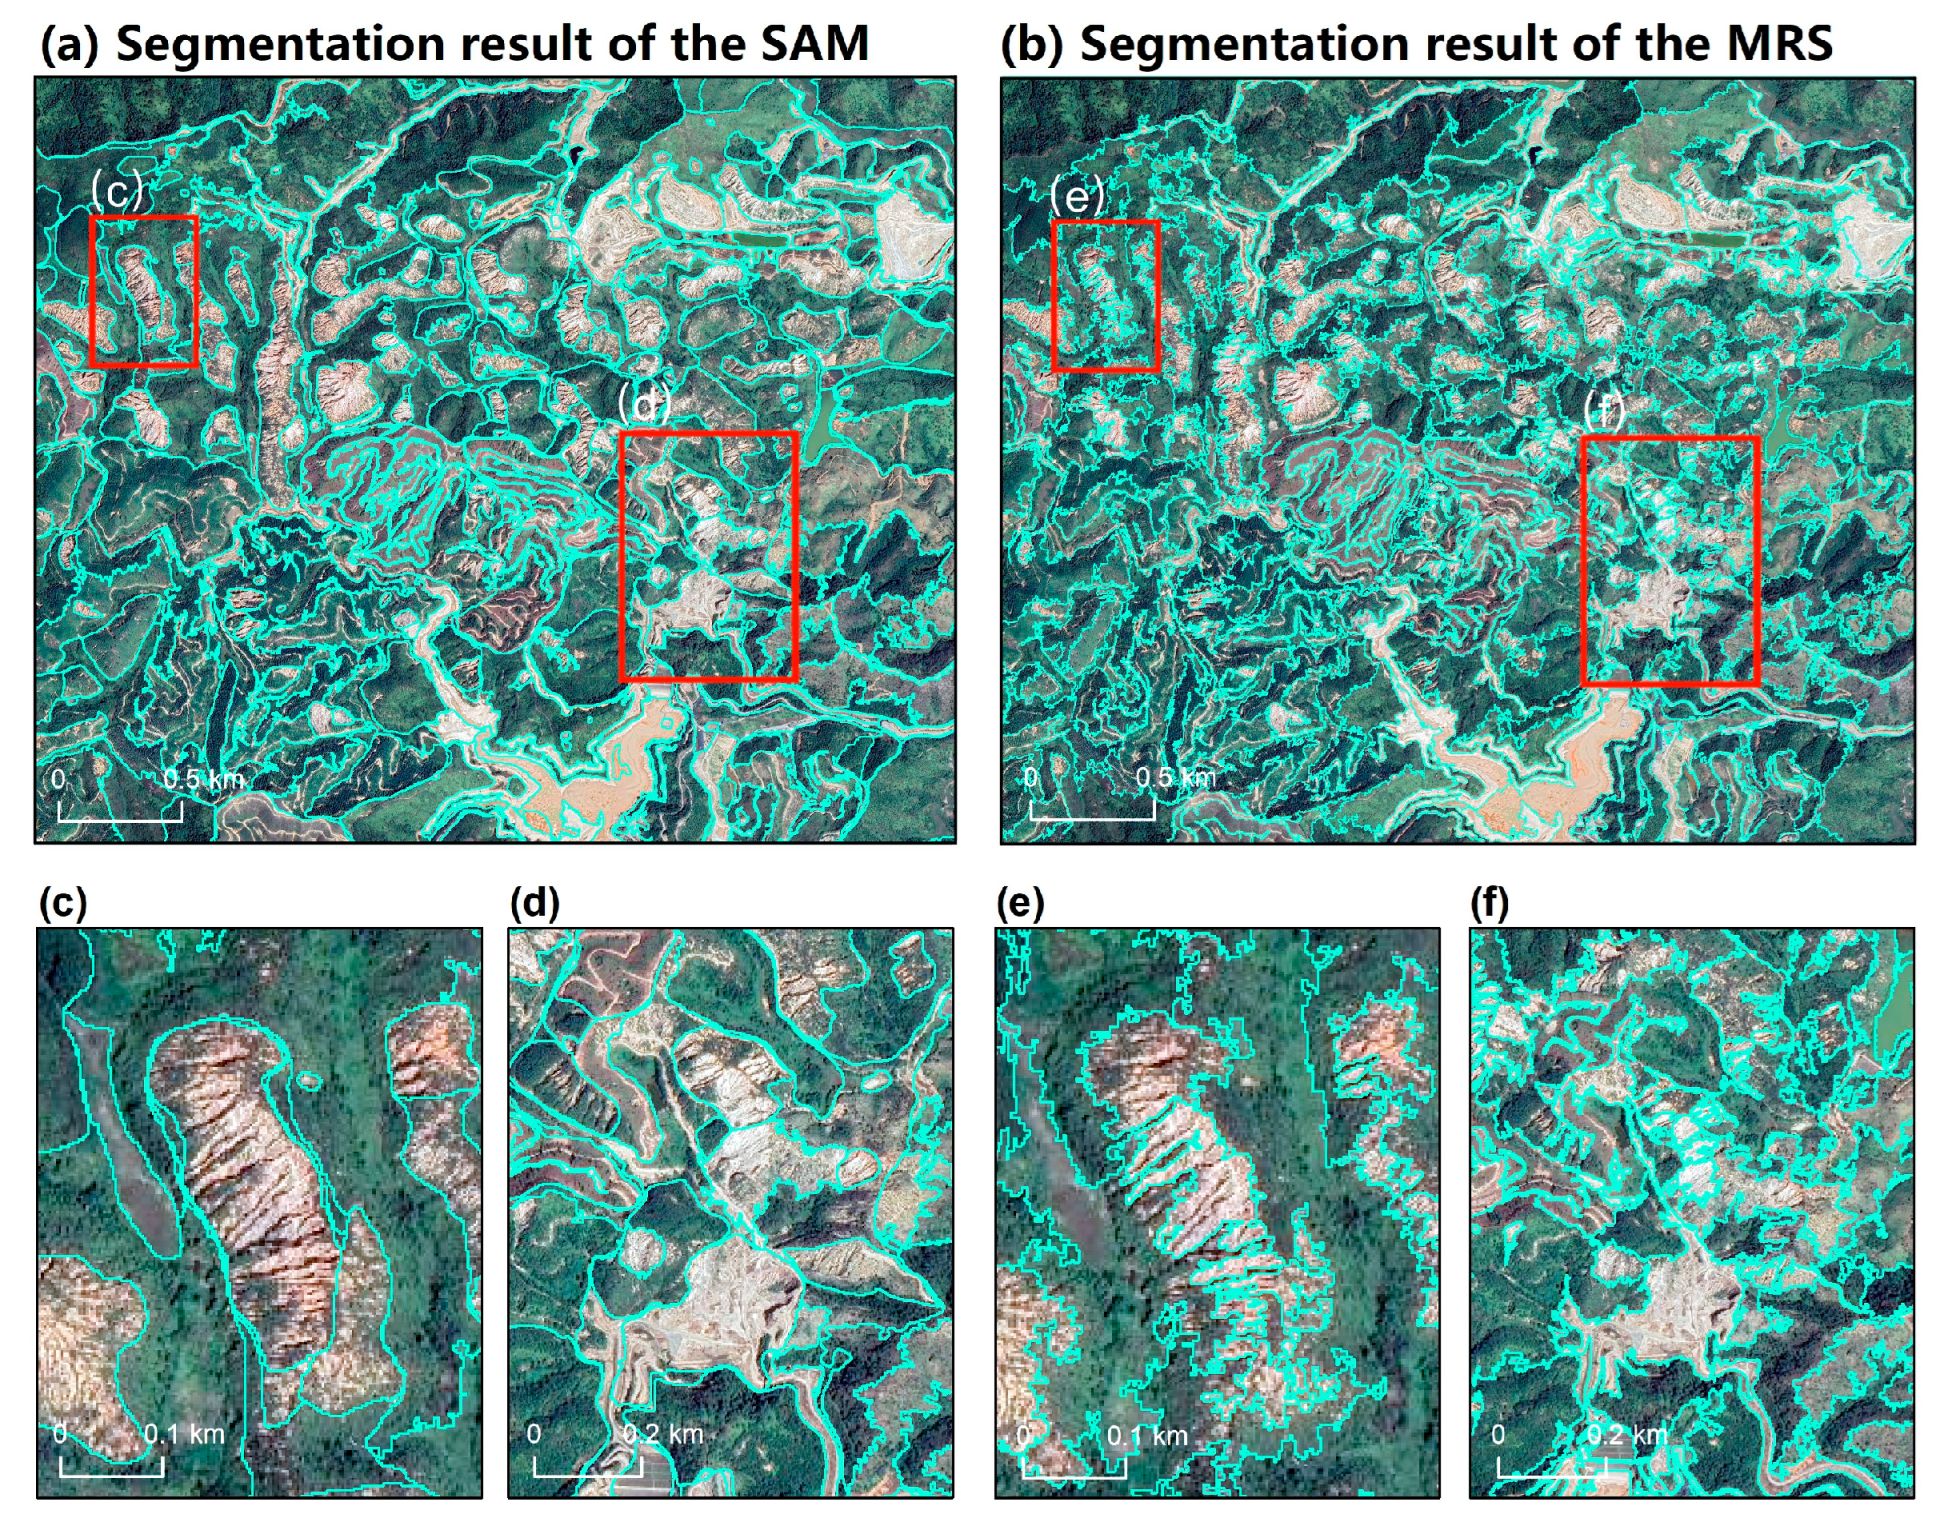
Compared with the MRS-OBC, the SAM-OBC produced much higher accuracy. The improvement was created by the utilization of the SAM. As elaborated before, the utilization of textural features played an important role in Benggang identification. There were noticeable differences between the segmentation results provided by the SAM (Figure 7a) and MRS (Figure 7b). The MRS segmented Benggang edges very strictly, for example, judging each pixel as Benggang or non-Benggang. As a result, the contour lines became very sharp. However, as Benggangs were formed by erosion, there were many distributed grooves on the surface, forming a radiating texture that appears relatively uniform from the center to the periphery. Some Benggangs were located on one side of the slope, resulting in only half of the radiating texture, forming a parallel texture crossing the Benggang. Additionally, the texture was usually linear as mentioned in Section 5.2 later. Due to the deep linear gullies present in Benggang, it was difficult for MRS to distinguish between gullies inside Benggang and the edges. As a result, when the MRS attempted to accurately segment the Benggang edges, it often ended up dividing one Benggang into multiple small pieces along the gullies (Figure 7e). This could disrupt the internal textural features of Benggang and made the geometrical features of the contour less uniform and distinct. We believe that this is the reason why the accuracy of MRS-OBC using only spectral features was paradoxically higher than that of MRS-OBC utilizing both textural and geometrical features. To be specific, these small pieces had smaller ranges and exhibited fewer or no textures. Moreover, most dirt roads have parallel textures much longer than usual Benggang along their directions, which might be the reason why the MRS-OBC misclassified a large number of dirt roads as Benggangs.
In contrast, the SAM produced smoother edges for Benggang, focusing on segmenting the entire Benggang object rather than the precise delineation of the edges. It demonstrated excellent segmentation performance, capturing almost all Benggangs in their entirety and preserving the integrity of the Benggang objects, including their textural, and geometrical characteristics. The SAM retained the uniform linear texture as much as possible, leading to a significant improvement in identification accuracy.
5.2. Improvement Created by Textural Features in Identifying Benggang Areas
Compared with the PBC, the SAM-OBC, and MRS-OBC produced higher accuracy. Given that the PBC only utilized spectral information, this improvement was created by the utilization of textural or geometrical features in the OBC. In Figure 5, spectral-related features were generally ranked lower, with band value standard deviation being more closely associated with image texture, ranking higher; whereas band value mean was only related to surface reflectance characteristics and tended to rank lower. This explains why the accuracy of PBC, relying solely on spectral features for classification, was low and could not distinguish Benggang from other land features with similar spectral characteristics (Figure 4d), such as dirt road (Figure 2c) and mining area (Figure 2e). Moreover, the top 8 features ranked are all object-based textural and geometrical features, indicating that these features significantly contribute to the accuracy of classification.
When comparing the two OBC methods, the accuracy of SAM-OBC has further improved over MRS-OBC. This improvement is due to the enhanced ability SAM-OBC to utilize textural features. To be specific, Entropy, ranked first as GLDV Entropy in Figure 5, measures the amount of information in the image and indicates its complexity. A smaller value indicates similar value and less texture, while a larger value indicates more complex texture. ASM, ranked second in Figure 5 as GLDV Angular Second Moment and ranked third as GLCM Angular Second Moment, describes the uniformity of gray-level distribution and the coarseness of texture in an image. A smaller value suggests less variation in the gray-level matrix elements, indicating finer texture, while a larger value suggests more variations, indicating coarser texture. We examined the features extracted from all samples and calculated their average values. The average GLDV Entropy value was 4.48, which was significantly higher than the 2.37 average in non-Benggang areas. This indicated that within individual Benggang objects, the pixel value differences were relatively larger compared to non-Benggang areas, thus exhibiting more pronounced textural features. The average GLDV ASM was 0.014, while the average GLCM ASM was 0.00012. In comparison to the non-Benggang areas, which had values of 0.034 and 0.00062, respectively, these features were considerably lower. This suggests that the texture, while distincted in its spectral value, was fine in its structural details, making it linear. We hypothesize that due to this characteristic, the linear textures of Benggang were easily identified by the MRS as boundaries for segmentation, leading to fragment objects.
The results indicated that the textural features were crucial in Benggang identification. Since the PBC could not extract and utilize textural information, it yielded poor results in comparison with the OBC. Additionally, the key to improving accuracy in OBC lay in the effective incorporation of these textural features.
6. Conclusions
This study proposed a new method that integrates the SAM and OBC for Benggang detection. Initially, HR imagery was input into the SAM to obtain a segmented dictionary. After converting the results into a polygon file, it was imported into eCognition as a thematic layer for chessboard segmentation, producing segmented HR imagery. Subsequently, a quantity of samples was chosen, features of objects were extracted, and an RF classifier was utilized for classification, resulting in Benggang identification. The proposed SAM-OBC exhibited significant improvements in all accuracy metrics when compared to the traditional RFC-PBC and MRS-OBC. Its detection accuracy reached 85.46%, which was an increase of 48.63% from RFC-PBC’s 36.83%, and an improvement of 34.12% over MRS-OBC’s 51.34%. The false alarm rate was only 2.19%, a decrease of 6.65% from RFC-PBC and 2.06% lower than MRS-OBC. The overall accuracy achieved was 96.48%, representing an increase of 11.19% over RFC-PBC’s 85.29% and 5.53% higher than MRS-OBC’s 90.95%. The Kappa coefficient reached 0.82, which was an improvement of 0.56 over RFC-PBC’s 0.26 and 0.32 higher than MRS-OBC’s 0.50.
The study identified a series of features that are important for Benggang detection, including the textural features GLDV Entropy, GLDV ASM, and GLCM ASM, highlighting the necessity of using OBC for Benggang recognition. Since the RFC-PBC could not extract and utilize these features, relying on the spectral information of pixels solely, it yielded suboptimal results with severe salt-and-pepper noise compared to the OBC methods. Although the MRS-OBC could extract and utilize these features, it still faced challenges in accurately delineating Benggang areas. More specifically, the deep ravines on the Benggang surface manifest as linear textures in high-resolution remote sensing images. We extracted textural features of Benggang objects and found them to have high Entropy values and low ASM values. Mathematically, this indicates that the textures of Benggang possess distinct spectral characteristics and are fine-grained, contributing to the linearity of a texture. These linear textures were often mistakenly identified by MRS as Benggang boundaries, leading to the fragmentation of a single Benggang object into multiple segments. Consequently, the extraction of spatial and textural features from these areas was susceptible to inaccuracies, potentially compromising the detection accuracy of Benggang areas. Due to the SAM’s ability to preserve complete Benggang objects during segmentation, the textural features of Benggang were effectively utilized. As a result, the SAM-OBC outperformed the MRS-OBC, with all the accuracy metrics improved. Further evidence suggests that gullies are common features in Benggang due to its developing process [52,53], implying that these textural characteristics apply to all Benggang instances. Therefore, our proposed SAM-OBC method is applicable for the extraction of Benggang. Moreover, the SAM model used in this method is a pre-trained model that can be easily integrated into OBC without additional training, making it user-friendly and practical.
In this experiment, the SAM has shown its potential for application in Benggang detection. Future research will further combine the SAM with deep learning techniques to achieve more accurate Benggang recognition.
Author Contributions
Conceptualization, Z.Q.; Methodology, Y.H. and Z.Q.; Software, Y.H.; Validation, Y.H.; Formal analysis, Y.H.; Investigation, Y.H. and Z.Z.; Resources, Y.Q.; Data curation, Y.Q.; Writing—original draft, Y.H.; Writing—review & editing, Z.Q. and Z.Z.; Visualization, Y.H. All authors have read and agreed to the published version of the manuscript.
Funding
This work was supported by the National Natural Science Foundation of China (Grant No. 42271334) and the Key R&D Program of Guangzhou (Grant No. 202206010018).
Data Availability Statement
No new data were created or analyzed in this study.
Conflicts of Interest
The authors declare no conflict of interest.
Appendix A
In identifying Benggang objects, all the features used are listed in Table A1, which includes 8 spectral-related, 22 geometry-related, and 12 texture-related features. Their explanations and formulas can be found in the eCognition Professional User Guide [43].

Table A1.
Full list of features used in Benggang identification.
| Type | Name |
|---|---|
| Spectral Feature | Max. diff. |
| Standard deviation (Layer 3) | |
| Standard deviation (Layer 2) | |
| Standard deviation (Layer 1) | |
| Mean (Layer 3) | |
| Mean (Layer 2) | |
| Mean (Layer 1) | |
| Brightness | |
| Geometrical Feature | Border length |
| Width | |
| Asymmetry | |
| Rel. Border to Image Border | |
| Elliptic Fit | |
| Density | |
| Average length of edges (polygon) | |
| Radius of smallest enclosing ellipse | |
| Rectangular Fit | |
| Length | |
| Length/Width | |
| Compactness (polygon) | |
| Volume | |
| Radius of largest enclosed ellipse | |
| Main direction | |
| Shape index | |
| Thickness | |
| Compactness | |
| Roundness | |
| Border index | |
| Area | |
| Number of edges | |
| Textural Feature * | GLCM Correlation |
| GLDV Contrast | |
| GLCM Homogeneity | |
| GLCM Contrast | |
| GLCM StdDev | |
| GLDV Mean | |
| GLDV Ang. 2nd moment | |
| GLCM Ang. 2nd moment | |
| GLCM Dissimilarity | |
| GLCM Mean | |
| GLDV Entropy | |
| GLCM Entropy |
* Textural features offer options in different directions, such as direction 45, direction 90, etc. The study utilizes all direction textural features.
References
- Zhu, X.; Gao, L.; Wei, X.; Li, T.; Shao, M. Progress and prospect of studies of Benggang erosion in southern China. Geoderma 2023, 438, 116656. [Google Scholar]
- Duan, X.; Deng, Y.; Tao, Y.; He, Y.; Lin, L.; Chen, J. The soil configuration on granite residuals affects Benggang erosion by altering the soil water regime on the slope. Int. Soil Water Conserv. Res. 2021, 9, 419–432. [Google Scholar] [CrossRef]
- Xu, J.X. Benggang erosion: The influencing factors. Catena 1996, 27, 249–263. [Google Scholar] [CrossRef]
- Ni, S.; Peng, J.; Wang, J.; Zhu, L.; Wang, D.; Cai, C. Impacts of slope morphological evolution on subsequent erosion for a coarse-textured soil. Geoderma 2023, 430, 116320. [Google Scholar] [CrossRef]
- Long, L.; Ding, S.; Cai, C.; Xia, D.; Liao, X. The Harm and Control of Collapse Erosion on Farmland in Granite Red Soil Hilly Areas. Soil Water Conserv. China 2013, 12, 24–26. [Google Scholar]
- Tang, X.; Hu, J.; Lu, Y.; Qiu, J.; Dong, Y.; Li, B. Soil C, N, P stocks and stoichiometry as related to land use types and erosion conditions in lateritic red soil region, south China. Catena 2022, 210, 105888. [Google Scholar] [CrossRef]
- The State Councilthe People’s Republic of China. Available online: https://www.gov.cn/zhengce/zhengceku/2022-01/05/content_5666545.htm (accessed on 19 November 2023).
- Zhang, X. Scientific and Technological Support Planning of Soil and Water Conservation in the 14th Five-Year Plan of Guangdong Province. Soil Water Conserv. China 2022, 6, 20–23. [Google Scholar]
- Liao, K.; Song, Y.; Xie, S.; Luo, Y.; Liu, Q.; Lin, H. Quantitative Analysis of the Factors Influencing the Spatial Distribution of Benggang Landforms Based on a Geographical Detector. ISPRS Int. J. Geo-Inf. 2022, 11, 337. [Google Scholar] [CrossRef]
- Dong, X.; Huang, R. Application of 3D Laser Scanning Technology to Geologic Survey of High and Steep Slope. Chin. J. Rock Mech. Eng. 2006, 52, 3629–3635. [Google Scholar]
- Du, Y.; Li, S.; Ding, S.; He, Y.; Deng, Y. Study of CORS–RTK combined with GIS in collapsing gully monitoring of southeast Hubei Province. Yangtze River 2015, 46, 87–90. [Google Scholar]
- Lyu, B.; Li, W.; Shen, E. Deformation monitoring of rockfall and landslide based on 3D laser scanning technology. Geotech. Investig. Surv. 2017, 45, 45–47. [Google Scholar]
- Liu, X.; Zhang, D. Temporal-spatial analyses of collapsed gully erosion based on three-dimensional laser scanning. Trans. Chin. Soc. Agric. Eng. 2015, 31, 204–211. [Google Scholar]
- Zhang, D.; Liu, X. Application of 3D Laser Scanning to Monitoring the Landform Changes of Collapsing Hill and Gully: A Case Study of Liantanggang Collapsing Hill and Gully in the Wuhua County of Guangdong. Trop. Geogr. 2014, 34, 133–140. [Google Scholar]
- Obertj, L.R.; Xu, G. Soil erosion measurement methods. Technol. Soil Water Conserv. 1994, 2, 54–57. [Google Scholar]
- Li, Z.; Liu, X.; Liu, J.; Gao, Y. Plan of Soil and Water Conservation Survey in National Census for Water Resources. Bull. Soil Water Conserv. 2010, 30, 87–91. [Google Scholar]
- Liang, Z.; Zhou, H.; Wu, G.; Ma, J. Research on the Spatial Distribution Characteristics of Benggang Erosion Based on UAV Imagery. Jiangsu Agric. Sci. 2018, 46, 220–224. [Google Scholar]
- Jiang, X.; Liang, Z.; Zhou, H.; Dai, Y.; Chen, Y.H. Dynamic Change Monitoring of Collapse Based on UAV Oblique Photograph Technique. Trop. Geogr. 2019, 39, 597–603. [Google Scholar]
- Li, Z.; Zhong, L.; Huang, Y.; Ge, H.; Zhu, Y.; Jiang, F.; Li, X.; Zhang, Y.; Lin, J. Monitoring technology for collapse erosion based on the nap of the object photograph of UAV. Trans. Chin. Soc. Agric. Eng. 2021, 37, 151–159. [Google Scholar]
- Liao, K.T. Study on the spatiotemporal changes of landslide erosion gullies based on drone imagery. Technol. Soil Water Conserv. 2021, 4, 1–2. [Google Scholar]
- Li, H.; Xie, H.; Xu, W.; Liu, H. Effects of Spatial Resolution of Remote Sensing Image on the Accuracy of Extracted Slope Collapse Data. J. Anhui Agric. Sci. 2016, 44, 227–229+246. [Google Scholar]
- Shen, S.; Zhao, Y.; Cheng, D.; Zhang, P.C. An Efficient Method of Investigating Slope Collapse by Unmanned Aerial Vehicle Remote Sensing. J. Yangtze River Sci. Res. Inst. 2018, 35, 43–47+53. [Google Scholar]
- Cai, Z. Study on the Collapsing Hills and Gullies of Survey and Evaluation Based on RS/GIS. Master’s Thesis, Guangxi Normal University, Guilin, China, 2016. [Google Scholar]
- Liu, J.; Liao, K.; Song, Y.; Lai, G.; Zheng, H. Comprehensive analysis of PLEIADES fusion for collapsing erosion in south China. Jiangxi Hydraul. Sci. Technol. 2020, 46, 235–239. [Google Scholar]
- Liu, J.; Liao, K.; Song, Y.; Lai, G.; Zheng, H. Research on Collapse Extraction Based on GF-2 Satellite Data. Geospat. Inf. 2021, 19, 85–87. [Google Scholar]
- Sheng, J.; Liao, A. Erosion control in South China. Catena 1997, 29, 211–221. [Google Scholar] [CrossRef]
- Wei, Y.; Liu, Z.; Wu, X.; Zhang, Y.; Cui, T.; Cai, C.; Guo, Z.; Wang, J.; Cheng, D. Can Benggang be regarded as gully erosion? CATENA 2021, 207, 105648. [Google Scholar] [CrossRef]
- Luk, S.H.; Yao, Q.Y.; Gao, J.Q.; Zhang, J.Q.; He, Y.G.; Huang, S.M. Environmental analysis of soil erosion in Guangdong Province: A Deqing case study. CATENA 1997, 29, 97–113. [Google Scholar] [CrossRef]
- Li, J.; Deng, Y.; Duan, X.; Cai, C.; Ding, S. Does joint structure promote the development of gully erosion? CATENA 2022, 214, 106233. [Google Scholar] [CrossRef]
- Wu, Z.; Deng, Y.; Cai, C.; Huang, J.; Huang, W. Multifractal analysis on spatial variability of soil particles and nutrients of Benggang in granite hilly region, China. CATENA 2021, 207, 105594. [Google Scholar] [CrossRef]
- Liu, D.; Qi, Z.; Zhang, H.; Li, X.; Yeh, A.G.; Wang, J. Investigation of the capability of multitemporal RADARSAT-2 fully polarimetric SAR images for land cover classification: A case of Panyu, Guangdong province. Eur. J. Remote Sens. 2021, 54, 338–350. [Google Scholar] [CrossRef]
- Kirillov, A.; Mintun, E.; Ravi, N.; Mao, H.; Rolland, C.; Gustafson, L.; Xiao, T.; Whitehead, S.; Berg, A.C.; Lo, W.-Y.; et al. Segment Anything. arXiv 2023, arXiv:2304.02643. [Google Scholar]
- Ren, S.; Luzi, F.; Lahrichi, S.; Kassaw, K.; Collins, L.M.; Bradbury, K.; Malof, J.M. Segment anything, from space? arXiv 2023, arXiv:2304.13000. [Google Scholar]
- Zhang, C.; Marfatia, P.; Farhan, H.; Di, L.; Lin, L.; Zhao, H.; Li, H.; Islam, M.D.; Yang, Z. Enhancing USDA NASS Cropland Data Layer with Segment Anything Model. In Proceedings of the 2023 11th International Conference on Agro-Geoinformatics (Agro-Geoinformatics), Wuhan, China, 25–28 July 2023; IEEE: New York, NY, USA, 2023; pp. 1–5. [Google Scholar]
- Giannakis, I.; Bhardwaj, A.; Sam, L.; Leontidis, G. Deep learning universal crater detection using Segment Anything Model (SAM). arXiv 2023, arXiv:2304.07764. [Google Scholar] [CrossRef]
- Shen, S.; Chen, J.; Zhang, T.; Liu, H.; Ye, S. Fine extraction of Benggang using high-resolution digital orthophoto and digital surface model. In Proceedings of the 2022 China Hydraulics Academic Conference, Beijing, China, 8 November 2022; Chinese Hydraulic Engineering Society; Yellow River Hydraulics Publishing House: Zhengzhou, China, 2022. [Google Scholar]
- Liang, Y.; Ning, D.; Pan, X.; Li, D.; Zhang, B. Characteristics and control of Benggang erosion in red soil region of southern China. Chin. Water Soil Conserv. 2009, 1, 31–34. [Google Scholar]
- Zhong, B.; Peng, S.; Zhang, Q.; Ma, H.; Cao, S. Using an ecological economics approach to support the restoration of collapsing gullies in southern China. Land Use Policy 2013, 32, 119–124. [Google Scholar] [CrossRef]
- Liao, J. Discussion on the status and control measures of Benggang erosion in Guangdong Province. Subtrop. Soil Water Conserv. 2005, 4, 28–30+48. [Google Scholar]
- Liao, Y.; Yuan, Z.; Li, D.; Zheng, M.; Huang, B.; Xie, Z.; Wu, X.; Luo, X. What kind of gully can develop into benggang? CATENA 2023, 225, 107024. [Google Scholar] [CrossRef]
- Sun, B.; Dong, Y.; Xu, M.; Zeng, X. Promote Development of Modern High-Efficient Ecological AgricultureBased on Divisional Remediation of Red Soil Degradation in Hilly Region of Southeastern China. Soils 2015, 47, 204–209. [Google Scholar]
- Liang, Y.; Zhang, B.; Pan, X.; Shi, D. Current status and comprehensive control strategies of soil erosion for hilly region in the Southern China. Sci. Soil Water Conserv. 2008, 1, 22–27. [Google Scholar]
- Baatz, M.; Benz, U.; Dehghani, S.; Heynen, M.; Holtje, A.; Hofmann, P.; Lingenfelder, I.; Mimler, M.; Sohlbach, M.; Weber, M. eCognition Professional User Guide 4; ADefiniens Imaging: Munich, Germany, 2004. [Google Scholar]
- Benz, U.C.; Hofmann, P.; Willhauck, G.; Lingenfelder, I.; Heynen, M. Multi-resolution, object-oriented fuzzy analysis of remote sensing data for GIS-ready information. ISPRS J. Photogramm. Remote Sens. 2004, 58, 239–258. [Google Scholar] [CrossRef]
- Breiman, L. Random Forests. Mach. Learn. 2001, 45, 5–32. [Google Scholar] [CrossRef]
- Fawagreh, K.; Gaber, M.M.; Elyan, E. Random forests: From early developments to recent advancements. Syst. Sci. Control Eng. 2014, 2, 602–609. [Google Scholar] [CrossRef]
- Esch, T.; Thiel, M.; Bock, M.; Roth, A.; Dech, S. Improvement of image segmentation accuracy based on multiscale optimization procedure. IEEE Geosci. Remote Sens. Lett. 2008, 5, 463–467. [Google Scholar] [CrossRef]
- Belgiu, M.; Drǎguţ, L. Comparing supervised and unsupervised multiresolution segmentation approaches for extracting buildings from very high resolution imagery. ISPRS J. Photogramm. Remote Sens. 2014, 96, 67–75. [Google Scholar] [CrossRef] [PubMed]
- Van der Linden, S.; Rabe, A.; Held, M.; Jakimow, B.; Leitão, P.J.; Okujeni, A.; Schwieder, M.; Suess, S.; Hostert, P. The EnMAP-Box—A Toolbox and Application Programming Interface for EnMAP Data Processing. Remote Sens. 2015, 7, 11249–11266. [Google Scholar] [CrossRef]
- Zhang, F.; Yang, X. Improving land cover classification in an urbanized coastal area by random forests: The role of variable selection. Remote Sens. Environ. 2020, 251, 112105. [Google Scholar] [CrossRef]
- Haralick, R.M.; Shanmugam, K.; Dinstein, I. Textural Features for Image Classification. IEEE Trans. Syst. Man Cybern. 1973, SMC-3, 610–621. [Google Scholar] [CrossRef]
- Lin, J.; Huang, Y.; Zhao, G.; Jiang, F.; Wang, M.; Ge, H. Flow-driven soil erosion processes and the size selectivity of eroded sediment on steep slopes using colluvial deposits in a permanent gully. CATENA 2017, 157, 47–57. [Google Scholar] [CrossRef]
- Gao, Y.; Liu, C.; Zou, Z.; Liu, Z.; Yang, X.; Tian, Z.; He, Y.; Lin, L.; Chen, J. Effects of sediment yield fluctuations on the niche-like ephemeral gully formation in granite red soil. CATENA 2022, 219, 106624. [Google Scholar] [CrossRef]
Figure 1.
A typical Benggang [9].
Figure 1.
A typical Benggang [9].

Figure 2.
Study area and data.

Figure 3.
Scheme of the proposed SAM-OBC for Benggang detection.

Figure 4.
Benggang detection results obtained with the different methods.

Figure 5.
Importance of the various features to Benggang detection.

Figure 6.
Benggang detection results used spectral features only.

Figure 7.
Comparison of segmentation results between the SAM and the MRS. Panels (c–f) are magnified sections of (a,b), where (c) and (e), (d) and (f) represent the different segmentation scenarios of the same Benggang by SAM and MRS, respectively.
Figure 7.
Comparison of segmentation results between the SAM and the MRS. Panels (c–f) are magnified sections of (a,b), where (c) and (e), (d) and (f) represent the different segmentation scenarios of the same Benggang by SAM and MRS, respectively.

Table 1.
Detailed parameters set for the SAM.
| Parameter Name | Final Parameters |
|---|---|
| Sampling-point-density | 360 |
| IOU-threshold | 0.86 |
| Stability-score-threshold | 0.92 |
| Number-of-layers | 1 |
| Downscale-factor | 2 |
| Minimum-mask-area | 100 |
Table 2.
Number of the objects and pixels of each class in the training and validation samples.
| Class | Training Samples | Validation Samples | ||
|---|---|---|---|---|
| Objects | Pixels | Objects | Pixels | |
| Benggang | 50 | 182,453 | 73 | 212,530 |
| Non-Benggang | 250 | 1,149,857 | / | 1,753,550 |
Table 3.
Accuracy assessment of different Benggang detection methods.
| Accuracy Statistics | RFC-PBC | MRS-OBC | SAM-OBC |
|---|---|---|---|
| Detection accuracy | 36.83% | 51.34% | 85.46% |
| False alarm rate | 8.84% | 4.25% | 2.19% |
| Overall accuracy | 85.29% | 90.95% | 96.48% |
| Kappa coefficient | 0.26 | 0.50 | 0.82 |
Table 4.
Accuracy assessment of results used different features.
| Accuracy Statistics | MRS-OBC | MRS-OBC Spectral Features Used Only | SAM-OBC | SAM-OBC Spectral Features Used Only |
|---|---|---|---|---|
| Detection accuracy | 51.34% | 63.48% | 85.46% | 75.59% |
| False alarm rate | 4.25% | 8.65% | 2.19% | 8.65% |
| Overall accuracy | 90.95% | 88.34% | 96.48% | 89.60% |
| Kappa coefficient | 0.50 | 0.48 | 0.82 | 0.55 |
Disclaimer/Publisher’s Note: The statements, opinions and data contained in all publications are solely those of the individual author(s) and contributor(s) and not of MDPI and/or the editor(s). MDPI and/or the editor(s) disclaim responsibility for any injury to people or property resulting from any ideas, methods, instructions or products referred to in the content. |
© 2024 by the authors. Licensee MDPI, Basel, Switzerland. This article is an open access article distributed under the terms and conditions of the Creative Commons Attribution (CC BY) license (https://creativecommons.org/licenses/by/4.0/).
Share and Cite
MDPI and ACS Style
Hu, Y.; Qi, Z.; Zhou, Z.; Qin, Y. Detection of Benggang in Remote Sensing Imagery through Integration of Segmentation Anything Model with Object-Based Classification. Remote Sens. 2024, 16, 428. https://doi.org/10.3390/rs16020428
AMA Style
Hu Y, Qi Z, Zhou Z, Qin Y. Detection of Benggang in Remote Sensing Imagery through Integration of Segmentation Anything Model with Object-Based Classification. Remote Sensing. 2024; 16(2):428. https://doi.org/10.3390/rs16020428
Chicago/Turabian StyleHu, Yixin, Zhixin Qi, Zhexun Zhou, and Yan Qin. 2024. "Detection of Benggang in Remote Sensing Imagery through Integration of Segmentation Anything Model with Object-Based Classification" Remote Sensing 16, no. 2: 428. https://doi.org/10.3390/rs16020428
Note that from the first issue of 2016, this journal uses article numbers instead of page numbers. See further details here.