
Simulation and Analysis of the Mesoscale Vortex Affecting the “21·7” Extreme Rainstorm in Henan
 , , ,
, , , 
Abstract
:1. Introduction
2. Materials and Methods
2.1. Data
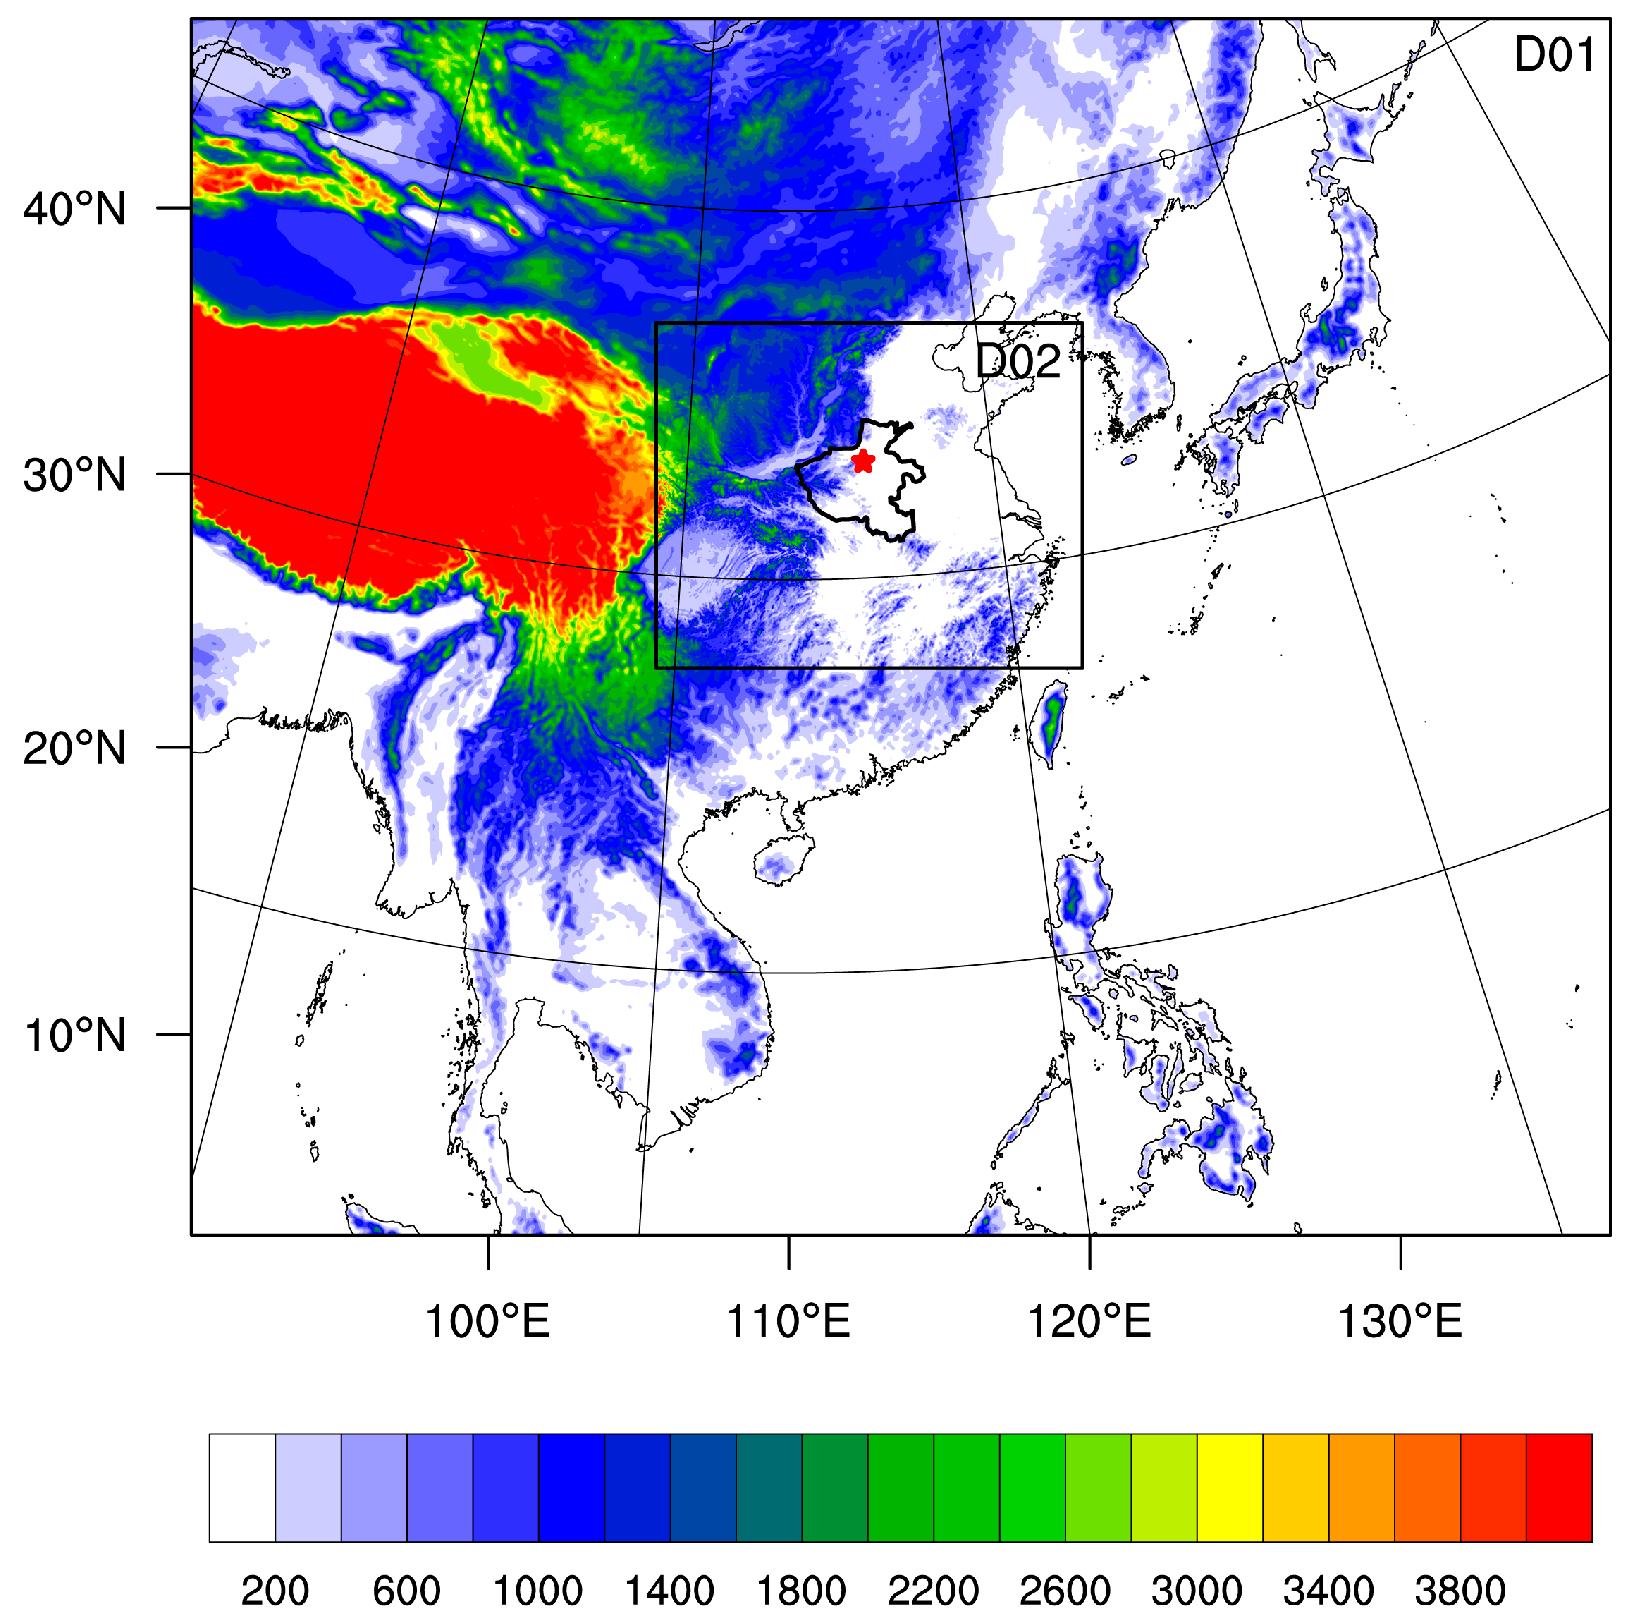
2.2. Model
2.3. Method
3. Results
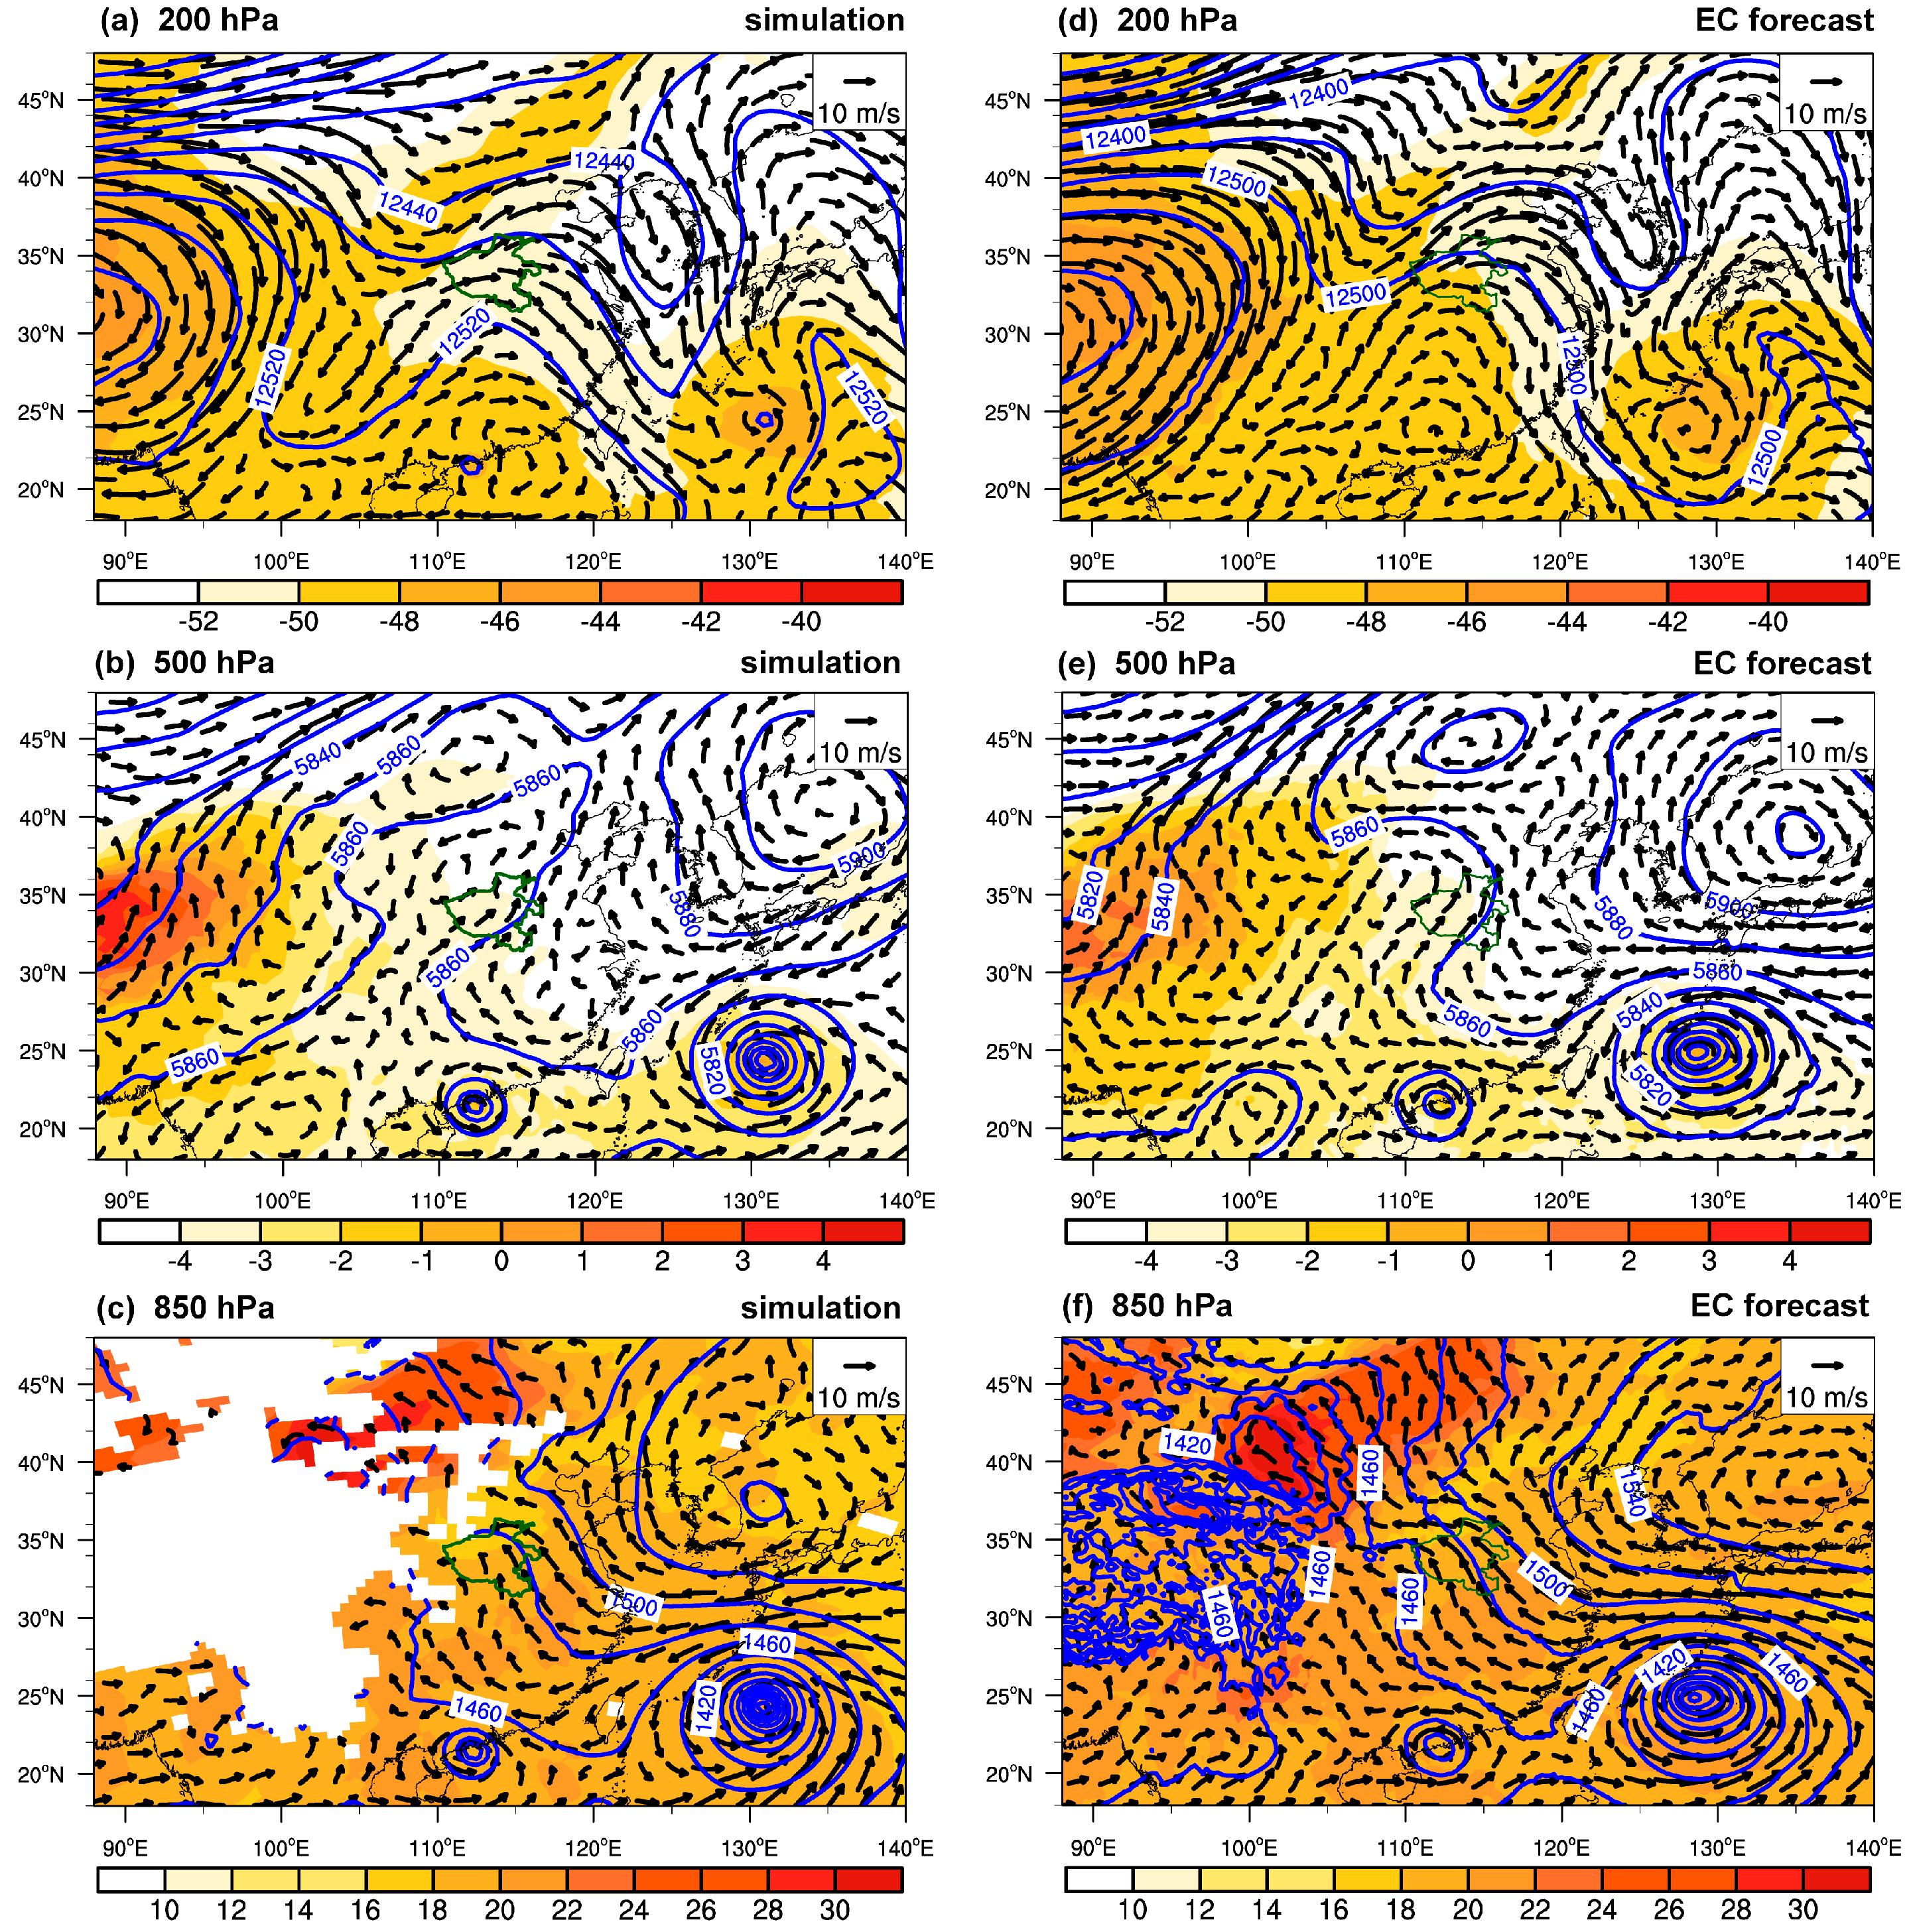
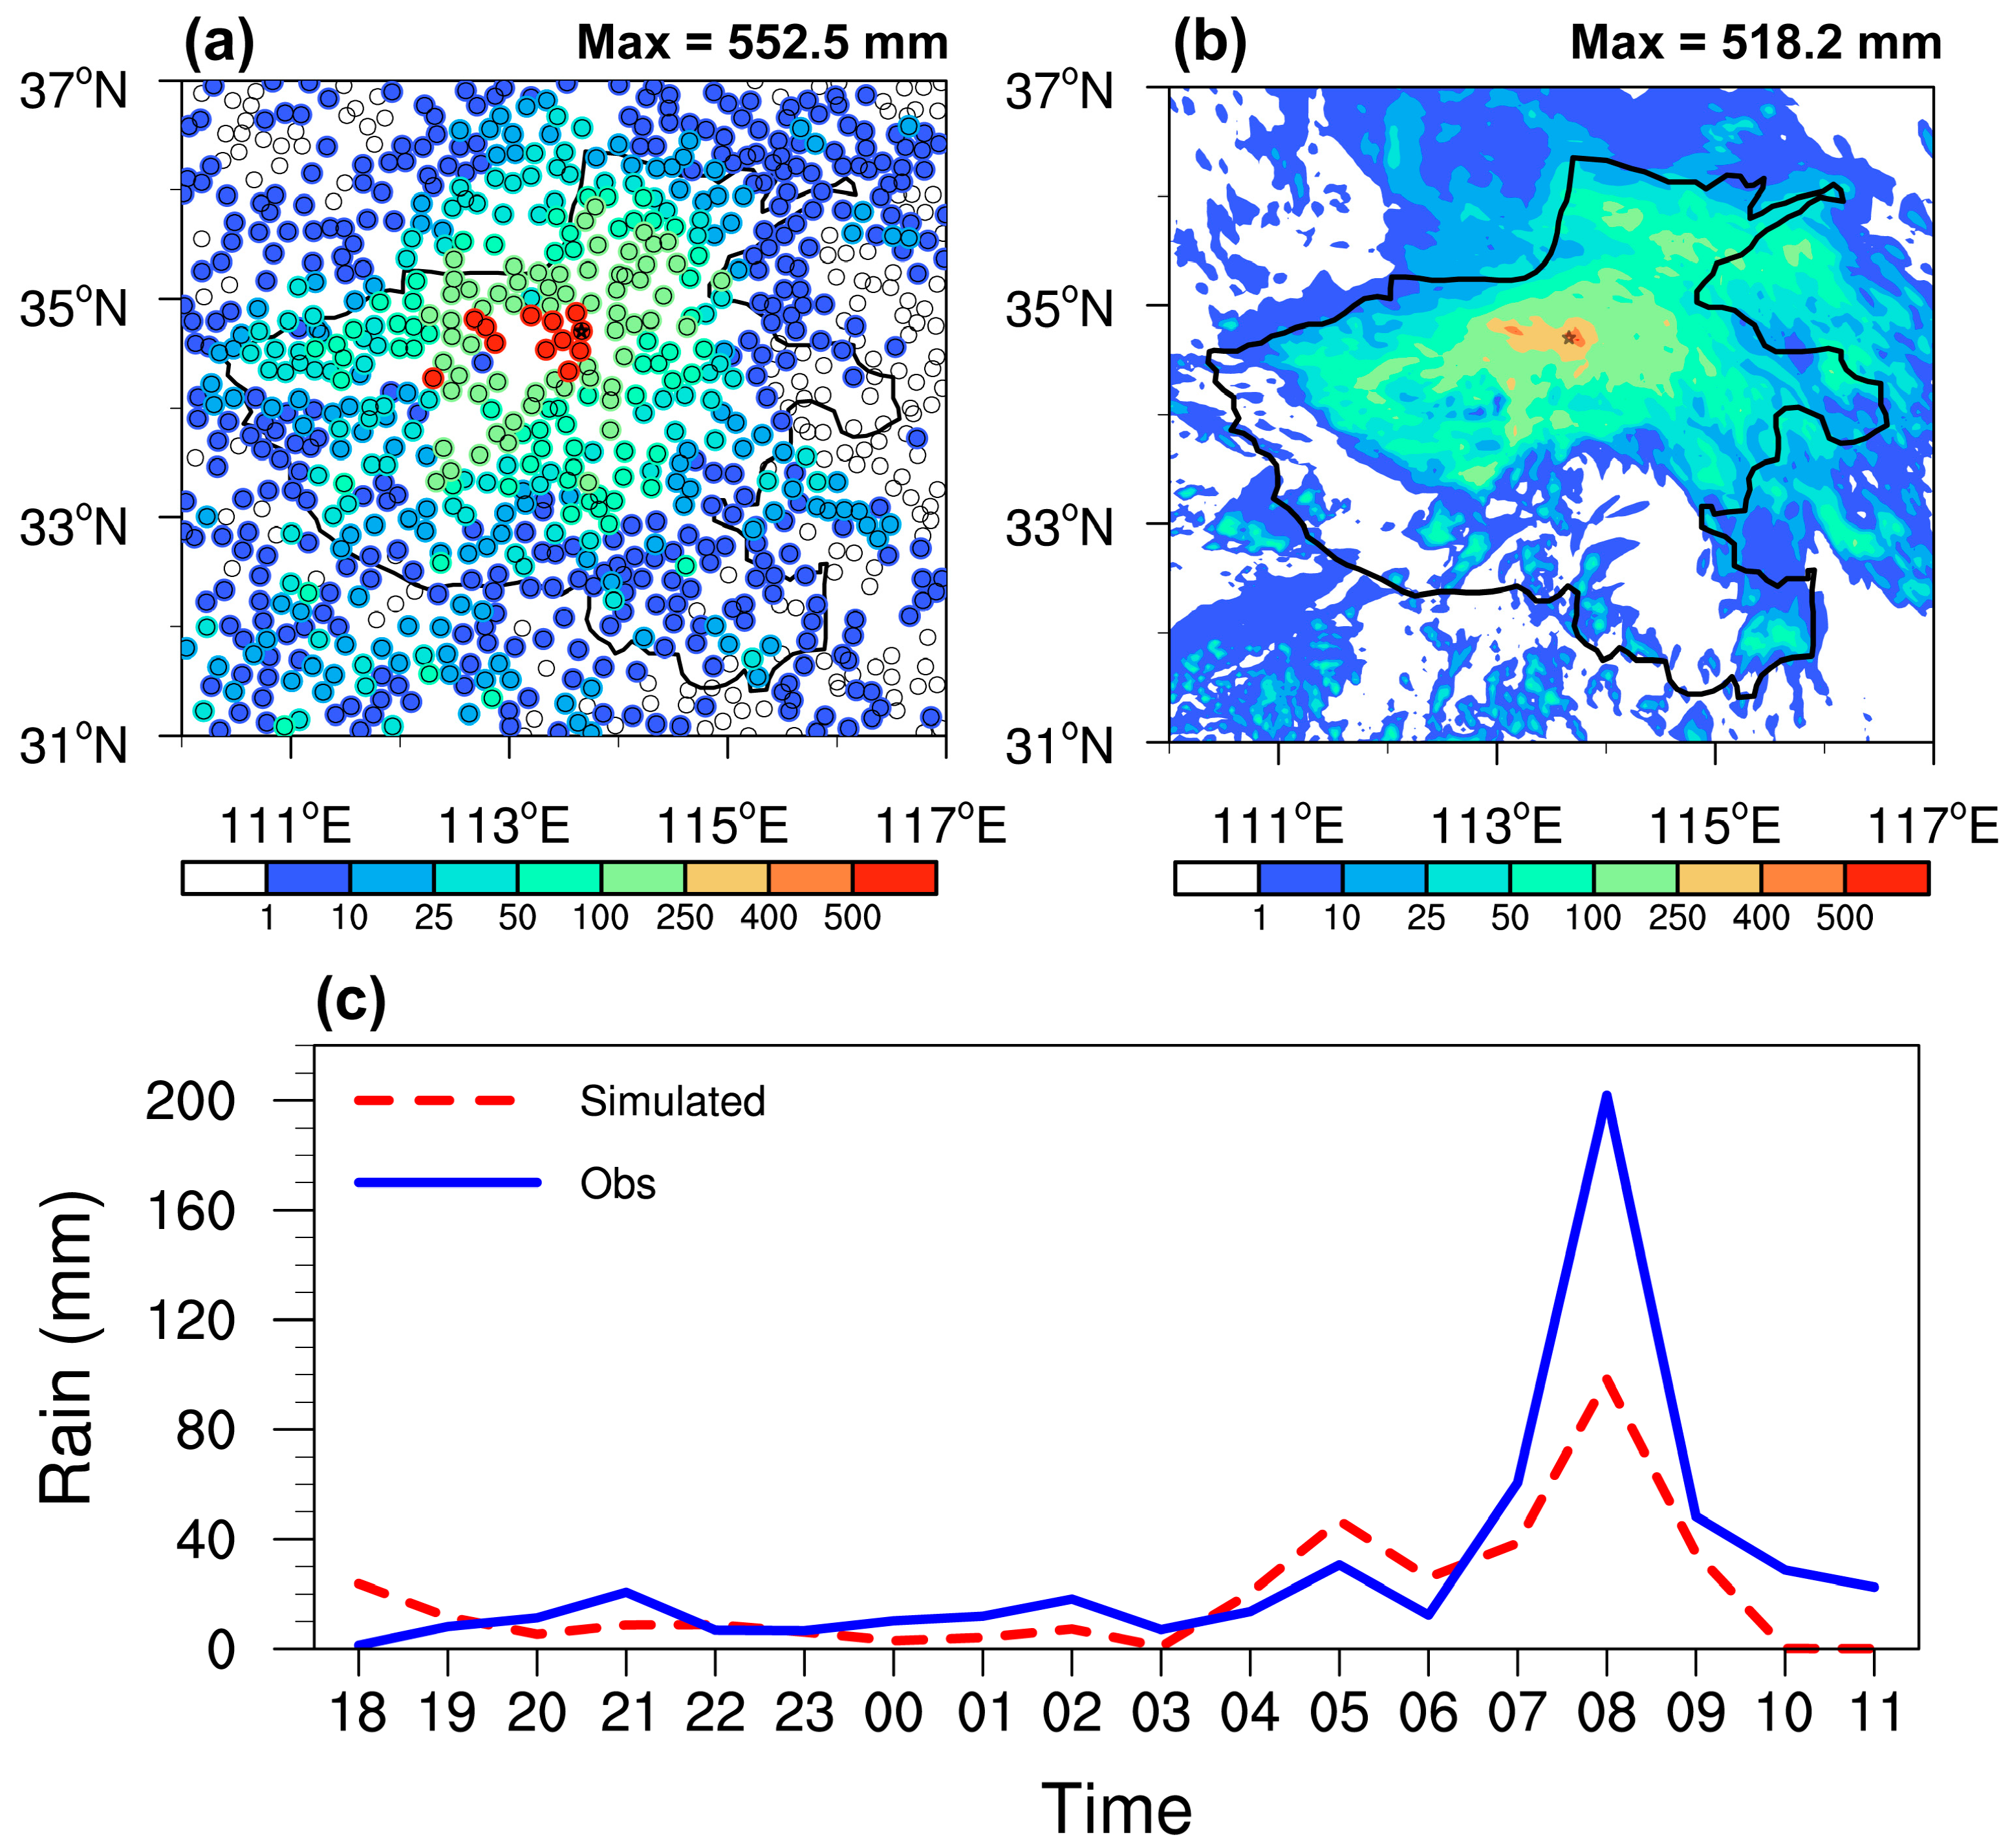
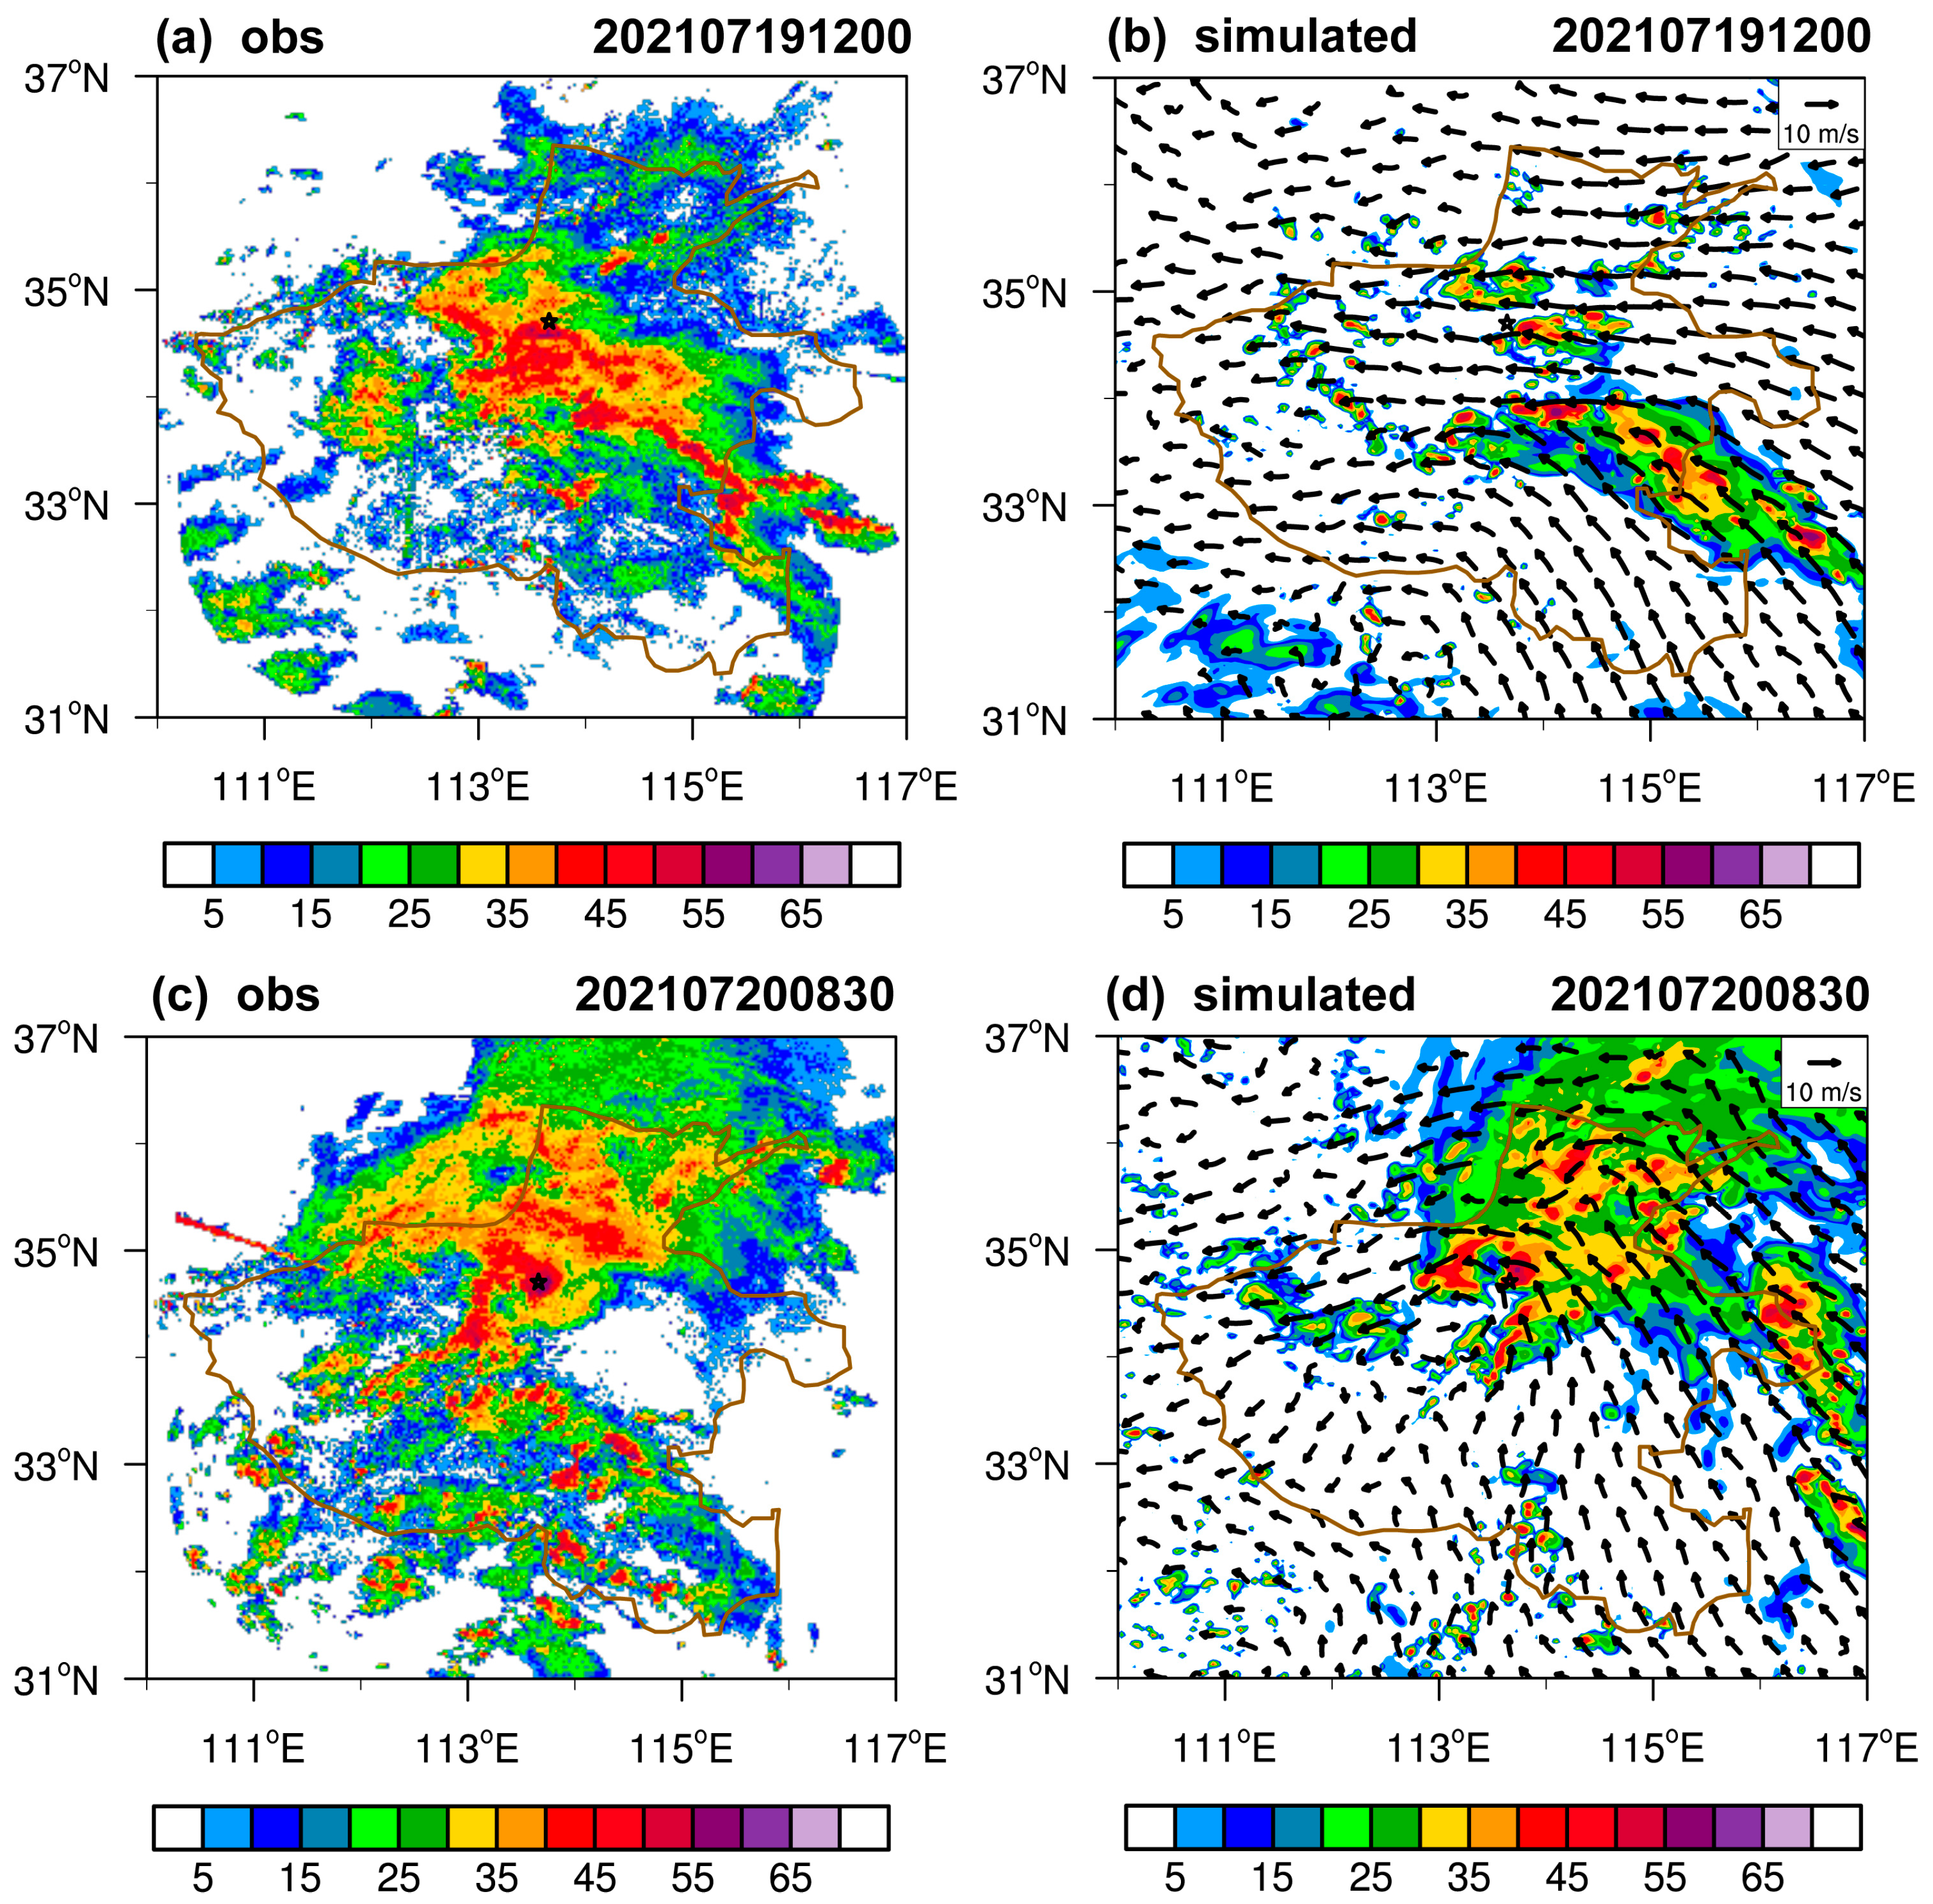
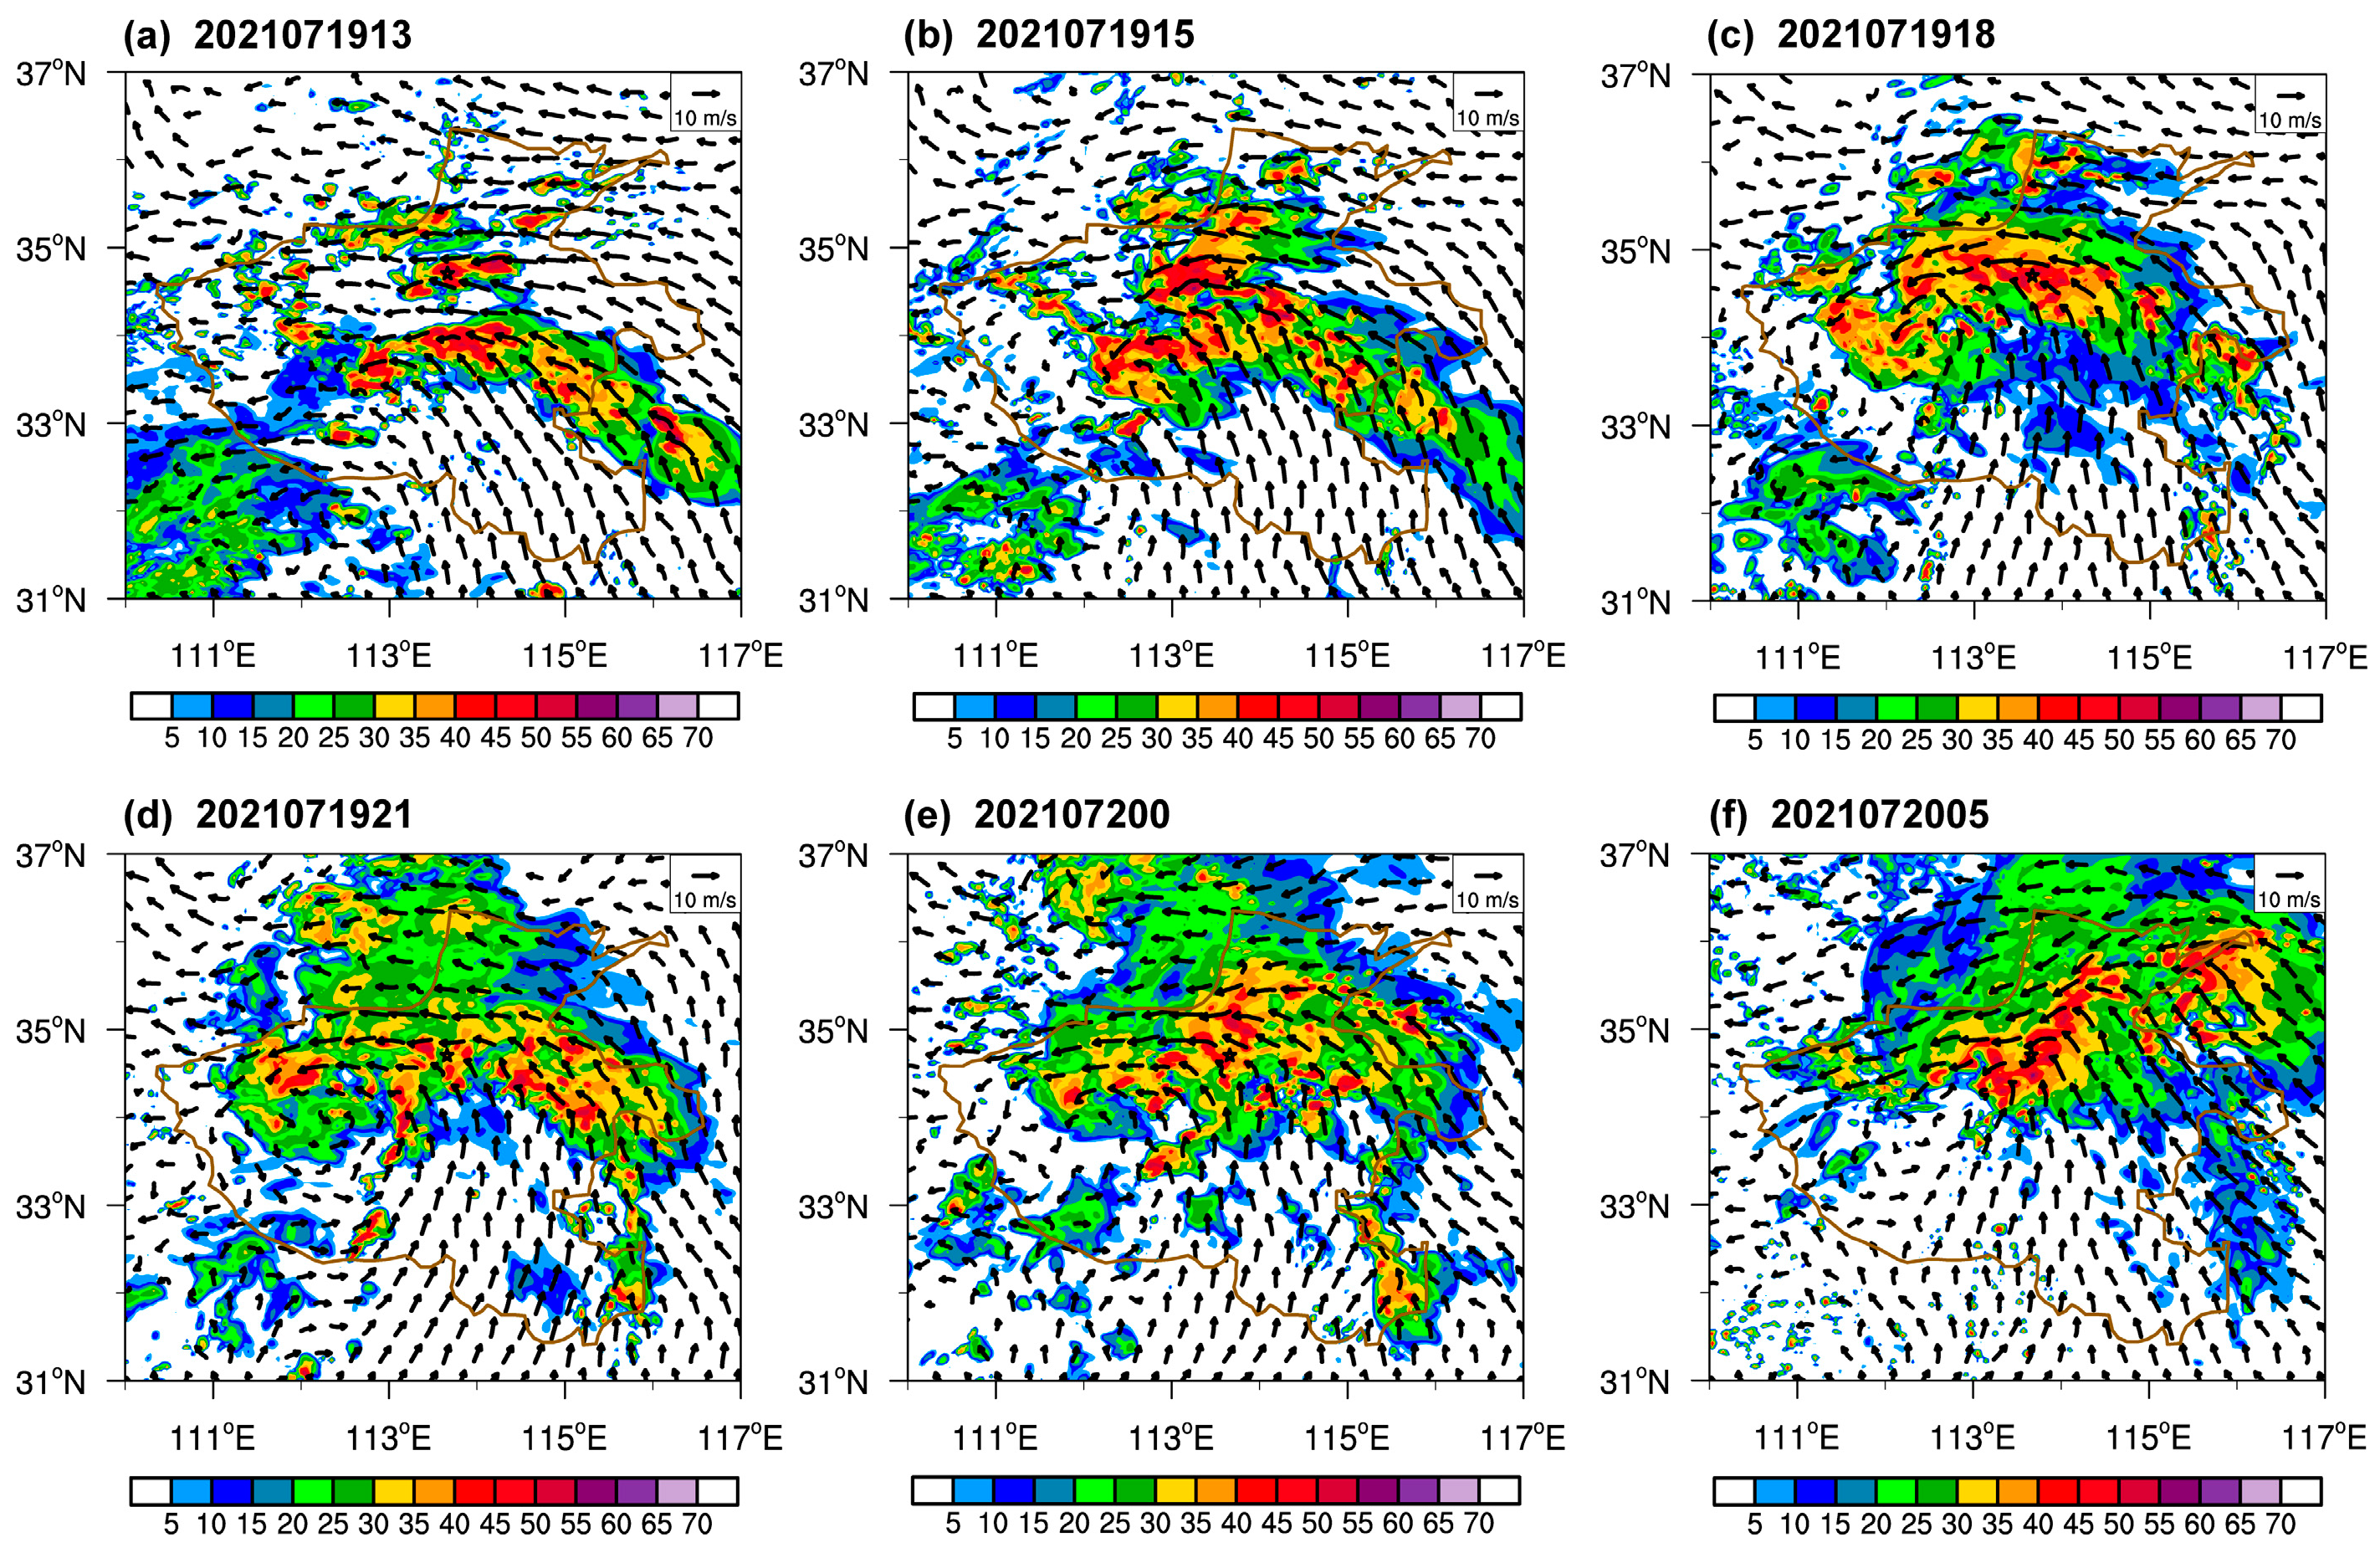
3.1. Verification
3.2. Simulation Analysis
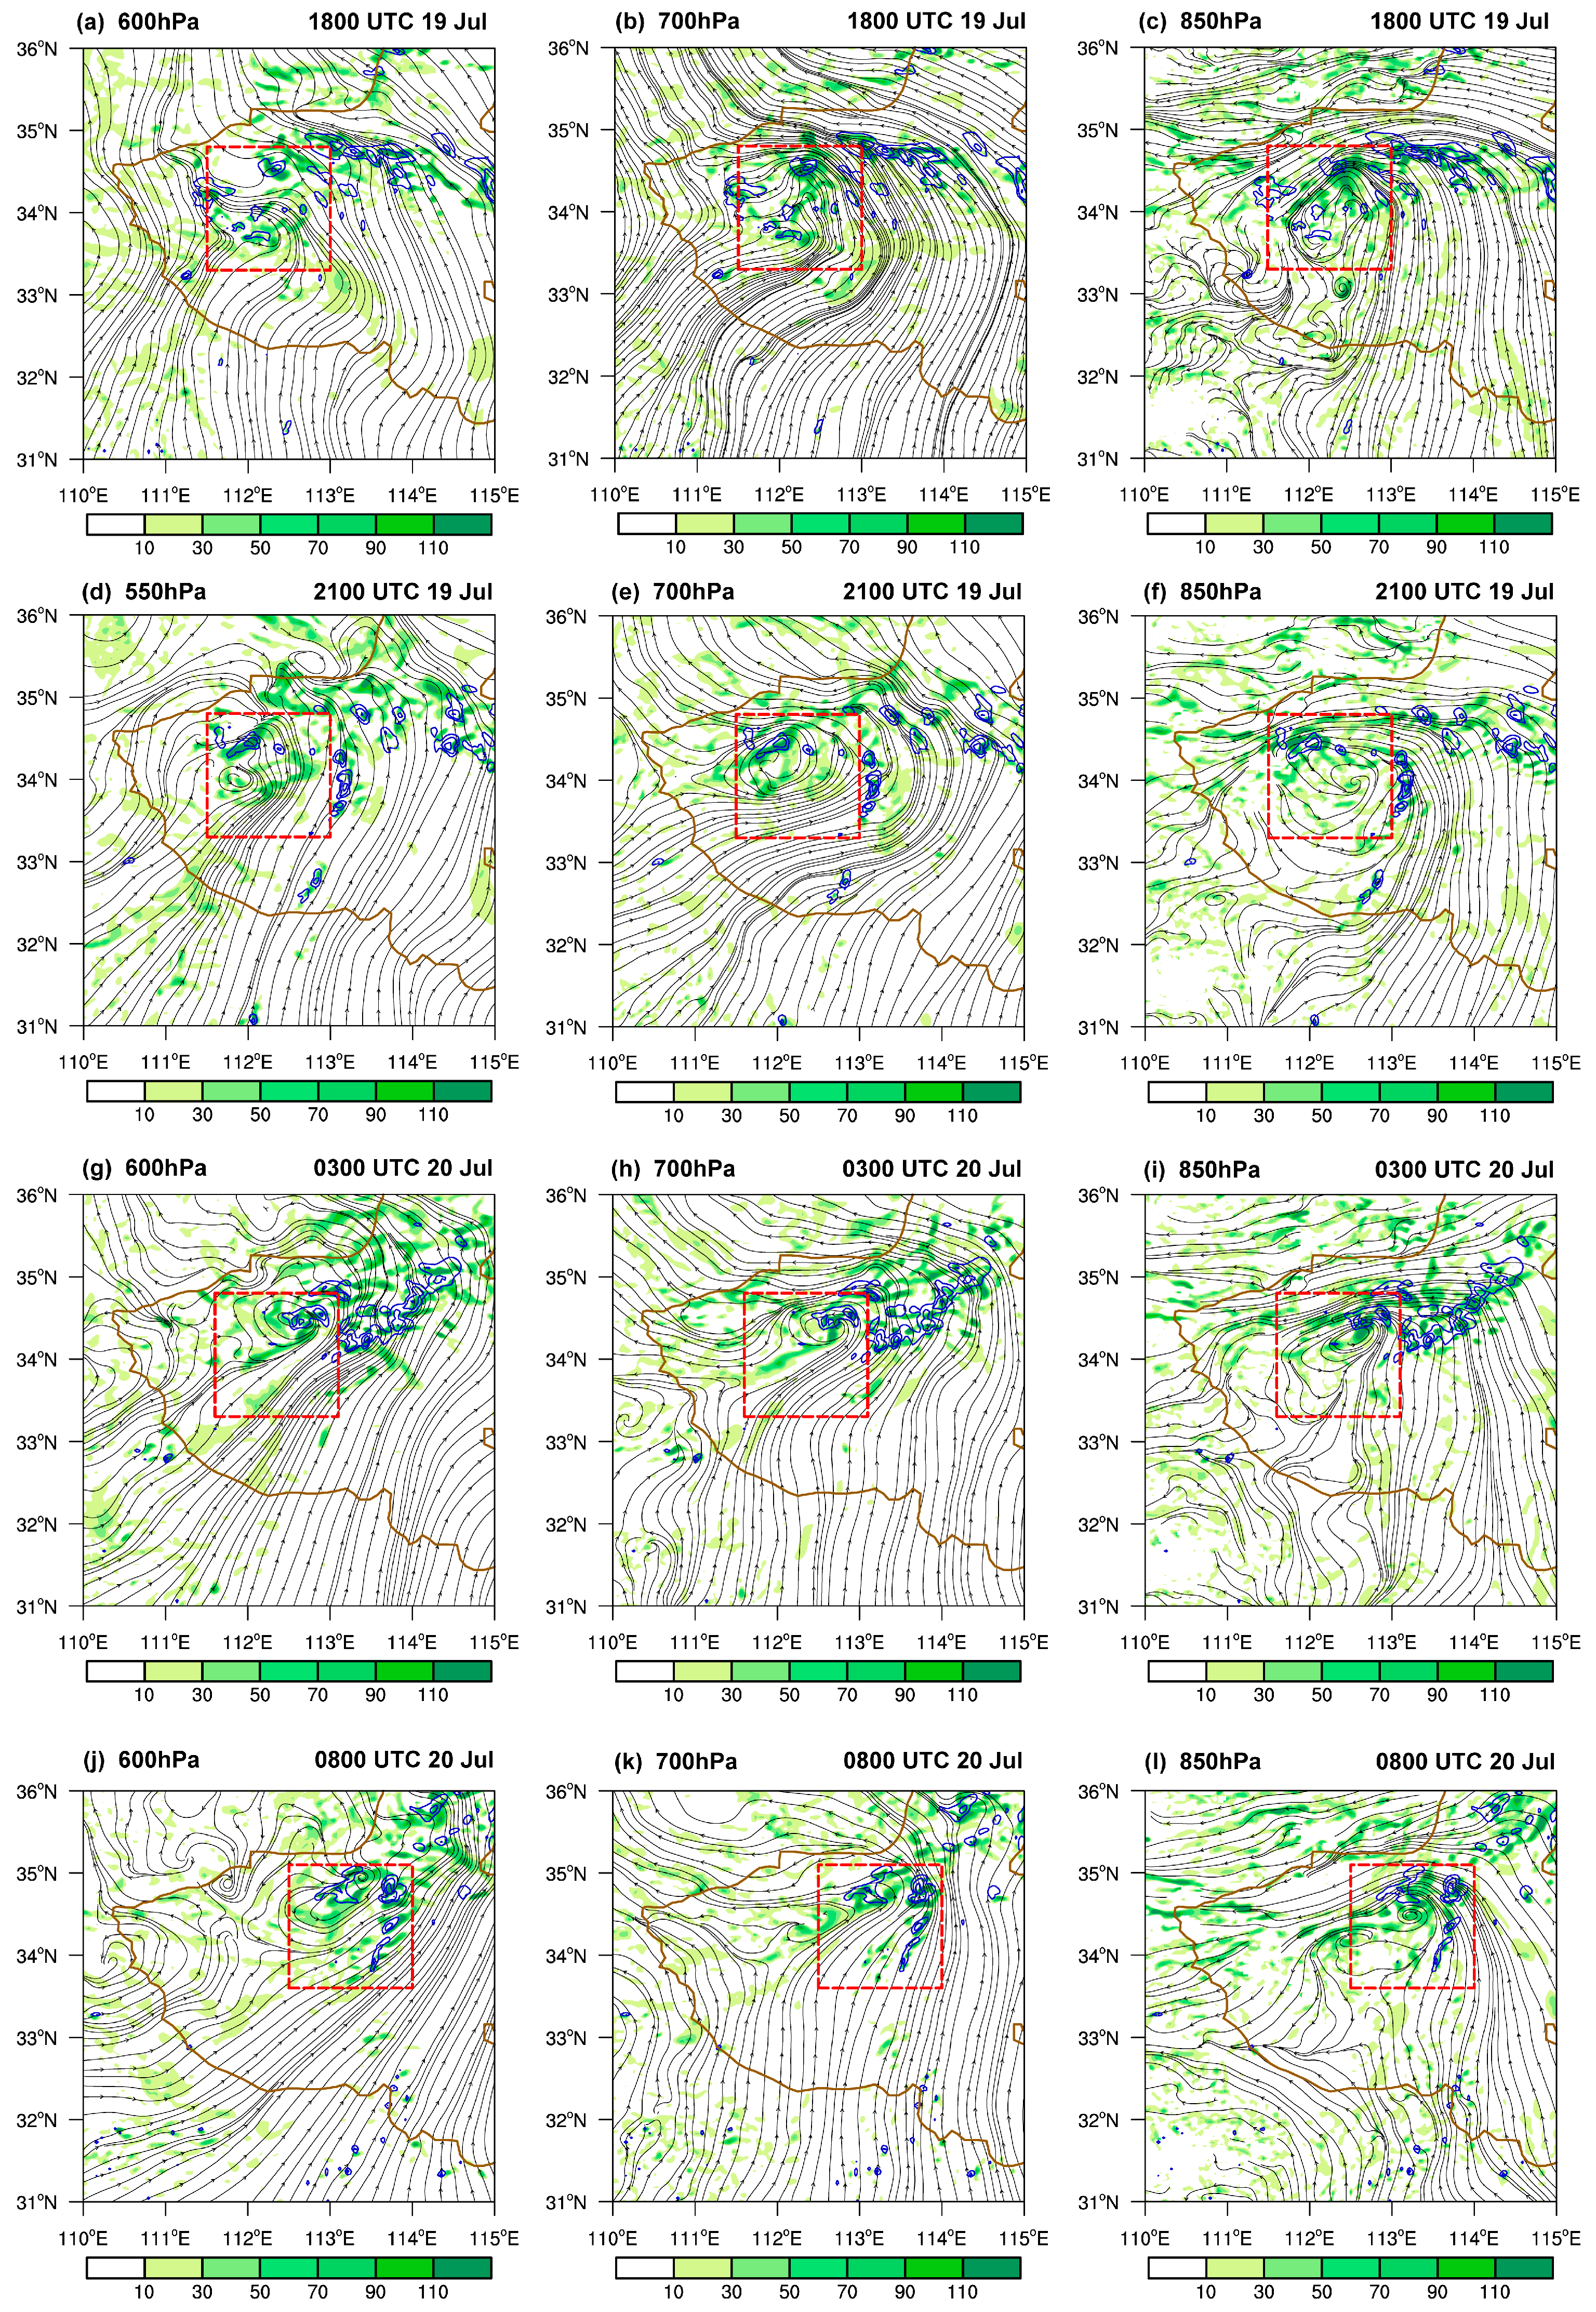
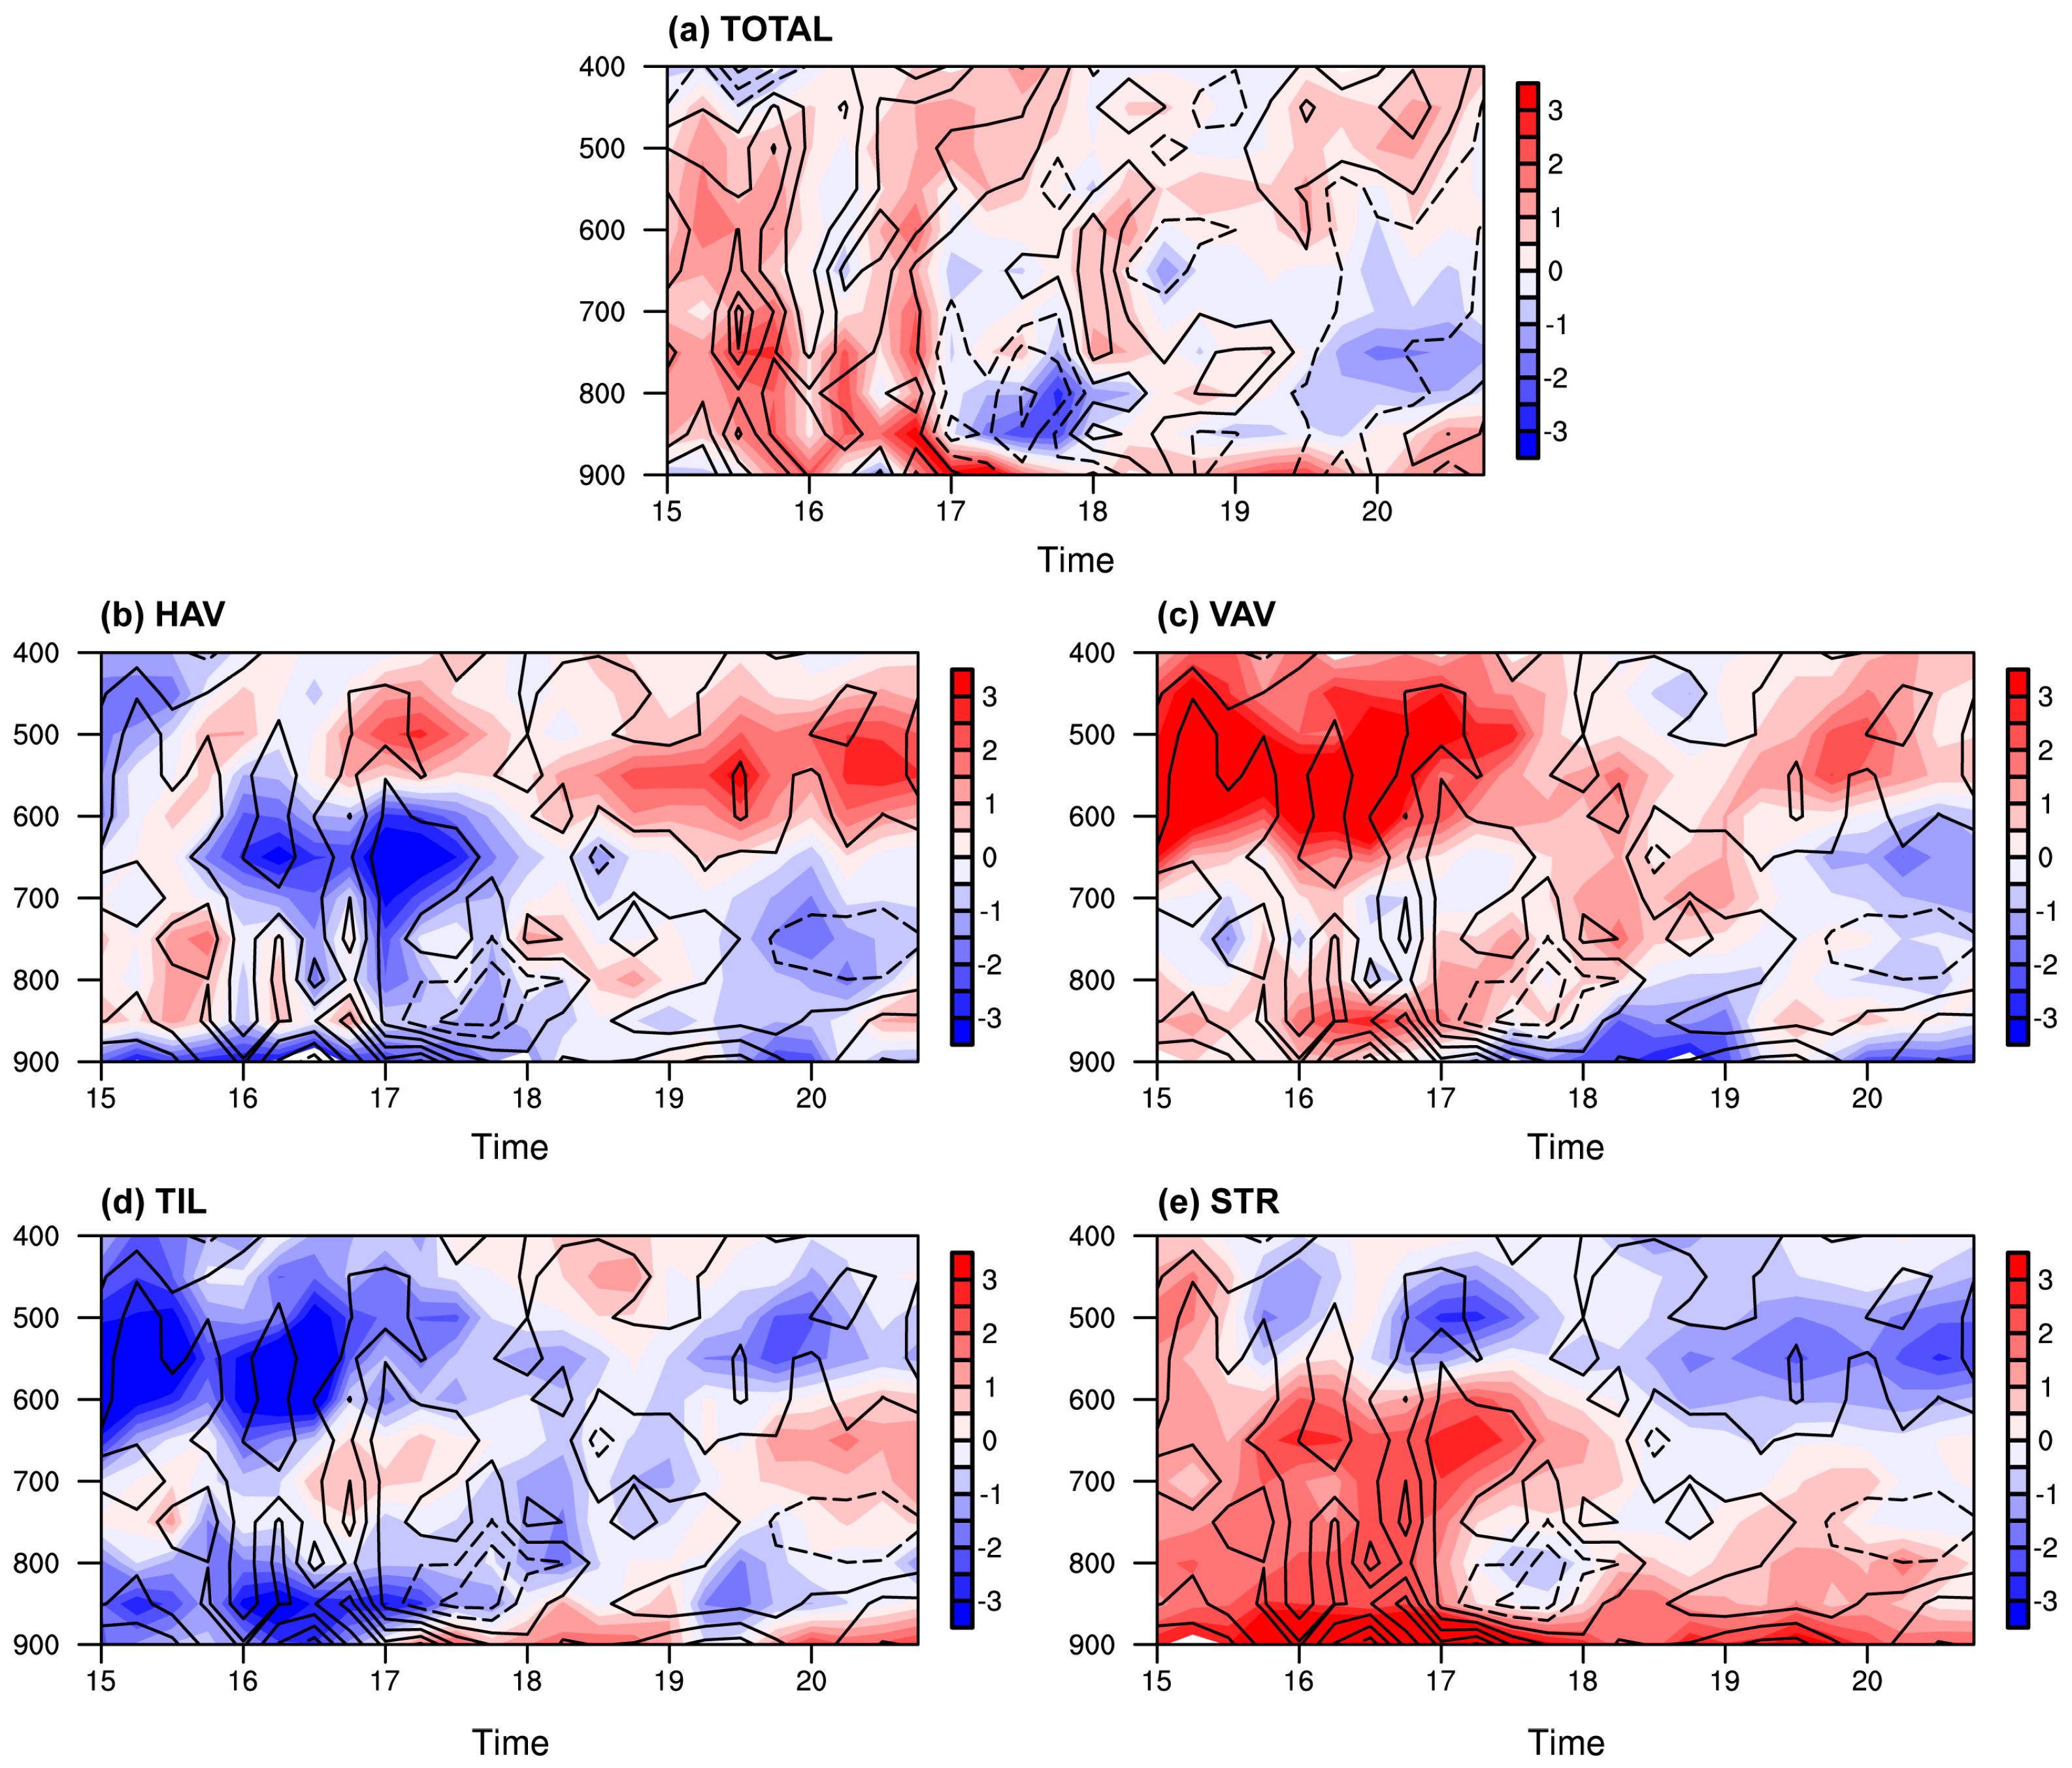
3.2.1. Generation Mechanism of the Huang-Huai Vortex
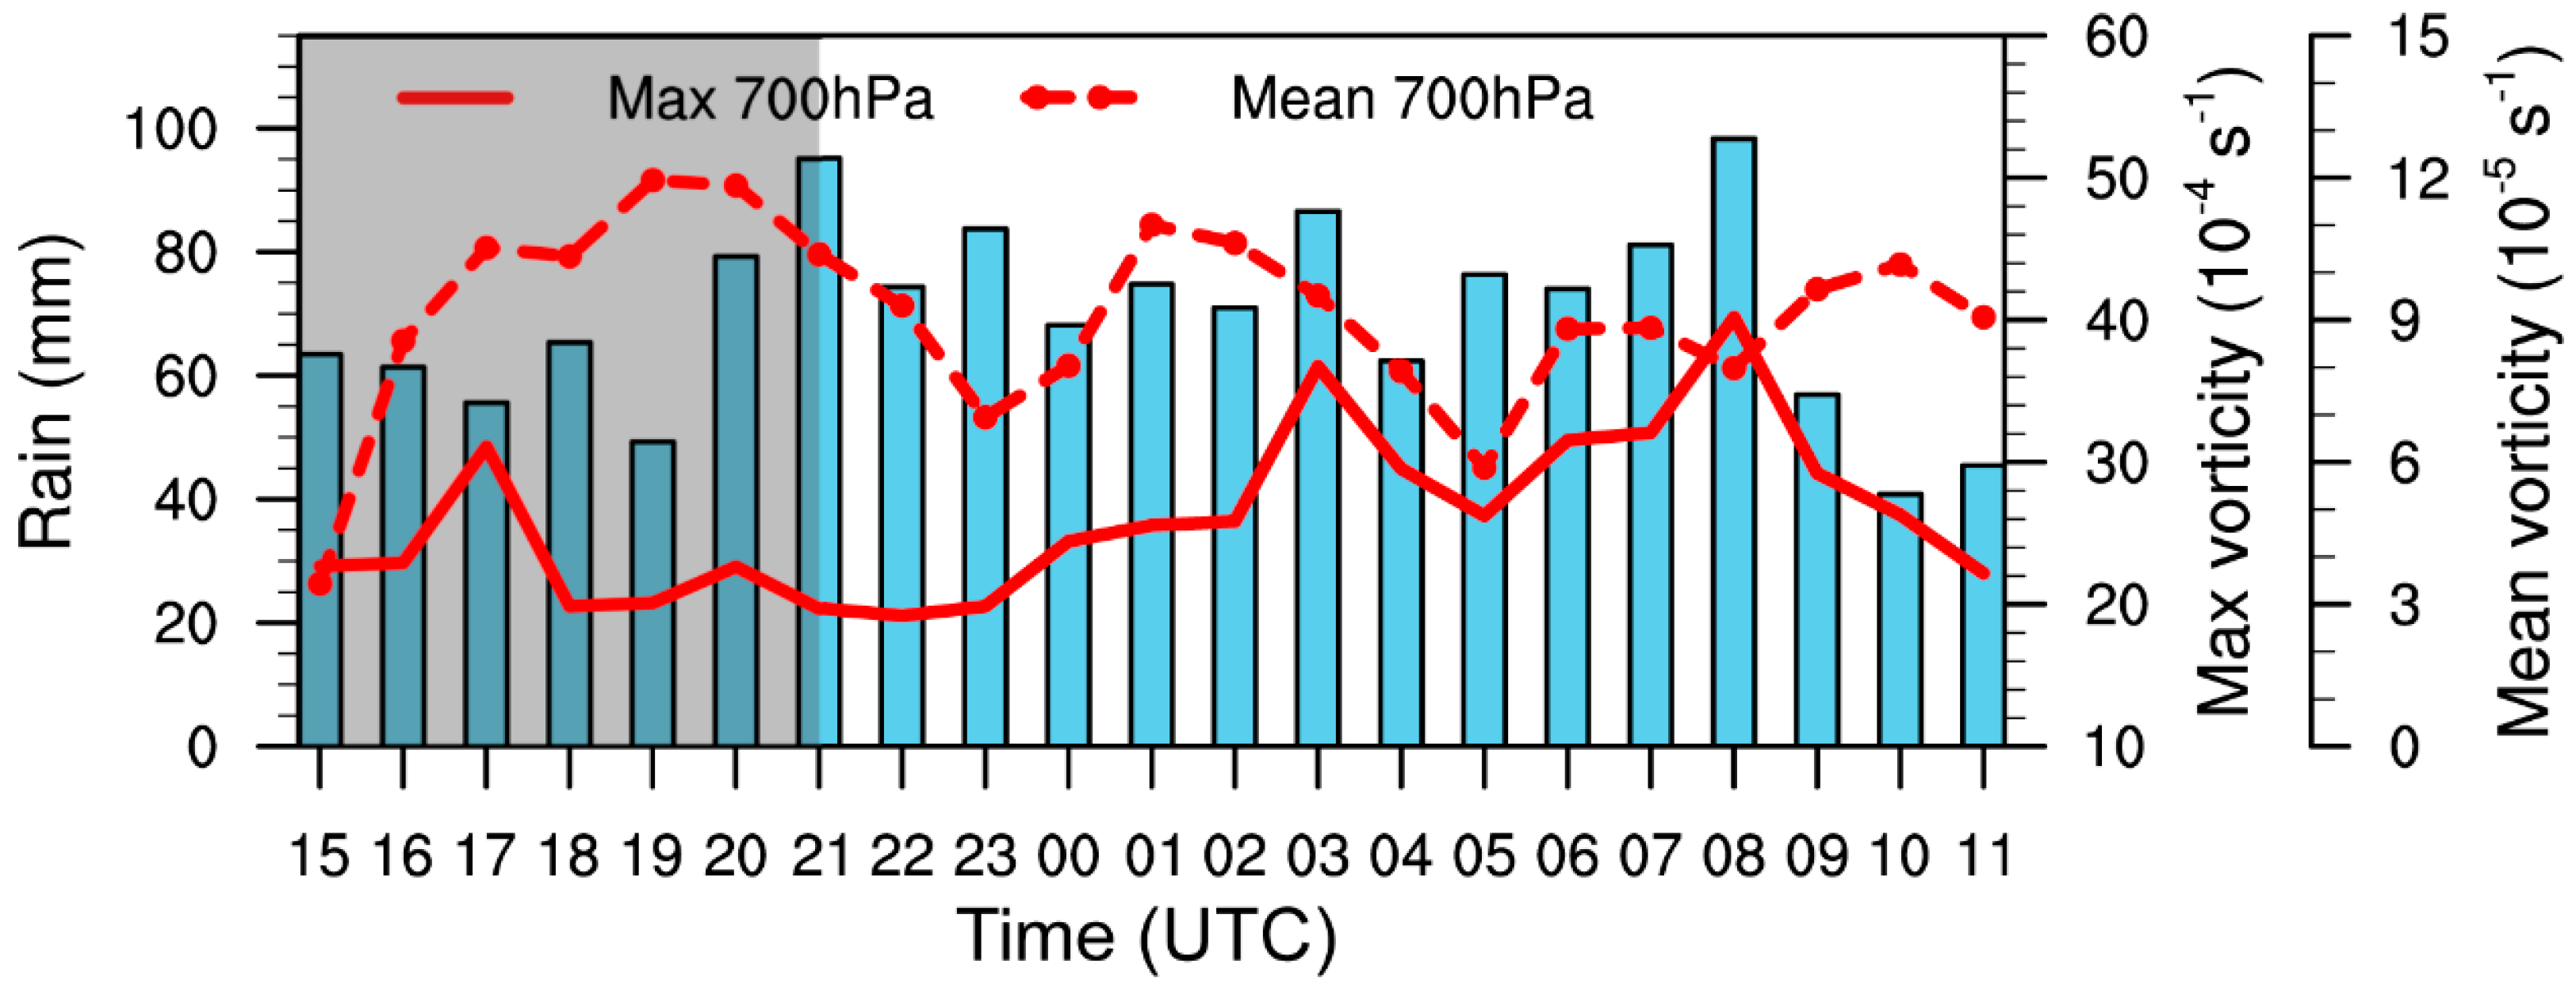
3.2.2. The Impact of the Huang-Huai Vortex on Extreme Hourly Rainfall
4. Discussion
5. Conclusions
Author Contributions
Funding
Data Availability Statement
Conflicts of Interest
Appendix A


References
- Luo, Y.; Du, Y. The Roles of Low-level Jets in “21·7” Henan Extremely Persistent Heavy Rainfall Event. Adv. Atmos. Sci. 2023, 40, 350–373. [Google Scholar] [CrossRef]
- Fu, S.; Zhang, Y.; Wang, H.; Tang, H.; Li, W.; Sun, J. On the evolution of a long-lived mesoscale convective vortex that acted as a crucial condition for the extremely strong hourly precipitation in Zhengzhou. J. Geophys. Res. Atmos. 2022, 127, e2021JD036233. [Google Scholar] [CrossRef]
- Li, W.; Ma, H.; Fu, R.; Han, H.; Wang, X. Development and maintenance mechanisms of a long-lived mesoscale vortex which governed the earlier stage of the “21.7” Henan torrential rainfall event. Front. Earth Sci. 2022, 10, 909662. [Google Scholar] [CrossRef]
- Xu, H.; Duan, Y.; Li, Y.; Wang, H. Indirect effects of binary typhoons on an extreme rainfall event in Henan Province, China From 19 to 21 July 2021: 1. Ensemble-based analysis. J. Geophys. Res. Atmos. 2022, 127, e2021JD036265. [Google Scholar] [CrossRef]
- Kong, Q.; Fu, J.L.; Chen, Y.; Zhang, F.; Hu, N. Evolution Characteristics and Formation Analysis of Mesoscale Low- level Jet and Vortex in Henan Province During the July 2021 Severe Torrential Rain. Meteorol. Mon. 2022, 48, 1512–1524. (In Chinese) [Google Scholar] [CrossRef]
- Xu, L.; Cheng, W.; Deng, Z.; Liu, J.; Wang, B.; Lu, B.; Wang, S.; Dong, L. Assimilation of the FY-4A AGRI clear-sky radiance data in a regional numerical model and its impact on the forecast of the “21·7” Henan extremely persistent heavy rainfall. Adv. Atmos. Sci. 2023, 40, 920–936. [Google Scholar] [CrossRef]
- Yin, R.; Han, W.; Wang, H.; Wang, J. Impacts of FY-4A GIIRS water vapor channels data assimilation on the forecast of “21·7” extreme rainstorm in Henan, China with CMA-MESO. Remote Sens. 2022, 14, 5710. [Google Scholar] [CrossRef]
- Deng, L.; Feng, J.; Zhao, Y.; Bao, X.; Huang, W.; Hu, H.; Duan, Y. The remote effect of binary Typhoon Infa and Cempaka on the “21.7” heavy rainfall in Henan Province, China. J. Geophys. Res. Atmos. 2022, 127, e2021JD036260. [Google Scholar] [CrossRef]
- Xu, H.; Duan, Y.; Li, Y.; Wang, H. Indirect effects of binary typhoons on an extreme rainfall event in Henan Province, China from 19 to 21 July 2021: 2. Numerical study. J. Geophys. Res. Atmos. 2022, 127, e2021JD036083. [Google Scholar] [CrossRef]
- Yin, J.; Gu, H.; Liang, X.; Yu, M.; Sun, J.; Xie, Y.; Li, F.; Wu, C. A possible dynamic mechanism for rapid production of the extreme hourly rainfall in Zhengzhou City on 20 July 2021. J. Meteorol. Res. 2022, 36, 1–20. [Google Scholar] [CrossRef]
- Wang, S.; Yu, E.; Wang, H. A simulation study of a heavy rainfall process over the Yangtze River valley using the two-way nesting approach. Adv. Atmos. Sci. 2012, 29, 731–743. [Google Scholar] [CrossRef]
- Fu, S.; Li, W.; Ling, J. On the evolution of a long-lived mesoscale vortex over the Yangtze River Basin: Geometric features and interactions among systems of different scales. J. Geophys. Res. Atmos. 2015, 120, 11889–11917. [Google Scholar] [CrossRef]
- Zhang, Y.; Zhang, F.; Davis, C.A.; Sun, J. Diurnal evolution and structure of long-lived mesoscale convective vortices along the mei-yu front over the East China plains. J. Atmos. Sci. 2018, 75, 1005–1025. [Google Scholar] [CrossRef]
- Su, A.; Cui, L.; Xu, W.; Lin, L. Comparative analysis on low vortex characteristics in two extra heavy rain processes over Henan in July 2010. Torrential Rain Disasters 2012, 31, 328–335. (In Chinese) [Google Scholar]
- Zhang, Y.; Wang, X.; Liang, J.; Li, Z.; Wang, H. Analysis on mesoscale characteristics of two vortex rainstorms in the Huanghe-Huaihe regions. Torrential Rain Disasters 2013, 32, 303–313. (In Chinese) [Google Scholar] [CrossRef]
- Sun, J.; Zhao, S.; Xu, G.; Meng, Q. Study on a mesoscale convective vortex causing heavy rainfall during the Mei-yu season in 2003. Adv. Atmos. Sci. 2010, 27, 1193–1209. [Google Scholar] [CrossRef]
- Weisman, M.L.; Davis, C.A. Mechanisms for the generation of mesoscale vortices within quasi-linear convective systems. J. Atmos. Sci. 1998, 55, 2603–2622. [Google Scholar] [CrossRef]
- Hersbach, H.; Bell, B.; Berrisford, P.; Hirahara, S.; Horanyi, A.; Muñoz-Sabater, J.; Nicolas, J.; Peubey, C.; Radu, R.; Schepers, D. The ERA5 global reanalysis. Q. J. R. Meteorol. Soc. 2020, 146, 1999–2049. [Google Scholar] [CrossRef]
- Wang, X.; Liu, Y. Causes of extreme rainfall in May 2013 over Henan Province: The role of the southwest vortex and low-level jet. Theor. Appl. Climatol. 2017, 129, 701–709. [Google Scholar] [CrossRef]
- Du, Y.; Zhang, Q.; Chen, Y. Numerical simulations of spatial distributions and diurnal variations of low-level jets in China during early summer. J. Clim. 2014, 27, 5747–5767. [Google Scholar] [CrossRef]
- Dong, P.M.; Zhao, S.X. A diagnostic study of mesoscale lows (disturbances) on Meiyu front and associated heavy rainfall. Chin. J. Atmos. Sci. 2004, 28, 876–891. (In Chinese) [Google Scholar] [CrossRef]
- Chen, S.; Frank, W.M. A numerical study of the genesis of extratropical convective mesovortices. Part I: Evolution and dynamics. J. Atmos. Sci. 1993, 50, 2401–2426. [Google Scholar] [CrossRef]
- Yin, J.; Gu, H.; Yu, M.; Bao, X.; Xie, Y.; Liang, X.D. Synergetic roles of dynamic and cloud microphysical processes in extreme short-term rainfall: A case-study. Q. J. R. Meteorol. Soc. 2022, 148, 3660–3676. [Google Scholar] [CrossRef]
- Thompson, G.; Rasmussen, R.M.; Manning, K. Explicit forecasts of winter precipitation using an improved bulk microphysics scheme. Part I: Description and sensitivity analysis. Mon. Weather Rev. 2004, 132, 519–542. [Google Scholar] [CrossRef]
- Iacono, M.J.; Delamere, J.S.; Mlawer, E.J.; Clough, S.A. Development and evaluation of RRTMG_SW, a shortwave radiative transfer model for general circulation model applications. In Proceedings of the 14th Atmos Radiation Measurement (ARM) Science Team Meeting, Albuquerque, NM, USA, 22–26 March 2004. [Google Scholar]
- Iacono, M.J.; Mlawer, E.J.; Clough, S.A.; Morcrette, J.J. Impact of an improved longwave radiation model, RRTM, on the energy budget and thermodynamic properties of the NCAR community climate model, CCM3. J. Geophys. Res. Atmos. 2000, 105, 14873–14890. [Google Scholar] [CrossRef]
- Clough, S.A.; Shephard, M.W.; Mlawer, E.J.; Delamere, J.S.; Iacono, M.J.; Cady-Pereira, K.; Boukabara, S.; Brown, P.D. Atmospheric radiative transfer modeling: A summary of the AER codes. J. Quant. Spectrosc. Radiat. Transf. 2005, 91, 233–244. [Google Scholar] [CrossRef]
- Hong, S.; Lim, J.O.J. The WRF single-moment 6-class microphysics scheme (WSM6). Asia-Pac. J. Atmos. Sci. 2006, 42, 129–151. [Google Scholar]
- Tewari, M.; Chen, F.; Wang, W.; Dudhia, J.; Lemone, M.A.; Mitchell, K.; Ek, M.; Gayno, G.; Wegiel, J.; Cuenca, R. Implementation and verification of the Unified NOAH land surface model in the WRF model. In Proceedings of the 20th Conference on Weather Analysis and Forecasting/16th Conf. on Numerical Weather Prediction, Seattle, WA, USA, 14 January 2004. [Google Scholar]
- Tiedtke, M. A comprehensive mass flux scheme for cumulus parameterization in large-scale models. Mon. Weather Rev. 1989, 117, 1779–1800. [Google Scholar] [CrossRef]
- Yang, Y.; Gu, W.; Zhao, R.; Liu, J. The statistical analysis of low vortex during Meiyu season in the lower reaches of the Yangtze. J. Appl. Meteorol. Sci. 2010, 21, 11–18. (In Chinese) [Google Scholar] [CrossRef]
- Kirk, J.R. Comparing the dynamical development of two mesoscale convective vortices. Mon. Weather Rev. 2003, 131, 862–890. [Google Scholar] [CrossRef]
- Ran, L.; Li, S.; Zhou, Y.; Yang, S.; Ma, S.; Zhou, K.; Shen, D.; Jiao, B.; Li, N. Observational analysis of the dynamic, thermal, and water vapor characteristics of the “7.20” extreme rainstorm event in Henan Province. Chinese J. Atmos. Sci. 2021, 45, 1366–1383. (In Chinese) [Google Scholar]
- Blackadar, A.K. Boundary layer wind maxima and their significance for the growth of nocturnal inversions. Bull. Am. Meteorol. Soc. 1957, 38, 283–290. [Google Scholar] [CrossRef]
- Du, Y.; Chen, G. Heavy rainfall associated with double low-level jets over southern China. Part I: Ensemble-Based Analysis. Mon. Weather Rev. 2018, 146, 3827–3844. [Google Scholar] [CrossRef]
- Mai, Z.; Fu, S.; Sun, J.; Hu, L.; Wang, X. Key statistical characteristics of the mesoscale convective systems generated over the Tibetan Plateau and their relationship to precipitation and southwest vortices. Int. J. Climatol 2020, 36, 3148–3160. [Google Scholar] [CrossRef]
- Byers, H.R.; Battan, L.J. Some Effects of Vertical Wind Shear on Thunderstorm Structure. Bull. Am. Meteorol. Soc. 1949, 30, 168–175. [Google Scholar] [CrossRef]
- Bennetts, D.; Bader, M.; Marles, R. Convective cloud merging and its effect on rainfall. Nature 1982, 300, 42–45. [Google Scholar] [CrossRef]
- Wescott, N.E. A historical perspective on cloud mergers. Bull. Am. Meteorol. Soc. 1984, 5, 219–226. [Google Scholar] [CrossRef]
- Tian, S. Effect of merging of the convective cloud clusters on occurrence of heavy rainfall. Adv. Atmos. Sci. 1991, 8, 499–504. [Google Scholar] [CrossRef]
- Peng, W.; Xu, X.; Xue, M.; Zhang, C.; Wang, Y.; Zhao, K.; Zhou, A.; Zhang, S.; Zhu, K. On key dynamical processes supporting the 21.7 Zhengzhou record-breaking hourly rainfall in China. Adv. Atmos. Sci. 2023, 40, 337–349. [Google Scholar] [CrossRef]


Disclaimer/Publisher’s Note: The statements, opinions and data contained in all publications are solely those of the individual author(s) and contributor(s) and not of MDPI and/or the editor(s). MDPI and/or the editor(s) disclaim responsibility for any injury to people or property resulting from any ideas, methods, instructions or products referred to in the content. |
© 2024 by the authors. Licensee MDPI, Basel, Switzerland. This article is an open access article distributed under the terms and conditions of the Creative Commons Attribution (CC BY) license (https://creativecommons.org/licenses/by/4.0/).
Share and Cite
Xu, L.; Chen, T.; Liu, J.; Fu, S.; Cheng, W.; Liu, H.; Lu, B.; He, Y.; Zhu, S.; Liu, Y.; et al. Simulation and Analysis of the Mesoscale Vortex Affecting the “21·7” Extreme Rainstorm in Henan. Remote Sens. 2024, 16, 280. https://doi.org/10.3390/rs16020280
Xu L, Chen T, Liu J, Fu S, Cheng W, Liu H, Lu B, He Y, Zhu S, Liu Y, et al. Simulation and Analysis of the Mesoscale Vortex Affecting the “21·7” Extreme Rainstorm in Henan. Remote Sensing. 2024; 16(2):280. https://doi.org/10.3390/rs16020280
Chicago/Turabian StyleXu, Lan, Tao Chen, Juanjuan Liu, Shenming Fu, Wei Cheng, Hongbo Liu, Bing Lu, Yujun He, Shujun Zhu, Yiran Liu, and et al. 2024. "Simulation and Analysis of the Mesoscale Vortex Affecting the “21·7” Extreme Rainstorm in Henan" Remote Sensing 16, no. 2: 280. https://doi.org/10.3390/rs16020280