Article

Estimation of Rainfall via IMERG-FR and Its Relationship with the Records of a Rain Gauge Network with Spatio-Temporal Variation, Case of Study: Mexican Semi-Arid Region

by
Eric Muñoz de la Torre
1,
Julián González Trinidad
1,*,
Efrén González Ramírez
1,
Carlos Francisco Bautista Capetillo
1,
Hugo Enrique Júnez Ferreira
1,
Hiram Badillo Almaraz
2 and
Maria Ines Rivas Recendez
1
1
Electrical Engineering Academic Unit, 21st Century Campus, Autonomous University of Zacatecas, Zacatecas 98160, Mexico
2
Engineering Academic Unit I, Campus I, Autonomous University of Zacatecas, Zacatecas 98060, Mexico
*
Author to whom correspondence should be addressed.
Remote Sens. 2024, 16(2), 273; https://doi.org/10.3390/rs16020273
Submission received: 8 November 2023 / Revised: 14 December 2023 / Accepted: 21 December 2023 / Published: 10 January 2024
(This article belongs to the Special Issue Advanced Microwave Remote Sensing Technologies for Hydrology)

Abstract

:
In the last few years, Satellite Precipitation Estimates (SPE) have been increasingly used for rainfall estimation applications. Their validity and accuracy are influenced by several factors related to the location where the SPEs are applied. The objective of this study is to evaluate the performance of the Integrated Multisatellite Retrievals for Global Precipitation Measurement Version 06 Half-Hour Temporal Resolution (IMERG-FR V06 HH) for rainfall estimation, as well as to determine its relationships with the hourly and daily rain gauge network data in a semiarid region during 2019–2021. The methodology contemplates the temporality, elevation, rainfall intensity, and rain gauge density variables, carrying out a point-to-pixel analysis using continuous, (Bias, r, ME, and RMSE), categorical (POD, FAR, and CSI), and volumetric (VHI, VFAR, and VCSI) statistical metrics to understand the different behaviors between the rain gauge and IMERG-FR V06 HH data. IMERG-FR greatly underestimated the heavy rainfall events in values of −63.54 to −23.58 mm/day and −25.29 to −11.74 mm/30 min; however, it overestimates the frequency of moderate rain events (1 to 25 mm/day). At making the correlation (r) between the temporal scales, the monthly temporal resolution was the one that better relates the measured and estimated data, as well as reported r values of 0.83 and 0.85, where records at shorter durations in IMERG-FR do not detect them. The weakness of this system, according to the literature and confirmed by the research findings, in the case of hydrological phenomena, is that recording or estimating short durations is essential for the water project, and therefore, the placement of rain gauges. The 1902–2101 m.a.s.l. range elevation has the best behavior between the data with the lowest error and best detection ability, of which IMERG-FR tended to overestimate the rain at higher altitudes. Considering that the r for two automated rain gauges per IMERG-FR pixel density was 0.74, this indicates that the automated rain gauges versus IMERG-FR have a better data fit than the rain gauges versus IMERG-FR. The distance to centroid and climatic evaluations did not show distinctive differences in the performance of IMERG. These findings are useful to improve the IMERG-FR algorithms, guide users about its performance at semiarid plateau regions, and assist in the recording of data for hydrological projects.

1. Introduction

Precipitation is an important component of the climate system and plays a key role in the Earth’s hydrologic cycle and energy balance. Precipitation variability in its rate, amount, and distribution substantially determine the Earth’s ecosystem, water cycle, and climate [1,2,3,4]. Global climate change, due to unwise anthropogenic intervention, is undeniable. At the global level, the occurrences and severity of climate extremes have increased and are causing loss of life and property and environmental damage [5]. Accurate and reliable precipitation information is therefore critical for different fields in geoscience, such as hydrological and ecological modeling, water resource management, climate analysis, flood and drought monitoring, soil movement modeling, and forecasting. However, in regions with difficult access, like in non-developed or developing countries [6], precipitation measurements from rain gauges or other in situ precipitation-measuring instruments are limited by the scarcity of low-density local network observations [3,4,7,8]. Additionally, a low density of rain gauges in agricultural areas significantly affects the reliability of insurance products (agricultural security). Due to micro-climatic factors, weather parameters may differ even between locations in close proximity [9]. A reliable precipitation assessment requires a minimum number of precipitation stations, which developing countries do not have [10].
Secondary sources of precipitation data are indirectly measured via radar, numerical models, and Satellite Precipitation Estimates (SPE) [2,11,12]. Satellites can provide precipitation estimates at larger geographic scales, and thus, these estimates offer a potential source for obtaining high-quality spatio-temporal distributions of precipitation [13]. This is particularly important in cases where socio-economic activities rely heavily on aquifers for water resources. However, monitoring precipitation via spatial sensors in arid areas is a challenging job because such areas are characterized by low precipitation intensities and large spatial heterogeneities [14].
IMERG-FRThe complex topography results in highly variable spatio-temporal precipitation patterns that are not fully captured via the rain gauge monitoring networks [15]. Furthermore, given that most urbanization exists in the lowlands, it follows that most rain gauges are concentrated in the lowlands, while the uplands are underrepresented. Low precipitation intensity events (light rain) represent another challenge for satellite precipitation products [16]. In the last few decades, SPE have become an alternative source of precipitation estimation with widespread applications such as (distributed) hydrological modeling, geomorphological and landscape evolution, flow forecasting and early warning systems, as well as investigations into atmospheric processes and storm structures [15], up to the monitoring of extreme events such as droughts and floods [17]. However, SPE techniques are not sufficiently accurate because they involve numerous uncertainties. Uncertainties can arise from timing errors in sampling, device calibration errors, errors in the algorithms used, local weather conditions, and topographic features. Accurate data validation is crucial to verify the performance of SPE, so that they can be used in various applications [11,12,13].
Numerous studies have been conducted to compare the performance of different SPE, proving that IMERG-FR has an excellent performance compared with its predecessors and other SPE. Huang et al., 2018 [18], evaluated IMERG-FR against rain gauges in Taiwan, concluding that IMERG-FR subestimated the precipitation magnitude in the region, where the bias was higher over mountain areas and in the warm seasons. Nevertheless, IMERG-FR was able to qualitatively represent several distinct features of Taiwan’s precipitation changes.
After evaluating the three products of IMERG (Early Run, Late Run, and Final Run) against rain gauges in the Lower Colorado River Basin of Texas, the researchers concluded that the final run product has the best performance among these three products. However, all products have similar performance in precipitation detection capability, besides that they need additional improvements for a better accuracy in the precipitation estimates [19]. Tan and Santo, 2018 [20], compared all IMERG products, TMPA 3B42, 3B42-RT, and PERSIANN-CDR, against rain gauges over Malaysia, concluding that all SPE subestimated very light and extreme precipitation classes, but overestimated light-to-high precipitation classes. IMERG products have the best light precipitation detection capability. The IMERG-FR product did not exhibit significant improvements over its “near-real-time” products.
One study evaluated GSMaP_MVK V7, IMERG-FR V05, and CHIRPS-2.0 against rain gauges over Bali Island, Indonesia, concluding that IMERG-FR performed best on daily, penta-day, and seasonal timescales. In addition, it demonstrated greater ability to detect precipitation events at different altitudes, but overestimated the frequency of moderate precipitation events [11]. Freitas et al., 2020 [21], evaluated the performance of IMERG-FR V06B in capturing sub-daily precipitation events and their properties in Brazil. Their results showed that IMERG-FR can properly estimate sub-daily precipitation depth, with the best results found in the southern part of the country. However, the results showed large bias of IMERG-FR for precipitation duration and intensity.
The IMERG V05B products against rain gauges over Saudi Arabia were analyzed, with the researchers concluding that all IMERG products have a very weak seasonal correlation with ground observations; spring and summer were the seasons with the best rain detection; light and medium rain presented the lowest detection errors, of which the opposite was true for the highest precipitation intensities; storm events showed a high correlation; and detectability improved significantly in higher altitude areas, especially in the case of IMERG-FR. However, the largest estimation errors were observed in coastal regions, foothills, and mountainous areas [16]. Morsy et al., 2021 [14], evaluated IMERG-FR and TRMM-3B42 V7 against rain gauges in the southwest of the arid Sinai Peninsula, concluding that IMERG-FR and TRMM showed high performance during light-intensity events; however, they showed the opposite with high-intensity events. IMERG-FR exhibited superior performance than TRMM in all precipitation intensities.
Eleven Gridded Precipitation Products (IMERG-FR V06B included) in Eastern Himalaya were validated using 27 rain gauges as reference. IMERG-FR outperformed the other satellite products, where the best results were given at mid elevation (1000–2000 m.a.s.l.) and in monsoon and summer [22]. For the IMERG-FR performance over China, they found that IMERG-FR has limited ability to detect precipitation events below 5 mm/d, and an even worst performance in areas with a complex winter precipitation phase. The evaluation was affected by the mismatch between the gauge and IMERG-FR data caused by air pollution [23]. After performing a systematic review of the literature to assess the performance of the IMERG products around the world, they concluded that China is the subject of the largest number of IMERG evaluation studies. IMERG-FR’s performance can be improved over mountainous regions characterized by orographic precipitation; complex terrains; and for winter precipitation, at the temporal scales, IMERG-FR performs better at monthly and annual time steps, and each new version shows substantial improvement in almost every spatiotemporal scale and climatic condition [24].
The aims of this research are as follows: (i) evaluating the performance of IMERG-FR V06B at half-hourly, daily, monthly, and seasonally temporal scales in a semiarid region, taking the rain gauge data from the rainy station of the period 2019–2021 as the reference, (ii) validating IMERG-FR at three ranges of elevations where the rain gauges are placed, (iii) analyzing the performance of IMERG-FR at five ranges of daily rainfall intensities and three ranges of hourly rainfall intensities, and (iv) calculating the performance of IMERG-FR at 1–3 rain gauge densities.

2. Materials and Methods
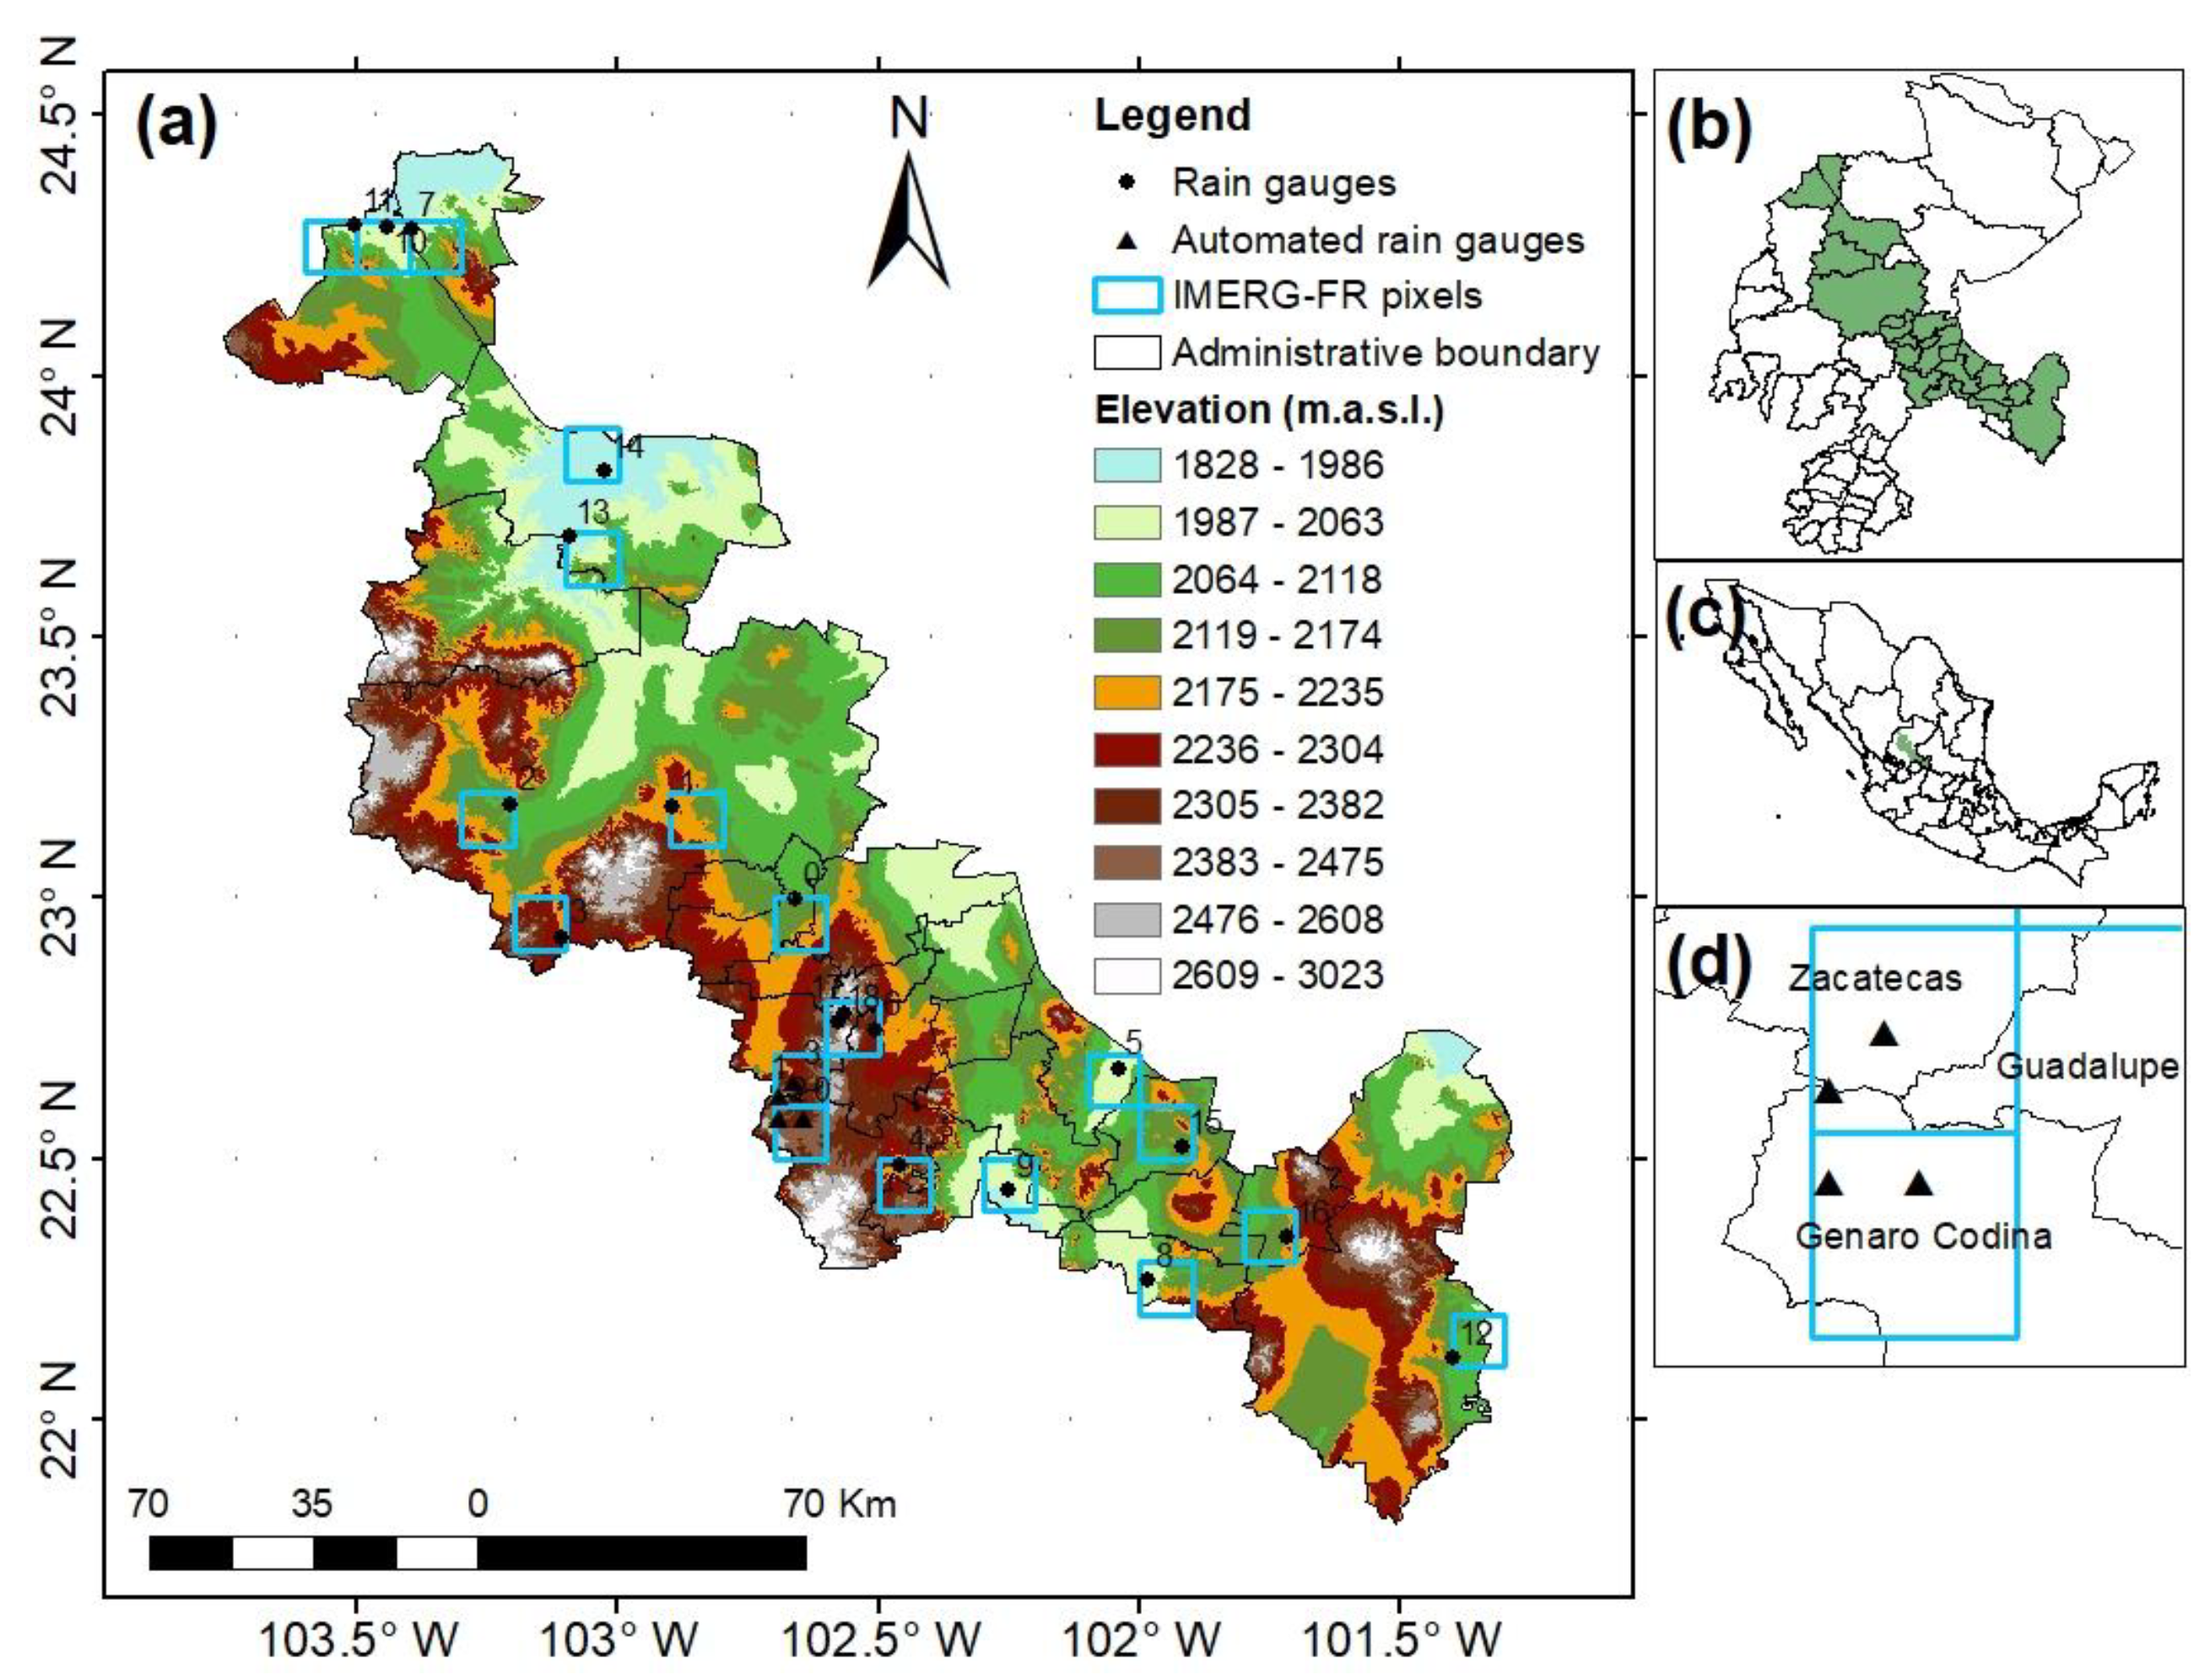
2.1. Study Area

The study area has a surface of 20,142.31 km2 inside the state of Zacatecas (Figure 1a,b) that is located in the north–central region of Mexico (Figure 1c), between coordinates 21.02° and 25.12°N and 100.72° and 104.37°W [25,26]. It presents a predominant semiarid climate (BS1kw) (Figure 2). The state’s topography is quite variable, including mountains, valleys, plains, and plateaus because it is part of three different physiographic provinces: The Sierra Madre Occidental (located in the north of the state), the Sierra Madre Oriental (center and southeast), and the Central Mexican Plateau (south of the state). The minimum altitude in the state, in the Juchipila river canyon, is 840 m above sea level (m.a.s.l.), whereas the highest point is located on the Cerro de los Pelones, with an altitude of 3160 m.a.s.l.
The city of Zacatecas (the state capital) has an average altitude of 2450 m.a.s.l. [26]. The predominant climate in most of Zacatecas is dry and semi-dry (73%); 17% of the territory, in the east of the state, is temperate subhumid; in 6% of the territory, mainly the north and northeast regions, the climate is very dry, and the remaining 4% of the state, in the south and southwest, presents a subhumid warm climate. The mean annual temperature is 17 °C, with a maximum mean temperature of 30 °C in the month of May and a minimum mean temperature of 3 °C in the month of January. The average annual precipitation is 510 mm; the rainy season is presented in summer in the months of June–September. The dry and semi-dry climate of the state is a limitation for the agriculture with the main crops as corn, oats, wheat, beans, chili, sorghum, nopal, and peach.

2.2. Rain Gauge and Automated Rain GaugeNetwork Data

A total of 25 rain gauges’ daily data from the months May to October of the period 2019–2020 and May to September 2021 was downloaded from the SIH (Sistema de Información Hidrológica) [29]. Also, four automatic rain gauges’ data with records every 5, 10, 15, and 30 min were collected for the same period of time from the automatic rain gauge network of the UAZ (Universidad Autonoma de Zacatecas).
To detect possible monotonic trends in the rainfall data, the non-parametric Mann-Kendall (MK) test was used, with a significance level of 5% [30] applied per year to the 25 rain gauges’ datasets. The data that showed a significance level of <5% were eliminated for presenting a significant trend of rain in the rainy season, of which the eliminated data were the following: six rain gauges complete 3 years of data. The 19 remaining rain gauges were used in this study.
The density of the combined rain gauge network Is of 23 rain gauges per 20,142.31 km2, which is within the minimum density standard recommended by the World Meteorological Organization for flat areas in the temperate, Mediterranean, and tropical zones (recommendation: one gauge per 600–900 km2) [11].
The coordinates and elevations of all the rain gauges (rain gauges and automatic rain gauges) used in this research are shown in Table 1 and Table 2. The missing data were calculated for a total of 520 days from May to October 2019–2020, and May to September 2021 (October was not available yet to download by IMERG). The year 2021 was the most complete data year for the automated rain gauges.

2.3. IMERG Data

The Core Observatory Satellite of the Global Precipitation Measurement (GPM) mission was launched on February 2014; as the successor to TRMM, the GPM mission is the state-of-the-art satellite-based precipitation measurement program over the world. IMERG products were first provided by NASA as version 03 (V03) from March 2014. IMERG released version V06B in 2019. Compared with version V05, it has been optimized and adjusted in data processing, algorithms, and verification. IMERG combines all microwave precipitation estimates, microwave-calibrated IR estimates, rain gauge analyses, and other possible estimates at fine temporal and spatial scales for the TRMM and GPM eras over the entire globe. To accommodate various latency and accuracy requirements, IMERG products provide three types of satellite precipitation data, the first two of which are Near-Real-Time (NRT) products, denoted as IMERG-ER and IMERG-LR; with more data available given the latency period, the “Post-Real-Time” (PRT) final run uses monthly precipitation data to create a research-quality final run product (IMERG-FR). IMERG-FR is adjusted monthly to the Global Precipitation Climatology Center (GPCC) precipitation datasets, which are derived from ~6700 stations worldwide. IMERG-ER and IMERG-LR are available approximately 4 h and 14 h after observation time, respectively, but IMERG-FR is released approximately three and a half months after the month of available observation [31].
In this research, the GPM IMERG Final Precipitation L3 Half-Hourly 0.1° × 0.1° V06 (GPM_3IMERGHH) data were downloaded from the GES DISC (Goddard Earth Sciences Data and Information Services Center) webpage (https://disc.gsfc.nasa.gov/, accessed on 16 April 2022) [32]. The data are presented in files with the NetCDF4 format, where every file has average precipitation intensity information at mm/h, but a temporal resolution of a half hour. A total of 24,l44 files were downloaded from IMERG-FR, corresponding to rainfall intensities with an interval of 30 min for the period 2019–2021. These were processed with a code made in Python [33] to obtain the precipitation information of the pixels that share place with the rain gauges and the automated rain gauges into csv files. The data are at the Universal Time Coordinated (UTC) time, so this was adjusted to the local standard time (UTC–6) [19]. In addition, to obtain the accumulated precipitation, the data were multiplied by 0.5, due to IMERG-FR reporting the rainfall as intensity (mm/h), with interval times of 30 min [19,34] to transform the average precipitation intensity, at mm/h, into precipitation depth in interval times of 30 min, daily, monthly, and six months to compare it with the rain gauge data at the same temporal scales.
Then, the accumulated precipitation amounts are multiplied by a factor of 0.5 as the unit of the half-hourly products is in mm/h.

2.4. Evaluation Techniques

Comparison between IMERG-FR and the rain gauge data were based on a pairwise approach. The point-to-pixel analysis was performed when there was only one rain gauge available inside the IMERG-FR pixel. On the other hand, an average point-to-pixel analysis was considered for IMERG-FR pixels containing more than one rain gauge. The IMERG-FR pixels without any rain gauges were excluded from the analyses. A total of 23 rain gauges and 19 IMERG-FR pixels were used in this study.
The accuracy of IMERG-FR was evaluated at different temporal resolutions, elevations, precipitation intensities, and gauge densities, taking the rain gauge data as the reference with a point-to-pixel analysis. Only the IMERG-FR pixels containing at least one rain gauge were used [16,19,21,22]. The data of the rain gauges that share an IMERG-FR pixel were averaged and then compared with the value of the IMERG-FR pixel in the temporal, topographical, rainfall intensity, and gauge density evaluations. The seasonal temporal resolution is integrated only by the May, June, July, August, September, and October months. June, July, August, and September are the wettest months in the research region.

2.4.1. Temporal Evaluation

The temporal evaluation was conducted by analyzing the performance of IMERG-FR at half-hourly, daily, monthly, and seasonal time resolutions. The half-hourly evaluation only could be performed with the four automated rain gauges distributed in two contiguous pixels (two per pixel) because these are the only ones with sub-daily data. The seasonal evaluation could only be performed with the rain gauges because of the low quantity of automated rain gauges. The observed and estimated data were aggregated for obtaining the coarser time resolutions. Interpolation using Inverse Distance Weighted was used with the average monthly precipitation of the 3-year data, to see the differences in the precipitation amount recorded via IMERG-FR and the rain gauges. The objective of this evaluation is to identify the variance in the performance of IMERG-FR at different time resolutions with the aggregation.

2.4.2. Topographical Evaluation

This evaluation was conducted by analyzing the performance of IMERG-FR at three ranges of elevation where the rain gauges and the automated rain gauges are located: 1902–2101, 2119–2323, and 2352–2612 m.a.s.l.; and three temporal resolutions: daily, monthly, and seasonal. The 1902–2101 m.a.s.l. elevation is integrated with nine rain gauges, the 2119–2323 m.a.s.l. elevation with eight rain gauges and two automated rain gauges, and the 2352–2612 m.a.s.l. elevation with two rain gauges and two automated rain gauges.

2.4.3. Rainfall Intensity-Based Evaluation

This evaluation was conducted by analyzing the performance of IMERG-FR at six ranges of daily rainfall intensities as Liu et al., 2020 [11], following the recommendations of the World Meteorological Organization (WMO). However, in this research, the ranges are renamed for a more detailed classification as 0–1 mm/day (very light rain events), 1–5 mm/day (light rain events), 5–10 (moderate–light rain events), 10–25 mm/day (moderate rain events), 25–50 mm/day (moderate–heavy rain events), and >50 mm/day (heavy rain events). The sub-daily data were analyzed at three ranges of hourly rainfall intensities following the American Meteorological Society (AMS) recommendation: 0–2.5 mm/h (light rain events), 2.6–7.6 mm/h (moderate rain events), and over 7.6 mm/h (heavy rain events) [35]. The hourly rainfall intensities of the AMS were converted (multiplied by 0.5) from mm/h to mm/30 min to match with our sub-daily data. Probability distribution functions (PDF) were used for graphical comparison of the IMERG-FR and gauge data. The PDF, which presents useful information on the histogram frequency of a dataset, has been used in many studies to evaluate the SPE performance [11]. Therefore, PDF was used in the present study to evaluate the performance of IMERG-FR in detecting the frequency of rainfall events at different rainfall intensities. Such an evaluation is useful to determine differences in rainfall intensity measured via a rain gauge and that is estimated using satellite pixels.

2.4.4. Spatial-Temporal Evaluation Rain Gauge Density

This evaluation was conducted by analyzing the performance of IMERG-FR at three gauge densities with a daily temporal scale: 1–3 rain gauges per IMERG-FR pixel. A total of 16 rain gauges and 4 automated rain gauges were used in the one rain gauge per pixel density; the four automated rain gauges were used in the two gauges per pixel density; and three rain gauges were used in the three gauges per pixel density. The four automated rain gauges that share two IMERG-FR pixels and the three rain gauges that share the same IMERG-FR pixel were used in the one and two rain gauges per IMERG-FR pixel densities because of the missed data. In addition to linear regression, the multiple linear regressions was used to evaluate the two and three rain gauges per IMERG-FR pixel densities.

2.4.5. Distance to Centroid of IMERG-FR Pixel Evaluation

This evaluation was conducted by analyzing the performance of IMERG-FR at two groups of rain gauges divided by the distance from their locations to the centroid of the IMERG-FR pixel where they are. The centroids of the IMERG-FR pixels were calculated by the “Feature to Point” Tool of ArcMap 10.5. The daily temporal scale was used at this evaluation. The objective of this evaluation is to calculate the performance of IMERG-FR in the basis of the distance of the rain gauges to the centroid of the IMERG-FR pixel.

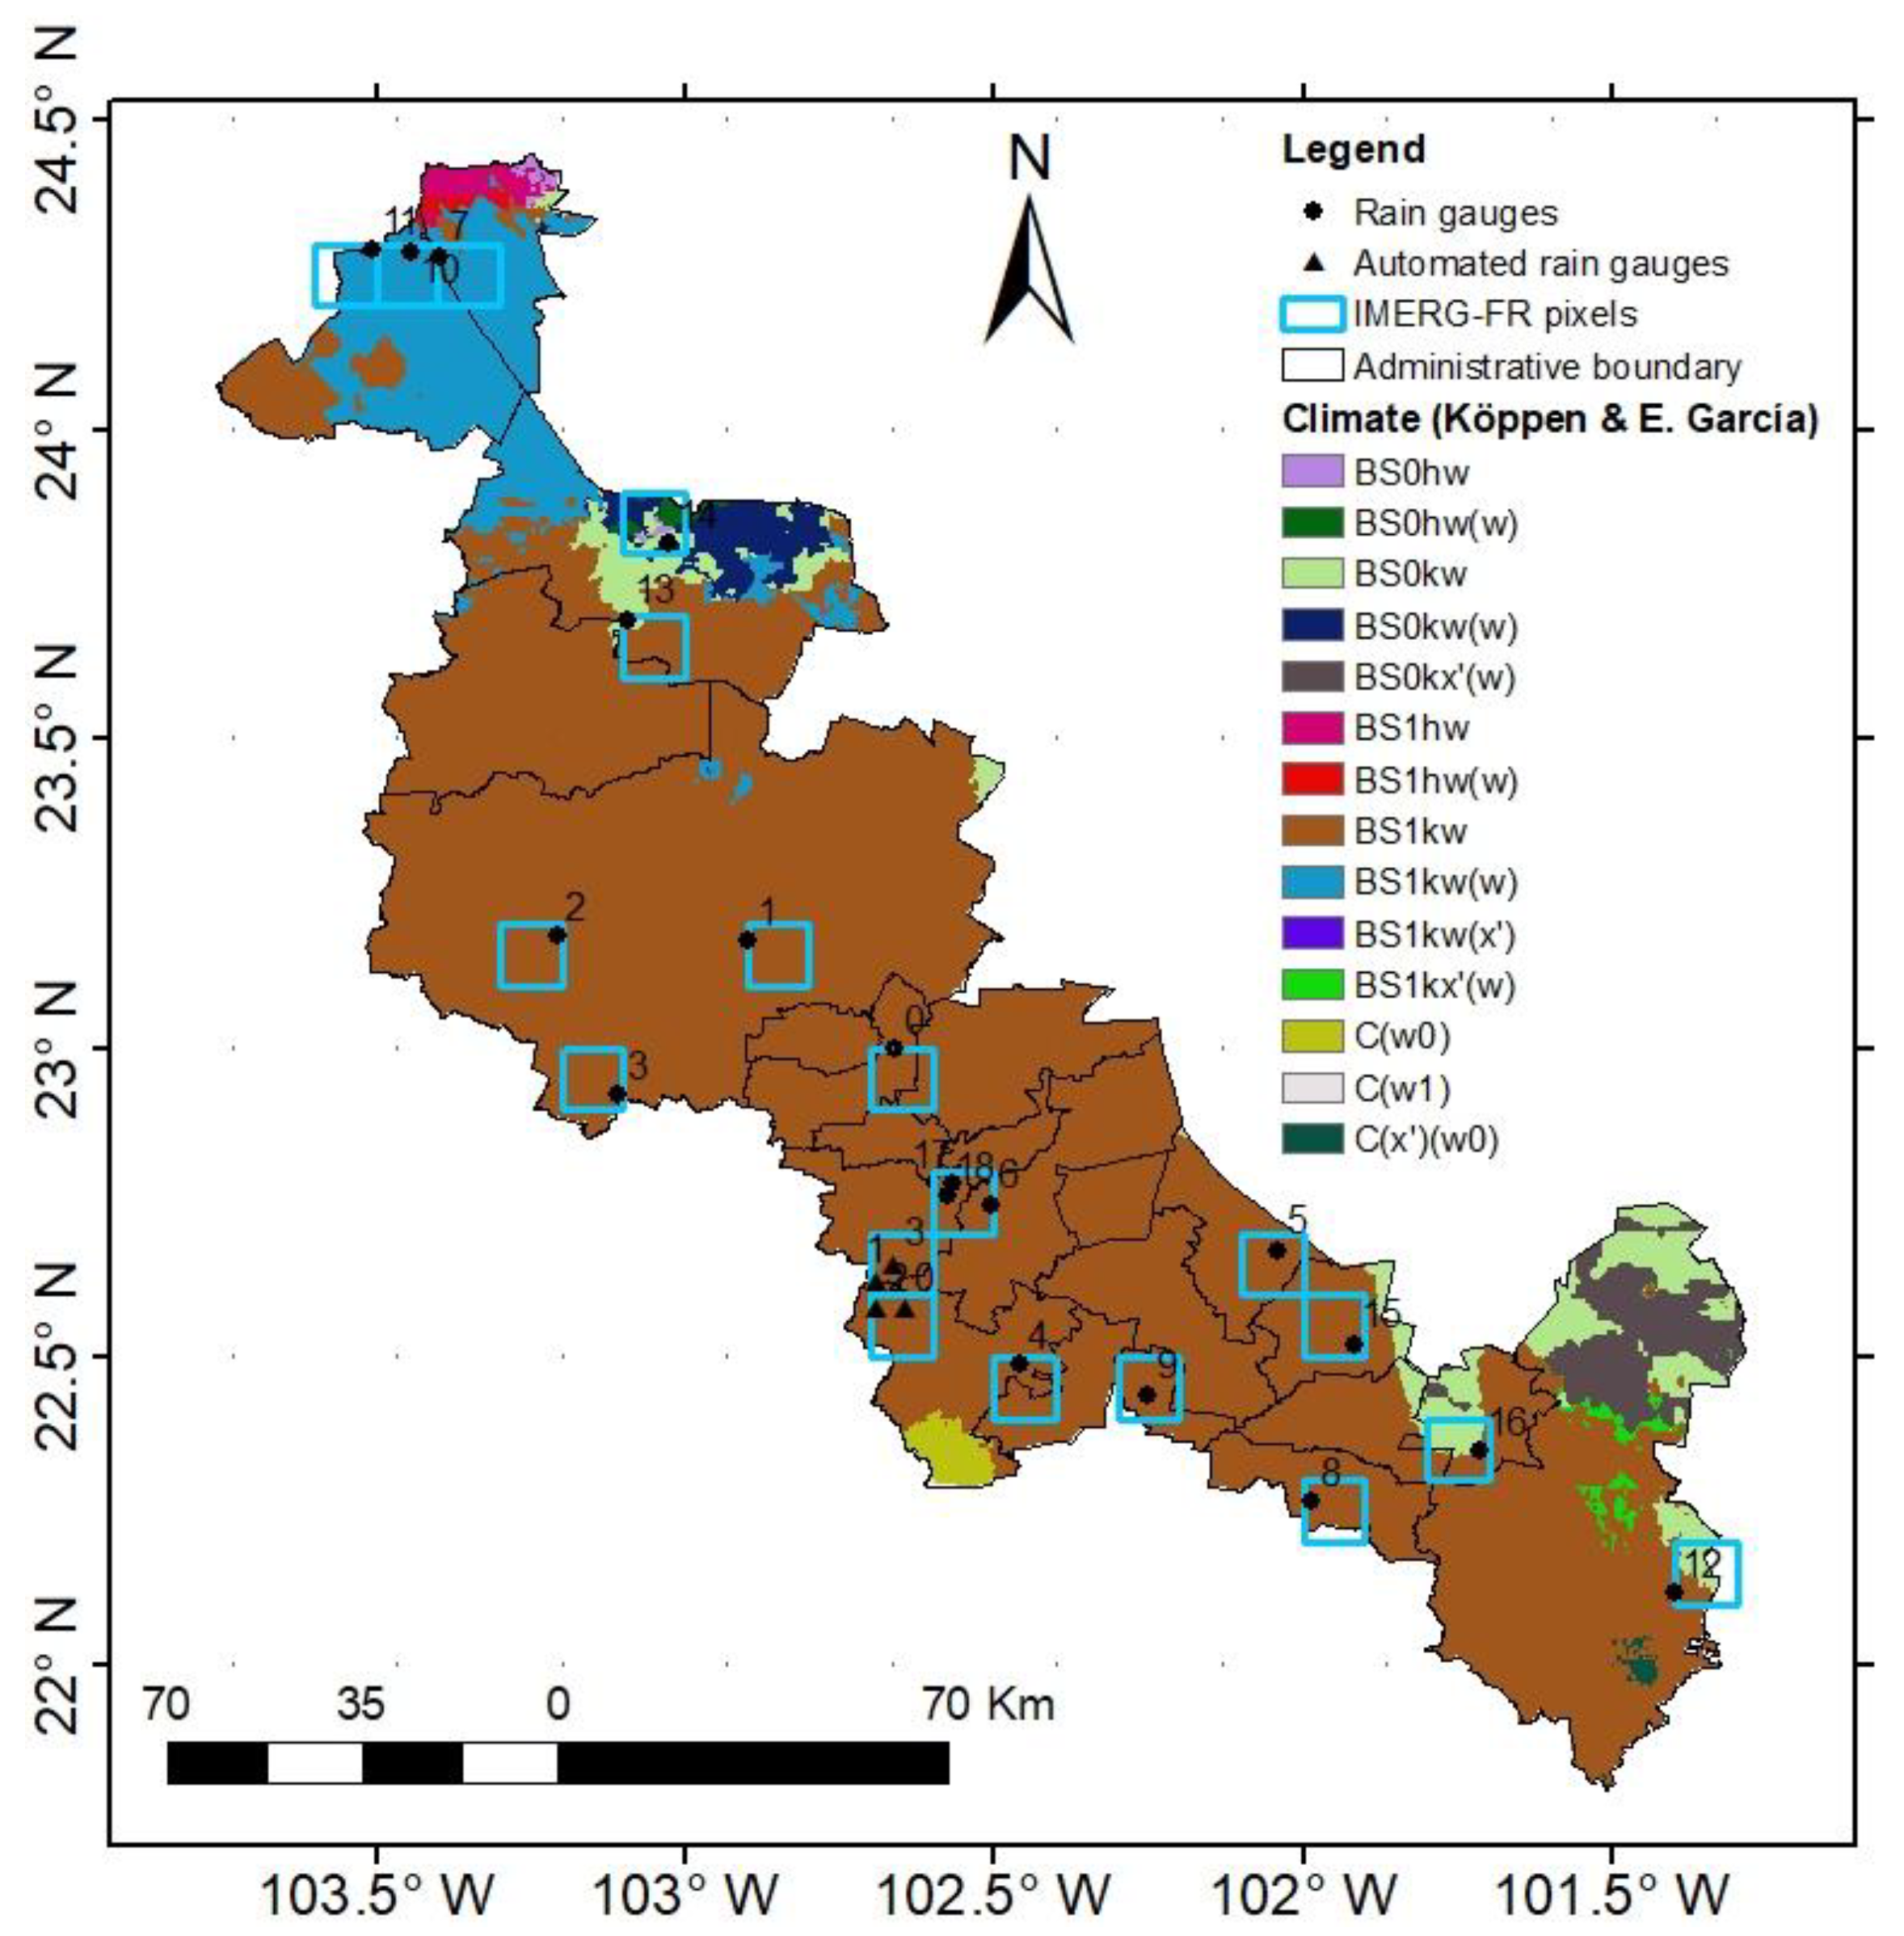
2.4.6. Climatic Evaluation

This evaluation was conducted by analyzing the performance of IMERG-FR at three climates of Köppen, modified by Enriqueta García, where the rain gauges are placed. A total of 12 rain gauges are in the BS1kw climate, four rain gauges are in the BS1kw(w) climate, and three rain gauges are in the BS0kw climate. Only the daily temporal scale was used in order to evaluate the performance of IMERG-FR at three climates. Figure 2 represents the climate distribution of the study area, noticing that the semiarid climate BS1kw is the predominant one.

2.5. Estimation Methods

IMERG-FR’s performance will be analyzed quantitatively via continuous statistical measurement, categorical metrics, and volumetric indices. Continuous metrics that will be used to measure the difference between satellite estimates and precipitation observations include relative bias ( B i a s ), Pearson´s correlation coefficient ( r ), mean error ( M E ), mean absolute error (MAE), and the root mean square error ( R M S E ) [3,11,16,36,37]. The B i a s , r , M E , M A E , and R M S E values will be calculated using the following equations, respectively:
B i a s = i = 1 N ( S i G i ) i = 1 N ( G i )
r = i = 1 N ( S i S ¯ ) ( G i G ¯ ) i = 1 N ( S i S ¯ ) 2 i = 1 N ( G i G ¯ ) 2
M E = 1 N i = 1 N ( S i G i )
M A E = 1 N i = 1 N ( | S i G i | )
R M S E = 1 N i = 1 N ( S i G i ) 2
where S i represents satellite precipitation estimates, G i is ground-based precipitation observation, S ¯ is satellite mean precipitation estimates, G ¯ indicates ground-based mean precipitation observation, N represents the total number of data, and i is the sample number [11]. The S i , G i , S ¯ , and G ¯ units are presented in mm/30 min, mm/day, mm/month, and mm/station, respectively.
The relative bias is the general deviation that the SPE presents based on ground observations, which indicate over or underestimation; the Pearson´s correlation coefficient describes the degree of linear correspondence between satellite estimates and ground observations; the mean error describes the average disparity between the SPE and ground measurements; the mean absolute error is similar to the mean error but with the advantage that the positive and negative errors do not cancel each other out; the R M S E represents the average error between the SPE and the ground measurement. A value of 0 is the deal score for relative bias, M E , and R M S E , and a value of 1 is the highest Pearson´s correlation coefficient value [2,11]. The ME and RMSE units arepresented in mm/30 min, mm/day, mm/month, and mm/station.
The categorical metric will be used to determine the abilities of the IMERG-FR product for the occurrence of the rain scenario. These statistics were extracted from a 2 × 2 contingency table where the number of successes (hits ( H )) describe the number of rain events correctly estimated from ground and satellite observation; the false alarm ( F ) refers to when the rain is estimated, but it does not occur; and the error (miss ( M )) refers to when the rain is not estimated by the satellite, but it does occur. Three statistical parameters will be adopted, named probability of detection ( P O D ), false alarm ratio ( F A R ), and critical success index ( C S I ). The P O D score defines the ability of the satellite product to correctly estimate rainfall events. The F A R measures the frequency of rain detection from the satellite product not confirmed via ground observation. The C S I is also known as a threat score and calculates the ratio of all estimated and observed events that were correctly diagnosed. The perfect value for P O D and C S I is 1, while for F A R , it is 0. The P O D , F A R , and C S I values will be examined using the following equations [4,7,9,37,38]:
P O D = H H + M
F A R = F H + F
C S I = H H + M + F
However, the categorical metric does not provide any information on the volume of the variable detected correctly/incorrectly; therefore, this study adopted volumetric indexes for the evaluation of data. Volumetric indices provide the volume of the variable of interest detected correctly by SPE relative to rain gauge observations [11]. In this study, the volumetric hit index (VHI), volumetric false alarm ratio (VFAR), and the volumetric critical success index (VCSI) were used. VHI is defined as the volume of rainfall accurately detected by SPE relative to the volume of the accurately detected satellite and missed observations. VFAR can be expressed as the volume of false rainfall detected by the SPE relative to the sum of rainfall detected by the SPE. VCSI is defined as an overall measure of volumetric performance. VHI, VFAR, and VCSI range from 0 to 1, with the perfect score for VHI and VCSI being 1 and for VFAR, 0. The equations for volumetric indices are as follows [11]:
V H I = i = 1 N ( S i | S i > t & G i > t ) i = 1 N ( S i | S i > t & G i > t ) + i = 1 N ( G i | S i t & G i > t )
V F A R = i = 1 N ( S i | S i > t & G i t ) i = 1 N ( S i | S i > t & G i > t ) + i = 1 N ( S i | S i > t & G i t )
V C S I = i = 1 N ( S i | S i > t & G i > t ) i = 1 N ( S i | S i > t & G i > t ) + i = 1 N ( G i | S i t & G i > t ) + i = 1 N ( S i | S i > t & G i t )
where S i represents satellite rainfall estimates; G i denotes ground-based rainfall observation; N represents the total number of data; i is the number of the sample; and t indicates threshold values of 0.1 mm/30 min, 0.1 mm/day, 0.1 mm/month, and 0.1 mm/season for 30 min, daily, monthly, and seasonal precipitation data segmentation, respectively [11]. The threshold values were used to define rain and no rain events. This threshold value has been used in similar studies for arid and semiarid regions [14,39].

3. Results

3.1. Sample Differences between the Observed and Satellite Data

The rain gauge and IMERG-FR daily rainfall data are presented in Table 3. These are the highest daily rainfall events registered per rain gauge, considered as heavy by the WMO daily rainfall intensity classification. The variation in the rain gauges and IMERG-FR is of −63.54 to −23.58 mm/day, indicating subestimation of IMERG-FR in the heavy daily rainfall events. There are no heavy daily rainfall events registered in some rain gauges, so these were omitted.
The behavior of the automated rain gauges with respect to IMERG-FR at the half-hourly scale, considering the American Meteorological Society (AMS) hourly rainfall intensity classification, varied from −25.29 to −11.74 mm/30 min, which indicates that IMERG-FR subestimated the observed rainfall, this effect is similar in bothrain gauges and automated rain gauges, this can be attributed to the fact that the rain gauges measure in a point area, whereas, IMERG-FR estimates in an area of 0.1° × 0.1°. The heaviest half-hourly rainfall events registered via the automated rain gauges are presented in Table 4.

3.2. Temporal-Based Evaluation

Overall, IMERG-FR performed well at daily, monthly, and seasonal, and worst in the half-hourly temporal resolution. In hydrological studies, estimating the rainfall at shorter intervals allows for obtaining better fits of rainfall intensity, especially in regions where they are torrential, which is why automated rain gauges are installed as measuring instruments. In this investigation, it is important to compare the records of this equipment with those estimated via IMERG-FR, according to the data obtained and using the Pearson’s correlation coefficient test which was very small (0.23), indicating a weakness of IMERG-FR at estimating rainfall at the half-hourly temporal resolution; this could be because of the time lag, the overestimation of the rain duration, and the underestimation of rain depth by IMERG-FR. The comparison of daily temporal resolutions in estimating rain on IMERG-FR improves the estimate, finding an r between 0.64 and 0.68 with respect to the rain gauges and the automated rain gauges. Related to IMERG-FR, the automated rain gauges obtained higher MAE but lower RMSE values than the rain gauges, meaning that the automated rain gauges present a lower extreme error but higher overall error values. With respect to the monthly and seasonal temporal resolutions, the value of the correlation coefficient increases from 0.83 to 0.85, which indicates less variability between the two. Another indicator that is used to find the relationship between IMERG-FR and the rain gauges is the probability of detection (POD), which varied from 0.31 to 1 where the smallest value corresponds to shorter durations and 1 for monthly or seasonal temporal resolutions. The false alarm ratio (FAR) varied from 0.23 to 0.46 for the automated rain gauges and the rain gauges with respect to the IMERG-FR, indicating that the most similar data are those recorded in the automated rain gauge; these data coincides with the correlation coefficient for this period of time where a similar behavior was obtained, improving its performance with respect to larger temporal scales. However, the best VHI (0.98) was obtained via the rain gauges, while the automated rain gauges improved with respect to the VCSI (0.92). This is probably due to the fact that sometimes the IMERG-FR registers false alarms (Table 5). Taking all metrics into consideration and importance, the best result was given by the automated rain gauges vs. IMERG-FR at the monthly temporal resolutions, of which the rain gauges vs. IMERG-FR have a better r (0.85 vs. 0.83), but the automated rain gauges vs. IMERG-FR have lower RMSE (27.83 vs. 29.87) and better CSI (1 vs. 0.94); this indicates that the automated rain gauges vs. IMERG-FR datasets are better fitted and have a better detection ability. According to the results obtained via the IDW interpolation at the monthly temporal scale, the precipitation differences between IMERG-FR and the rain gauge network were higher in the July, August, and September months, probably because these are the wetter months of the year and that the error is higher when more precipitation occurs (Figure 3).

3.3. Topographical Evaluation

The elevation range of the rain gauge and automated rain gauge network was of 1902 to 2612 m.a.s.l.; the correlation between the IMERG-FR data and those registered in the network with respect to the elevation presented the following behavior of 0.60 to 0.89, where the smallest value corresponds to the daily temporal scale at 2119–2323 m.a.s.l.; and the larger value to themonthly temporal scale occurred at 1902–2101 m.a.s.l.
According to the literature, it is reported that the greatest amount of rain occurs at the highest elevations, indicating a better relationship between IMERG-FR and the rain gauge network because in this area, there is orographic rain. However, the bias and the error incremented with the elevation indicates a slight overestimation at higher altitudes. The POD varied from 0.91 to 1, indicating a very good ability of IMERG-FR to correctly detect rainfall, where the lowest value was obtained at the daily temporal scale in the 2352–2612 m.a.s.l. elevation range that corresponds with the highest bias and error values, and the highest at monthly and seasonal temporal scales at all elevation ranges. Nevertheless, the lowest FAR values were obtained at 2352–2612 m.a.s.l., and the highest at 2119–2323 m.a.s.l., ranging from 0 to 0.46, showing a behavior similar to the r. At the monthly and seasonal temporal scales at every elevation range were obtained perfect volumetric indices, and those obtained at the daily temporal scales improved considerably with respect to their similar categorical metrics, where the VHI ranged from 0.97 to 1, indicating a near perfect score, and the VFAR ranged from 0.20 to 0, with the highest value of the daily temporal scale at 2119–2323 m.a.s.l. Overall, according to the error, bias values, and detection ability, the best results were given at the minimum elevation range (1902–2101 m.a.s.l.) (Table 6).

3.4. Rainfall Intensity-Based Evaluation

The PDF exposed that the bulk of the rainfall events detected by the rain gauges and IMERG-FR at the daily temporal scale were very light (0 to 1 mm/day), ranging from 64.44 to 69.57% by IMERG-FR, and from 70.29 to 77.03% by the rain gauges with respect to the elevation ranges (Figure 4a–d). Both lowest values were obtained at 2409 m.a.s.l. (Figure 4d), of which the highest IMERG-FR value was found at 1902–2101 m.a.s.l. (Figure 4b), and the highest rain gauge value was obtained at 2119–2240 m.a.s.l. (Figure 4c); this indicates that there are less very light rainfall events in the mountainous regions and that there are more of this events in the flatter regions.
IMERG-FR tended to underestimate the occurrence of very light, moderate–heavy (25 to 50 mm/day), and heavy (>50 mm/day) rainfall events, as well as overestimate the rate of light (1 to 5 mm/day), moderate–light (5 to 10 mm/day), and moderate (10 to 25 mm/day) rainfall events (Figure 4a–d). The frequency of rain events estimated via IMERG-FR at all intensities have a better fit with the frequency of rain events observed via the rain gauges at 2409 m.a.s.l. (Figure 4d), compared with the other elevations. The intensity ranges that presented a better fit between the rain gauges and IMERG-FR data were those above 5 mm/day.
The PDF also showed a similar tendency of daily rainfall occurrence in the comparison of IMERG-FR and the automated rain gauges (Figure 4e) with respect to the comparison of IMERG-FR and the rain gauges, with the following exceptions: IMERG-FR overestimated the frequency of moderate–heavy rainfall events, where no heavy rainfall events were registered, and the frequency of rainfall events at distinct intensities detected by IMERG-FR and the automated rain gauges fit slightly better than those detected by IMERG-FR and the rain gauges.
In the sub-daily rainfall occurrence evaluated via the AMS rainfall intensity classification, the PDF demonstrated that the majority of the rainfall events detected by the automated rain gauges and IMERG-FR were light (0 to 2.5 mm/h), with 98.74% by the automated rain gauges and 98.86% by IMERG-FR, and no heavy rainfall events (>7.6 mm/h) were registered by IMERG-FR; only the 0.10% of the events registered by the automated rain gauges were heavy and the rest of the events were moderate (1.17% by the automated rain gauges and 1.14% by IMERG-FR) (Figure 4f).
In general, IMERG-FR has an excellent ability to detect the occurrence of rainfall events at all rainfall intensities in both daily and sub-daily temporal scales, the automated rain gauges’ data fitted slightly better with the IMERG-FR data than the rain gauges, and the sub-daily occurrences of rainfall events fitted better probably because of the great quantity of 0 rainfall in the sub-daily datasets.

3.5. Gauge Density-Based Evaluation

In the gauge density-based evaluation conducted only at the daily temporal resolution, the correlation coefficient ranged from 0.42 to 0.74, the lowest value was obtained in the one automated rain gauge per pixel density evaluation, and the highest was obtained in both two and three rain gauges per pixel density evaluation; this clearly indicates that the rain gauge and the IMERG-FR data have a stronger correlation with the gauge density augmentation. However, it was unexpected that the automated rain gauges had a worse r than the rain gauges at one rain gauge per pixel density, but this can be attributable to the incomplete or interrupted time series that were used in the one automated rain gauge per pixel density evaluation; meanwhile, the rain gauges had complete time series.
The automated rain gauges showed the higher MAE values, ranging in 2.20 to 2.46, with the highest obtained by those with two gauges per pixel density, in addition to the latter which had the highest bias, an overestimation of 0.16.
The probability of detection (POD) ranged from 0.74 to 0.93, where the lowest value obtained was again in the one automated rain gauge per pixel density evaluation, and the highest was at the one rain gauge per pixel density evaluation. This could be because the bulk of the rain gauges (16/19) have a gauge density of one rain gauge per pixel and are located in flatter areas (1902 to 2240 m.a.s.l.). As such, the literature says that in mountainous regions, there is more rainfall variability, and a higher gauge density is required for more accuracy in the rainfall observations, of which the rain gauges with three gauges per pixel density and the automated rain gauges are located at higher elevation than the rain gauges with one gauge per pixel density. The false alarm ratio (FAR) ranged from 0.22 to 0.47, with the lowest value obtained at the two automated rain gauges per pixel density evaluation, and the highest at one rain gauge per pixel density evaluation, indicating the superiority of the automated rain gauges over the rain gauges, although the last have a higher gauge density. The volumetric indices again demonstrated an improvement over the categorical metrics. The two automated rain gauges per pixel density evaluation exhibited the best performance; despite having the same r and higher error values than the three rain gauges per pixel evaluation, the two automated rain gauges per pixel density evaluation had better CSI and VCSI values, indicating that they are better tools than the rain gauges to measure rainfall (Table 7).
The multiple linear regression (MLR) was applied to the daily observed and estimated data that present a gauge density above 1 rain gauge per IMERG-FR pixel (Figure 5), where the observations were not averaged as in temporal evaluation. The automated rain gauges Estación Climatológica and SainVenant share the same IMERG-FR pixel (Figure 5a); with their IMERG-FR pixel, the multiple correlation coefficient (MCC) obtained was 0.73 and the coefficients of the automated rain gauges were 0.48 and 0.37, respectively. NavierStokes and Vertedor share another IMERG-FR pixel (Figure 5b), where they obtained an MCC of 0.75 and the coefficients were 0.46 and 0.37, respectively (Figure 4). The rain gauges Guadalupe, Zacatecas, and La Bufa, with their IMERG-FR pixel, obtained an MCC of 0.74, and their coefficients were 0.1, 0.2, and 0.4, respectively. These values are almost the same as the ones obtained with the standard linear regression applied to the averaged observed data vs. the IMERG-FR pixel data; this proves that it is not necessary to average the observed data that share an IMERG-FR pixel to make a regression, with the MLR, the averaging work can be omitted. In addition, the coefficients obtained are useful to know the significance of each rain gauge.

3.6. Distance to Centroid of IMERG-FR Pixel Evaluation

The IMERG-FR and rain gauges’ daily rainfall data were used in this evaluation. The reference distance to the centroid to classify the rain gauges in central or peripheral was decided to be 3.78 km because it is the half of the larger radius (centroid to corner) of the IMERG-FR pixel, that is, 7.55 km. A total of 14 rain gauges and 2 automated rain gauges were classified as peripheral, and five rain gauges and two automated rain gauges were classified as central.
The correlation coefficient obtained varied from 0.62 to 0.69, having a very similar behavior between the centric rain gauges and those located at the limit of the pixel area delimited by IMERG-FR. This finding suggests that there is not a large correlation with respect to the location of the rain gauge because the IMERG-FR estimates the average rainfall magnitude within a pixel area of 123.43 km2. This is confirmed by the significant trend of the evaluation metrics, obtaining that there are no significant differences between the evaluation of the central and peripheral rain gauges with respect to the IMERG-FR (Table 8).

3.7. Climatic Evaluation

This evaluation was carried out using the daily rainfall data of IMERG-FR and the rain gauge network. The behavior of the correlation coefficient varied from 0.63 to 0.67 for the three types of climates identified, indicating a similar correlation between the three climates. A difference is that theBS1kw(w) climate, registers a winter rainfall of less than 5 mm, and the climates BS1kw and BS0kw, register 5 to 10.2 mm. Different researches regarding the rain estimation using IMERG-FR reports a weakness of IMERG-FR at detecting freezing rainfall and snow in winter due to their reflection properties. In this investigation, it is assumed that this is probably the cause, that BS1kw(w) has registered the best fit between the IMERG-FR and the rain gauge data because it achieved the best bias, ME, POD, FAR, CSI, VFAR, and VCSI values. However, the driest climate BS0kw achieved the best MAE and RMSE values in was probably due to the scarcity of rainfall (Table 9). The rain gauges located in the BS1Kw(w) climate are at a 1902–2101 m.a.s.l. elevation range that registered the lowest bias and highest POD values (best values).

4. Discussion

Most of the studies reviewed that the evaluated IMERG-FR reported fewer variables within them [20], who only consider temporal evaluation (daily and monthly scales and intraseasonal variation). In this regard, Ref. [21] focused their research on evaluating IMERG-FR with temporal and spatial aggregation, but they compared all IMERG-FR executions (ER, LT, and FR). Ref. [22] integrated temporal and rainfall intensity-based assessments, but compared all IMERG-FR and TMPA runs and PERSIANN; [23] analyzed the performance of IMERG-FR in 12 rainfall densities, but introduced the MIT (minimum time between events) criterion to define independent rainfall events determined by dry periods: 1, 6, and 24 h; and Ref. [11] evaluated several SPE, including IMERG-FR, with temporal, precipitation rate-based, and topographic techniques. Ref. [24] evaluated various SPE, including IMERG-FR, with temporal (hourly, 3 h, 6 h, half-day, and daily) and topographic techniques, but used the seasonal evaluation (summer, winter, and monsoon), whereas this research only evaluated the wet season. Many other studies also used similar or the same continuous and categorical statistical metrics to evaluate the performance of IMERG-FR or other SPE [7,13,15,36,37,38], but as this research only also used the volumetric indexes to evaluate the quantity of rainfall correctly or incorrectly detected by IMERG-FR.
The found differences between the IMERG-FR and rain gauge records, with respect to the bias, can be attributed to the great IMERG-FR pixel surface that estimate a single rainfall value; meanwhile, the rain gauge is located at a point in that pixel where the heaviest rainfall intensities were heavily underestimated, of which similar results were reported by [11,22].

4.1. Temporal Resolution Evaluation

Consistent with this research, other studies [7,11,13,19,20,22] showed that IMERG-FR agrees more with the gauge observations for coarser temporal resolutions, reaching a way better r value in the half-hourly scale (0.46) compared with this study (0.04), and a better r value in the daily scale (0.75 in their study and 0.64 to 0.68 in this research), which is probably attributable to the higher number of rain gauges they used (241) and their location in a river basin (lower spatial variation). Nevertheless, the difference between the r values in the daily scale in both studies was small (0.11 to 0.07). Ref. [16] also calculated a better r value (0.79) at the daily scale in a basin using 121 automatic rain gauges, in a lower elevation (27 to 1100 m.a.s.l.) compared with this research (1902 to 2409 m.a.s.l.). Ref. [37] obtained the best correlation coefficient index (0.5 to 0.7), with median values of POD and a CSI above 0.75 and 0.5, respectively, in the daily scale in the fall and summer seasons, which is concordant with this research (POD and CSI above 0.83 and 0.52, respectively, in the daily scale in the wet season). The authors of [7] achieved a near perfect r value in the monthly scale (0.99 in their study and 0.85 in this research). On the other hand, [7,22] calculated a worse r value at the daily scale (both 0.42) compared with this research. The difference in performance may be due to the deviations caused by complex terrain, rainfall rate, uncertainty of rain gauge data, and their low density, which cannot accurately reflect the rainfall patterns in these areas. In addition, in some studies [13], IMERG-FR presented higher performance in the wet seasons or wetter climates.

4.2. Topographic Evaluation

According to this research, IMERG-FR overestimated the rainfall at most altitudes; nevertheless, its performance was relatively good at high elevations because of the inclusion of the elevation indicator in the development of datasets; moreover, the use of microwave sensors to estimate rainfall is more accurate in open areas than in complex areas [11]. Ref. [18] also noted that IMERG-FR had larger bias in the mountainous areas; he suggested that IMERG-FR might have a weakness in validating orographic rainfall. Ref. [16] noted that IMERG-FR showed relatively high POD (>0.8), with some exceptions in foothills and mountainous regions. On the other hand, Ref. [22] noted that IMERG-FR performed better with most metrics at lower altitudes, with the exception of the FAR; Ref. [36] calculated lower biases (based on RMSE) in the Prairie provinces; contrary to this [38], the authors found that IMERG-FR shows a remarkably overestimation of rainfall over the plain region of the watershed and that the orographic rainfall is not fully captured via IMERG-FR products; similarly, Ref. [3] encountered that IMERG-FR overestimated the rainfall in low elevation regions and underestimated it in high-altitude mountainous areas; Ref. [4] announced that the precipitation detection ability of IMERG-FR is influenced by the rainfall type and topography, where this occurs because the IMERG-FR products are still weak in detecting spatially heterogeneous rainfall in complex terrain, despite their relatively fine spatial resolution (0.1° × 0.1°). Satellite sensors have difficulties in detecting low-level orographic rainfall events that often occur at elevations higher than 3000 m.a.s.l. [36].

4.3. Rainfall Intensity Evaluation

In agreement with this research, and with respect to the daily scale of other studies, Refs. [11,20] noted that IMERG-FR tend to underestimate the very light (0 to 1 mm/day) and heavy (>50 mm/day) rainfall events, but overestimate the moderate–light, moderate, and moderate–heavy rainfall events (5 to 50 mm/day) classes. As the present research, some studies [14,16] noted that IMERG-FR show a considerably good performance in capturing various rainfall intensities, for example, [3,13] found that IMERG-FR can better estimate moderate precipitation, especially in the range of 5–10 mm/day; this research found that the IMERG-FR data fit better at rainfall events above 5 mm/day. On the other hand, Ref. [39] noted that IMERG-FR tend to overestimate the very light and part of the light rainfall events (0–2 mm/day), but underestimate moderate–light and part of the moderate rainfall events (5–20 mm/day); Ref. [4] also encountered that IMERG-FR tends to overestimate rainfall events, especially light rainfall events. With respect to the half-hour scale [37], contrary to this research, found that IMERG-FR detected more moderate and heavy (AMS classification) rainfall events, and part of the light rainfall events (above 0.4 mm/h) than the ground measurements. All the differences from the results of the aforementioned studies can be attributable to the different climate, temporal, and topographical conditions of their study zones.

4.4. Gauge Density Evaluation

Contradictory to this study, Ref. [21] evaluated IMERG-FR at 1 to 12 gauges per pixel densities and did not identify an improvement in the performance with the increase in the gauge density; this probably could be for the more humid climates, the type of rainfall, and the movement of the clouds in their study zone (Brazil) that can make a uniformity effect of rainfall through all of the IMERG-FR pixel area.

4.5. Climatic Evaluation

In this research, the evaluated climate that obtained the best results was the BS1kw(w), probably because from the three evaluated climates, it is the climate that less rainfall presents in winter (<5 mm), and the rain gauges located here are at the lowest elevation range (1902–2101 m.a.s.l.); this may be because of a lower bias and higher POD values, as mentioned in the topographical evaluation. Other studies [13,16,23,36] that evaluated IMERG-FR via solid and liquid rainfall found that IMERG-FR have issues to estimate rainfall in winter, due to the reflection effect that freezing rainfall and snow have, and Ref. [3] encountered that IMERG-FR have better performance in warm seasons (summer and autumn) than in cold seasons (spring and winter).

5. Conclusions

In this research, the performance of IMERG-FR-FR V06 HH was evaluated, in a semiarid region of Zacatecas, using daily rainfall observation data from 19 rain gauges and half-hour interval rainfall observation data from four automated rain gauges as a reference from 2019 to 2021. A point-to-pixel analysis using continuous, categorical, and volumetric statistical metrics were made in order to calculate the differences between the rain gauge and satellite data.
The main findings are summarized as follows:
  • IMERG-FR heavily underestimated the heavy rainfall events (>50 mm/day and >7.6 mm/h) with a difference between −63.54 and −23.58 mm/day and −25.29 and −11.74 mm/30 min.
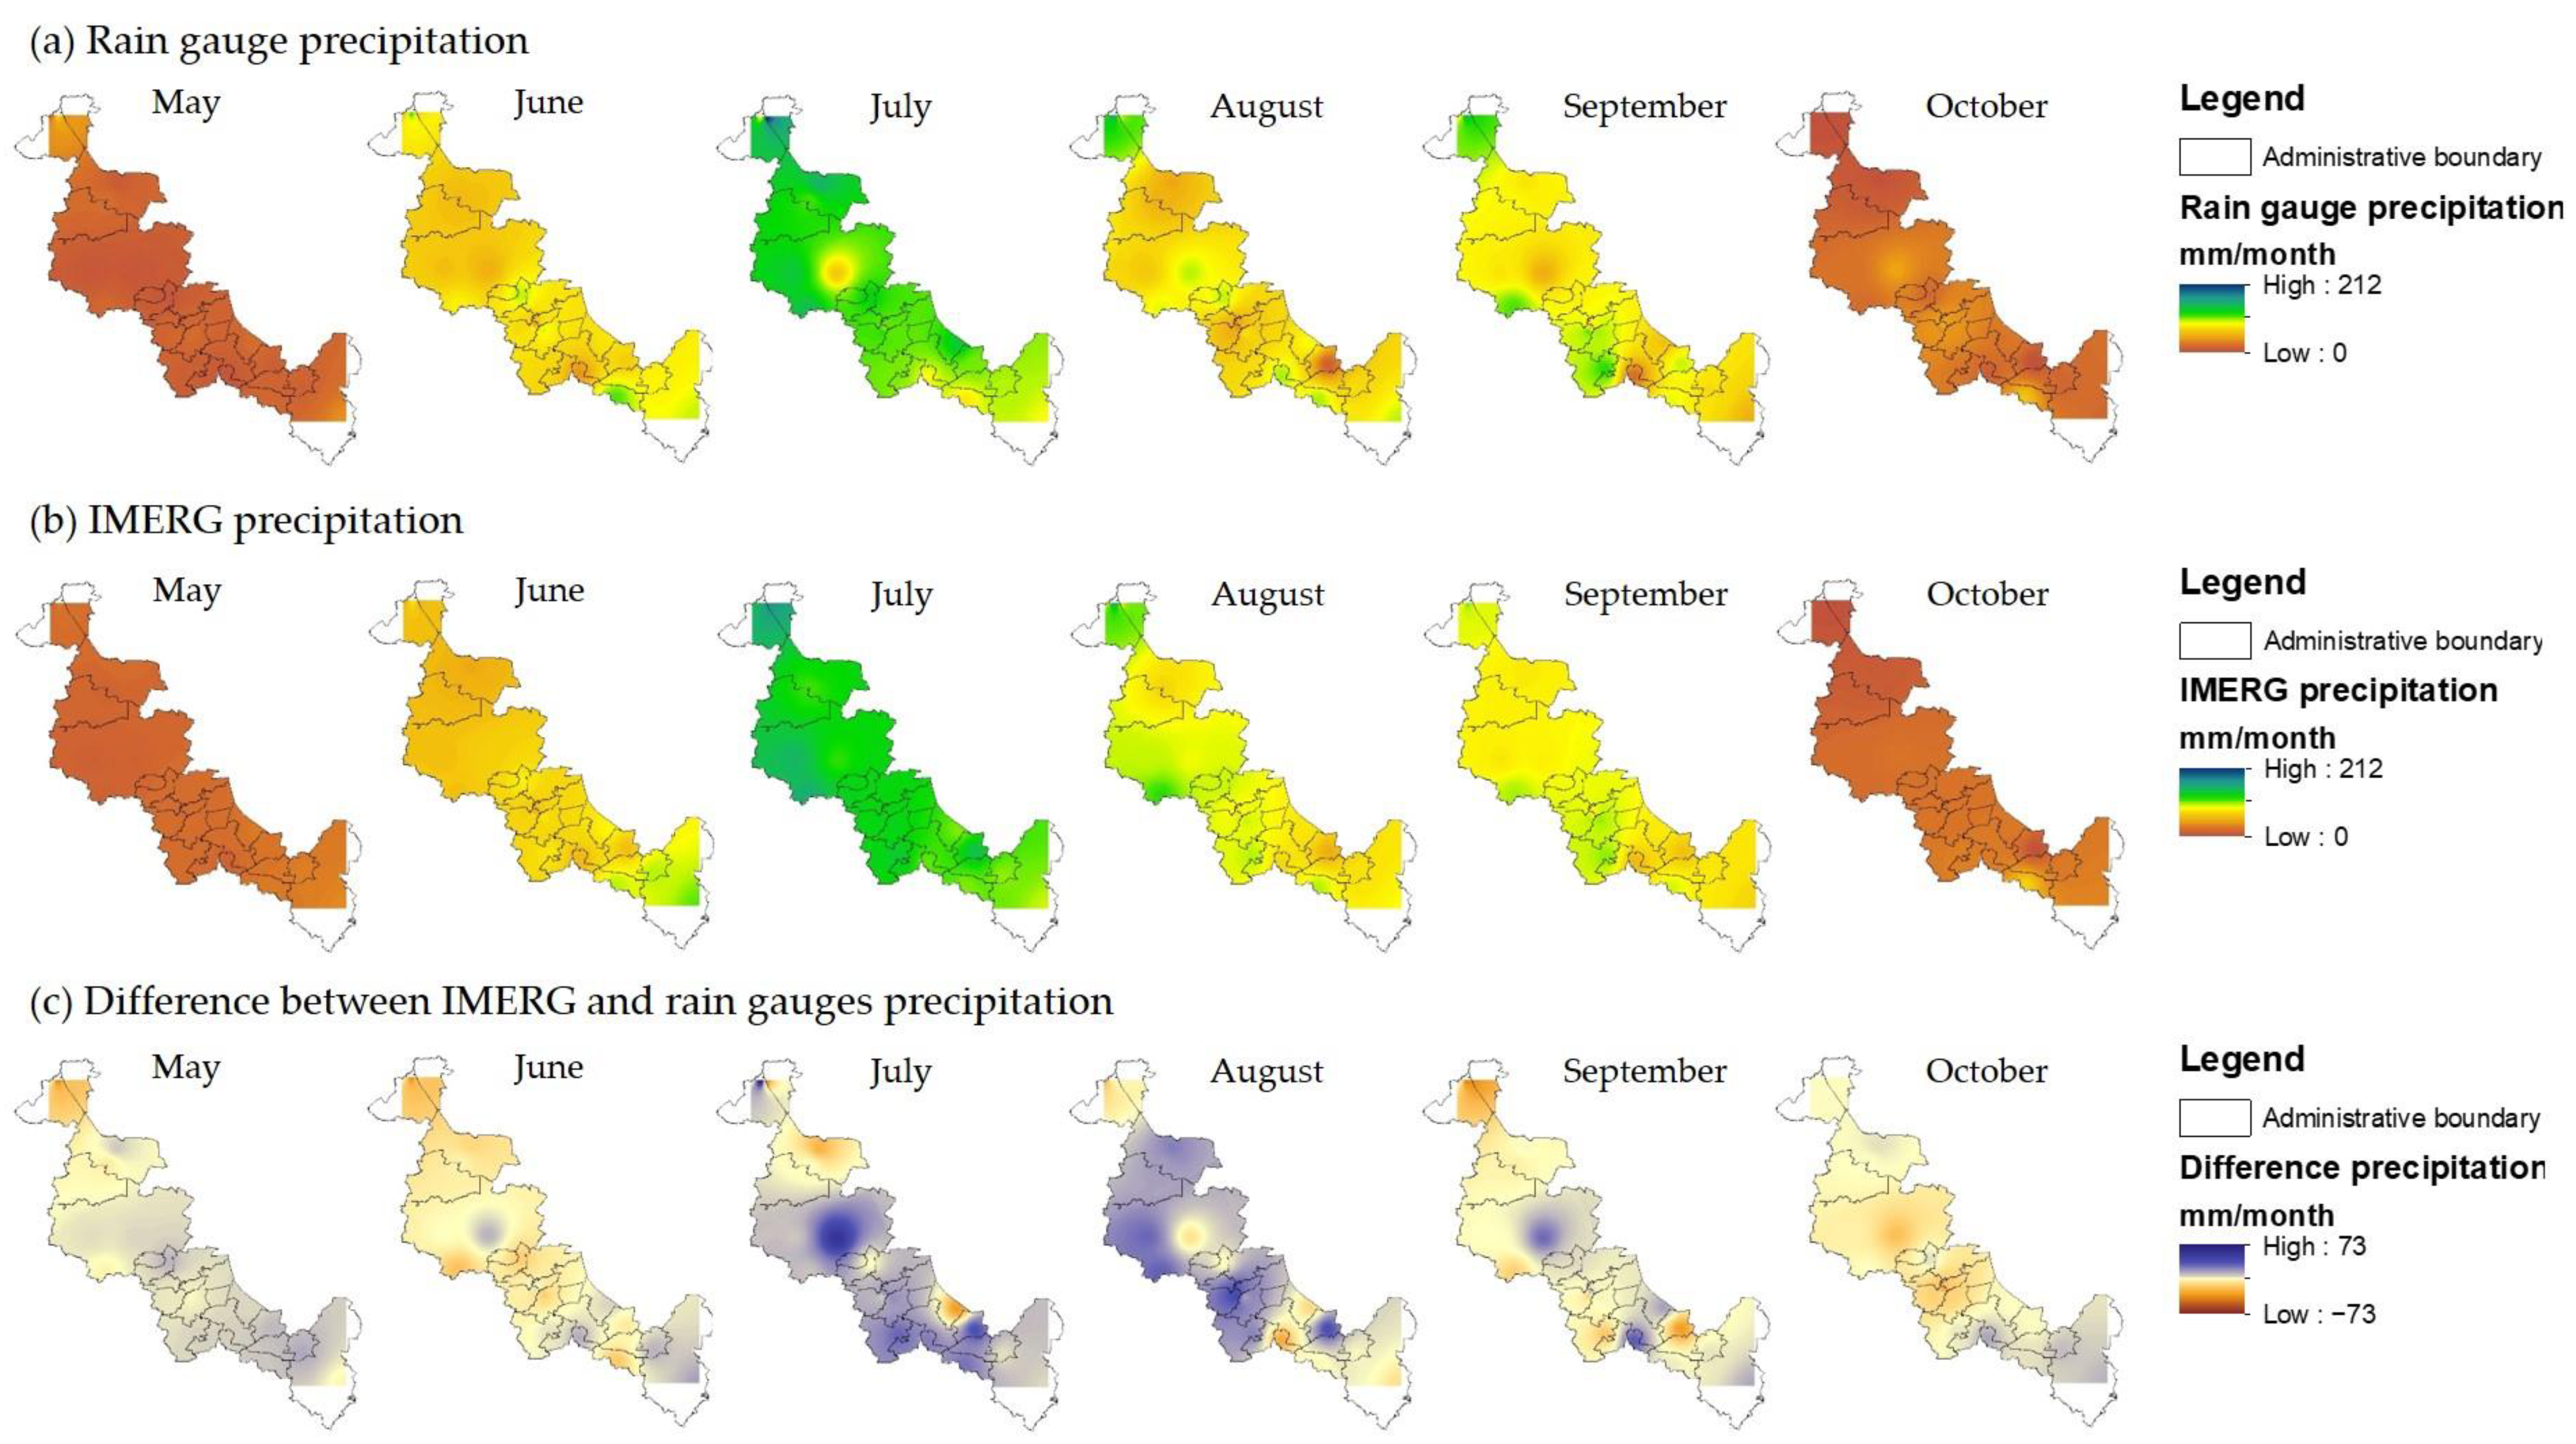
  • Temporarily, IMERG-FR performed well at daily, monthly, and seasonal temporal resolutions, with the best results in the monthly temporal resolution against the automated rain gauges (R = 0.83 and CSI = 1), and the worst performance was at the half-hour temporal resolution (R = 0.23 and CSI = 0.24). The differences of precipitation between IMERG-FR and the rain gauge network were higher in the wetter months (July, August, and September).
  • Topographically, IMERG-FR performed best at the 1902–2101 m.a.s.l. elevation range, with the lowest bias and error values and the highest detection abilities.
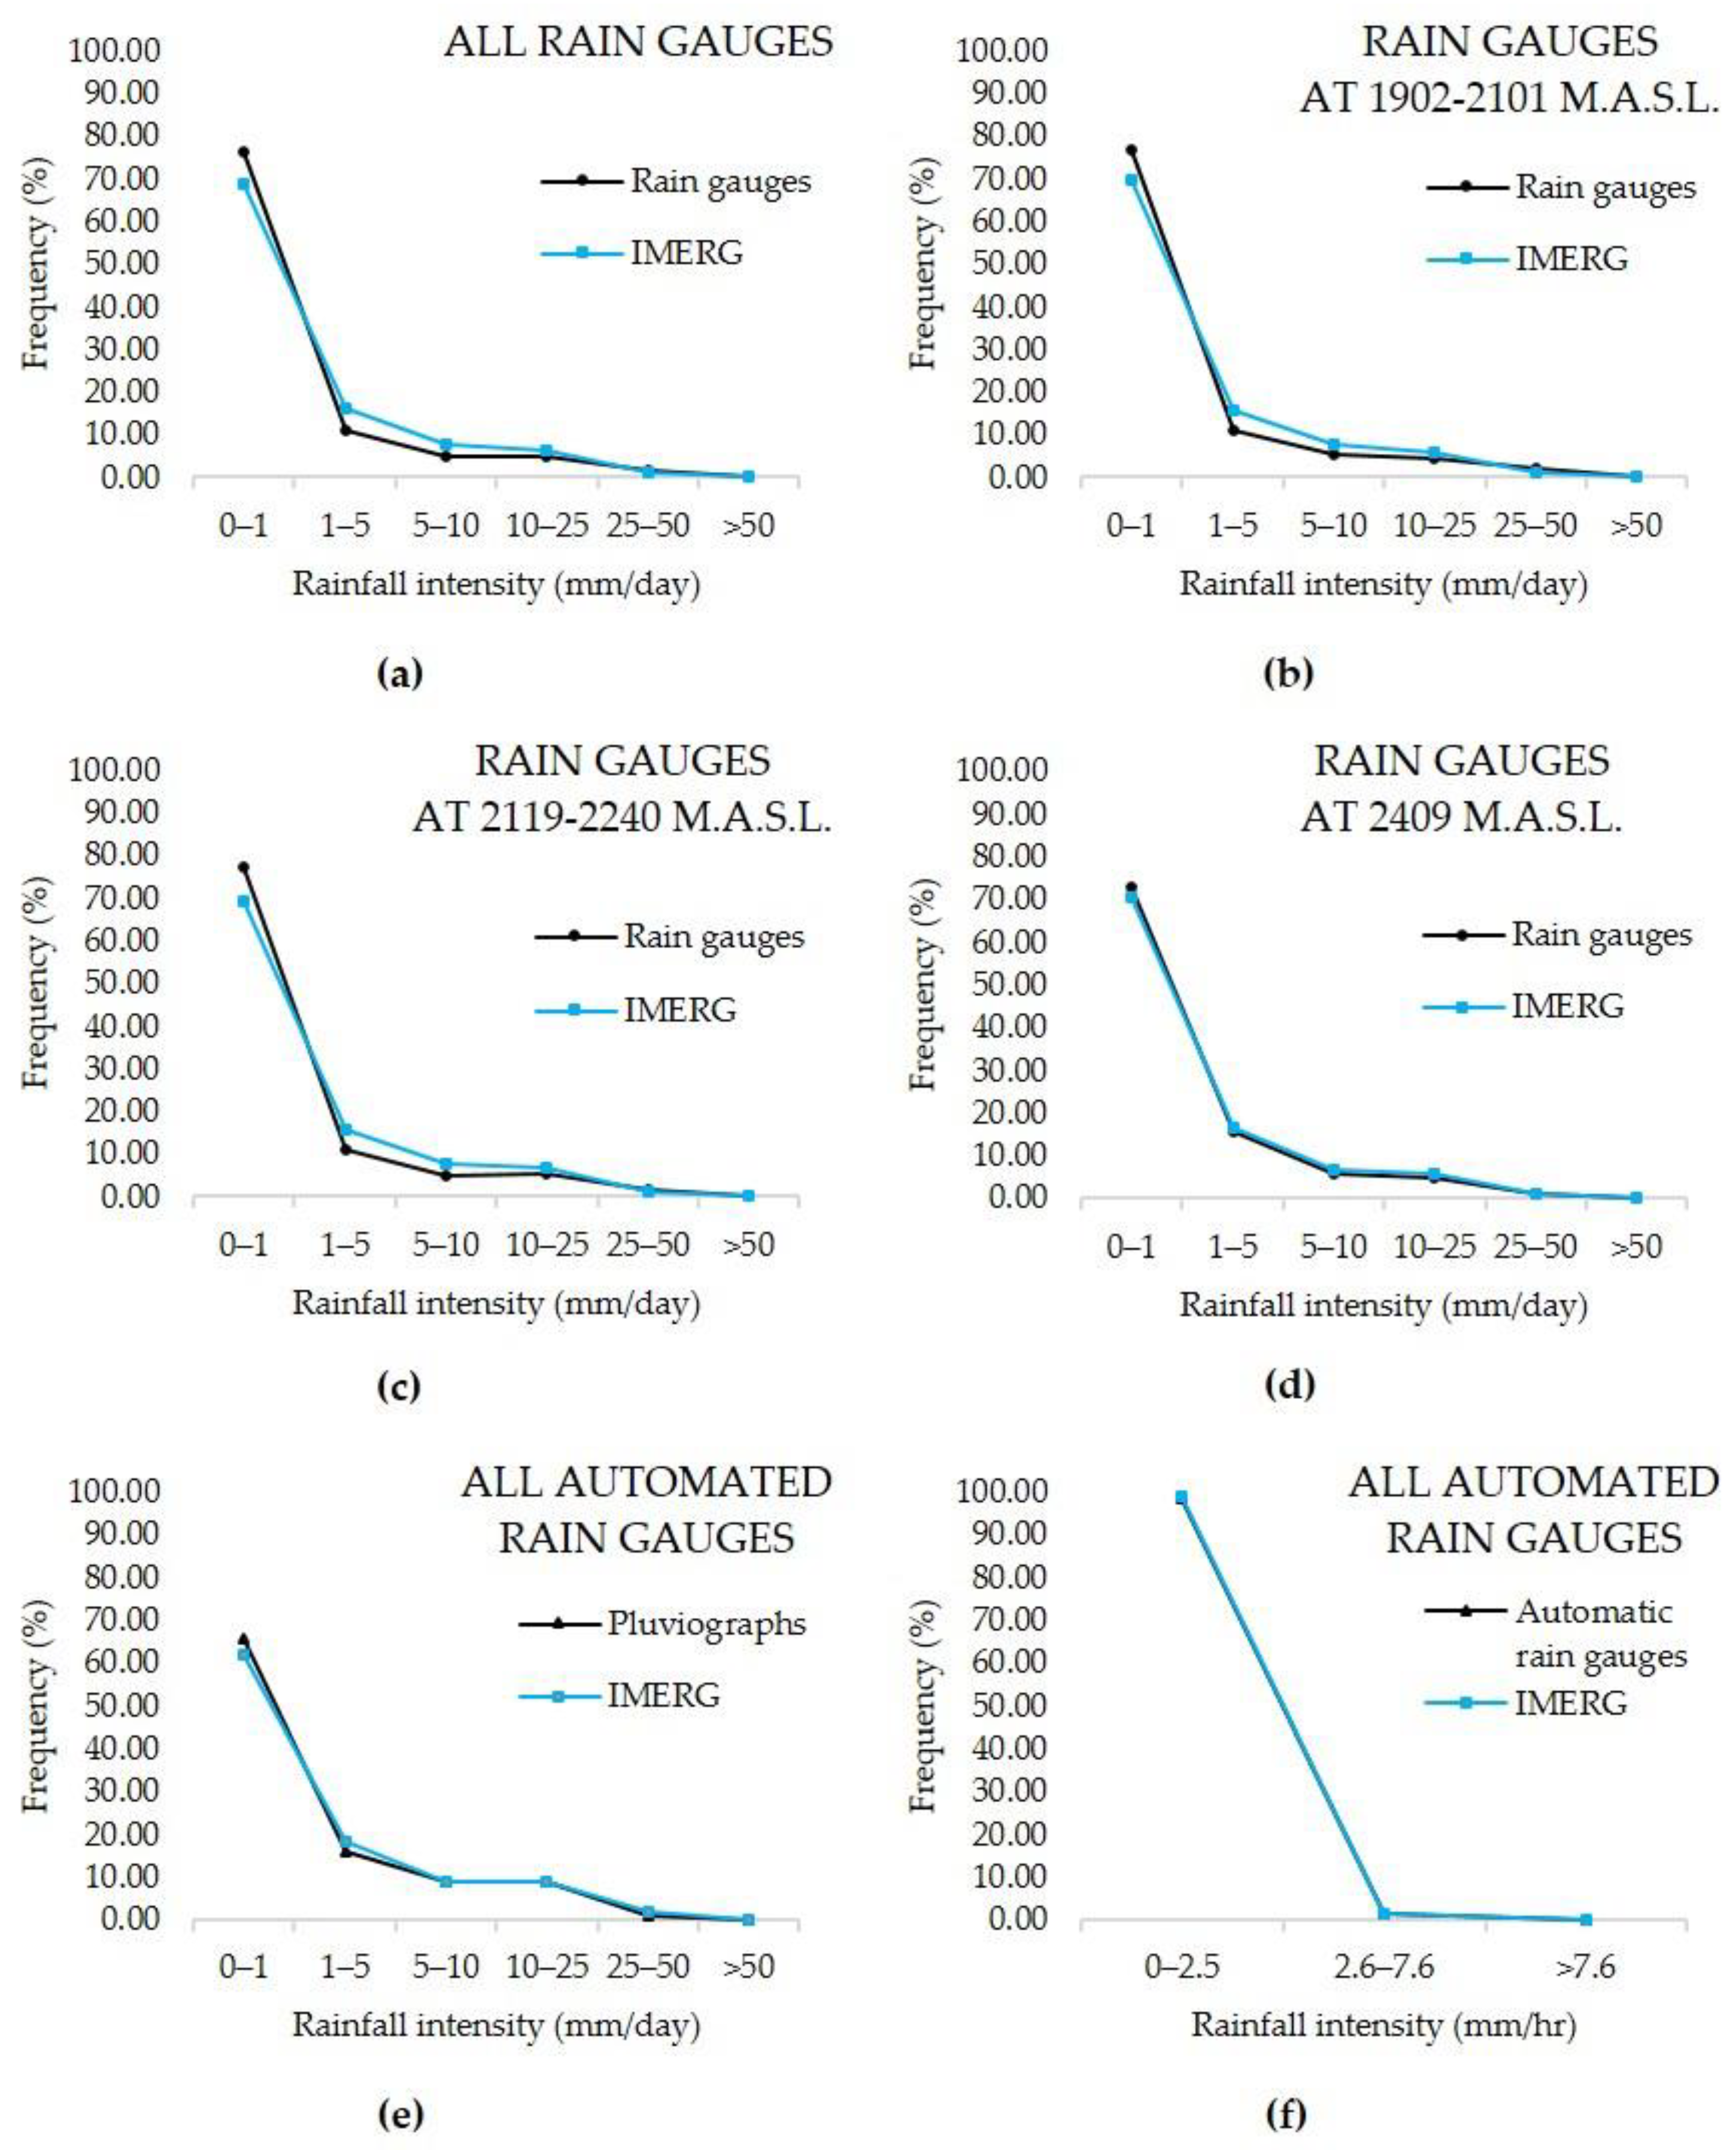
  • According to the PDF of the rainfall intensity evaluation, the very light rainfall events represent the majority of the daily rainfall events (64.44 to 77.03%), and the light rainfall events represent the bulk of the sub-daily rainfall events (98.74 to 98.86%), where IMERG-FR identified the occurrence of daily and sub-daily rainfall events with great accuracy at all rainfall intensity classes with reference to WMO and AMS, of which the best fit was in the sub-daily classes, probably for the great quantity of 0 rainfall values, but in the daily classes, IMERG-FR tended to underestimate the frequency of 0 to 1 and >25 mm/day rainfall events, as well as overestimate the rate of 1 to 25 mm/day rainfall events, of which the automated rain gauges slightly fitted better with IMERG-FR than the rain gauges at the daily temporal resolution.
  • At the gauge density evaluation, the performance incremented with the augmentation of the gauge density, the best performance was given at two automated rain gauges per IMERG-FR pixel density (R = 0.74 and CSI = 0.70), indicating that the automated rain gauges are better tools to measure rainfall than the rain gauges, despite these having three rain gauges per IMERG-FR pixel density.
  • From the three evaluated dry climates, BS1kw(w) has the best results with small differences, probably because it is the one that presents less rainfall in the winter season (<5 mm), compared with the other two (5 to 10.2 mm).
There are very few studies about the performance of SPE in Mexico, Central, and South America. Thus, it is important to amplify the studies of the SPE in all the world to continue with their improvement and verify if is suitable to actually use them in a determinate region for some purpose. The main limitations of this work were the low rain gauge density and the missing rain gauge data. It is recommended to evaluate IMERG-FR at a higher rain gauge density, to see how much the statistical metrics improve with the rain gauge density augmentation (rain gauges/IMERG-FR pixel).

Author Contributions

Conceptualization, E.M.d.l.T., J.G.T. and E.G.R.; methodology, E.M.d.l.T., J.G.T. and E.G.R.; software, E.M.d.l.T., J.G.T. and E.G.R.; validation, E.M.d.l.T., J.G.T. and E.G.R.; formal analysis, E.M.d.l.T., J.G.T. and E.G.R.; investigation, E.M.d.l.T., J.G.T. and E.G.R.; resources, C.F.B.C. and H.E.J.F.; data curation, E.M.d.l.T., J.G.T. and E.G.R.; writing—original draft preparation, E.M.d.l.T. and J.G.T.; writing—review and editing, E.M.d.l.T., J.G.T., H.B.A. and M.I.R.R.; visualization, H.B.A. and M.I.R.R.; supervision, J.G.T., E.G.R., C.F.B.C. and H.E.J.F.; project administration, J.G.T., E.G.R., C.F.B.C., and H.E.J.F.; funding acquisition, J.G.T., C.F.B.C., and H.E.J.F. All authors have read and agreed to the published version of the manuscript.

Funding

This research was funded by the Consejo Nacional de Humanidades Ciencia y Tecnología and the Consejo Zacatecano de Ciencia, Tecnología e Innovación.

Data Availability Statement

The data is available in the quotes included in the article.

Acknowledgments

The authors express their gratitude to the Consejo Nacional de Humanidades, Ciencia y Tecnología (CONAHCyT), for financing the scholarship of the doctoral students, and the ConsejoZacatecano de Ciencia, Teconologia e Innovacion (COZCyT), for the financial support to its publication. We thank the data providers of IMERG-FR and the developers of Python and R programming languages. We also acknowledge the M.I. Carlos M. Alean Rocha and the Comision Nacional del Agua, for their support in obtaining the rain gauge rainfall data over Zacatecas, and the Universidad Autonoma de Zacatecas, for providing the installations and a fine and low cost education.

Conflicts of Interest

The authors declare no conflict of interest.

References

  1. Ayehu, G.T.; Tadesse, T.; Gessesse, B.; Dinku, T. Validation of New Satellite Rainfall Products over the Upper Blue Nile Basin, Ethiopia. Atmos. Meas. Tech. 2018, 11, 1921–1936. [Google Scholar] [CrossRef]
  2. Ma, Q.; Li, Y.; Feng, H.; Yu, Q.; Zou, Y.; Liu, F.; Pulatov, B. Performance Evaluation and Correction of Precipitation Data Using the 20-Year IMERG and TMPA Precipitation Products in Diverse Subregions of China. Atmos. Res. 2021, 249, 105304. [Google Scholar] [CrossRef]
  3. Wang, X.; Ding, Y.; Zhao, C.; Wang, J. Similarities and Improvements of GPM IMERG upon TRMM 3B42 Precipitation Product under Complex Topographic and Climatic Conditions over Hexi Region, Northeastern Tibetan Plateau. Atmos. Res. 2019, 218, 347–363. [Google Scholar] [CrossRef]
  4. Yang, M.; Liu, G.; Chen, T.; Chen, Y.; Xia, C. Evaluation of GPM IMERG Precipitation Products with the Point Rain Gauge Records over Sichuan, China. Atmos. Res. 2020, 246, 105101. [Google Scholar] [CrossRef]
  5. Zakaria Lukwasa, A.; Zeleke, T.T.; Beketie, K.T.; Ayal, D.Y. Spatio-Temporal Rainfall Variability and Its Linkage with Large Scale Climate Oscillations over the Republic of South Sudan. Clim. Serv. 2022, 28, 100322. [Google Scholar] [CrossRef]
  6. Zhang, L.; Li, X.; Cao, Y.; Nan, Z.; Wang, W.; Ge, Y.; Wang, P.; Yu, W. Evaluation and Integration of the Top-down and Bottom-up Satellite Precipitation Products over Mainland China. J. Hydrol. 2020, 581, 124456. [Google Scholar] [CrossRef]
  7. Arshad, M.; Ma, X.; Yin, J.; Ullah, W.; Ali, G.; Ullah, S.; Liu, M.; Shahzaman, M.; Ullah, I. Evaluation of GPM-IMERG and TRMM-3B42 Precipitation Products over Pakistan. Atmos. Res. 2021, 249, 105341. [Google Scholar] [CrossRef]
  8. Yuan, F.; Wang, B.; Shi, C.; Cui, W.; Zhao, C.; Liu, Y.; Ren, L.; Zhang, L.; Zhu, Y.; Chen, T.; et al. Evaluation of Hydrological Utility of IMERG Final Run V05 and TMPA 3B42V7 Satellite Precipitation Products in the Yellow River Source Region, China. J. Hydrol. 2018, 567, 696–711. [Google Scholar] [CrossRef]
  9. Eltazarov, S.; Bobojonov, I.; Kuhn, L.; Glauben, T. Mapping Weather Risk – A Multi-Indicator Analysis of Satellite-Based Weather Data for Agricultural Index Insurance Development in Semi-Arid and Arid Zones of Central Asia. Clim. Serv. 2021, 23, 100251. [Google Scholar] [CrossRef]
  10. Torres-Batlló, J.; Martí-Cardona, B. Precipitation Trends over the Southern Andean Altiplano from 1981 to 2018. J. Hydrol. 2020, 590, 125485. [Google Scholar] [CrossRef]
  11. Liu, C.-Y.; Aryastana, P.; Liu, G.-R.; Huang, W.-R. Assessment of Satellite Precipitation Product Estimates over Bali Island. Atmos. Res. 2020, 244, 105032. [Google Scholar] [CrossRef]
  12. Lu, X.; Tang, G.; Wang, X.; Liu, Y.; Jia, L.; Xie, G.; Li, S.; Zhang, Y. Correcting GPM IMERG Precipitation Data over the Tianshan Mountains in China. J. Hydrol. 2019, 575, 1239–1252. [Google Scholar] [CrossRef]
  13. Meng, C.; Mo, X.; Liu, S.; Hu, S. Extensive Evaluation of IMERG Precipitation for Both Liquid and Solid in Yellow River Source Region. Atmos. Res. 2021, 256, 105570. [Google Scholar] [CrossRef]
  14. Morsy, M.; Scholten, T.; Michaelides, S.; Borg, E.; Sherief, Y.; Dietrich, P. Comparative Analysis of TMPA and IMERG Precipitation Datasets in the Arid Environment of El-Qaa Plain, Sinai. Remote Sens. 2021, 13, 588. [Google Scholar] [CrossRef]
  15. Manz, B.; Páez-Bimos, S.; Horna, N.; Buytaert, W.; Ochoa-Tocachi, B.; Lavado-Casimiro, W.; Willems, B. Comparative Ground Validation of IMERG and TMPA at Variable Spatiotemporal Scales in the Tropical Andes. J. Hydrometeorol. 2017, 18, 2469–2489. [Google Scholar] [CrossRef]
  16. Mahmoud, M.T.; Mohammed, S.A.; Hamouda, M.A.; Mohamed, M.M. Impact of Topography and Rainfall Intensity on the Accuracy of IMERG Precipitation Estimates in an Arid Region. Remote Sens. 2021, 13, 13. [Google Scholar] [CrossRef]
  17. Zambrano-Bigiarini, M.; Nauditt, A.; Birkel, C.; Verbist, K.; Ribbe, L. Temporal and Spatial Evaluation of Satellite-Based Rainfall Estimates across the Complex Topographical and Climatic Gradients of Chile. Hydrol. Earth Syst. Sci. 2017, 21, 1295–1320. [Google Scholar] [CrossRef]
  18. Huang, W.-R.; Chang, Y.-H.; Liu, P.-Y. Assessment of IMERG Precipitation over Taiwan at Multiple Timescales. Atmos. Res. 2018, 214, 239–249. [Google Scholar] [CrossRef]
  19. Omranian, E.; Sharif, H.O. Evaluation of the Global Precipitation Measurement (GPM) Satellite Rainfall Products over the Lower Colorado River Basin, Texas. JAWRA J. Am. Water Resour. Assoc. 2018, 54, 882–898. [Google Scholar] [CrossRef]
  20. Tan, M.L.; Santo, H. Comparison of GPM IMERG, TMPA 3B42 and PERSIANN-CDR Satellite Precipitation Products over Malaysia. Atmos. Res. 2018, 202, 63–76. [Google Scholar] [CrossRef]
  21. Freitas, E. da S.; Coelho, V.H.R.; Xuan, Y.; Melo, D. de C.D.; Gadelha, A.N.; Santos, E.A.; Galvão, C. de O.; Ramos Filho, G.M.; Barbosa, L.R.; Huffman, G.J.; et al. The Performance of the IMERG Satellite-Based Product in Identifying Sub-Daily Rainfall Events and Their Properties. J. Hydrol. 2020, 589, 125128. [Google Scholar] [CrossRef]
  22. Kumar, M.; Hodnebrog, Ø.; Sophie Daloz, A.; Sen, S.; Badiger, S.; Krishnaswamy, J. Measuring Precipitation in Eastern Himalaya: Ground Validation of Eleven Satellite, Model and Gauge Interpolated Gridded Products. J. Hydrol. 2021, 599, 126252. [Google Scholar] [CrossRef]
  23. Li, X.; Sungmin, O.; Wang, N.; Huang, Y. Evaluation of the GPM IMERG V06 Products for Light Rain over Mainland China. Atmos. Res. 2021, 253, 105510. [Google Scholar] [CrossRef]
  24. Pradhan, R.K.; Markonis, Y.; Vargas Godoy, M.R.; Villalba-Pradas, A.; Andreadis, K.M.; Nikolopoulos, E.I.; Papalexiou, S.M.; Rahim, A.; Tapiador, F.J.; Hanel, M. Review of GPM IMERG Performance: A Global Perspective. Remote Sens. Environ. 2021, 268, 112754. [Google Scholar] [CrossRef]
  25. INEGI Resumen de Zacatecas. Available online: https://cuentame.inegi.org.mx/monografias/informacion/zac/ (accessed on 27 February 2023).
  26. Pita-Díaz, O.; Ortega-Gaucin, D. Analysis of Anomalies and Trends of Climate Change Indices in Zacatecas, Mexico. Climate 2020, 8, 55. [Google Scholar] [CrossRef]
  27. INEGI Continuo de Elevaciones Mexicano (CEM). Available online: https://www.inegi.org.mx/app/geo2/elevacionesmex/ (accessed on 21 June 2023).
  28. CONABIO Portal de Información Geográfica—CONABIO. Available online: http://www.conabio.gob.mx/informacion/gis/?vns=gis_root/clima/climas/clima1mgw (accessed on 21 June 2023).
  29. CONAGUA Sistema de Información Hidrológica (SIH). Available online: https://sih.conagua.gob.mx/ (accessed on 15 March 2023).
  30. Tamm, O.; Saaremäe, E.; Rahkema, K.; Jaagus, J.; Tamm, T. The Intensification of Short-Duration Rainfall Extremes Due to Climate Change – Need for a Frequent Update of Intensity–Duration–Frequency Curves. Clim. Serv. 2023, 30, 100349. [Google Scholar] [CrossRef]
  31. Huffman, G.J.; Bolvin, D.T.; Braithwaite, D.; Hsu, K.; Joyce, R.; Kidd, C.; Nelkin, E.J.; Sorooshian, S.; Tan, J.; Xie, P. Algorithm Theoretical Basis Document (ATBD) Version 06: NASA Global Precipitation Measurement (GPM) Integrated Multi-satellitE Retrievals for GPM (IMERG). Available online: https://gpm.nasa.gov/sites/default/files/2020-05/IMERG_ATBD_V06.3.pdf (accessed on 16 April 2022).
  32. Huffman, G.J.; Stocker, E.F.; Bolvin, D.T.; Nelkin, E.J.; Jackson, T. GES DISC Dataset: GPM IMERG Final Precipitation L3 Half Hourly 0.1 Degree x 0.1 Degree V06, Greenbelt, MD, Goddard Earth Sciences Data and Information Services Center (GES DISC). Available online: https://disc.gsfc.nasa.gov/datasets/GPM_3IMERGHH_06/summary?keywords=imerg (accessed on 16 April 2022).
  33. Van Rossum, G.; Drake, F.L. Python 3 Reference Manual; CreateSpace: Scotts Valley, CA, USA, 2009; ISBN 978-1-4414-1269-0. [Google Scholar]
  34. Zhou, Z.; Guo, B.; Xing, W.; Zhou, J.; Xu, F.; Xu, Y. Comprehensive Evaluation of Latest GPM Era IMERG and GSMaP Precipitation Products over Mainland China. Atmos. Res. 2020, 246, 105132. [Google Scholar] [CrossRef]
  35. American Meteorological Society Rain—Glossary of Meteorology. Available online: https://glossary.ametsoc.org/wiki/Rain (accessed on 24 May 2023).
  36. Moazami, S.; Najafi, M.R. A Comprehensive Evaluation of GPM-IMERG V06 and MRMS with Hourly Ground-Based Precipitation Observations across Canada. J. Hydrol. 2021, 594, 125929. [Google Scholar] [CrossRef]
  37. Sharifi, E.; Steinacker, R.; Saghafian, B. Multi Time-Scale Evaluation of High-Resolution Satellite-Based Precipitation Products over Northeast of Austria. Atmos. Res. 2018, 206, 46–63. [Google Scholar] [CrossRef]
  38. Su, J.; Lü, H.; Zhu, Y.; Cui, Y.; Wang, X. Evaluating the Hydrological Utility of Latest IMERG Products over the Upper Huaihe River Basin, China. Atmos. Res. 2019, 225, 17–29. [Google Scholar] [CrossRef]
  39. Li, Z.; Tang, G.; Hong, Z.; Chen, M.; Gao, S.; Kirstetter, P.; Gourley, J.J.; Wen, Y.; Yami, T.; Nabih, S.; et al. Two-Decades of GPM IMERG Early and Final Run Products Intercomparison: Similarity and Difference in Climatology, Rates, and Extremes. J. Hydrol. 2021, 594, 125975. [Google Scholar] [CrossRef]
Figure 1. (a) Study area with the distribution of the rain gauges and the automated rain gauges with a code number used in this study; (b) view of the Zacatecas state with the study area marked with green color; (c) view of México country; and (d) zoom view of the distribution of the four automated rain gauges with their corresponding IMERG-FR pixels. The digital elevation model was downloaded from the Continuo de Elevaciones Mexicano (CEM) of INEGI [27].
Remotesensing 16 00273 g001
Figure 2. Climate distribution of the study area. The climate shapefile was downloaded from the CONABIO geoportal [28].
Remotesensing 16 00273 g002
Figure 3. IDW Interpolation maps of the study zone with the amount of average monthly precipitation of the 3 years data recorded via the (a) rain gauges and (b) IMERG, and the (c) difference of precipitation between IMERG and the rain gauges.
Remotesensing 16 00273 g003
Figure 4. Probability distribution functions (PDF) of rainfall occurrence estimated via IMERG-FR and observed using rain gauges at mm/day over different elevations (ad), automated rain gauges at mm/day (e), and mm/h (f).
Remotesensing 16 00273 g004
Figure 5. 3D Scatter Plots of the daily rainfall observations and estimations of the automated rain gauges Estación Climatológica and SainVenant vs. IMERG-FR (a) and NavierStokes and Vertedor vs. IMERG-FR (b).
Remotesensing 16 00273 g005
Table 1. Coordinates and elevations of the rain gauge network used in this research.
CodeRain GaugeLatitudeLongitudeElevation (m.a.s.l.)Missing Data (%)
(GRD)(min)(s)(GRD)(min)(s)
0Llano Blanco230000102393621500.96
1Fresnillo231012102540022010.96
2Gobernador Leobardo Reynoso231048103123621010.00
3Santa Rosa225512103063622400.00
4Genaro Codina222924102273621764.23
5El Saladillo224012102022420340.00
6Guadalupe224500102303622620.00
7Juan Aldama241648103240020092.96
8Loreto221536101592420774.88
9Luis Moya222624102150020170.00
10Miguel Auza241724103262419945.92
11Presa Santiago241724103303619900.00
12Pino Suárez220712101240021190.77
13El Cazadero234124103052419280.00
14Río Grande234912103014819020.00
15Villa González Ortega223112101551221540.00
16Villa Hidalgo222100101431221951.15
17La Bufa224648102341226120.58
18Zacatecas224536102344823527.5
Table 2. Coordinates and elevations of the automated rain gauge network used in this research.
CodeAutomated Rain GaugeLatitudeLongitudeElevation (m.a.s.l.)Missing Data (%)
(GRD)(min)(s)(GRD)(min)(s)
0Estación Climatológica2234481023900232327.87
1NavierStokes223712102412424640.03
2SaintVenant223448102412424030.03
3Vertedor223900102393622480.00
Table 3. Highest daily rainfall events registered by the rain gauges.
Rain GaugeDayGi (mm)Si (mm)Si-Gi (mm)Intensity of
Rain (WMO)
El Cazadero2 July 202053.6016.91−36.69heavy
El Saladillo18 August 202177.0022.08−54.92heavy
Fresnillo4 October 201961.009.34−51.66heavy
Genaro Codina16 September 202179.5022.07−57.43heavy
Gobernador Leobardo Reynoso12 July 202151.9021.82−30.08heavy
Guadalupe20 June 202152.3028.52−23.78heavy
Juan Aldama28 July 202074.3039.19−35.11heavy
Llano Blanco6 August 202176.5012.96−63.54heavy
Loreto16 September 202162.8031.87−30.93heavy
Pino Suárez31 August 202052.1023.53−28.57heavy
Presa Santiago20 June 202154.0017.23−36.77heavy
Zacatecas3 June 202157.5022.77−34.73heavy
Table 4. Highest half-hourly rainfall events registered via the automated rain gauges.
Automated Rain GaugeDayHourGi (mm)Si (mm)Si-Gi (mm)Intensity of
Rain (AMS)
Estación Climatológica18 August 202122:30:0015.003.26−11.74Heavy
NavierStokes1 September 202120:30:0027.201.91−25.29Heavy
SaintVenant22 June 202119:00:0025.603.23−22.37Heavy
Vertedor2 June 202119:30:0023.300.81−22.49Heavy
Table 5. Results of the statistical metrics of the temporal-based evaluation.
Temporal
Resolution
Type of Rain GaugerBiasMEMAERMSEPODFARCSIVHIVFARVCSI
Half-hourlyAutomated rain gauges0.230.130.010.100.520.600.720.240.510.660.25
DailyRain gauges0.640.050.122.045.210.930.460.520.980.190.79
Automated rain gauges0.680.110.332.374.730.830.260.650.910.080.92
MonthlyRain gauges0.850.074.4721.2529.871.000.060.941.000.001.00
Automated rain gauges0.830.1010.4123.7727.831.000.001.001.000.001.00
SeasonalRain gauges0.820.0624.1057.0976.911.000.001.001.000.001.00
Note: ME, MAE, and RMSE are presented in mm/30 min, mm/day, mm/month, and mm/season.
Table 6. Statistical metrics of the topographical evaluation.
Elevation Range
(m.a.s.l.)
Temporal ResolutionrBiasMEMAERMSEPODFARCSIVHIVFARVCSI
1902–2101Daily0.670.010.011.954.990.930.450.520.970.170.82
Monthly0.890.021.3019.4427.501.000.060.941.000.001.00
Seasonal0.830.027.4458.1777.691.000.001.001.000.001.00
2119–2323 Daily0.600.120.262.195.510.920.460.510.970.200.78
Monthly0.840.117.3823.0431.291.000.070.931.000.001.00
Seasonal0.810.1038.1757.7877.981.000.001.001.000.001.00
2352–2612Daily0.680.100.262.295.130.910.390.580.970.120.86
Monthly0.880.096.8721.9427.951.000.100.901.000.001.00
Seasonal0.840.1243.9648.6078.041.000.001.001.000.001.00
Note: ME, MAE, and RMSE are presented in mm/day, mm/month, and mm/season.
Table 7. Statistical metrics of the gauge density-based evaluation.
Gauge Density (Gauges/Pixel)Type of Rain GaugerBiasMEMAERMSEPODFARCSIVHIVFARVCSI
1Rain gauges0.630.050.112.055.260.930.470.510.980.200.78
Automated rain gauges0.420.000.002.204.800.740.340.540.740.130.87
2Automated rain gauges0.740.160.522.464.690.880.220.700.970.060.94
3Rain gauges0.740.120.281.924.310.890.320.630.980.070.92
Note: ME, MAE, and RMSE are presented in mm/day.
Table 8. Distance to centroid of IMERG-FR pixel evaluation.
Type of Rain Gauge (Distance to Centroid)Type of Rain GaugerBiasMEMAERMSEPODFARCSIVHIVFARVCSI
CentricRain gauges0.690.140.281.854.670.930.480.500.970.180.80
Automated rain gauges0.620.300.782.615.280.830.330.580.910.110.89
PeripheralRain gauges0.620.030.082.135.430.930.460.520.980.190.80
Automated rain gauges0.660.040.142.805.640.900.310.640.950.080.92
Note: ME, MAE, and RMSE are presented in mm/day.
Table 9. Statistical metrics of the climatic evaluation.
ClimaterBiasMEMAERMSEPODFARCSIVHIVFARVCSI
BS1kw0.630.090.192.105.410.930.470.510.980.190.79
BS1kw (w)0.67−0.02−0.052.205.250.950.400.580.980.130.85
BS0kw0.670.060.111.744.480.910.500.480.970.220.76
Note: ME and RMSE are presented in mm/day.
Disclaimer/Publisher’s Note: The statements, opinions and data contained in all publications are solely those of the individual author(s) and contributor(s) and not of MDPI and/or the editor(s). MDPI and/or the editor(s) disclaim responsibility for any injury to people or property resulting from any ideas, methods, instructions or products referred to in the content.

