
Mapping Cones on Mars in High-Resolution Planetary Images with Deep Learning-Based Instance Segmentation

1
College of Earth Sciences, Jilin University, Changchun 130061, China
2
Lab of Moon and Deep Space Exploration, National Astronomical Observatories, Chinese Academy of Sciences, Beijing 100012, China
3
College of Computer Science and Technology, Jilin University, Changchun 130012, China
*
Author to whom correspondence should be addressed.
Remote Sens. 2024, 16(2), 227; https://doi.org/10.3390/rs16020227
Submission received: 1 December 2023
/
Revised: 4 January 2024
/
Accepted: 4 January 2024
/
Published: 6 January 2024
(This article belongs to the Special Issue High-Resolution Observations of Planetary Geological and Geomorphic Investigation)
Abstract
:Cones are among the significant and controversial landforms on Mars. Martian cones exhibit various morphological characteristics owing to their complex origin, and their precise origin remains an active research topic. A limited number of cones have been manually mapped from high-resolution images in local areas, and existing detection methods are only applicable to a single type of cone that has a similar morphology and spatial distribution, leading to the vast majority remaining unidentified. In this paper, a novel cone identification approach is proposed that is specially designed for adequately recognizing cones from different regions in high-resolution planetary images. First, due to the lack of a publicly available cone database for reference, we annotated 3681 cones according to the literature on manual interpretation and the cone information provided by the Lunar and Planetary Laboratory (IRL) in HiRISE images. Then, the cone identification problem was converted into an instance segmentation task, i.e., a cone identification approach was designed based on deep neural networks. The Feature Pyramid Network-equipped Mask R-CNN was utilized as the detection and segmentation model. Extensive experiments were conducted for fine recognition of Martian cones with HiRISE. The results show that the proposed approach achieves high performance; it especially efficiently detects multiple types of cones while generating accurate segmentation to describe the geometry contour of cones. Finally, a Martian cone dataset with deep learning-based instance segmentation (DL-MCD) was built, containing 3861 cones for exploring geological processes on the surface of Mars.
1. Introduction
Cones protruding from the surface of Mars are distinctive features of Martian geomorphology [1]. Compared to other typical landforms on Mars, cones exhibit various features in different morphologies and are widely distributed on the surface of Mars, including in high-latitude regions [2]. Cones can be classified into three types according to their origin, i.e., volcanic (scoria/cinder cones [3,4], rootless cones [5,6], and tuff cones/rings [7]), sedimentary (mud volcanoes [8,9,10,11]), and periglacial (pingos [12,13]). The formation of cones is evidence of recent water/ice, hydrothermal, and related ore-forming processes on Mars, and information has been recorded on the environment and climate change characteristics of Mars [14,15,16]. The effective identification of Martian cones is a necessary and important task for revealing the geological evolutionary history of Mars.
At present, the identification of cones is mainly focused on the utilization of the Mars Reconnaissance Orbiter (MRO) data. Manual visual interpretation has always been the main means of cone detection. As early as 1979, cones were first recognized by Allen and Frey on the northern plains of Mars using Viking Orbiter imagery [17,18]. Three years later, Frey and Jarosewich [19] found many small cones in Acidalia and parts of Utopia–Isidis–Elysium Planitia by interpreting more than 12,000 images transmitted back from the Viking orbiter. In 2005, Farrand et al. [20] marked 180 cones in Acidalia Planitia and Cydonia Mensae with the Mars Orbiter Camera (MOC), THEMIS images, and a TES-derived thermal inertia map. Hauber et al. [21] presented observations of 100 cones and mounds on the floor of Coprates Chasma, and the origin of these cones was inferred based on the crater/cone diameter ratios. In 2021, Dapremont and Wray [22] used orbital remote sensing data to assess 253 cones. On 15 May 2021, China’s Tianwen-1 successfully landed on the Martian Utopian Plain. The Tianwen-1 orbiter is conducting a detailed survey of the landing area via the High-Resolution Imaging Camera (HiRIC). More recently, Huang et al. [23] found a total of 272 well-preserved cones in the landing area with HiRIC data.
Recently, machine learning (ML) has gradually been applied to the automatic identification of cones [24,25,26,27] on two types of high-resolution MRO images, i.e., the High-Resolution Imaging Science Experiment (HiRISE, 0.3 m/pixel) and Context Camera (CTX; 6 m/pixel). Traditional machine learning methods such as artificial neural networks (ANNs) [24] and support vector machines (SVMs) [25] combined with features extracted based on well-established image processing techniques such as gradient features have been used for the automatic recognition of Martian landforms. However, the feature extracted via traditional image processing techniques is a hand-designed feature with weak robustness. With the great success of deep learning in the field of image processing, especially deep convolutional neural networks (CNNs), some researchers have tried to use CNNs for cone recognition owing to their powerful feature extraction capabilities. For example, Palafox et al. [25] demonstrated the utilization of a CNN and an SVM to classify volcanic rootless cone groups in northeastern Elysium Planitia on HiRISE, and the results show that the CNN is more advantageous for unknown cone detection. Palafox et al. [26] also classified volcanic rootless cone groups with an SVM and a CNN on HiRISE and CTX. Such methods, however, are still a two-stage model with a more laborious design process and lower performance compared to end-to-end models. Therefore, the researchers only used CNNs to accomplish cone recognition in an end-to-end manner. These types of methods can only determine cone groups, and information such as the number, size, and location of cones cannot be acquired. Pieterek et al. [27] automatically detected cones and impact craters with CTX global mosaic images using a CNN, with a detection rate of 90% (7/8) and 80% (71/90) for cones and impact craters, respectively. In general, little work has been performed to develop generalized recognizers to identify Martian cones. It is necessary to design models that can accurately recognize individual cones based on advanced artificial intelligence techniques.
According to the current literature, three factors, i.e., the spatial differentiation of cones for complex geological activities on Mars, various morphological characteristics owing to their complex origin, and the limited number of recognized cones, should be considered in the automatic identification of cones. The spatial distribution of Martian cones displays area differences. Existing techniques for the automatic identification of cones can only be applied to specific types in a small area. Meanwhile, the complex origin of cones leads to their irregular shapes and degraded morphology with blurred boundaries and them being connected to each other. This increases the difficulty of individual identification of cones, and complete cone information is crucial for future analysis. More importantly, there are relatively few marked Martian cones and no publicly available cone database for reference. Detection models use limited and single types of typical cones as training samples, as other types cannot be identified efficiently and comprehensively.
To address these issues, we annotated a Martian cone dataset that contains 3681 cones according to the literature on manual visual interpretation. The cone information was provided by the Lunar and Planetary Laboratory (IRL) at the College of Science, University of Arizona, from HiRISE images. Then, we converted the cone identification problem into an instance segmentation task and identified cones using the HiRISE images by means of deep neural networks. The identification of Martian cones with an instance segmentation approach can distinguish different individual cones in a pixel-to-pixel manner, which provides accurate information about the location and size of each cone, which is critically important for subsequent research. The main contributions of this article are as follows.
- (1)
- For the comprehensive identification of Martian cones, we use cones with different origins and distributed in different spatial locations as training samples. The Feature Pyramid Network-equipped Mask-RCNN model is introduced to Mars cone instance segmentation. This model not only effectively detects the cones in the image but also generates high-quality segmentation masks for each cone.
- (2)
- The Feature Pyramid Network fuses the features extracted by the convolutional network backbone at different levels in a top-down manner, which is suitable for the different scales of cones in high-resolution images, and thus provides a higher cone recognition performance.
- (3)
- Instance segmentation of the Martian cone dataset was carried out based on deep learning (DL-MCD) with 3681 cones, which is 180 more than the initial number of annotated cones. In this dataset, the locations and morphological characteristics, e.g., cone width and basal dip angle, are provided to explore geological processes on the surface of Mars.
2. Data and Methods
2.1. Description of Dataset
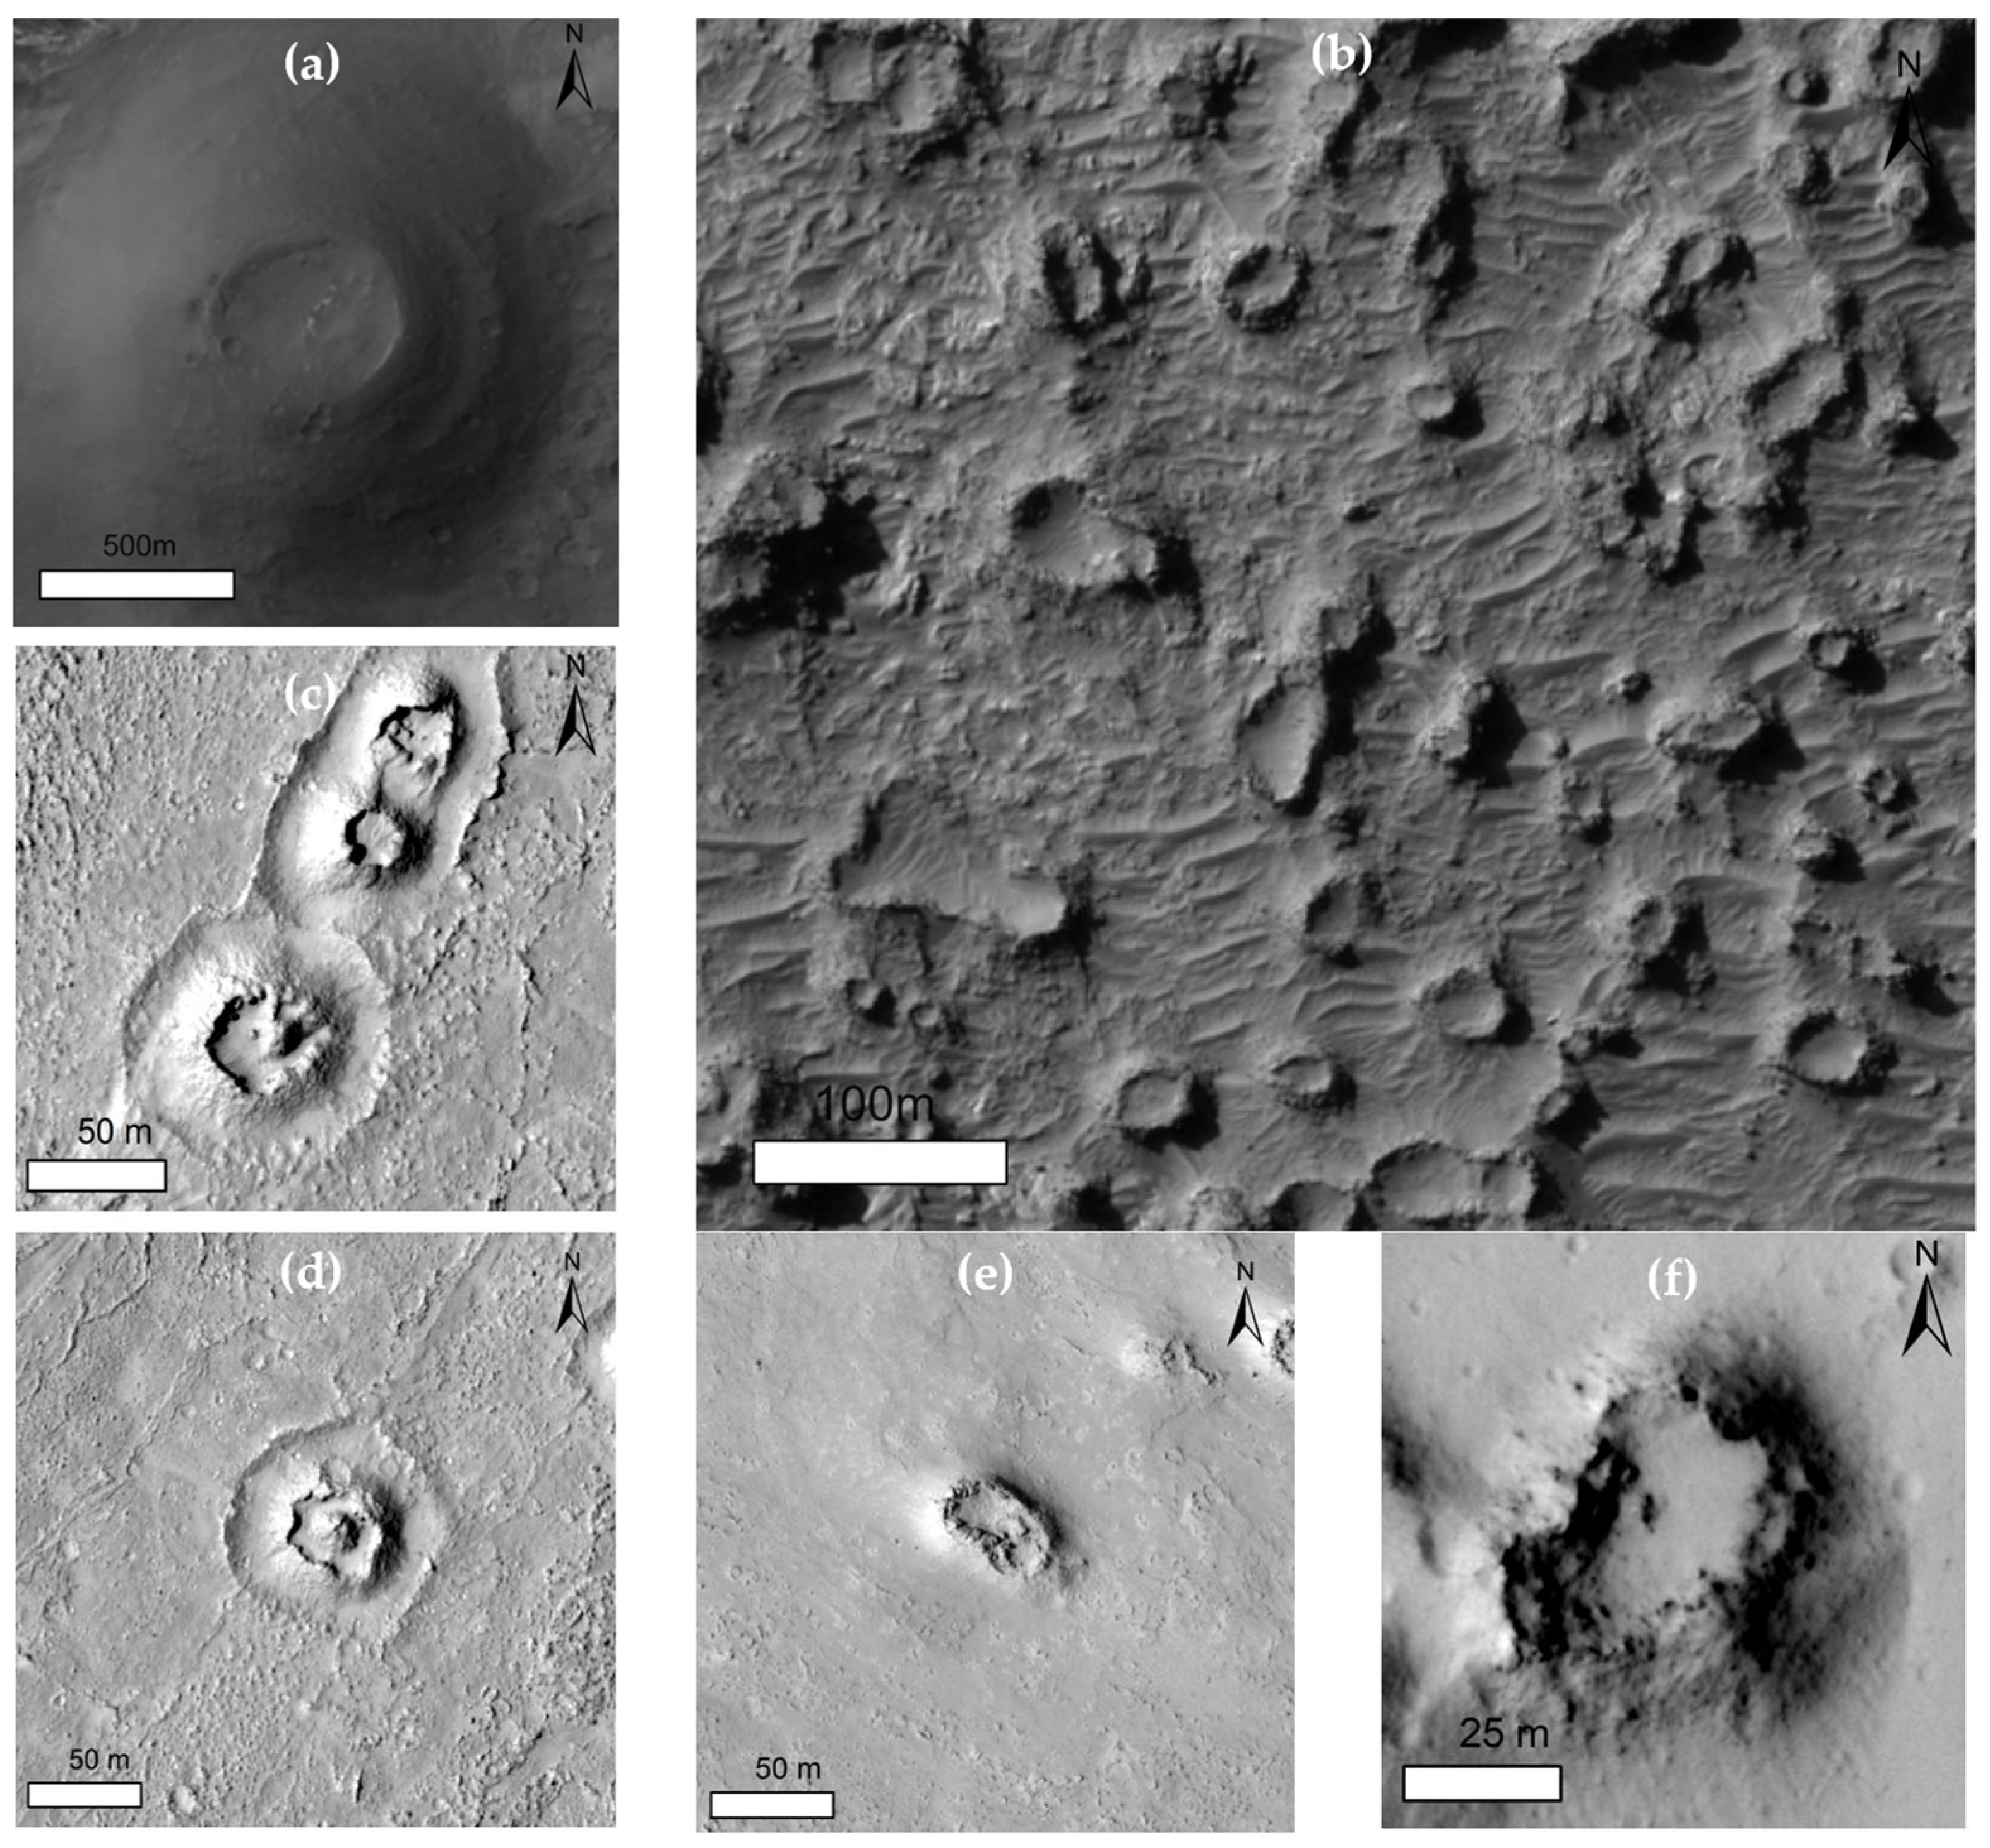
The imaging mode of the annotated Martian cone dataset is HiRISE images with a high resolution of 0.25 to 0.5 m/pixel. We collected and selected 43 and 12 HiRISE images according to Refs. [3,8,9,21,22,28,29,30,31,32,33] and the cone information provided by the IRL, in which 3355 and 326 cones were annotated, respectively. In this dataset, the origin of more than 40% of cones has been inferred, such as scoria cones [3,9], rootless cones (pseudocraters) [31], mud volcanoes [22,23,24,25], and tuff cones/rings [21], leading to the presentation of various morphological characteristics. The spatial distribution and morphological characteristics of Martian cones in the HiRISE images appear as isolated, clustered, chained, irregular, and destroyed cones. Among these cones, clustered and isolated cones account for 50% and 40%, respectively. Figure 1 shows the typical cones in the HiRISE images. It should be emphasized that, in this study, we do not distinguish among the different origins of cones, and all cones with different origins are identified as targets.
2.2. Identification of Cones with Deep Learning-Based Instance Segmentation
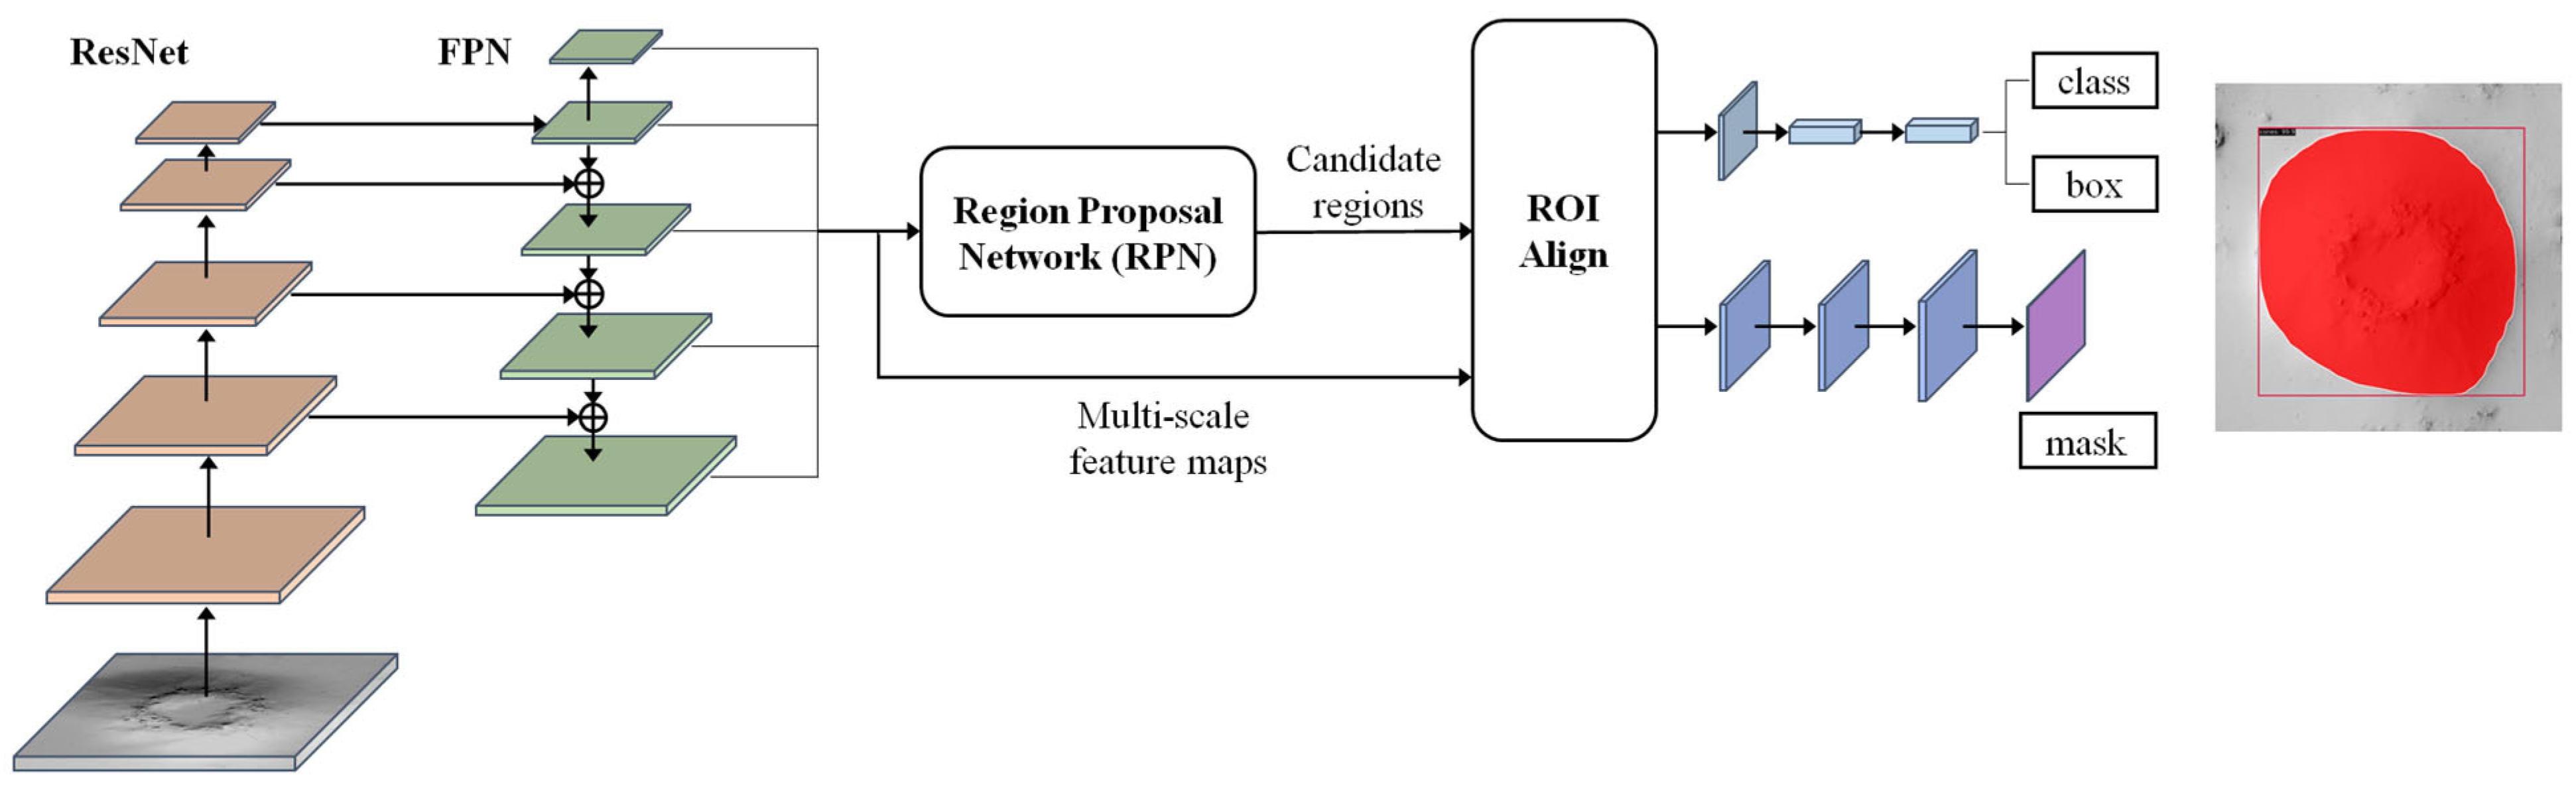
This subsection presents an intelligent Mars cone recognition method based on the Mask R-CNN [34] instance segmentation model. The Mask R-CNN is an advanced instance segmentation model extended from the Faster R-CNN [35] object detection model, which can simultaneously perform object detection and semantic segmentation. To adapt to the multi-scale characteristics of cones, the Mask R-CNN equipped with a Feature Pyramid Network (FPN) [36] was adopted for cone recognition. The model mainly includes multi-scale feature extraction, the region proposal network (RPN), the ROIAlign module, and the instance segmentation head. The framework of the Feature Pyramid Network-equipped Mask R-CNN is shown in Figure 2.
2.2.1. Multi-Scale Feature Extraction
The multi-scale feature extraction module uses a standard convolutional neural network (ResNet50 [37] was used in this study) to extract features at different levels from bottom to top and then fuses the features at different levels from top to bottom with the FPN module to obtain a multi-scale feature representation of the image.
2.2.2. Region Proposal Network (RPN)
The RPN generates candidate boxes with different sizes and scales based on the extracted multi-scale features and then classifies these potential candidate regions and generates bounding boxes. Candidate boxes that may contain targets are selected and integrated into the second stage framework for instance segmentation.
2.2.3. ROIAlign Module
The RoIAlign module processes the candidate frames into features of the same size, which are passed into the subsequent instance segmentation header. Specifically, RoIAlign uses bilinear interpolation to obtain the feature values of each point in the feature map, converting the feature aggregation operation into a continuous process instead of the two quantization processes in the RoIPooling operation in the Faster R-CNN model, which improves the detection and segmentation accuracy of the model.
2.2.4. Instance Segmentation Head
The instance segmentation head consists of two parts: the detection head and the segmentation head. The detection head is implemented using a fully connected layer and a Softmax classifier, which is used to accurately obtain the size and location of the cone, as well as the confidence level that the region is recognized as a cone. The segmentation head is implemented with fully convolutional networks (FCNs) [38]. It firstly up-samples the feature map via deconvolution to reduce the scale difference between the feature map and the original image, thus alleviating the error in mapping the target region to the original image, and then enhances the feature information of the object by utilizing multiple convolutional layers with a 3 × 3 kernel size and ultimately achieves cone segmentation by generating a prediction for every pixel of the feature map.
3. Experiments and Results
3.1. Experiment Design
3.1.1. Training Strategy
To effectively identify Martian cones with the deep learning-based instance segmentation cone identification approach, we adopted a cropping window size of 1024 × 1024, and the image area of interest was automatically cropped based on the position of the cones and the preset cropping window size for subsequent analysis. The cone images from different adjacent detection maps had a 50% overlap with each other. Then, we obtained a total of 2024 cone images, from which 1798 cone images were randomly selected for training and the remaining images for testing. It should be emphasized that the theoretical minimum detection size of the model is 32 × 32 pixels due to the fact that the feature extraction module of the model has five downsampling operations.
3.1.2. Evaluation Metrics
In this study, the normal instance segmentation criteria, i.e., the recall and precision of object detection and object segmentation, were used to evaluate the performance of the cone identification model.
In object detection, a bounding box (bbox) is usually used to describe the target location. The evaluation metrics of the location of cones, including recall and precision, can be formulated as follows:
where TP is the true positive cone, FP is the false positive cone, and FN is the number of false negative cones. In the experiment, if the intersection over union (IoU) of the detection result and the ground truth is more than 0.5, the sample is a TP. If the IoU is less than 0.5, the sample is an FP. When there is no ground truth, the sample is an FN. A high recall or a high precision suggests that the model has good performance.
In object segmentation, mAR and mAP were used to evaluate the segmentation results, which can be calculated as follows:
where mAR and mAP are the average recall and average precision of pixel segmentation, respectively, and c is the number of segmentation categories. The higher the mAR and mAP, the better the segmentation results.
3.1.3. Implementation Details and Parameter Settings
For the experiments in this study, the Mars cone recognition method was founded on the ResNet50 backbone pretrained on ImageNet [39] and the FPN. The stochastic gradient descent optimization algorithm was used to train the model, with momentum and weight decay set to 0.9 and 0.0001, respectively. The learning rate was 0.02, and the batch size was set to 2. The proposed method was implemented on a computer with an Intel(R) Core (TM) i5-13400F 2.50 GHz CPU, an NVIDIA RTX 3060 GPU, and 16 GB of RAM.
3.2. Results
For the evaluation metrics mentioned above, the performance of the deep learning-based instance segmentation cone identification achieved competitive object detection accuracies, i.e., 92.1% in recall and 84.8% in precision, and object segmentation accuracies, i.e., 92.2% in recall and 84.9% in precision (Table 1). The average identification time required for each image was 0.52 s. For the recall, it indicated that almost all of the recognized cones in the test set can be recovered with the proposed cone identification mode, whereas from the precision, we could infer that the model identified many new Martian cones.
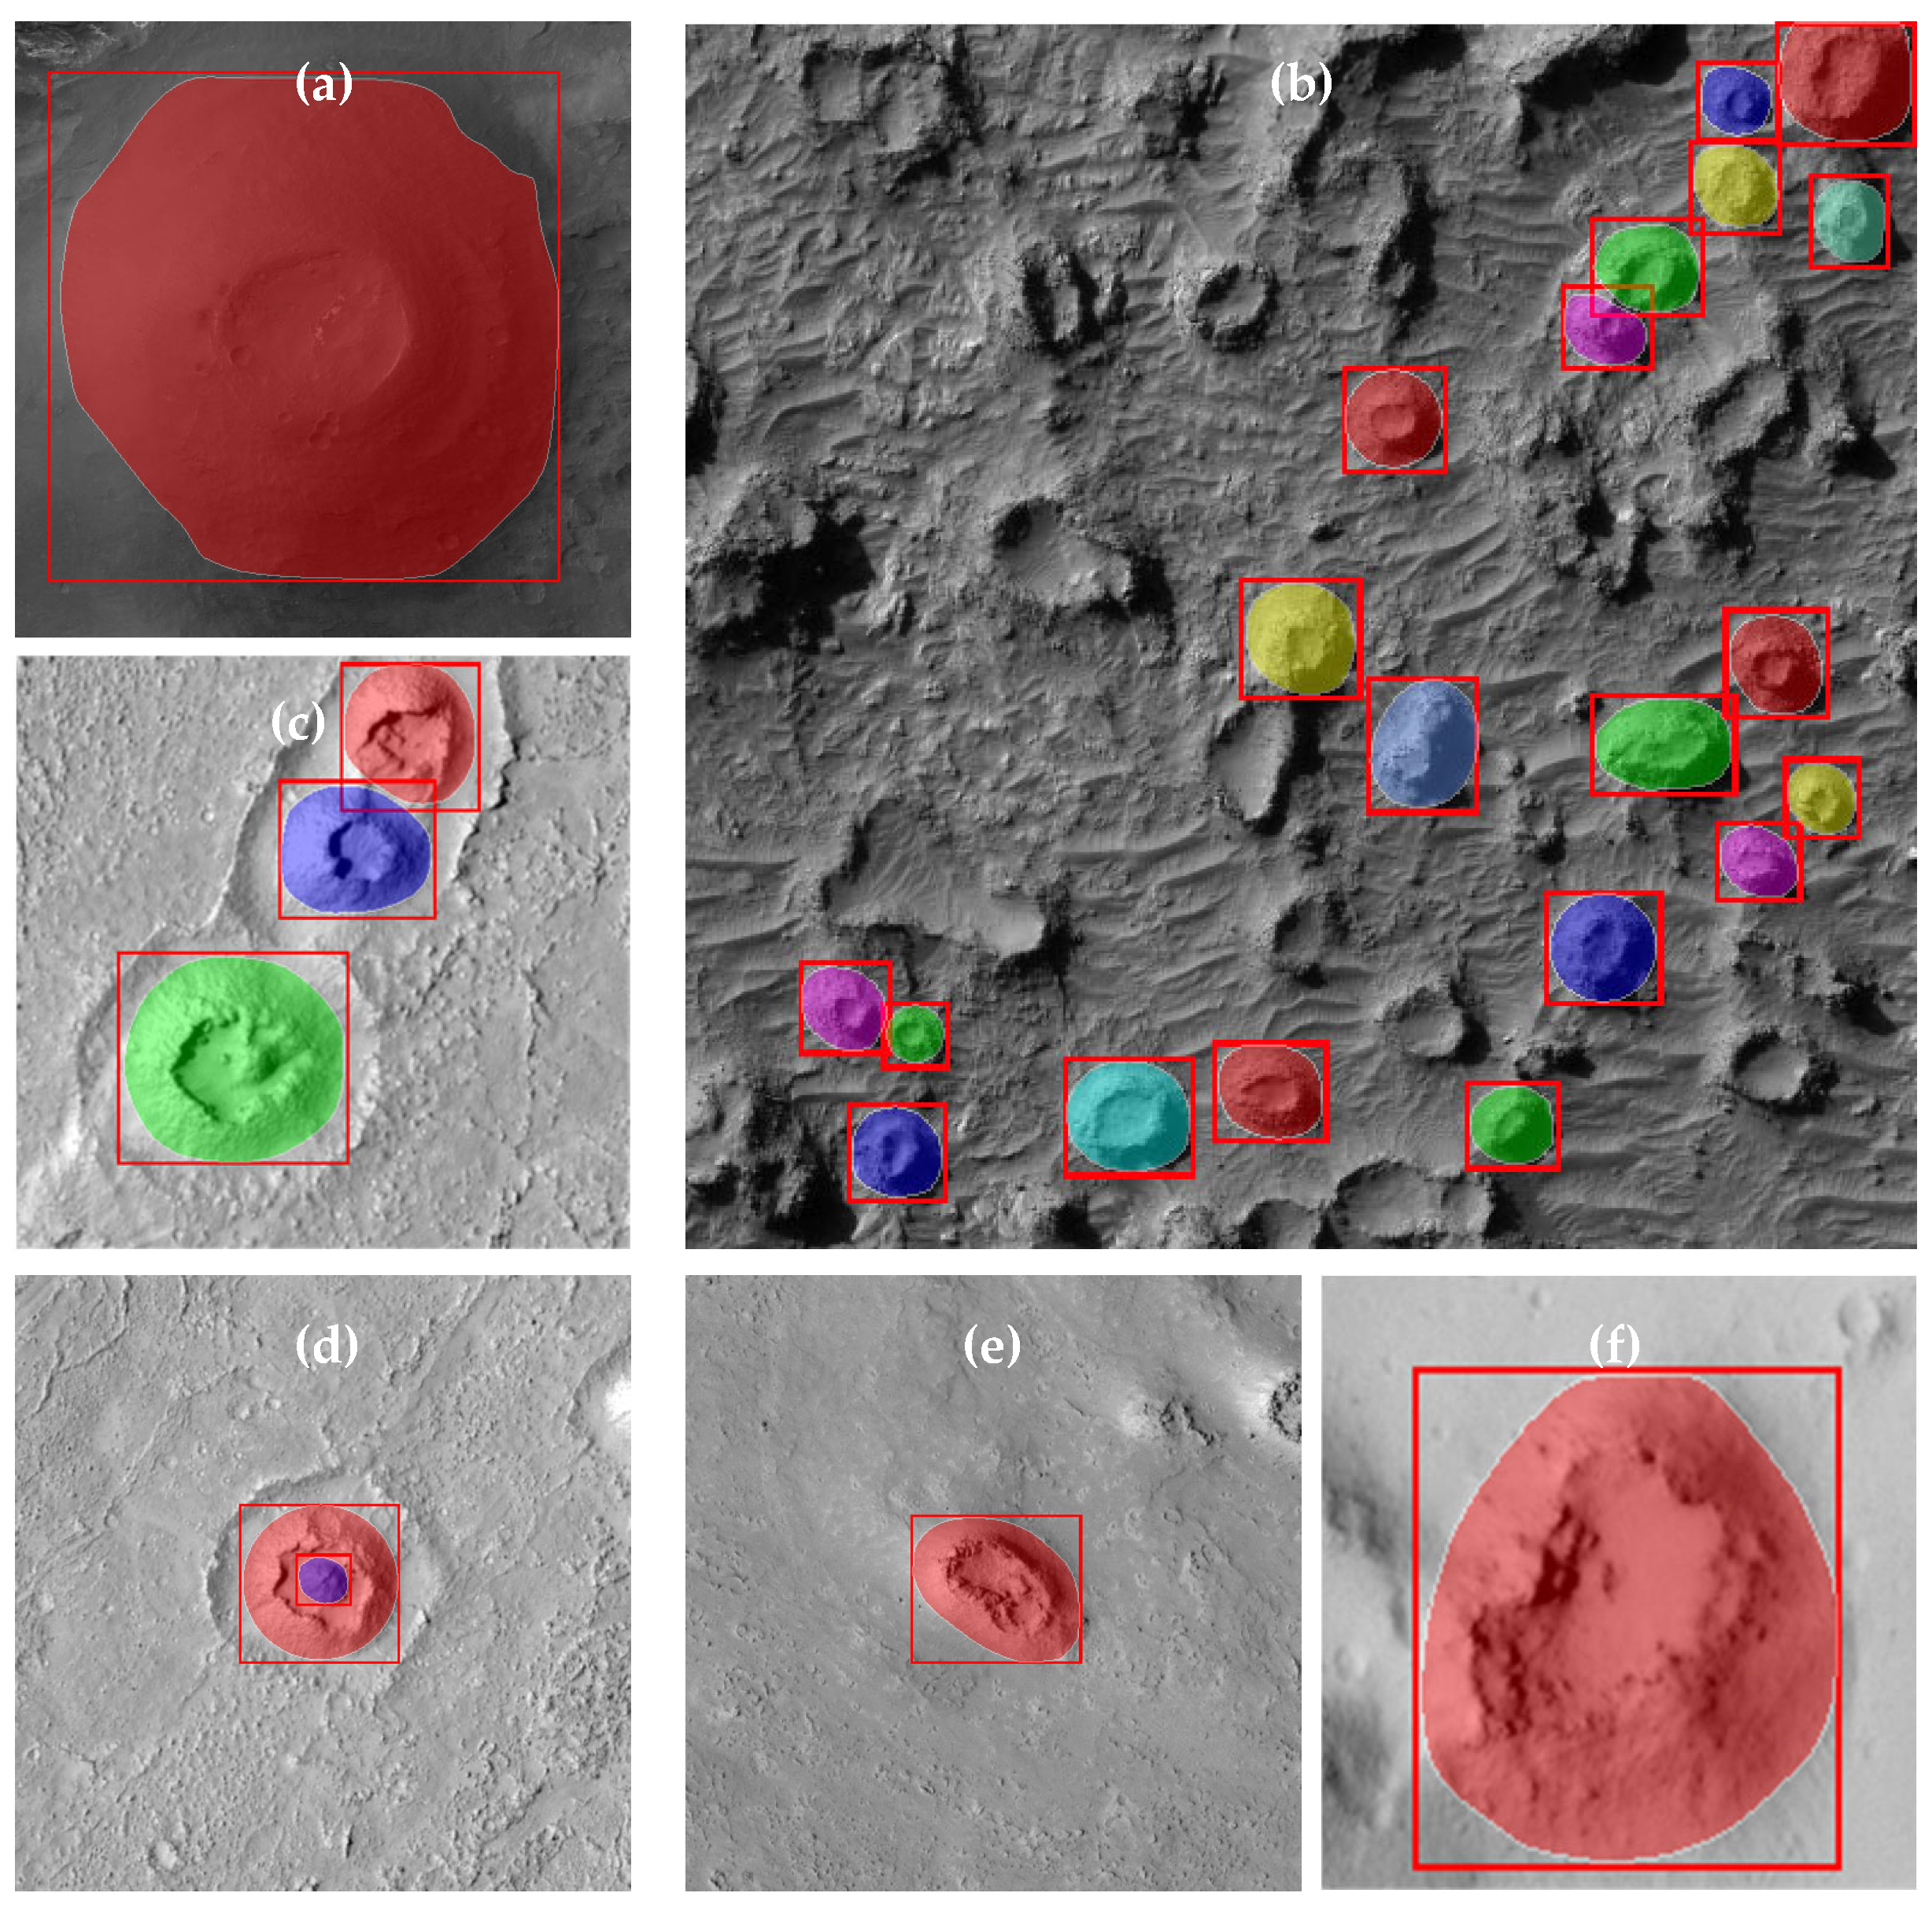
Figure 3 shows the visualization results of the Martian cones with the proposed deep learning-based instance segmentation approach. As can be seen from Figure 3, the identified cones have two indicators, i.e., the detection box and the target edge, which can clearly outline the cone base. For various spatial distributions and morphological characteristics of Martian cones, it showed good recognition performance.
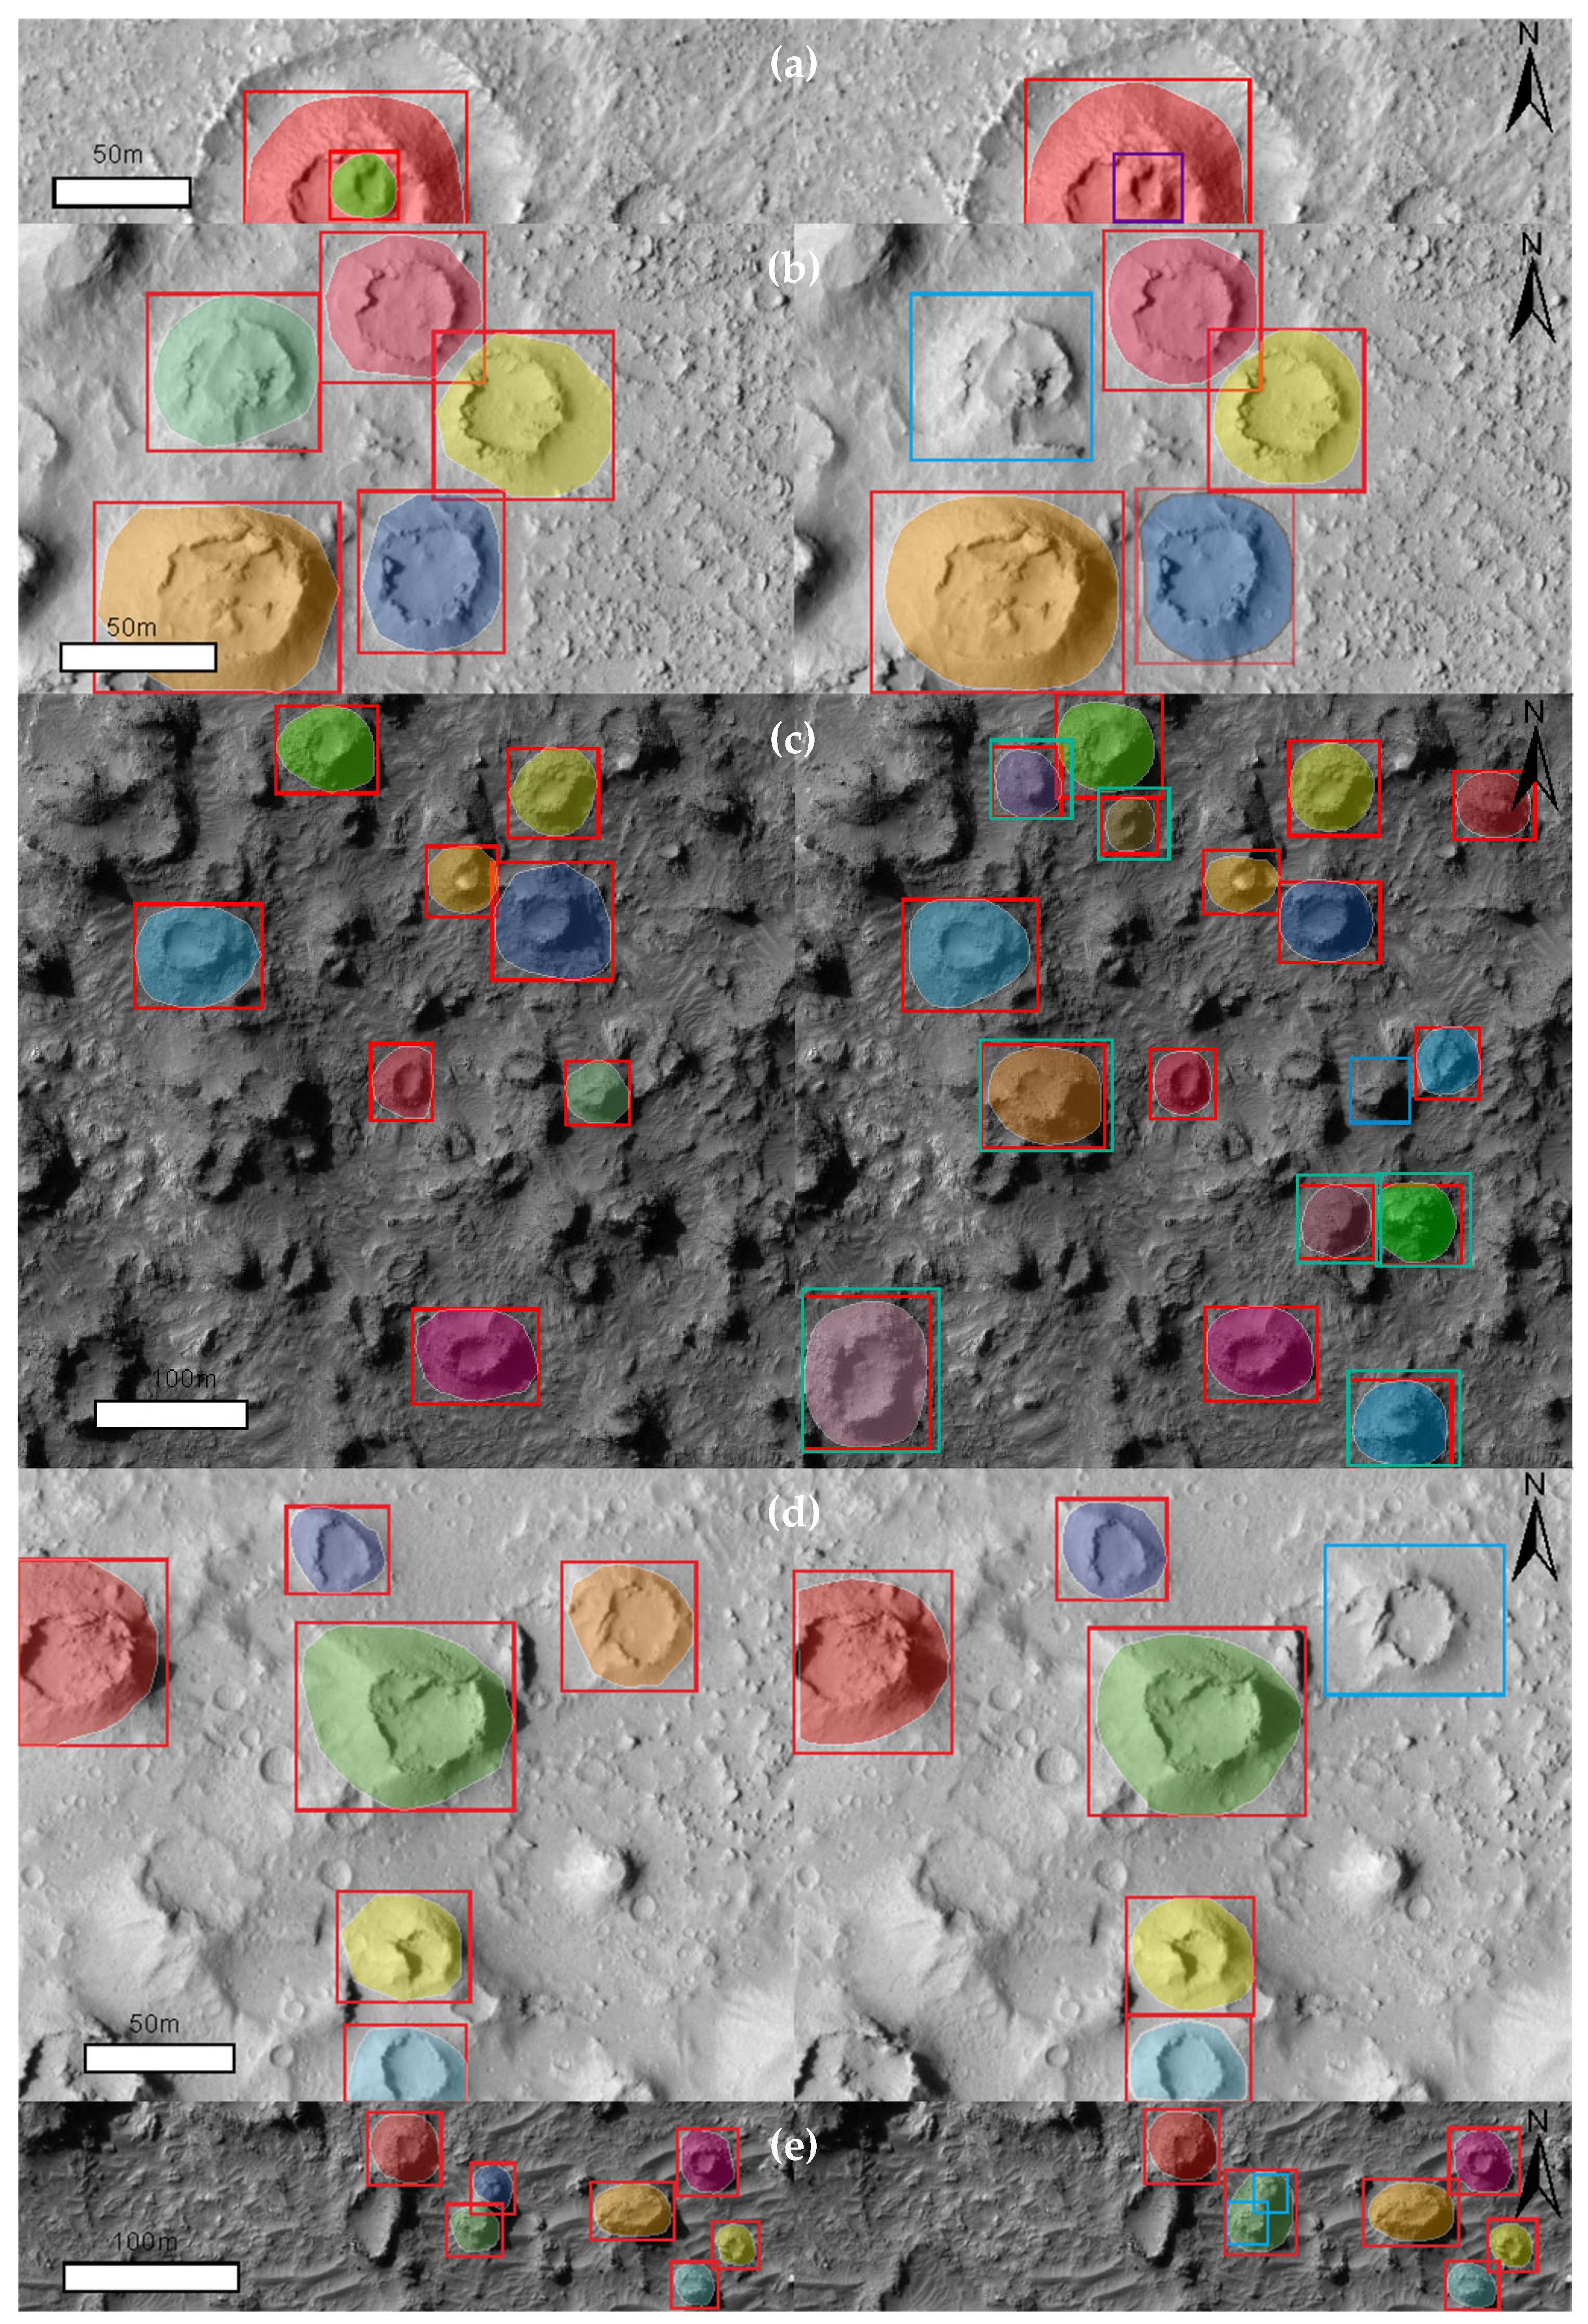
However, due to the complex morphological characteristics of Martian cones, it might be expected that undetected and newly detected Martian cones are inevitable. Figure 4 shows undetected and newly detected Martian cones in the testing data. Green squares represent the newly detected cones, and the blue squares represent the undetected cones. One can observe that missed detection usually occurs when the shape of the cone is not obvious (Figure 4a,b,d), e.g., double cones, destroyed or degenerated cones, or flat isolated cones, and when the cones are densely distributed (Figure 4c,e), e.g., clustered cones, densely adjacent cones, and especially cones with small sizes. For double cones, the crater of the inner cone is relatively small, but destroyed or degenerated cones and flat isolated cones present features of wide and shallow craters. Among the clustered cones, densely distributed smaller cones exhibit cone chains or a pairwise distribution. Due to the limitation of the minimum detection size of the identification model, these smaller cones could not be detected. However, it should be noted that we could find many newly detected Martian cones in the clustered cones.
Deep Learning-Based Instance Segmentation Martian Cone Dataset (DL-MCD)
Due to the effectiveness of the cone identification model, more Martian cones can be recognized in the collected HiRISE images. The deep learning-based instance segmentation model for Martian cone identification based on a derivation of learned features was used to detect and segment cones simultaneously. This resulted in the identification of 3861 cones, which is approximately 5% greater than the initial number of labeled cones. Then, the newly identified cones, i.e., 180 cones that were not included in the labeled cones, were extracted for manual assessment of the identification accuracy. The false positive rate (FPRs) of the newly identified cones was 7.2 ± 3% and was derived with manual inspection by three domain experts. This illustrates the reliability and stability of the cone identification model. In conclusion, a deep learning-based instance segmentation Martian cone dataset (DL-MCD) of 3861 cones has been derived and made available (see Table S1 in Supplementary Materials).
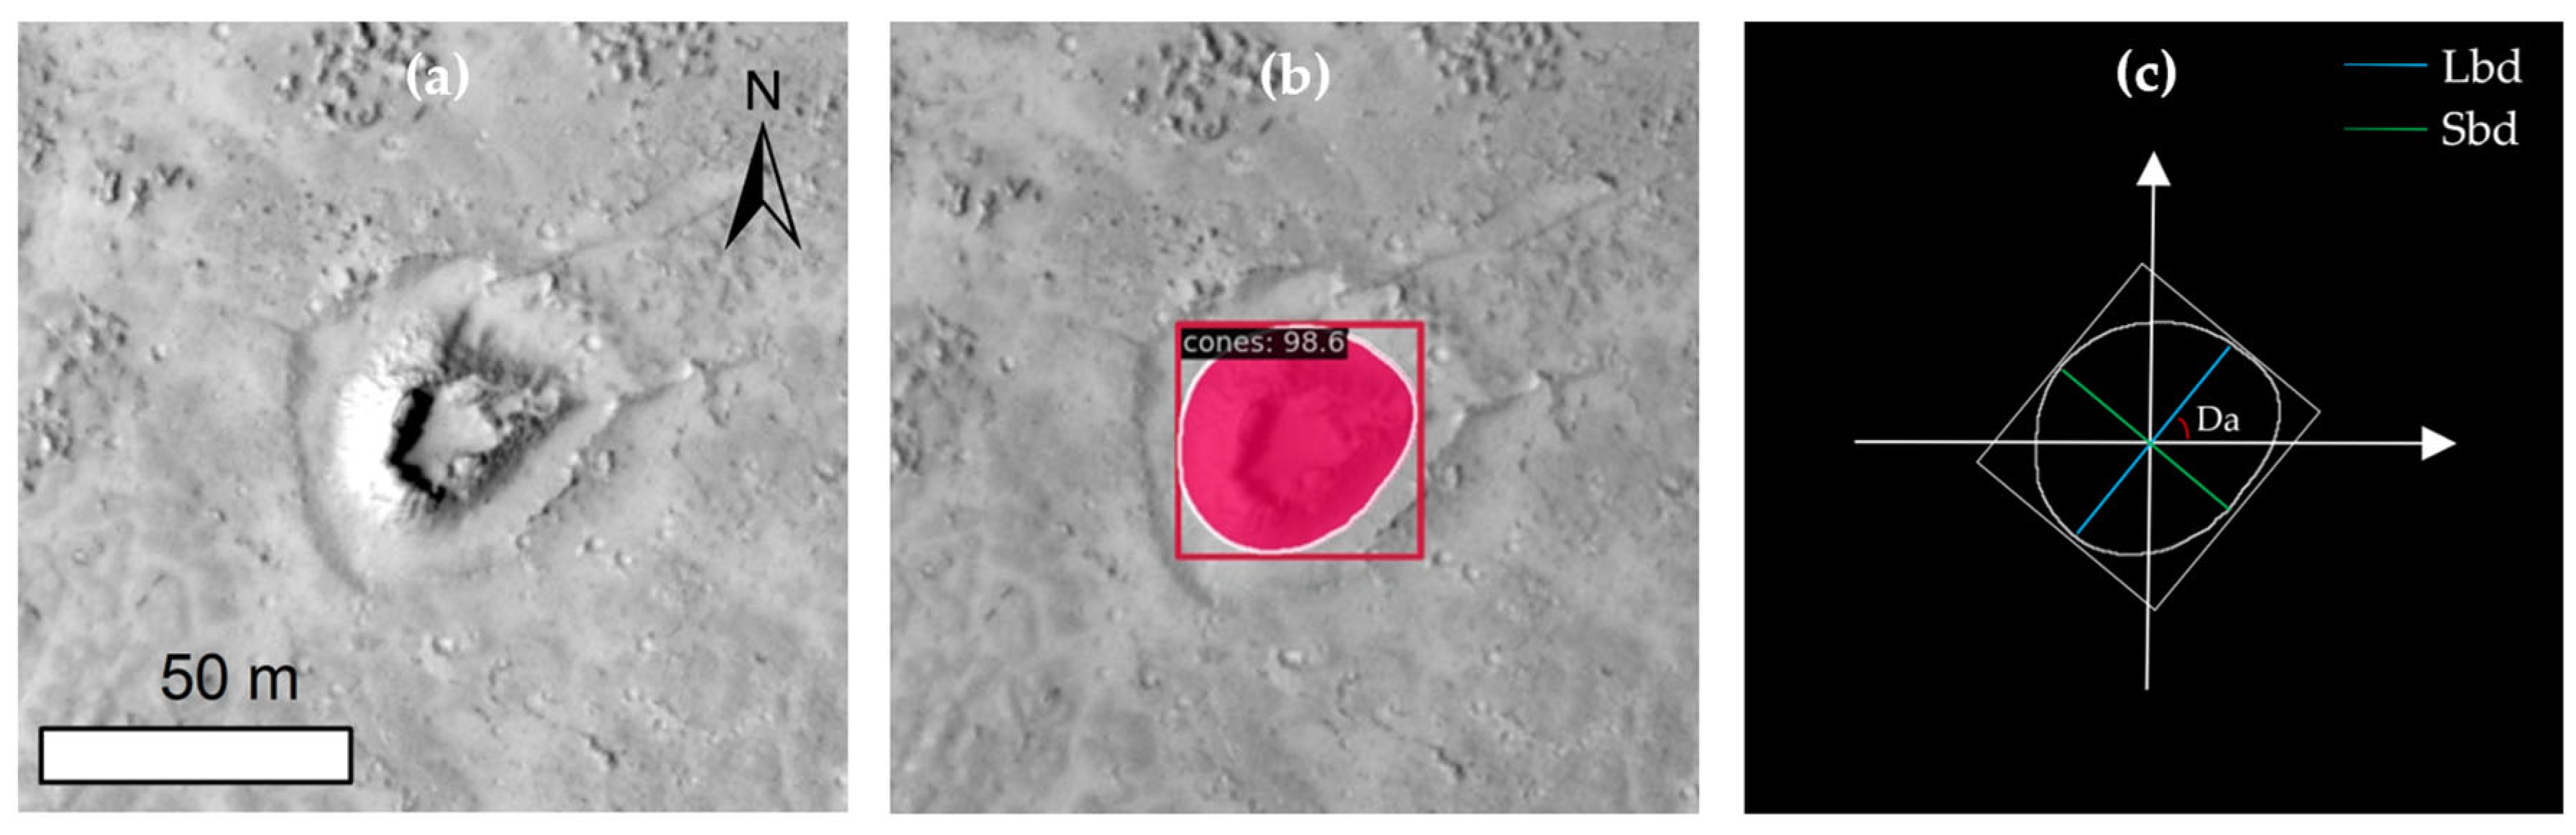
In the DL-MCD, the geometry of the Martian cones, i.e., cone width (i.e., basal diameter), can be quantified with the segmentation results. It is worth noting that the bases of Martian cones often exhibit an irregular elliptical shape. To acquire accurate morphometric features of cones, the pixel edges of cones were extracted, and two cone width parameters, i.e., the long basal diameter (Lbd) and short basal diameter (Sbd), were measured in HiRISE images. Meanwhile, the basal dip angle (Da) of cones also determined the distributed direction of Martian cones. Moreover, derived parameters, i.e., flatness (Lbd/Sbd) of the basal parameters, were also considered. Figure 5 shows the diagram of the given geometry of the Martian cones.
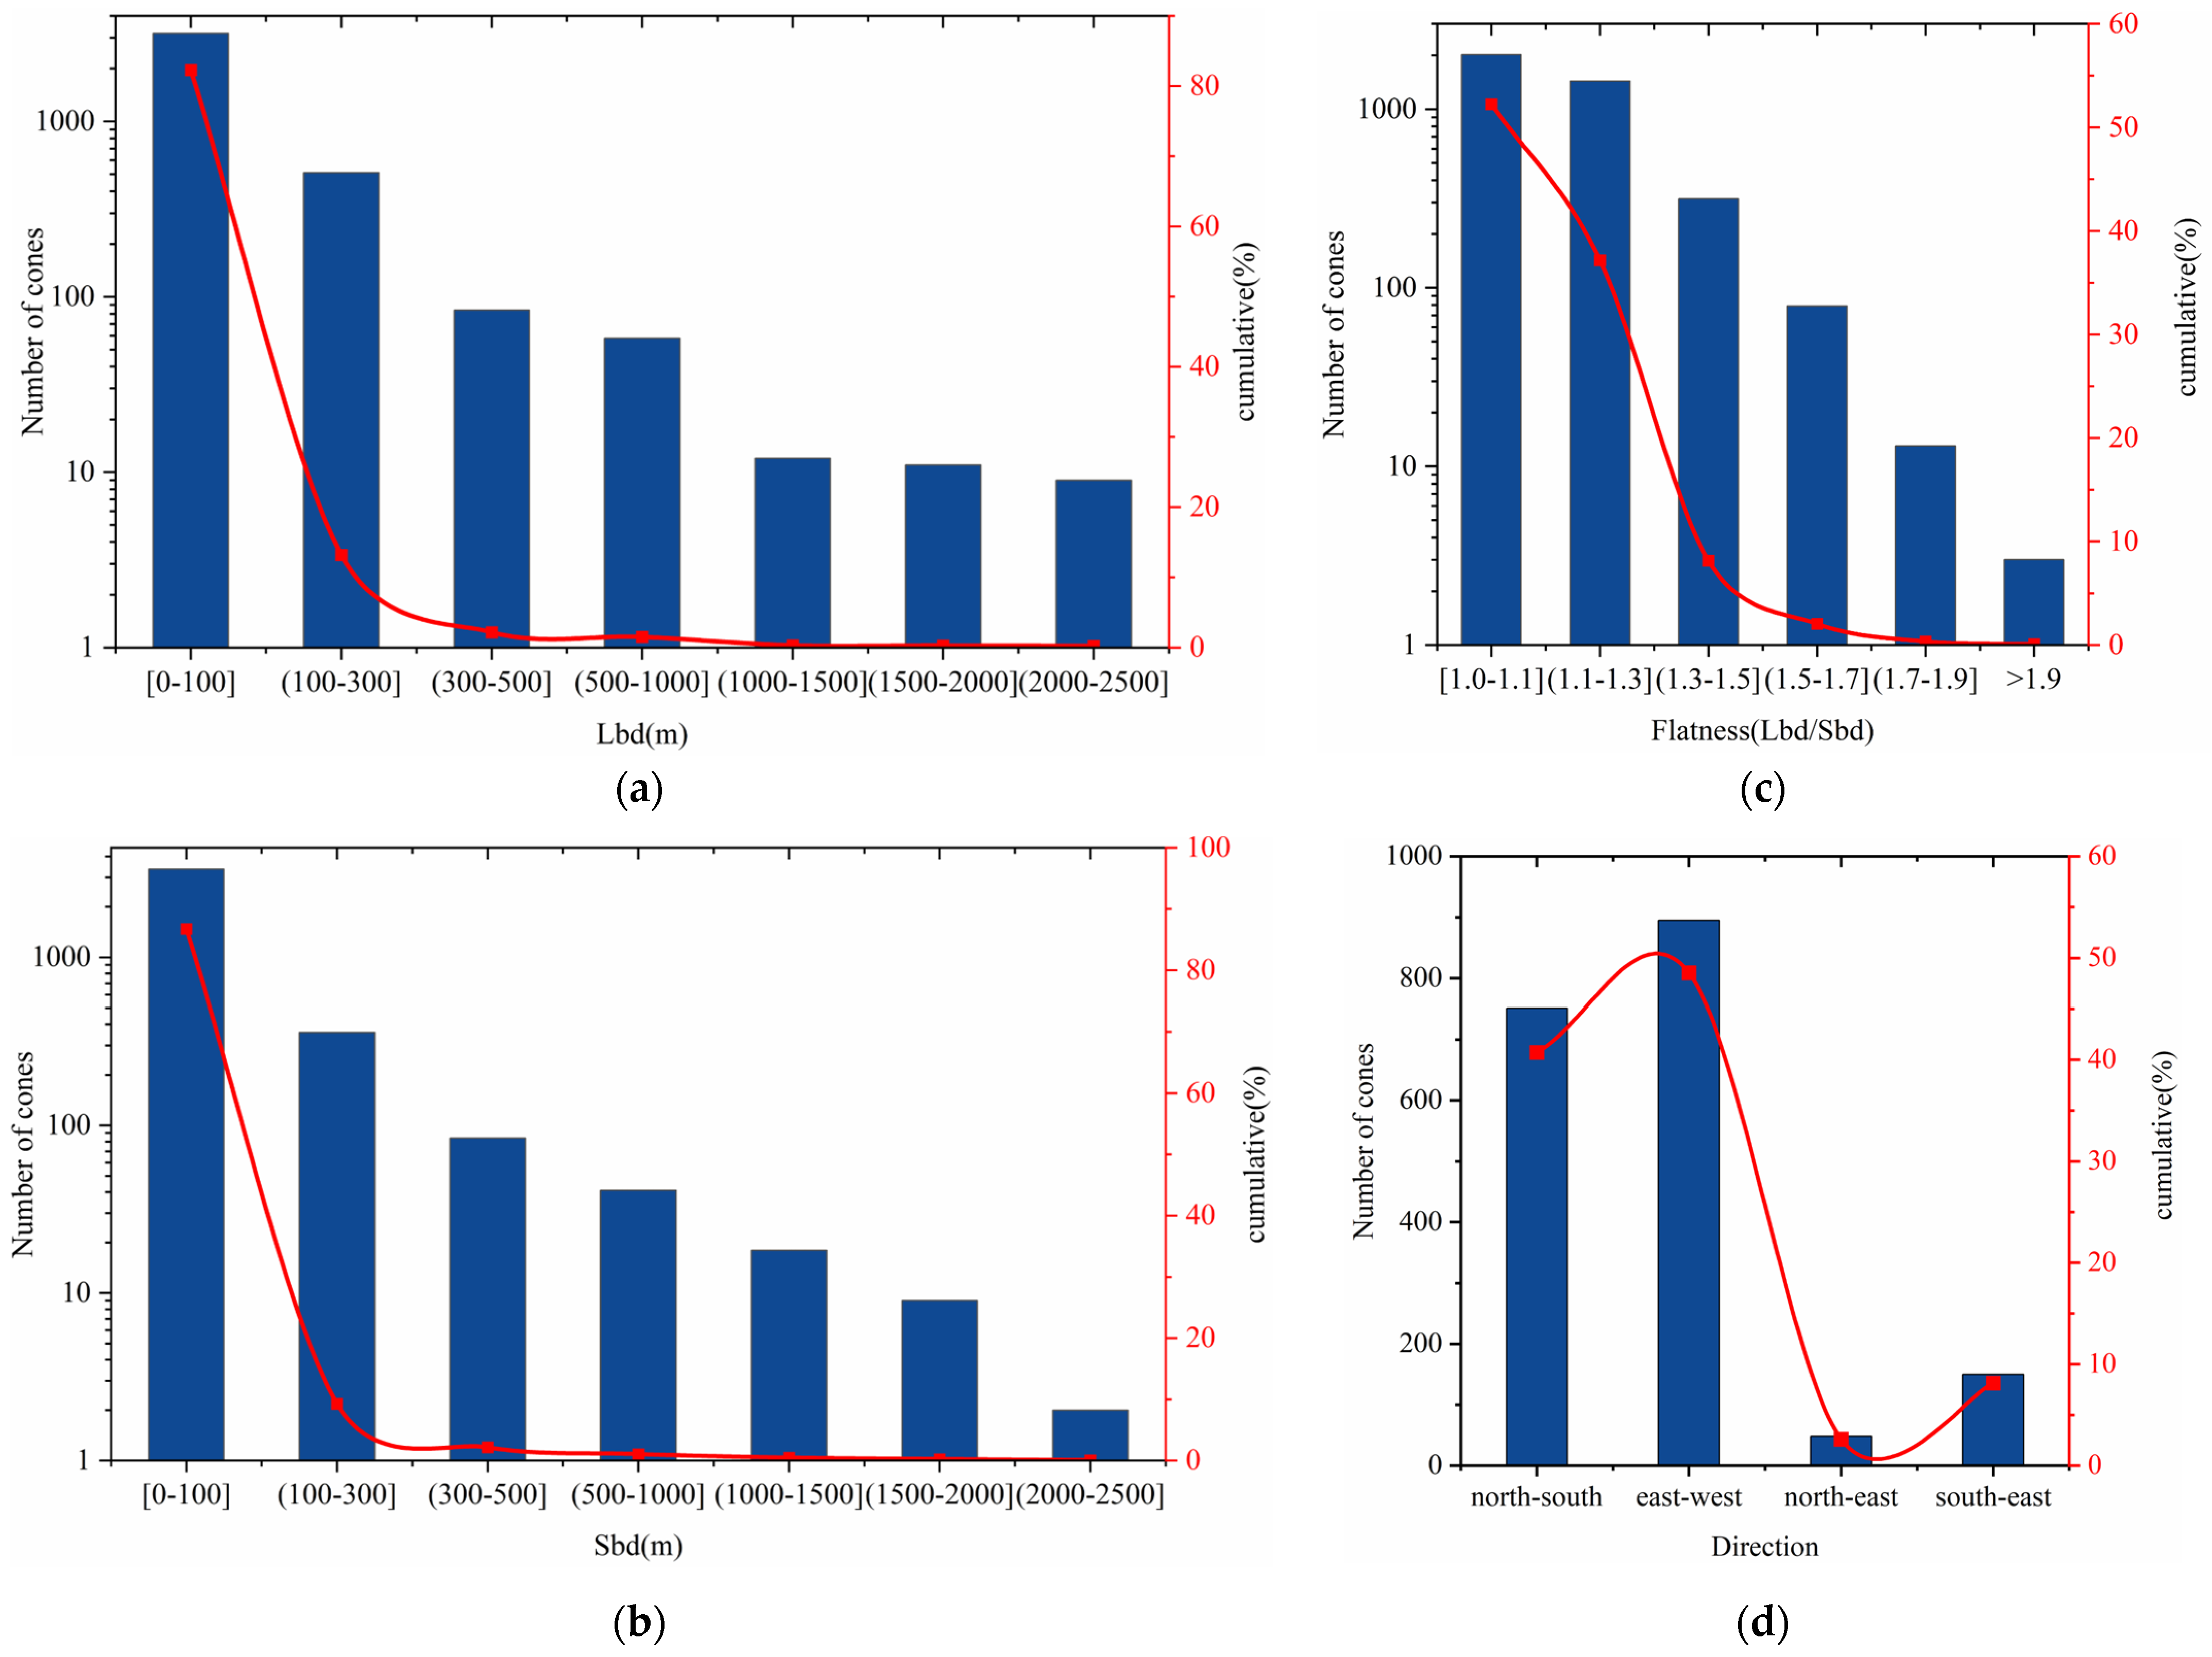
For the DL-MCD, the range of Lbd is 14–2439 m, with a mean of 100 m, and the range of Sbd is 13–2130 m, with a mean of 88 m. Figure 6 shows the frequency histograms and cumulative percentages of basal and dig angle parameters. As can be observed from Figure 6a,b, approximately 90% of identified cones have Lbd < 100 m and Sbd < 100 m. The cone flatness (Lbd/Sbd) is also given in Figure 6c for measuring the shape of the Martian cone. Nearly half of the cones, i.e., 2017 cones, appear circular with flatness (Lbd/Sbd) ≤ 1.1 and present no special direction; a few cones exhibit an elongated elliptical shape, and three cones present obvious flatness (Lbd/Sbd) > 1.9. For the cone distributed direction with Da (Figure 6d), more than 55.24% of cones do not have apparent selectivity of direction, and their flatness (Lbd/Sbd) is close to 1, whereas 48 and 150 cones face toward the northeast or south-east, and 751 and 895 cones face toward the direction of north–south or east–west.
4. Discussion
4.1. Spatial Distribution Analysis
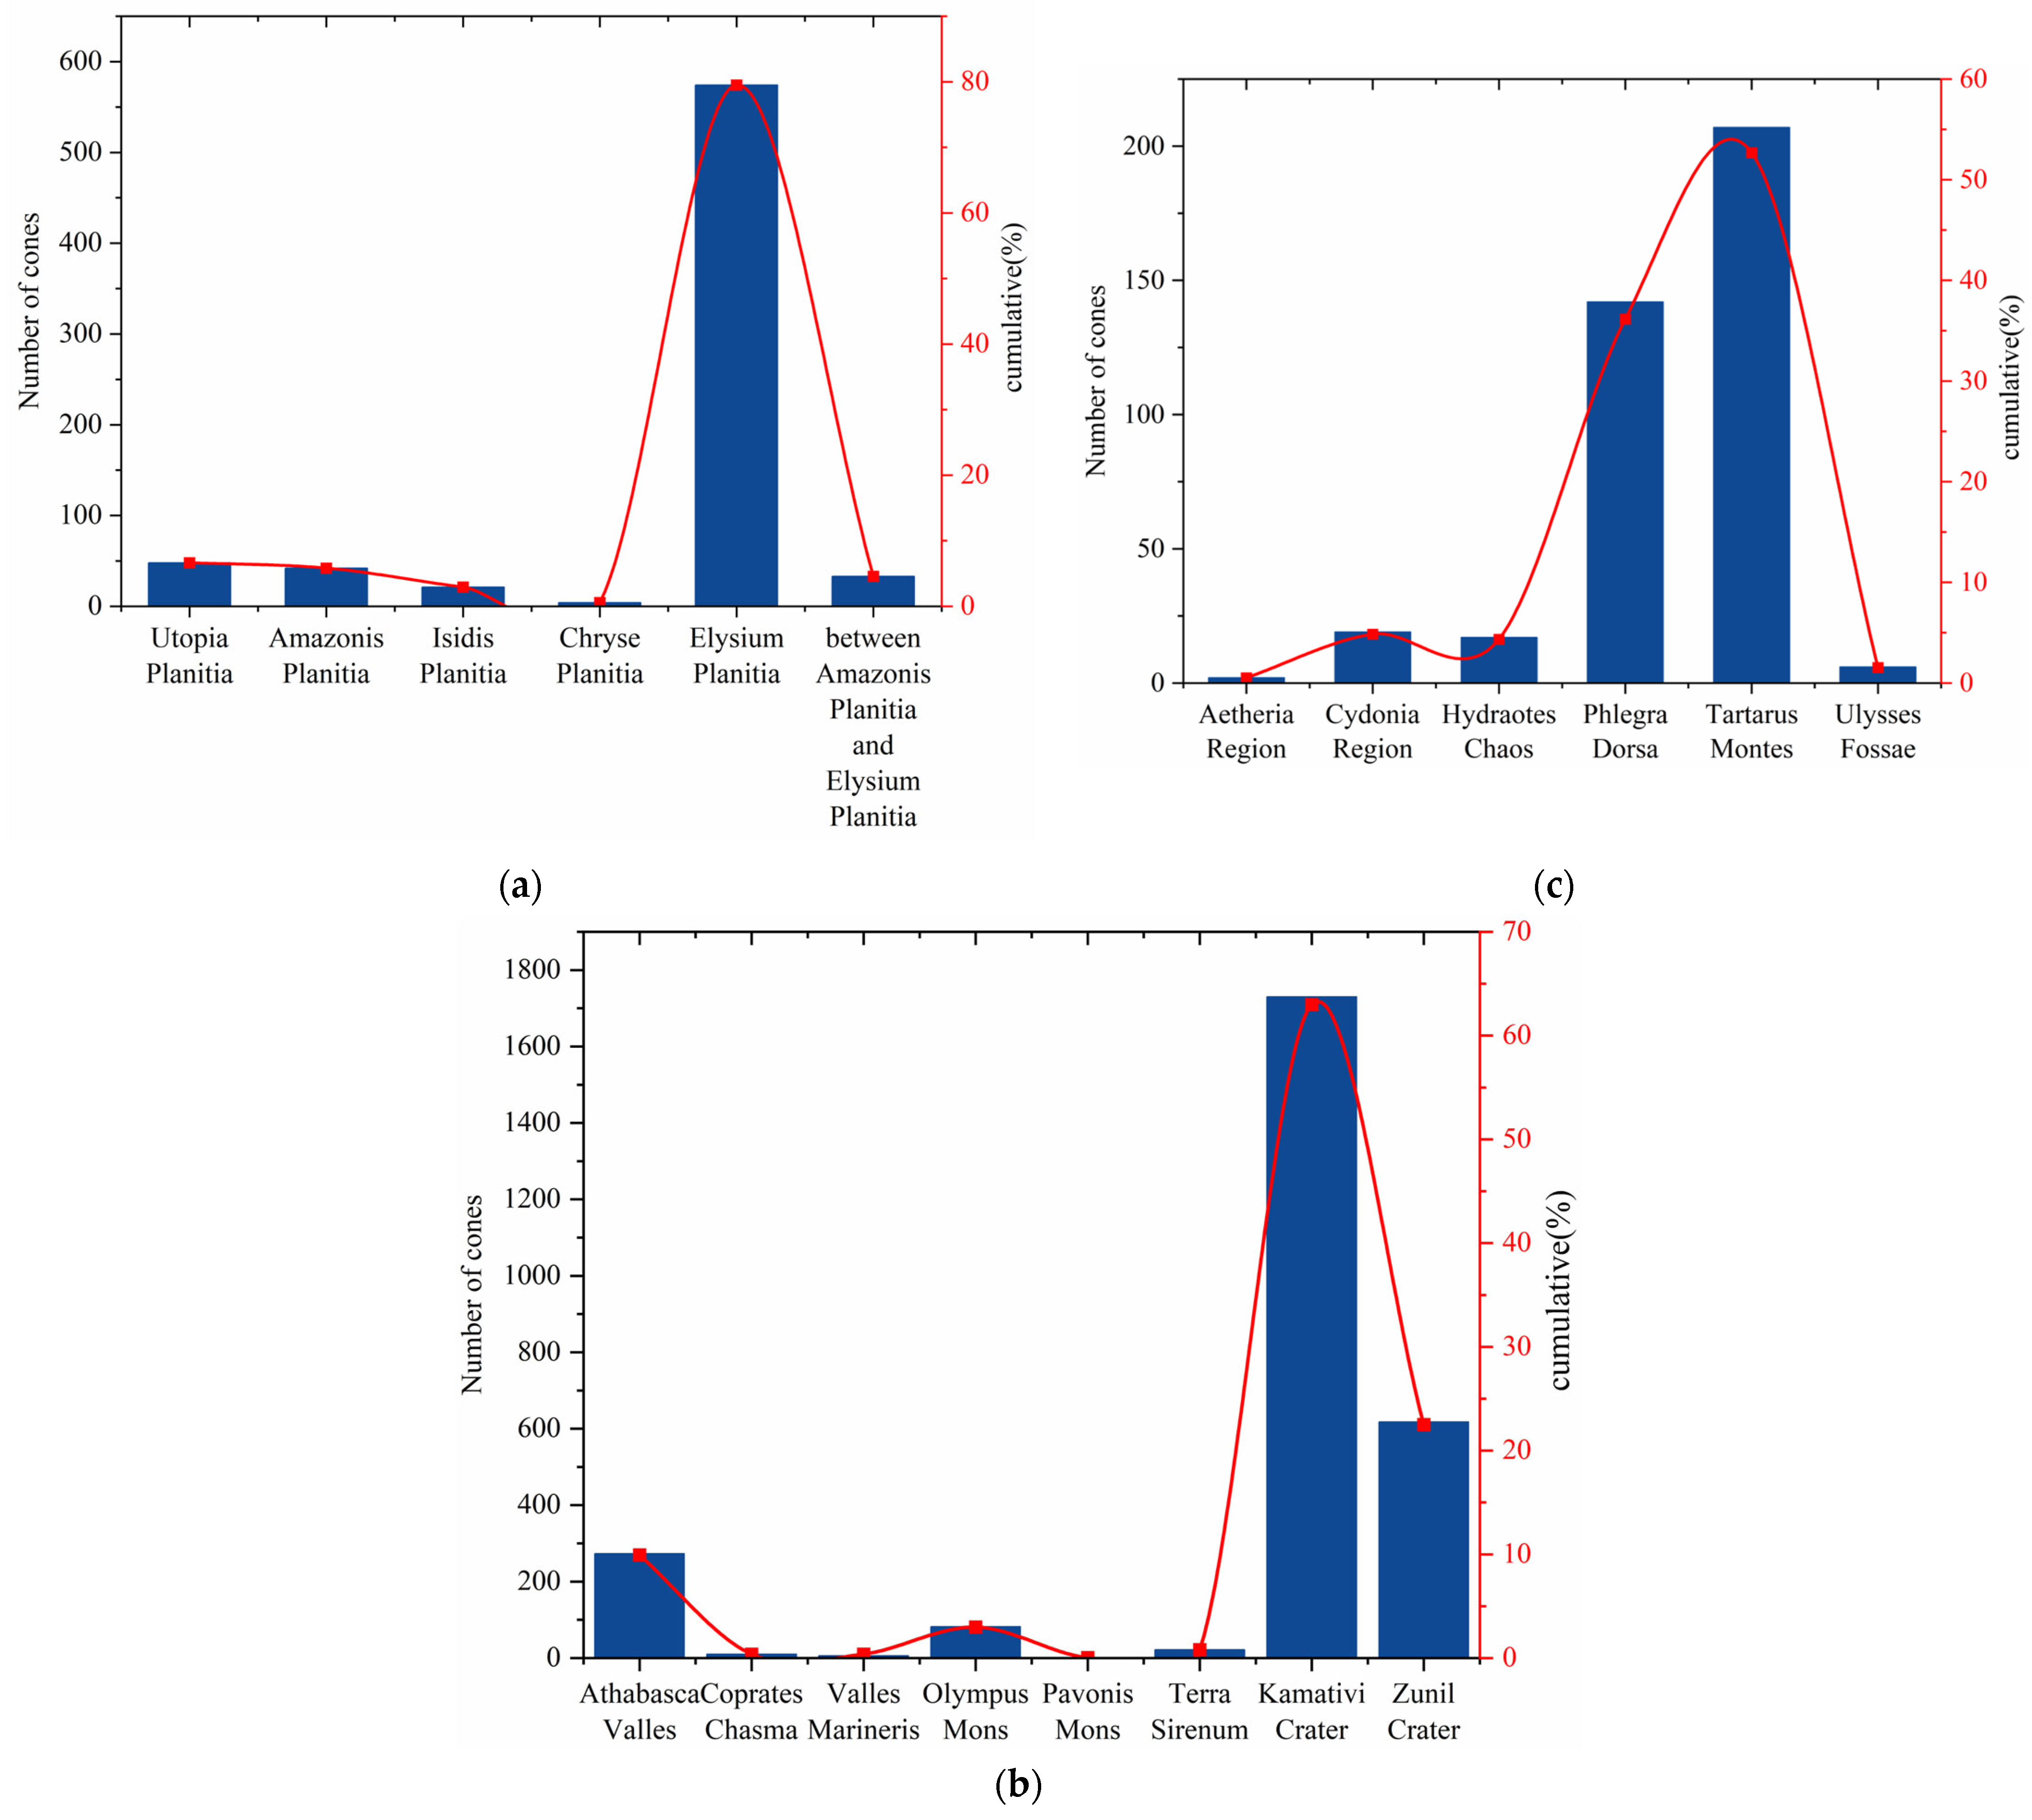
In this subsection, the spatial distribution of Martian cones in the DL-MCD is presented with the acquired spatial location information. In the DL-MCD, the cones were identified across six typical geographical regions on Mars. The distribution regions include (1) plains, such as Utopia Planitia, Amazonis Planitia, Isidis Planitia, Chryse Planitia, Elysium Planitia, and the area between the Amazonis Planitia and Elysium Planitia; (2) valleys and canyons, i.e., Athabasca Valles, Valles Marineris, and Coprates Chasma; (3) the Tharsis volcanic province, i.e., Olympus Mons and Pavonis Mons; (4) the southern highlands of Mars known as Terra Sirenum; (5) the areas near impact craters, such as Kamativi crater and Zunil crater; (6) ridges, i.e., Tartarus Montes; (7) fossae, i.e., Ulysses Fossae; and (8) other regions, i.e., the Aetheria Region, the Cydonia Region, Hydraotes Chaos, and the Phlegra Dorsa Region.
Figure 7 shows the distribution scale of the Martian cones in the DL-MCD. The widely distributed region of the identified cones is the Kamativi crater; nearly half of the cones are located near this area. More than 600 cones are in the region near the Zunil crater. For the plains, nearly 600 cones were identified in the western Elysium Planitia. A total of 273, 207, and 142 cones were located in the Athabasca Valles, Tartarus Montes, and Phlegra Dorsa, respectively. In other regions, there are fewer than 100 identified cones. Among these identified cones, 360 distributed in the western Elysium Planitia, Phlegra Dorsa, Utopia Planitia, Valles Marineris, and Terra Sirenum are not mentioned in the existing literature. The newly identified cones are mainly in the area of the Elysium Planitia and Phlegra Dorsa, where 157 and 142 cones are distributed, respectively.
4.2. Morphological Parameter Analysis
To verify the analysis of the newly identified Martian cones, we compared the three morphometric parameters, i.e., the long basal diameter (Lbd), short basal diameter (Sbd), and basal dip angle (Da), for the cones in the regions that had not been described in the existing literature. The western Elysium Planitia and Phlegra Dorsa are the two regions that have a large number of newly identified cones.
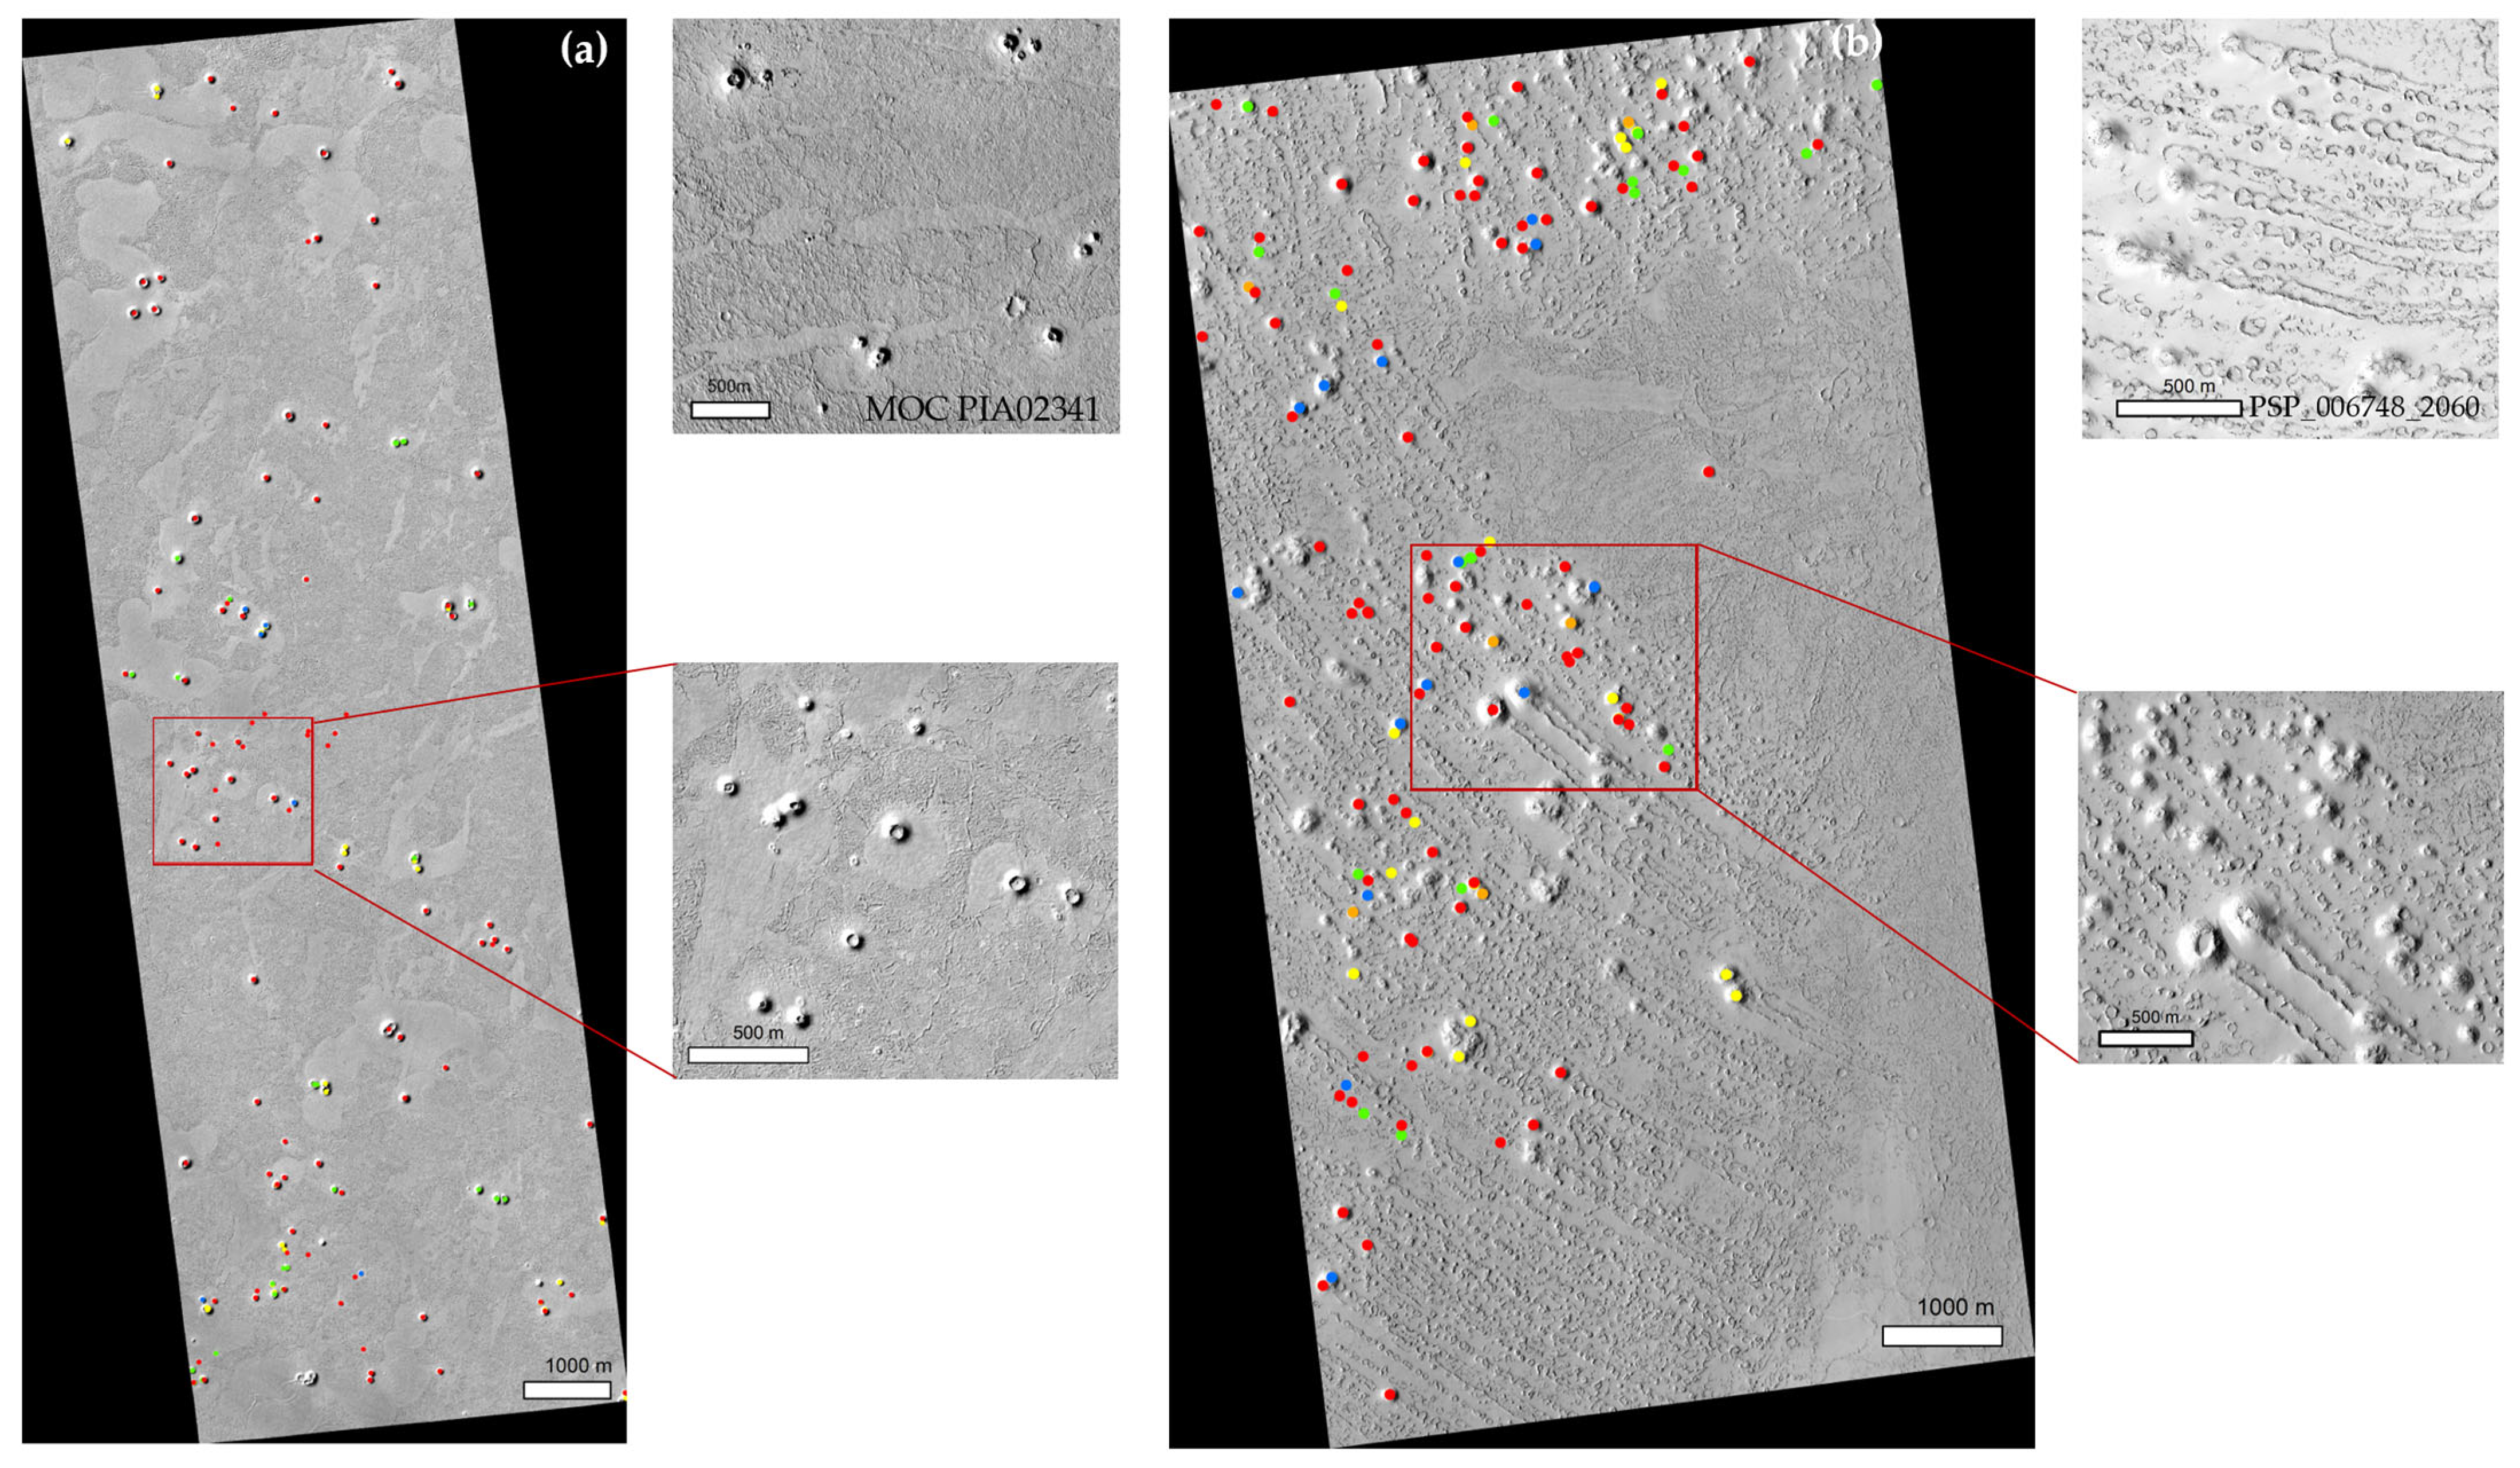
Figure 8 shows the distribution of newly identified cones in western Elysium Planitia and Phlegra Dorsa, also with the analogous cones in the existing literature [14,31]. In the western Elysium Planitia, the 152 newly identified cones are mostly circular with no direction, but elongated, irregular forms are also common. They are of varying sizes, with Lbd and Sbd ranging from 25.55 m to 219.18 m and from 23.27 m to 212.32 m, respectively. The analogous cones are located at Cerberus Palus within Elysium Planitia and determined as pseudocraters on Mars, with basal diameters ranging from 20 m to 300 m [14]. Compared with the middle upper image, the newly identified and analogous cones occur both in isolated clusters or bands of cones and in direct contact with lava flows or lava plains [14]. For the Phlegra Dorsa, the 142 newly identified cones and the analogous cones near the southern margin of Arcadia Planitia in the Tartarus Colles show unique characteristics, i.e., chain structures, and have mainly been interpreted as rootless cones produced by successive explosions as the crust was translating over a fixed steam source where the explosions overlapped [31,33,40]. The identified cones are usually below 120 m in Lbd and Sbd, and the diameter of rings ranges from 40 m to 120 m, similar to those in Ref [33]. Some cones in both Figure 8b and the lower middle of the image are elongated, with the south-east and north–south directions merging into parallel wakes.
4.3. Further Discussion on the Experiments
Due to the complex morphological characteristics of Martian cones and the limited HiRISE images, it is a challenge to identify Martian cone-like features. The DL-MCD is a powerful support for the geological and geomorphic analysis of Mars. However, the spatial distribution shows that the identified cones only account for a very small portion of Mars. Moreover, the small targets, also with a limited number of training samples, degrade the identification results. The identification of cones for expanding the DL-MCD will be a long-term task with the release and collection of HiRISE images.
In addition, the basal diameter and dip angle of the cones have been provided in the DL-MCD based on the cone identification model. There are other morphometric parameters, e.g., crater width and cone height, which are also crucial to studying the features of cones. The elevation data are crucial for the comprehensive analysis of cones, and the generation of elevation data will be investigated in the future. This can further improve the accuracy of cone identification.
5. Conclusions
This study focuses on mapping Martian cones in high-resolution images. To identify cones sufficiently, we collected Martian cones with various morphological characteristics in HiRISE images. Meanwhile, a deep learning-based instance segmentation approach, i.e., the Feature Pyramid Network-equipped Mask R-CNN, was utilized. To identify different scales of the Martian cones efficiently, the network was built by fusing the features extracted by the convolutional network backbone at different levels in a top-down manner. Meanwhile, the Martian cones were detected, and their basal outline was segmented. The cone identification model based on the Feature Pyramid Network-equipped Mask RCNN effectively and accurately detected and segmented conventional and isolated cones, clustered cones, cone chains, double cones, elongated cones, and destroyed or degenerated cones. The detection recall, precision, and segmentation mAR and mAP of the cone identification model were 92.1%, 84.8%, 92.2%, and 84.9%, respectively, and the average run-time was 0.52 s per image. Meanwhile, the morphometric parameters of cones were accurately calculated for building the DL-MCD. Finally, 3861 identified cones in the DL-MCD were analyzed with detailed surveys of the spatial distribution and morphological characteristics. These cones can be used in a comparative study to analyze their possible origin to advance the understanding of Martian geology.
In the future, we will collect more HiRISE images to acquire new cones to overcome the limitations of the deep learning-based instance segmentation approach and refine the cone identification model to obtain other crucial morphometric parameters. Additionally, we plan to study a cone detection model based on transfer learning so that it can recognize new cones in other high-resolution images that lack cone information, e.g., HiRIC images on Tianwen-1.
Supplementary Materials
The following supporting information can be downloaded at: https://www.mdpi.com/article/10.3390/rs16020227/s1; Table S1: locations and morphometric parameters of the 3861 cones identified in this study.
Author Contributions
Conceptualization, C.Y. and H.Z.; methodology, N.Z. and R.G.; software, H.Z. and N.Z.; validation, N.Z. and R.G.; formal analysis, C.Y and N.Z.; investigation, N.Z.; resources, C.Y.; data curation, N.Z.; writing—original draft preparation, C.Y. and H.Z.; writing—review and editing, C.Y. and N.Z.; visualization, N.Z.; supervision, C.Y. and H.Z.; funding acquisition, C.Y. and H.Z. All authors have read and agreed to the published version of the manuscript.
Funding
This research was supported by the “National Natural Science Foundation of China” (grant no. 42272340, 42241163, and 42302265) and “Science-Technology Development Plan Project of Jilin Province of China” (grant no. 20230101311JC).
Data Availability Statement
The HiRISE images used in this paper are available at https://www.uahirise.org/ (accessed on 30 September 2022). Datasets generated or analyzed during this study are available from the corresponding author upon reasonable request.
Conflicts of Interest
The authors declare no conflicts of interest.
References
- Li, C.; Zheng, Y.; Wang, X.; Zhang, J.; Wang, Y.; Chen, L.; Zhang, L.; Zhao, P.; Liu, Y.; Lv, W.; et al. Layered subsurface in Utopia Basin of Mars revealed by Zhurong rover radar. Nature 2022, 610, 308–312. [Google Scholar] [CrossRef] [PubMed]
- Noguchi, R.; Kurita, K. Cones on Mars with Special Reference to Volcanic Cone Morphology. J. Geogr. 2016, 125, 35–48. [Google Scholar] [CrossRef]
- Brož, P.; Čadek, O.; Hauber, E.; Rossi, A.P. Scoria Cones on Mars: Detailed Investigation of Morphometry Based on High-Resolution Digital Elevation Models. J. Geophys. Res. Planets 2015, 120, 1512–1527. [Google Scholar] [CrossRef]
- Meresse, S.; Costard, F.; Mangold, N.; Masson, P.; Neukum, G. Formation and Evolution of the Chaotic Terrains by Subsidence and Magmatism: Hydraotes Chaos, Mars. Icarus 2008, 194, 487–500. [Google Scholar] [CrossRef]
- Noguchi, R.; Kurita, K. Unique Characteristics of Cones in Central Elysium Planitia, Mars. Planet. Space Sci. 2015, 111, 44–54. [Google Scholar] [CrossRef]
- Hamilton, C.W.; Fagents, S.A.; Thordarson, T. Lava–Ground Ice Interactions in Elysium Planitia, Mars: Geomorphological and Geospatial Analysis of the Tartarus Colles Cone Groups. J. Geophys. Res. 2011, 116. [Google Scholar] [CrossRef]
- Brož, P.; Hauber, E. Hydrovolcanic Tuff Rings and Cones as Indicators for Phreatomagmatic Explosive Eruptions on Mars. J. Geophys. Res. Planets 2013, 118, 1656–1675. [Google Scholar] [CrossRef]
- Hemmi, R.; Miyamoto, H. Distribution, Morphology, and Morphometry of Circular Mounds in the Elongated Basin of Northern Terra Sirenum, Mars. Prog. Earth Planet. Sci. 2017, 4, 1–15. [Google Scholar] [CrossRef]
- Komatsu, G.; Okubo, C.H.; Wray, J.J.; Ojha, L.; Cardinale, M.; Murana, A.; Orosei, R.; Chan, M.A.; Ormö, J.; Gallagher, R. Small Edifice Features in Chryse Planitia, Mars: Assessment of a Mud Volcano Hypothesis. Icarus 2016, 268, 56–75. [Google Scholar] [CrossRef]
- Brož, P.; Hauber, E.; van de Burgt, I.; Špillar, V.; Michael, G. Subsurface Sediment Mobilization in the Southern Chryse Planitia on Mars. J. Geophys. Res. Planets 2019, 124, 703–720. [Google Scholar] [CrossRef]
- Ivanov, M.A.; Hiesinger, H.; Erkeling, G.; Reiss, D. Mud Volcanism and Morphology of Impact Craters in Utopia Planitia on Mars: Evidence for the Ancient Ocean. Icarus 2014, 228, 121–140. [Google Scholar] [CrossRef]
- DEPABLO, M.; KOMATSU, G. Possible Pingo Fields in the Utopia Basin, Mars: Geological and Climatical Implications. Icarus 2009, 199, 49–74. [Google Scholar] [CrossRef]
- Dundas, C.M.; McEwen, A.S. An Assessment of Evidence for Pingos on Mars Using HiRISE. Icarus 2010, 205, 244–258. [Google Scholar] [CrossRef]
- Lanz, J.K.; Saric, M.B. Cone Fields in SW Elysium Planitia: Hydrothermal Venting on Mars? J. Geophys. Res. Planets 2009, 114. [Google Scholar] [CrossRef]
- Brož, P.; Bernhardt, H.; Conway, S.J.; Parekh, R. An Overview of Explosive Volcanism on Mars. J. Volcanol. Geotherm. Res. 2021, 409, 107125. [Google Scholar] [CrossRef]
- Brož, P.; Hauber, E. A Unique Volcanic Field in Tharsis, Mars: Pyroclastic Cones as Evidence for Explosive Eruptions. Icarus 2012, 218, 88–99. [Google Scholar] [CrossRef]
- Allen, C.C. Volcano-Ice Interactions on Mars. J. Geophys. Res. Solid Earth 1979, 84, 8048–8059. [Google Scholar] [CrossRef]
- Frey, H.; Lowry, B.L.; Chase, S.A. Pseudocraters on Mars. J. Geophys. Res. Solid Earth 1979, 84, 8075–8086. [Google Scholar] [CrossRef]
- Frey, H.; Jarosewich, M. Subkilometer Martian Volcanoes: Properties and Possible Terrestrial Analogs. J. Geophys. Res. Solid Earth 1982, 87, 9867–9879. [Google Scholar] [CrossRef]
- Farrand, W.H.; Gaddis, L.R.; Keszthelyi, L. Pitted Cones and Domes on Mars: Observations in Acidalia Planitia and Cydonia Mensae Using MOC, THEMIS, and TES Data. J. Geophys. Res. Planets 2005, 110. [Google Scholar] [CrossRef]
- Hauber, E.; Brož, P.; Rossi, A.P.; Michael, G. A Field of Small Pitted Cones on the Floor of Coprates Chasma: Volcanism inside Valles Marineris. In Proceedings of the European Planetary Science Congress 2015, Nantes, France, 27 September–2 October 2015. [Google Scholar]
- Dapremont, A.M.; Wray, J.J. Igneous or Mud Volcanism on Mars? The Case Study of Hephaestus Fossae. J. Geophys. Res. Planets 2021, 126, e2020JE006390. [Google Scholar] [CrossRef]
- Huang, H.; Liu, J.; Wang, X.; Chen, Y.; Zhang, Q.; Liu, D.; Yan, W.; Ren, X. The Analysis of Cones within the Tianwen-1 Landing Area. Remote Sens. 2022, 14, 2590. [Google Scholar] [CrossRef]
- Hamilton, C.W.; Plug, L.J. Identification of Volcanic Rootless Cones and Impact Craters Using Artificial Neural Networks. In Proceedings of the AGU Spring Meeting Abstracts, Montreal, Canada, 17–21 May 2004; p. P33D-09. [Google Scholar]
- Palafox, L.; Alvarez, A.; Hamilton, C. Automated Detection of Impact Craters and Volcanic Rootless Cones in Mars Satellite Imagery Using Convolutional Neural Networks and Support Vector Machines. In Proceedings of the Lunar and Planetary Science Conference, Lunar and Planetary Science Conference, The Woodlands, TX, USA, 16–20 March 2015. [Google Scholar]
- Palafox, L.F.; Hamilton, C.W.; Scheidt, S.P.; Alvarez, A.M. Automated Detection of Geological Landforms on Mars Using Convolutional Neural Networks. Comput. Geosci. 2017, 101, 48–56. [Google Scholar] [CrossRef] [PubMed]
- Pieterek, B.; Grochowski, M.; Ciążela, J.; Sokolov, O.; Józefowicz, M. Automated Detection of Pitted Cones and Impact Craters: Deep-Learning Approach for Searching Potential Hydrothermal Activity and Related Ore Deposits on Mars. LPI Contrib. 2022, 2678, 1328. [Google Scholar]
- Wu, B.; Dong, J.; Wang, Y.; Li, Z.; Chen, Z.; Liu, W.C.; Zhu, J.; Chen, L.; Li, Y.; Rao, W. Characterization of the Candidate Landing Region for Tianwen-1—China’s First Mission to Mars. Earth Space Sci. 2021, 8, e2021EA001670. [Google Scholar] [CrossRef]
- Hamilton, C.W.; Fagents, S.A.; Wilson, L. Explosive Lava-water Interactions in Elysium Planitia, Mars: Geologic and Thermodynamic Constraints on the Formation of the Tartarus Colles Cone Groups. J. Geophys. Res. Planets 2010, 115. [Google Scholar] [CrossRef]
- Dundas, C.M.; Mellon, M.T.; McEwen, A.S.; Lefort, A.; Keszthelyi, L.P.; Thomas, N. HiRISE Observations of Fractured Mounds: Possible Martian Pingos. Geophys. Res. Lett. 2008, 35. [Google Scholar] [CrossRef]
- Keszthelyi, L.P.; Jaeger, W.L.; Dundas, C.M.; Martínez-Alonso, S.; McEwen, A.S.; Milazzo, M.P. Hydrovolcanic Features on Mars: Preliminary Observations from the First Mars Year of HiRISE Imaging. Icarus 2010, 205, 211–229. [Google Scholar] [CrossRef]
- Vörös, F.; Székely, B. Preliminary Geomorphometric Analysis of Selected Martian Scoria Cone-like Features Using High-Resolution DTMs. Abstr. ICA 2021, 3, 1–2. [Google Scholar] [CrossRef]
- Németh, K. Rootless Cone/Vent. In Encyclopedia of Planetary Landforms; Springer Science + Business Media: New York, NY, USA, 2015; pp. 1829–1834. [Google Scholar]
- He, K.; Gkioxari, G.; Dollar, P.; Girshick, R. Mask R-CNN. IEEE Trans. Pattern Anal. Mach. Intell. 2020, 386–397. [Google Scholar] [CrossRef]
- Ren, S.; He, K.; Girshick, R.; Sun, J. Faster R-CNN: Towards Real-Time Object Detection with Region Proposal Networks. IEEE Trans. Pattern Anal. Mach. Intell. 2017, 1137–1149. [Google Scholar] [CrossRef] [PubMed]
- Lin, T.-Y.; Dollár, P.; Girshick, R.; He, K.; Hariharan, B.; Belongie, S. Feature Pyramid Networks for Object Detection. In Proceedings of the IEEE Conference on Computer Vision and Pattern Recognition (CVPR), Honolulu, HI, USA, 21–26 July 2017; pp. 936–944. [Google Scholar]
- He, K.; Zhang, X.; Ren, S.; Sun, J. Deep Residual Learning for Image Recognition. In Proceedings of the IEEE Conference on Computer Vision and Pattern Recognition (CVPR), Las Vegas, NV, USA, 27–30 June 2016; pp. 770–778. [Google Scholar]
- Shelhamer, E.; Long, J.; Darrell, T. Fully Convolutional Networks for Semantic Segmentation. IEEE Trans. Pattern Anal. Mach. Intell. 2017, 39, 640–651. [Google Scholar] [CrossRef] [PubMed]
- Deng, J.; Dong, W.; Socher, R.; Li, L.-J.; Li, K.; Fei-Fei, L. ImageNet: A Large-Scale Hierarchical Image Database. In Proceedings of the IEEE Conference on Computer Vision and Pattern Recognition, Miami, FL, USA, 20–25 June 2009; pp. 248–255. [Google Scholar]
- Jaeger, W.L.; Keszthelyi, L.; Galuszka, D.; Kirk, R.L.; Team, H. Morphologic Characteristics and Global Distribution of Phreato-Volcanic Constructs on Mars as Seen by HiRISE. In Proceedings of the 39th Annual Lunar and Planetary Science Conference, League City, TX, USA, 10–14 March 2008; Volume 1391, p. 2428. [Google Scholar]
- McEwen, A.S.; Eliason, E.M.; Bergstrom, J.W.; Bridges, N.T.; Hansen, C.J.; Delamere, W.A.; Grant, J.A.; Gulick, V.C.; Herkenhoff, K.E.; Keszthelyi, L.; et al. Mars Reconnaissance Orbiter’s High Resolution Imaging Science Experiment (HiRISE). J. Geophys. Res. Planets 2007, 112. [Google Scholar] [CrossRef]
Figure 1.
Cones in the HiRISE images. (a) A conventional and isolated cone; (b) clustered cones; (c) a cone chain; (d) double cones; (e) an elongated cone; and (f) a destroyed or degenerated cone.
Figure 1.
Cones in the HiRISE images. (a) A conventional and isolated cone; (b) clustered cones; (c) a cone chain; (d) double cones; (e) an elongated cone; and (f) a destroyed or degenerated cone.

Figure 2.
Overall framework of the Feature Pyramid Network-equipped Mask R-CNN.

Figure 3.
Visualization results of the Martian cones with deep learning-based instance segmentation in the HiRISE images. (a) A conventional and isolated cone; (b) clustered cones; (c) a cone chain; (d) double cones; (e) an elongated cone; and (f) a destroyed or degenerated cone. The red squares show the detected cones, and the white outlines show the edges of segmented cones. The colors of the cones are used to distinguish different ones.

Figure 4.
Undetected and newly detected Martian cones in the testing data. (a) Double cones; (b) destroyed or degenerated cones; (c) clustered cones; (d) flat isolated cones; and (e) densely adjacent cones. The left images show the labeled cones, in which the red squares and white outlines represent the labeled cones. The right images are the identified cones, the red squares show the detected cones, and the white outlines show the edges of segmented cones. In the identified cone images, the blue squares represent the individual undetected cones, and the green squares represent the newly detected cones. The colors of the cones are used for distinction.

Figure 5.
The diagram of the given geometry of the Martian cones. (a) Example of a cone in HiRISE image; (b) identification image of the cone; and (c) schematic diagram of the cone width parameters (Lbd and Sbd) and dip angle of the cone (Da).
Figure 5.
The diagram of the given geometry of the Martian cones. (a) Example of a cone in HiRISE image; (b) identification image of the cone; and (c) schematic diagram of the cone width parameters (Lbd and Sbd) and dip angle of the cone (Da).

Figure 6.
Frequency histograms and cumulative percentages of (a) cone long basal diameter (Lbd), (b) cone short basal diameter (Sbd), (c) cone flatness (Lbd/Sbd), and (d) cone distributed direction with Da (north–south: 67.5~90° and −90~−67.5°; east–west: −22.5~22.5°; northeast: 22.5~65.5°; and south-east: −22.5~−65.5°). Please note that cones with Lbd/Sbd > 1.1 were considered.

Figure 7.
The distribution scale of the Martian cones in the DL-MCD. (a) Plains, (b) valleys and canyons, Tharsis volcanic province, and the areas near impact craters. (c) The southern highlands, ridges, fossae, and other regions.
Figure 7.
The distribution scale of the Martian cones in the DL-MCD. (a) Plains, (b) valleys and canyons, Tharsis volcanic province, and the areas near impact craters. (c) The southern highlands, ridges, fossae, and other regions.

Figure 8.
The distribution of newly identified cones and analogous cones in (a) western Elysium Planitia (ESP_035521_1825, Lat: 2.4° Long: 146.8°) and Cerberus Palus within Elysium Planitia (MOC PIA02341) [14], (b) Phlegra Dorsa (ESP_018457_2065, Lat: 26.3° Long: 173.6°), and near the southern margin of Arcadia Planitia in the Tartarus Colles (PSP_006748_2060) [31] and of newly identified cones with Da information (red: no direction; blue: south-east; green: north–south; yellow: east–west; and orange: north-east).


Table 1.
Results of the proposed cone identification model and the other mainstream methods.
| Object Detection | Object Segmentation | Time (s) | ||
|---|---|---|---|---|
| Recall (%) | Precision (%) | mAR (%) | mAP (%) | 0.52 |
| 92.1 | 84.8 | 92.2 | 84.9 | |
Disclaimer/Publisher’s Note: The statements, opinions and data contained in all publications are solely those of the individual author(s) and contributor(s) and not of MDPI and/or the editor(s). MDPI and/or the editor(s) disclaim responsibility for any injury to people or property resulting from any ideas, methods, instructions or products referred to in the content. |
© 2024 by the authors. Licensee MDPI, Basel, Switzerland. This article is an open access article distributed under the terms and conditions of the Creative Commons Attribution (CC BY) license (https://creativecommons.org/licenses/by/4.0/).
Share and Cite
MDPI and ACS Style
Yang, C.; Zhang, N.; Guan, R.; Zhao, H. Mapping Cones on Mars in High-Resolution Planetary Images with Deep Learning-Based Instance Segmentation. Remote Sens. 2024, 16, 227. https://doi.org/10.3390/rs16020227
AMA Style
Yang C, Zhang N, Guan R, Zhao H. Mapping Cones on Mars in High-Resolution Planetary Images with Deep Learning-Based Instance Segmentation. Remote Sensing. 2024; 16(2):227. https://doi.org/10.3390/rs16020227
Chicago/Turabian StyleYang, Chen, Nan Zhang, Renchu Guan, and Haishi Zhao. 2024. "Mapping Cones on Mars in High-Resolution Planetary Images with Deep Learning-Based Instance Segmentation" Remote Sensing 16, no. 2: 227. https://doi.org/10.3390/rs16020227
Note that from the first issue of 2016, this journal uses article numbers instead of page numbers. See further details here.