
Influence of South-to-North Water Diversion on Land Subsidence in North China Plain Revealed by Using Geodetic Measurements

1
School of Geography and Information Engineering, China University of Geosciences, Wuhan 430074, China
2
State Key Laboratory of Geodesy and Earth’s Dynamics, Innovation Academy for Precision Measurement Science and Technology, Chinese Academy of Sciences, Wuhan 430077, China
*
Author to whom correspondence should be addressed.
Remote Sens. 2024, 16(1), 162; https://doi.org/10.3390/rs16010162
Submission received: 4 December 2023
/
Revised: 26 December 2023
/
Accepted: 28 December 2023
/
Published: 30 December 2023
(This article belongs to the Special Issue Analysis of Groundwater and Total Water Storage Changes Using GRACE Observations II)
Abstract
:As a major grain-producing region in China, the North China Plain (NCP) faces serious challenges such as water shortage and land subsidence. In late 2014, the Central Route of the South-to-North Water Diversion Project (SNWD-C) began to provide NCP with water resources. However, the effectiveness of this supply in mitigating land subsidence remains a pivotal and yet unassessed aspect. In this paper, we utilized various geodetic datasets, including the Gravity Recovery and Climate Experiment (GRACE) and GRACE Follow On (GRACE-FO), Global Navigation Satellite System (GNSS) and leveling data, to conduct a spatial-temporal analysis of the equivalent water height (EWH) and vertical ground movement in the NCP. The results reveal a noteworthy decline in EWH from 2011 to 2015, followed by a slight increase with minor fluctuations from 2015 to 2020, demonstrating a strong correlation with the water resources supplied by the SNWD-C. The GRACE-derived surface deformation rate induced by hydrological loading is estimated to be <1 mm/yr. In comparison, GNSS-derived vertical ground movements exhibit considerable regional differences during the 2011–2020 period. Substantial surface subsidence is evident in the central and eastern NCP, contrasting with a gradual uplift in the front plain of the Taihang Mountains. Three-stage leveling results indicate that the rate of subsidence in the central and eastern plains is gradually increasing with the depression area expanding from 1960 to 2010. Based on these geodetic results, it can be inferred that the SNWD-C’s operation since 2014 has effectively mitigated the reduction in terrestrial water storage in the NCP. However, land subsidence in the NCP persists, as the subsidence rate does not turn around in sync with the change in EWH following the operation of SNWD-C. Consequently, it’s necessary to maintain and enforce existing policies, including controlling groundwater exploitation and water resources supply (e.g., SNWD-C) to curtail the exacerbation of land subsidence in the NCP. Additionally, continuous monitoring of land subsidence by GRACE, GNSS, leveling and other geodetic techniques is crucial to enable timely policy adjustments based on monitoring results.
1. Introduction
Over the past half century, the North China Plain (NCP) has undergone remarkable industrial, agricultural, and economic growth, leading it to become one of the most water-scarce areas in China [1,2]. The overexploitation of groundwater has resulted in the NCP experiencing some of the most pronounced surface deformations worldwide due to mass redistribution [3,4,5,6]. In response, the Central Route of the South-to-North Water Diversion Project (SNWD-C) began operation at the end of 2014, aiming to alleviate the severe water resource shortage in the NCP by diverting water from the Danjiangkou Reservoir [7,8]. However, critical questions remain unanswered: what’s the spatial-temporal characteristics of the vertical land motion in the NCP? What’s the influence of SNWD-C on the land motion? Does the water supply from the SNWD-C effectively mitigate land subsidence? These issues are crucial and demand to be evaluated.
In recent decades, tremendous advancements in geodetic technologies, such as Global Navigation Satellite System (GNSS), Interferometric Synthetic Aperture Radar (InSAR), and Gravity Recovery and Climate Experiment (GRACE), have enabled them provide high-precision, sustainable, and large-scale surface observations and thus they are widely used in geoscience and hydrology [9,10,11]. Together with hydrological models, well data, geodetic data are utilized to explore the feature of groundwater deficit in the NCP [12,13]. Groundwater level measurements from the 1960s show excessive groundwater exploitation, with varying depths of groundwater extraction in different regions [5]. GRACE and well data during the 2003–2010 period in the NCP present a decline trend of 2.2 ± 0.3 cm/yr and 2.0–2.8 cm/yr, respectively [14]. The accuracy and reliability of the equivalent water height (EWH) calculated by GRACE are verified, demonstrating that the groundwater is still being consumed after 2000 [12]. Consumption and variation characteristics of groundwater reserves are further determined based on GRACE data, revealing that the piedmont plain of the NCP primarily consumes shallow aquifers, while the central plain primarily consumes deep aquifers, with the groundwater consumption rate of the piedmont being much higher than that in the central and eastern plains [15]. In the late 2014, SNWD-C began to provide large water resource for NCP, leading to the reduced groundwater exploitation in the central and eastern plains, but severe land subsidence still persists [16,17,18]. By using InSAR observations during the 2016–2018 periods, the land subsidence is observed to be prevalent in most of the NCP, with a maximum subsidence rate of 16.54 cm/yr and regional disparities in subsidence rates [19]. In order to assess the impact of SNWD-C on land subsidence in the NCP, it is highly necessary to analyze the spatial-temporal characteristics of the land subsidence before and after SNWD-C’s operation in 2014. However, previous studies have not provided comprehensive historical data to conduct such research.
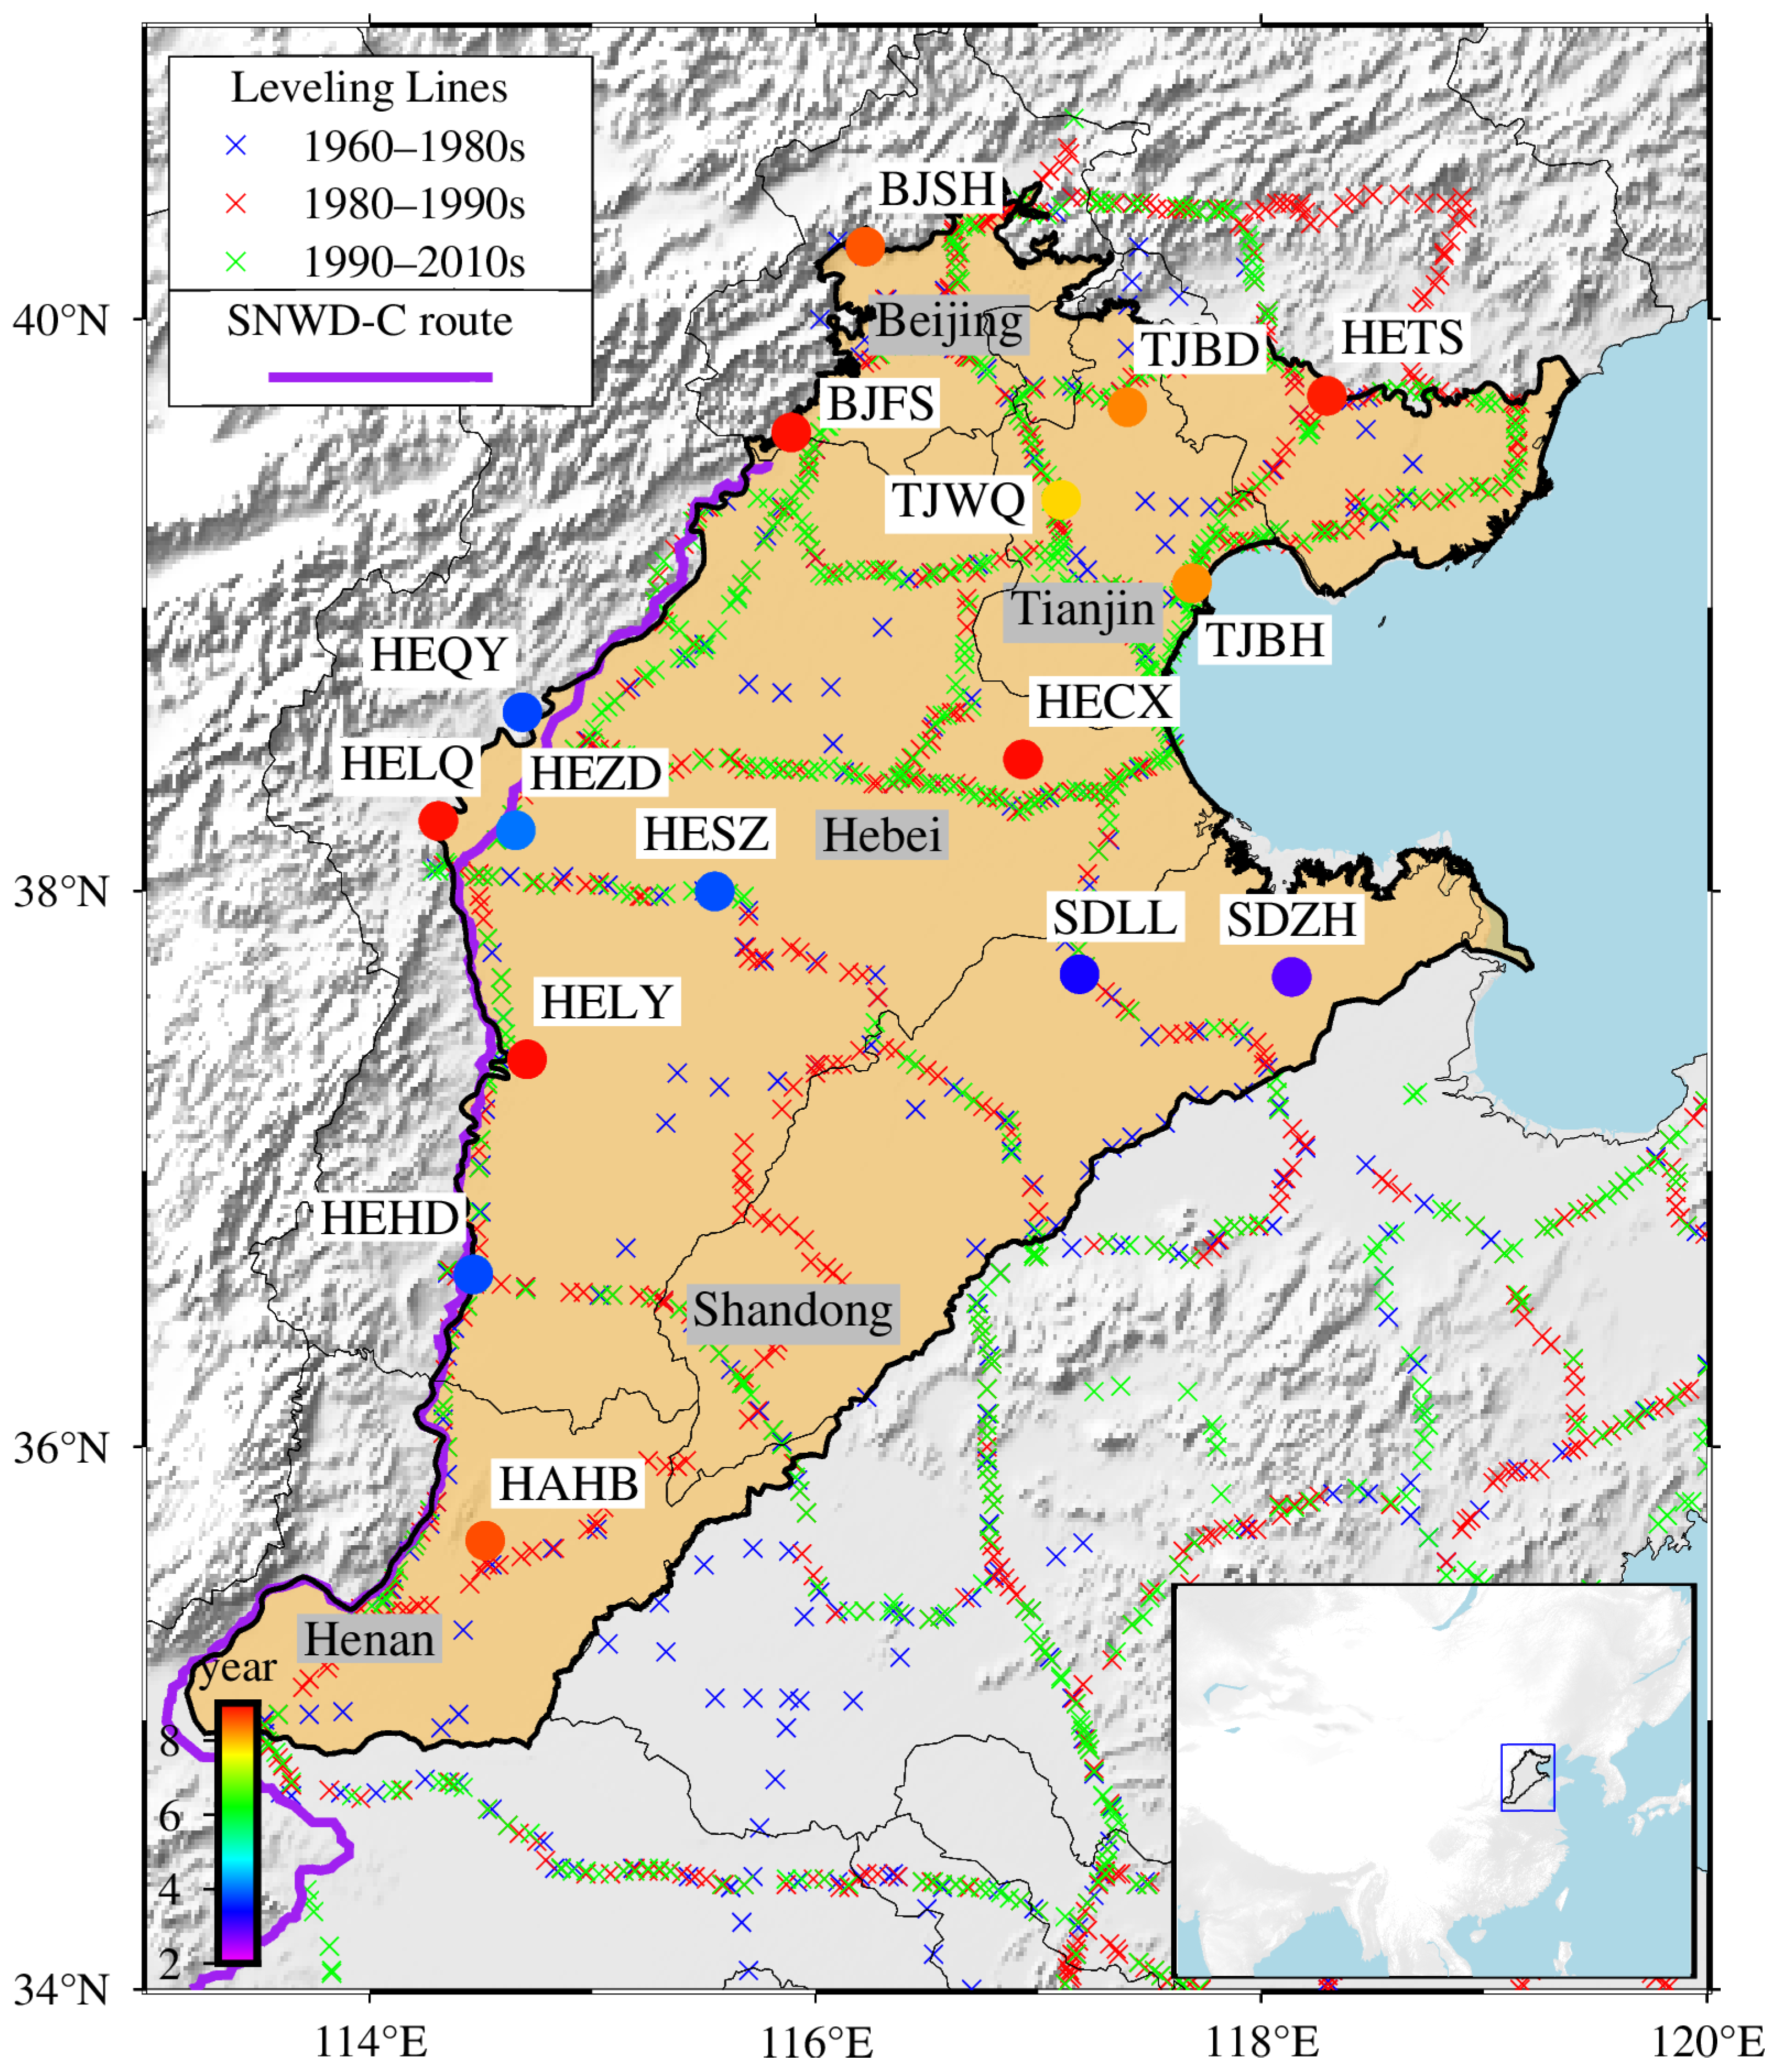
In this study, we employ a combination of GRACE data and GNSS data with relatively a long period spanning from 2011 to 2020 to investigate the changes of terrestrial water storage (TWS), surface response induced by hydrological loading, and land subsidence characteristics in the NCP, with the incorporation of leveling results from 1960 to 2010 (Figure 1). Furthermore, we analyze the impact of the SNWD-C on the changes of TWS and land subsidence and discuss the question whether the operation of SNWD-C has effectively mitigated the land subsidence in the NCP.
2. Data and Methods
As the land motion caused by the change of TWS can be accurately monitored by geodetic technologies, including GNSS, GRACE and leveling, these geodetic data are accumulated and processed to provide a data basis for comprehensively analyzing the vertical land motion. Therefore, we use the GNSS and GRACE data collected in the NCP during the past decade to extract the spatial-temporal characteristics of the vertical land motion in the NCP and analyze its variation in the last half century with leveling results during the 1960–2010 period.
2.1. GNSS and Data Processing
In the NCP, there are 16 GNSS continuously operating reference stations available (shown in Figure 1) to produce the time series of daily solutions during the 2011–2020 period. The average length of observation periods is 6.7 years. We adopt the commonly used processing strategy to process the GNSS data. Based on the precise orbit and clock products provided by International GNSS service (IGS), the GAMIT/GLOBK 10.40 software is used to process the observation data by following the strategy of Wang & Shen [20], and finally the GNSS daily solution coordinate time series is obtained for each station. In the calculation process, the IERS03 model and the FES2004 model are used to correct the solid tide, polar tide, and the ocean tide, respectively [21]. The tropospheric delay is corrected by the tropospheric mapping function VMF [22]. The surface response time series generated with the atmosphere and the non-tidal ocean released by GFZ [23] are deducted from GNSS time series. Then, the function model as Equation (1) is used to solve the parameters such as long-term motion, periodic motion and step parameters in the time series based on the least square fitting method [24].
Among them, y(t) is the GNSS vertical time series, t is the observation epoch, a is the constant term, b is the annual average vertical velocity, c, d and e, f are the annual and the semi-annual term coefficients, respectively, is the step coordinate mutation caused by the replacement of the antenna or the coseismic deformation, represents the epoch of step, H is the Heaviside step function with H being 0 before the mutation or 1 after the mutation, and ε is the noise. Previously studies show that it is too optimistic to estimate the deformation rate with its value biased and its error underestimated if the error is assumed to be ‘white noise’ only [25]. Thus, in this study, noise models such as ‘white noise’ model, ‘white noise + flicker noise’ model and ‘white noise + power-law noise’ model, are used to estimate the parameters, respectively, and the optimal noise model is selected according to the Bayesian information criterion. Finally, the ‘white noise + flicker noise’ model is selected as the optimal noise model to estimate the annual average vertical velocity and its uncertainty for each station.
2.2. GRACE and Data Processing
Due to the elasticity of the Earth’s solid structure, the surface undergoes deformation as a result of the redistribution of mass loading [26,27,28]. GRACE satellite can accurately monitor the gravity field change information of the earth, and the data is widely used to estimate the real surface response caused by hydrological loading. EWH is commonly calculated to estimate the TWS within a region, assuming that the TWS is the product of the EWH and area of the region. And the change of EWH reflects the change of TWS. We used the monthly Release 06 GRACE solutions provided by the Center for Space Research (CSR). The solutions were expressed in the form of spherical harmonics (SH) coefficients truncated to degree and order 60. During the data processing, the degree 2 order 0 (C20) coefficients in the GRACE data were replaced by estimates obtained from satellite laser ranging [29]. The observation period of GRACE data is from January 2010 to June 2017 and the observation period of GRACE-FO data is from June 2018 to December 2019. Monthly geocenter estimates calculated by Swenson et al. [30] were used to account for the degree 1 coefficients of the gravity field, which GRACE does not observe. The influence of tides such as ocean tides, solid tides and solid polar tides, atmosphere and glacial isostatic adjustment (GIA) was deducted from GRACE data. Gaussian smoothing with a radius of 350 km and a decorrelation filter (order 6, polynomial order 4) are used to reduce high frequency noise and north–south stripes [31]. GRACE data was used to calculate the EWH change as follows [32]:
where, and are the average density of the earth and the water, respectively, a is the average radius of the earth. θ and φ are the colatitude and longitude, respectively. is the fully normalized Legendre function of degree n and order m, and are spherical harmonic coefficients of the geoid change. is the Love number relative to the center of mass of the solid Earth, perpendicular to the direction of tidal forces.
The vertical deformation due to hydrological loading changes can be calculated using GRACE as follows [33]:
where is the Love number in the radial direction relative to the center of mass of the solid Earth.
2.3. Leveling and Data Processing
The leveling started early in the NCP, and was measured during the 1960–1980, 1980–1990, and 1990–2010 three periods. Thus, we used these data to explore the spatial-temporal characteristics of vertical land motion in the past half century. The distribution of the leveling lines is illustrated in Figure 1. The average distance between successive benchmarks of the network is less than 4 km, and benchmarks integrated into the bedrock are positioned approximately 400 km apart along the leveling lines. In order to suppress the influence of leveling errors, the orthometric correction in height differences were applied to eliminate the influence of the non-parallel equipotential surface with the field gravity data. According to the precise leveling specifications outlined by the Standardization Administration of the People’s Republic of China in 2006 [34], it is noteworthy that distinct tolerances are specified for the root mean square of discrepancies in bidirectional leveling, labeled as in Equation (4), and for the leveling error per kilometer, denoted as in Equation (5). The variability of these tolerances depends on the specific classification of the leveling survey. For first-order leveling surveys, the prescribed tolerances for and are 0.45 mm and 1.0 mm, respectively. In contrast, second-order leveling surveys allow 1.0 mm for and 2.0 mm for . The results of multi-stage leveling are derived from the study of Su et al. [35], where an elaborate processing strategy is comprehensively detailed.
where represents the misclosure of the ith segment in bidirectional leveling surveys, denotes the length of the ith segment, and n signifies the total number of leveling segments.
where is the ith leveling loop misclosure, is the ith leveling loop length, N is the number of the leveling loop.
3. Results
3.1. Spatio-Temporal Characteristics of Changes of Terrestrial Water Storage
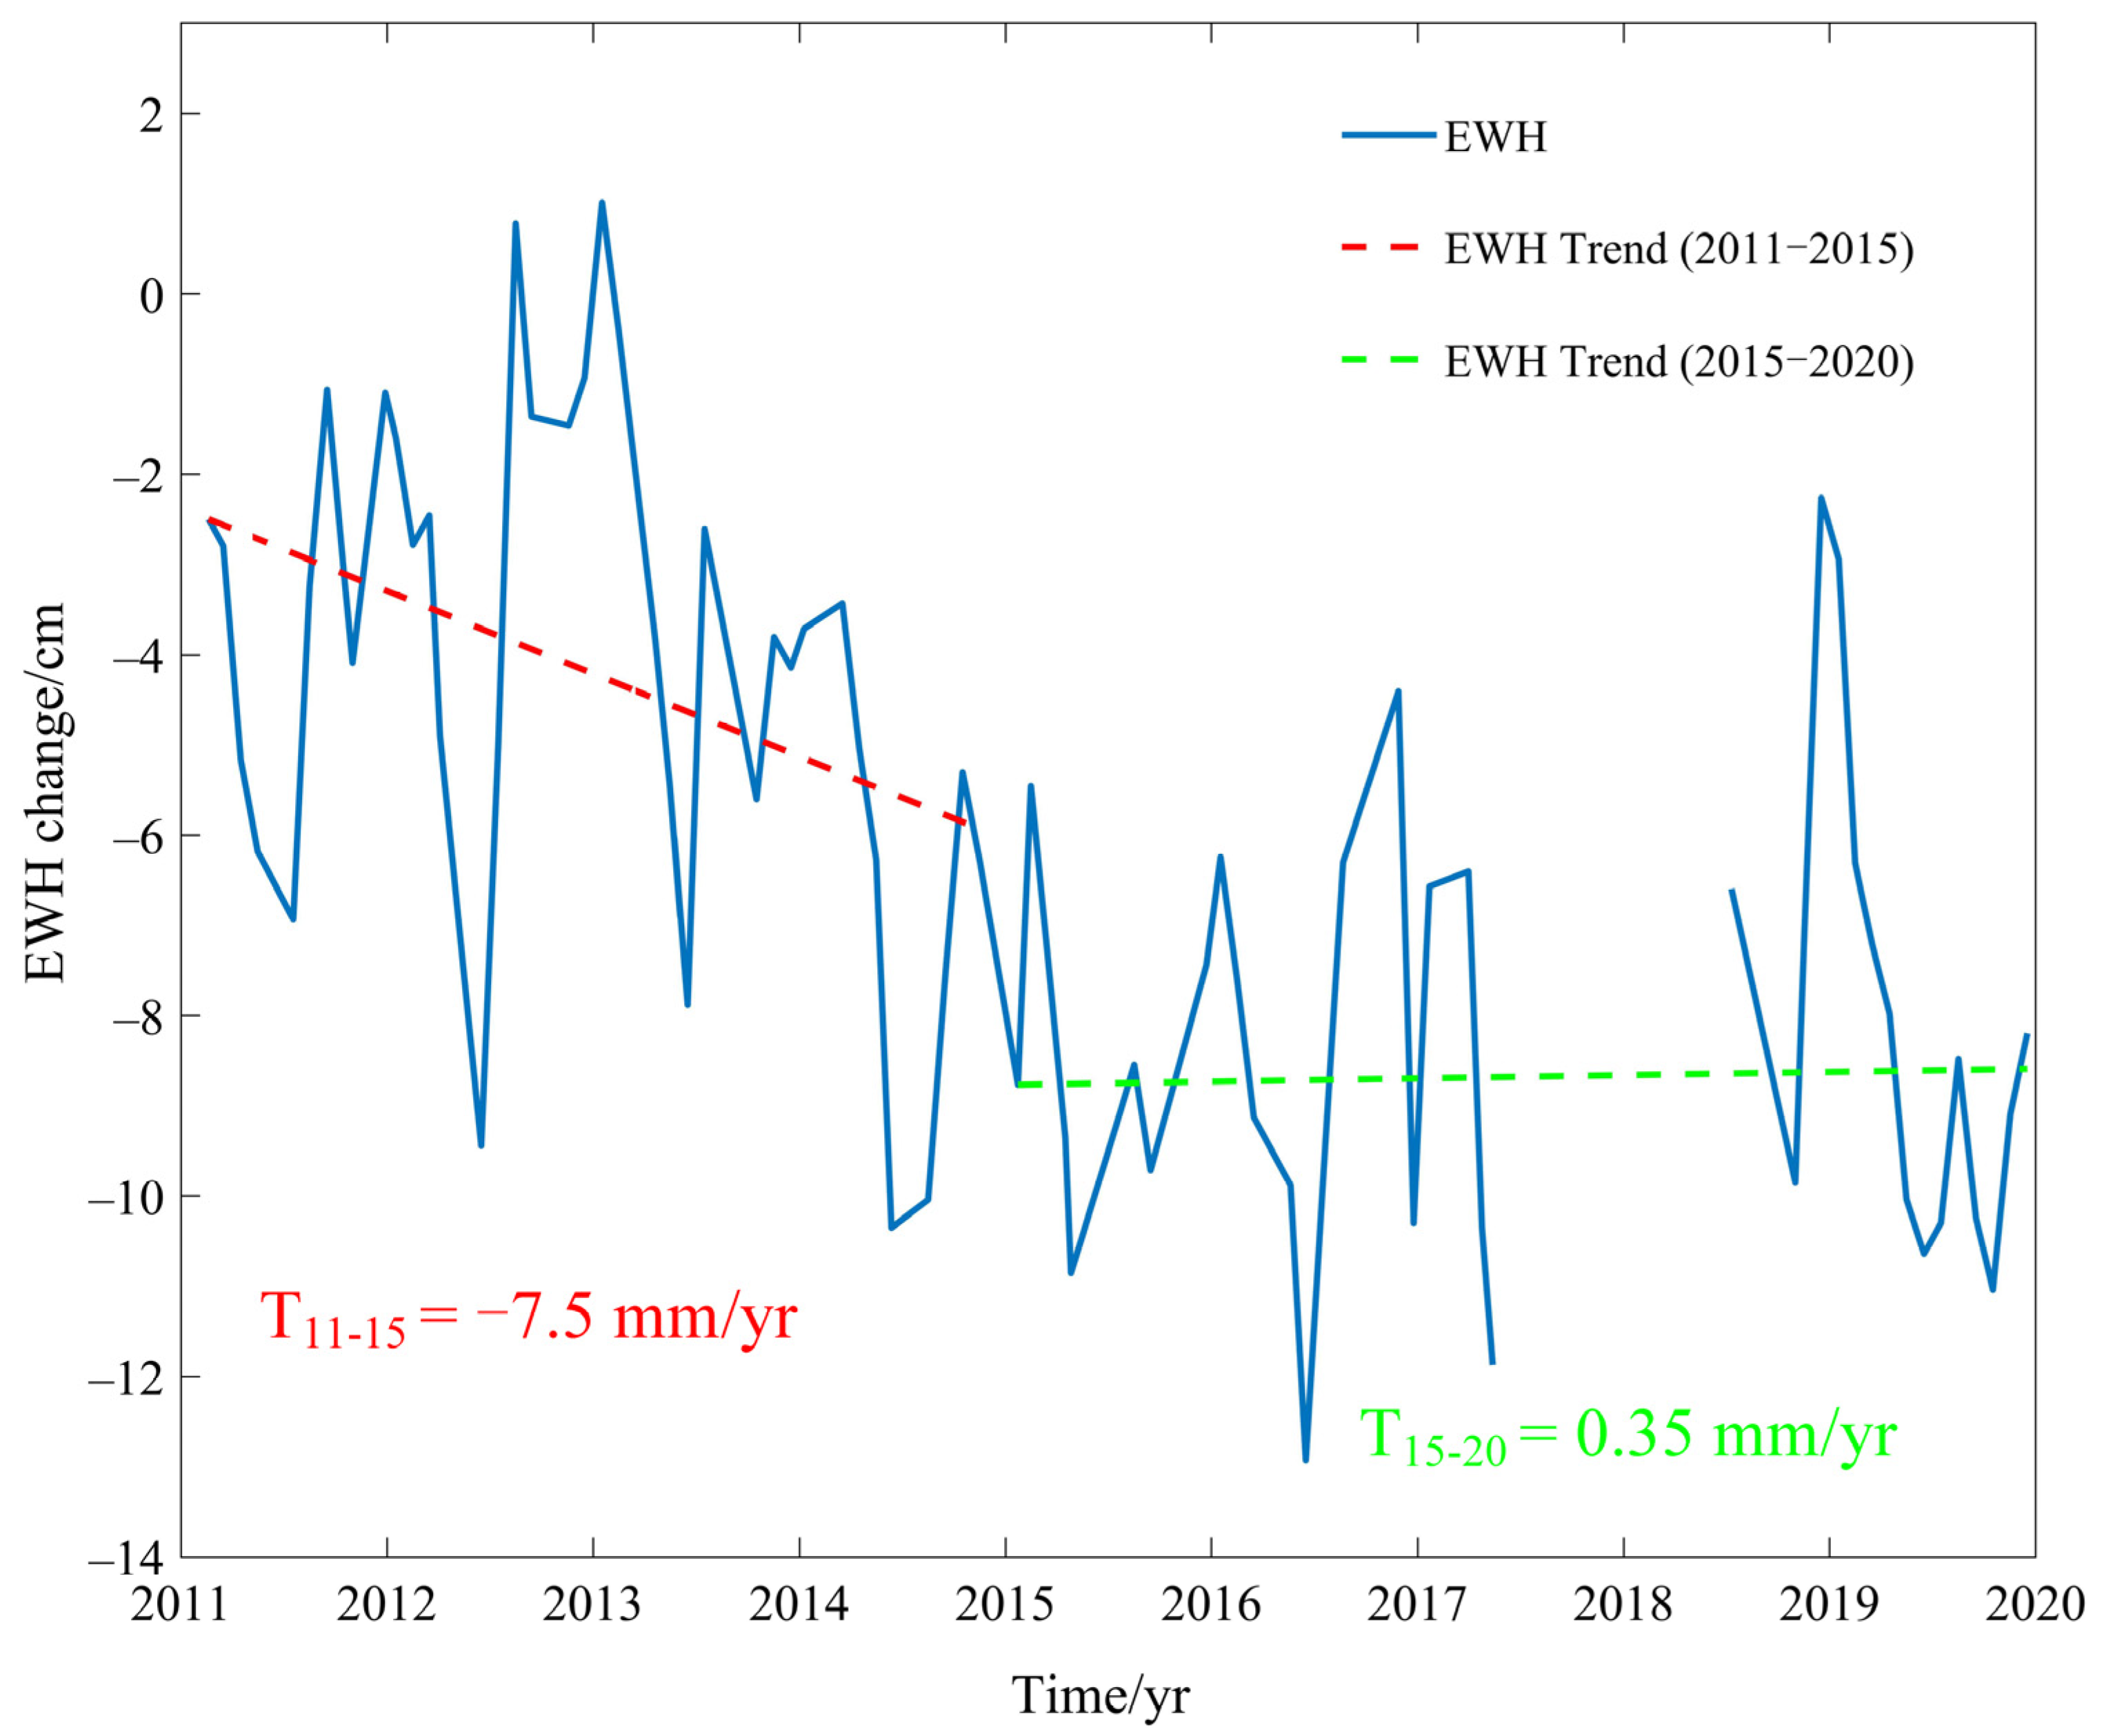
The mean EWH variation time series, derived from the GRACE and GRACE-FO data in the NCP, is depicted in Figure 2. The time series of EWH distinctively exhibits an annual cyclic pattern, consistently reaching a trough around the mid-year and a peak at the beginning or end of the year. Analyzing the EWH trend reveals a distinct water storage deficit within the NCP, with the rate of −7.5 mm/yr from 2011 to 2015. However, the deficit in water storage has been significantly mitigated from 2015 to 2020, with the rate changing to 0.35 mm/yr. Considering the operation of SNWD-C at the end of 2014, it can be inferred that the water storage is mainly affected by the SNWD-C with its water supply to the NCP, resulting in water storage slightly increased. The earlier water storage deficit trend is consistent the result from GRACE data during the 2003–2012 period but differs in magnitude for the deficit rate of −1.23 cm/yr [17]. The rate of descent has been slowed down, suggesting a recent reduction in terrestrial water loss. Before the SNWD-C, the long-term EWH trend showed a certain decline, with the maximum of trend not exceeding 15 mm/yr in the NCP. Comparing rate variations before and after the operation of the SNWD-C, it indicates a significant mitigation in the loss of TWS, implying that supplemental water can effectively meet the overall consumption needs of the region.
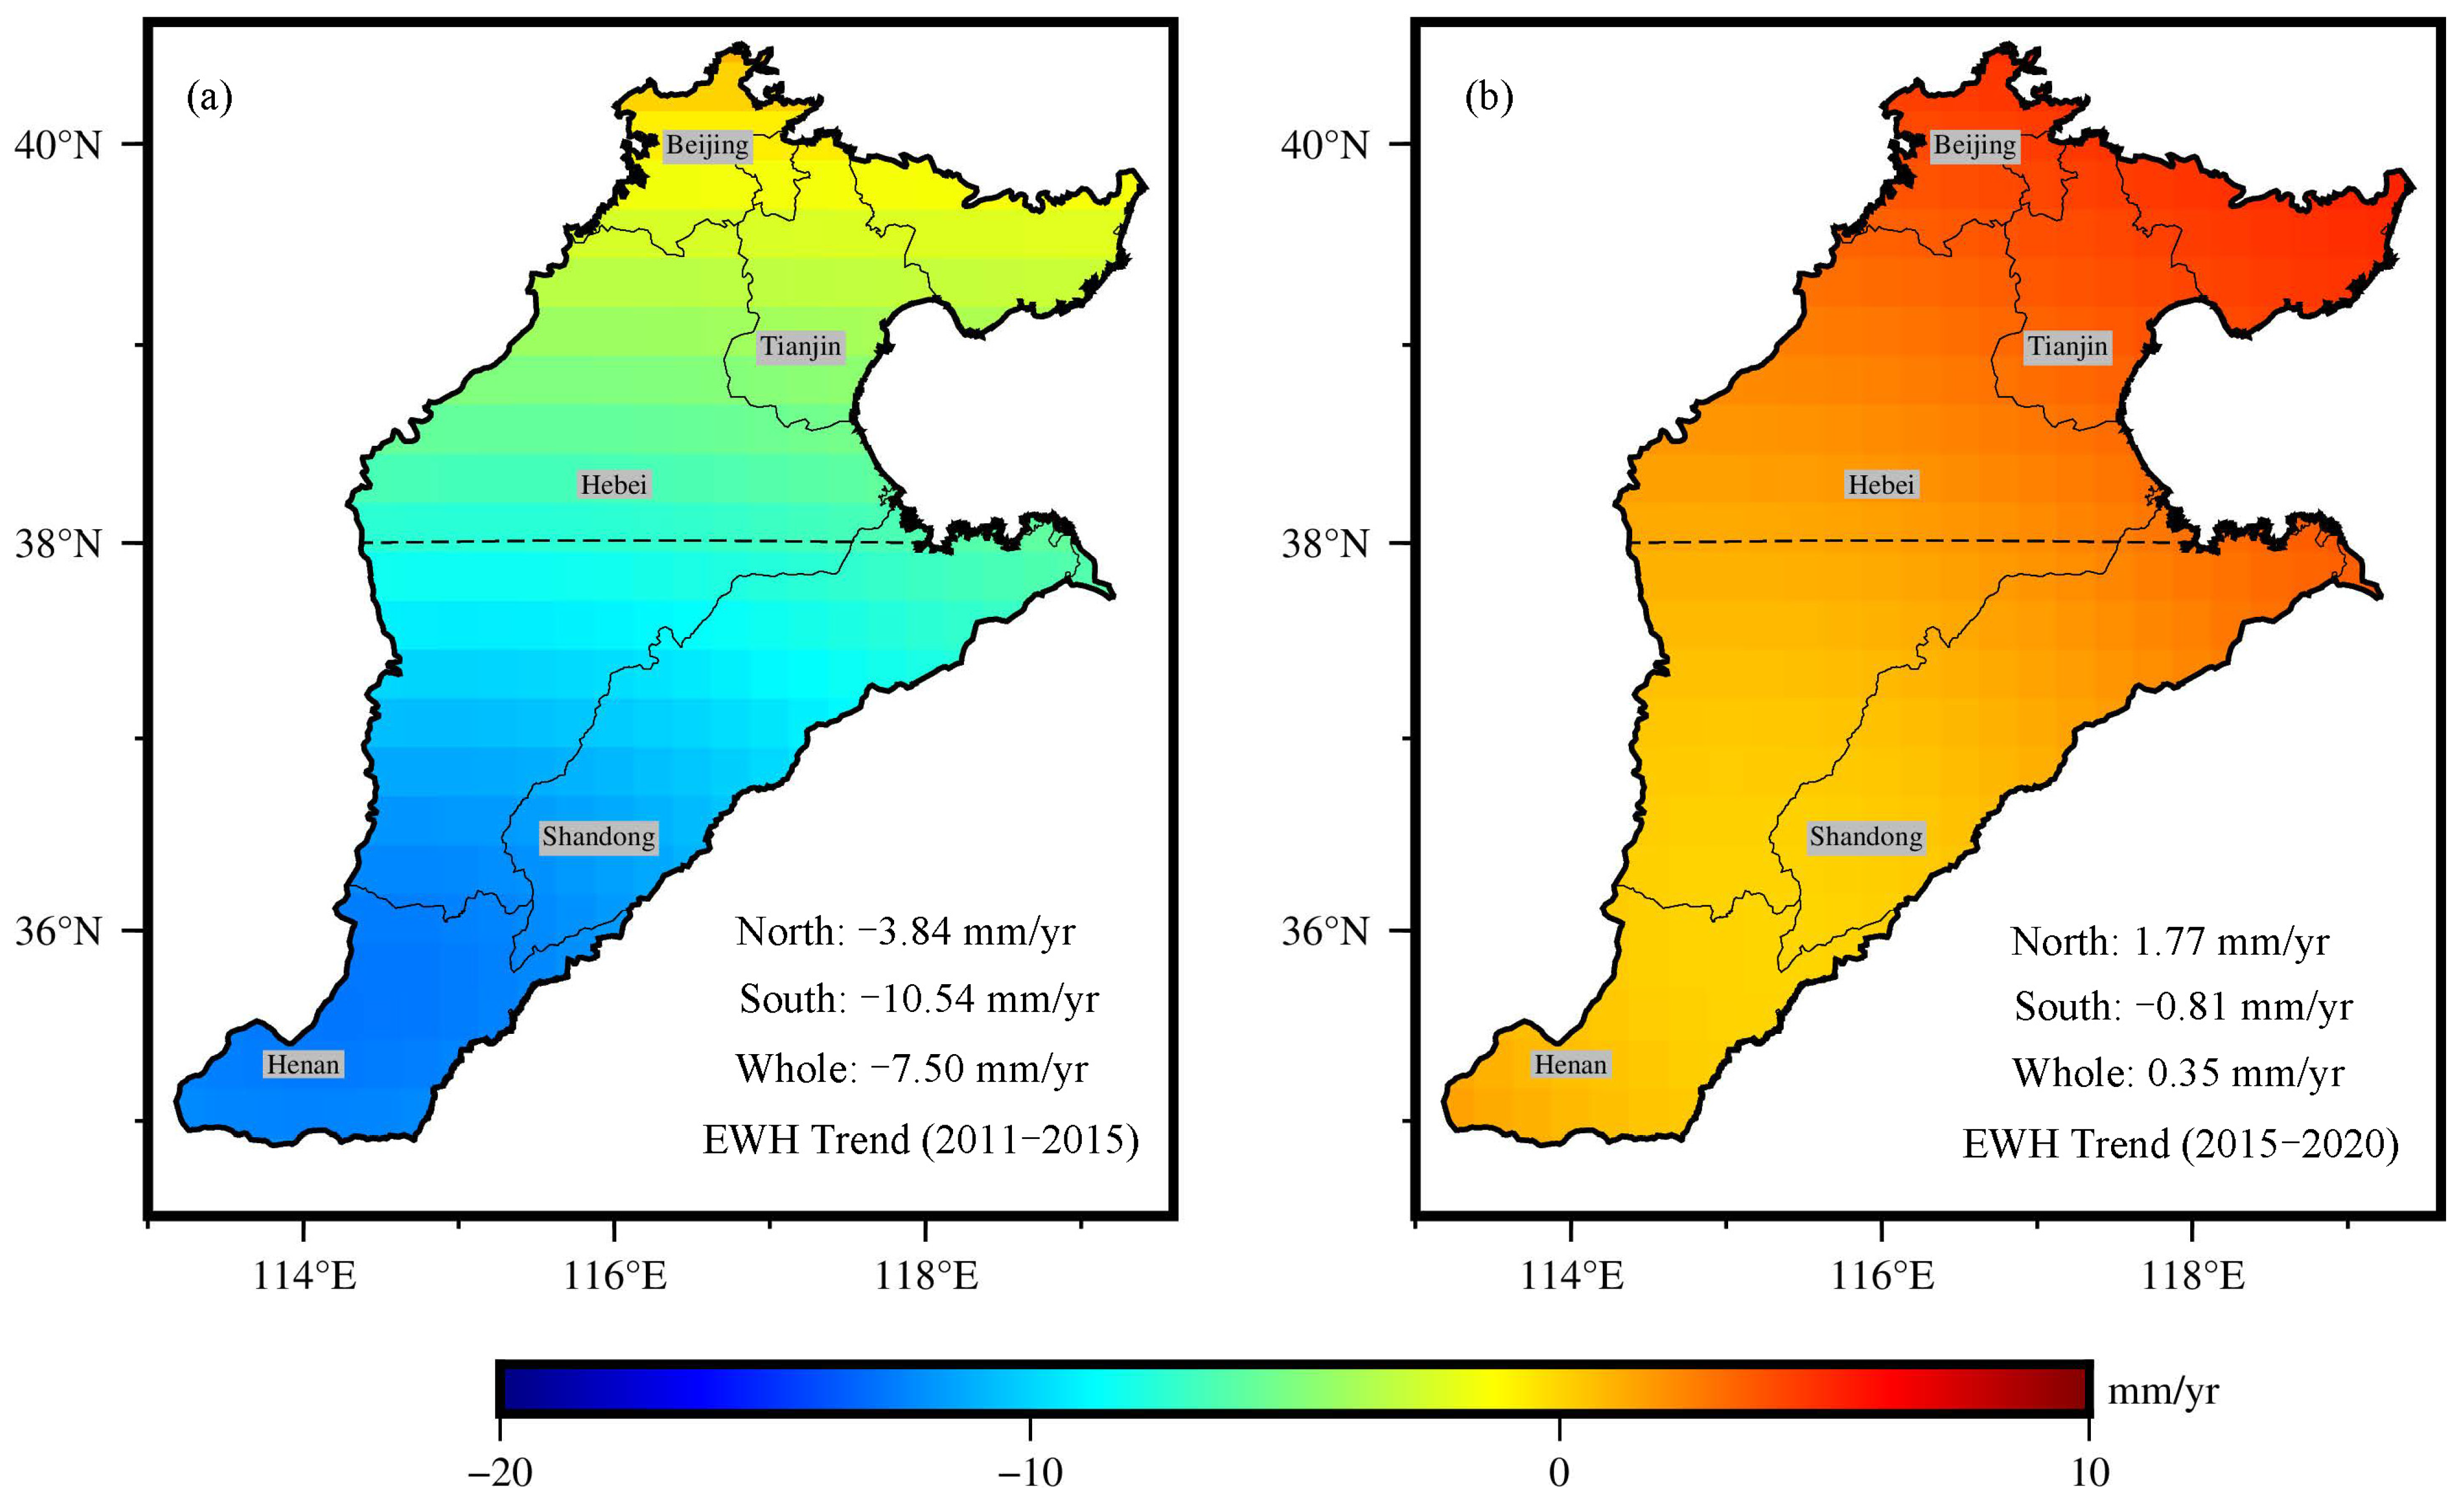
Moreover, we calculated the rates of EWH spanning 2011 to 2015 and 2015 to 2020 across the entire NCP, illustrated in Figure 3. This analysis revealed a significant divergence in water storage between the southern and northern regions of the NCP, with the considerably larger loss rate of −10.54 mm/yr in the south compared to that of −3.84 mm/yr in the north. Specifically, during the 2011–2015 period, provinces in the southern NCP like Hebei, Henan and Shandong experienced substantial water loss, which could be attributed to the dense concentration of agricultural cultivation and the extensive need for large-scale irrigation in these regions [36]. According to GRACE and well observation data, the consumption rate of TWS was 4.65 cm/yr from 2003 to 2013 in the piedmont plain, primarily utilized for agricultural production [15]. This rate was much higher compared to the average EWH change in the whole NCP with rates of −7.5 mm/yr and 0.35 mm/yr for the 2011–2015 and 2015–2020 periods, respectively (as illustrated in Figure 2). Conversely, the central and eastern regions, influenced more by industrial and human activities, exhibited a lower consumption rate of water resources. This difference suggests that intensive irrigation practices significantly deplete water resources. After the operation of the SNWD-C, the pressure of water scarcity in the NCP has been alleviated, leading to a cessation of significant water loss in agricultural regions. Additionally, there has been a conspicuous replenishment of terrestrial water reserves with EWH change rate of 1.77 mm/yr in Tianjin, Beijing and northern Hebei, which may be due to the fact that these regions are not short of water.
3.2. Characteristics of Land Subsidence
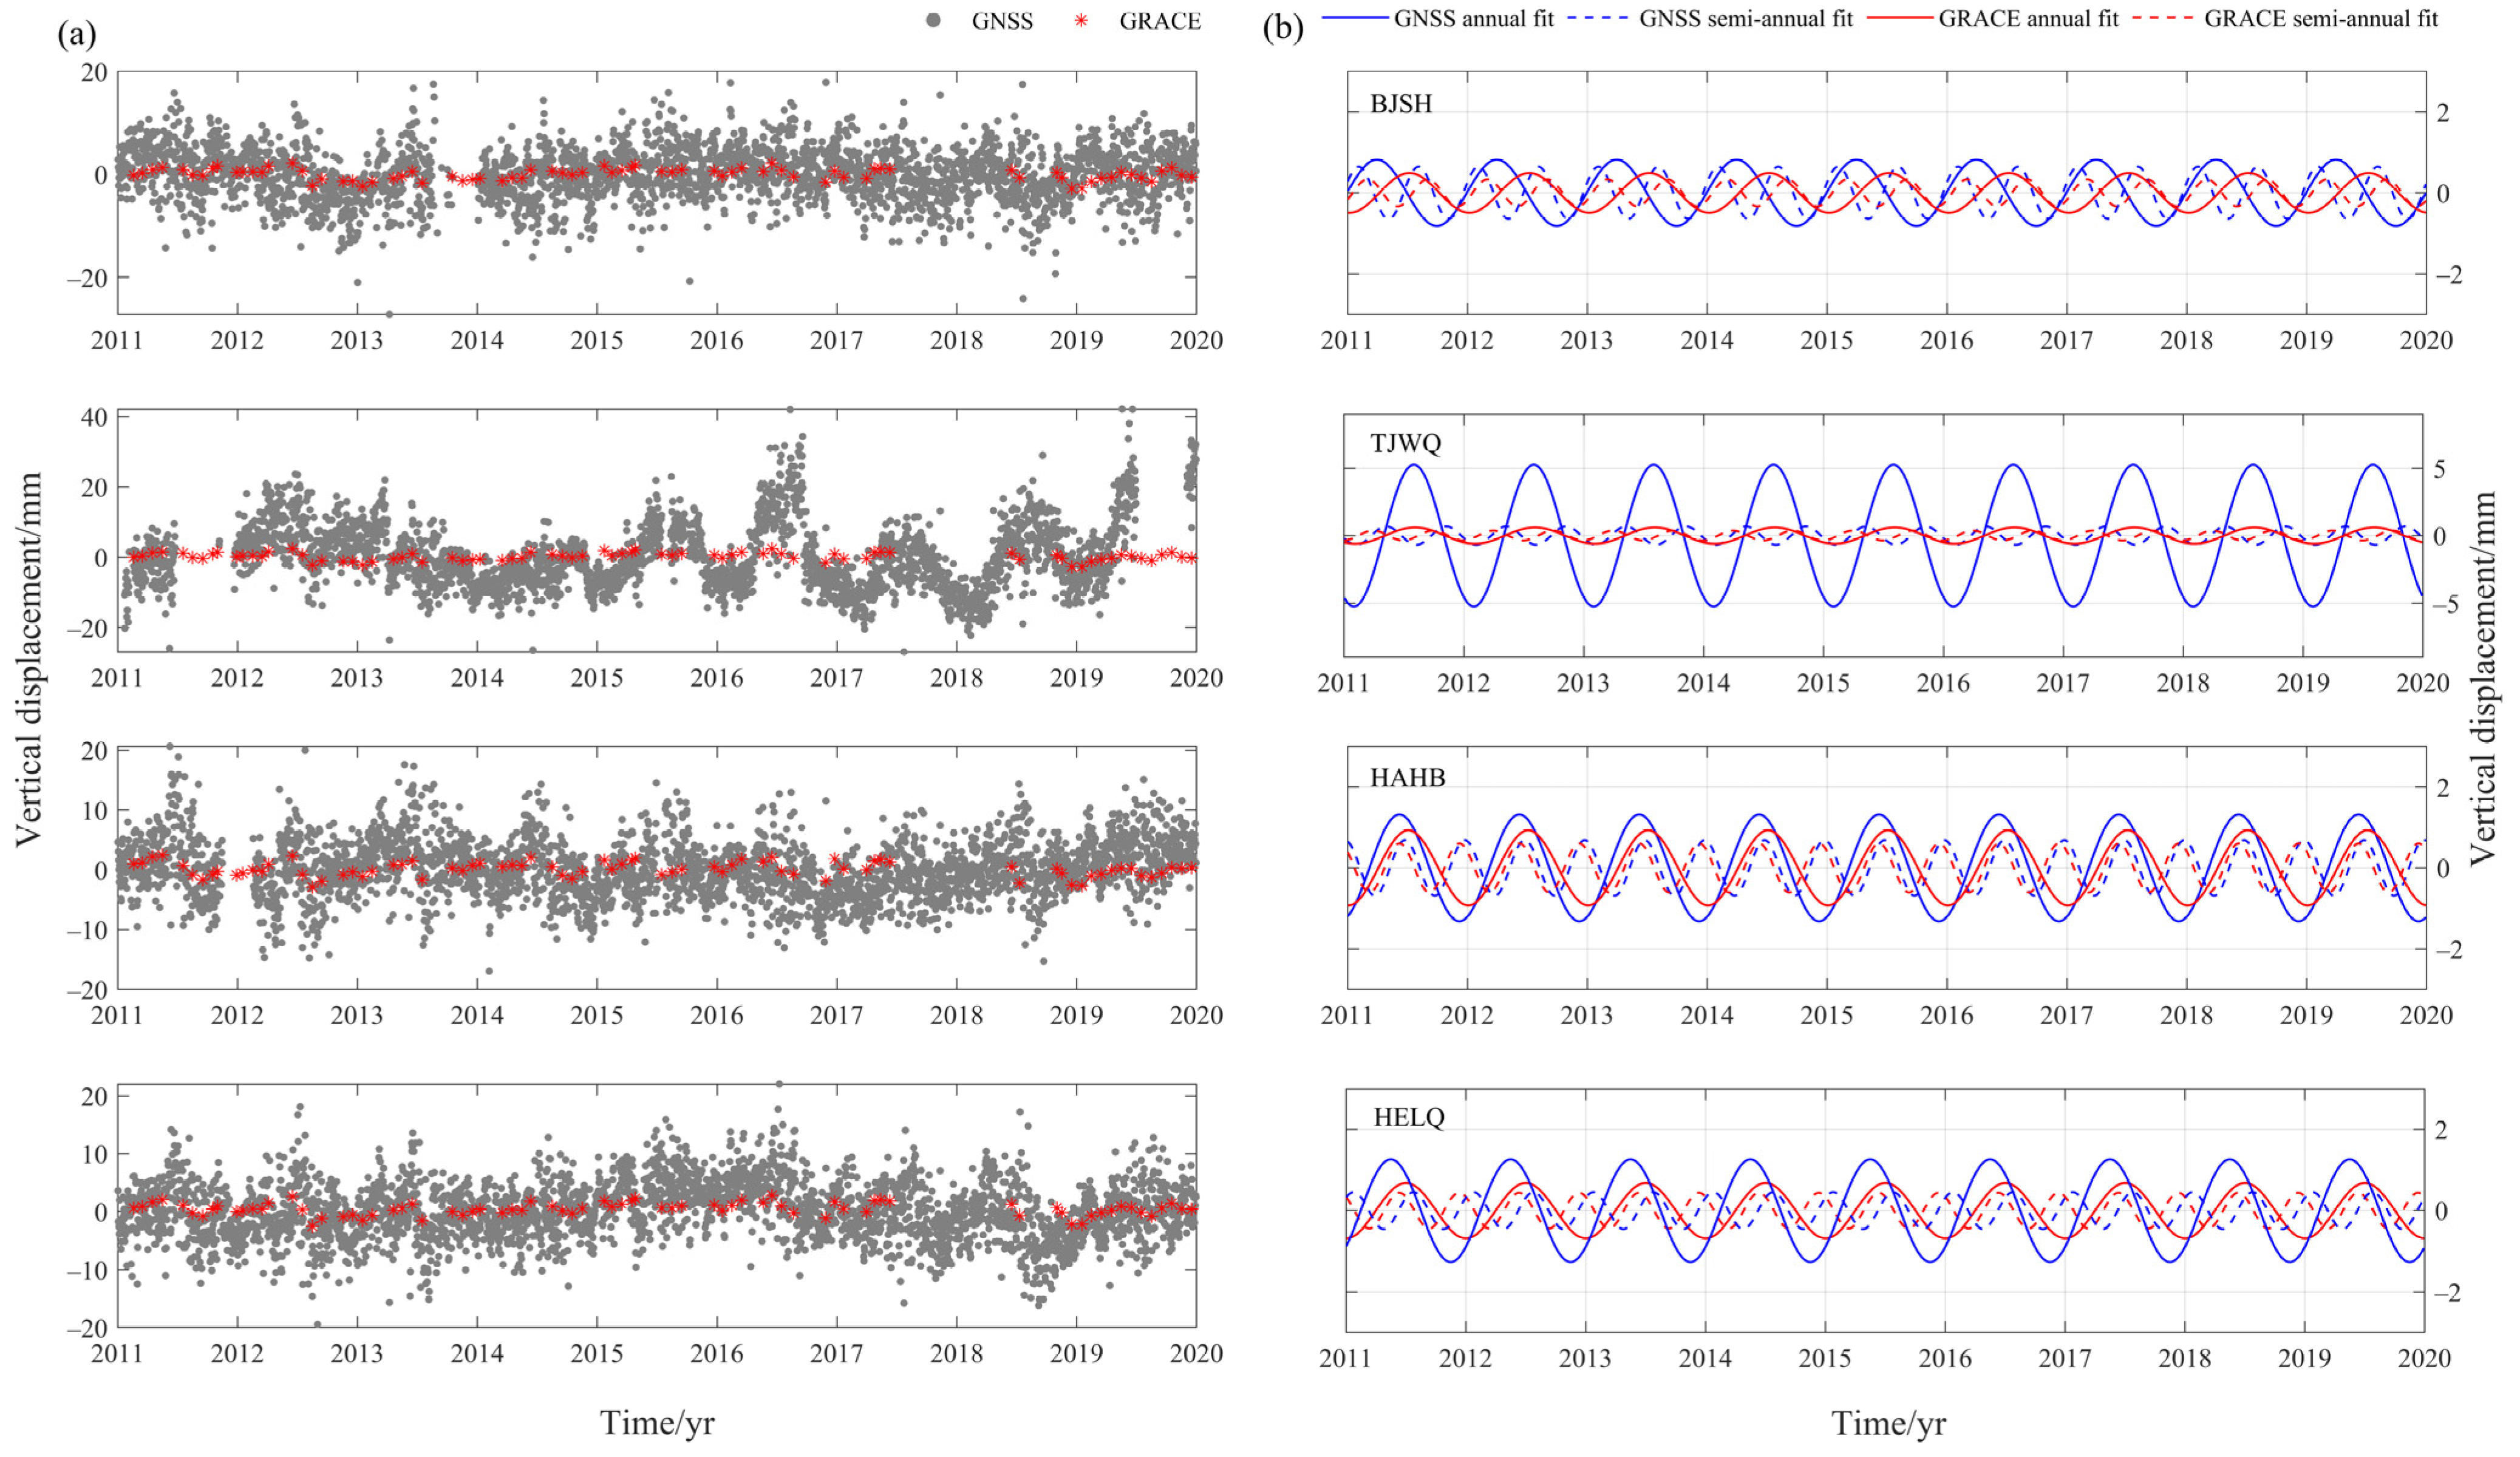
In the decades preceding advancements in water resource management, the NCP experienced extensive groundwater extraction due to insufficient surface water resources to fulfill the demands of human activities, resulting in significant land subsidence in the region. Analysis of TWS variations based on GRACE data spanning the period from 2011 to 2020 reveals that the soil moisture content in the region has been adequate to support growth following the implementation of the SNWD-C. However, it remains uncertain whether the rate of land subsidence has synchronically reduced, necessitating further quantitative analysis. Therefore, we utilized GNSS vertical displacement time series to extract this signal, isolating the nonlinear motion caused by mass loading. Due to the strong seasonal correlation between GRACE and GNSS signals, as depicted in Figure 4, the deformation caused by water mass migration is deducted from the GNSS vertical time series to derive accurate surface settlement deformation. Notably, significant land subsidence is evident in the central and eastern regions of NCP. The maximum observed motion rate reaches 67.94 mm/yr (as presented in Table 1). However, the land deformation in the vicinity of Taihang Mountains does not exhibit pronounced changes. These findings underscore substantial regional variations in land subsidence across the area. From the perspective of time scale, most GNSS stations did not record the obvious change in motion rate before and after SNWD-C, suggesting that the supply of water resources has ceased to intensify the reduction in motion rate or alleviate the exacerbation of land subsidence.
We utilized GRACE data to calculate the annual average EWH and the surface deformation rate resulting from the migration of water masses. Additionally, we used the GNSS data to estimate the vertical land motion rate at each station during the 2011–2015 and 2015–2020 periods, detailed in Table 1. Notably, the HAHB station exhibits the most rapid decline in EWH before the implementation of the SNWD-C and experiences the slowest recovery after the implementation. In contrast, the loss of terrestrial water in Beijing is the smallest and the recovery is the most obvious after the water supply. Moreover, there is a widespread increase in EWH across the NCP following the implementation of SNWD-C. Despite substantial fluctuations in EWH at GNSS stations like HAHB, HEHD, HELY, etc., the rate of surface displacement caused by water mass migration is below 0.5 mm/yr. Consequently, the results show that the surface displacements resulting from hydrological loads influenced by the SNWD-C are minimal, nearly negligible compared to the obvious surface deformation observed by GNSS.
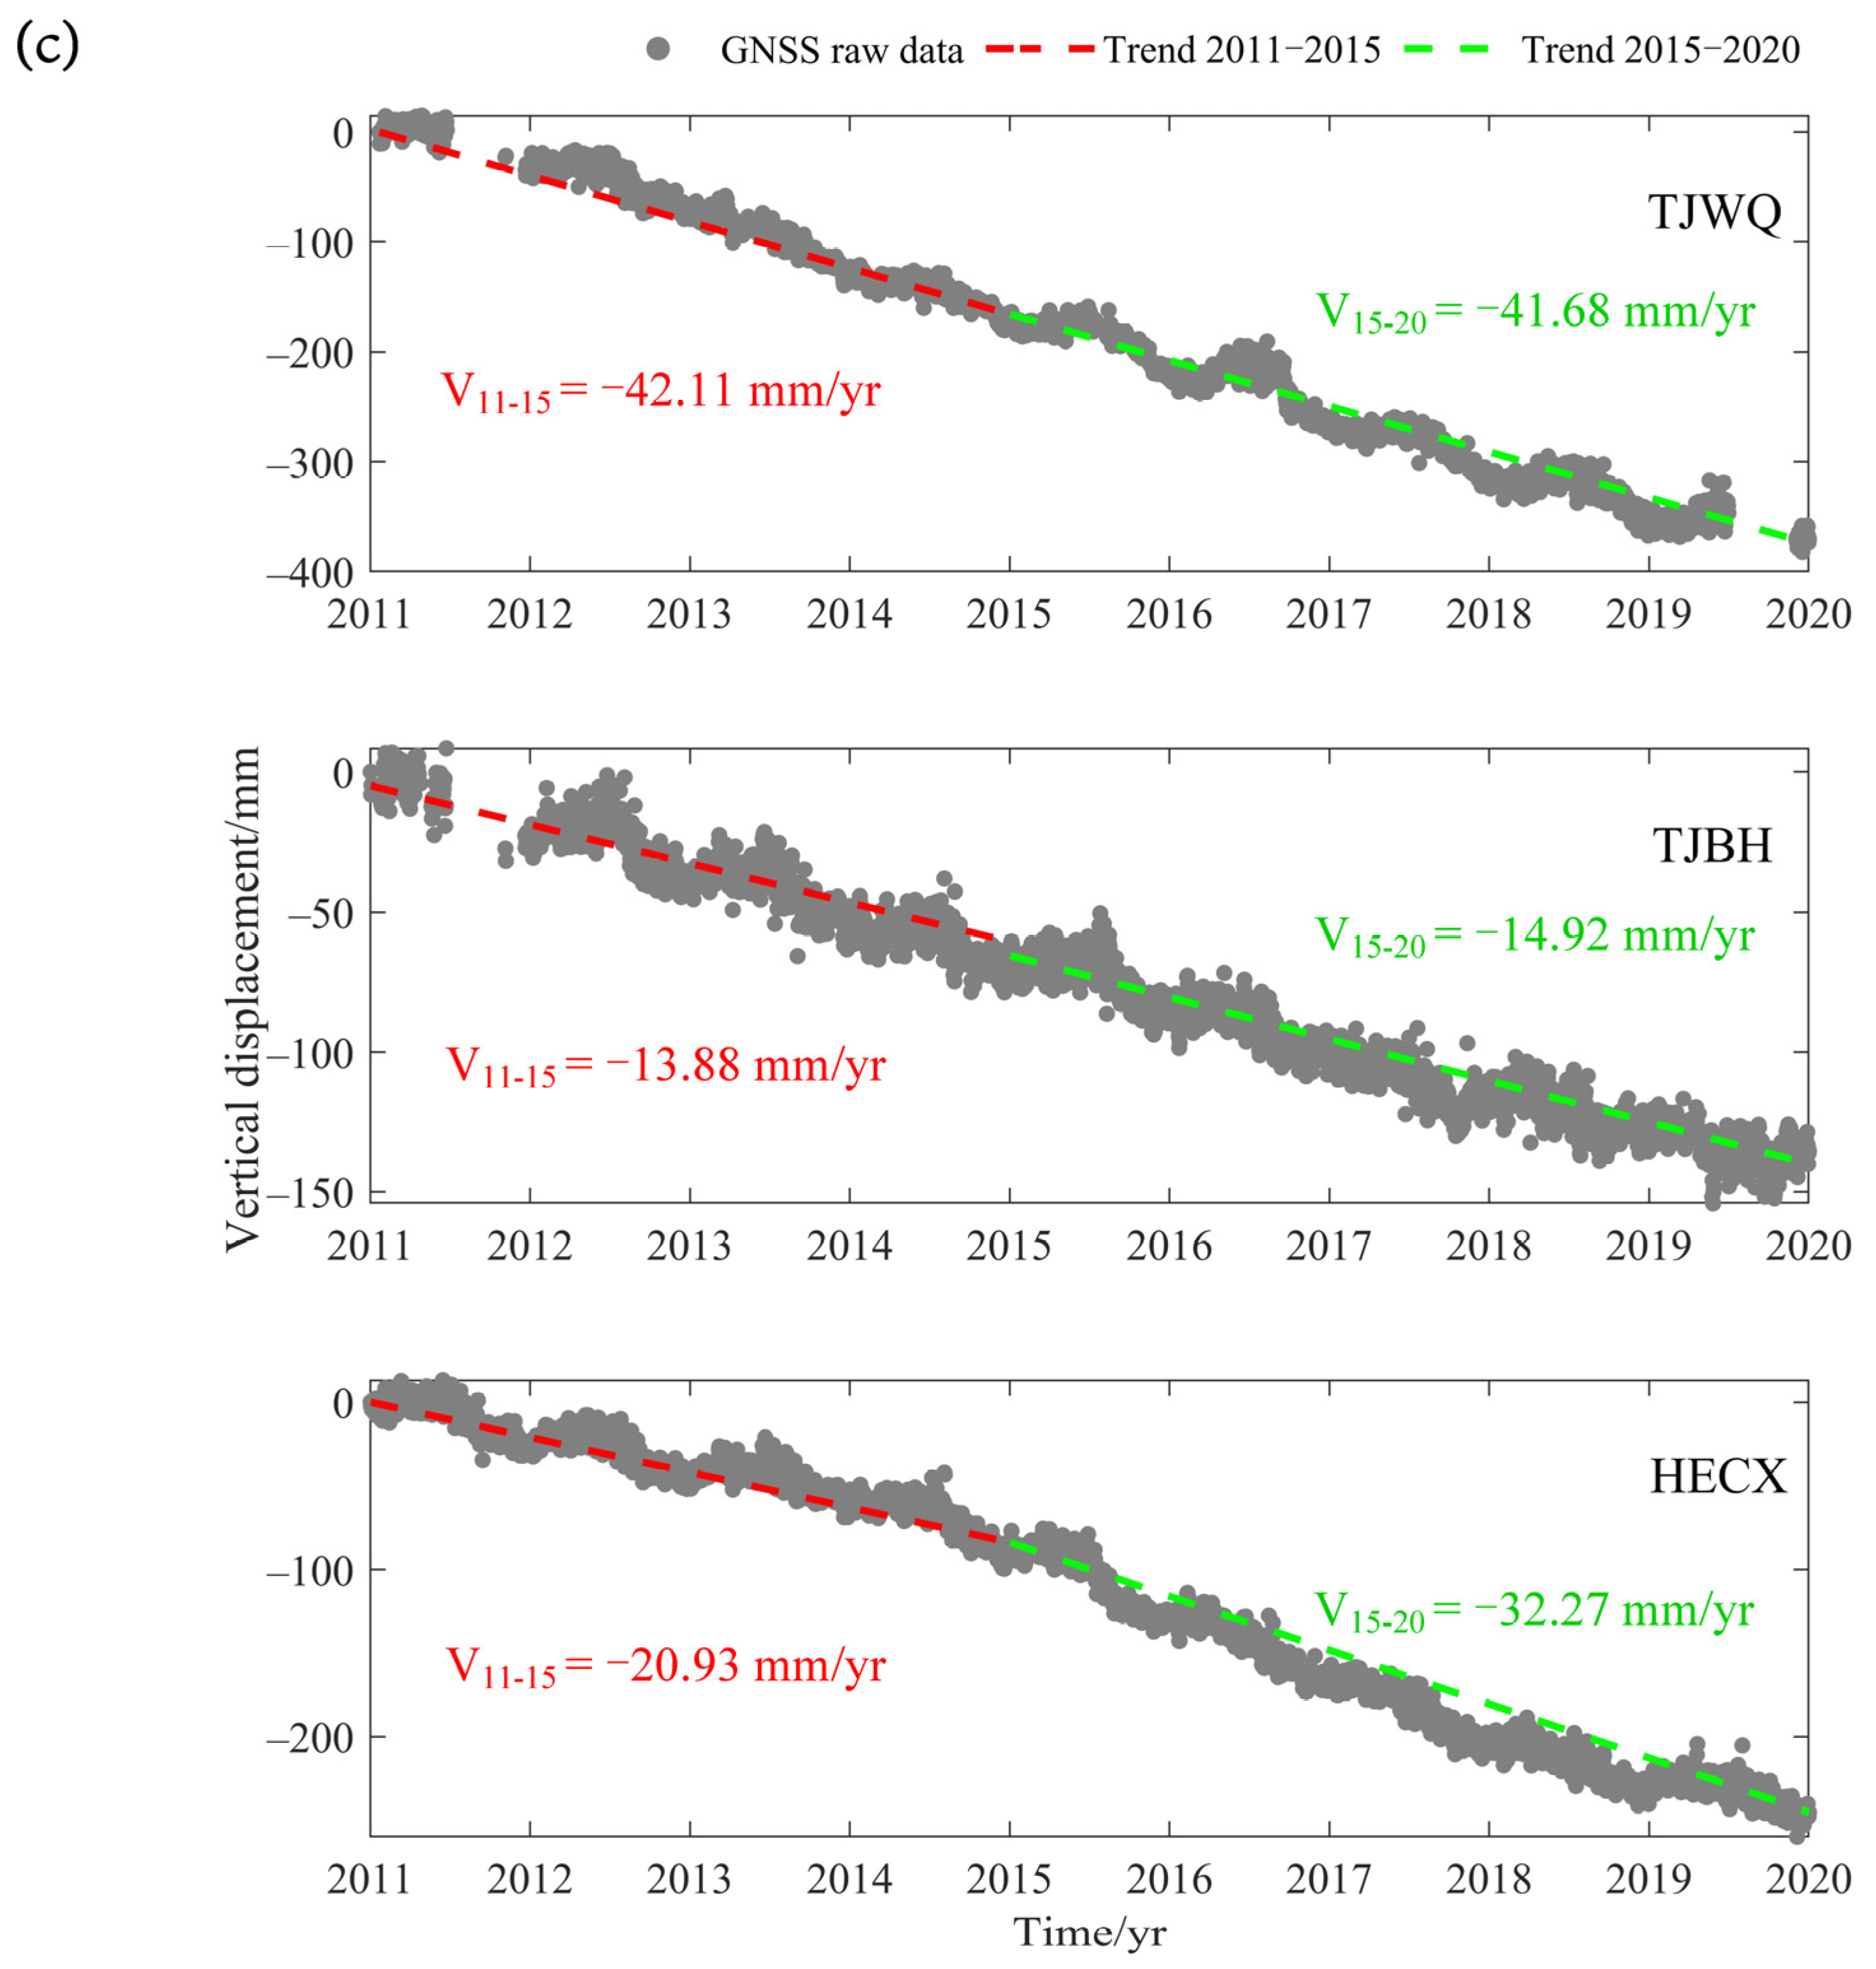
The land motion rates derived from GNSS data show negligible changes at most stations before and after the SNWD-C. However, the HECX station near Cangzhou in western Hebei province is experiencing intensified land subsidence even after water resource supply by the SNWD-C. This inconsistent motion is also evidenced by InSAR results in the adjacent region. Zhang et al. used InSAR observations from Envisat/ASAR and RadarSAT-2 data to calculate land subsidence with rate of −11.3 mm/yr in the Cangzhou area from 2003 to 2010, consistent with the changes in deep groundwater [37]. In contrast, the InSAR data spanning 2016 to 2019 revealed a steep increase, showing a trend rate of −39.7 mm/yr [19], indicating an increasingly severe land subsidence. The hydraulic head observations from 2003 to 2019 indicated a delayed release of the aquitard, likely due to prior hydraulic head reductions and a continuous decline, potentially driving the escalating land subsidence rates [16]. These findings imply that despite the short-term operation of the SNWD-C with surface water recharge, it might not be adequate to alleviate the land subsidence caused by overexploitation of groundwater.
4. Discussion
4.1. The Relationship between Land Subsidence and Groundwater Changes
Due to the decreased precipitation in the NCP, soil moisture content and surface water storage have subsequently reduced, leading to that individuals have to extract more groundwater to compensate the water shortage, and finally causing a significant depletion of groundwater between 2013 and 2016 [38]. The depletion of groundwater has affected the surface subsidence rate to a certain degree [39], particularly evident at the three GNSS stations like TJBD, TJWQ, and HECX, with severe land subsidence. However, the water resource supply by the SNWD-C changes the situation, partially meeting the needs of human beings while also alleviating the loss of groundwater reserves in the NCP [40]. The evidence indicates that the surface water has supplemented shallow groundwater to a certain extent, yielding a positive impact on shallow groundwater in Beijing [41]. Nonetheless, not all regions in the NCP have experienced a reversal from subsidence to uplifting because of the water supply by the SNWD-C. For instance, the subsidence rates at TJBD and TJWQ stations during the 2015–2020 period remained comparable to those recorded from 2011 to 2015 period (detailed in Table 1). GRACE measurements indicate that the loss of groundwater has not continuously deteriorated and there is a slight increase in terrestrial water reserves in the NCP (Figure 2 and Figure 3), implying a potential correlation between groundwater fluctuations and land subsidence. However, for the HECX station, the land subsidence rate has continuously increased after the operation of the SNWD-C, emphasizing persistent concerns about groundwater loss in specific regions of Cangzhou. Despite minimal declines in terrestrial water storage in some areas of NCP or almost no decline, the phenomenon of land subsidence persists [19]. The key geological and hydrogeological conditions contributing to ground subsidence in the NCP involve a multilayered aquifer system with deep-pressured confined water-bearing strata and relatively thick normally consolidated or unconsolidated compressible clay layers [42]. Compared with the change of groundwater, there is a lag in land deformation which may be caused by compression process of soil layer. Moreover, it is recommended that the long-term deformation rate changes observed by GNSS can be employed to analyze the relationship between groundwater changes and land subsidence in the NCP.
4.2. Variation Characteristics of Land Subsidence in the NCP
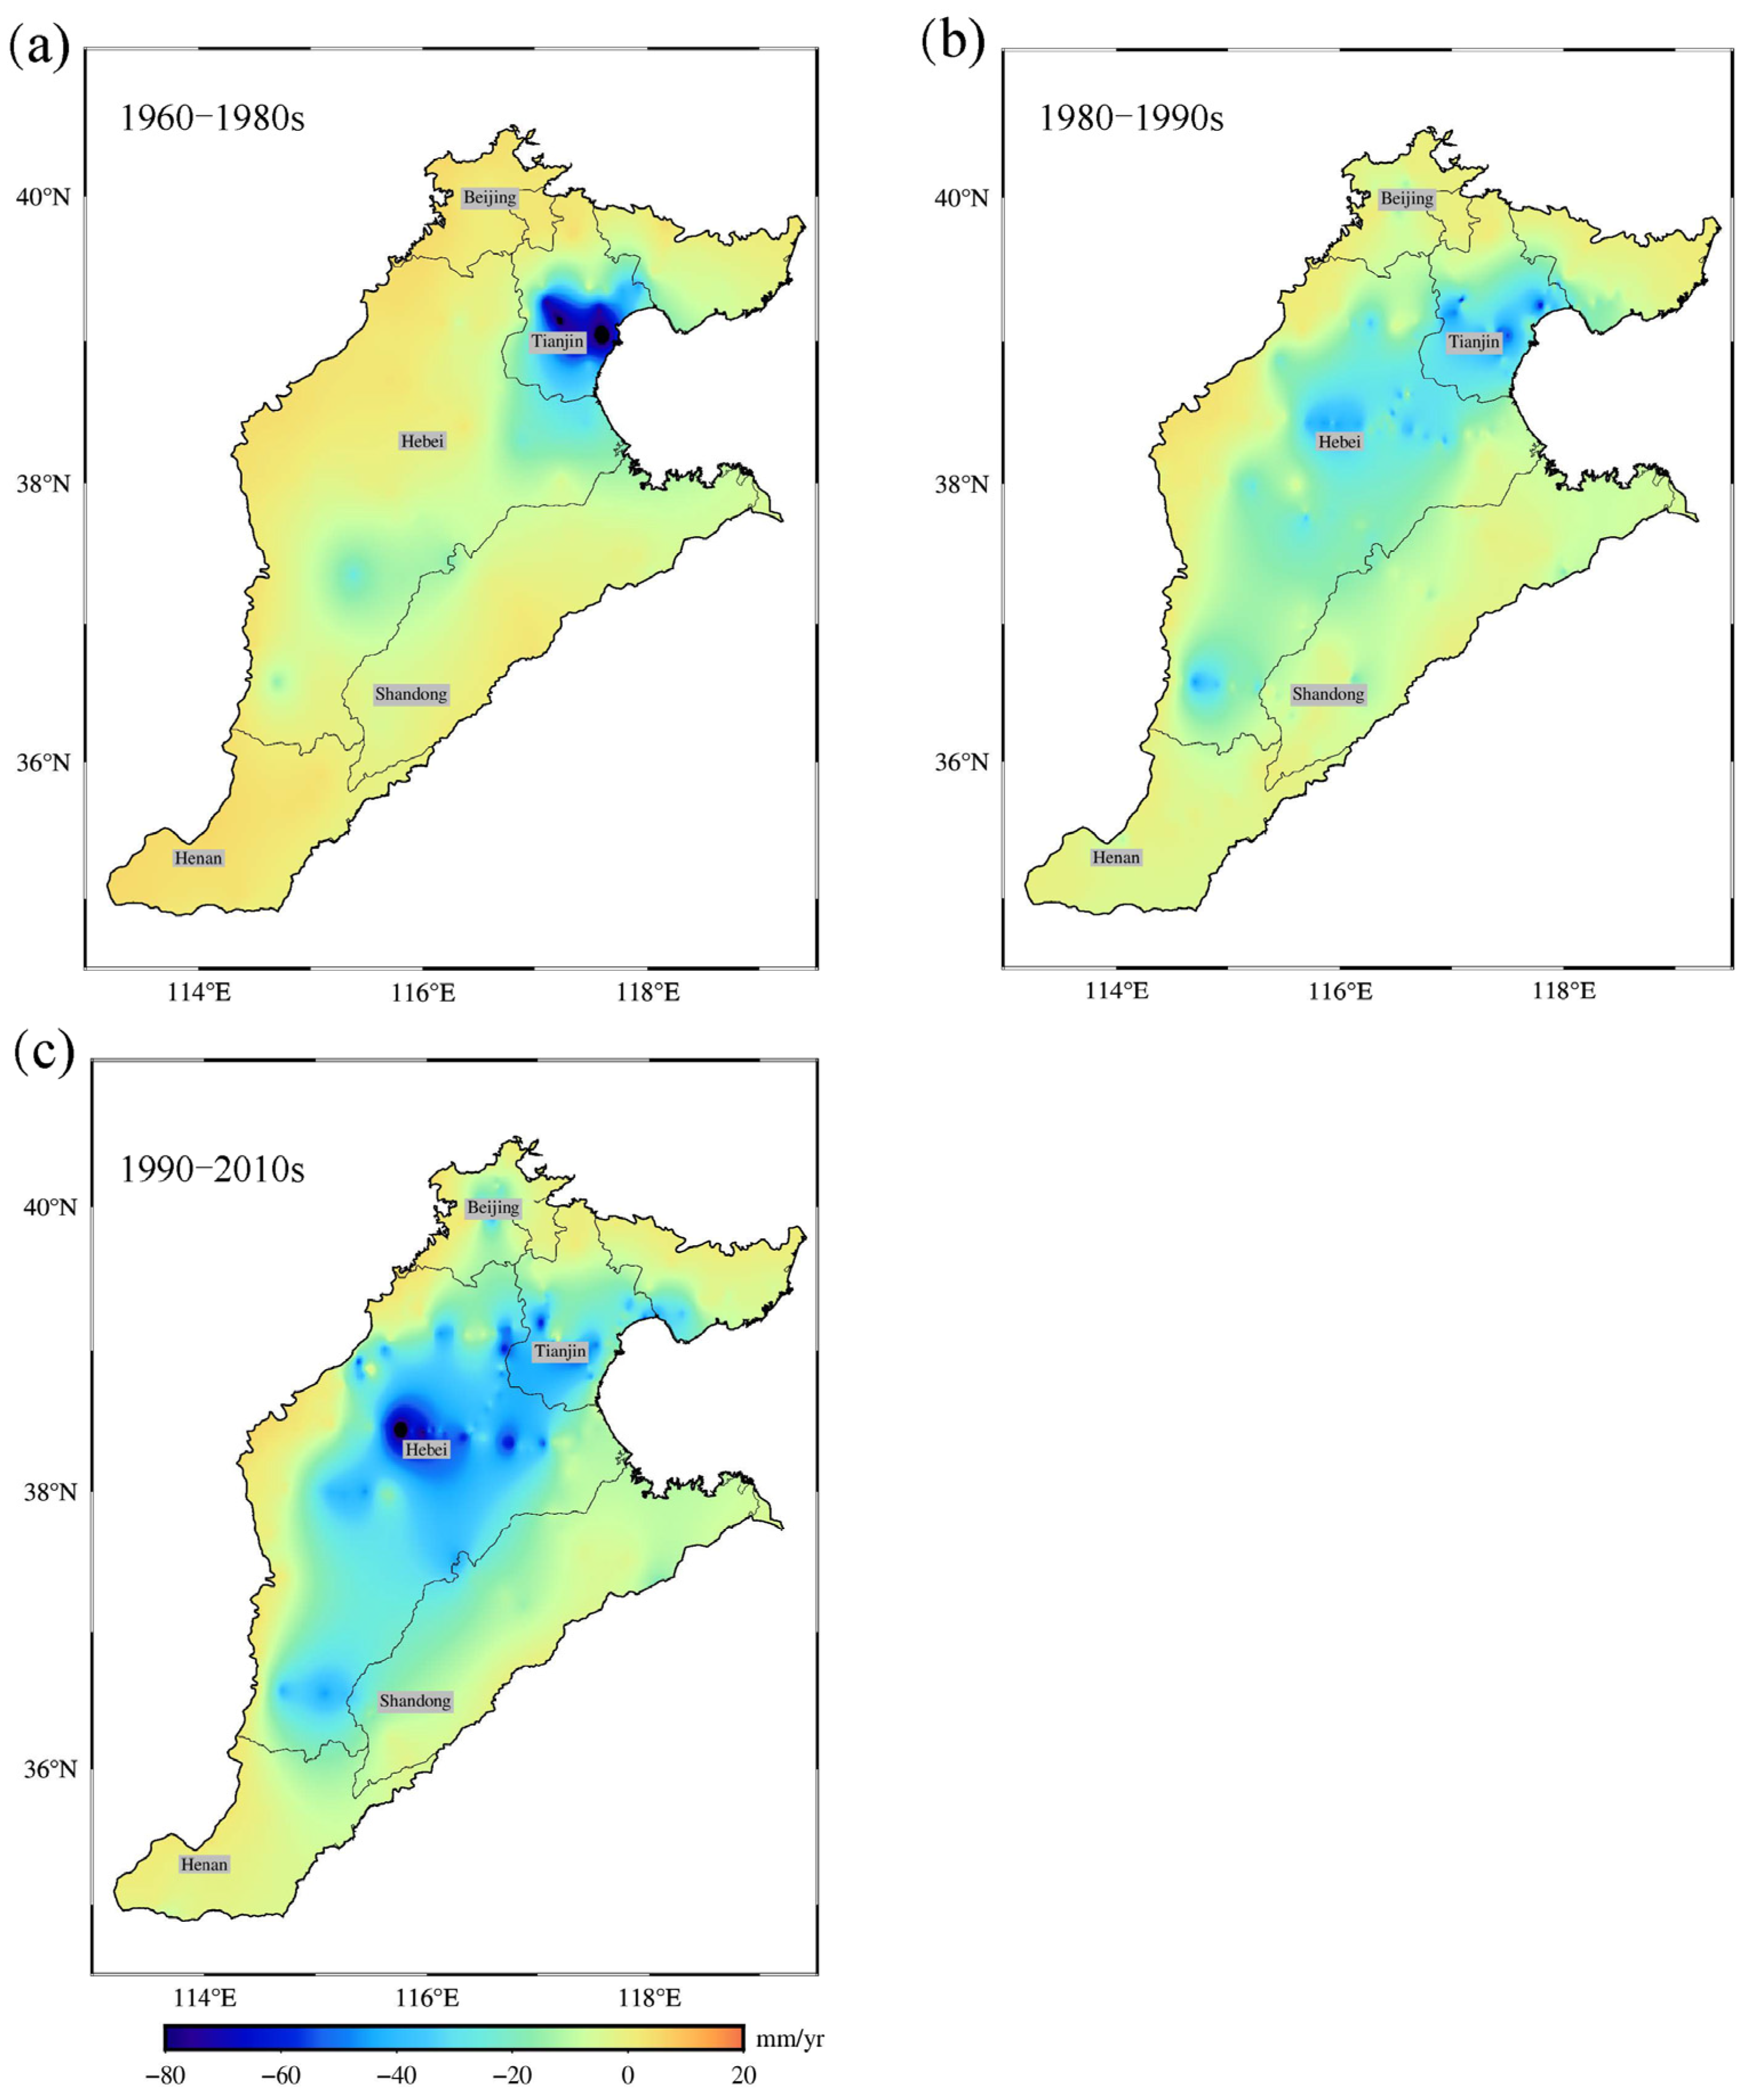
In order to investigate the variation of land vertical deformation in the NCP over a longer period, we utilized the leveling results of three phases spanning the past 50 years across the region (Figure 5), with average errors of the vertical movement rates of ±2.49, ±1.42 and ±1.31 mm/yr for the 1960–1980s, 1980–1990s and 1990–2010s periods, respectively [35]. It is shown that the plain near front of the Taihang Mountains has consistently maintained a slow uplift throughout the entire observation periods. Initially, only Tianjin and its adjacent areas were experiencing serious land subsidence. However, over time, the subsidence areas gradually expanded in the central and western NCP, with persistent soaring subsidence rate in regions like central Hebei Province, especially during the 1990–2010 period. In Henan province, the land experienced uplift during the 1960–1980s but underwent subsidence in the subsequent decades (1980–1990s and 1990–2010s). This shift can be attributed to the excessive utilization of water resources in the process of agricultural development.
In order to comprehensively understand the variations of the land subsidence variations in the NCP over the past decade, the subsidence rate derived from GNSS for the 2011–2020 period (Figure 6) is compared with the rate obtained from the leveling during the 1990–2010 period (Figure 5c). The comparison reveals an excellent agreement between the two datasets over the past decade. The plain in front of the Taihang Mountains continues to demonstrate a slow uplift, while the central and eastern regions, including Beijing and Tianjin, are undergoing substantial subsidence. It’s noteworthy that no loss of EWH was detected by the GRACE results during the 2011–2020 period. The main factors leading to ground subsidence in the NCP are manifested as strong compressible thick layers of loose sediments, along with dynamic conditions of the groundwater system, such as groundwater extraction. The sediments beneath the North China Craton represent alternating sequences of sand layers and high-compressibility clay layers. Due to long-term excessive groundwater extraction, the groundwater level has significantly declined, resulting in extensive ground subsidence in the region [42]. However, land subsidence showed an increasing trend during the period 1960 to 2010. After the supplement of SNWD-C, the central and eastern parts of the NCP are at a certain rate of subsidence, preventing further intensification of subsidence. This suggests that water recharge has a substantial impact on land deformation in the region.
4.3. The Influence of SNWD-C on Changes of Terrestrial Water Storage and Land Subsidence
GNSS stations with nearly a decade of observation data revealed obvious subsidence in the central and eastern parts of the NCP, while showing minimal variation in the piedmont plain. Notably, significant land subsidence was observed at TJWQ, TJBH and HECX stations. As shown in Figure 6c, the sedimentation rate observed after the SNWD-C is almost the same as that of 2011–2015 and even faster in some cases. Interestingly, despite the distance of SNWD-C from western Hebei province, the more pronounced land subsidence observed by GNSS in this area may be attributed to inadequate water supply [43]. However, the broader coverage of SNWD-C seems to have mitigated further exacerbation of land subsidence in multiple areas. For most GNSS stations with no obvious land subsidence observed, it can be seen that the trend had little change before and after of SNWD-C. These stations are generally distributed in the front of the Taihang Mountains, predominantly reliant on shallow groundwater consumption. Consequently, their vertical land change seems to be less affected by groundwater fluctuations [15].
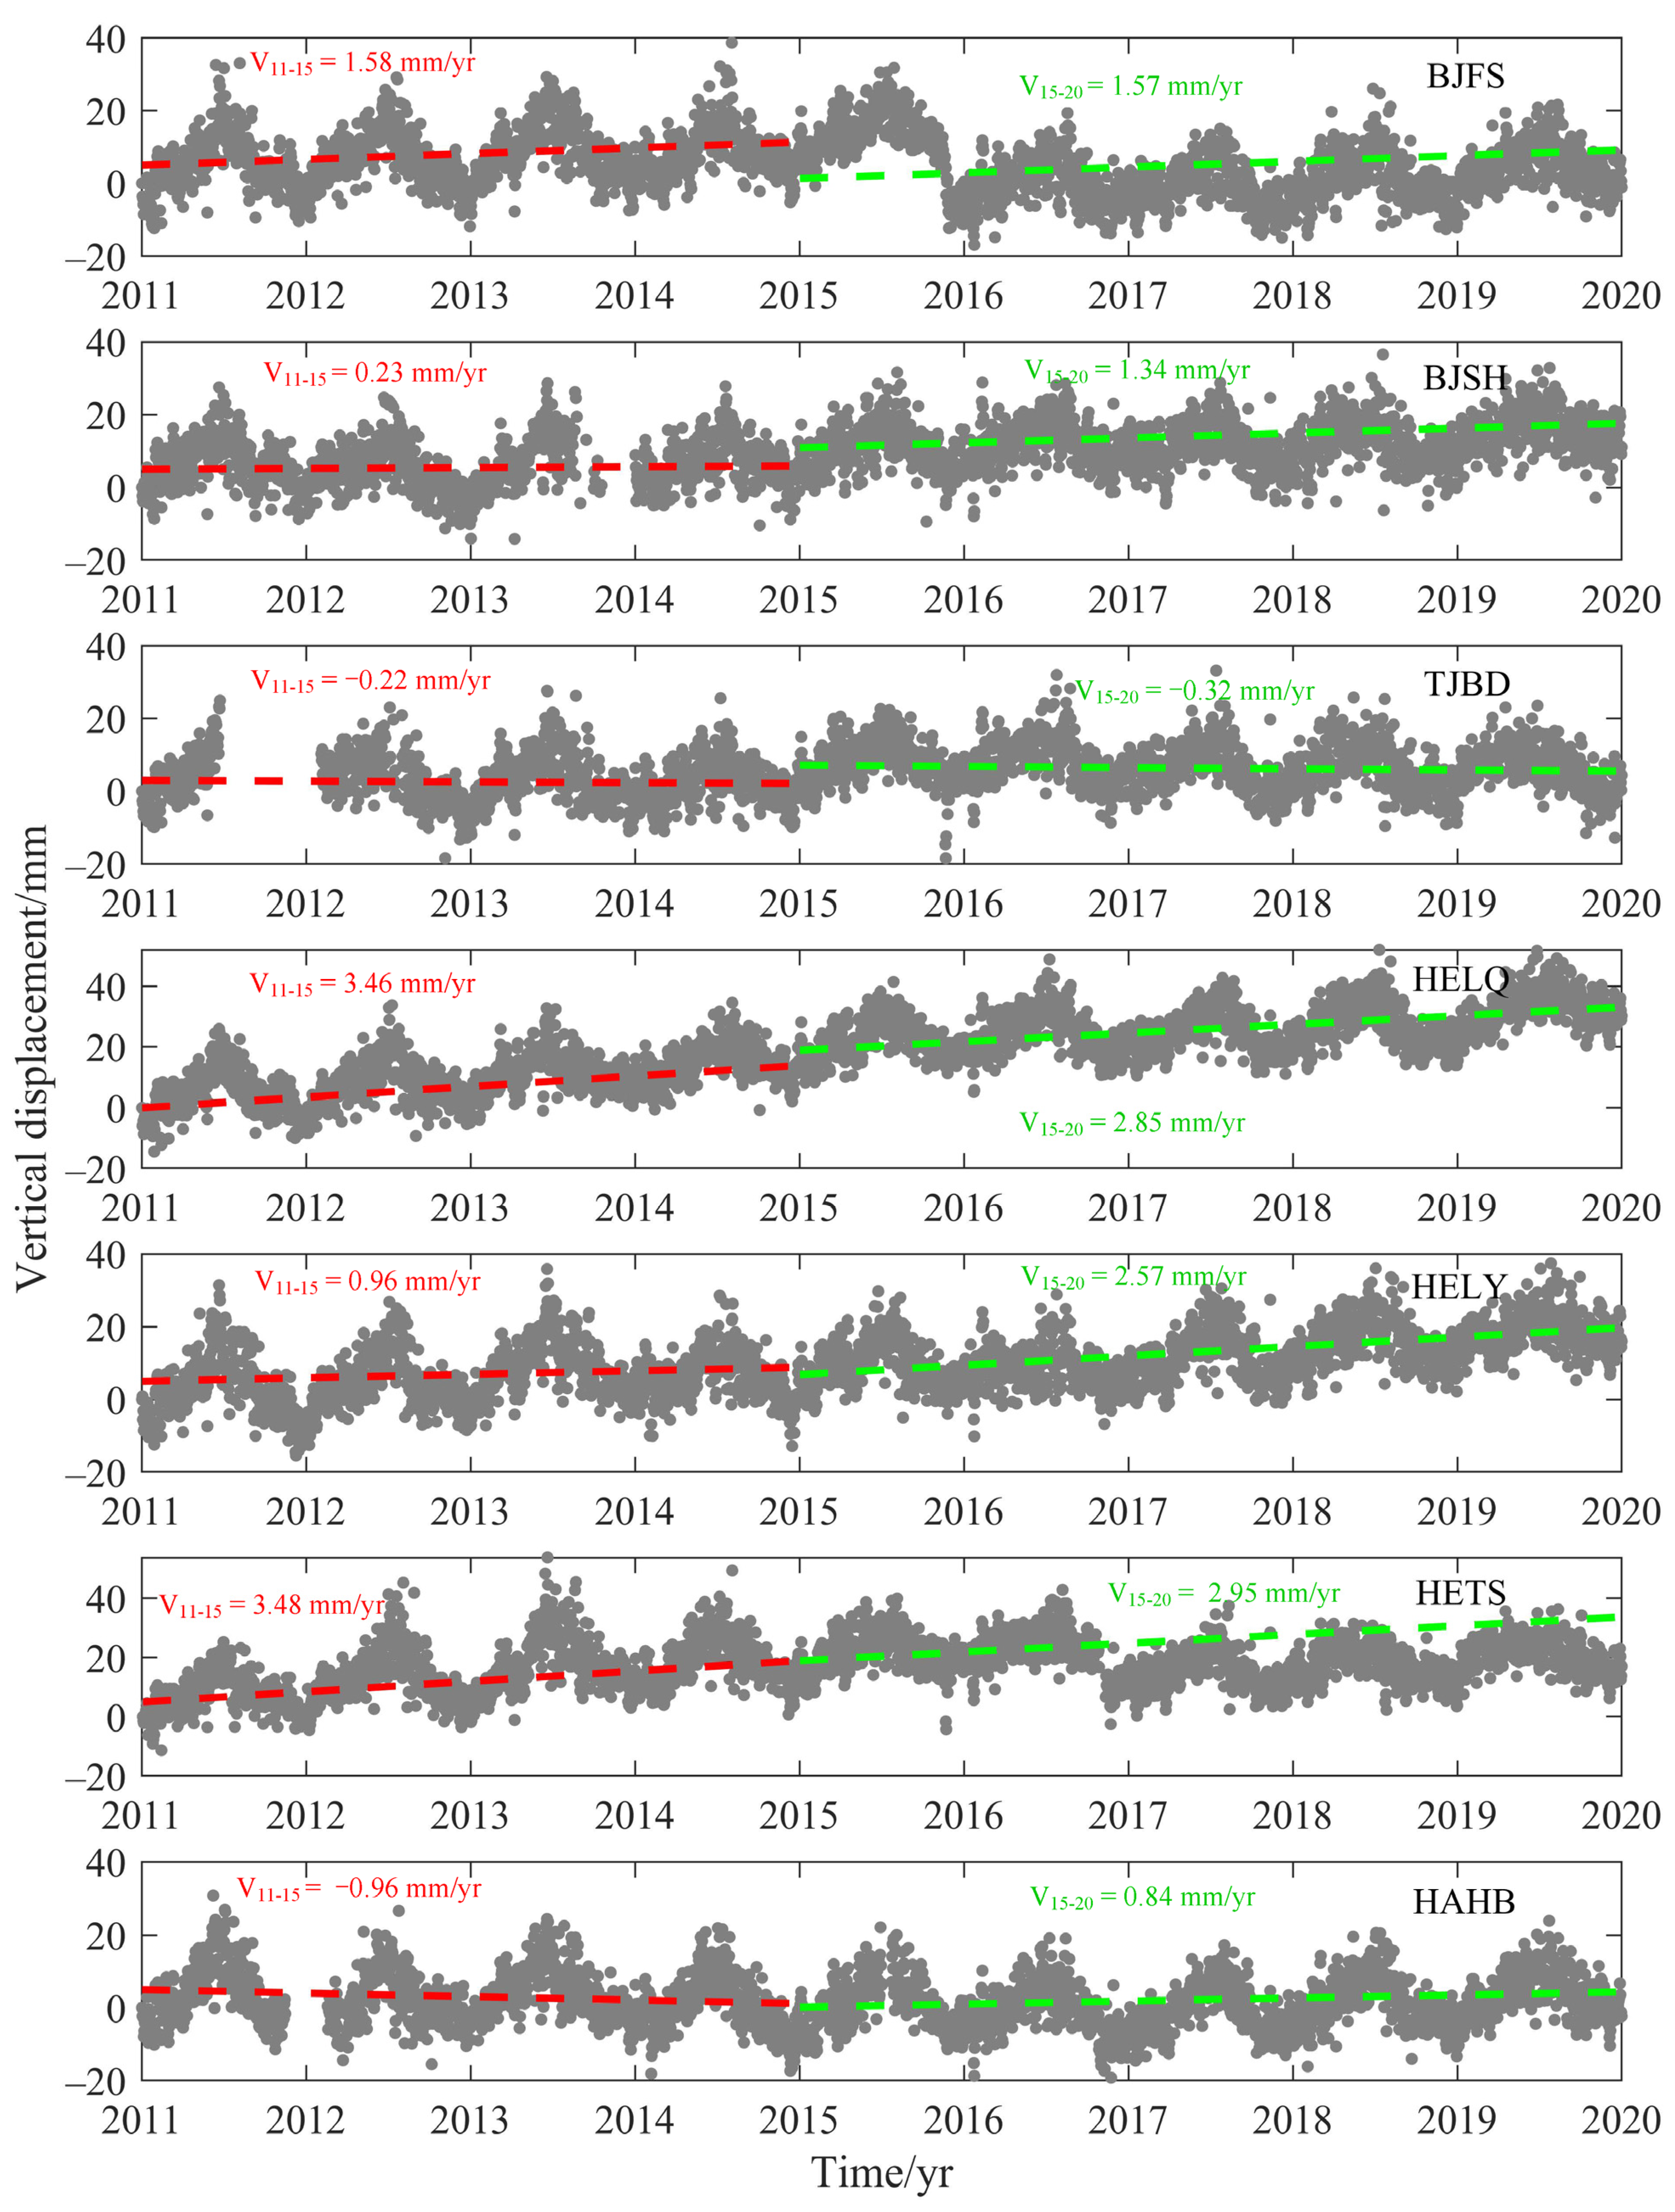
The SNWD-C has played a crucially important role in replenishing terrestrial water reserves and even contributing to the replenishment of shallow groundwater [41]. The depth of groundwater exploitation is closely linked to the geological structure of the region [15]. In the central and eastern parts of the NCP, the compressible layer ranges from approximately 100 to 260 m in depth, with the primary mining aquifer located within this stratum [44]. The continuous exploitation of groundwater stands as the primary driver behind the accelerated increase in land subsidence velocity in this area. The water supply from SNWD-C emerges as a crucial factor in elevating groundwater levels within this stratum, elucidating why the observed land subsidence velocity measured by GNSS has not continued to increase. The calculation results of GNSS stations in the southern part of the NCP, exemplified by HAHB (shown in Figure 7), show that the land subsidence in the area near the SNWD-C has been significantly slowed down or even uplifted, implying abundant water resources provided by SNWD-C to the region. This supply not only satisfies the water demands of the local population but also significantly aids in mitigating land subsidence, providing a strong condition for slowing down the land subsidence.
5. Conclusions
In this study, we have utilized the GRACE and GNSS data spanning from 2011 to 2020, along with leveling data from 1960 to 2010, to analyze the changes in EWH and land subsidence in the NCP over the past ten years. Our investigation yields the following findings:
- (1)
- Between 2011 and 2015, the GRACE-derived EWH results exhibited a noticeable decline in mean EWH across the NCP. This reduction was more pronounced from north to south, highlighting substantial losses. However, after the implementation of SNWD-C, the provision of water resources has alleviated losses attributed to agricultural irrigation in the southern part of the NCP and has provided supplementary effects on the water reserves in other regions.
- (2)
- The GNSS-derived land subsidence rate indicates no significant change in land subsidence velocity before and after the implementation of SNWD-C, particularly in the middle east of the NCP. This suggests that short-term water supply might not immediately alleviate land subsidence resulting from excessive exploitation of groundwater. Areas far away from SNWD-C, such as central Heibei province, continue to experience serious land subsidence due to limited recharge from water resources. However, there is a discernible uplift in the southern part of NCP affected by the SNWD-C. Therefore, GNSS observations provide valuable insights into groundwater changes in the NCP and offer a reference point for understanding these variations.
- (3)
- By combining the leveling data of the last 50 years, we analyzed the vertical changes of the land in the landscape over the past decade. Between 1960 and 2010, the land subsidence area in the central and eastern NCP progressively expanded, accompanied by an increasing subsidence rate. Nevertheless, the results calculated from GNSS and GRACE data demonstrate that the magnitude and trend of the sedimentation rate in this area are comparable to those of the leveling results from 1990 to 2010. This suggests that the intensification of land sedimentation rate has been restrained by controlling groundwater exploitation and water resource supply such as SNWD-C over the last decade. For regions where the subsidence is not obvious, the SNWD-C appears effective in counteracting the influence of excessive utilization of water resources in the early stage. However, for regions experiencing severe subsidence, the extent to which the subsidence rate can be significantly decelerated still requires verification through observational data on a more extended time scale.
Author Contributions
K.D. and X.C. conceived and led the study. J.W. performed the leveling, GNSS and GRACE data analysis and wrote the paper. R.G. and H.S. participated in the interpretation of the results. All authors have read and agreed to the published version of the manuscript.
Funding
This study was supported by the National Natural Science Foundation of China (Grant No. 42174012, 41974023, 42174101) and (Germany) The Offshore International Science and Technology Cooperation Center of Frontier Technology of Geodesy (Grant No. 2022EHB012).
Data Availability Statement
GNSS data utilized in this study are sourced from the Crustal Movement Observation Network of China (CMONOC) (accessible at https://data.earthquake.cn/index.html, accessed on 15 February 2021) and processed using the GAMIT/GLOBK 10.40 software. The harmonic coefficient data are acquired from CSR Institutions (accessible at http://icgem.gfz-potsdam.de/home, accessed on 15 May 2022). These coefficients are mainly used to calculate and analyze the changes of terrestrial water storage in the NCP.
Acknowledgments
We thank Yanqiang Wu and Guangli Su for providing the level data of 1960–2010s. Thanks to Associate Researcher Peng Peng and Shuo Zheng for their help in calculating and analyzing GRACE results. We thank CMOMOC for providing the GNSS data. Thanks to the CSR mechanism for providing the solved gravity field harmonic coefficients.
Conflicts of Interest
The authors declare no conflict of interest.
References
- Qin, H.; Cao, G.; Kristensen, M.; Refsgaard, J.C.; Rasmussen, M.O.; He, X.; Liu, J.; Shu, Y.; Zheng, C. Integrated hydrological modeling of the North China Plain and implications for sustainable water management. Hydrol. Earth Syst. Sci. 2013, 17, 3759–3778. [Google Scholar] [CrossRef]
- Wu, M.; Wu, J.; Liu, J.; Wu, J.; Zheng, C. Effect of groundwater quality on sustainability of groundwater resource: A case study in the North China Plain. J. Contam. Hydrol. 2015, 179, 132–147. [Google Scholar] [CrossRef] [PubMed]
- Ha, D.; Zheng, G.; Loáiciga, H.A.; Guo, W.; Zhou, H.; Chai, J. Long-term groundwater level changes and land subsidence in Tianjin, China. Acta Geotech. 2021, 16, 1303–1314. [Google Scholar] [CrossRef]
- Yang, W.; Long, D.; Scanlon, B.R.; Burek, P.; Zhang, C.; Han, Z.; Butler, J.J., Jr.; Pan, Y.; Lei, X.; Wada, Y. Human intervention will stabilize groundwater storage across the North China Plain. Water Resour. Res. 2022, 58, e2021WR030884. [Google Scholar] [CrossRef]
- Yi, L.X.; Wang, J.; Shao, C.Q.; Guo, J.W.; Jiang, Y.X.; Bo, L. Land Subsidence Disaster Survey and Its Economic Loss Assessment in Tianjin, China. Nat. Hazards Rev. 2010, 11, 35–41. [Google Scholar] [CrossRef]
- Ortega-Guerrero, A.; Rudolph, D.L.; Cherry, J.A. Analysis of long term land subsidence near Mexico City: Field investigations and predicitive modelling. Water Resour. Res. 1999, 35, 3327–3341. [Google Scholar] [CrossRef]
- Zhang, C.; Duan, Q.; Yeh, P.J.-F.; Pan, Y.; Gong, H.; Moradkhani, H.; Gong, W.; Lei, X.; Liao, W.; Xu, L. Sub-regional groundwater storage recovery in North China Plain after the South-to-North water diversion project. J. Hydrol. 2021, 597, 126156. [Google Scholar] [CrossRef]
- Sun, D.; Li, J.; Li, H.; Liu, Q.; Zhao, S.; Huang, Y.; Wu, Q.; Xie, X. Evolution of groundwater salinity and fluoride in the deep confined aquifers of Cangzhou in the North China plain after the South-to-North Water Diversion Project. Appl. Geochem. 2022, 147, 105485. [Google Scholar] [CrossRef]
- Jiang, Z.; Hsu, Y.J.; Yuan, L.; Yang, X.; Ding, Y.; Tang, M.; Chen, C. Characterizing spatiotemporal patterns of terrestrial water storage variations using GNSS vertical data in Sichuan, China. J. Geophys. Res. Solid Earth 2021, 126, e2021JB022398. [Google Scholar] [CrossRef]
- Pan, Y.; Shen, W.-B.; Shum, C.; Chen, R. Spatially varying surface seasonal oscillations and 3-D crustal deformation of the Tibetan Plateau derived from GPS and GRACE data. Earth Planet. Sci. Lett. 2018, 502, 12–22. [Google Scholar] [CrossRef]
- Wang, N.; Dong, J.; Wang, Z.G.; Lei, J.F.; Zhang, L.; Liao, M.S. Monitoring Large-Scale Hydraulic Engineering Using Sentinel-1 InSAR: A Case Study of China’s South-to-North Water Diversion Middle Route Project. IEEE J. Sel. Top. Appl. Earth Obs. Remote Sens. 2022, 15, 739–750. [Google Scholar] [CrossRef]
- Feng, W.; Zhong, M.; Lemoine, J.M.; Biancale, R.; Hsu, H.T.; Xia, J. Evaluation of groundwater depletion in North China using the Gravity Recovery and Climate Experiment (GRACE) data and ground-based measurements. Water Resour. Res. 2013, 49, 2110–2118. [Google Scholar] [CrossRef]
- Li, M.; Sun, J.; Xue, L.; Shen, Z.; Zhao, B.; Hu, L. Characterization of Aquifer System and Groundwater Storage Change Due to South-to-North Water Diversion Project at Huairou Groundwater Reserve Site, Beijing, China, Using Geodetic and Hydrological Data. Remote Sens. 2022, 14, 3549. [Google Scholar] [CrossRef]
- Feng, W.; Wang, C.; Mu, D.; Zhong, M.; Zhong, Y.; Xu, H. Groundwater storage variations in the North China Plain from GRACE with spatial constraints. Chin. J. Geophsics 2017, 60, 1630–1642. [Google Scholar]
- Huang, Z.; Pan, Y.; Gong, H.; Yeh, P.J.F.; Li, X.; Zhou, D.; Zhao, W. Subregional-scale groundwater depletion detected by GRACE for both shallow and deep aquifers in North China Plain. Geophys. Res. Lett. 2015, 42, 1791–1799. [Google Scholar] [CrossRef]
- Jiang, L.; Bai, L.; Zhao, Y.; Cao, G.; Wang, H.; Sun, Q. Combining InSAR and hydraulic head measurements to estimate aquifer parameters and storage variations of confined aquifer system in Cangzhou, North China Plain. Water Resour. Res. 2018, 54, 8234–8252. [Google Scholar] [CrossRef]
- Wang, L.S.; Chen, C.; Du, J.S.; Wang, T.Q. Detecting seasonal and long-term vertical displacement in the North China Plain using GRACE and GPS. Hydrol. Earth Syst. Sci. 2017, 21, 2905–2922. [Google Scholar] [CrossRef]
- Chen, B.; Gong, H.; Li, X.; Lei, K.; Zhang, Y.; Li, J.; Gu, Z.; Dang, Y. Spatial-temporal characteristics of land subsidence corresponding to dynamic groundwater funnel in Beijing Municipality, China. Chin. Geogr. Sci. 2011, 21, 753–764. [Google Scholar] [CrossRef]
- Bai, L.; Jiang, L.; Zhao, Y.; Li, Z.; Cao, G.; Zhao, C.; Liu, R.; Wang, H. Quantifying the influence of long-term overexploitation on deep groundwater resources across Cangzhou in the North China Plain using InSAR measurements. J. Hydrol. 2022, 605, 127368. [Google Scholar] [CrossRef]
- Wang, M.; Shen, Z.K. Present-day crustal deformation of continental China derived from GPS and its tectonic implications. J. Geophys. Res. Solid Earth 2020, 125, e2019JB018774. [Google Scholar] [CrossRef]
- Lyard, F.; Lefevre, F.; Letellier, T.; Francis, O. Modelling the global ocean tides: Modern insights from FES2004. Ocean Dyn. 2006, 56, 394–415. [Google Scholar] [CrossRef]
- Böhm, J.; Niell, A.; Tregoning, P.; Schuh, H. Global Mapping Function (GMF): A new empirical mapping function based on numerical weather model data. Geophys. Res. Lett. 2006, 33, L07304. [Google Scholar] [CrossRef]
- Dill, R.; Dobslaw, H. Numerical simulations of global-scale high-resolution hydrological crustal deformations. J. Geophys. Res. Solid Earth 2013, 118, 5008–5017. [Google Scholar] [CrossRef]
- Blewitt, G.; Lavallée, D. Effect of annual signals on geodetic velocity. J. Geophys. Res. Solid Earth 2002, 107, ETG 9-1–ETG 9-11. [Google Scholar] [CrossRef]
- Agnieszka, W.; Dawid, K. Modeling seasonal oscillations in GNSS time series with Complementary Ensemble Empirical Mode Decomposition. GPS Solut. 2022, 26, 101. [Google Scholar] [CrossRef]
- Blewitt, G.; Lavallée, D.; Clarke, P.; Nurutdinov, K. A new global mode of Earth deformation: Seasonal cycle detected. Science 2001, 294, 2342–2345. [Google Scholar] [CrossRef]
- Sośnica, K.; Thaller, D.; Dach, R.; Jäggi, A.; Beutler, G. Impact of loading displacements on SLR-derived parameters and on the consistency between GNSS and SLR results. J. Geod. 2013, 87, 751–769. [Google Scholar] [CrossRef]
- Jiao, J.; Pan, Y.; Zhang, X.; Shum, C.K.; Zhang, Y.; Ding, H. Spatially heterogeneous nonlinear signal in Antarctic ice-sheet mass loss revealed by GRACE and GPS. Geophys. J. Int. 2022, 233, 826–838. [Google Scholar] [CrossRef]
- Chambers, D.P.; Bonin, J.A. Evaluation of Release-05 GRACE time-variable gravity coefficients over the ocean. Ocean Sci. 2012, 8, 859–868. [Google Scholar] [CrossRef]
- Swenson, S.; Chambers, D.; Wahr, J. Estimating geocenter variations from a combination of GRACE and ocean model output. J. Geophys. Res. Solid Earth 2008, 113, B08410. [Google Scholar] [CrossRef]
- Wahr, J.; Zhong, S. Computations of the viscoelastic response of a 3-D compressible Earth to surface loading: An application to Glacial Isostatic Adjustment in Antarctica and Canada. Geophys. J. Int. 2013, 192, 557–572. [Google Scholar]
- Wahr, J.; Molenaar, M.; Bryan, F. Time variability of the Earth’s gravity field: Hydrological and oceanic effects and their possible detection using GRACE. J. Geophys. Res. Solid Earth 1998, 103, 30205–30229. [Google Scholar] [CrossRef]
- Fu, Y.; Freymueller, J.T. Seasonal and long-term vertical deformation in the Nepal Himalaya constrained by GPS and GRACE measurements. J. Geophys. Res. Solid Earth 2012, 117, B03470. [Google Scholar] [CrossRef]
- Hao, M.; Wang, Q.; Shen, Z.; Cui, D.; Ji, L.; Li, Y.; Qin, S. Present day crustal vertical movement inferred from precise leveling data in eastern margin of Tibetan Plateau. Tectonophysics 2014, 632, 281–292. [Google Scholar] [CrossRef]
- Su, G.; Wu, Y.; Zhan, W.; Zheng, Z.; Chang, L.; Wang, J. Spatiotemporal evolution characteristics of land subsidence caused by groundwater depletion in the North China plain during the past six decades. J. Hydrol. 2021, 600, 126678. [Google Scholar] [CrossRef]
- Foster, S.; Garduno, H.; Evans, R.; Olson, D.; Tian, Y.; Zhang, W.; Han, Z. Quaternary aquifer of the North China Plain—Assessing and achieving groundwater resource sustainability. Hydrogeol. J. 2004, 12, 81–93. [Google Scholar] [CrossRef]
- Zhang, L.; Ge, D.; Guo, X.; Wang, Y.; Li, M. Land subsidence in Cangzhou over the last decade based on interferometric time series analysis. Shanghai Land Resour. 2014, 35, 72–75. [Google Scholar]
- Zhao, Q.; Zhang, B.; Yao, Y.; Wu, W.; Meng, G.; Chen, Q. Geodetic and hydrological measurements reveal the recent acceleration of groundwater depletion in North China Plain. J. Hydrol. 2019, 575, 1065–1072. [Google Scholar] [CrossRef]
- Tao, T.; Xie, G.; He, R.; Tao, Z.; Ma, M.; Gao, F.; Zhu, Y.; Qu, X.; Li, S. Groundwater Storage Variation Characteristics in North China before and after the South-to-North Water Diversion Project Based on GRACE and GPS Data. Water Resour. Res. 2023, 50, 58–67. [Google Scholar] [CrossRef]
- Xiong, J.; Yin, J.; Guo, S.; Yin, W.; Rao, W.; Chao, N.; Abhishek. Using GRACE to Detect Groundwater Variation in North China Plain after South–North Water Diversion. Groundwater 2023, 61, 402–420. [Google Scholar] [CrossRef]
- Long, D.; Yang, W.T.; Scanlon, B.R.; Zhao, J.S.; Liu, D.G.; Burek, P.; Pan, Y.; You, L.Z.; Wada, Y. South-to-North Water Diversion stabilizing Beijing’s groundwater levels. Nat. Commun. 2020, 11, 3665. [Google Scholar] [CrossRef] [PubMed]
- Guo, H.; Zhang, Z.; Cheng, G.; Li, W.; Li, T.; Jiao, J.J. Groundwater-derived land subsidence in the North China Plain. Environ. Earth Sci. 2015, 74, 1415–1427. [Google Scholar] [CrossRef]
- Yang, Y.; Zhang, D.; Quan, J.; Wang, P.; Xu, Y. Water quality assessment of Middle Route of South-North Water Diversion Project based on modified Nemerow index method. Water Supply 2021, 21, 1005–1015. [Google Scholar] [CrossRef]
- Lyu, M.; Ke, Y.; Guo, L.; Li, X.; Zhu, L.; Gong, H.; Constantinos, C. Change in regional land subsidence in Beijing after south-to-north water diversion project observed using satellite radar interferometry. Remote Sens. Environ. 2020, 57, 140–156. [Google Scholar] [CrossRef]
Figure 1.
Distribution of GNSS sites and leveling lines across the North China Plain. The colored circles represent GNSS stations and the color depicts observation duration of GNSS. Leveling points are denoted by crosses during three periods with blue for 1960–1980s, red for 1980–1990s, and green for 1990–2010s. The NCP region is highlighted in light orange. The purple line represents SNWD-C route. The inset map delineates the study region located in China.

Figure 2.
The average EWH time series of the whole NCP. The EWH time series is depicted by the blue line. The red and green dotted lines, respectively signify the trend of EWH with their values before and after the SNWD-C, respectively.
Figure 2.
The average EWH time series of the whole NCP. The EWH time series is depicted by the blue line. The red and green dotted lines, respectively signify the trend of EWH with their values before and after the SNWD-C, respectively.

Figure 3.
The average annual variation rates of EWH with their values for the northern, southern and whole NCP during the 2011–2015 (a) and 2015–2020 (b) periods, respectively. The northern and southern NCP is divided by the dashed black line.
Figure 3.
The average annual variation rates of EWH with their values for the northern, southern and whole NCP during the 2011–2015 (a) and 2015–2020 (b) periods, respectively. The northern and southern NCP is divided by the dashed black line.

Figure 4.
(a) The observed GNSS (gray dot) and GRACE (red star) time series. (b) The fitting results with non-tidal ocean and atmospheric effects removed at BJSH, TJWQ, HAHB and HELQ stations. The blue solid line and dotted line, respectively represent the fitted annual and semi-annual signals in the GNSS time series. The red solid line and dotted line, respectively represent the annual and semi-annual signals in the GRACE time series.

Figure 5.
Land deformation is observed by leveling data during the 1960–1980s (a), the 1980–1990s (b), and the 1990–2010s (c) periods, respectively.
Figure 5.
Land deformation is observed by leveling data during the 1960–1980s (a), the 1980–1990s (b), and the 1990–2010s (c) periods, respectively.

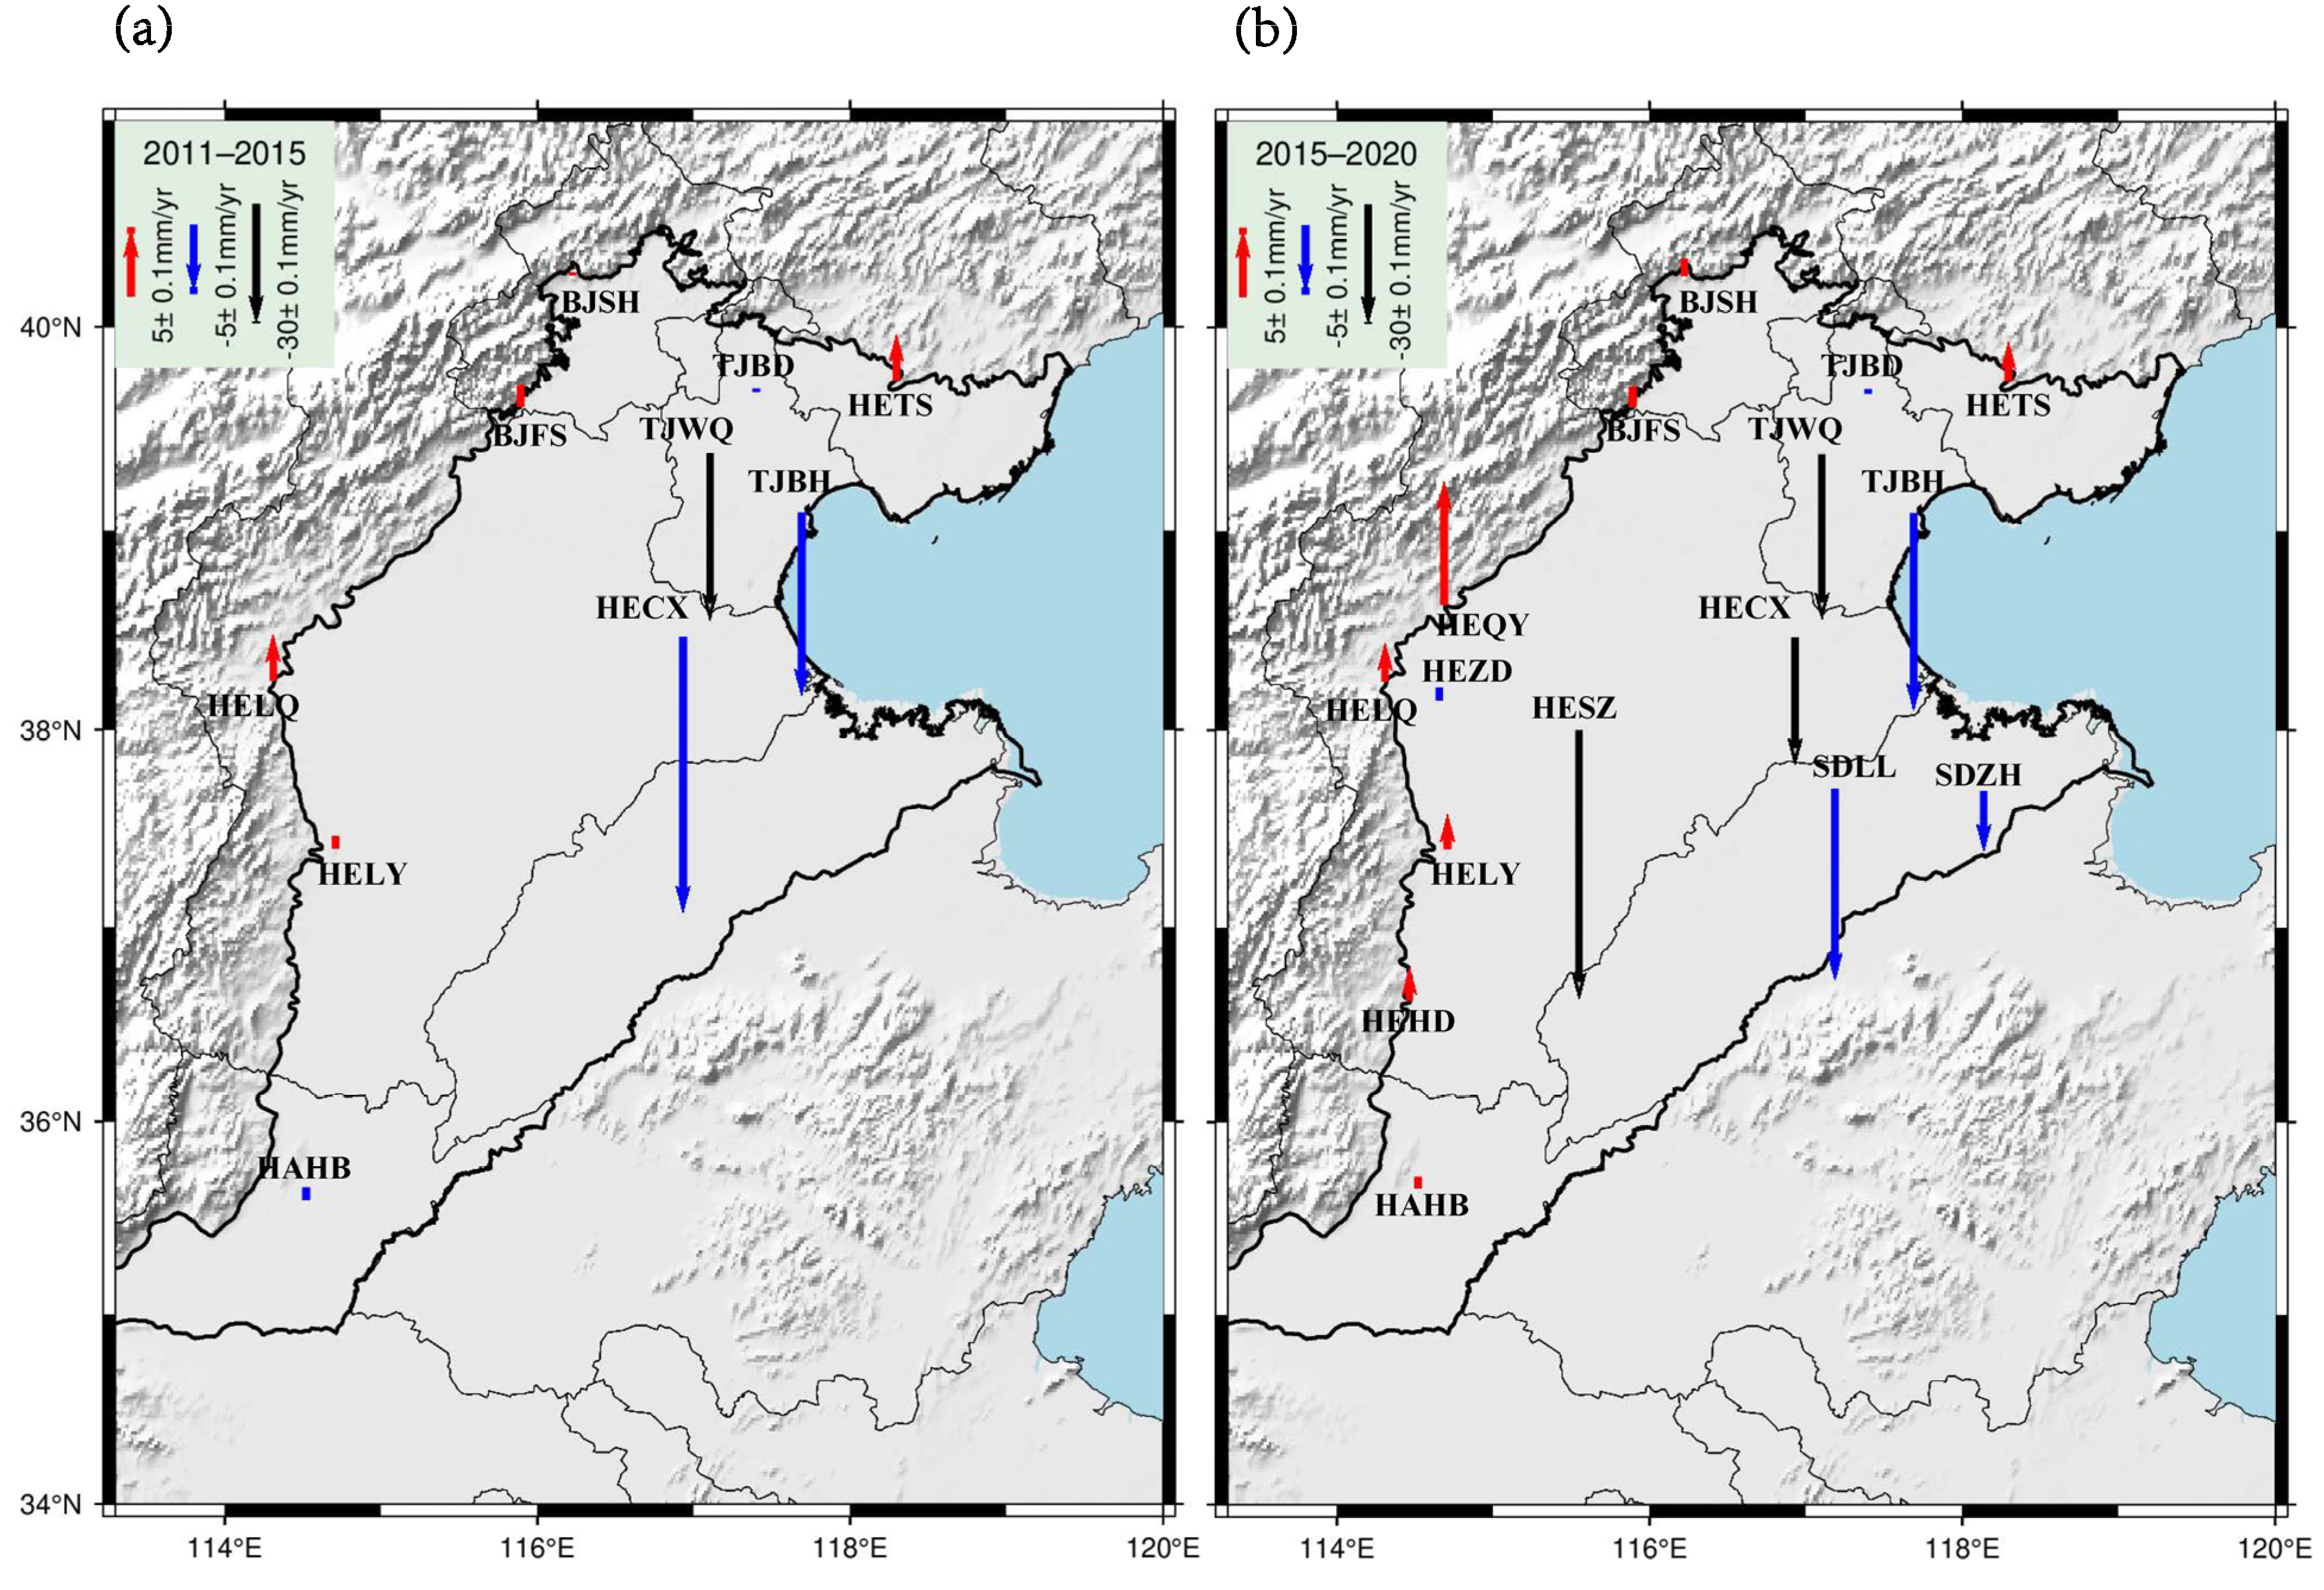
Figure 6.
The arrows represent the land deformation observed by GNSS data during the 2011–2015 (a) and the 2015–2020 (b) periods, respectively. (c) The serious land subsidence observed by GNSS stations named TJWQ, TJBH and HECX. The gray dots denote the GNSS time series. The red and green dashed lines, respectively represent the trend during the 2011–2015 and 2015–2020 periods.


Figure 7.
GNSS raw data and fitting results for stations BJFS, BJSH, TJBD, HELQ, HELY, HETS and HAHB. The gray dots denote the GNSS time series. The red and green dashed lines, respectively represent the trends during the 2011–2015 and 2015–2020 periods.
Figure 7.
GNSS raw data and fitting results for stations BJFS, BJSH, TJBD, HELQ, HELY, HETS and HAHB. The gray dots denote the GNSS time series. The red and green dashed lines, respectively represent the trends during the 2011–2015 and 2015–2020 periods.


Table 1.
Equivalent water height (EWH) change, surface displacement caused by water mass migration (SDWM), and the trend calculated with GNSS.
Table 1.
Equivalent water height (EWH) change, surface displacement caused by water mass migration (SDWM), and the trend calculated with GNSS.
| Station Name | 2011–2015 | 2015–2020 | ||||
|---|---|---|---|---|---|---|
| EWH cm/yr | SDWM mm/yr | Motion Rate mm/yr | EWH cm/yr | SDWM mm/yr | Motion Rate mm/yr | |
| BJFS | −0.18 0.76 | −0.33 0.29 | .08 | 0.35 0.35 | −0.40 0.18 | 1.57 0.72 |
| BJSH | 0.03 0.80 | −0.40 0.30 | 0.23 1.12 | 0.44 0.34 | −0.41 0.18 | .92 |
| TJBD | −0.15 0.78 | −0.35 0.30 | −0.22 1.04 | 0.43 0.35 | −0.41 0.18 | −0.32 0.76 |
| TJBH | −0.34 0.73 | −0.29 0.29 | −13.88 1.60 | 0.38 0.36 | −0.40 0.19 | −14.92 1.44 |
| TJWQ | −0.26 0.75 | −0.31 0.29 | −42.11 2.10 | 0.38 0.36 | −0.40 0.18 | −.07 |
| HECX | −0.56 0.69 | −0.23 0.27 | −20.93 1.08 | 0.26 0.38 | −0.38 0.19 | −32.27 1.10 |
| HELQ | −0.63 0.67 | −0.20 0.26 | 3.46 0.95 | 0.16 0.38 | −0.37 0.18 | 2.85 0.75 |
| HELY | −0.94 0.65 | −0.13 0.26 | 0.96 1.08 | 0.07 0.41 | −0.35 0.19 | 2.57 0.72 |
| HETS | −0.13 0.78 | −0.36 0.30 | 3.48 1.09 | 0.48 0.35 | −0.42 0.19 | 2.95 0.80 |
| HAHB | −1.27 0.69 | −0.05 0.26 | −0.96 0.89 | 0.02 0.46 | −0.35 0.19 | 0.84 0.62 |
| SDLL | −0.77 0.65 | −0.17 0.26 | 0.19 0.40 | −0.37 0.19 | −14.49 0.91 | |
| SDZH | −0.70 0.64 | −0.23 0.27 | 0.27 0.39 | 0.38 0.20 | −4.55 0.87 | |
| HESZ | −0.75 0.66 | −0.18 0.26 | 0.14 0.39 | −0.36 0.19 | −67.94 1.21 | |
| HEQY | −0.51 0.69 | −0.23 0.27 | 0.20 0.38 | −0.37 0.18 | 9.3 0.86 | |
| HEHD | −1.14 0.65 | −0.08 0.26 | 0.03 0.43 | −0.35 0.19 | 2.48 1.12 | |
| HEZD | −0.66 0.67 | −0.19 0.26 | 0.15 0.38 | −0.37 0.18 | −0.98 0.89 | |
Disclaimer/Publisher’s Note: The statements, opinions and data contained in all publications are solely those of the individual author(s) and contributor(s) and not of MDPI and/or the editor(s). MDPI and/or the editor(s) disclaim responsibility for any injury to people or property resulting from any ideas, methods, instructions or products referred to in the content. |
© 2023 by the authors. Licensee MDPI, Basel, Switzerland. This article is an open access article distributed under the terms and conditions of the Creative Commons Attribution (CC BY) license (https://creativecommons.org/licenses/by/4.0/).
Share and Cite
MDPI and ACS Style
Wang, J.; Ding, K.; Chen, X.; Guo, R.; Sun, H. Influence of South-to-North Water Diversion on Land Subsidence in North China Plain Revealed by Using Geodetic Measurements. Remote Sens. 2024, 16, 162. https://doi.org/10.3390/rs16010162
AMA Style
Wang J, Ding K, Chen X, Guo R, Sun H. Influence of South-to-North Water Diversion on Land Subsidence in North China Plain Revealed by Using Geodetic Measurements. Remote Sensing. 2024; 16(1):162. https://doi.org/10.3390/rs16010162
Chicago/Turabian StyleWang, Jingqi, Kaihua Ding, Xiaodong Chen, Rumeng Guo, and Heping Sun. 2024. "Influence of South-to-North Water Diversion on Land Subsidence in North China Plain Revealed by Using Geodetic Measurements" Remote Sensing 16, no. 1: 162. https://doi.org/10.3390/rs16010162
Note that from the first issue of 2016, this journal uses article numbers instead of page numbers. See further details here.