
Assessment of the GNSS-RTK for Application in Precision Forest Operations

Division of Forest Sciences, College of Forest and Environmental Sciences, Kangwon National University, Chuncheon 24341, Republic of Korea
*
Author to whom correspondence should be addressed.
†
These authors contributed equally to this work.
Remote Sens. 2024, 16(1), 148; https://doi.org/10.3390/rs16010148
Submission received: 15 October 2023
/
Revised: 7 December 2023
/
Accepted: 26 December 2023
/
Published: 29 December 2023
(This article belongs to the Special Issue Remote Sensing of Forest and Wetland Hydrology)
Abstract
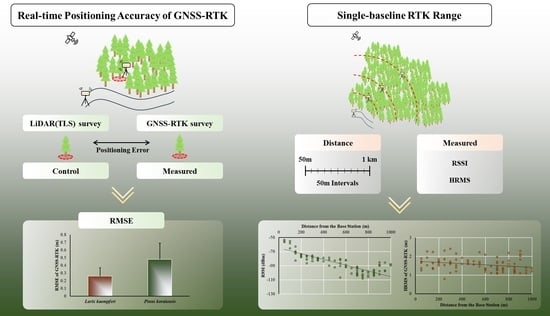
:A smart thinning operation refers to an advanced method of selecting and cutting trees to be thinned based on digitally captured forest information. In smart thinning operations, workers use the coordinates of individual trees to navigate to the target trees for thinning. However, it is difficult to accurately locate individual trees in a forest stand covered with a canopy, necessitating a precise real-time positioning system that can be used in the forest. Therefore, this study aimed to evaluate the applicability of the global navigation satellite system real-time kinematic (GNSS-RTK) device in a forest stand through analysis of its positioning accuracy within the forest environment and evaluation of the operational range of the single-baseline RTK based on analysis of the positioning precision and radio signal strength index (RSSI) change with increasing distance from the base station. The results showed that the root mean square error (RMSE) of the horizontal positioning error was highly accurate, with an average of 0.26 m in Larix kaempferi stands and 0.48 m in Pinus koraiensis stands. The RSSI decreased to a minimum of −103.3 dBm within 1 km of distance from the base station; however, this had no significant impact on the horizontal positioning precision. The conclusion is that the GNSS-RTK is suitable for use in smart thinning operations.
1. Introduction
Recently, precision forest operations that utilize advanced technologies such as artificial intelligence, remote exploration, artificial satellites, and automatic sensors have been rapidly applied within the forestry industry following the Forestry 4.0 trend [1,2,3]. In South Korea, conventional forest thinning operations consist of a forest stand survey, followed by the selection of trees to be thinned, and finally the cutting down of the selected trees. This process requires a large number of personnel for each step, and as the thinning area increases, the survey and operational costs increase exponentially [4,5]. In contrast, smart thinning operations consist of processes such as conducting precise forest resource surveys, constructing 3D forest inventories, selecting trees for thinning, navigating to the selected trees, and cutting the selected trees [6,7]. If the necessary high-precision sensor equipment is available for each task, a minimal number of workers will be able to execute even larger-scale operations, allowing for greater accuracy and efficiency.
The first stage of a smart thinning operation is conducting a forest stand survey. A precise forest stand survey involves spatial scanning using terrestrial and aerial light detection and ranging (LiDAR) technology to acquire point cloud data (PCD) for the forest stand [8,9]. The acquired PCD is processed to construct a 3D forest inventory model [10]. Various algorithms have been developed to extract information about the forest stand from the 3D forest inventory, such as individual tree location coordinates, diameter at breast height (DBH), tree height, a digital elevation model (DEM), canopy width, tree shape, and slope gradient [11,12,13]. Using these extracted data, crown competition factor can be calculated, and tree crown classes can be classified. Subsequently, machine learning techniques are employed to select trees for thinning that can maximize the thinning effect within the desired thinning intensity [14]. After the selection of trees to be thinned, workers use a real-time positioning system to accurately navigate to the selected area and then cut down the target trees.
In traditional thinning operations in South Korea, selected trees to be thinned are marked or flagged, allowing workers to easily identify them [15]. However, in smart thinning operations, trees selected for thinning are not directly marked on site; therefore, it is imperative for workers to rely on an accurate real-time positioning system to locate their own positions and navigate to the trees selected for thinning [16].
The positioning system primarily used in forestry is a portable global navigation satellite system (GNSS) receiver as a standalone [17]. A GNSS is a satellite navigation device that determines the coordinates on Earth by receiving signals, either C/A code or P code (L1/L2), from satellites and processing them [18]. For the GNSS to calculate a position, signals from at least four satellites are required; if the signal is interrupted, it can induce a decrease in positioning accuracy. Although the GNSS is the most commonly used positioning system in devices including mobile phones and vehicles, it has limitations in areas with many obstacles between the satellite and receiver, such as mines, tunnels, and forests [19]. In such environments, the occurrence of multipath errors makes it challenging to achieve high positional accuracy [20]. To enhance the positioning precision and reliability and improve the ambiguity resolution of GNSS in challenging environments, various mathematical models can be applied, such as a composite stochastic model and cycle slip detection and repairing models [21,22].
The real-time kinematic (RTK) GNSS is a solution developed to compensate for errors caused by the Earth’s atmosphere, which affects signals transmitted from satellites when using GNSS for standalone positioning [23]. By addressing the calculation errors caused by signal interference from the atmosphere, a real-time navigation device can achieve accuracy up to the centimeter level. To use the single-baseline GNSS-RTK, two GNSS receivers are required: a base station and a rover. The base station is placed at a predetermined coordinate point and calculates the error values of the satellite signals in real time to produce correction data [24]. Simultaneously, the base station communicates with the rover via radio signals, transmitting the correction data in real time, which allows the rover to better estimate ambiguities when calculating its position. Typically, to cover the low power requirement and broad communication range, radio signals utilize the low-frequency range of 403–473 MHz, which is known to have a maximum communication range of approximately 10 km [25,26]. As the distance between the rover and base station or interference from obstacles increases, the radio signal strength index (RSSI) decreases. For the radio modems used in the GNSS-RTK, signals can generally be received from −20 dBm to −120 dBm [27]. In forests, the presence of tree leaves, trunks and terrain reduces radio communication [28]. Therefore, to effectively utilize the GNSS-RTK in forest operation, the communication range of RTK in a forest must be determined at which the signal transmitted from the base station can be received at the rover by accounting for the RSSI value.
It is essential that the equipment applied in forestry operations be user-friendly for the operator and cost-competitive. In this respect, due to the advantages that GNSS-RTK offers, such as high precision, portability, and user-friendliness, it was considered a suitable positioning solution for a smart thinning operation. Furthermore, it can be relatively cost-effective compared to other high-performance navigation systems. However, there is a lack of research evaluating the real-time positioning accuracy and RTK radio signal communication of the GNSS-RTK in forest stands. Therefore, this study focused on the applicability of the GNSS-RTK for real-time positioning within forest stands.
This study aimed to evaluate the suitability of the GNSS-RTK in a forest stand through (1) analysis of positioning accuracy and its relationship with the forest environment and (2) determination of the operational range of the single-baseline RTK by analyzing the positioning precision and RSSI change with increasing distance from the base station.
2. Materials and Methods
2.1. Experimental Design
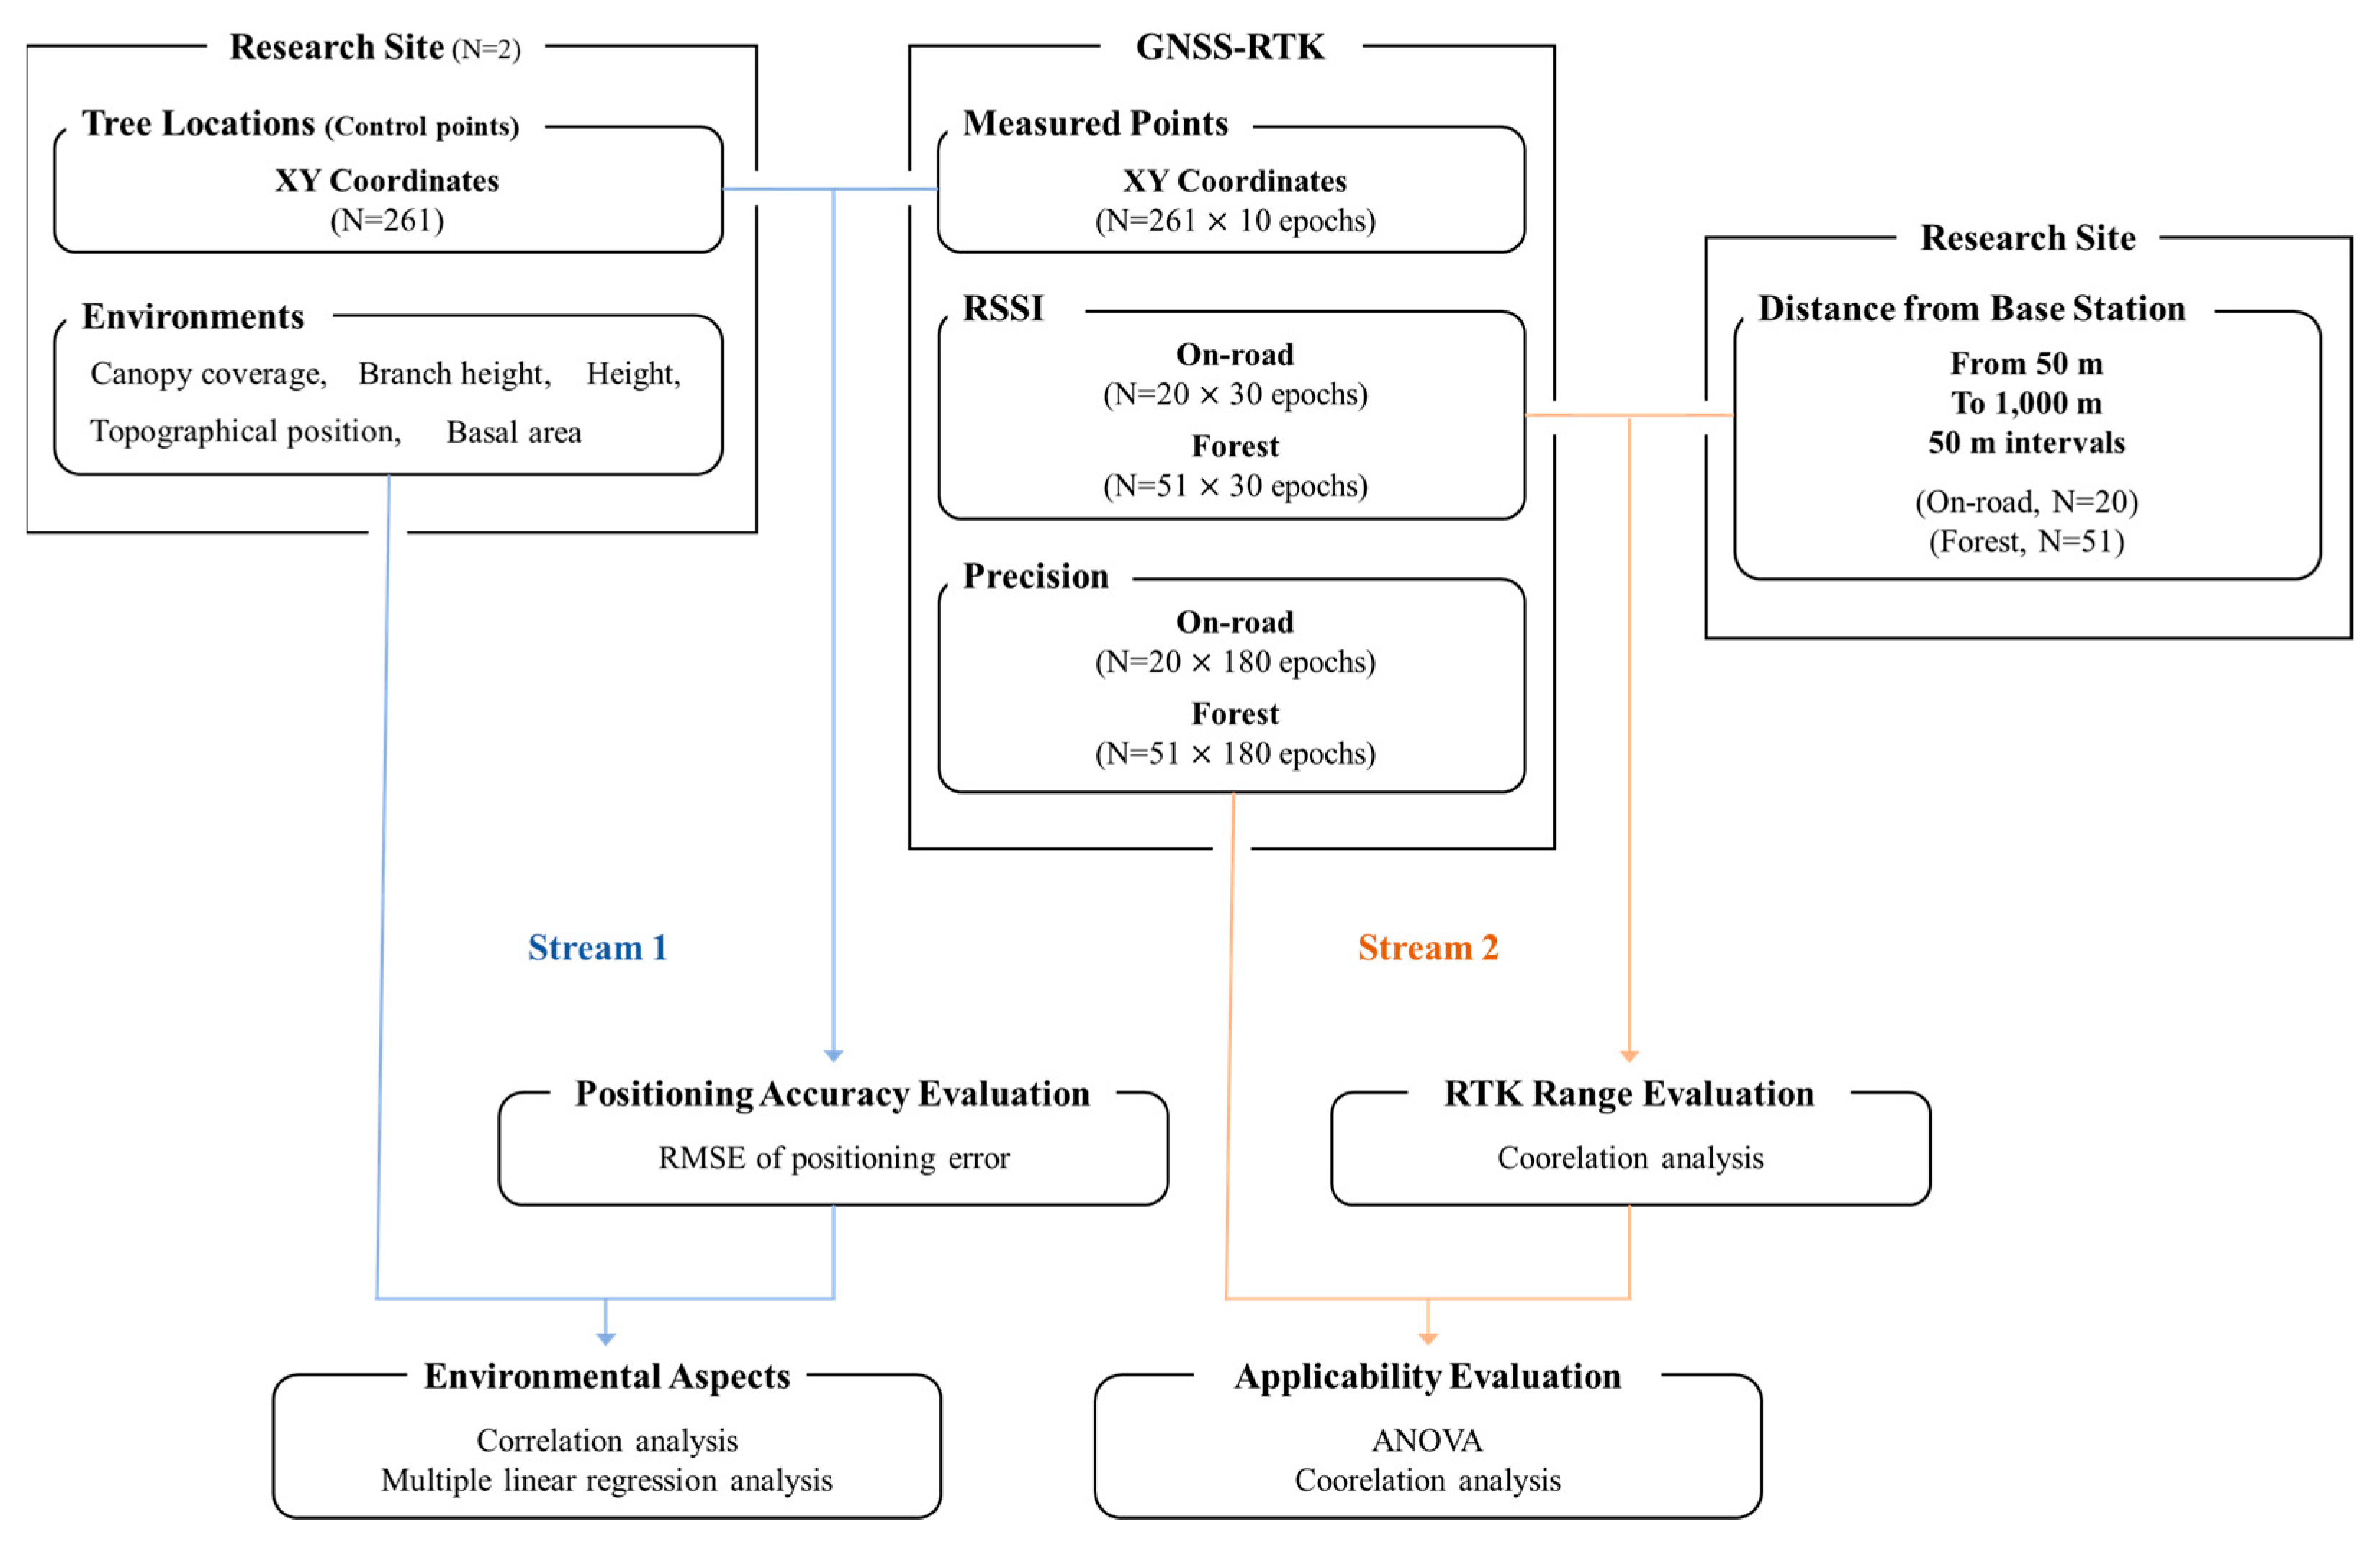
To evaluate the applicability of the GNSS-RTK in forest operations, two main experimental streams—positioning accuracy evaluation and RTK range evaluation—were established in the research design (Figure 1). In Stream 1, the positioning accuracy of the GNSS-RTK was evaluated using the root mean square error (RMSE) of the positioning error, and the environmental aspects were considered by analyzing the relationship between the positioning accuracy and forest environmental factors. In Stream 2, the available RTK range of the GNSS-RTK, that is, the available radio signal transmission and reception range between the rover and base station, was evaluated based on the change in the RSSI as the rover’s distance from the base station increased. Furthermore, the influence of the RSSI on positioning precision was statistically analyzed.
2.2. Study Site
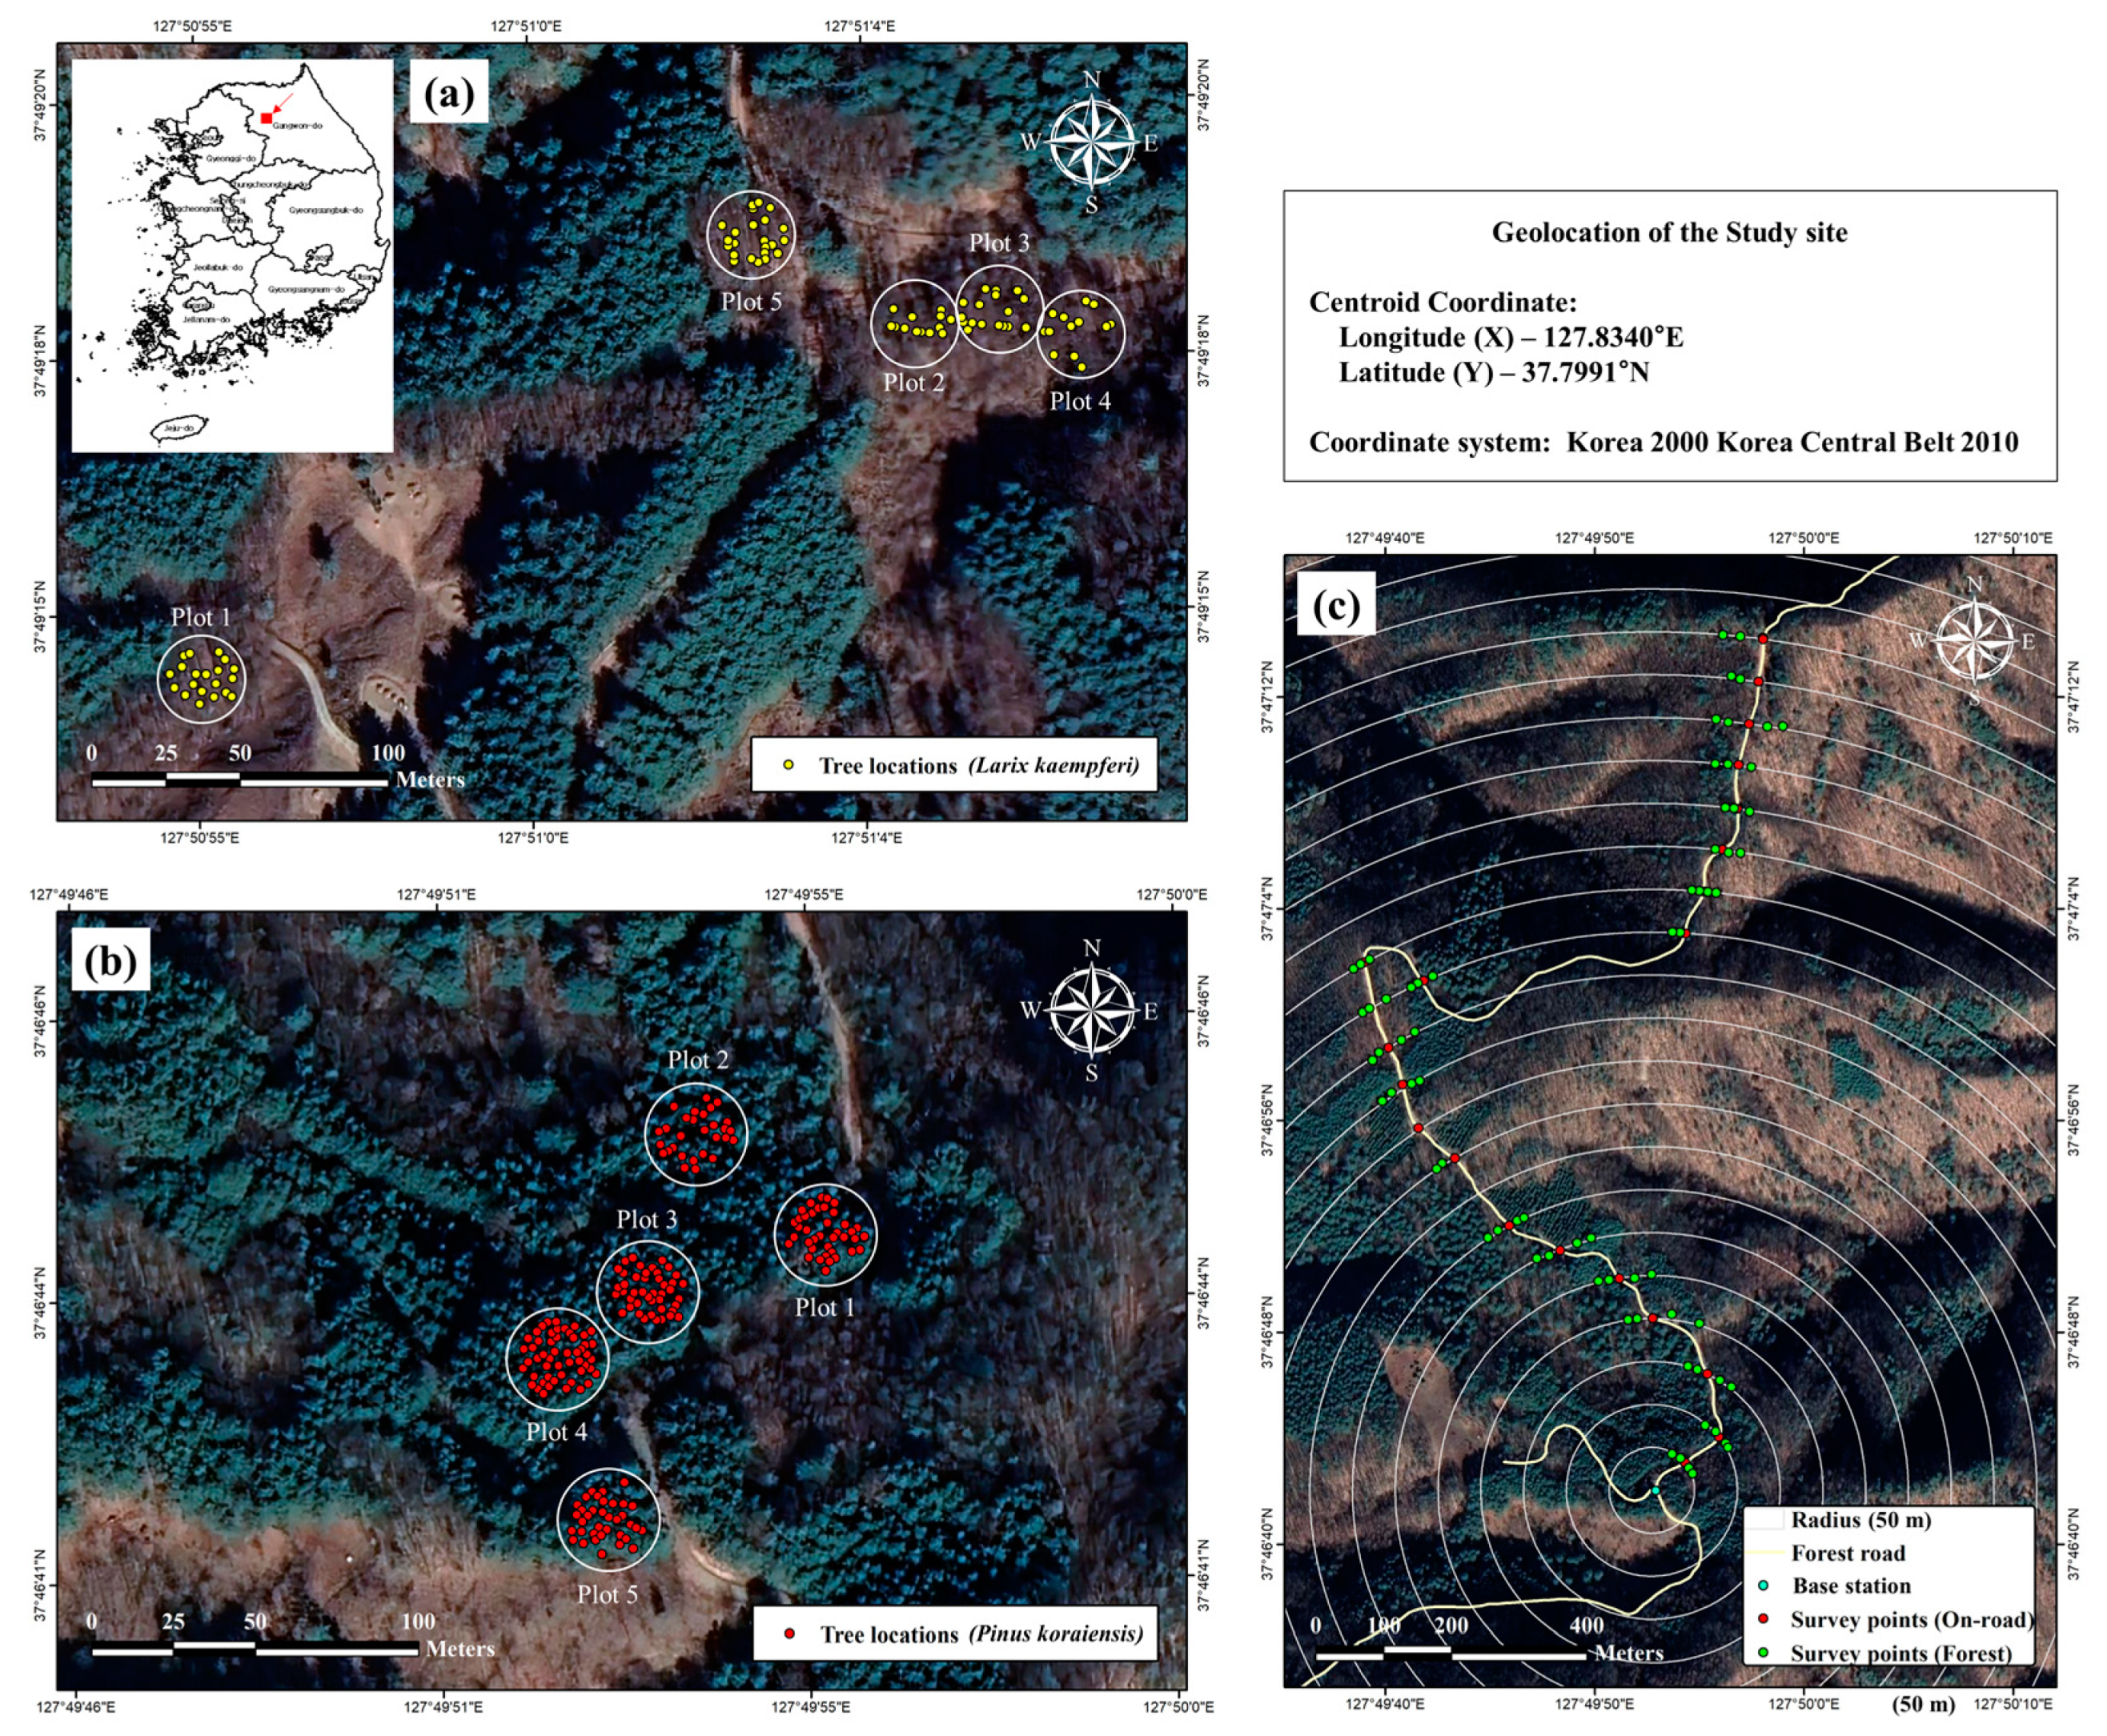
This study was conducted in August 2022 in the experimental forest of Kangwon National University, Republic of Korea (Figure 2). Two study sites were selected for each research stream according to the experiment design. The geolocation of an appropriate study site is longitude 127.834°E and latitude 37.7991°N at a projected coordinate system of “Korea 2000 Korea Central Belt 2010”. For Stream 1, five research plots were allocated to each of the two tree species, Larix kaempferi and Pinus koraiensis, which are representative coniferous species in South Korea. The area of each plot was approximately 0.04 ha, established by a circular plot with a diameter of 11.3 m. Stream 2 was conducted using sample points on the forest road and inside the forest. Sample points were selected along the forest road, starting from a point where the GNSS-RTK base station was installed and extending to a radius of 1000 m at intervals of 50 m.
The study plots in Stream 1 showed different forest characteristics for each species (Table 1). In the P. koraiensis plots, the average stand density was 1025 trees/ha, which was higher than the 430 trees/ha density in the L. kaempferi plots. The canopy coverage for both species was approximately 70%. The average diameter at breast height (DBH) and tree height in the L. kaempferi plots were approximately 33 cm and 26 m, respectively, which were higher than the average values of 28 cm and 19 m in the Pinus koraiensis plots.
2.3. Real-Time Positioning Accuracy Evaluation of the GNSS-RTK
In Stream 1, the locations of all trees in the study plots were surveyed using the GNSS-RTK in real time, and the positioning error was calculated for every epoch by second for individual trees. The control points of the individual trees used to calculate the positioning error were provided by Kangwon National University. The control data was obtained by LiDAR survey using a static terrestrial LiDAR sensor, BLK360 (Lecia, Wetzlar, Land Hessen—Germany). The static LiDAR survey was conducted on a total of 9 survey points at each research plot, and the collected point cloud data was registered with ground control points investigated at each survey point using GNSS-RTK static survey. The method of estimating tree positions using terrestrial laser scanning data is known to having high and reliable accuracy about 0.01 m of RMSE [29]. Furthermore, the relationship between the positioning accuracy of the GNSS-RTK and the forest environment was statistically analyzed.
2.3.1. Positioning Survey
The GNSS-RTK equipment used in this study was the R12i model (Trimble Inc., Westminster, CO, USA) (Table 2). To construct a single-baseline RTK system, two devices were utilized: one as the base station and the other as the rover. A base station was installed near the study plots for each species.
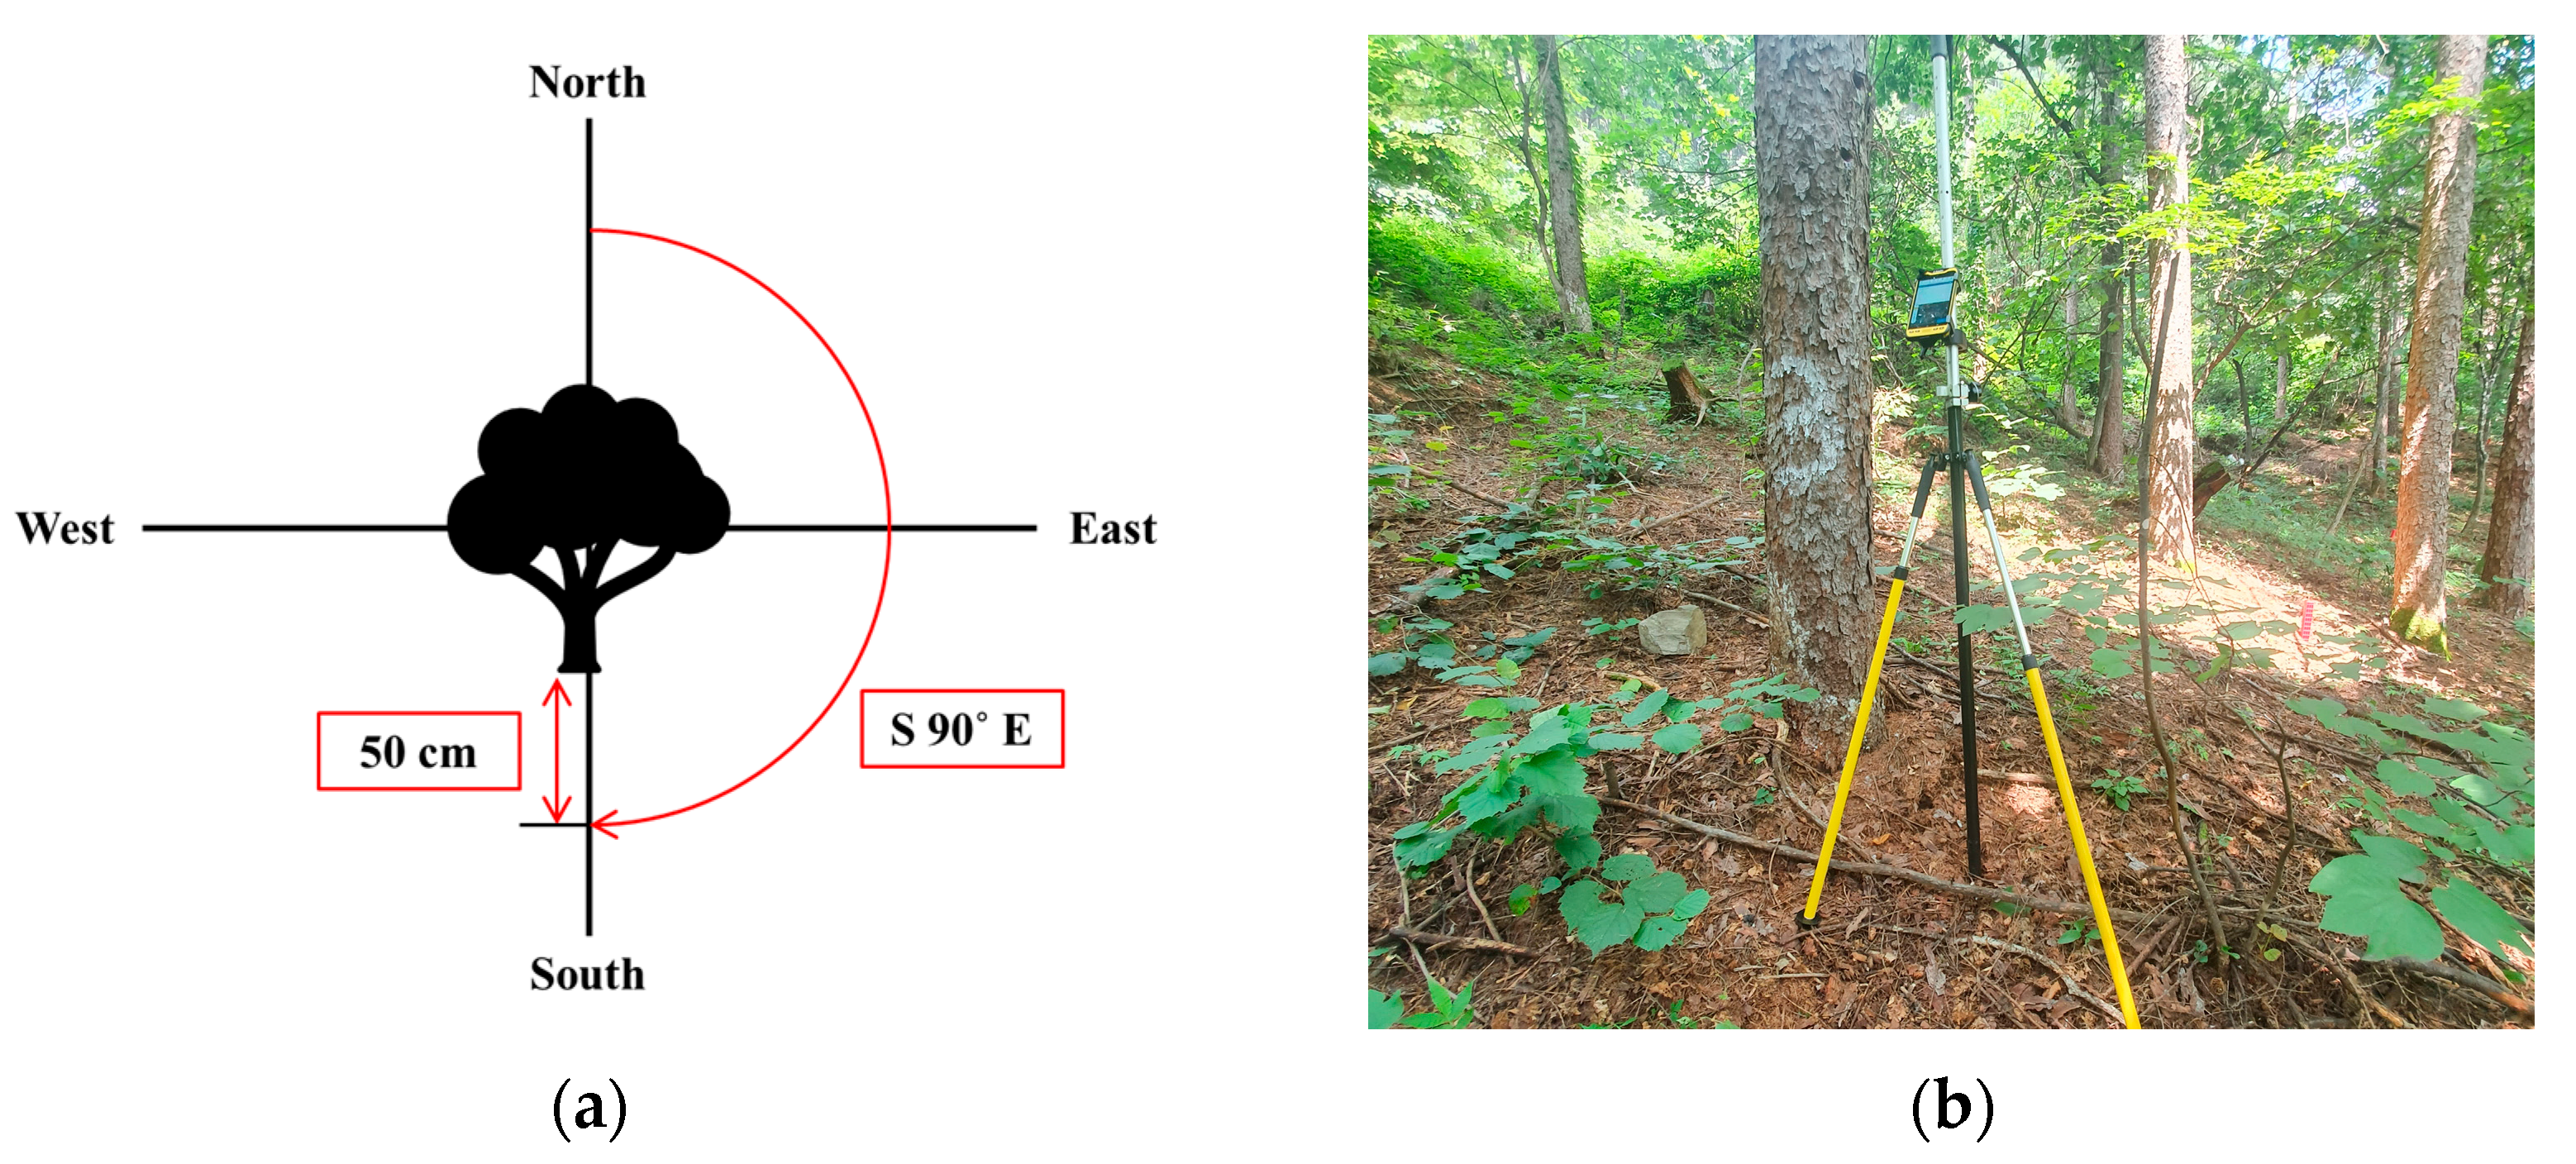
All individual tree locations in the study plots were surveyed using the GNSS-RTK. To operate the GNSS-RTK accurately, the device must not get too close to the tree trunk because the closer the device is to the tree trunk, the fewer satellites the device can obtain a signal from. Accordingly, the survey location of a single tree was determined at a consistent distance of 50 cm in the direction of azimuth angle 180° from the tree (Figure 3). The measured XY coordinates of trees were post-processed after the survey by being shifted 50 cm in the direction of azimuth angle 0° to acquire the actual XY coordinates of the individual trees.
The positioning data were acquired for 10 epochs, starting when the device arrived at the survey points. As this study aimed to evaluate the real-time accuracy, the positioning data at each epoch were used as independent measurements of the GNSS-RTK for the target trees. During the survey, the option of ‘allowed precision’ of the rover device was set to 10 m horizontal and 15 m vertical to acquire actual real-time positioning data within a wide range of precision allowed, without missing a single epoch.
2.3.2. Forest Environment Survey
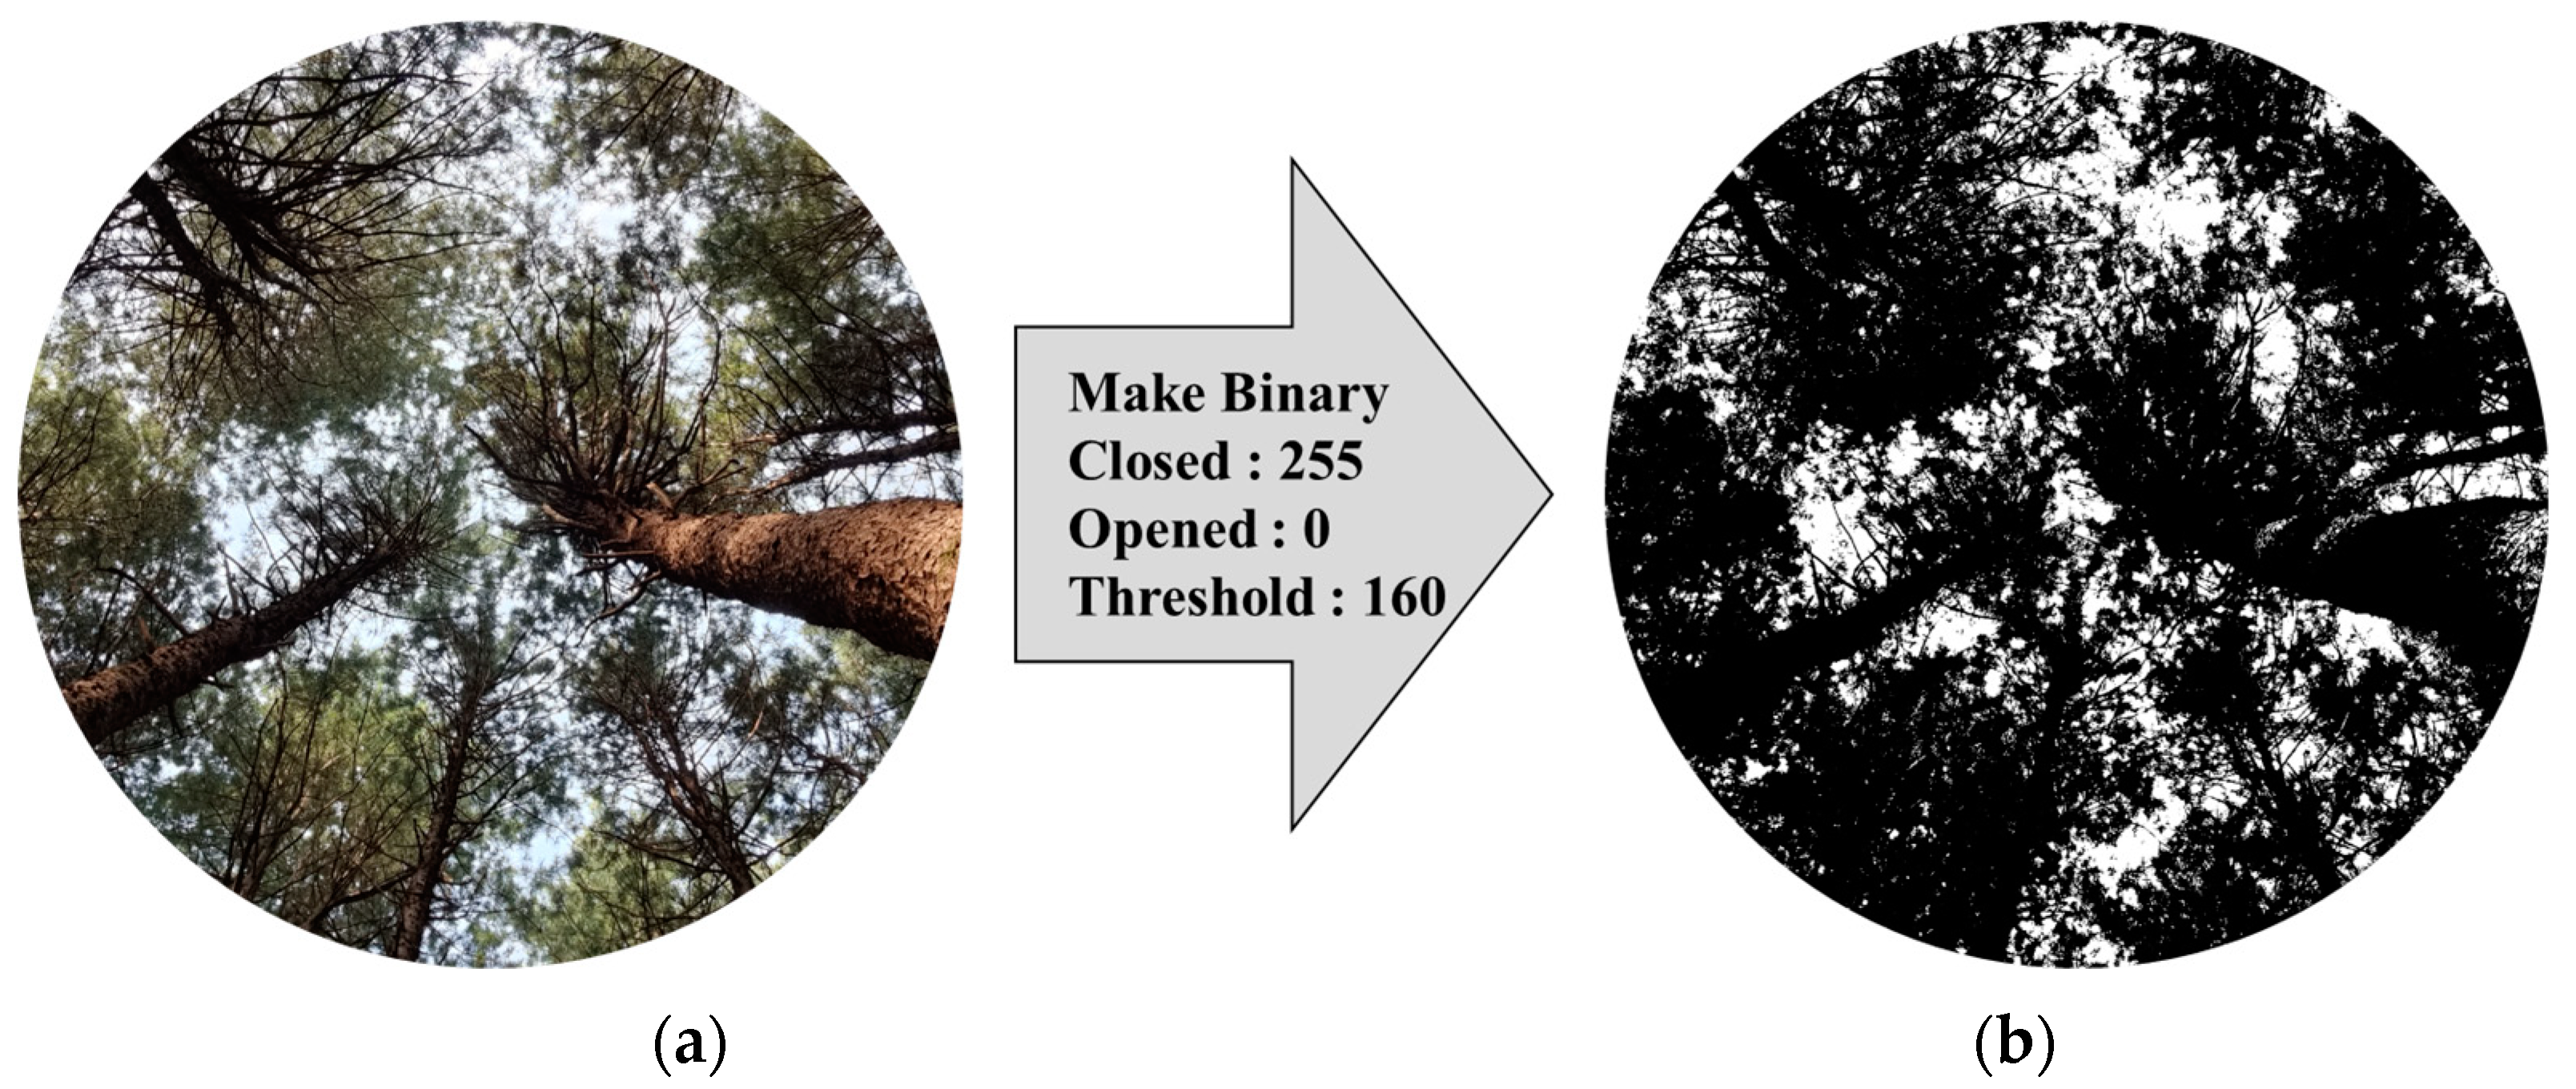
Five forest environment factors (DBH, tree height, branch height, canopy coverage, and topographical position index [TPI]) were measured to analyze the impact of the forest environment on the poisoning accuracy of the GNSS-RTK. The DBH was measured using a D-tape, whereas tree height and branch height were measured using a Vertex Laser Geo device (Haglöf AB, Borlange, Dalarna, Sweden). Canopy coverage was measured by taking overhead photographs at the same height as the rover from the position where the coordinates were measured using a wide-angle lens. The overhead photos were then converted to binary images with the sky represented in white and the canopy in black; the threshold value of the binary image was 160 (Figure 4). Canopy coverage was calculated as the ratio of the number of black cells to the total number of imaged cells as follows (Equation (1)):
TPI indicates the elevation difference of a certain cell from the surrounding cells within the raster map. A positive value of TPI corresponds to ridges, a negative value to valleys, and a zero value to flat or plain terrain [30]. The TPI data for each tree were acquired using a spatial analysis method. First, a digital elevation model (DEM) of the research site was created in a 1 m × 1 m resolution using a digital topographic map. Subsequently, the TPI was calculated through raster calculation at the surveyed point of each tree (Equation (2)). The QGIS 3.30.2 program (QGIS.ORG, Boschacherstrasse, Gossau, Switzerland) was used for TPI data acquisition.
where is the elevation value of the raster and m is the total number of surrounding points employed.
2.3.3. Positioning Accuracy Analysis
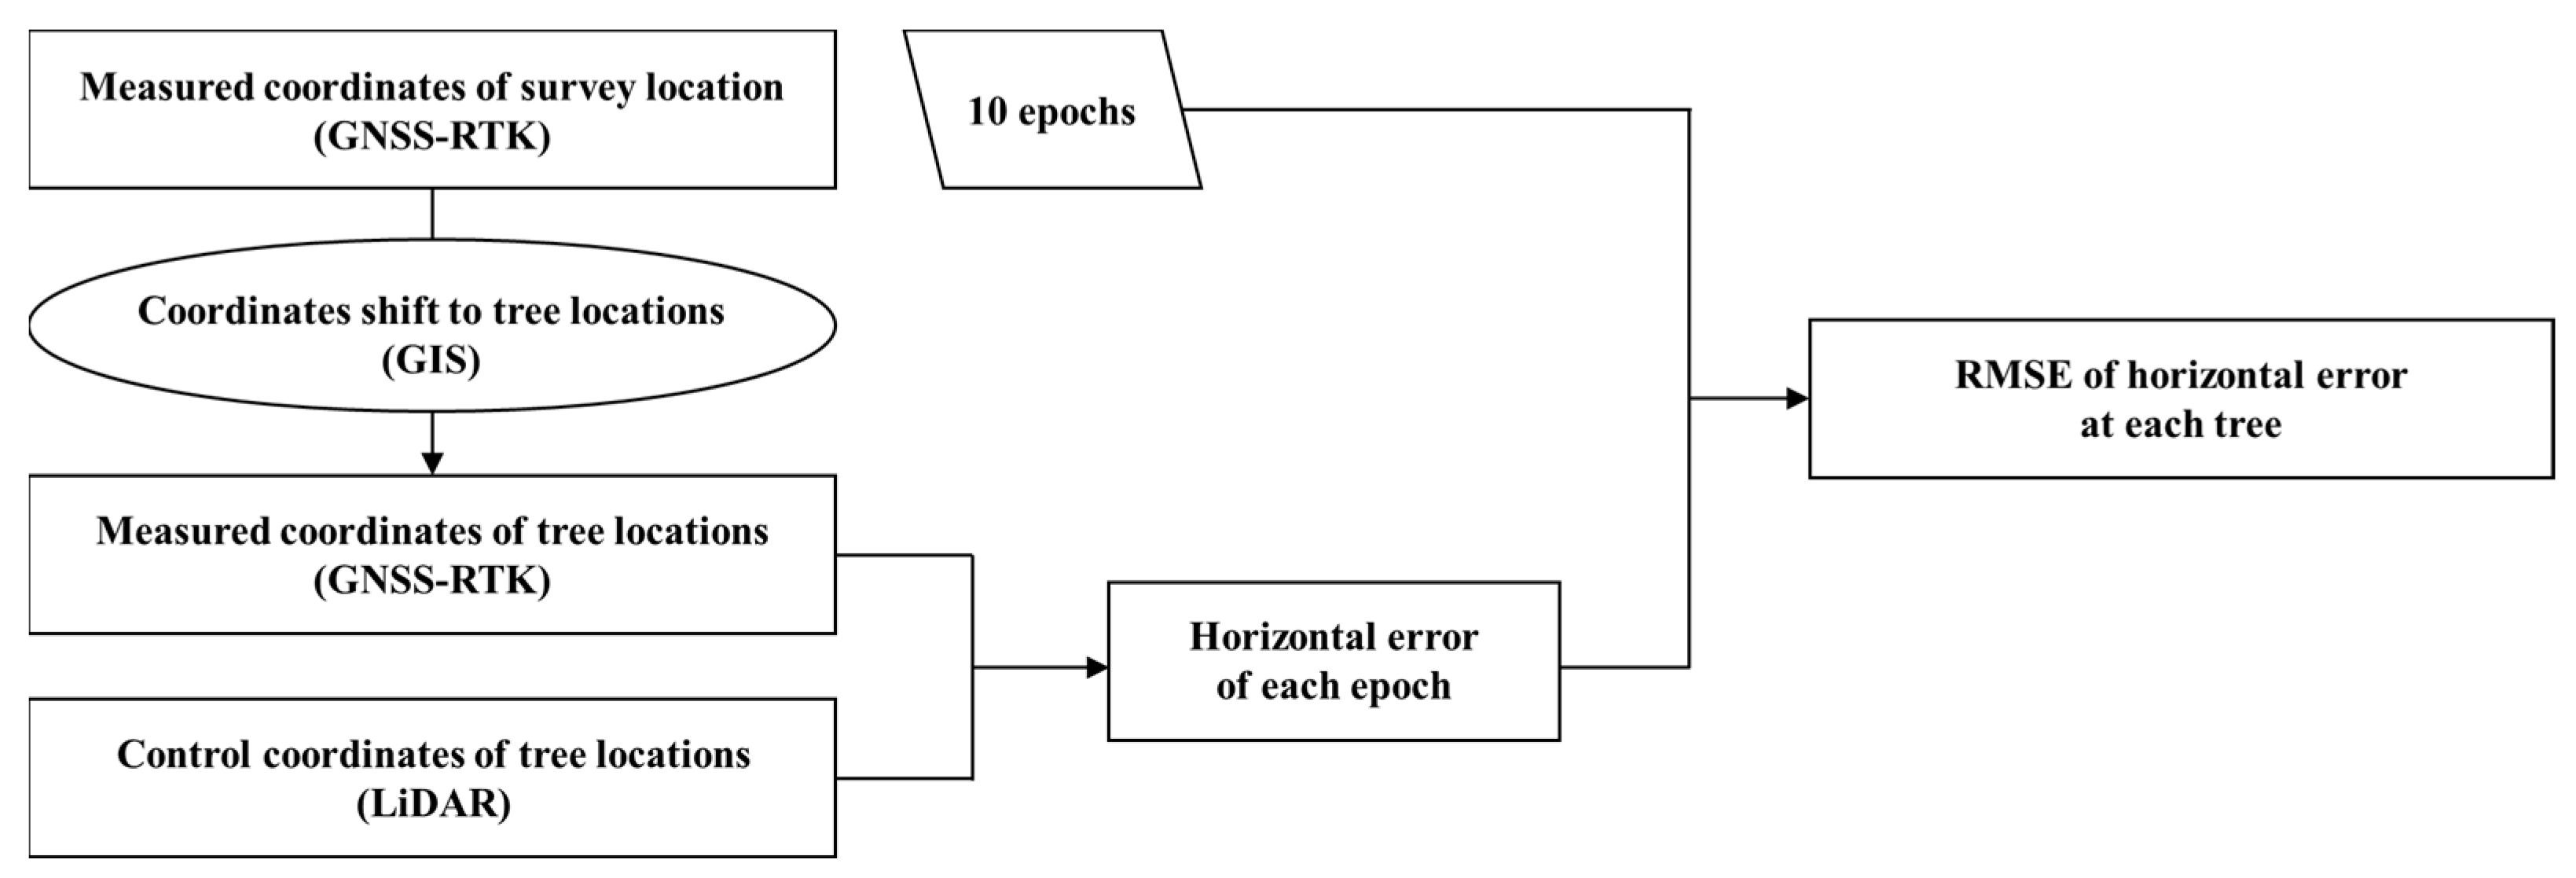
To evaluate the positional accuracy of the GNSS-RTK, the RMSE of the horizontal errors was calculated, as shown in Figure 5. First, coordinate-shift processing was conducted to adjust the measured coordinates of the survey locations to their tree locations using ArcGIS Pro (ESRI, Redlands, CA, USA).
Subsequently, the horizontal error between the control coordinates of the tree position and the measured value from the GNSS-RTK was calculated as follows (Equation (3)):
where and are the control XY coordinates of trees, and and are the measured XY coordinates of trees.
The RMSE of the horizontal error was calculated using 10 epochs of measurements acquired using the GNSS-RTK for each tree as follows (Equation (4)):
where is the horizontal error of the GNSS-RTK at each epoch and is the number of measured epochs at each tree.
To analyze the relationship between the RMSE of the horizontal error and forest environmental factors, such as canopy coverage, basal area, tree height, branch height, and TPI, a simple correlation analysis was conducted. Subsequently, a multiple linear regression analysis was conducted using forest environmental factors as independent variables and the RMSE of the horizontal positioning error as a dependent variable. In the derived linear regression model, the unstandardized coefficients of each independent variable were compared to assess their influence on the dependent variable. After deriving the model, a collinearity analysis using the variance inflation factor (VIF) was conducted to diagnose multicollinearity among the selected independent variables. We used SPSS Statistics 26.0 program (IBM, Armonk, NY, USA) for the statistical analysis.
2.4. Range Evaluation of GNSS-RTK
In Stream 2, the RTK range assessment was performed using the same GNSS-RTK equipment as in Stream 1, operating the single-baseline RTK. The survey points were selected using the proposed systematic sampling method based on spatial analysis, distinguishing between road and forest points. The positioning precision and RSSI of the GNSS-RTK were acquired at each survey point, and their relationships were statistically analyzed. The main objective of Stream 2 was to determine the available distance range for the GNSS-RTK in the forest while maintaining tolerable positioning precision.
2.4.1. Positioning Precision and RSSI Survey
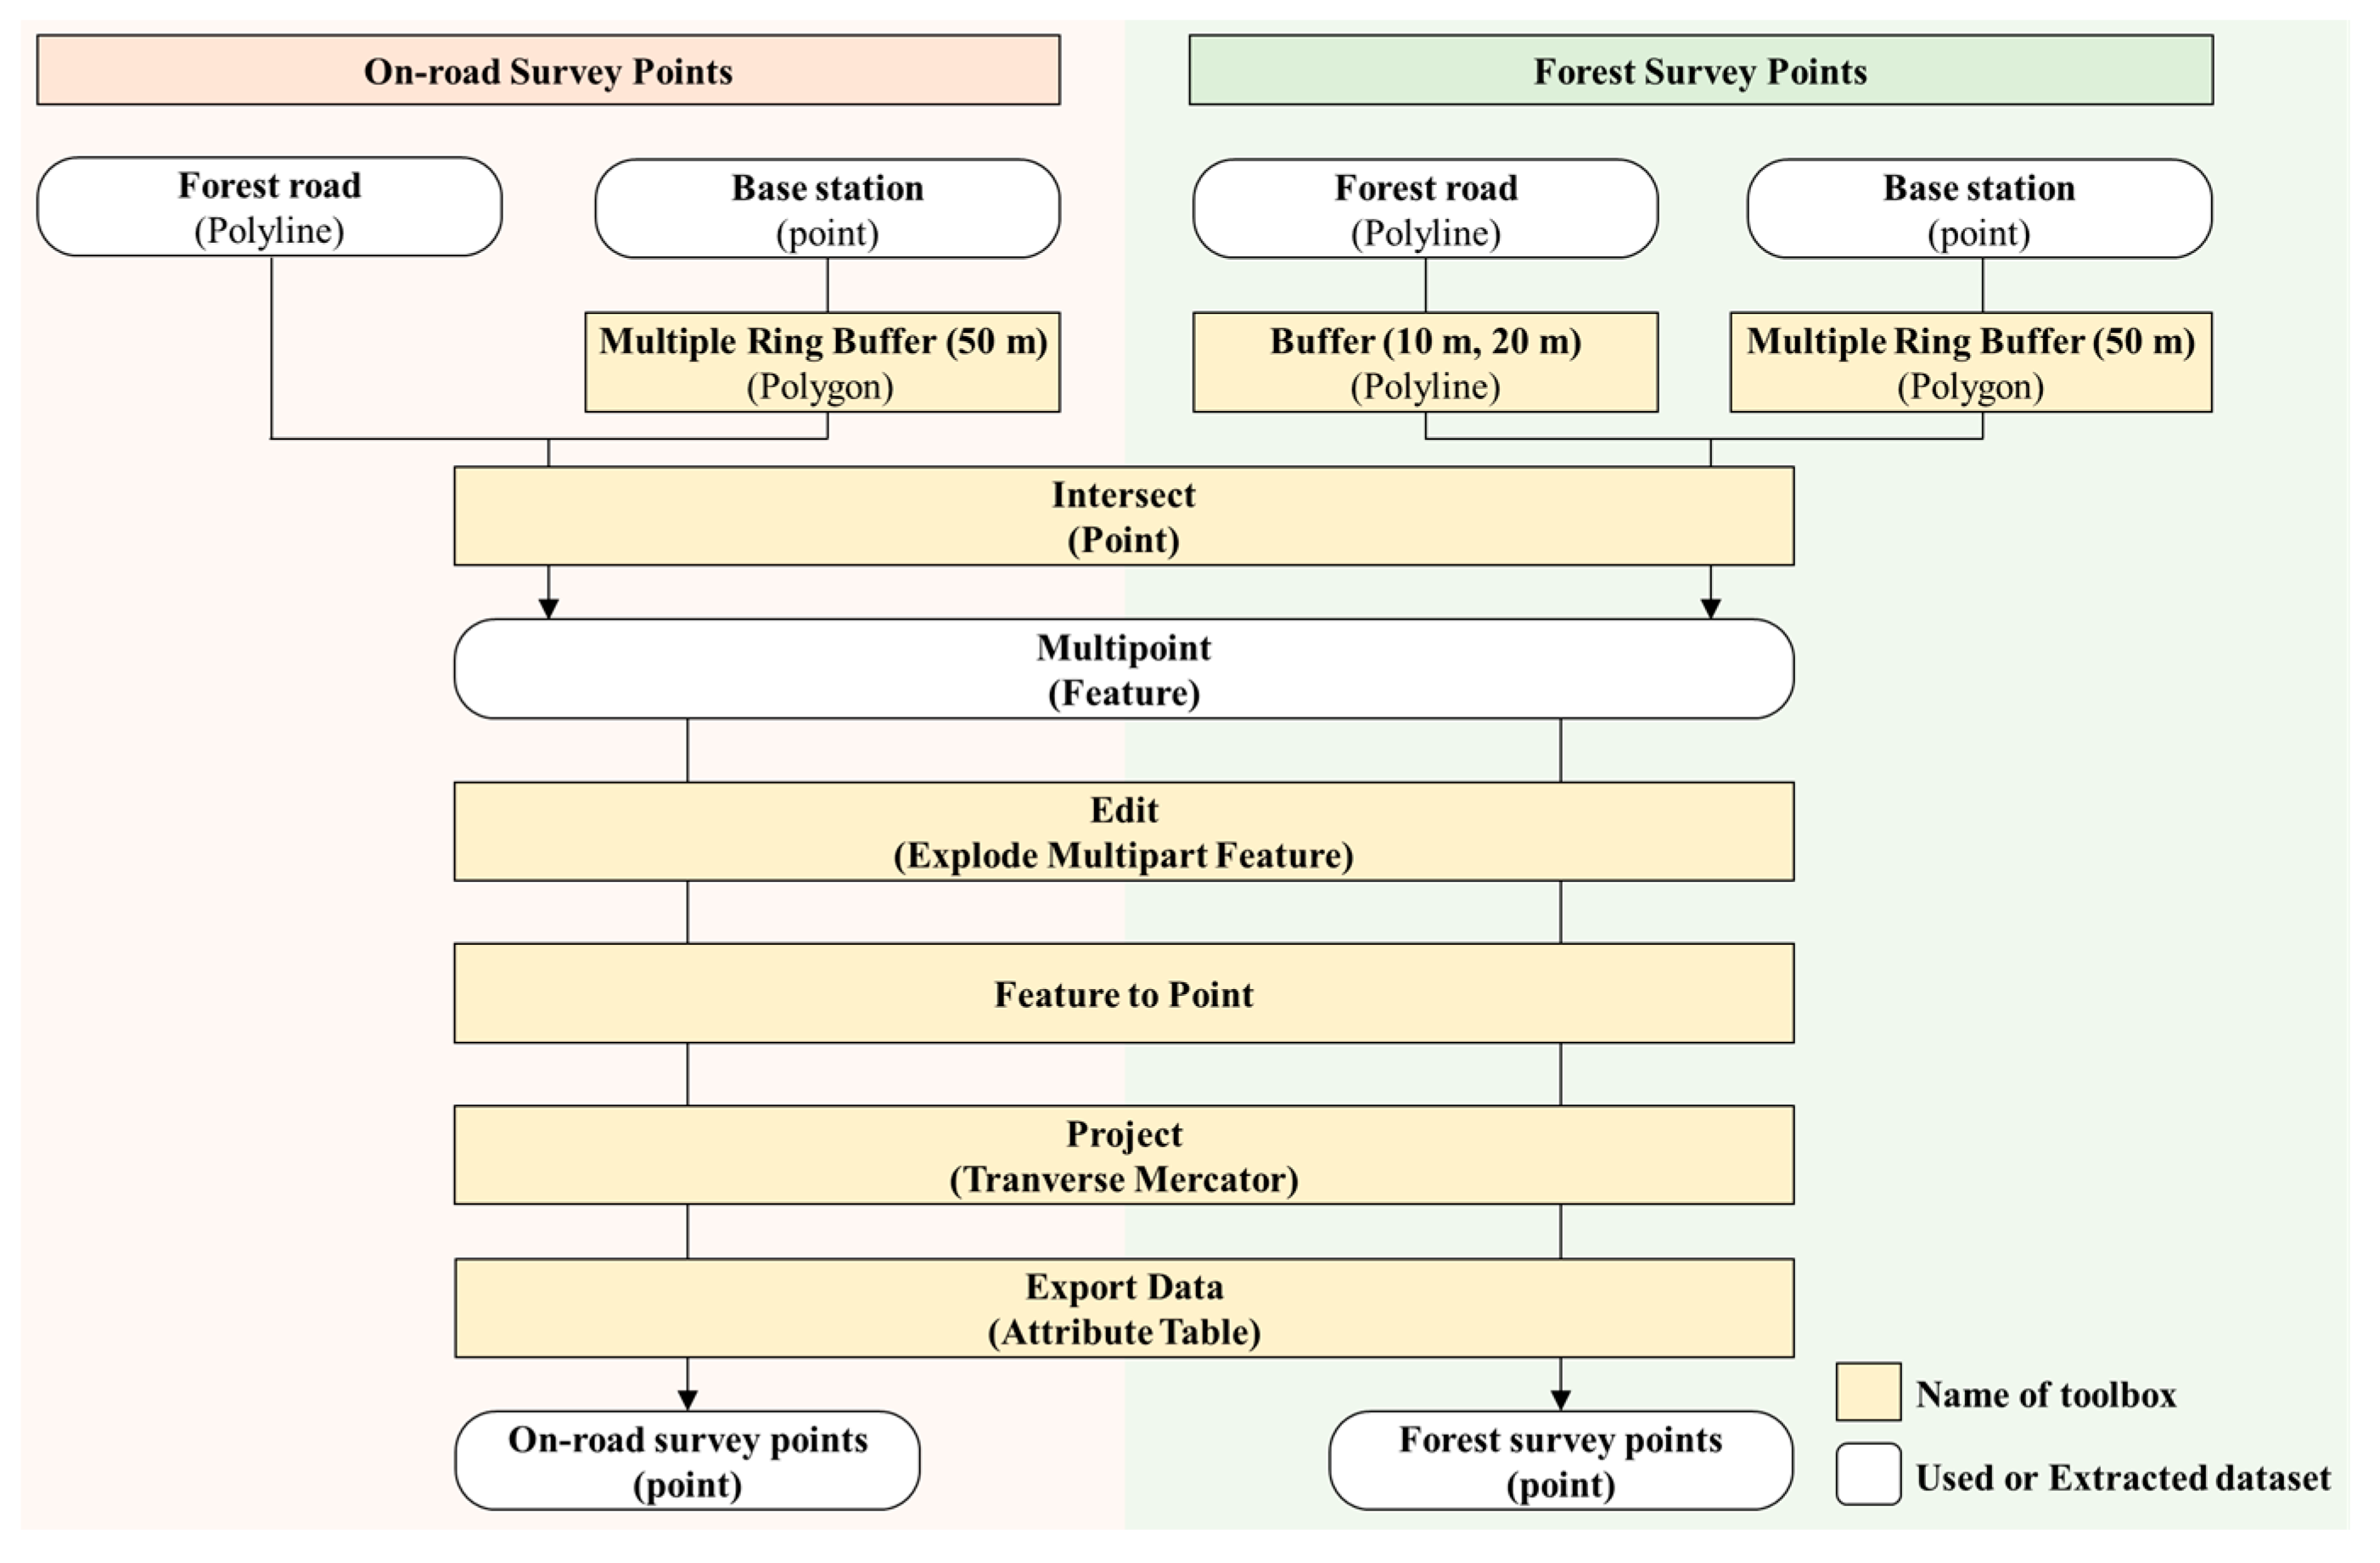
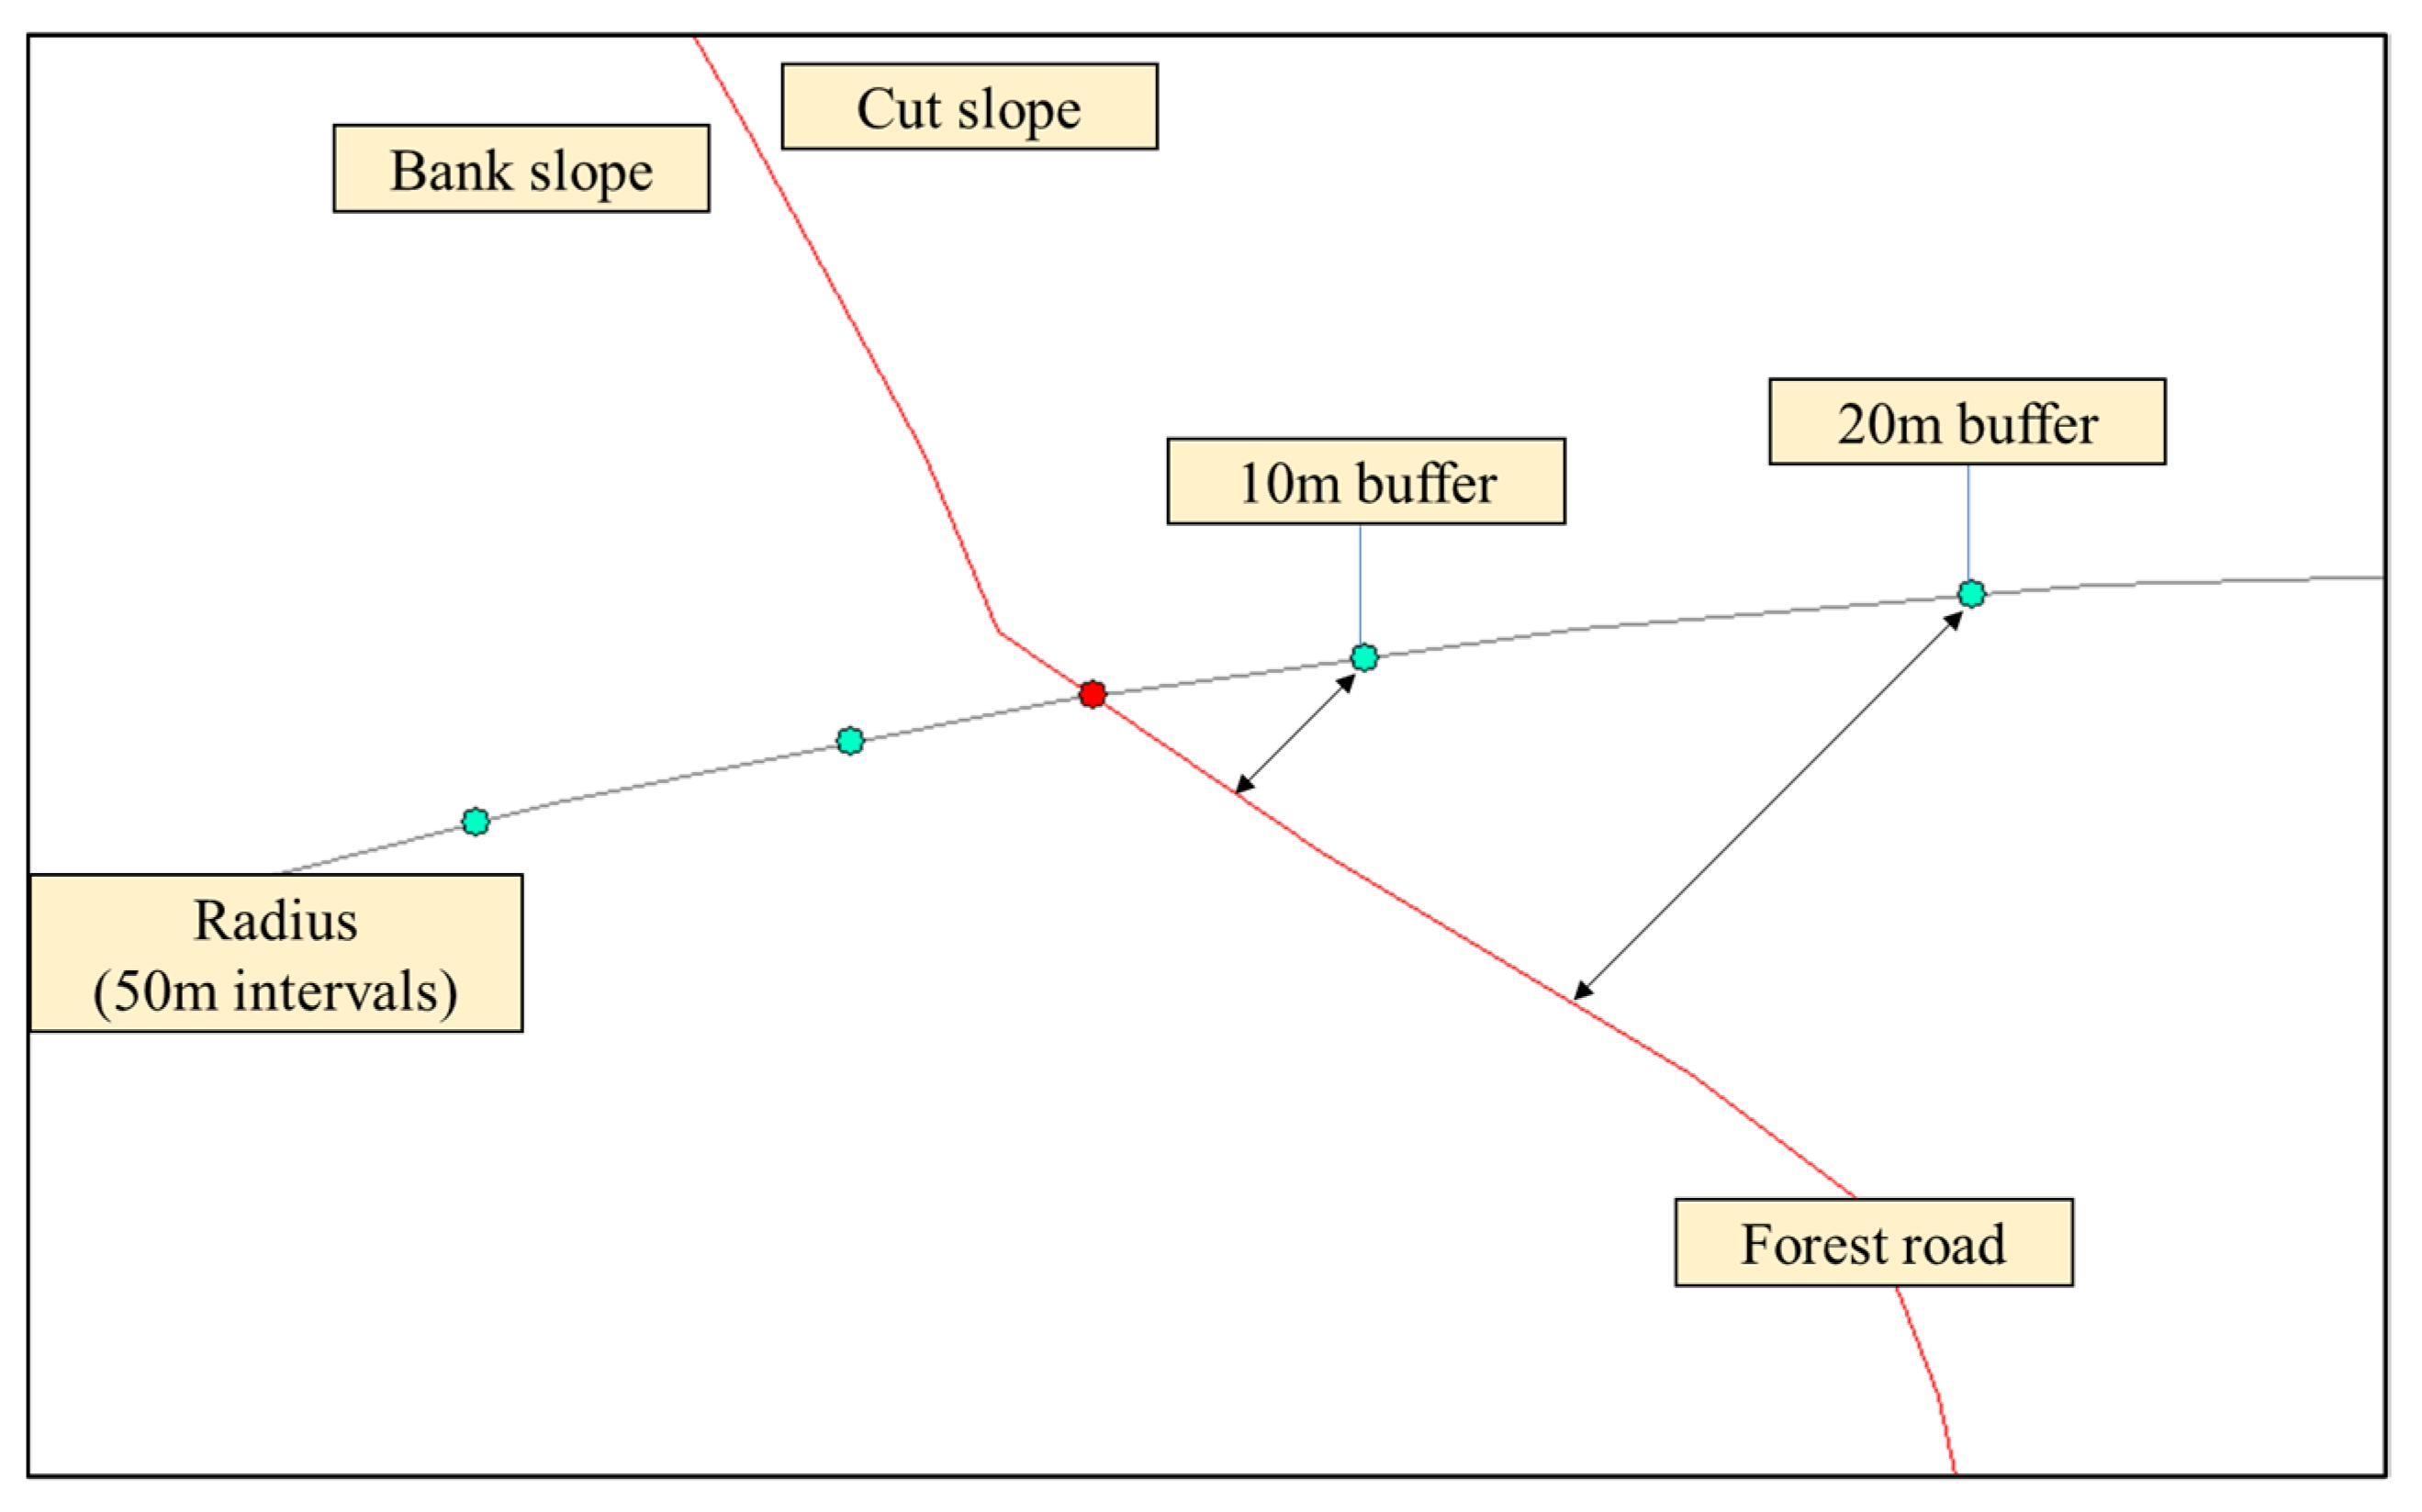
The survey points were selected in the order shown in Figure 6, using ArcGIS Pro. For the on-road survey points, a total of 20 points were intersected between the forest road route and the intervals of 50 m radius polylines, ranging from 50 m to 1 km from the base station (Figure 7). For the forest survey points, locations where the buffered polylines (10 m and 20 m from the forest road route) and the radius polylines of the base station intersected were chosen. After excluding sites with steep slopes deemed difficult to survey, a total of 71 points were selected. At each survey point, after setting up the GNSS-RTK rover, the horizontal positioning precision of the equipment was measured for 180 epochs and the RSSI was measured for 30 epochs.
2.4.2. RTK Range Analysis
To determine the significance of the relationships between the distance from the base station, GNSS-RTK positioning precision, and RSSI, a multiple correlation analysis was conducted using the Pearson correlation coefficient. Additionally, Student’s t-test was conducted along with the RSSI and positioning precision between the on-road and forest locations.
3. Results
3.1. Real-Time Positioning Accuracy of GNSS-RTK
3.1.1. RMSE of Real-Time Positioning Accuracy
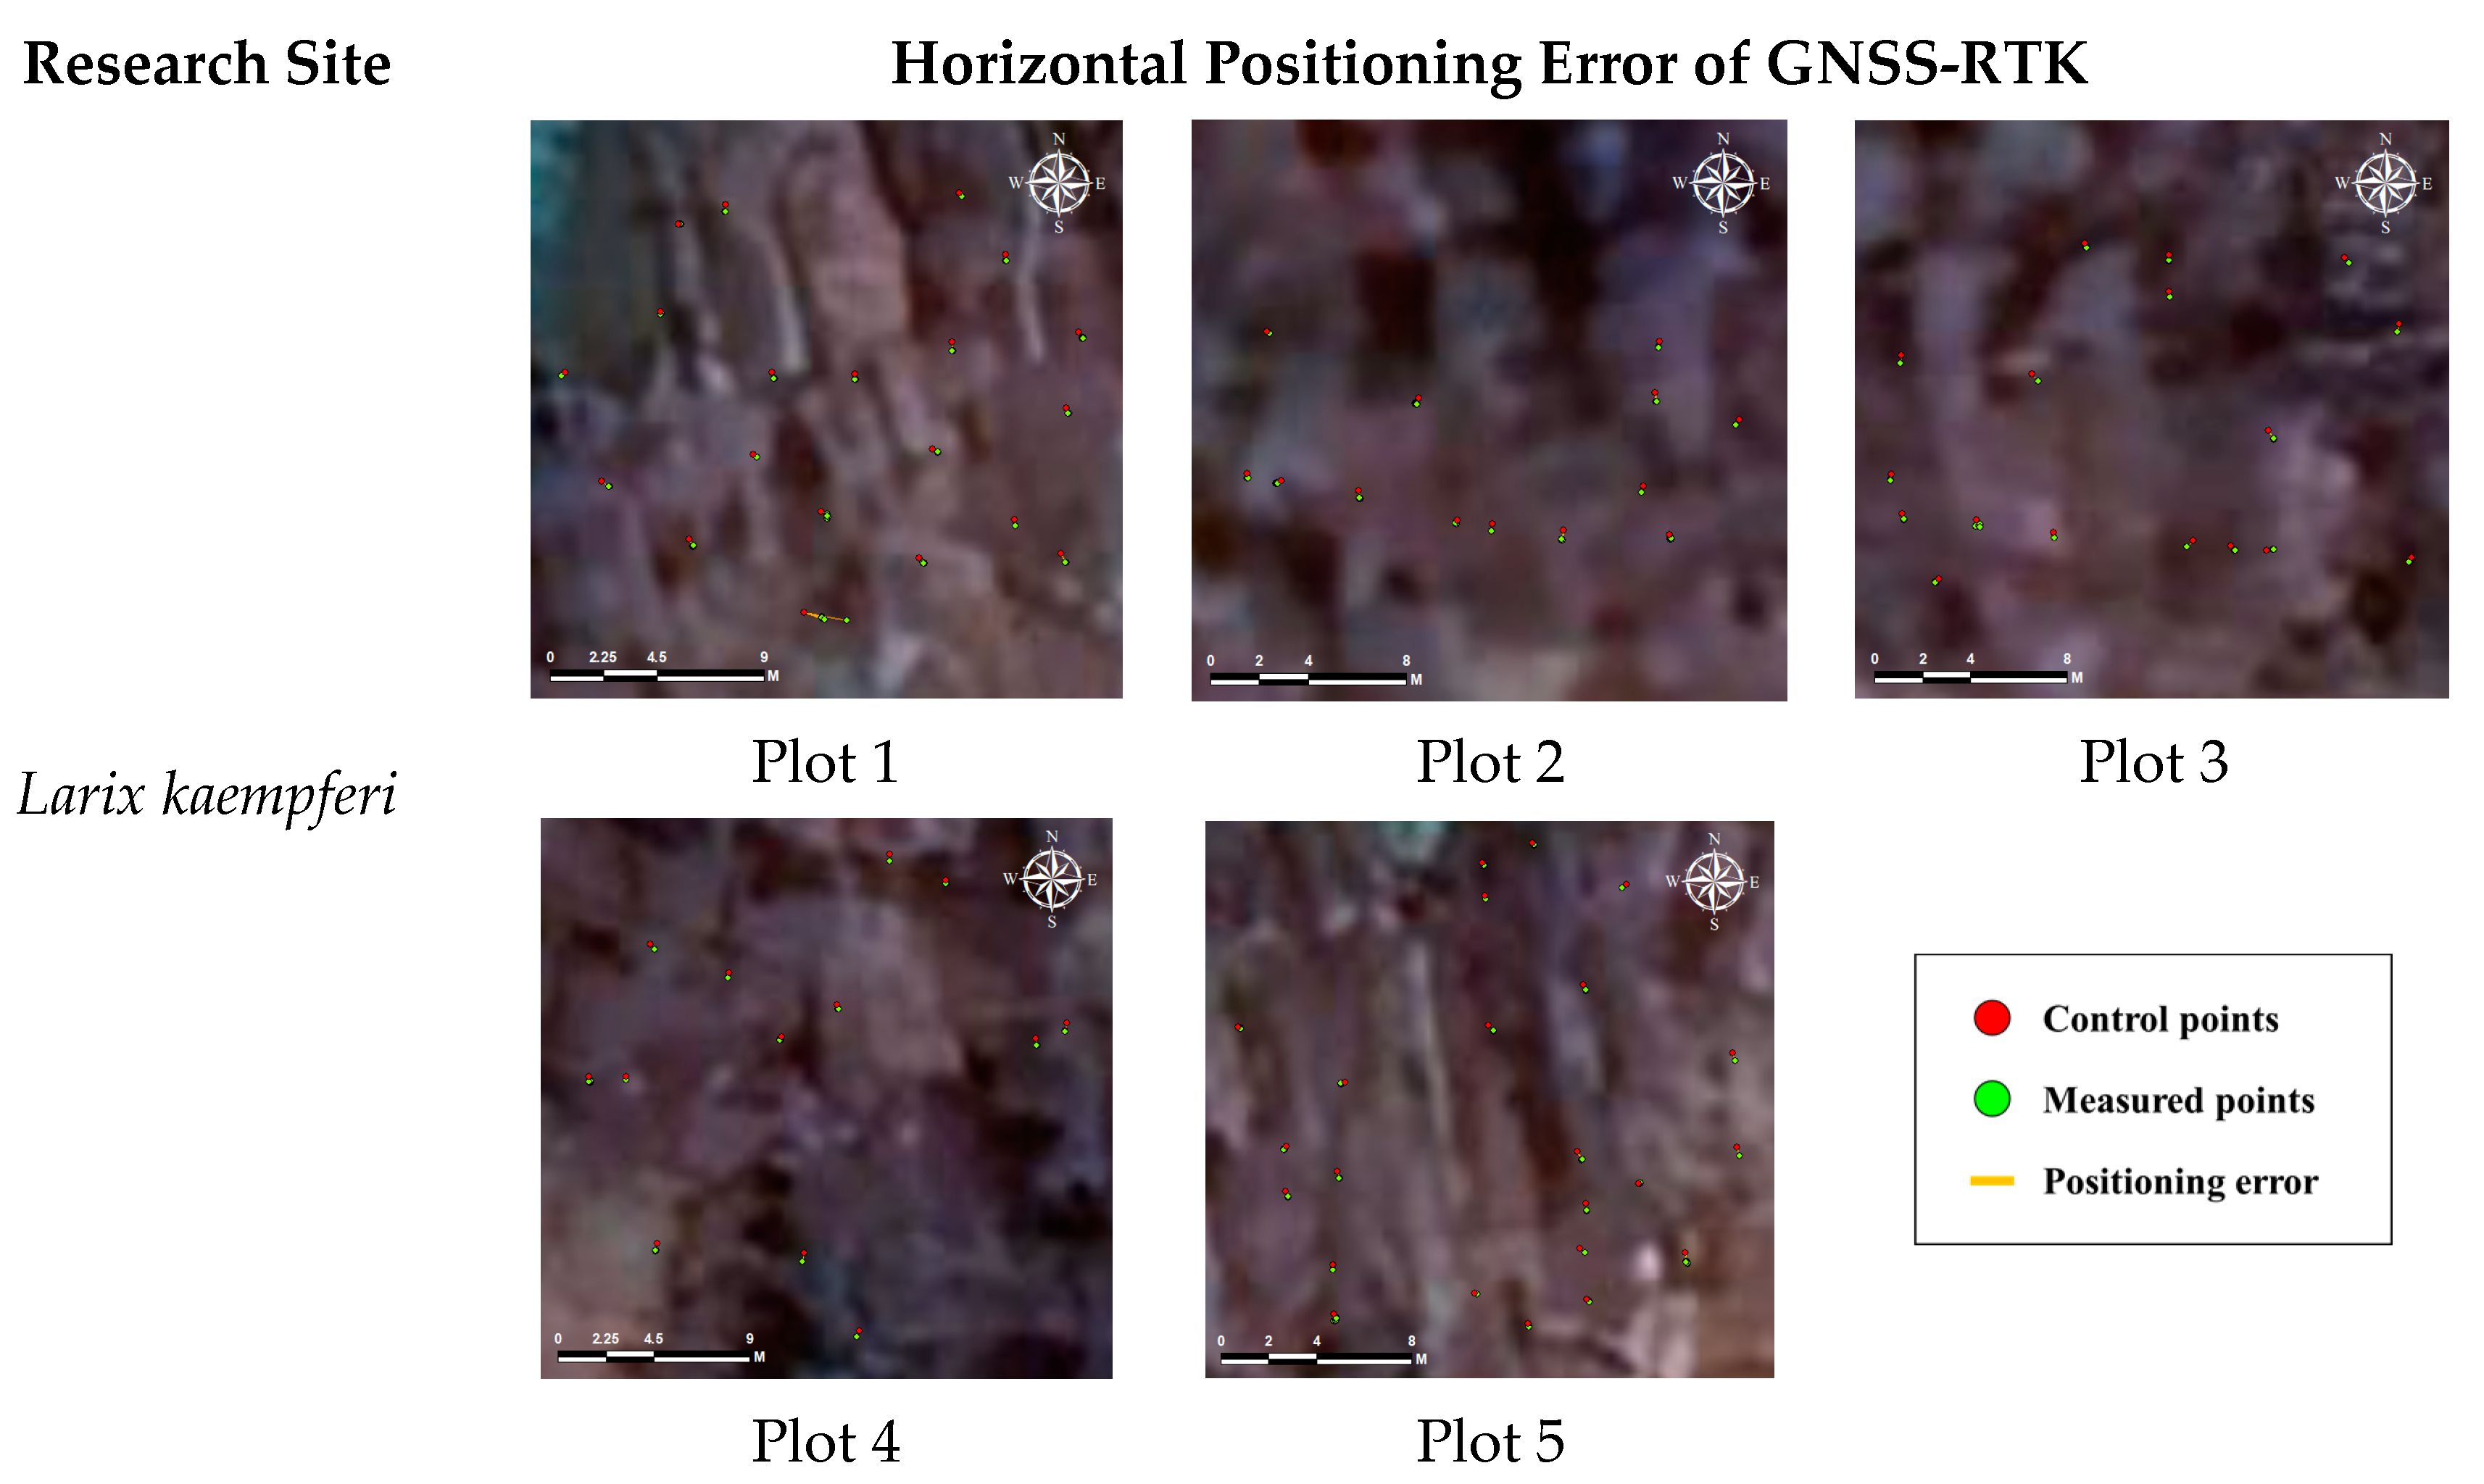
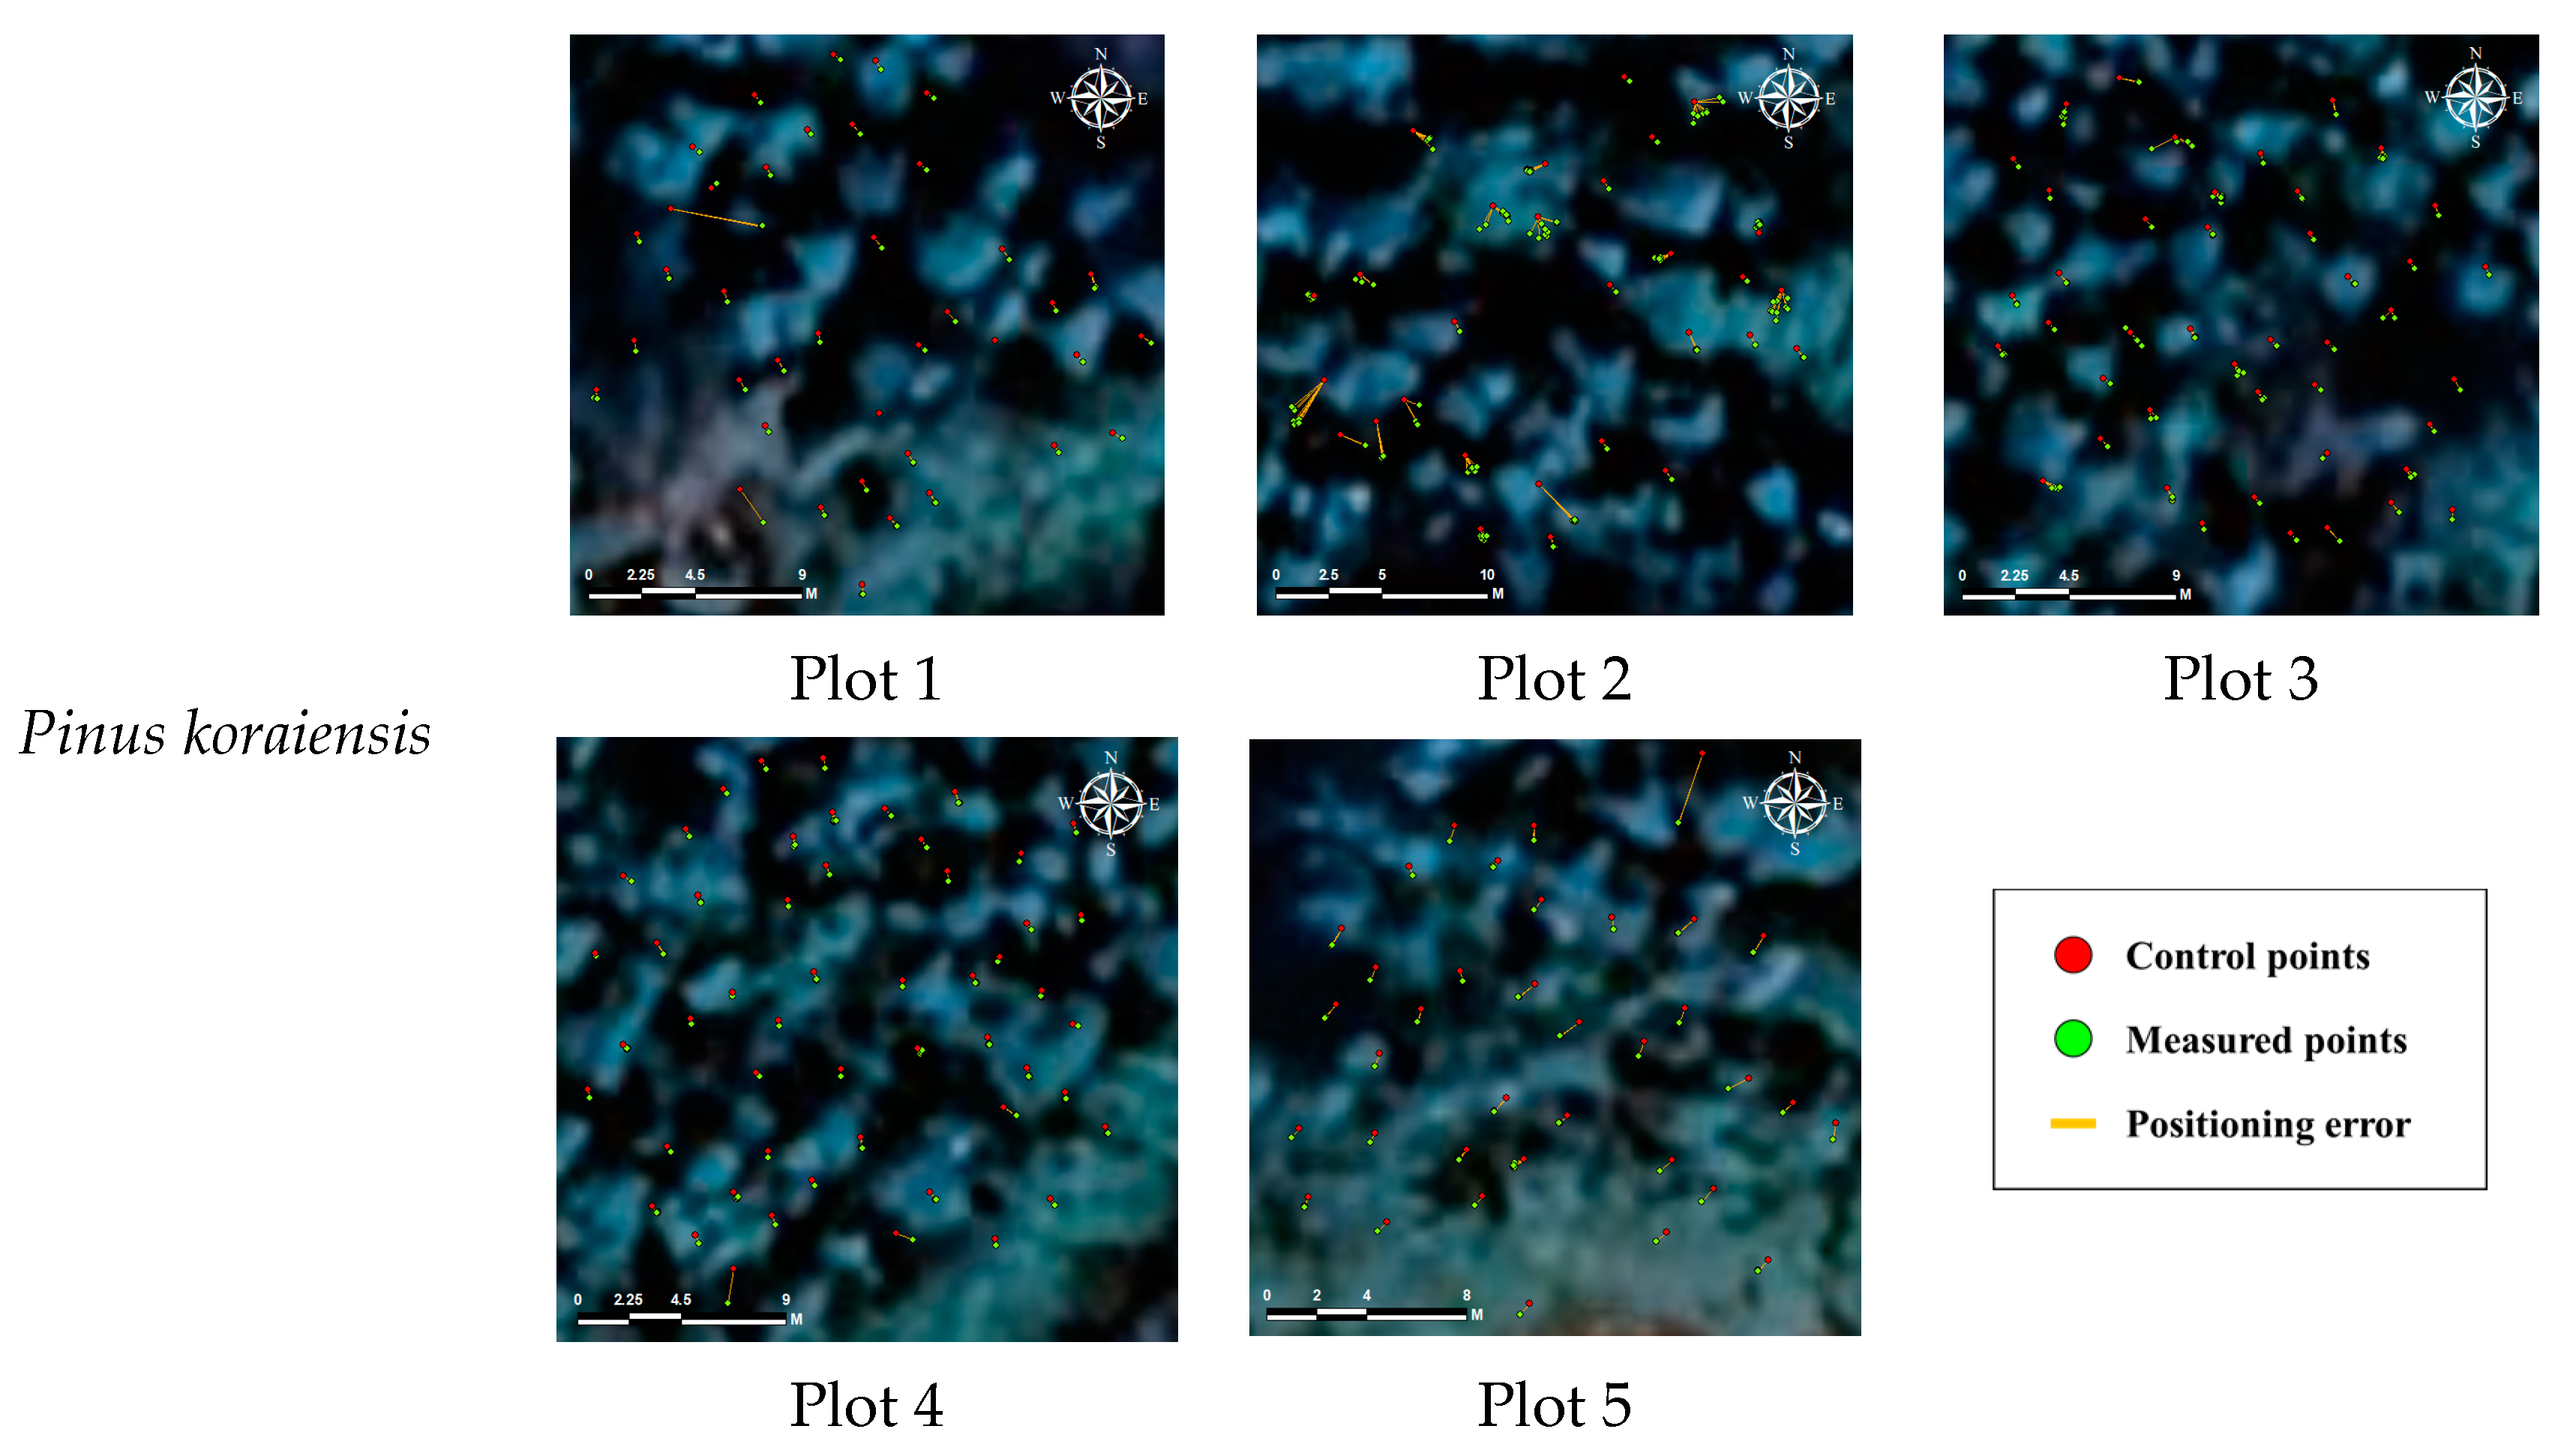
In the L. kaempferi and P. koraiensis stands, the location coordinates were measured using the GNSS-RTK for 82 and 179 trees, respectively. The results showed that in the L. kaempferi stand, the average RMSE of the horizontal error was 0.26 m with a standard deviation of 0.11 m. This was found to be more favorable than the P. koraiensis stand, which had an average RMSE of 0.48 m and a standard deviation of 0.21 m (Table 3). Although the canopy coverage showed little difference between the two forest species, with 74% for the L. kaempferi stand and 70% for the P. koraiensis stand, the RMSE of the horizontal positioning error was higher in the P. koraiensis stand. This difference was likely due to the reduced spatial visibility in the P. koraiensis stand, which had a higher stand density of 1025 trees/ha, with 65.6 m2/ha of basal area, than that of the L. kaempferi stand with 430 trees/ha and 37.9 m2/ha of basal area.
Figure 8 shows the distance of the positioning errors obtained by mapping the actual locations of individual trees against the locations measured using the GNSS-RTK. In the L. kaempferi stand, the locations measured using the GNSS-RTK did not show significant differences from the actual locations, with most appearing to overlap. In contrast, the P. koraiensis stand exhibited relatively longer distances of positioning error than the L. kaempferi stand. Among the study plots, the deviated horizontal positioning errors, ranging from 0.93 m to 1.52 m, were intermittently observed in dense areas.
For smart thinning operations, a certain level of accuracy is required from the GNSS-RTK positioning equipment. Assuming a minimum distance of about 2.0 m between individual trees in a non-thinned stand, if the positioning error at a tree occurs within a range less than 1.5 times the DBH of the tree, it is deemed sufficiently usable in actual field operations [31]. The RMSE of the positioning error derived in this study was 0.48 m on average for the P. koraiensis stand, which is believed to be sufficiently accurate for thinning operations in domestic coniferous stands.
3.1.2. Relationship between Positioning Accuracy and Forest Environment
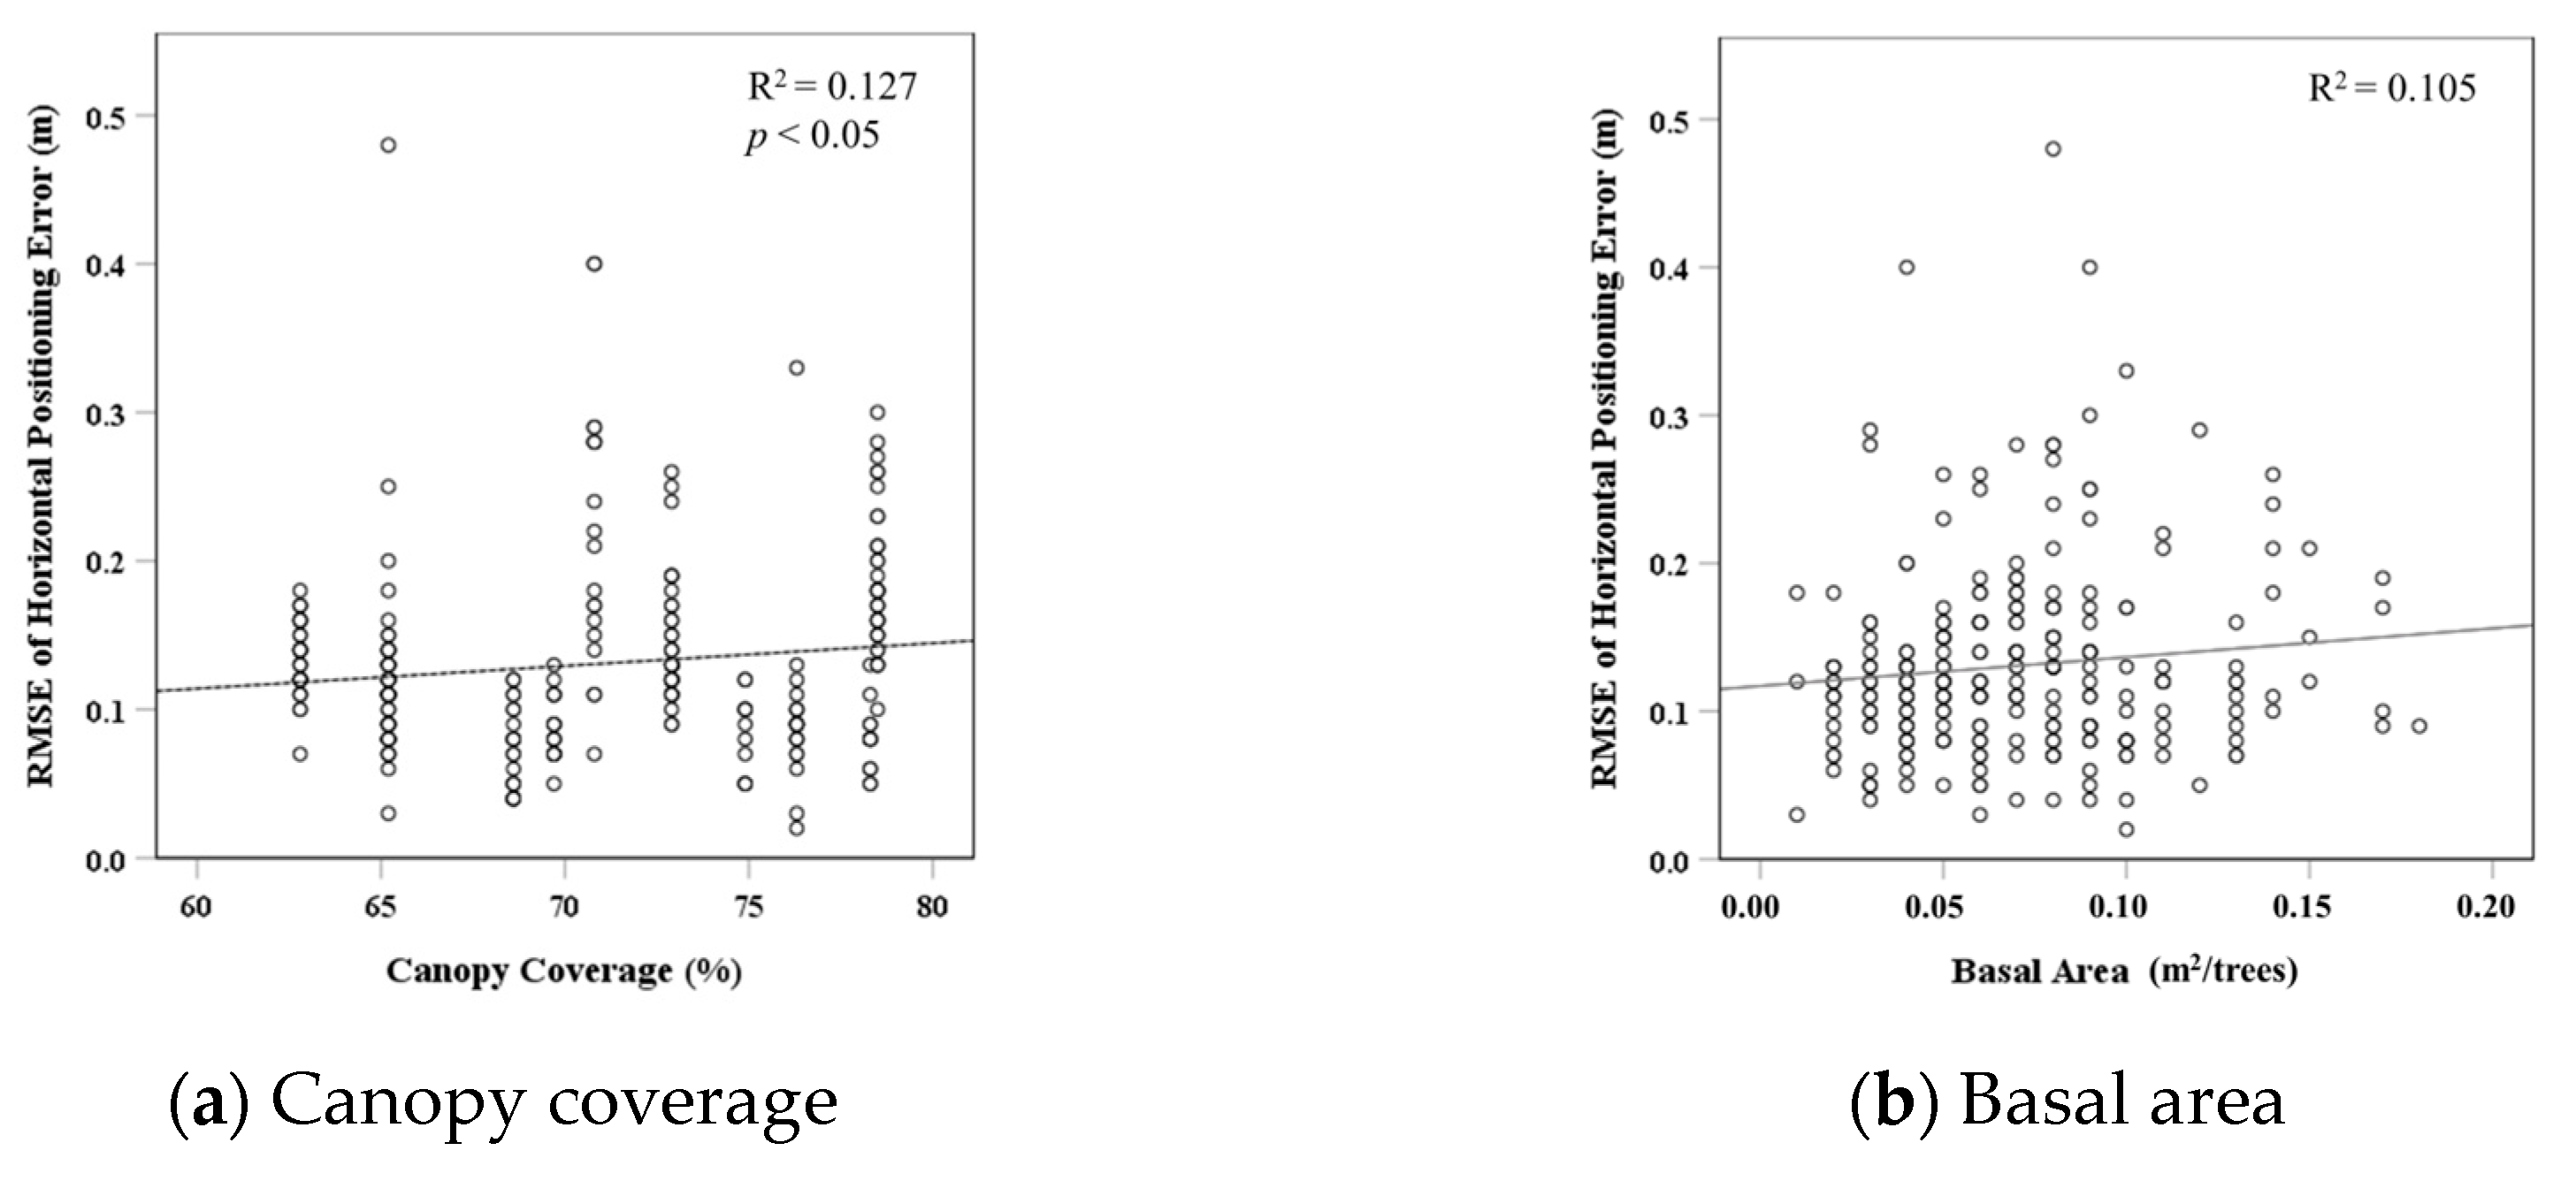
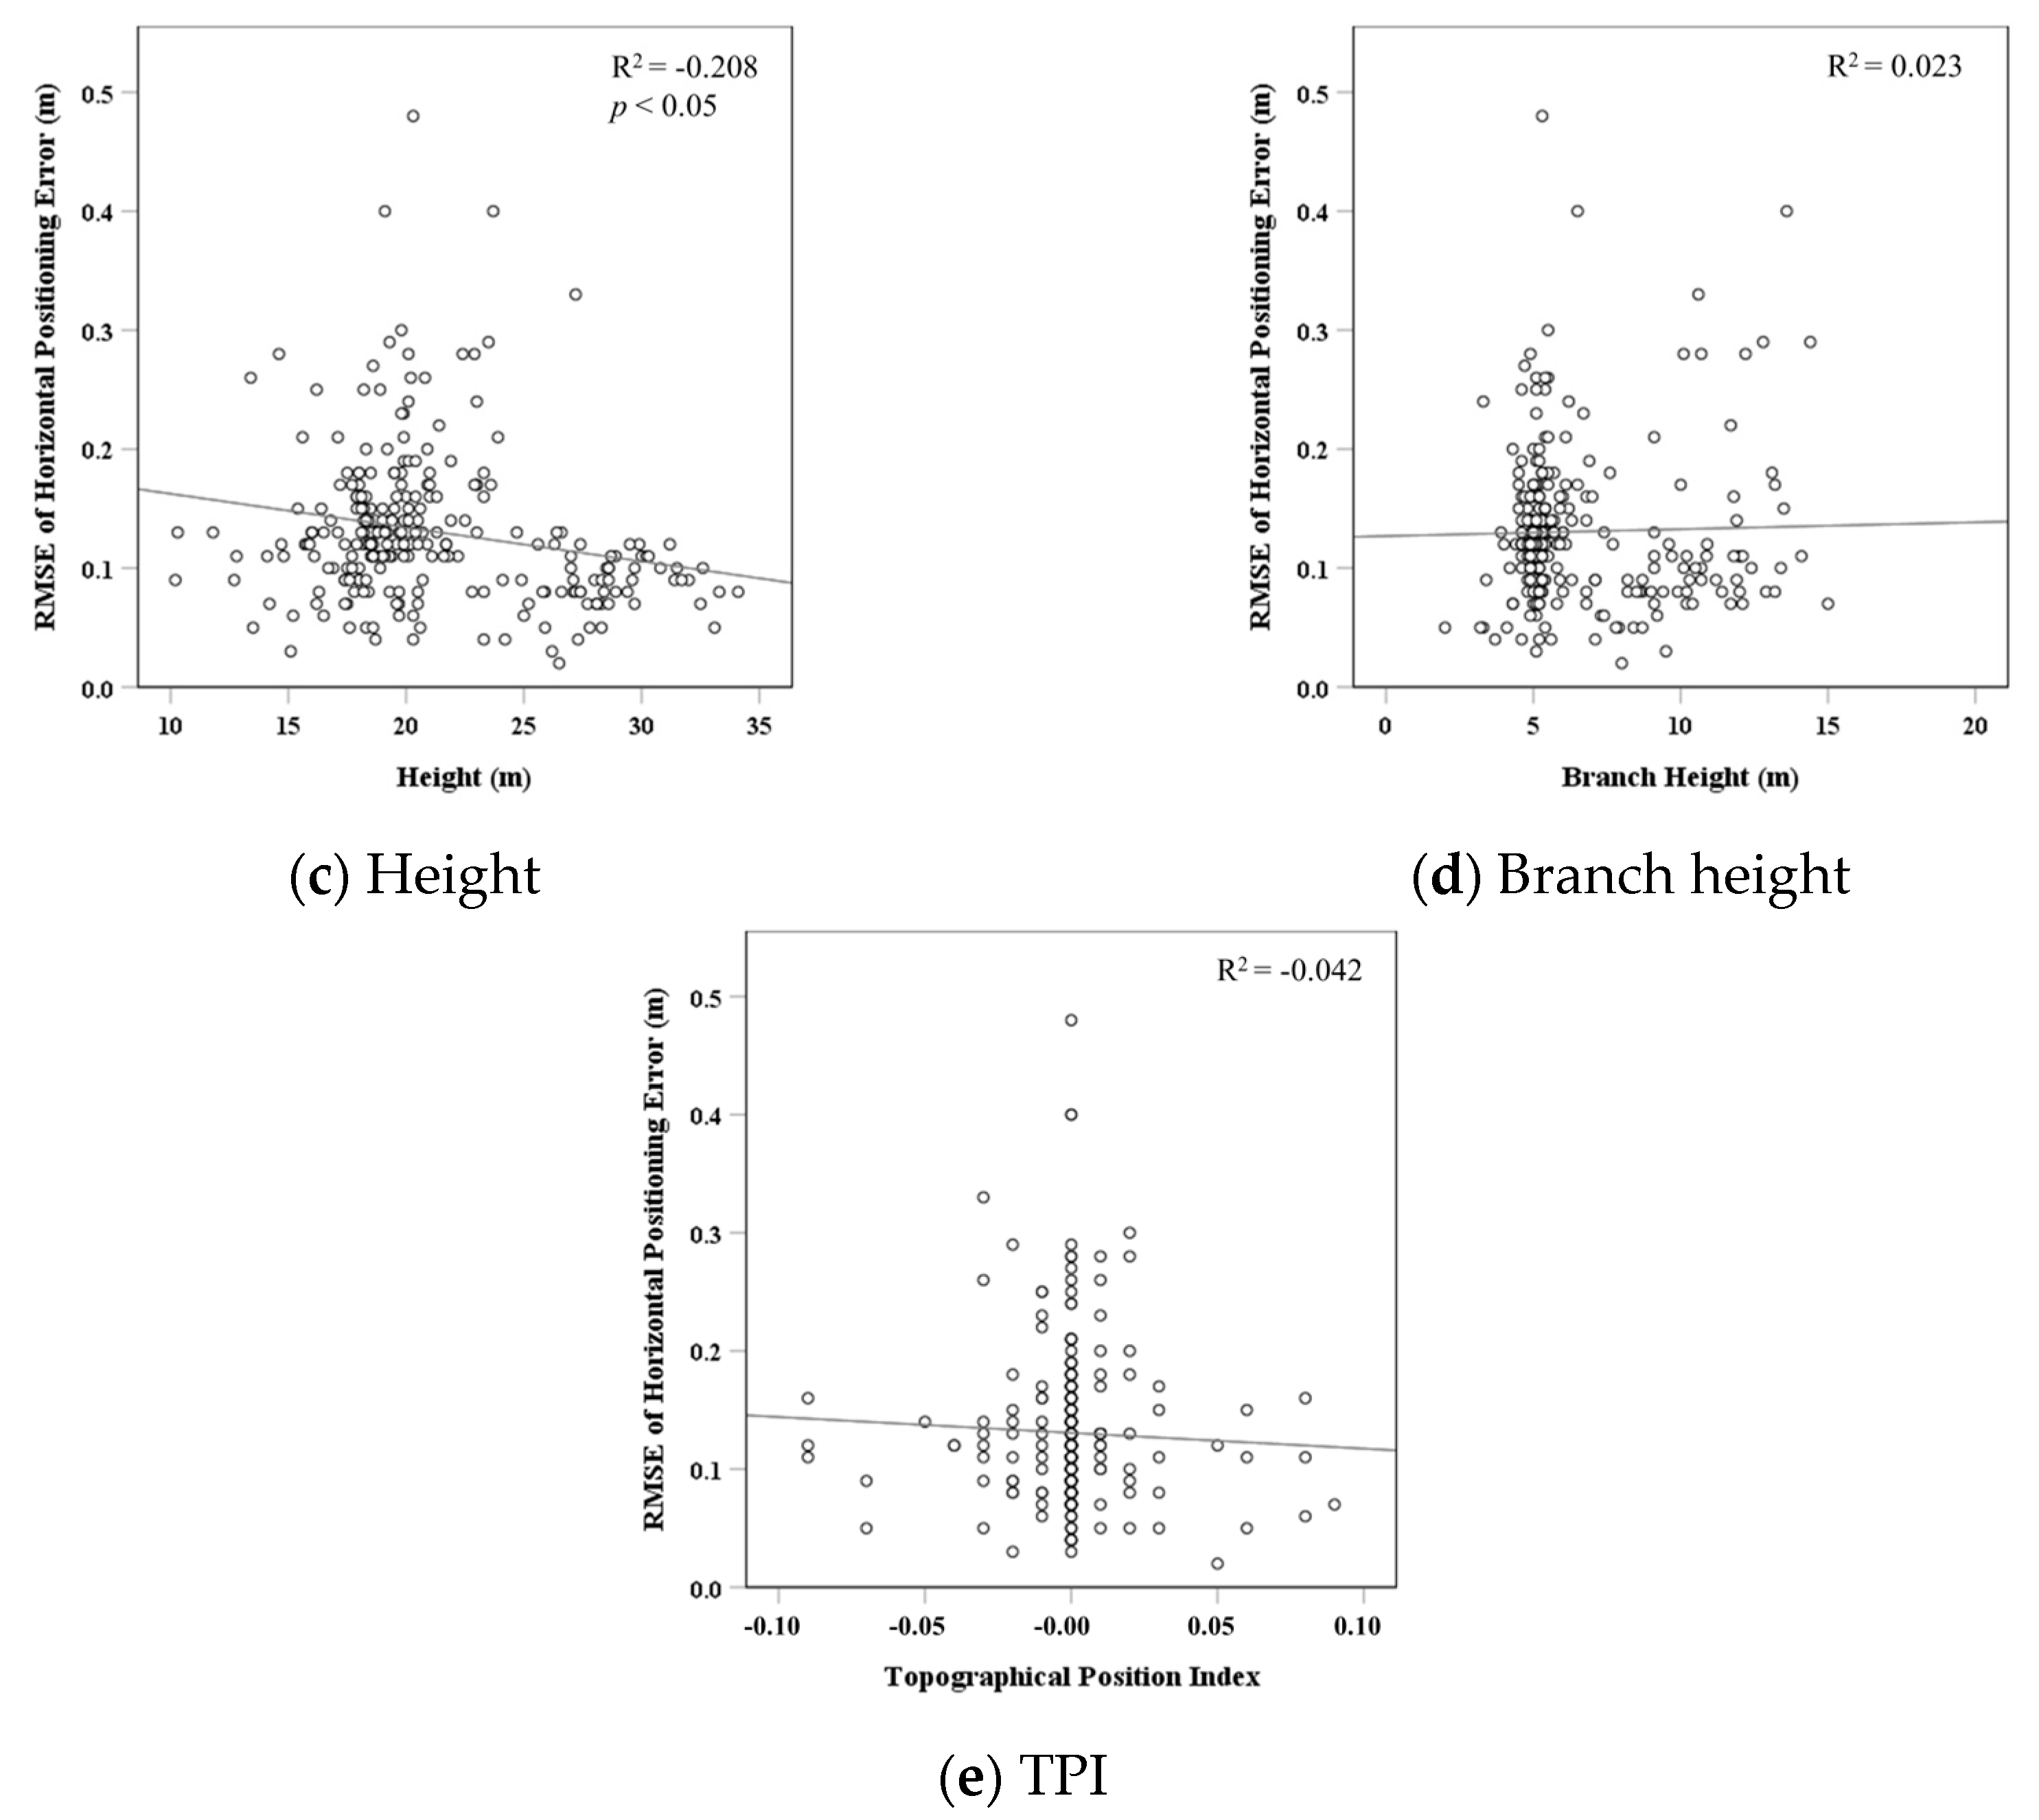
To identify the forest environmental factors that influenced the RMSE of the horizontal positioning error of the GNSS-RTK, a correlation analysis was conducted between the RMSE and five forest environmental factors: canopy coverage, basal area, tree height, branch height, and TPI. The results showed that canopy coverage had a positive correlation with RMSE (R2 = 0.127), whereas tree height and TPI had negative correlations (R2 = −0.208 and R2 = −0.042, respectively) (Figure 9).
As the canopy coverage increases, the proportion of visible sky decreases because of the presence of branches, leaves, and stems. The increase in obstructions and interference between the satellite and the GNSS-RTK rover can interfere with and block the radio frequency (RF) signals transmitted from the satellites. The study results showed a low explanatory correlation coefficient between canopy cover and RMSE, likely because the canopy coverage of the study area was between 60% and 80%; therefore, no drastic changes in the horizontal error due to canopy coverage were observed.
Considering the role of the real-time positioning system in a smart thinning operation, the destination of the positioning sensor was directly in front of the tree trunk, which would help the worker navigate to the target tree. At this point, the proportion of visible sky can drastically decrease because of the proximity of the sensor to tree trunks. Sky visibility from the GNSS-RTK receiver decreased more with larger target tree DBH and basal area, leading to a decrease in the positioning accuracy.
Previously, we analyzed the correlation between various forest environmental factors and the positioning accuracy of the GNSS-RTK. However, within a stand, these factors coexist and influence the receiver simultaneously. To this end, a multiple linear regression analysis was conducted using the same five factors as independent variables (Table 4). Consequently, a regression equation was derived, as shown in Table 4, and the model was found to be significant (p < 0.05). The impact of the independent variables on the horizontal positioning error RMSE was the highest for the basal area, with a non-standardized coefficient of 0.643, followed by TPI (−0.079), tree height (−0.007), branch height (0.005), and canopy coverage (0.001).
A multicollinearity analysis was conducted to determine the existence of multicollinearity among the independent variables in the regression equation. The results showed that the VIF values were all below 3, indicating that there were no issues with multicollinearity (Table 5).
3.2. Range Evaluation of GNSS-RTK
3.2.1. Positioning Precision and RSSI of GNSS-RTK Based on the Distance from the Base Station
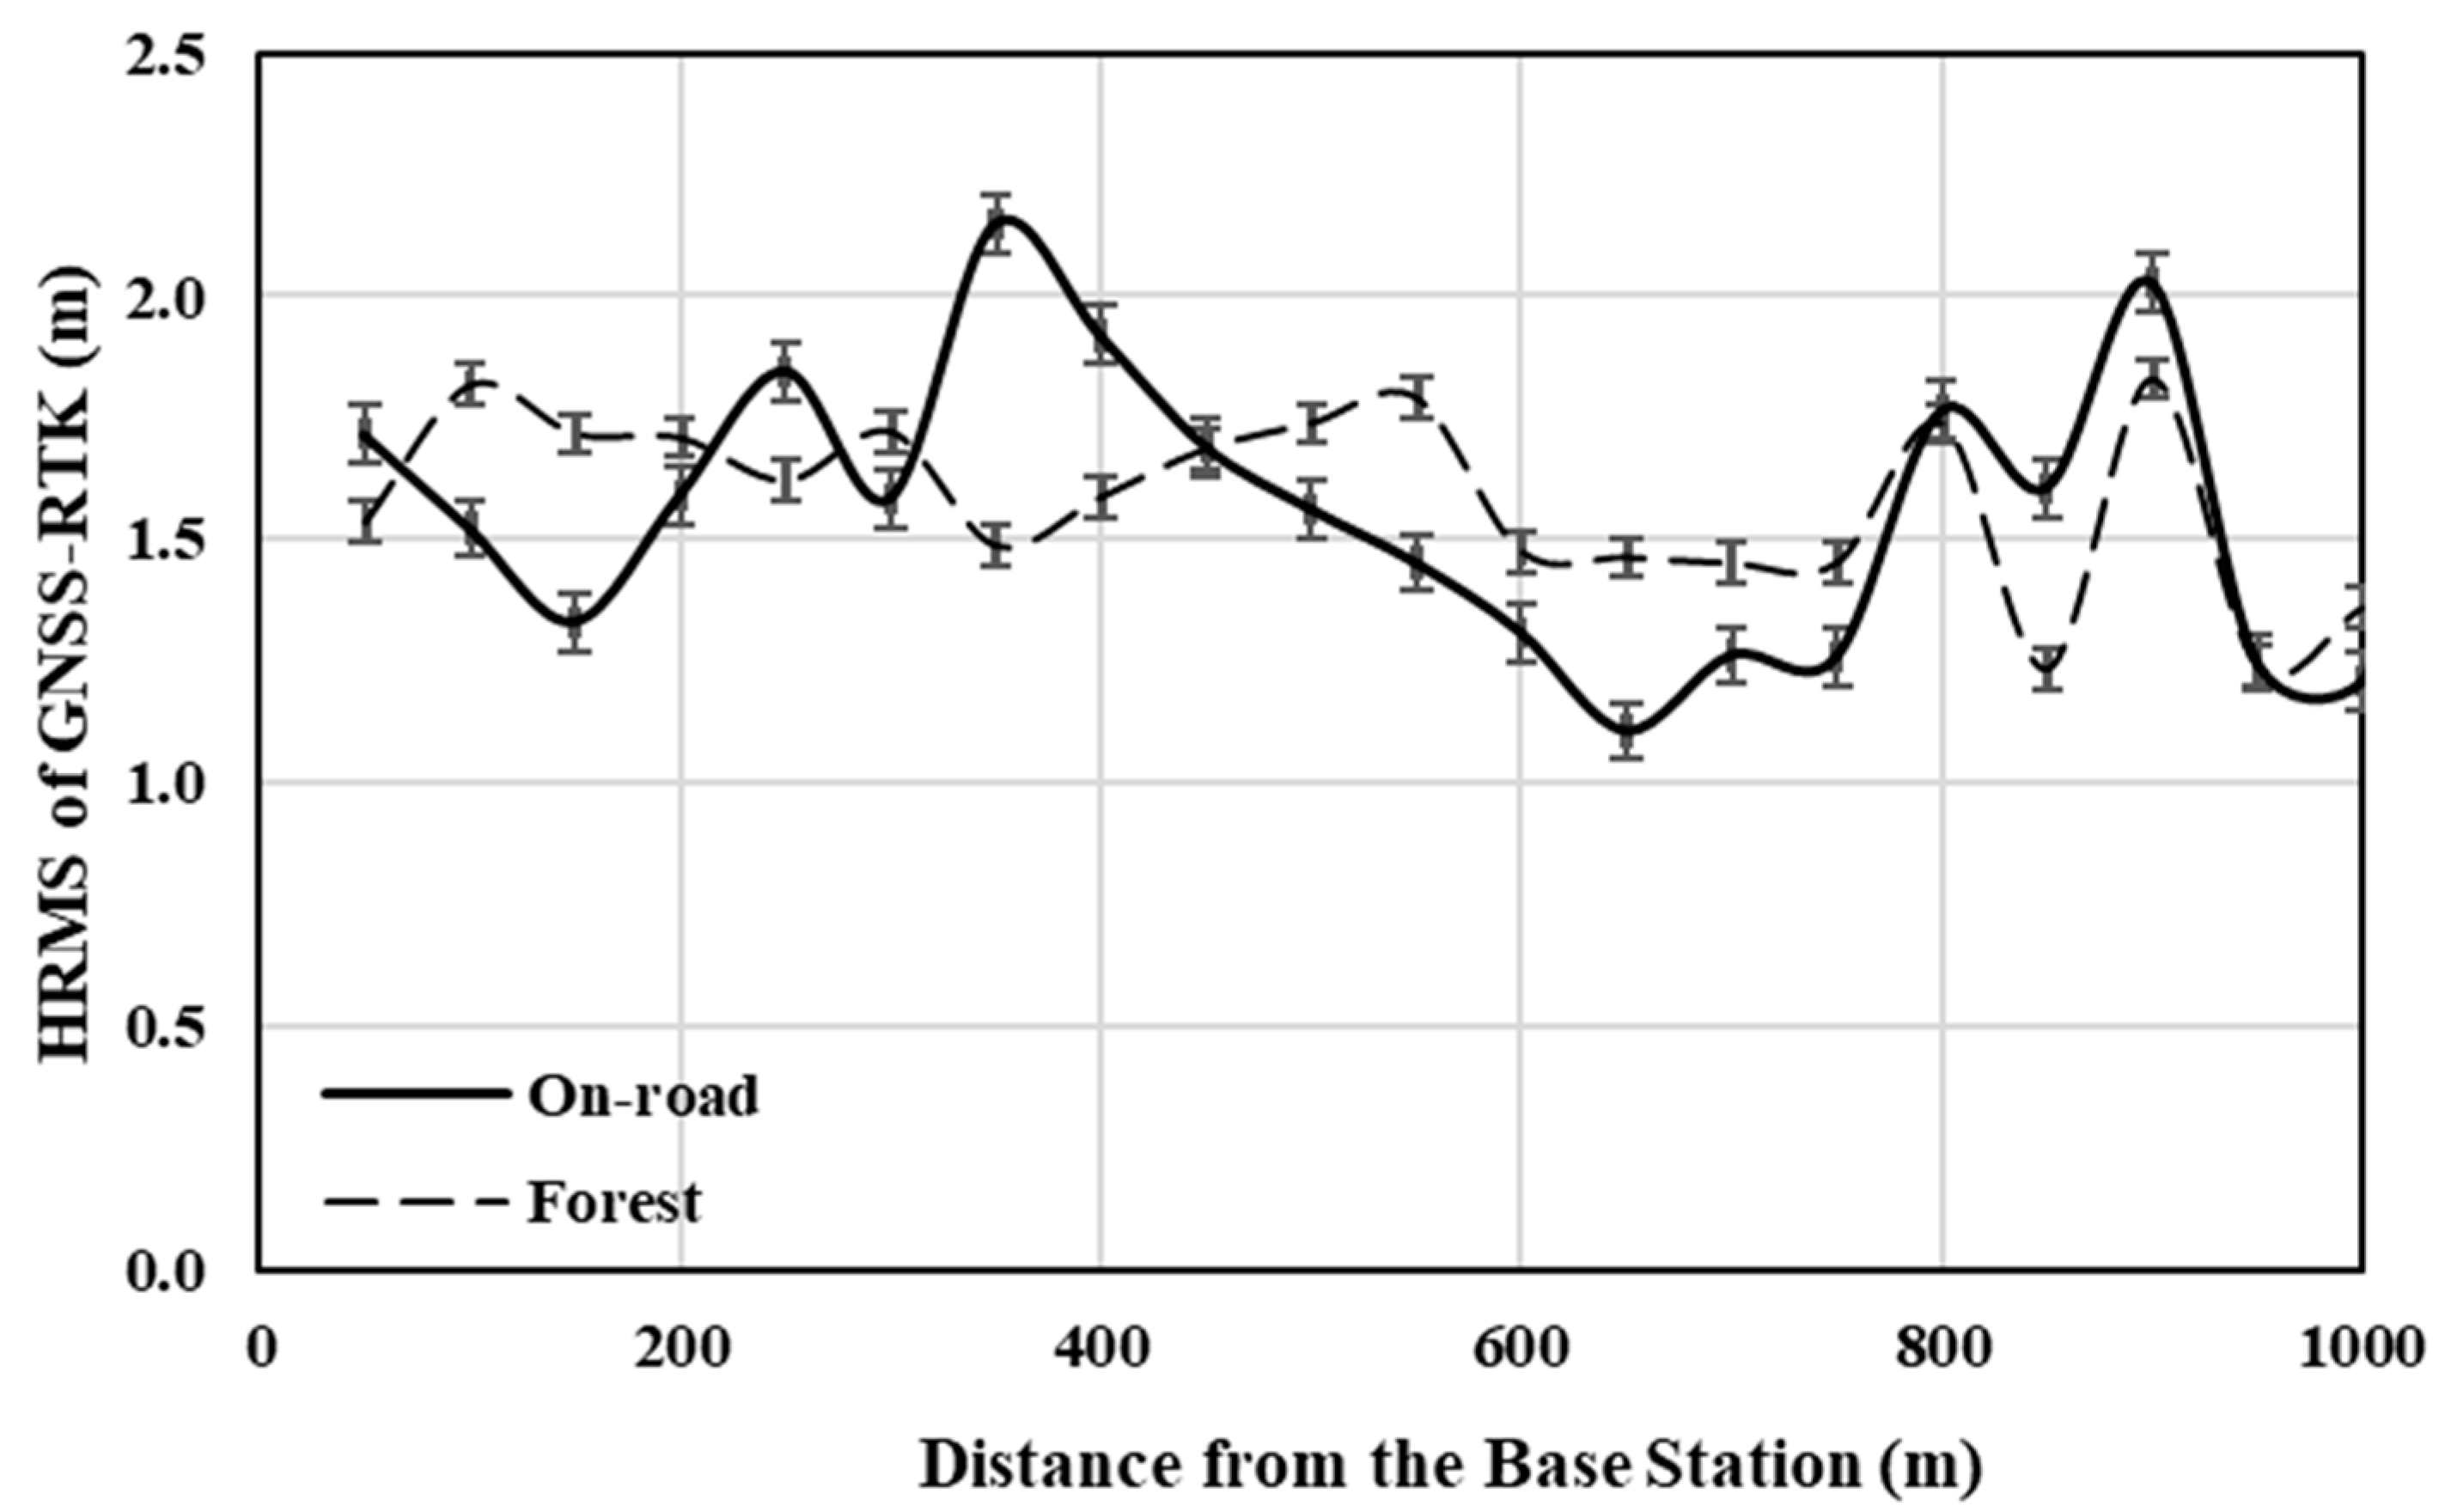
To investigate the impact of the distance between the rover and base station on the positioning precision of the GNSS-RTK, the horizontal root mean square (HRMS) was measured using the GNSS-RTK along the road at intervals of 50 m from the base station, up to a maximum of 1000 m. Surveys were conducted at 20 locations on the road and 71 locations in the forest (Table 6). The average HRMS on the forest road was approximately 1.5 m, with a standard deviation of approximately 0.3 m. The observed HRMS did not vary substantially as the distance from the base station increased (Figure 10). Moreover, in the forest, the HRMS varied from a minimum of 1.2 m to a maximum of 1.8 m, which was not greatly dependent on distance.
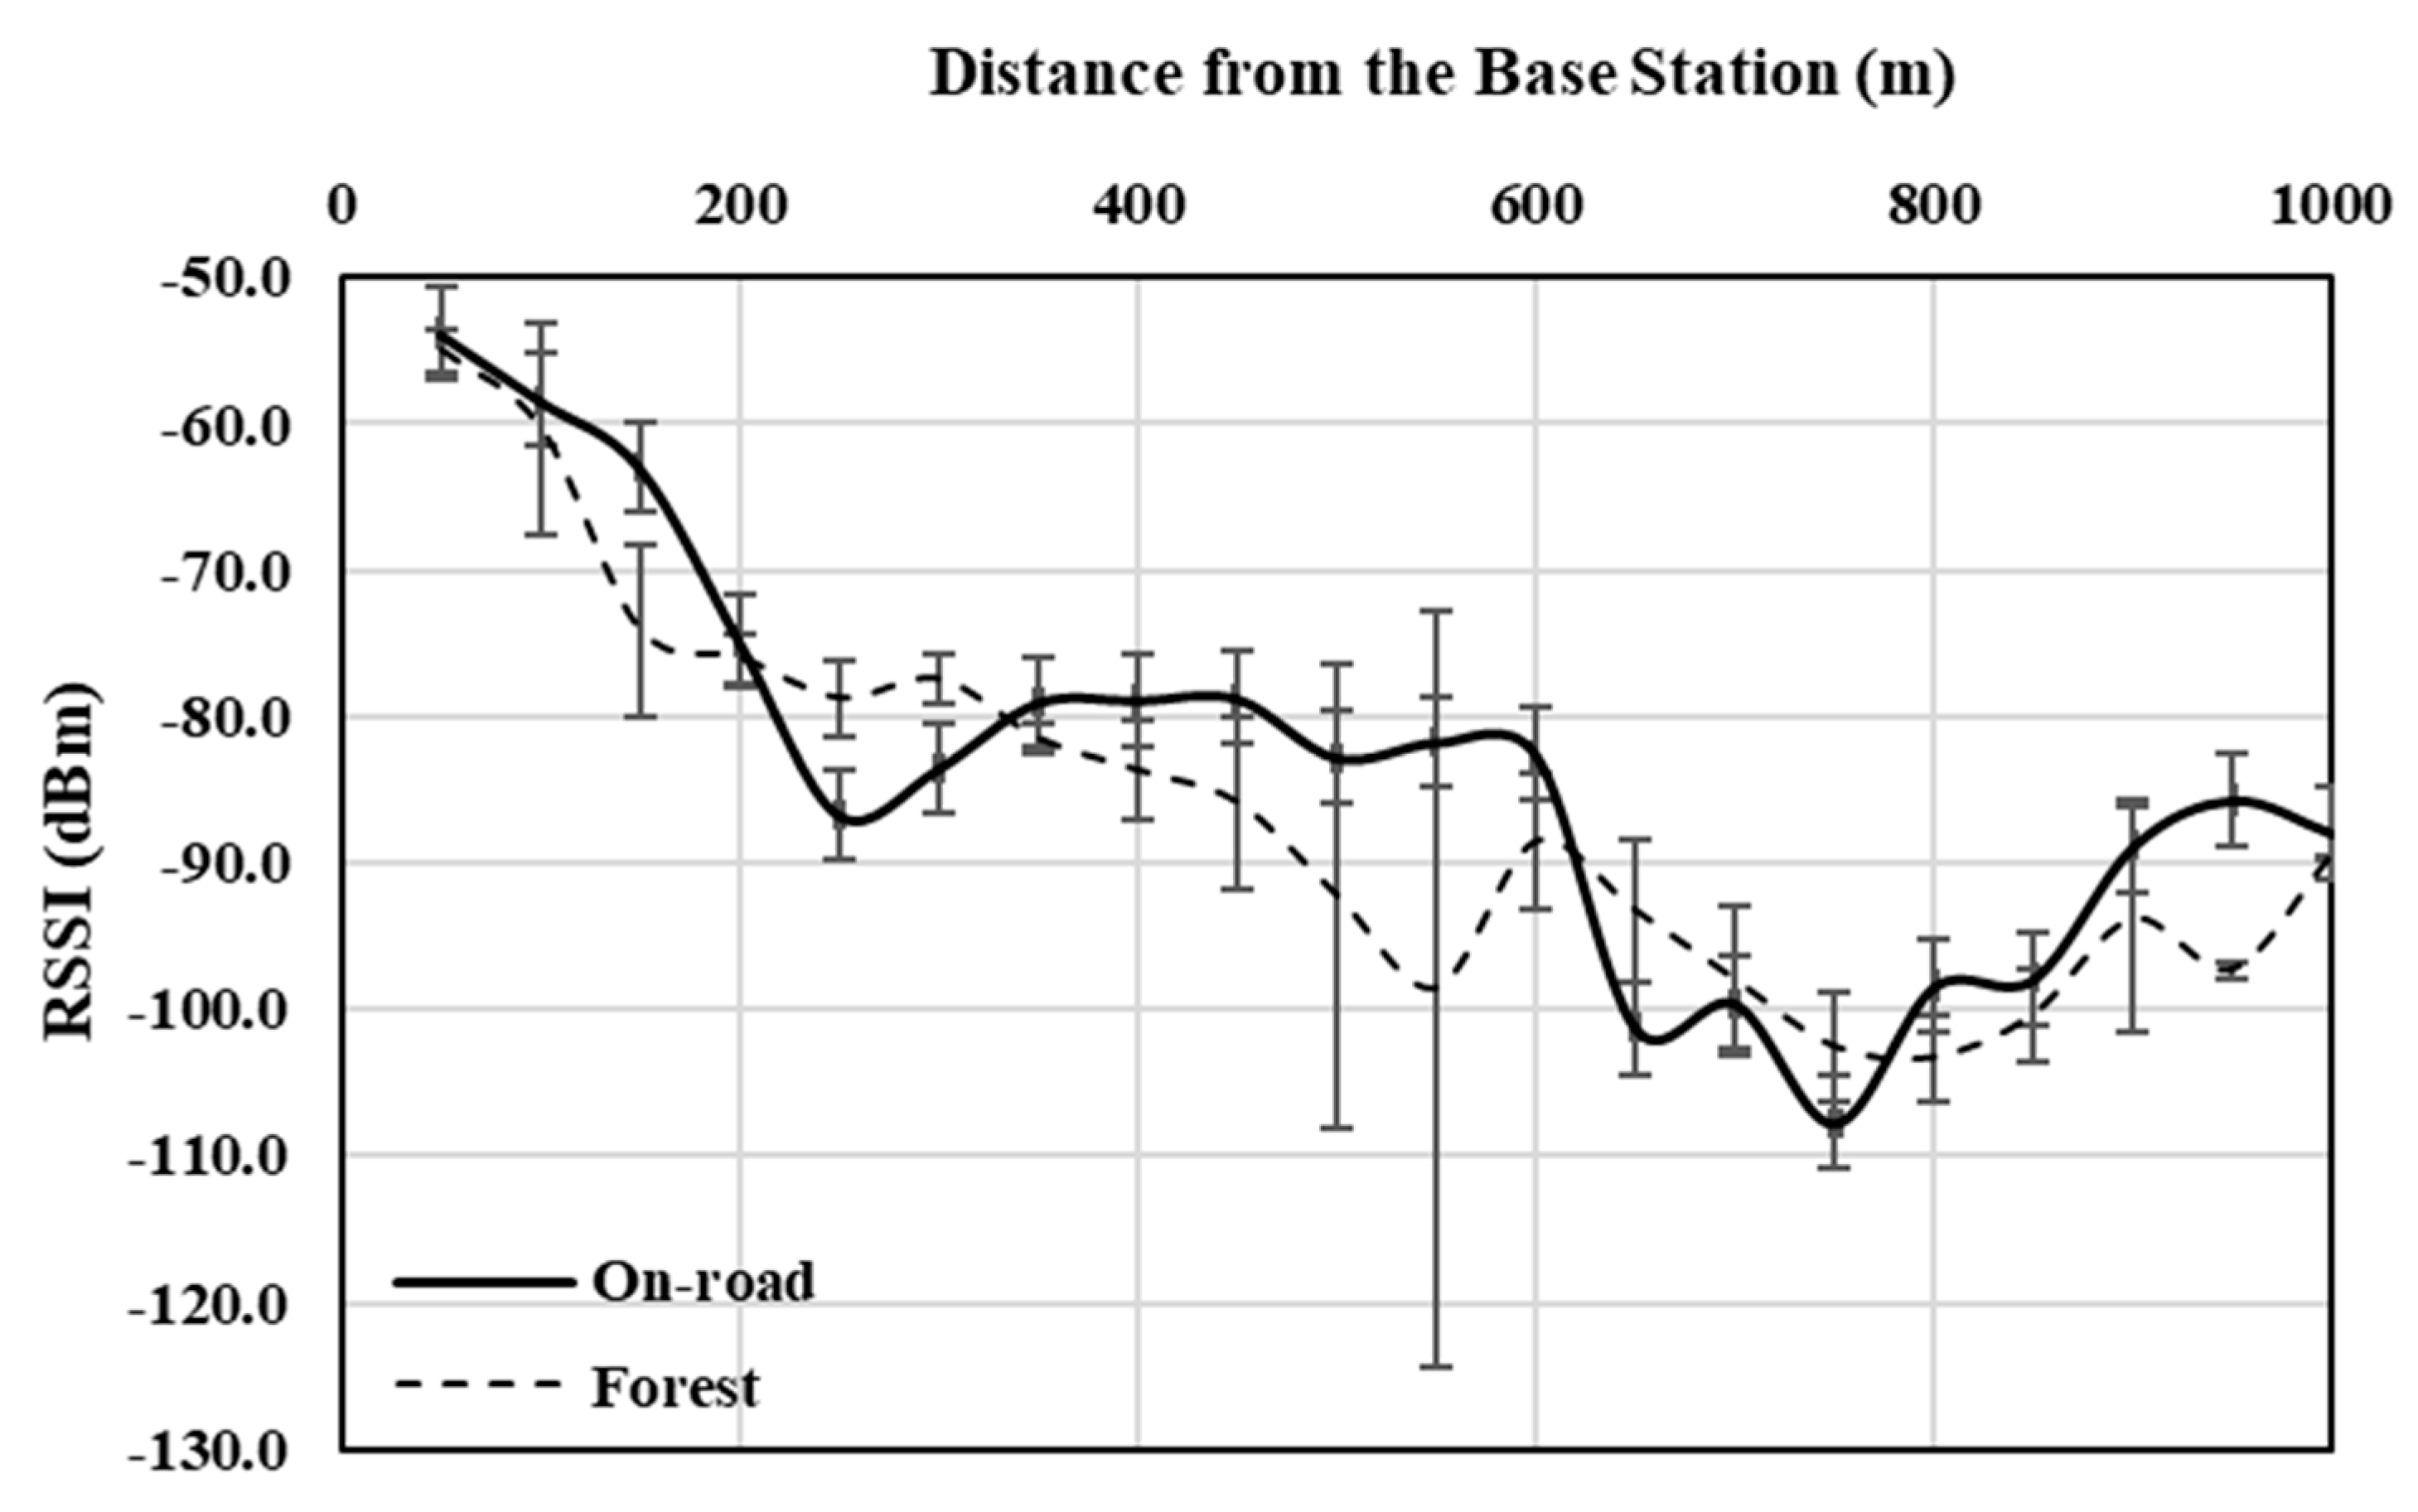
The GNSS-RTK transmits a real-time position-correction signal from the base station to the rover in the form of an RF signal. The RSSI is a crucial metric that can determine the feasibility of data transmission and the reception of RF signals. Therefore, the RSSI was measured at the same points where HRMS was investigated (Table 7). The results showed that, as the distance from the base station increased, the RSSI decreased on both the forest road and within the stand (Figure 11). Specifically, in the forest, there was a more substantial decrease in RSSI, ranging from a maximum of −55.0 dBm to a minimum of −103.3 dBm, compared to that on the forest road.
When using the GNSS-RTK in forests, its application can be divided into cases where it is used on forest roads or in clear-cut areas and areas enclosed by forest stands. Therefore, a paired Student’s t-test was conducted to analyze the influence of forest location on HRMS and RSSI (Table 8).
The paired Student’s t-test revealed that the average HRMS values at on-road and forest survey points were approximately 0.28 m and 0.18 m, respectively, showing no statistical significance (p > 0.05). The average measured RSSI value was approximately −83.56 dBm for on-road and −86.44 dBm for forest, showing no significant difference between the two locations (p > 0.05).
3.2.2. Relationship between RSSI, Horizontal Root Mean Square (HRMS), and the Distance from the Base Station
To determine whether there was a statistical correlation between the distance from the base station, the RSSI, and the HRMS of the GNSS-RTK, a cross-correlation analysis was conducted (Table 9). The correlation between the distance from the base station and RSSI was significant (p < 0.05). The Pearson correlation coefficient was −0.834, indicating a strong negative correlation. The results revealed a Pearson correlation coefficient of −0.274, indicating a significant negative correlation between the HRMS and distance (p < 0.05).
Additionally, there was a significant positive correlation between the RSSI and HRMS (p < 0.05), with a low explanatory correlation coefficient of 0.267. However, if the distance from the base station increases beyond the scope of this study, the radio signal may become unstable with a sharply decreased RSSI and cause an evident decrease in the HRMS, leading to the opposite result.
3.3. Study Limitations
This study evaluated the applicability of the GNSS-RTK within the experimental forests of Kangwon National University. A limitation of this study was that the geographical features of the research area were limited, which means that the impact of these features was not clearly delineated. Therefore, to improve the applicability of the GNSS-RTK to forest stands, further research is required in a wider range of areas that include various characteristics and environments.
4. Discussions
In Stream 1, the positioning accuracy of GNSS-RTK in the P. koraiensis stand was shown to be approximately 0.48 m on average. This was similar to a study conducted in a planned thinning area of a pine forest in western Finland, which reported an absolute error of 0.43 m for a low-cost GNSS-RTK [32]. Previous research has suggested that improved antenna performance in the GNSS-RTK yields higher positioning accuracy. However, despite the GNSS-RTK R12i used in this study being a relatively recent receiver model equipped with the latest sensors (post-2021), an accuracy performance similar to that of previous research was recorded. This is likely because of the steeper slopes and higher stand density of the study area, which led to greater interference with satellite signal reception.
In Stream 2, the HRMS value at on-road survey points was 0.28 on average, similar to the average value of 0.18 at forest survey points, showing no statistical significance despite the higher sky visibility at the on-road survey points. By contrast, de Bakker and Tiberius [33] showed that, as the openness of the sky increases, the positioning precision of the GNSS-RTK improves. This discrepancy in the results likely arose because forest roads were established horizontally along mountain contour lines in the study area. Despite the low canopy coverage on the roads, the relatively steep terrain of the mountain limits the number of satellites that the rover can receive signals from at both on-road and forest survey points. The RSSI value measured was approximately −83.56 dBm on average on-road and −86.44 dBm on average in forest, resulting in no significance in RSSI according to the locations. This result is attributed to the fact that the RF signal used for transmission operates in the ultra high-frequency bandwidth. Therefore, when located at the same distance from the base station, the signal can easily bypass physical obstacles and reach the receiver [34]. According to a study by Islam [35], the radio signal communication modem adopted in the GNSS can typically receive signals ranging from −40 dBm to −130 dBm depending on its sensitivity performance, while the received signal strength can be influenced by the maximum elevation angle of obstacles in the surrounding terrain that can block the RF signal. Ilci [36] determined that, under favorable weather and topographical conditions, the maximum usable range of the GNSS-RTK was within a radius of 5–10 km. However, in the current study, the HRMS improved as the distance increased and was assumed to be influenced more by factors such as terrain, atmospheric conditions, and forest environment than by the RSSI quality.
A few limitations of this research were found during the analysis stages, and one of them was the geolocational issue of the research sites. The research site chosen in Stream 1 comprised a total of 10 sample plots. On these research plots, the accuracy of GNSS-RTK was derived and analyzed with the forest environmental factors. The characteristics of the plots were similar to each other by species. Therefore, it was possible to derive a reliable result for the accuracy and applicability of GNSS-RTK in a forest by validating the numeral identical set of data. However, there was difficulty in analyzing the correlation and influence of forest environmental factors on the positioning accuracy of GNSS-RTK due to a lack of variance in the characteristics of each research plot. As a minor regression model to the RMSE of positioning error was developed in the present study, this might be improved with data collected from larger and more dynamic forest conditions in further studies.
Also, it is crucial to know the actual position of the certain position to calculate the actual positioning error of the GNSS-RTK system in this research. Therefore, the coordinates of the target points were surveyed using a LiDAR sensor in Stream 1. However, it was challenging to collect the reference coordinates at every single survey point using LiDAR in Stream 2 due to the rugged terrain of the forest. Therefore, we analyzed the HRMS as the relative positioning accuracy that shows positioning precision reliability, which means how close the measured points are to one another. Consequently, the reported accuracy of GNSS-RTK in Streams 1 and 2 has led to difficulties in directly interpreting the results. This can be improved by structuring the methodology more rigorously in relation to the collection of reference position coordinates.
Arguably, this research employed a methodology that inevitably yields predictable results regarding the correlations with the RSSI. It is known that the accuracy of GNSS-RTK begins to vary significantly only when the distance to the base station exceeds tens of kilometers [37]. Also, the RSSI can influence the accuracy of the GNSS-RTK only when the radio signal transmitted from the base station does not reach the rover, regardless of the decrease in its value. However, the nominal transmission range of the radio signal of the GNSS-RTK equipment used in this study was set at 5 km maximum, at 2 W of transmission power due to the enforcement decree of the Radio Waves Act in South Korea. In this circumstance, the findings of this research, which are somewhat predictable, can be beneficial in reducing the hesitation among individual forest managers and decision-makers to utilize the GNSS-RTK in forest operations. In further study, it might be valuable to find the certain threshold range of the GNSS-RTK in larger and more varied forest environments.
5. Conclusions
This study was conducted to evaluate the feasibility of using the GNSS-RTK as a navigation system for determining the real-time location of trees selected for logging relative to the location of workers in smart thinning operations. To achieve our aim, we analyzed the positioning accuracy of the GNSS-RTK in forest stands and investigated its relationship with forest environmental factors and studied the operational range of the single-baseline RTK by analyzing the HRMS and RSSI based on the distance from the base station.
In the analysis of the positioning accuracy of the GNSS-RTK in P. koraiensis and L. kaempferi stands, the L. kaempferi stand showed a better positioning error RMSE, with an average of 0.26 m compared with that of 0.48 m in the P. koraiensis stand. This difference was attributed to the spatial enclosure caused by the higher stand density and basal area of the P. koraiensis stand, despite having a canopy coverage level similar to that of the L. kaempferi stand. Additionally, the characteristic of P. koraiensis having a higher leaf area index than L. kaempferi suggests that even if the analyzed canopy coverage is similar on a planar basis, greater signal interference occurs in P. koraiensis stands. Considering that the average DBH of the individual trees in the entire research area was approximately 27.6 cm, the absolute positioning error was less than 1.5 times the DBH in both forest stands. This indicates that, even with errors, workers are likely to be able to identify and reach the targeted trees during smart thinning operation. Furthermore, among the forest environmental factors, canopy coverage and tree height were significantly correlated with the positioning error RMSE. The results of the multiple linear regression analysis showed that the factors that simultaneously influenced the positioning error RMSE, in order of impact, were basal area, TPI, tree height, ground height, and canopy coverage.
Regarding the operational range of the GNSS-RTK, we determined that as the distance between the base station and rover increased, the HRMS tended to improve, whereas the RSSI significantly decreased, showing a negative correlation. Within a radius of 1 km, the RSSI values were observed to be above the sensitivity limit of the GNSS-RTK radio signal communication module, supporting the fact that distance does not affect the degradation of HRMS where the radio signal can be received regardless of the RSSI. However, in actual operation, when the distance between the rover and the base station exceeds 1 km, HRMS is not guaranteed. For smooth utilization of the equipment, it may be necessary to move the location of the base station or install a repeater for the multi-baseline RTK system. The results of this study provide a valuable reference for the use of the GNSS-RTK within smart thinning forestry operations.
Author Contributions
Conceptualization, J.-S.L., J.-W.P. and S.-K.H.; Methodology, H.-M.C. and S.-K.H.; Validation, J.-W.P. and S.-K.H.; Formal Analysis, H.-M.C. and S.-K.H.; Investigation, H.-M.C. and S.-K.H.; Resources, J.-S.L.; Data Curation, H.-M.C. and J.-W.P.; Writing—Original Draft Preparation, H.-M.C. and S.-K.H.; Writing—Review & Editing, H.-M.C., J.-S.L., J.-W.P. and S.-K.H.; Visualization, H.-M.C. and S.-K.H.; Supervision, S.-K.H.; Project Administration, J.-S.L., J.-W.P. and S.-K.H.; Funding Acquisition, S.-K.H. All authors have read and agreed to the published version of the manuscript.
Funding
This study was carried out with the support of ‘R&D Program for Forest Science Technology (Project No. 2021359D10-2323-BD01)’ provided by Korea Forest Service (Korea Forestry Promotion Institute).
Data Availability Statement
Data is contained within the article.
Conflicts of Interest
The authors declare no conflicts of interest.
References
- Gingras, J.F.; Charrette, F. FPInnovations’ New Forestry 4.0 Initiative. In Proceedings of the Council on Forest Engineering meeting, Bangor, ME, USA, 30 July 2017. [Google Scholar]
- Henning, K.; Wolfgang, W.; Johannes, H. Recommendations for Implementing the Strategic Initiative INDUSTRIE 4.0; Federal Ministry of Education and Research: Berlin, Germany, 2013.
- Hermann, M.; Pentek, T.; Otto, B. Design Principles for Industrie 4.0 Scenarios. In Proceedings of the 49th Hawaii International Conference on System Sciences, Koloa, HI, USA, 5–8 January 2016. [Google Scholar]
- Han, S.K.; Cho, M.J.; Baek, S.A.; Yun, J.U.; Cha, D.S. The Characteristics of Residual Stand Damages Caused by Skyline Thinning Operations in Mixed Conifer Stands in South Korea. J. For. Environ. Sci. 2019, 35, 197–204. [Google Scholar]
- Cho, M.J.; Choi, Y.S.; Oh, J.H.; Mun, H.S.; Han, S.K. Comparison of harvesting productivity, cost, and residual stand damages between single-tree selection thinning and mechanized line thinning using a small-scale grapple-saw. For. Sci. Technol. 2022, 18, 45–55. [Google Scholar] [CrossRef]
- Ko, C.; Lee, S.; Yim, J.; Kim, D.; Kang, J. Comparison of Forest Inventory Methods at Plot-Level between a Backpack Personal Laser Scanning (BPLS) and Conventional Equipment in Jeju Island, South Korea. Forests 2021, 12, 308. [Google Scholar] [CrossRef]
- Cho, H.M.; Oh, J.H.; Park, J.W.; Choi, Y.S.; Lee, J.S.; Han, S.K. Application of Real-time Positioning Systems to a Forest Stand for Precision Forest Management. Sens. Mater. 2022, 34, 4651–4668. [Google Scholar] [CrossRef]
- Beland, M.; Parker, G.; Sparrow, B.; Harding, D.; Chasmer, L.; Phinn, S.; Antonarakis, A.; Strahler, A. On promoting the use of lidar systems in forest ecosystem research. For. Ecol. Manag. 2019, 450, 117484. [Google Scholar] [CrossRef]
- Chisholm, R.A.; Cui, J.; Lum, S.K.Y.; Chen, B.M. UAV LiDAR for below-canopy forest surveys. J. Unmanned Veh. Syst. 2013, 1, 61–68. [Google Scholar] [CrossRef]
- Molina-Valero, J.A.; Villamayor, M.J.G.; Perez, M.A.N.; Alvarez-Gonzalez, J.G.; Montes, F.; Martinez-Calvo, A.; Perez-Cruzado, C. FORTLS: An R Package for Processing TLS Data and Estimating Stand Variables in Forest Inventories. Environ. Sci. Proc. 2021, 3, 38. [Google Scholar]
- Torre-Tojal, L.; Bastarrika, A.; Boyano, A.; Lopez-Guede, J.M.; Grana, M. Above-ground biomass estimation from LiDAR data using random forest algorithms. J. Comput. Sci. 2022, 58, 101517. [Google Scholar] [CrossRef]
- Pourshamsi, M.; Xia, J.; Yokoya, N.; Garcia, M.; Lavalle, M.; Pottier, E.; Balzter, H. Tropical forest canopy height estimation from combined polarimetric SAR and LiDAR using machine-learning. ISPRS J. Photogramm. Remote Sens. 2021, 172, 79–94. [Google Scholar] [CrossRef]
- Corte, A.P.D.; Souza, D.V.; Rex, F.E.; Sanquetta, C.R.; Mohan, M.; Silva, C.A.; Zambrano, A.M.A.; Prata, G.; de Almeida, D.R.A.; Trautenmuller, J.W.; et al. Forest inventory with high-density UAV-Lidar: Machine learning approaches for predicting individual tree attributes. Comput. Electron. Agric. 2020, 179, 105815. [Google Scholar] [CrossRef]
- Lee, Y.K.; Lee, J.S.; Park, J.W. A Study on Classification of Crown Classes and Selection of Thinned Trees for Major Conifers Using Machine Learning Techniques. J. Korean Soc. For. Sci. 2022, 111, 302–310. [Google Scholar]
- Nuutinen, Y.; Miina, J.; Saksa, T.; Bergstrom, D.; Routa, J. Comparing the characteristics of boom-corridor and selectively thinned stands of Scots pine and birch. Silva Fenn. 2021, 55, 10462. [Google Scholar] [CrossRef]
- Zimbelman, E.G.; Keefe, R.F. Real-time positioning in logging: Effects of forest stand characteristics, topography, and line-of-sight obstructions on GNSS-RF transponder accuracy and radio signal propagation. PLoS ONE 2018, 13, e0191017. [Google Scholar] [CrossRef] [PubMed]
- Gallo, R.; Grigolato, S.; Cavalli, R.; Mazzetto, F. GNSS-based operational monitoring devices for forest logging operation chains. J. Agric. Eng. 2013, 44 (Suppl. S2), 27. [Google Scholar] [CrossRef]
- Zaidi, A.S.; Suddle, M.R. Global Navigation Satellite Systems: A Survey. In Proceedings of the International Conference on Advances in Space Technologies, Islamabad, Pakistan, 2–3 September 2006. [Google Scholar]
- Kim, H.; Hyun, C.U.; Park, H.D.; Cha, J. Image Mapping Accuracy Evaluation Using UAV with Standalone, Differential (RTK), and PPP GNSS Positioning Techniques in an Abandoned Mine Site. Sensors 2023, 23, 5858. [Google Scholar] [CrossRef]
- Klimanek, M. Analysis of the accuracy of GPS Trimble Juno ST measurement in the conditions of forest canopy. J. For. Sci. 2010, 56, 84–91. [Google Scholar] [CrossRef]
- Zhang, Z.; Li, Y.; He, X.; Chen, W.; Li, B. A composite stochastic model considering the terrain topography for real-time GNSS monitoring in canyon environments. J. Geod. 2022, 96, 79. [Google Scholar] [CrossRef]
- Zhang, Z.; Zeng, J.; Li, B.; He, X. Principles, methods and applications of cycle slip detection and repair under complex observation conditions. J. Geod. 2023, 97, 50. [Google Scholar] [CrossRef]
- Reid, T.G.R.; Pervez, N.; Ibrahim, U.; Houts, S.E.; Pandey, G.; Alla, N.K.R.; Hsia, A. Standalone and RTK GNSS on 30,000 km of North American Highways. In Proceedings of the 32nd International Technical Meeting of the Satellite Division of the Institute of Navigation, Miami, FL, USA, 16–20 September 2019. [Google Scholar]
- Gumilar, I.; Bramanto, B.; Rahman, F.F.; Hermawan, I.M.D.A. Variability and Performance of Short to Long-Range Single Baseline RTK GNSS Positioning in Indonesia. E3S Web Conf. 2019, 94, 01012. [Google Scholar] [CrossRef]
- Ogutcu, S.; Kalayci, I. Accuracy and precision of network-based RTK techniques as a function of baseline distance and occupation time. Arab. J. Geosci. 2018, 11, 354. [Google Scholar] [CrossRef]
- Riemann, A.I.; Evans, N.E. The incidence of radio-frequency impulsive noise within hospital buildings: Initial measurements in the 450 MHz band. Med. Eng. Phys. 1999, 21, 567–574. [Google Scholar] [CrossRef]
- Grewal, M.S.; Andrews, A.P.; Bartone, C.G. Global Navigation Satellite Systems, Inertial Navigation, and Integration, 4th ed.; Wiley & Sons, Inc.: Hoboken, NJ, USA, 2020; p. 34. [Google Scholar]
- Iswandi; Nastiti, H.T.; Praditya, I.E.; Mustika, I.W. Evaluation of XBee-Pro Transmission Range for Wireless Sensor Network’s Node under Forested Environments Based on Received Signal Strength Indicator (RSSI). In Proceedings of the 2nd International Conference on Science and Technology-Computer (ICST), Yogyakarta, Indonesia, 27–28 October 2016. [Google Scholar]
- Michalowska, M.; Rapinski, J.; Janicka, J. Tree position estimation from TLS data using hough transform and robust least-squares circle fitting. Remote Sens. Appl. Soc. Environ. 2023, 29, 100863. [Google Scholar] [CrossRef]
- Carreno-Luengo, H.; Luzi, G.; Crosetto, M. First Evaluation of Topography on GNSS-R: An Empirical Study Based on a Digital Elevation Model. Remote Sens. 2019, 11, 2556. [Google Scholar] [CrossRef]
- Lee, D.; Jung, S.; Choi, J. Analysis of Tree Growth Characteristics by First and Second Thinning in Korean White Pine Plantations. J. Korean Soc. For. Sci. 2022, 111, 150–164. [Google Scholar]
- Abdi, O.; Uusitalo, J.; Pietarinen, J.; Lajunen, A. Evaluation of Forest Features Determining GNSS Positioning Accuracy of a Novel Low-Cost, Mobile RTK System Using LiDAR and TreeNet. Remote Sens. 2022, 14, 2856. [Google Scholar] [CrossRef]
- de Bakker, P.F.; Tiberius, C.C.J.M. Real-time multi-GNSS single-frequency precise point positioning. GPS Solut. 2017, 21, 1791–1803. [Google Scholar] [CrossRef]
- Keefe, R.F.; Wempe, A.M.; Becker, R.M.; Zimbelman, E.G.; Nagler, E.S.; Gilbert, S.L.; Caudill, C.C. Positioning Methods and the Use of Location and Activity Data in Forests. Forests 2019, 10, 458. [Google Scholar] [CrossRef]
- Islam, S. Infrastructure-less Positioning: Localization in GNSS-denied Environments. Master’s Thesis, Tampere University, Tampere, Finland, 2019. [Google Scholar]
- Ilci, V. Accuracy comparison of real-time GNSS positioning solutions: Case study of Mid-North Anatolia. Measurement 2019, 142, 40–47. [Google Scholar] [CrossRef]
- Omogunloye, O.G.; Okorocha, C.V.; Ojegbile, B.M.; Odumosu, J.O.; Ajayi, O.G. Comparative analysis of the standard error in relative GNSS positioning for short, medium and long baselines. J. Geomat. 2017, 11, 207–217. [Google Scholar]
Figure 1.
Experimental design of the study.

Figure 2.
(a) Larix kaempferi research plots of Stream 1, (b) Pinus koraiensis research plots of Stream 1, and (c) research site of Stream 2.
Figure 2.
(a) Larix kaempferi research plots of Stream 1, (b) Pinus koraiensis research plots of Stream 1, and (c) research site of Stream 2.

Figure 3.
(a) Survey location of an individual tree, and (b) photo of positioning survey.

Figure 4.
Canopy coverage data acquisition method by converting (a) overhead photos of the survey locations to (b) binary images.
Figure 4.
Canopy coverage data acquisition method by converting (a) overhead photos of the survey locations to (b) binary images.

Figure 5.
Analysis method of global navigation satellite system real-time kinematic (GNSS-RTK) positioning accuracy.
Figure 5.
Analysis method of global navigation satellite system real-time kinematic (GNSS-RTK) positioning accuracy.

Figure 6.
Survey points sampling method using ArcGIS Pro.

Figure 7.
Survey points for global navigation satellite system real-time kinematic (GNSS-RTK) precision and radio signal strength index (RSSI) at 50 m intervals from the base station.
Figure 7.
Survey points for global navigation satellite system real-time kinematic (GNSS-RTK) precision and radio signal strength index (RSSI) at 50 m intervals from the base station.

Figure 8.
Mapped horizontal positioning error of global navigation satellite system real-time kinematic (GNSS-RTK).
Figure 8.
Mapped horizontal positioning error of global navigation satellite system real-time kinematic (GNSS-RTK).


Figure 9.
Results of correlation analysis between root mean square error (RMSE) of horizontal positioning error and forest environmental factors.
Figure 9.
Results of correlation analysis between root mean square error (RMSE) of horizontal positioning error and forest environmental factors.


Figure 10.
Change in horizontal root mean square (HRMS) based on surveying location: on-road or forest.
Figure 10.
Change in horizontal root mean square (HRMS) based on surveying location: on-road or forest.

Figure 11.
Change in radio signal strength index (RSSI) based on the surveying location: on-road or forest.
Figure 11.
Change in radio signal strength index (RSSI) based on the surveying location: on-road or forest.


Table 1.
Forest characteristics of study plots in Stream 1.
| Plot No. | Stand Density (Trees/Ha) | DBH a (cm) | Tree Height (m) | Canopy Coverage (%) | |
|---|---|---|---|---|---|
| Larix kaempferi | 1 | 500 | 31.4 (22.3–38.2) | 27.6 (20.7–34.1) | 76.3 (59.1–86.9) |
| 2 | 325 | 31.3 (20.1–40.5) | 23.9 (13.5–28.3) | 78.3 (74.1–83.3) | |
| 3 | 425 | 33.9 (16.9–46.5) | 27.4 (10.2–33.3) | 69.7 (62.1–81.5) | |
| 4 | 325 | 37.7 (23.9–47.5) | 26.6 (17.6–32.6) | 74.9 (70.0–80.4) | |
| 5 | 575 | 31.0 (16.2–42.8) | 24.9 (13.2–29.7) | 68.6 (57.3–74.5) | |
| Avg. | 430 | 32.7 (16.2–47.5) | 26.1 (10.2–34.1) | 73.6 (53.3–86.9) | |
| Pinus koraiensis | 1 | 975 | 27.5 (12.9–43.0) | 19.9 (14.7–27.4) | 62.8 (51.6–70.9) |
| 2 | 725 | 29.9 (12.5–50.3) | 21.0 (14.6–24.8) | 70.8 (67.1–76.6) | |
| 3 | 1225 | 26.5 (15.0–47.0) | 17.6 (10.3–22.9) | 72.9 (67.8–76.6) | |
| 4 | 1300 | 26.5 (12.0–44.0) | 18.6 (15.1–23.3) | 65.2 (60.9–68.4) | |
| 5 | 900 | 29.0 (16.0–48.0) | 18.5 (15.4–21.9) | 78.5 (74.2–85.9) | |
| Avg. | 1025 | 27.6 (12.0–50.3) | 19.0 (10.3–27.4) | 70.0 (51.6–85.9) | |
a diameter at breast height.
Table 2.
Nominal specifications of the global navigation satellite system real-time kinematic equipment used in the research.
Table 2.
Nominal specifications of the global navigation satellite system real-time kinematic equipment used in the research.
| Content | Data | Image | ||
|---|---|---|---|---|
| Company | Trimble |  | ||
| Model | R12i | |||
| Satellite signal reception | GPS: L1C, L1C/A, L2C, L2E, L5 GLONASS: L1C/A, L1P, L2C/A, L2P, L3 SBAS: L1C/A, L5 Galileo: E1, E5A, E5B, E5 AltBOC, E62 BeiDou: B1, B1C, B2, B2A, B2B, B3 QZSS: L1C/A, L1S, L1C, L2C, L5, L6 NavIC (IRNSS): L5 | |||
| Positioning rate | 1 Hz, 2 Hz, 5 Hz, 10 Hz, 20 Hz | |||
| Positioning precision | Static | Horizontal: 3 mm + 0.1 ppm Vertical: 3.5 mm + 0.4 ppm | ||
| RTK | Single baseline | Horizontal: 8 mm + 1 ppm Vertical: 15 mm + 1 ppm | ||
| Network | Horizontal: 8 mm + 0.5 ppm Vertical: 15 mm + 0.5 ppm | |||
| Radio signal transmission power/range | 2 W/3–5 km | |||
| Hardware | Size: 11.9 (W) × 13.6 (H) cm Weight: 1.12 kg | |||
Table 3.
Root mean square error of horizontal positioning error of global navigation satellite system real-time kinematic in Larix kaempferi and Pinus koraiensis stands.
Table 3.
Root mean square error of horizontal positioning error of global navigation satellite system real-time kinematic in Larix kaempferi and Pinus koraiensis stands.
| RMSE a Unit: m | Larix kaempferi Stand | Pinus koraiensis Stand | ||||
|---|---|---|---|---|---|---|
| N | Mean | SD b | N | Mean | SD | |
| Plot 1 | 20 | 0.30 (0.06–0.93) | 0.17 | 33 | 0.44 (0.23–1.43) | 0.20 |
| Plot 2 | 12 | 0.25 (0.15–0.40) | 0.08 | 20 | 0.67 (0.22–1.26) | 0.31 |
| Plot 3 | 17 | 0.28 (0.17–0.41) | 0.07 | 44 | 0.43 (0.27–0.84) | 0.11 |
| Plot 4 | 11 | 0.26 (0.14–0.38) | 0.08 | 47 | 0.38 (0.10–1.52) | 0.21 |
| Plot 5 | 22 | 0.23 (0.12–0.38) | 0.09 | 35 | 0.59 (0.30–0.95) | 0.15 |
| Total | 82 | 0.26 (0.06–0.93) | 0.11 | 179 | 0.48 (0.10–1.52) | 0.21 |
a root mean square error; b standard deviation.
Table 4.
Results of multiple linear regression analysis to estimate root mean square error due to forest environmental factors.
Table 4.
Results of multiple linear regression analysis to estimate root mean square error due to forest environmental factors.
| Regression Equations | N | R2 | ANOVA | |||
|---|---|---|---|---|---|---|
| F | p-Value | |||||
| RMSE a of horizontal positioning error | = | +0.119 | 261 | 0.167 | 10.166 | 0.000 * |
| Canopy coverage | ||||||
| Basal area | ||||||
| Tree height | ||||||
| Branch height | ||||||
| TPI | ||||||
a root mean square error; * p < 0.05.
Table 5.
Results of multicollinearity analysis using the variance inflation factor.
| Forest Environmental Factor | VIF a |
|---|---|
| Canopy coverage | 1.056 |
| Basal area | 1.549 |
| Tree height | 2.050 |
| Branch height | 1.532 |
| TPI | 1.012 |
a variance inflation factor.
Table 6.
Mean and standard deviation of surveyed horizontal root mean square (HRMS) based on the distance from the base station.
Table 6.
Mean and standard deviation of surveyed horizontal root mean square (HRMS) based on the distance from the base station.
| Distance from the Base Station (m) | On-Road | Forest | ||||
|---|---|---|---|---|---|---|
| Number of Survey Points | HRMS a (m) | Number of Survey Points | HRMS (m) | |||
| Mean | SD | Mean | SD | |||
| 50 | 1 | 1.7 | N/A | 4 | 1.5 | 0.3 |
| 100 | 1 | 1.5 | 2 | 1.8 | 0.2 | |
| 150 | 1 | 1.3 | 4 | 1.7 | 0.4 | |
| 200 | 1 | 1.6 | 4 | 1.7 | 0.1 | |
| 250 | 1 | 1.8 | 4 | 1.6 | 0.6 | |
| 300 | 1 | 1.6 | 4 | 1.7 | 0.5 | |
| 350 | 1 | 2.1 | 4 | 1.5 | 0.3 | |
| 400 | 1 | 1.9 | 1 | 1.6 | 0.2 | |
| 450 | 1 | 1.7 | 2 | 1.7 | 0.1 | |
| 500 | 1 | 1.6 | 1 | 1.7 | 0.2 | |
| 550 | 1 | 1.5 | 4 | 1.8 | 0.3 | |
| 600 | 1 | 1.3 | 4 | 1.5 | 0.4 | |
| 650 | 1 | 1.1 | 1 | 1.5 | 0.4 | |
| 700 | 1 | 1.3 | 8 | 1.5 | 0.3 | |
| 750 | 1 | 1.3 | 7 | 1.5 | 0.2 | |
| 800 | 1 | 1.8 | 3 | 1.7 | 0.4 | |
| 850 | 1 | 1.6 | 6 | 1.2 | 0.1 | |
| 900 | 1 | 2.0 | 4 | 1.8 | 0.5 | |
| 950 | 1 | 1.2 | 2 | 1.2 | 0.2 | |
| 1000 | 1 | 1.2 | 2 | 1.4 | 0.0 | |
| Total | 20 | 1.5 | 0.3 | 71 | 1.6 | 0.2 |
a horizontal root mean square.
Table 7.
Mean and standard deviation of surveyed radio signal strength index (RSSI) based on the distance from the base station.
Table 7.
Mean and standard deviation of surveyed radio signal strength index (RSSI) based on the distance from the base station.
| Distance from the Base Station (m) | On-Road | Forest | ||||
|---|---|---|---|---|---|---|
| Number of Survey Points | RSSI a (dBm) | Number of Survey Points | RSSI (dBm) | |||
| Mean | SD | Mean | SD | |||
| 50 | 1 | –53.8 | N/A | 4 | –55.0 | 1.4 |
| 100 | 1 | –58.4 | 2 | –60.3 | 7.3 | |
| 150 | 1 | –62.9 | 4 | –74.1 | 5.9 | |
| 200 | 1 | –74.8 | 4 | –76.0 | 1.7 | |
| 250 | 1 | –86.7 | 4 | –78.8 | 2.7 | |
| 300 | 1 | –83.5 | 4 | –77.5 | 1.7 | |
| 350 | 1 | –79.0 | 4 | –81.5 | 1.0 | |
| 400 | 1 | –78.9 | 1 | –83.7 | 3.4 | |
| 450 | 1 | –78.7 | 2 | –85.9 | 5.9 | |
| 500 | 1 | –82.8 | 1 | –92.2 | 15.8 | |
| 550 | 1 | –81.7 | 4 | –98.6 | 25.8 | |
| 600 | 1 | –82.6 | 4 | –88.6 | 4.7 | |
| 650 | 1 | –101.3 | 1 | –93.3 | 4.9 | |
| 700 | 1 | –99.6 | 8 | –98.0 | 5.1 | |
| 750 | 1 | –107.7 | 7 | –102.6 | 3.8 | |
| 800 | 1 | –98.4 | 3 | –103.3 | 2.9 | |
| 850 | 1 | –97.9 | 6 | –100.4 | 3.3 | |
| 900 | 1 | –88.8 | 4 | –93.9 | 7.7 | |
| 950 | 1 | –85.7 | 2 | –97.3 | 0.5 | |
| 1000 | 1 | –88.0 | 2 | –89.5 | 0.1 | |
| Total | 20 | –83.6 | 14.0 | 71 | –86.4 | 13.6 |
a radio signal strength index.
Table 8.
Results of paired Student’s t-test for horizontal root mean square (HRMS) and radio signal strength index (RSSI) based on forest locations.
Table 8.
Results of paired Student’s t-test for horizontal root mean square (HRMS) and radio signal strength index (RSSI) based on forest locations.
| Category | Variable | N | Mean | SD | t | p-Value |
|---|---|---|---|---|---|---|
| HRMS a | On-road | 20 | 0.28 | 0.06 | 0.409 | 0.687 |
| Forest | 20 | 0.18 | 0.04 | |||
| RSSI b | On-road | 20 | −83.56 | 14.02 | −1.936 | 0.068 |
| Forest | 20 | −86.44 | 13.55 |
a horizontal root mean square; b radio signal strength index.
Table 9.
Cross-correlation matrix between the distance from the base station, radio signal strength index (RSSI), and horizontal root mean square (HRMS).
Table 9.
Cross-correlation matrix between the distance from the base station, radio signal strength index (RSSI), and horizontal root mean square (HRMS).
| Variables | Distance from the Base Station | RSSI | HRMS |
|---|---|---|---|
| Distance from the base station | 1 | −0.834 * | −0.274 * |
| RSSI a | - | 1 | 0.267 * |
| HRMS b | - | - | 1 |
a radio signal strength index; b horizontal root mean square; * p < 0.05.
Disclaimer/Publisher’s Note: The statements, opinions and data contained in all publications are solely those of the individual author(s) and contributor(s) and not of MDPI and/or the editor(s). MDPI and/or the editor(s) disclaim responsibility for any injury to people or property resulting from any ideas, methods, instructions or products referred to in the content. |
© 2023 by the authors. Licensee MDPI, Basel, Switzerland. This article is an open access article distributed under the terms and conditions of the Creative Commons Attribution (CC BY) license (https://creativecommons.org/licenses/by/4.0/).
Share and Cite
MDPI and ACS Style
Cho, H.-M.; Park, J.-W.; Lee, J.-S.; Han, S.-K. Assessment of the GNSS-RTK for Application in Precision Forest Operations. Remote Sens. 2024, 16, 148. https://doi.org/10.3390/rs16010148
AMA Style
Cho H-M, Park J-W, Lee J-S, Han S-K. Assessment of the GNSS-RTK for Application in Precision Forest Operations. Remote Sensing. 2024; 16(1):148. https://doi.org/10.3390/rs16010148
Chicago/Turabian StyleCho, Hyun-Min, Jin-Woo Park, Jung-Soo Lee, and Sang-Kyun Han. 2024. "Assessment of the GNSS-RTK for Application in Precision Forest Operations" Remote Sensing 16, no. 1: 148. https://doi.org/10.3390/rs16010148
Note that from the first issue of 2016, this journal uses article numbers instead of page numbers. See further details here.