
Aerosol Optical Depth Measurements from a Simulated Low-Cost Multi-Wavelength Ground-Based Camera: A Clear Case over a Peri-Urban Area

 , , , , and
Abstract
:1. Introduction
2. Data
2.1. Camera Observation
2.1.1. The HySpex Camera
2.1.2. The WaltRCam
2.2. Validation Data
2.2.1. AERONET
2.2.2. MODIS
3. Methodology
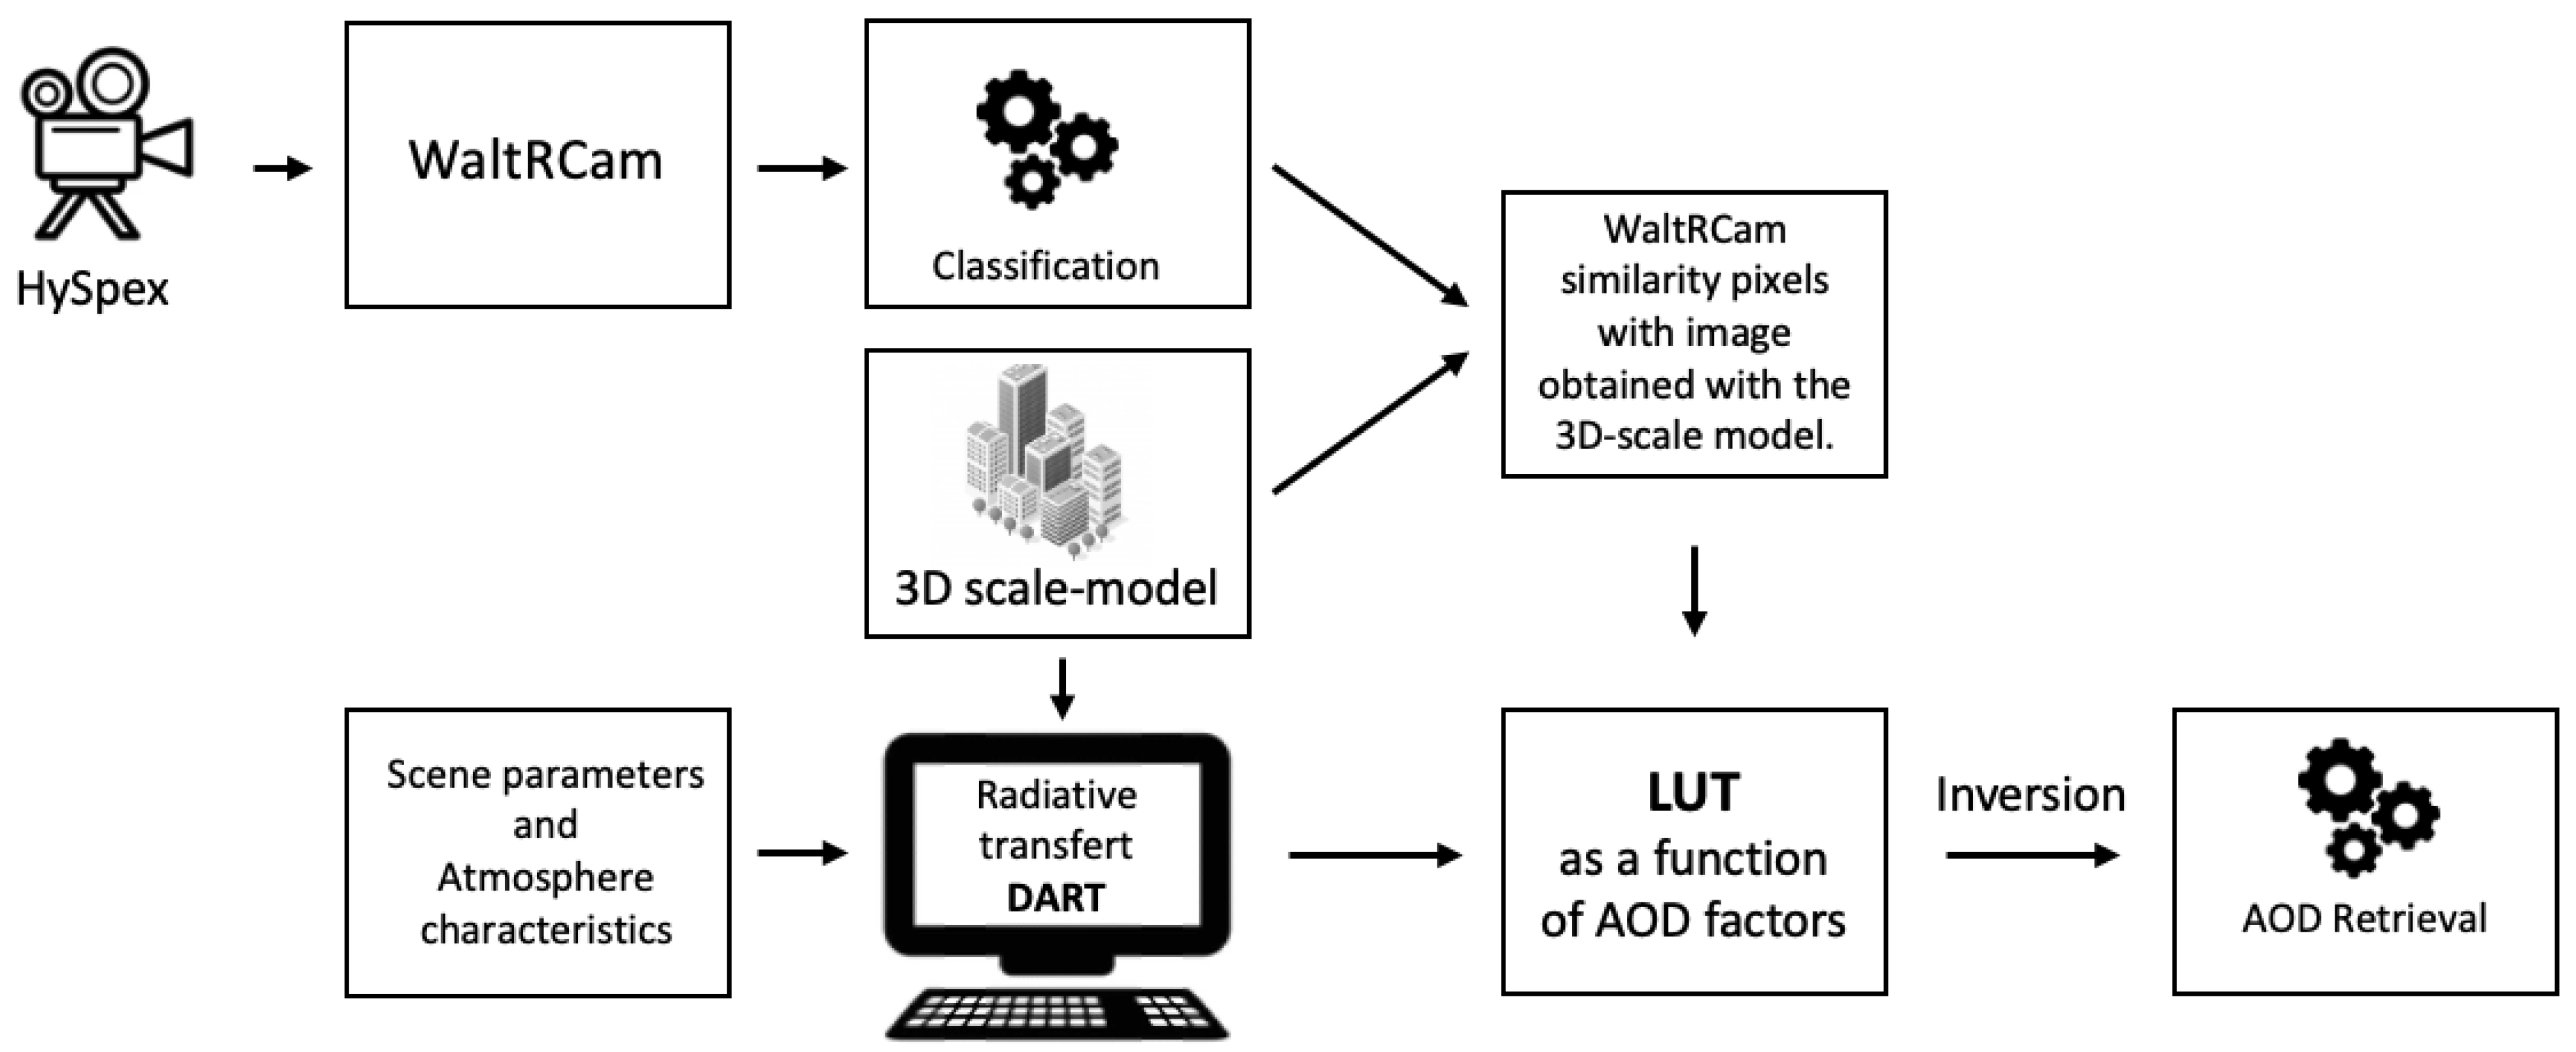
3.1. Processing Chain
3.2. The Toulouse 3D Scale-Model
3.2.1. Description
3.2.2. Camera Position Settings
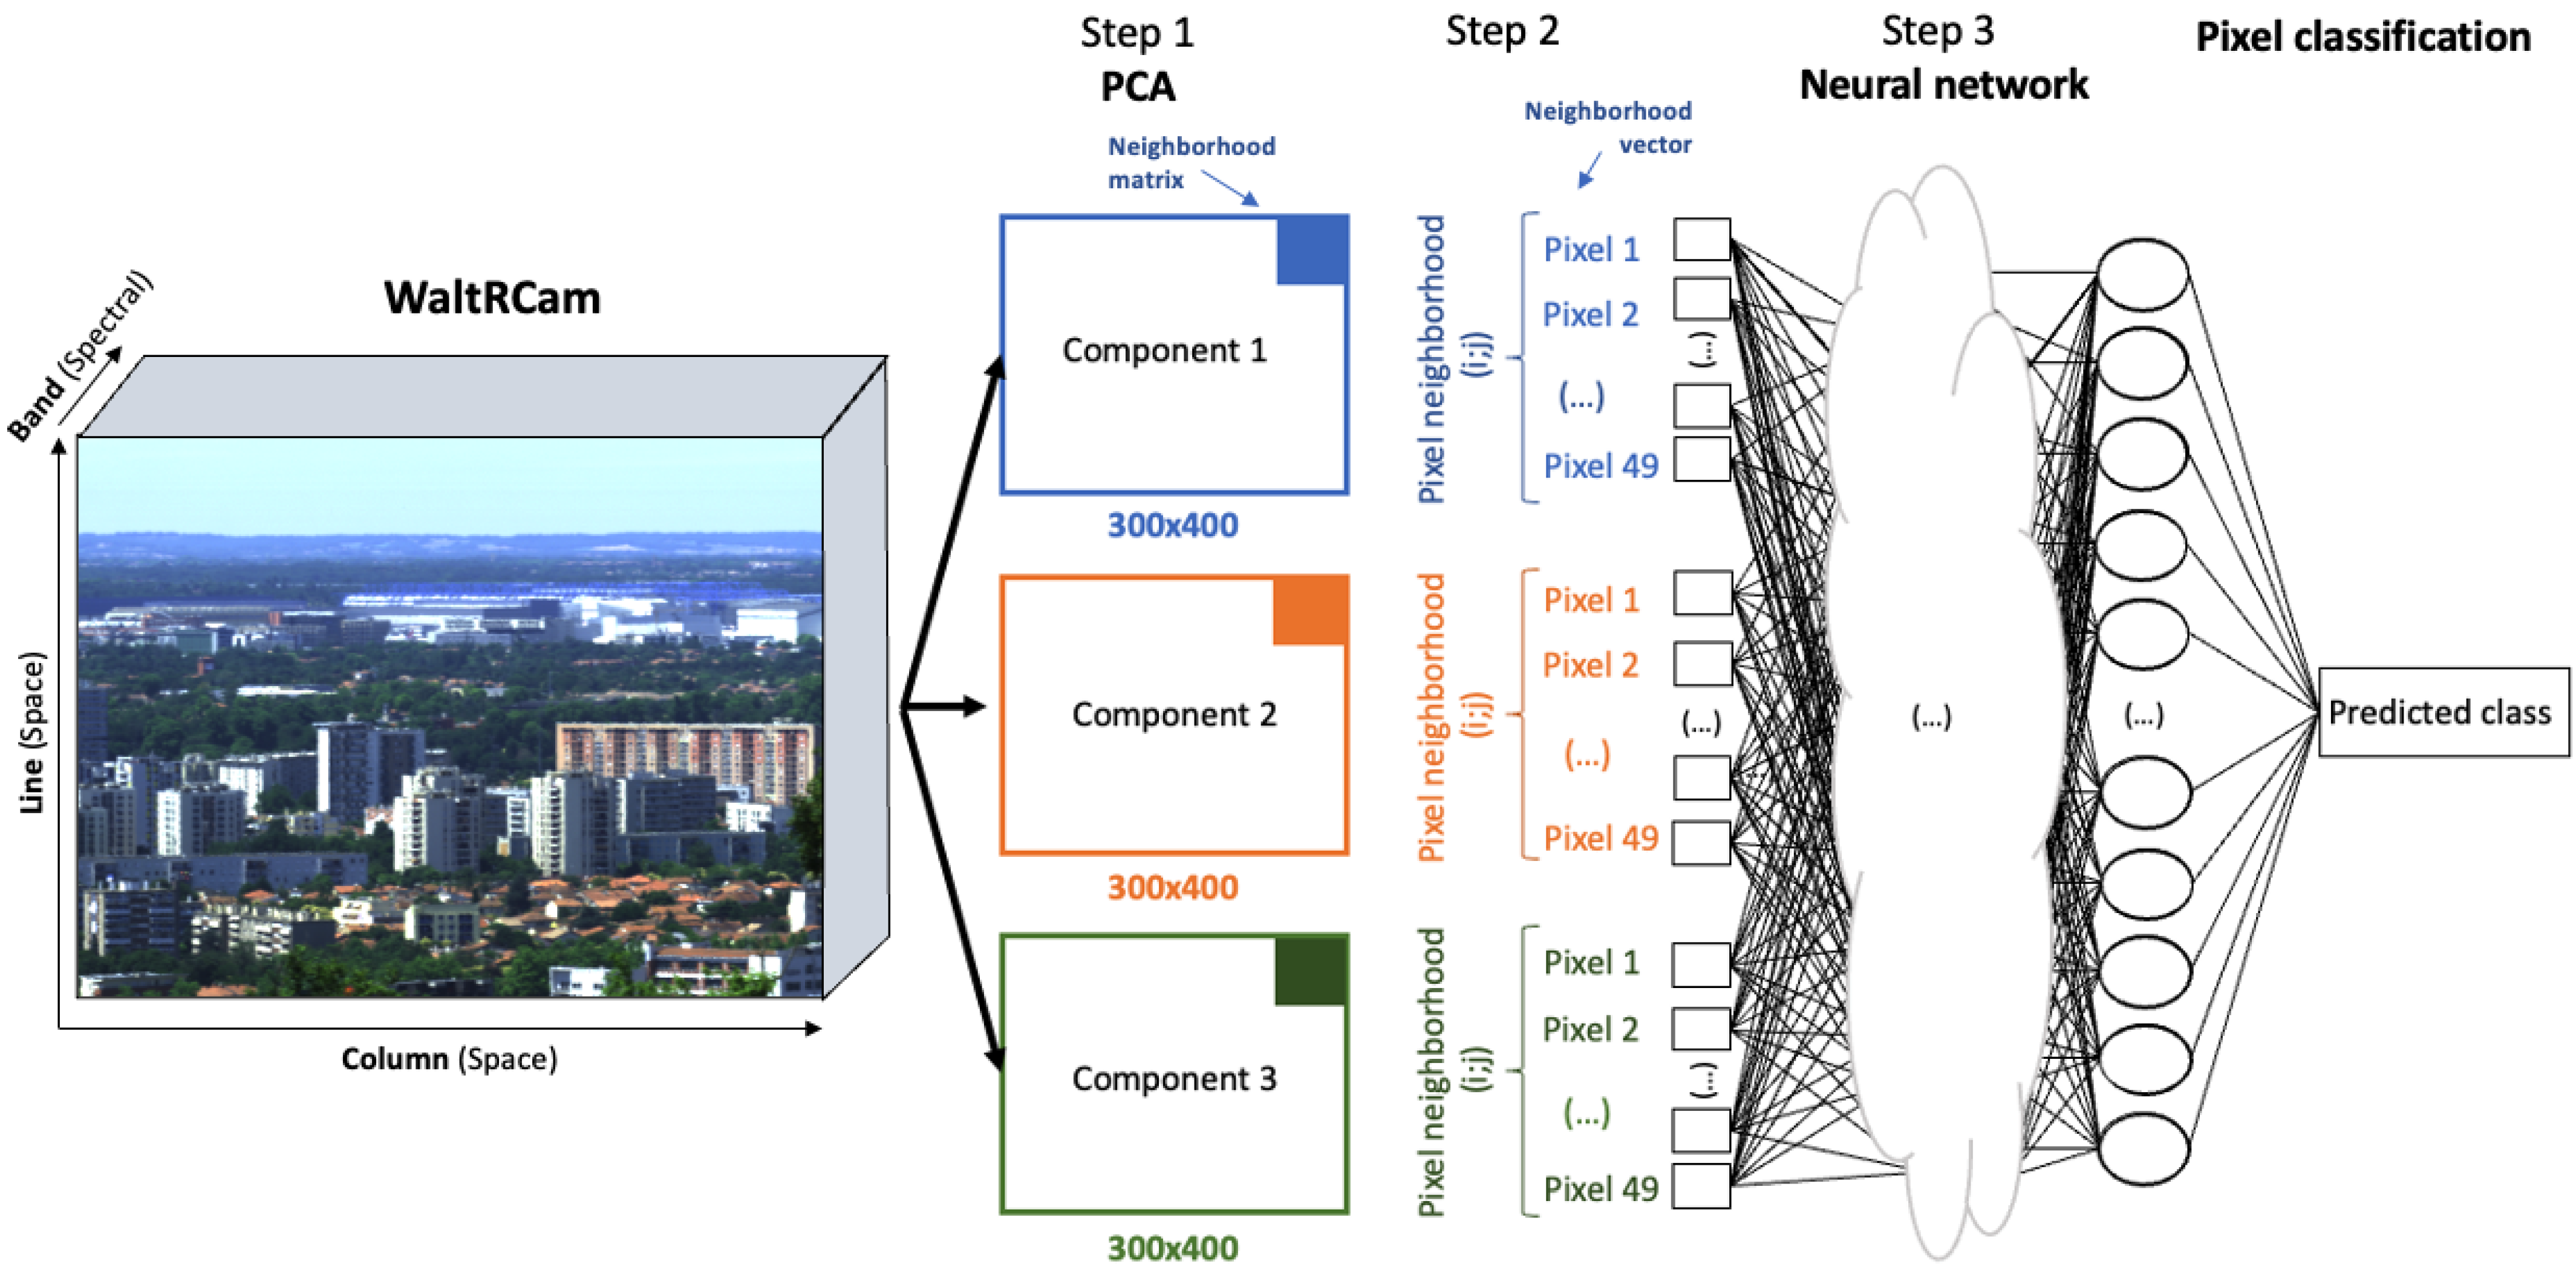
3.3. WaltRCam Object Classification
3.4. The DART Model
3.4.1. Scene Parameters
3.4.2. Atmosphere Characteristics
3.5. AOD Retrieval
4. Results
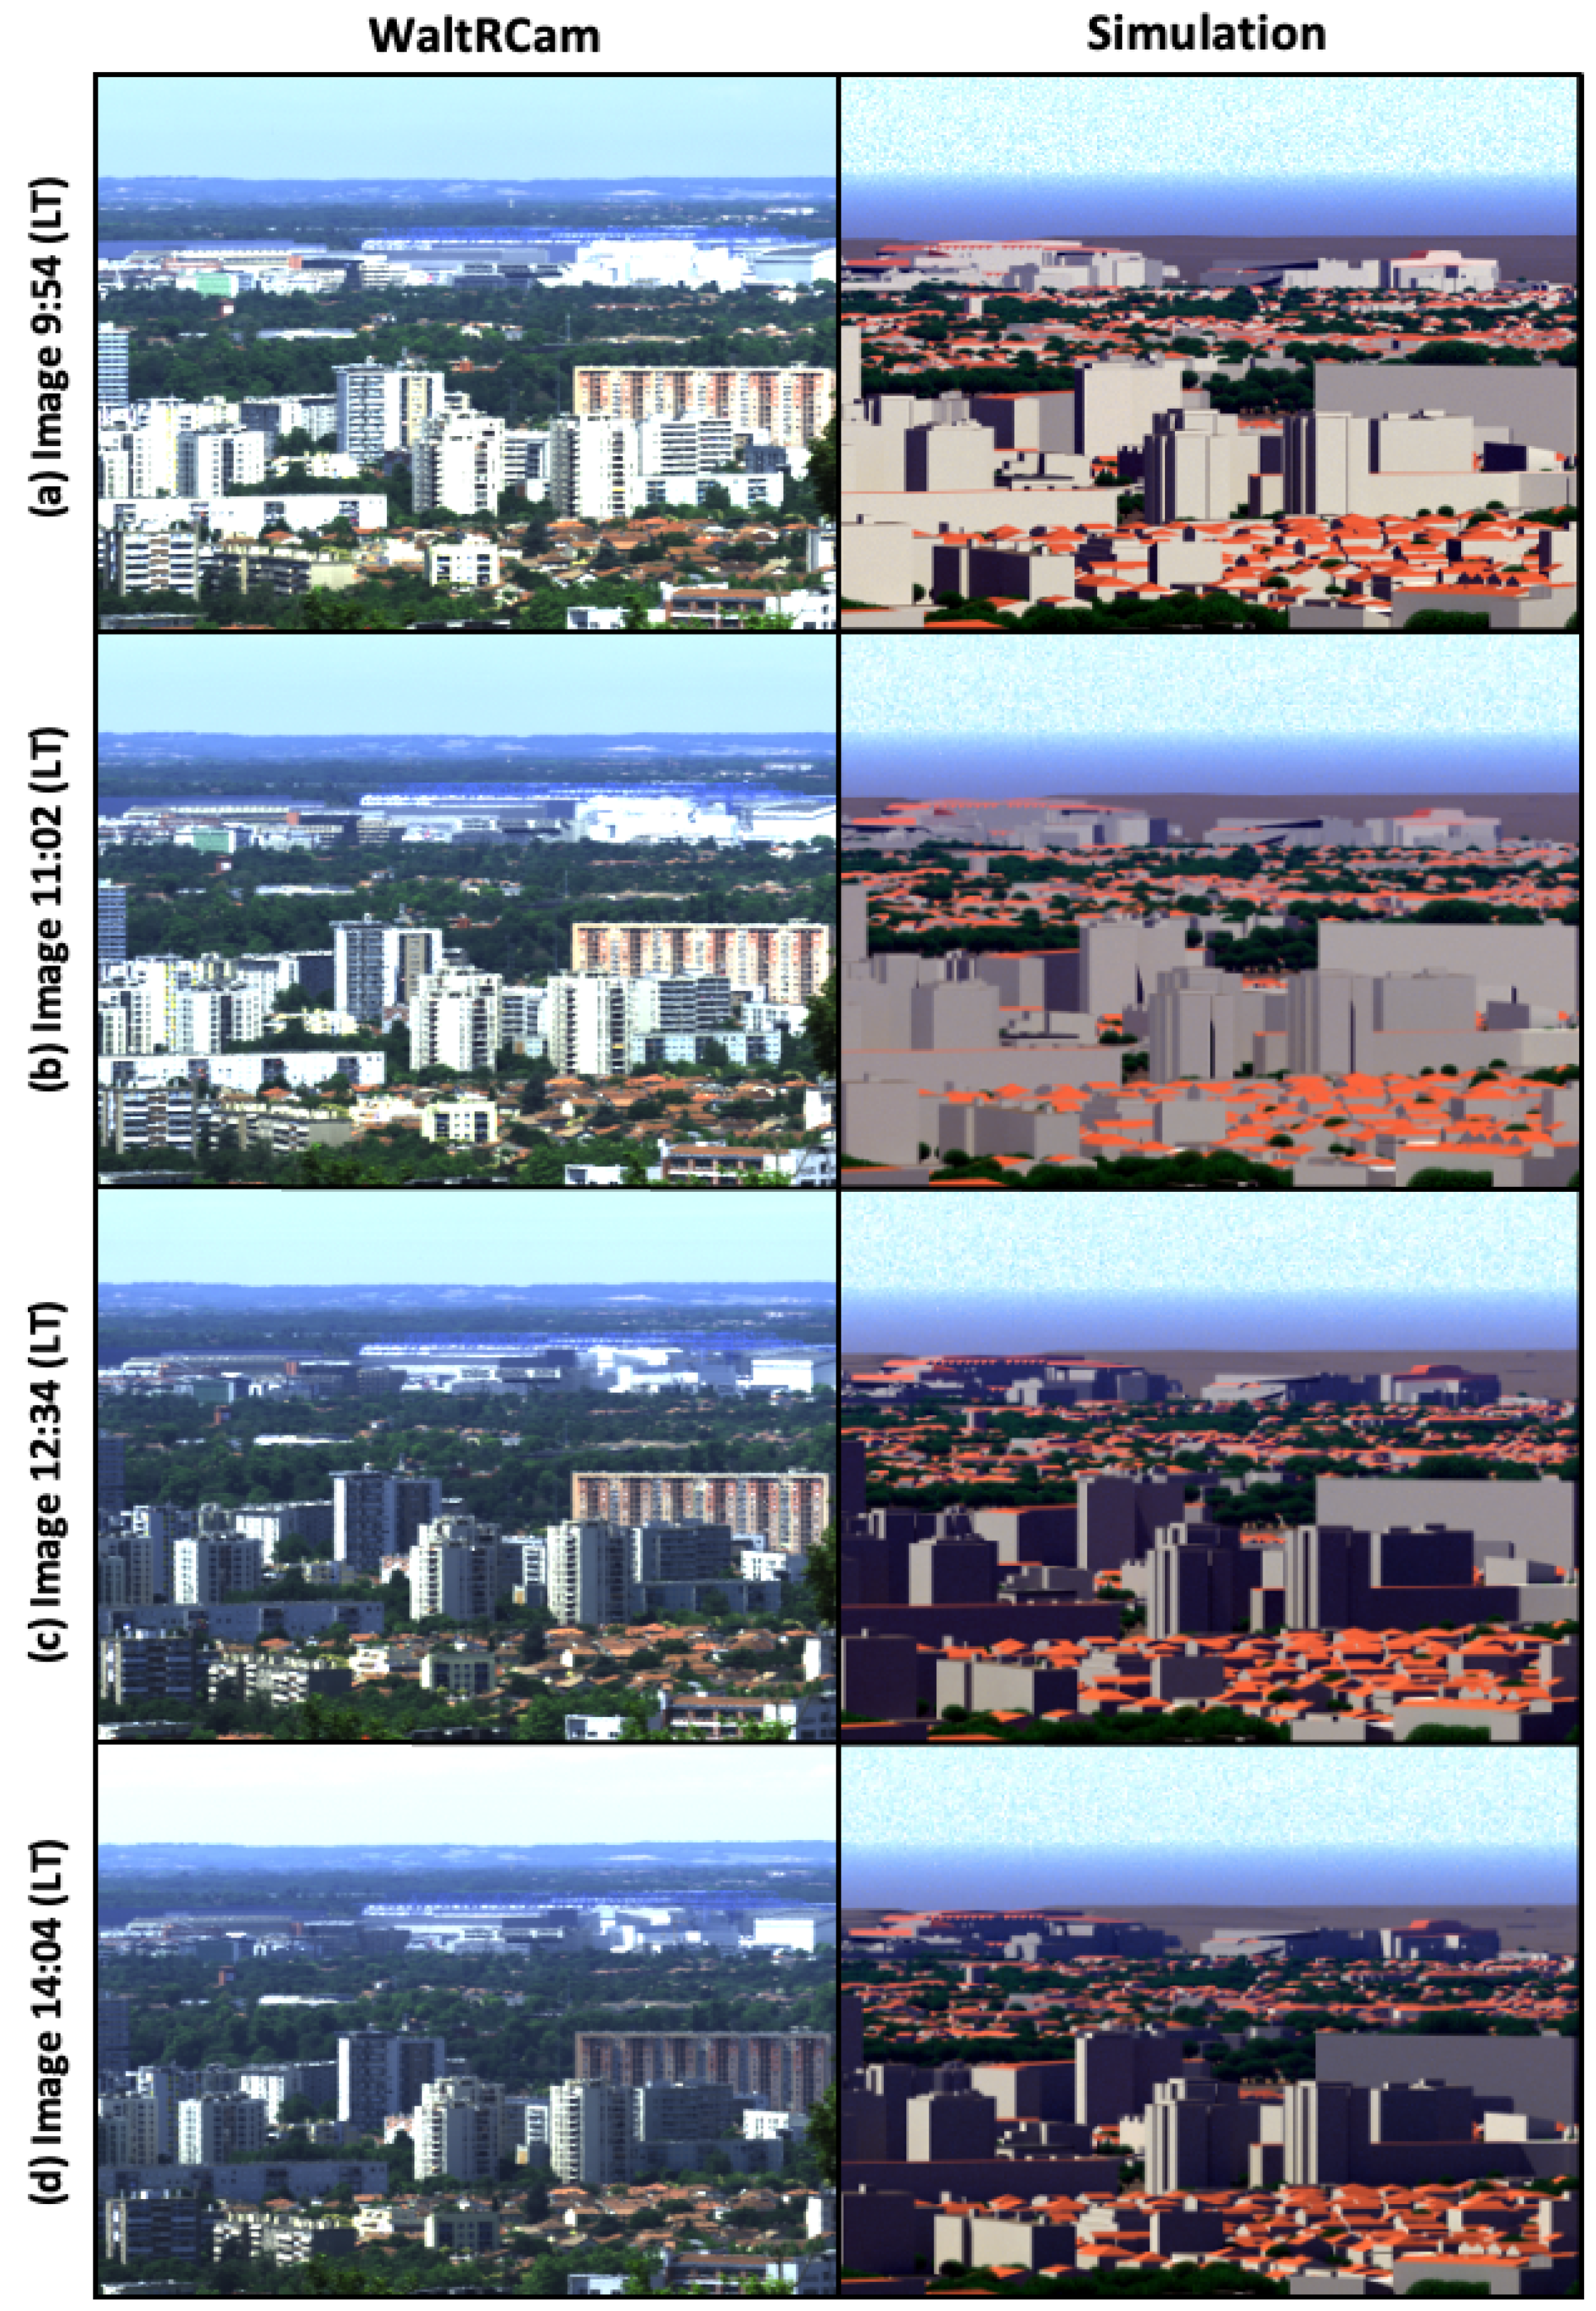
4.1. Simulation Presentation
4.2. Similarity Matrix
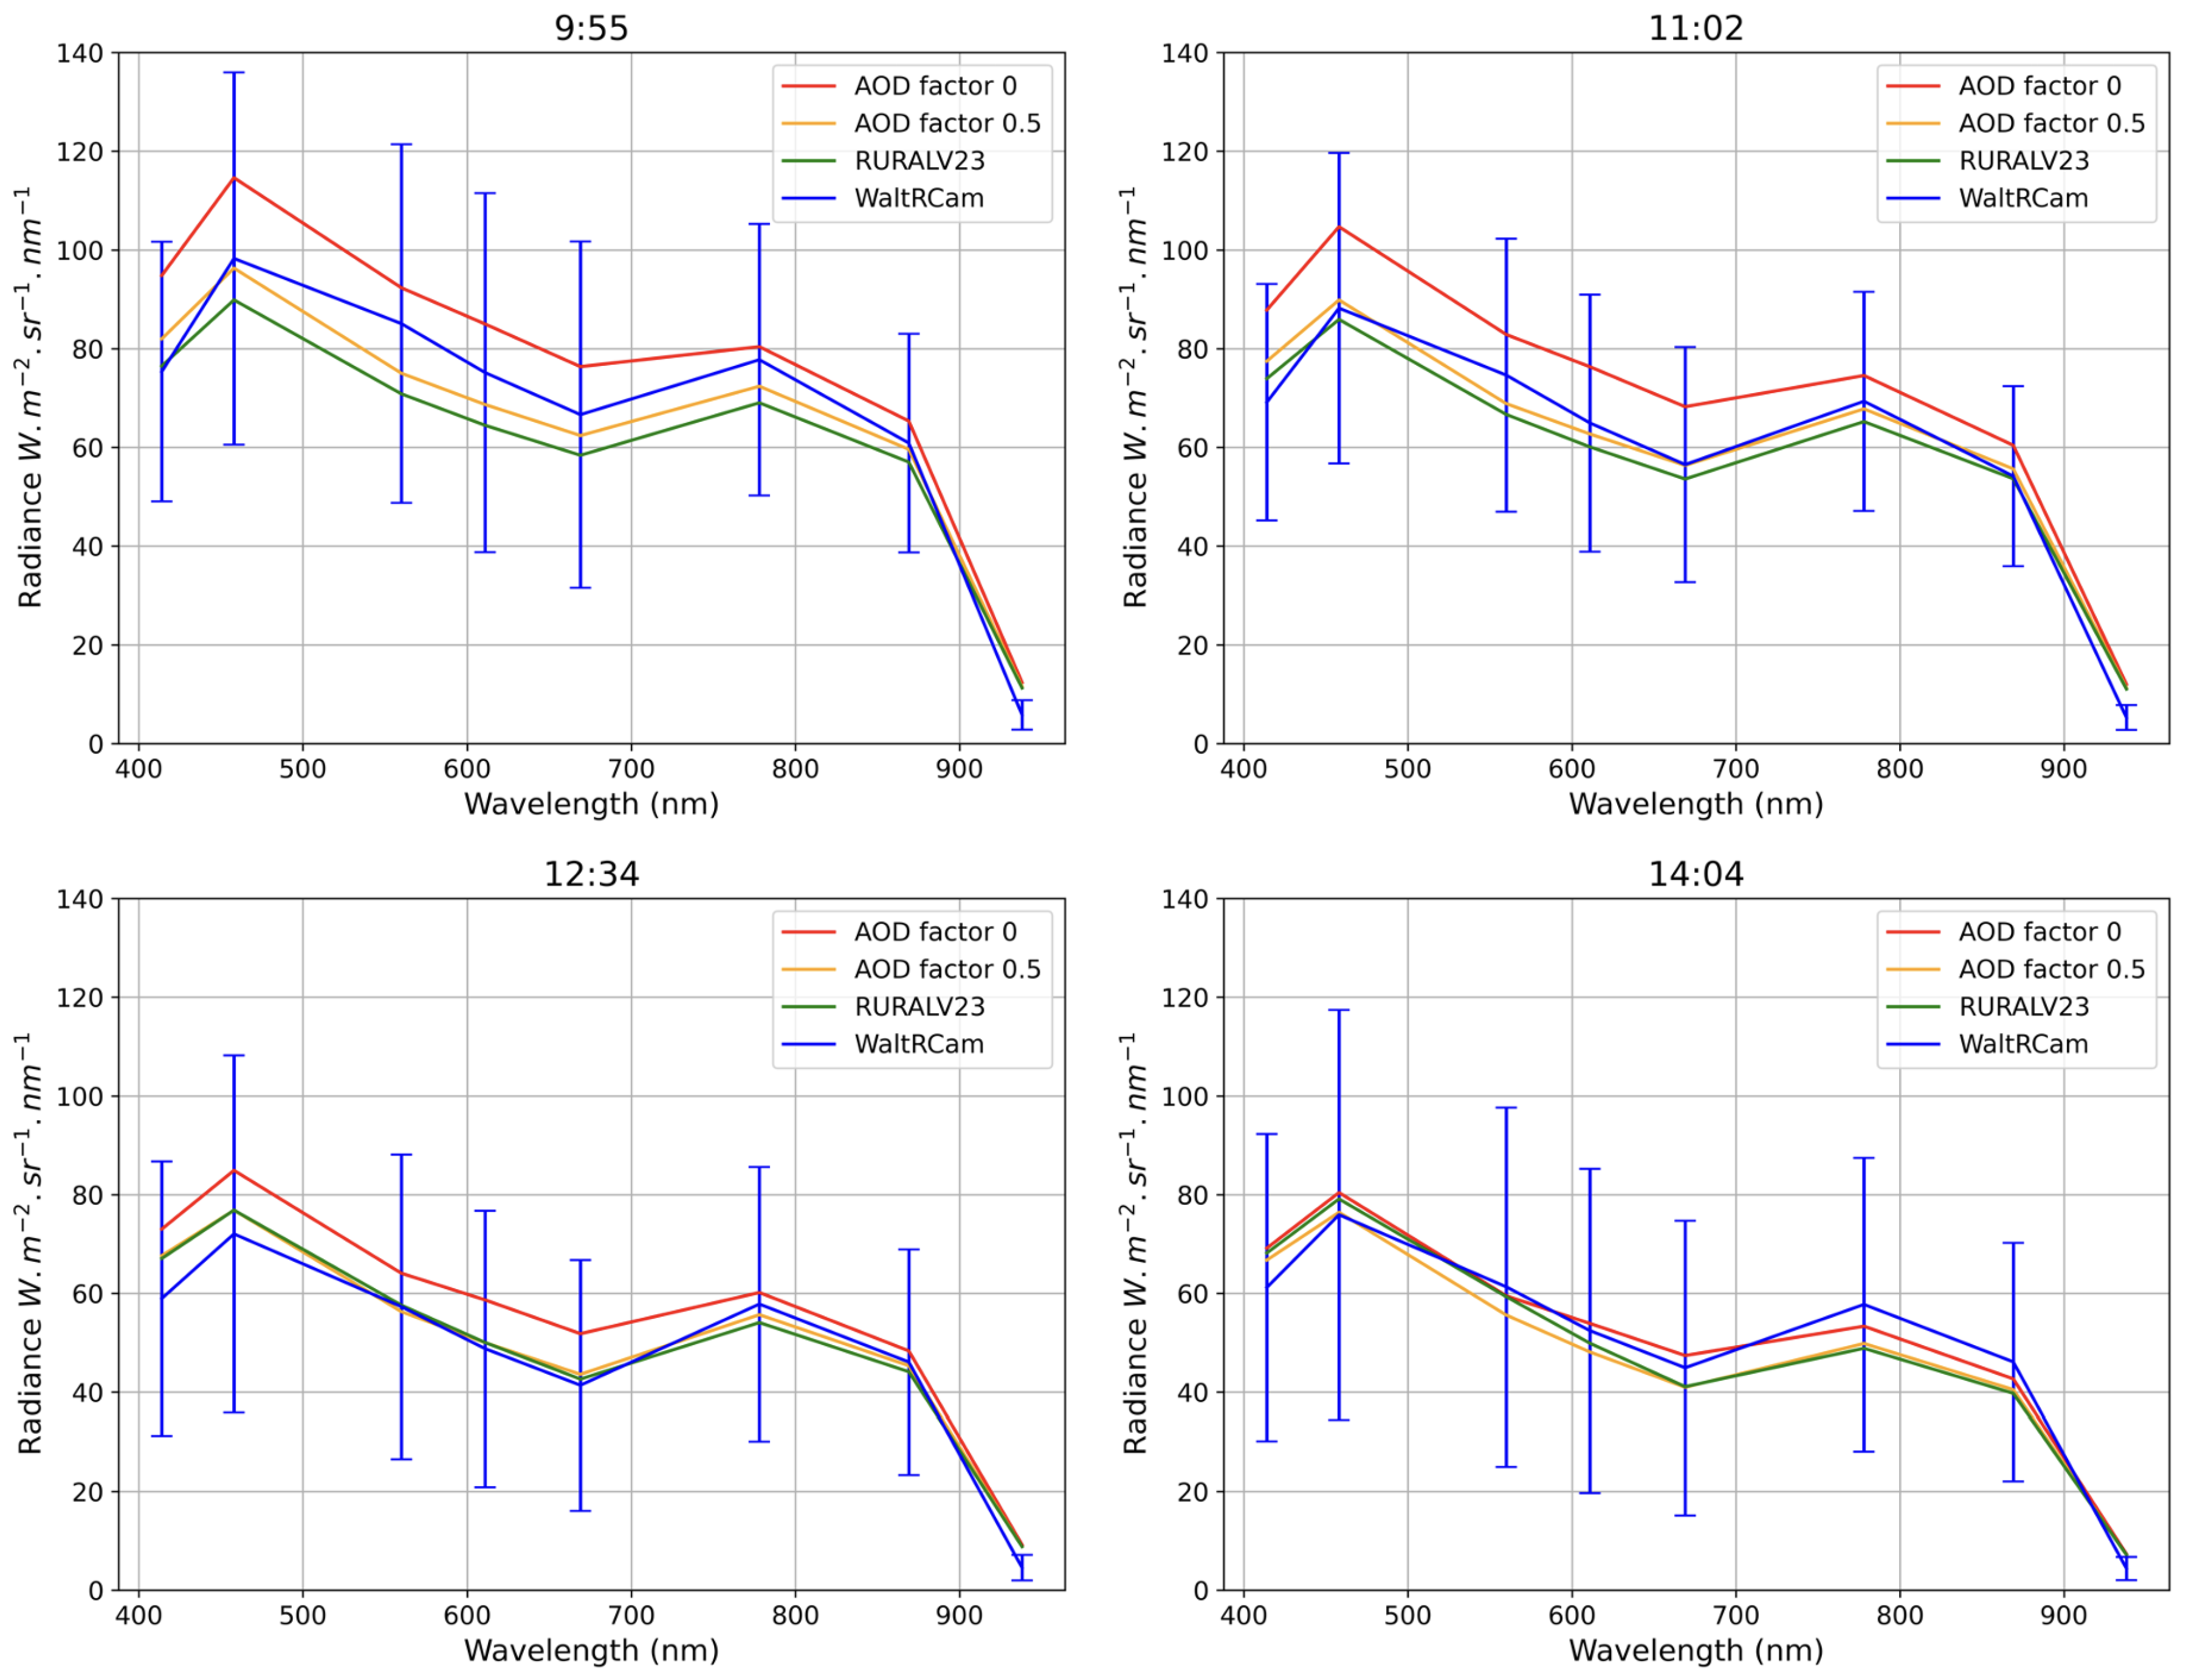
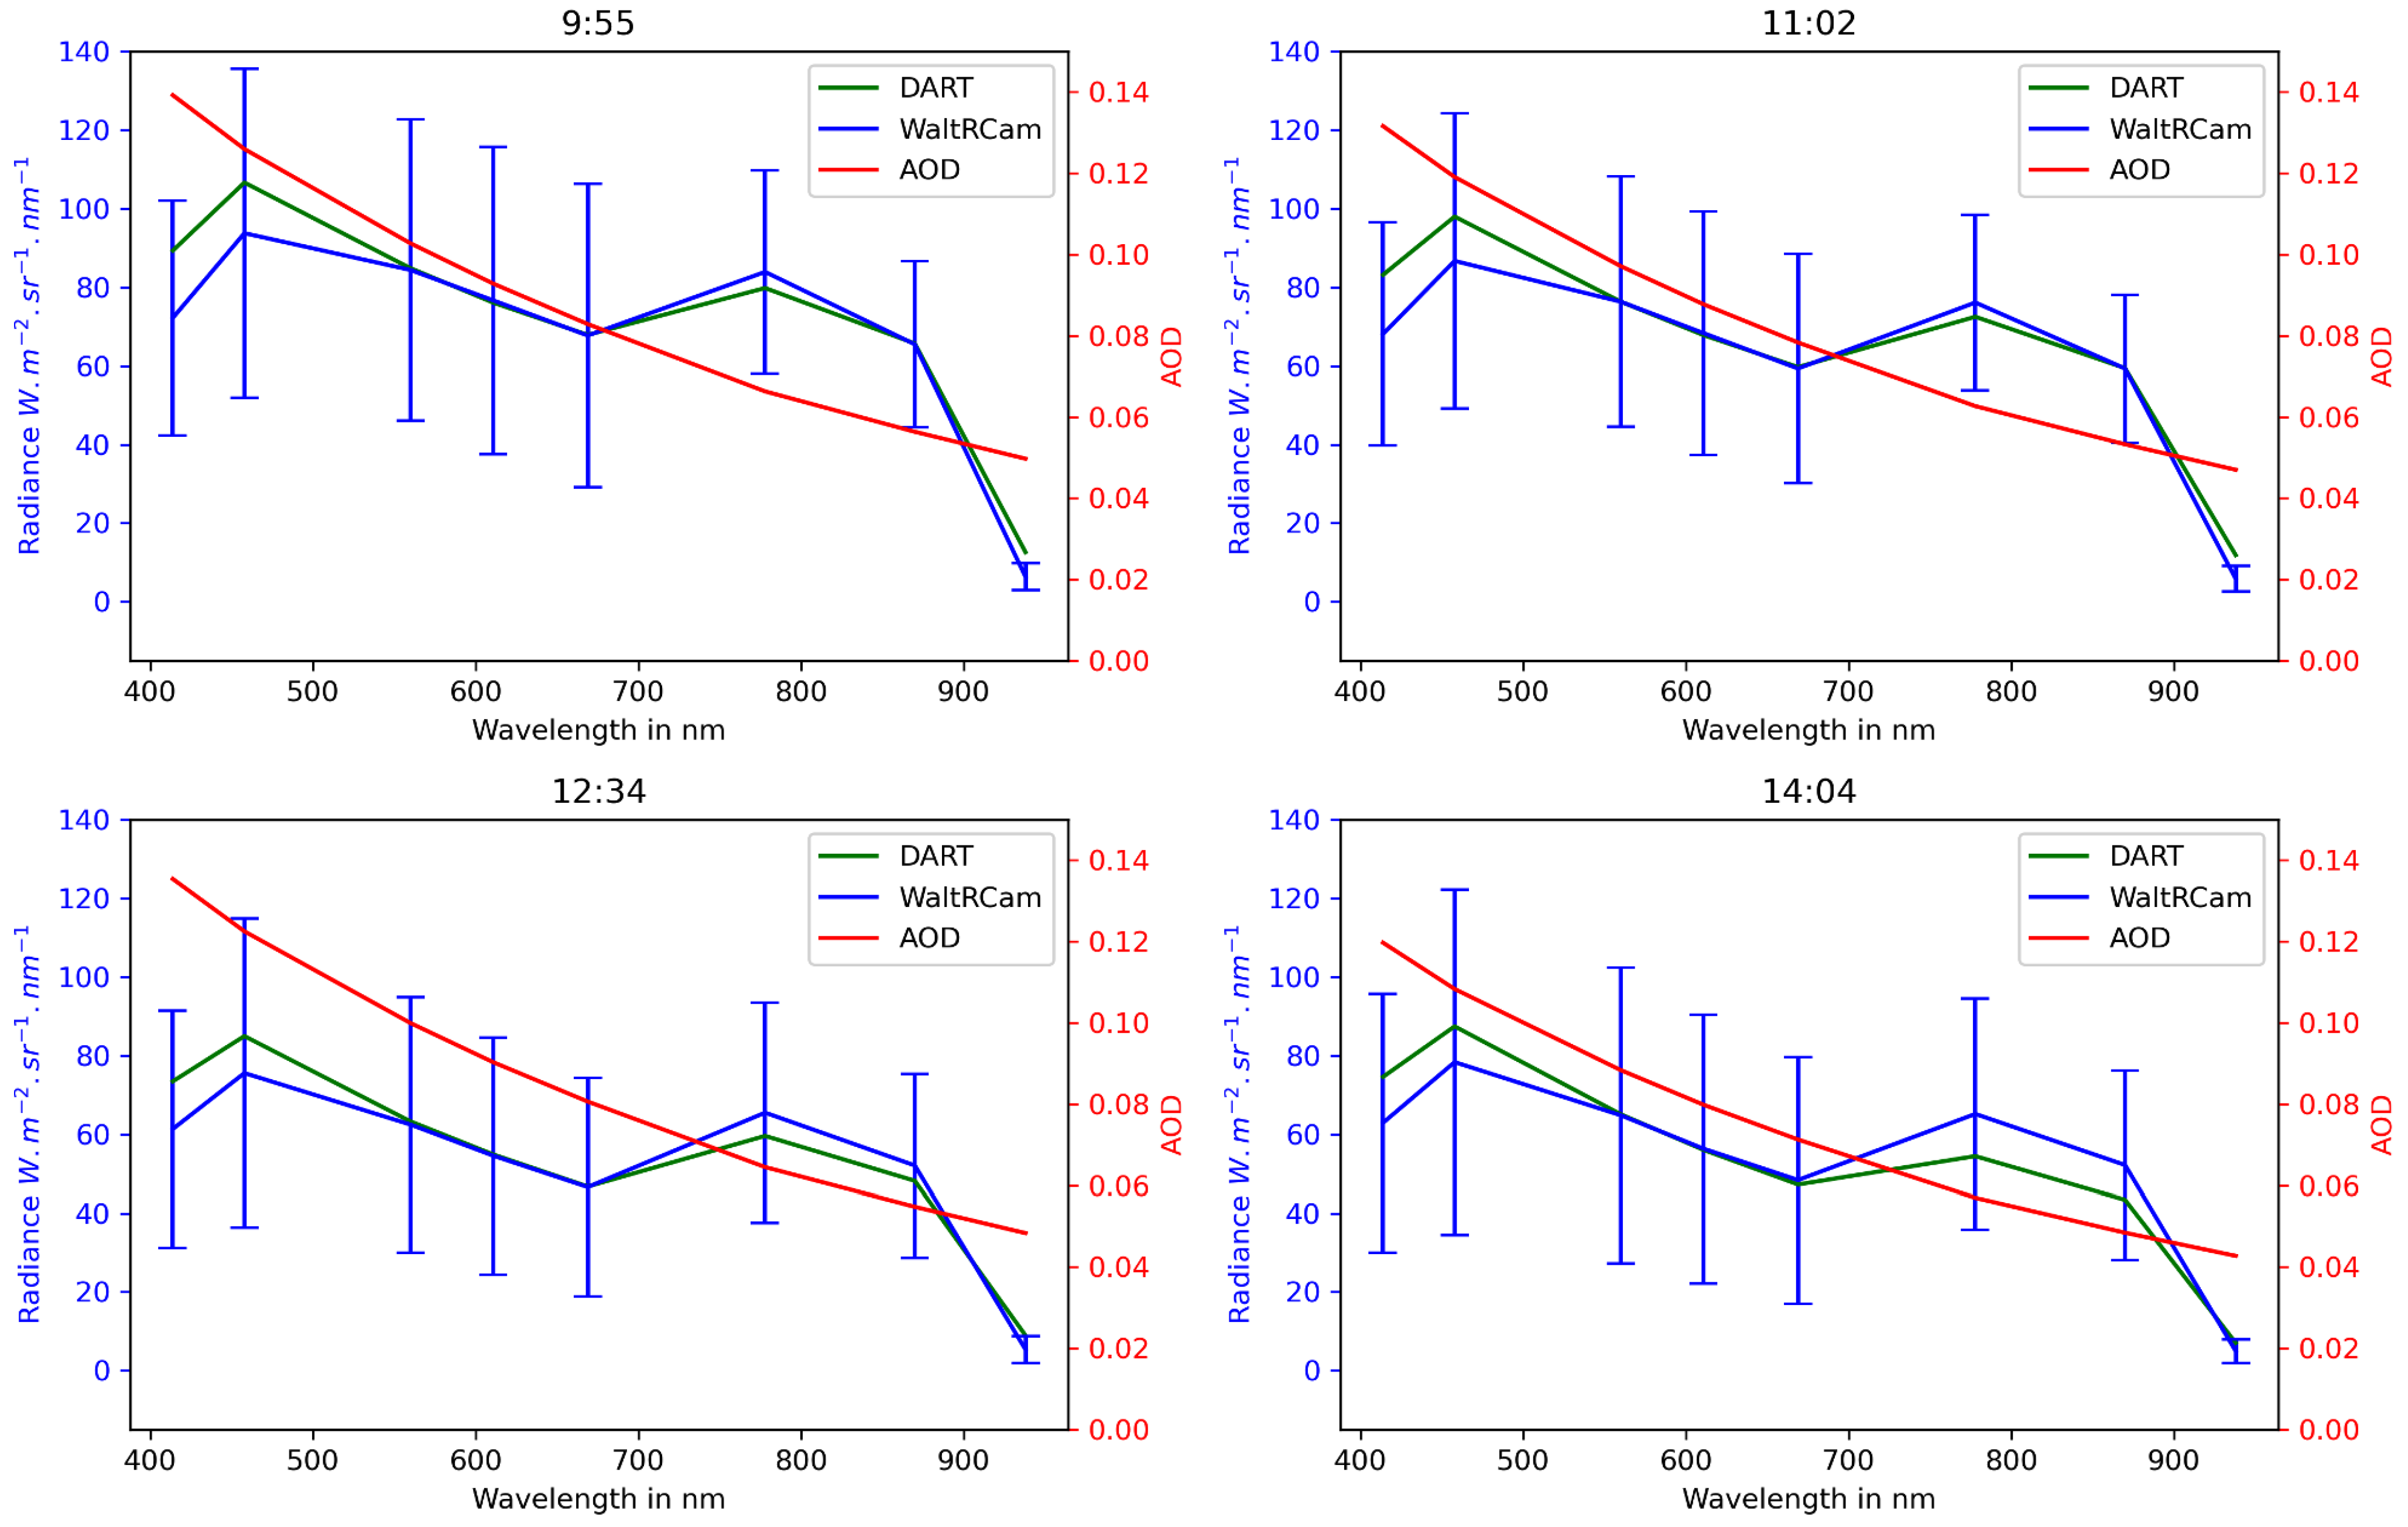
4.3. WaltRCam and DART Spectra Correspondence
4.4. Evaluation of AOD
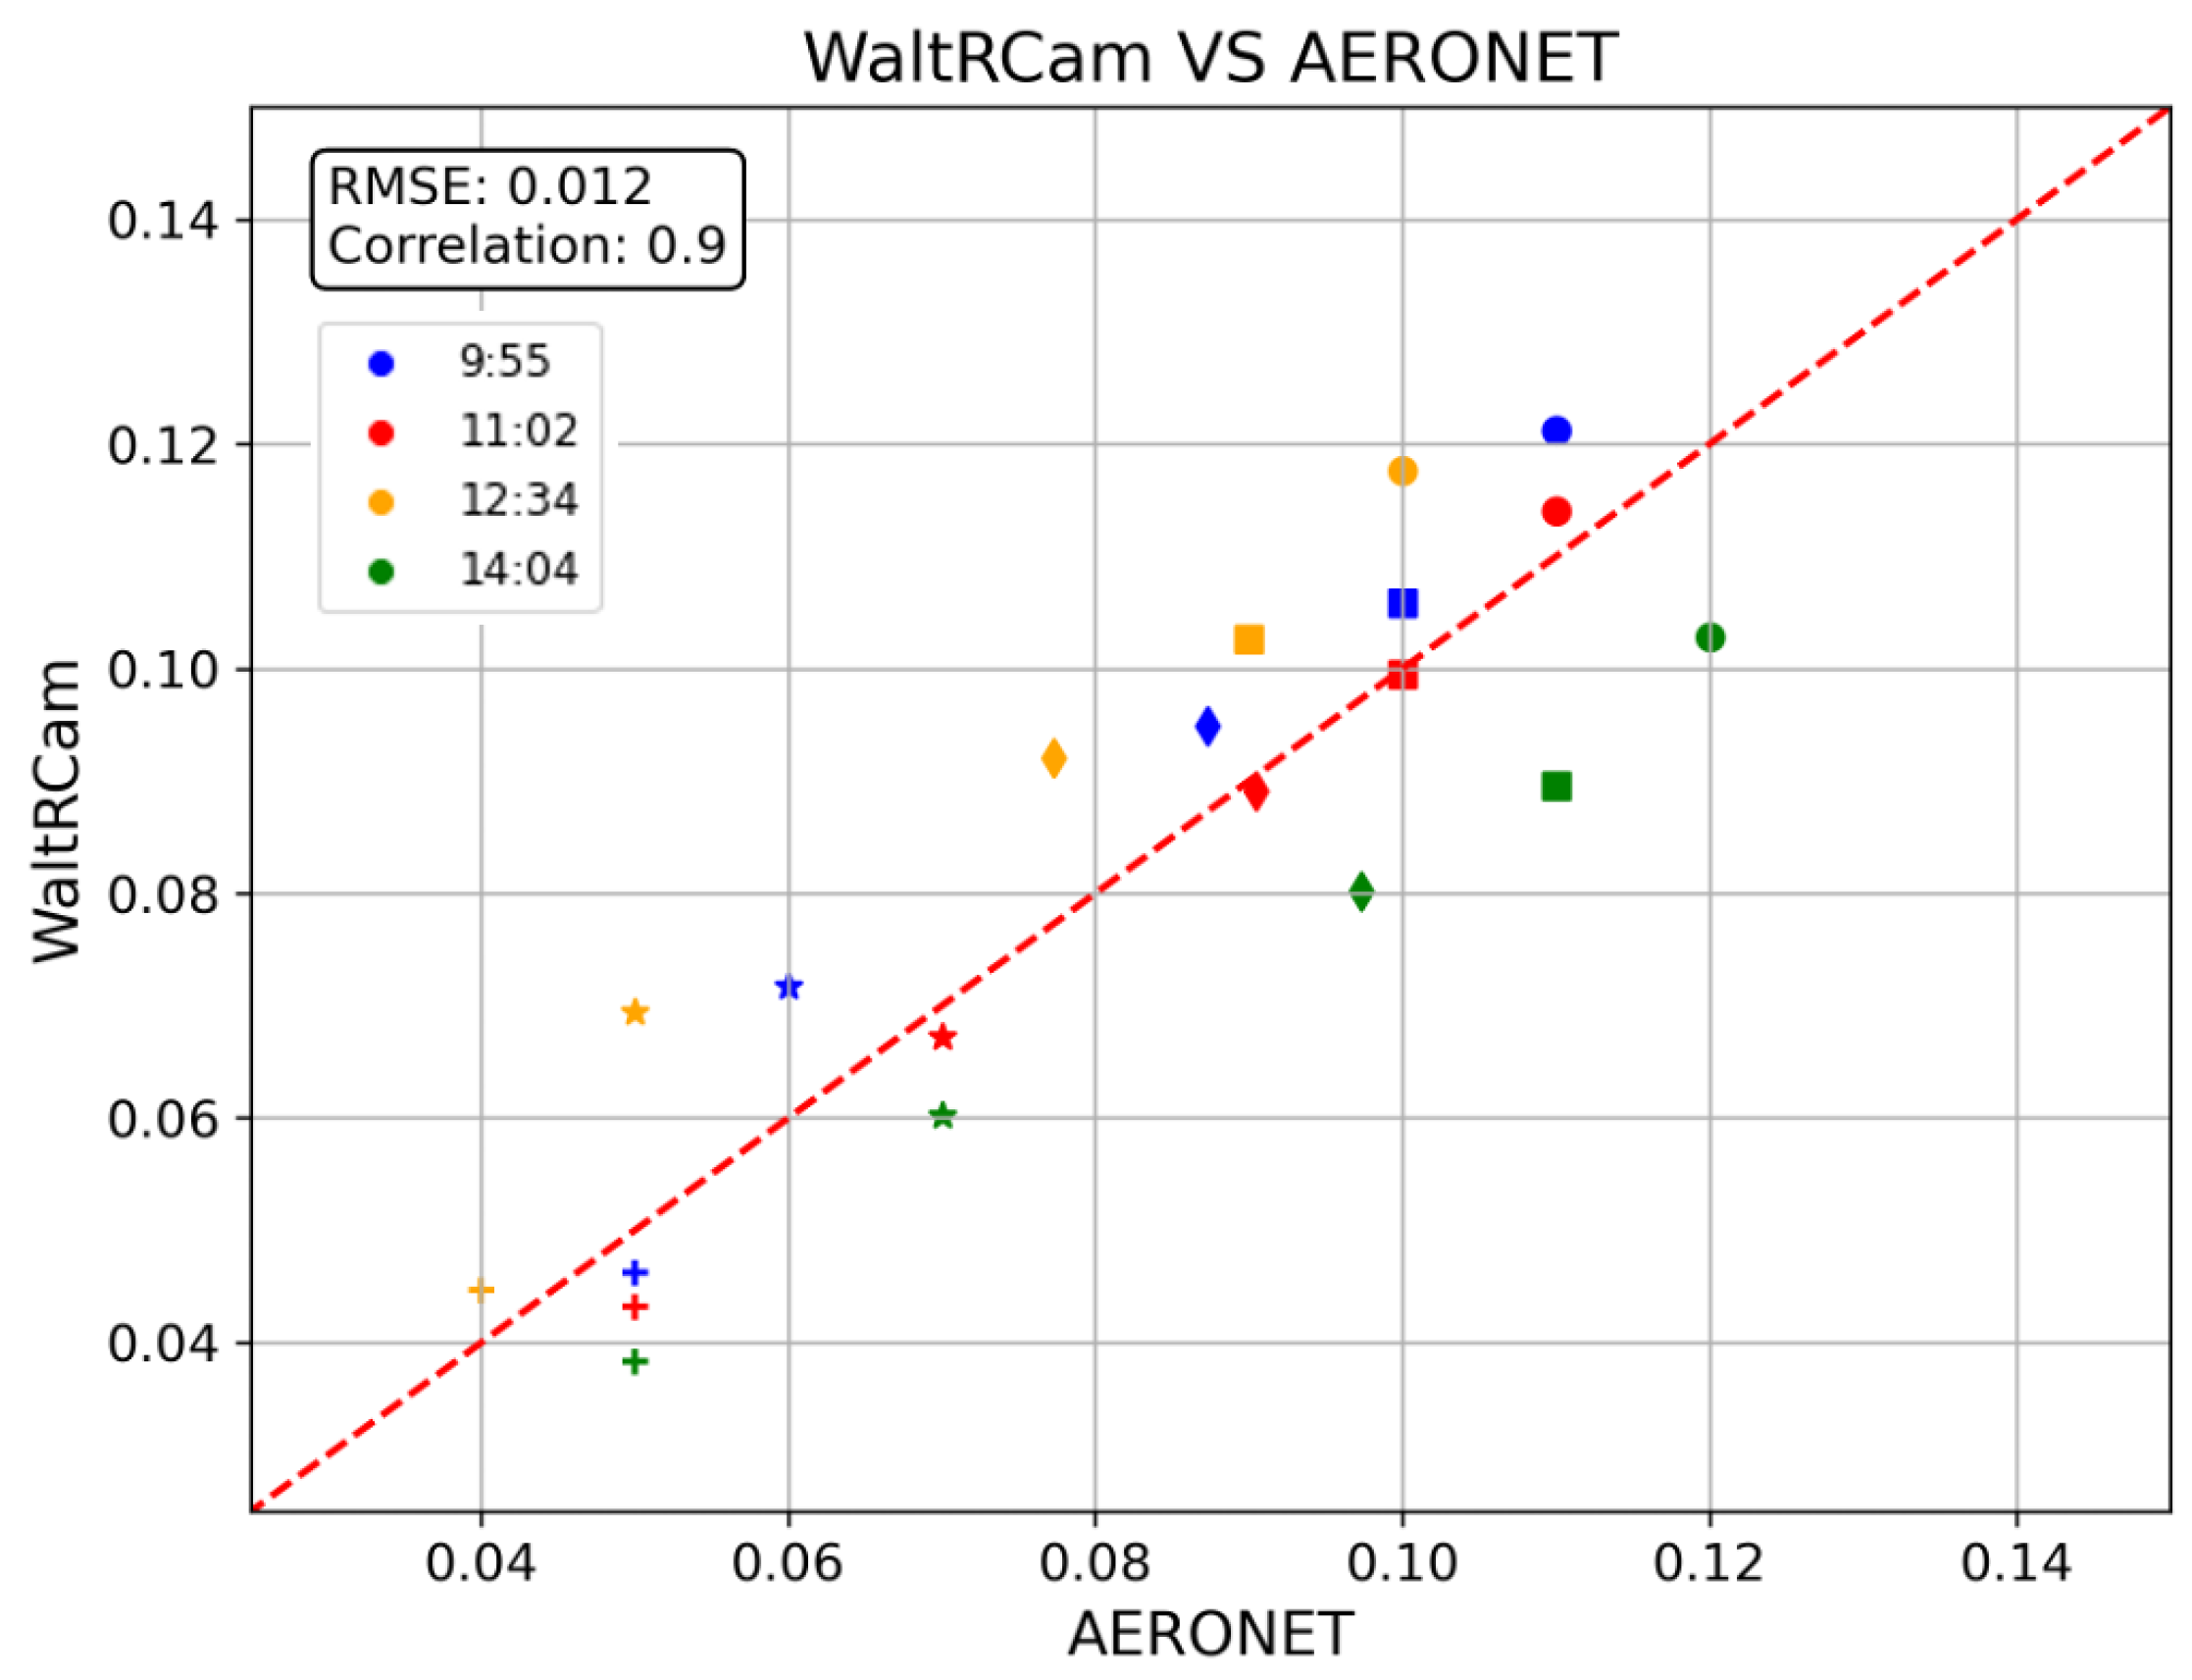
4.4.1. AERONET
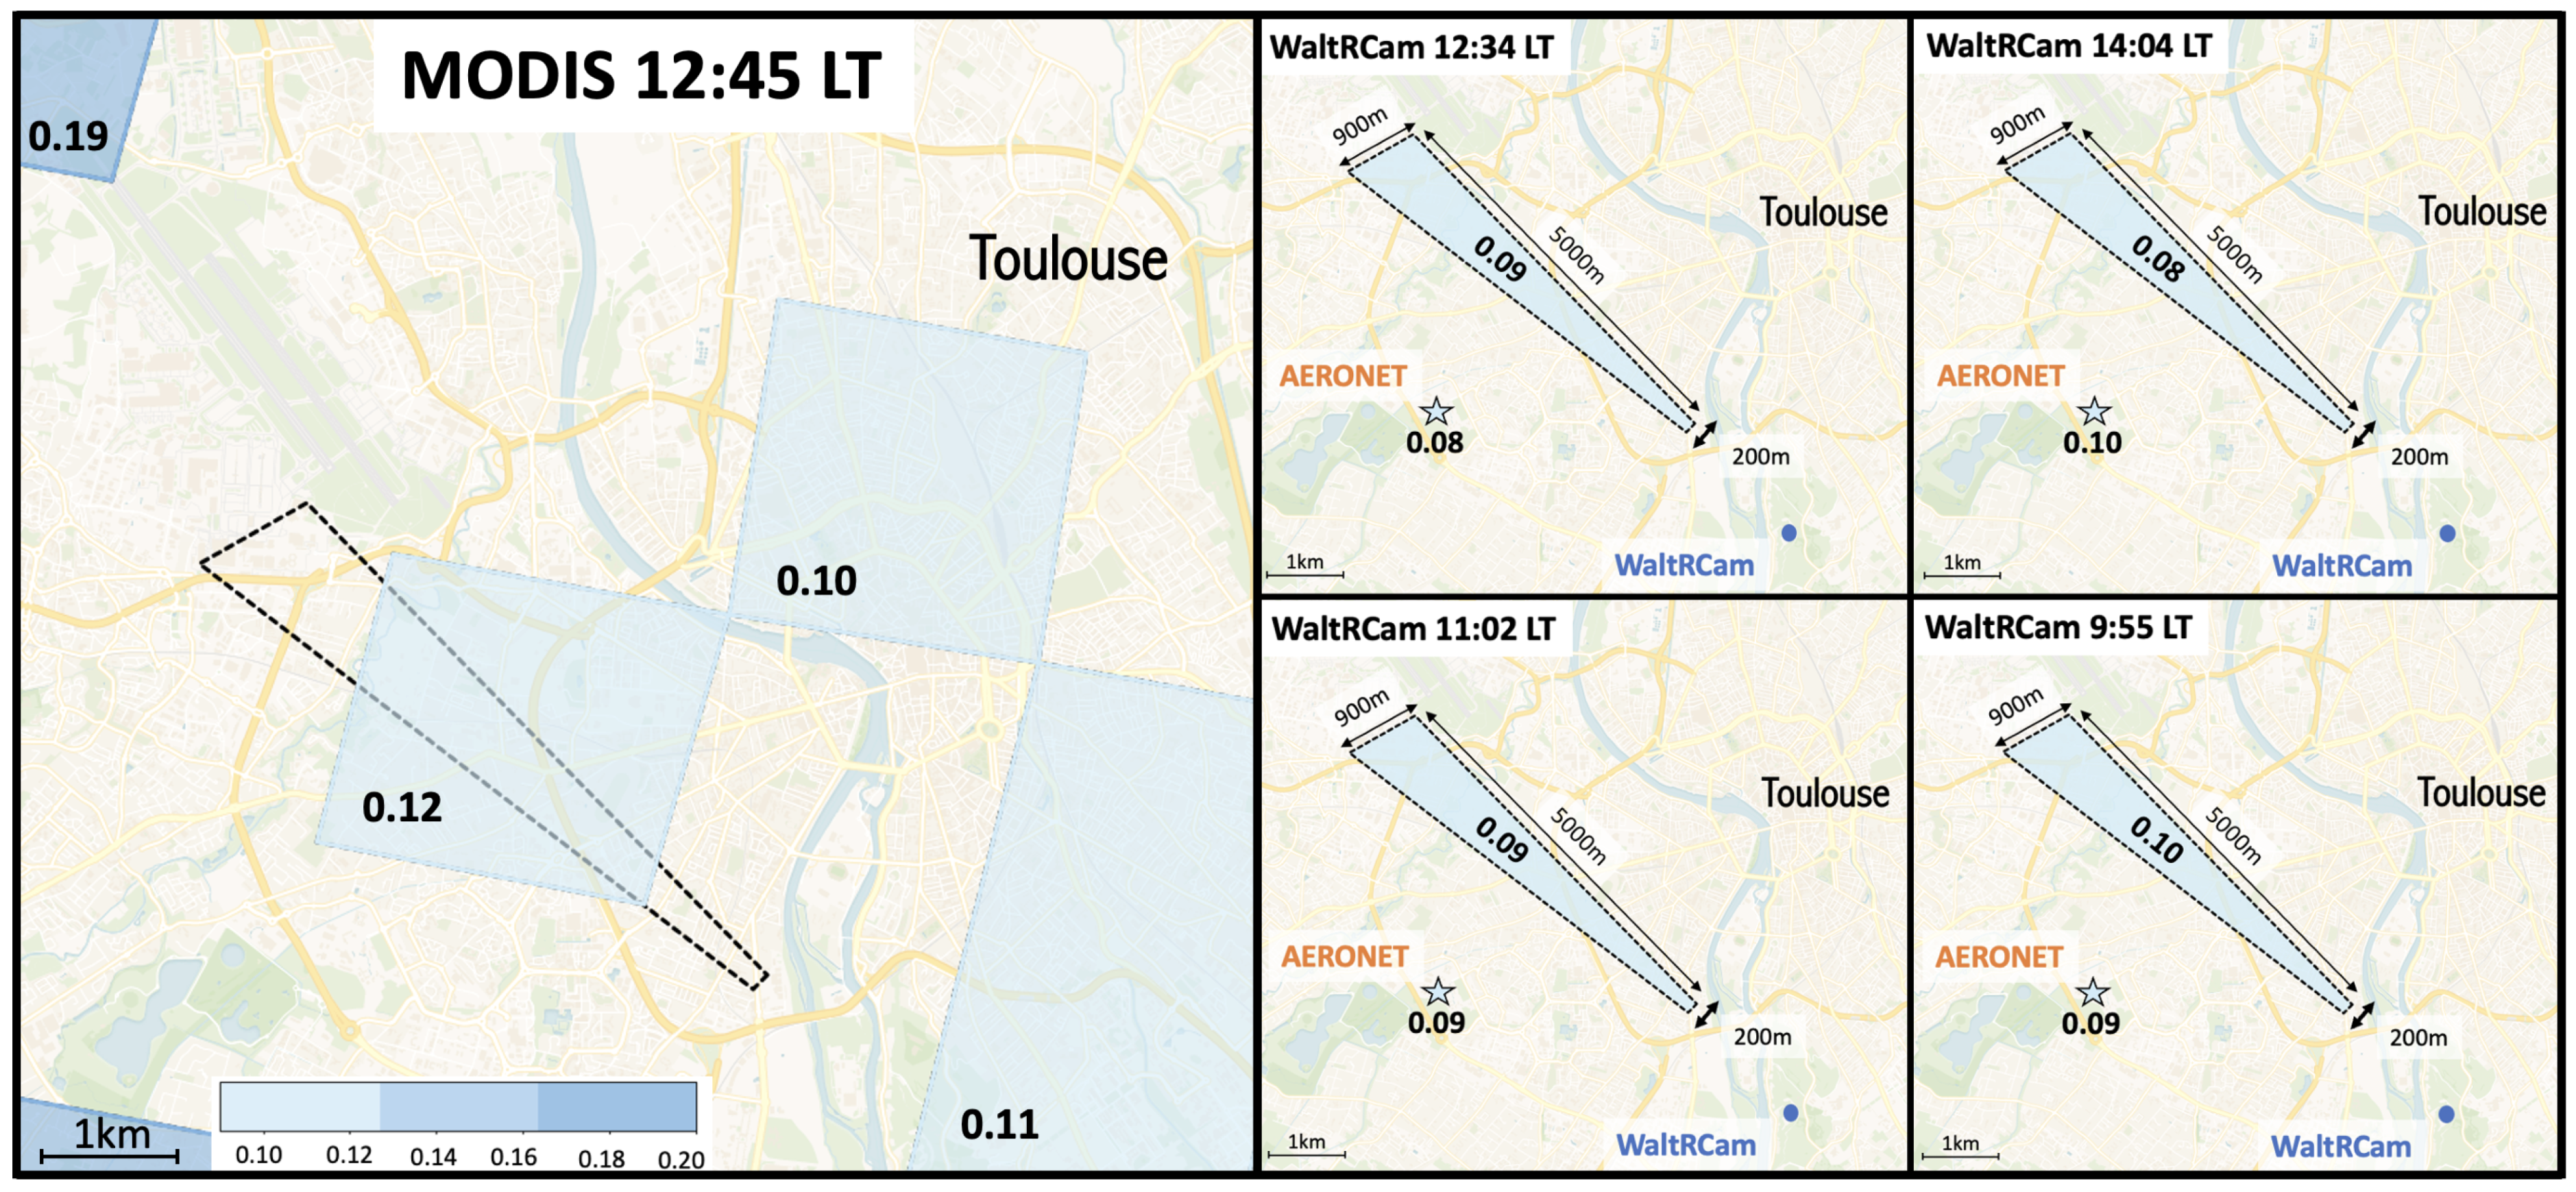
4.4.2. MODIS
5. Conclusions
Author Contributions
Funding
Data Availability Statement
Acknowledgments
Conflicts of Interest
References
- Pui, D.Y.; Chen, S.C.; Zuo, Z. PM2.5 in China: Measurements, sources, visibility and health effects, and mitigation. Particuology 2014, 13, 1–26. [Google Scholar] [CrossRef]
- Xie, X.; Semanjski, I.; Gautama, S.; Tsiligianni, E.; Deligiannis, N.; Rajan, R.T.; Pasveer, F.; Philips, W. A review of urban air pollution monitoring and exposure assessment methods. ISPRS Int. J.-Geo-Inf. 2017, 6, 389. [Google Scholar] [CrossRef]
- Lahoz, W.A.; Schneider, P. Data assimilation: Making sense of Earth Observation. Front. Environ. Sci. 2014, 2, 16. [Google Scholar] [CrossRef]
- Air Quality Near You. Available online: https://www.atmo-france.org (accessed on 15 November 2023).
- Kokhanovsky, A.A. The modern aerosol retrieval algorithms based on the simultaneous measurements of the intensity and polarization of reflected solar light: A review. Front. Environ. Sci. 2015, 3, 4. [Google Scholar] [CrossRef]
- Li, J.; Carlson, B.E.; Yung, Y.L.; Lv, D.; Hansen, J.; Penner, J.E.; Liao, H.; Ramaswamy, V.; Kahn, R.A.; Zhang, P.; et al. Scattering and absorbing aerosols in the climate system. Nat. Rev. Earth Environ. 2022, 3, 363–379. [Google Scholar] [CrossRef]
- Bellouin, N.; Quaas, J.; Gryspeerdt, E.; Kinne, S.; Stier, P.; Watson-Parris, D.; Boucher, O.; Carslaw, K.S.; Christensen, M.; Daniau, A.L.; et al. Bounding global aerosol radiative forcing of climate change. Rev. Geophys. 2020, 58, e2019RG000660. [Google Scholar] [CrossRef] [PubMed]
- Shin, S.K.; Tesche, M.; Müller, D.; Noh, Y. Absorption aerosol optical depth components from AERONET observations of mixed dust plumes. Atmos. Meas. Tech. 2019, 12, 607–618. [Google Scholar] [CrossRef]
- Schraufnagel, D.E. The health effects of ultrafine particles. Exp. Mol. Med. 2020, 52, 311–317. [Google Scholar] [CrossRef]
- Liang, F.; Xiao, Q.; Gu, D.; Xu, M.; Tian, L.; Guo, Q.; Wu, Z.; Pan, X.; Liu, Y. Satellite-based short-and long-term exposure to PM2. 5 and adult mortality in urban Beijing, China. Environ. Pollut. 2018, 242, 492–499. [Google Scholar] [CrossRef]
- Yang, Y.; Ruan, Z.; Wang, X.; Yang, Y.; Mason, T.G.; Lin, H.; Tian, L. Short-term and long-term exposures to fine particulate matter constituents and health: A systematic review and meta-analysis. Environ. Pollut. 2019, 247, 874–882. [Google Scholar] [CrossRef]
- World Health Organization. Ambient Air Pollution: A Global Assessment of Exposure and Burden of Disease; World Health Organization: Geneva, Switzerland, 2016.
- MODIS (Moderate-Resolution Imaging Spectroradiometer). Available online: https://modis.gsfc.nasa.gov (accessed on 15 November 2023).
- Dubovik, O.; Herman, M.; Holdak, A.; Lapyonok, T.; Tanré, D.; Deuzé, J.; Ducos, F.; Sinyuk, A.; Lopatin, A. Statistically optimized inversion algorithm for enhanced retrieval of aerosol properties from spectral multi-angle polarimetric satellite observations. Atmos. Meas. Tech. 2011, 4, 975–1018. [Google Scholar] [CrossRef]
- Ceamanos, X.; Six, B.; Moparthy, S.; Carrer, D.; Georgeot, A.; Gasteiger, J.; Riedi, J.; Attié, J.L.; Lyapustin, A.; Katsev, I. Instantaneous aerosol and surface retrieval using satellites in geostationary orbit (iAERUS-GEO)–estimation of 15 min aerosol optical depth from MSG/SEVIRI and evaluation with reference data. Atmos. Meas. Tech. 2023, 16, 2575–2599. [Google Scholar] [CrossRef]
- Chen, C.W.; Tseng, Y.S.; Mukundan, A.; Wang, H.C. Air pollution: Sensitive detection of PM2. 5 and PM10 concentration using hyperspectral imaging. Appl. Sci. 2021, 11, 4543. [Google Scholar] [CrossRef]
- Elcoroaristizabal, S.; Amigo, J. Near infrared hyperspectral imaging as a tool for quantifying atmospheric carbonaceous aerosol. Microchem. J. 2021, 160, 105619. [Google Scholar] [CrossRef]
- Norsk Elektro Optikk. Available online: https://www.neo.no (accessed on 15 November 2023).
- SmartG. Available online: https://www.hygeos.com/smartg (accessed on 15 November 2023).
- ArtDeco. Available online: http://precog.iiitd.edu.in/people/anupama (accessed on 15 November 2023).
- Gastellu-Etchegorry, J.P.; Demarez, V.; Pinel, V.; Zagolski, F. Modeling radiative transfer in heterogeneous 3-D vegetation canopies. Remote Sens. Environ. 1996, 58, 131–156. [Google Scholar] [CrossRef]
- Gastellu-Etchegorry, J.; Martin, E.; Gascon, F. DART: A 3D model for simulating satellite images and studying surface radiation budget. Int. J. Remote Sens. 2004, 25, 73–96. [Google Scholar] [CrossRef]
- Gastellu-Etchegorry, J.P. 3D modeling of satellite spectral images, radiation budget and energy budget of urban landscapes. Meteorol. Atmos. Phys. 2008, 102, 187–207. [Google Scholar] [CrossRef]
- AERONET (AErosol RObotic NETwork). Available online: https://aeronet.gsfc.nasa.gov (accessed on 15 November 2023).
- Lenhard, K.; Baumgartner, A.; Schwarzmaier, T. Independent laboratory characterization of NEO HySpex imaging spectrometers VNIR-1600 and SWIR-320m-e. IEEE Trans. Geosci. Remote Sens. 2014, 53, 1828–1841. [Google Scholar] [CrossRef]
- Lenhard, K.; Baumgartner, A.; Gege, P.; Nevas, S.; Nowy, S.; Sperling, A. Impact of improved calibration of a NEO HySpex VNIR-1600 sensor on remote sensing of water depth. IEEE Trans. Geosci. Remote Sens. 2015, 53, 6085–6098. [Google Scholar] [CrossRef]
- Høye, G.; Løke, T.; Fridman, A. Method for quantifying image quality in push-broom hyperspectral cameras. Opt. Eng. 2015, 54, 53102. [Google Scholar] [CrossRef]
- Weather Station of Toulouse-Blagnac. Available online: https://www.infoclimat.fr/observations-meteo/archives/30/juin/2020/toulouse-blagnac/07630.html (accessed on 15 November 2023).
- WaltR. Available online: https://waltr.fr (accessed on 15 November 2023).
- Eichenholz, J.M.; Barnett, N.; Fish, D. Sequential filter wheel multispectral imaging systems. In Proceedings of the Applied Industrial Optics: Spectroscopy, Imaging and Metrology, Tucson, AZ, USA, 7–8 June 2010. [Google Scholar]
- Holben, B.N.; Eck, T.F.; Slutsker, I.a.; Tanré, D.; Buis, J.; Setzer, A.; Vermote, E.; Reagan, J.A.; Kaufman, Y.; Nakajima, T.; et al. AERONET—A federated instrument network and data archive for aerosol characterization. Remote Sens. Environ. 1998, 66, 1–16. [Google Scholar] [CrossRef]
- Eck, T.F.; Holben, B.; Reid, J.; Dubovik, O.; Smirnov, A.; O’neill, N.; Slutsker, I.; Kinne, S. Wavelength dependence of the optical depth of biomass burning, urban, and desert dust aerosols. J. Geophys. Res. Atmos. 1999, 104, 31333–31349. [Google Scholar]
- Yoon, J.; von Hoyningen-Huene, W.; Kokhanovsky, A.; Vountas, M.; Burrows, J. Trend analysis of aerosol optical thickness and Ångström exponent derived from the global AERONET spectral observations. Atmos. Meas. Tech. 2012, 5, 1271–1299. [Google Scholar] [CrossRef]
- Aldabash, M.; Bektas Balcik, F.; Glantz, P. Validation of MODIS C6. 1 and MERRA-2 AOD using AERONET observations: A comparative study over Turkey. Atmosphere 2020, 11, 905. [Google Scholar] [CrossRef]
- Missions: Earth Observing System (EOS). Available online: https://eospso.nasa.gov/mission-category/3 (accessed on 15 November 2023).
- Algorithme Dark Target MODIS. Available online: https://darktarget.gsfc.nasa.gov (accessed on 15 November 2023).
- Levy, R.; Mattoo, S.; Munchak, L.; Remer, L.; Sayer, A.; Patadia, F.; Hsu, N. The Collection 6 MODIS aerosol products over land and ocean. Atmos. Meas. Tech. 2013, 6, 2989–3034. [Google Scholar] [CrossRef]
- Blender—A 3D Modelling and Rendering Package. Available online: http://www.blender.org (accessed on 15 November 2023).
- Boulisset, V.; Attié, J.L.; Tournier, R.; El Malki, N.; Ceamanos-Garcia, X.; Andrey, J.; Pequignot, E. Classification de surfaces dans une image hyperspectrale urbaine par réseau de neurones pour la qualité de l’air. In Proceedings of the 9ème Conférence Nationale sur les Applications Pratiques de l’Intelligence Artificielle APIA@ PFIA2023, Strasbourg, France, 6–7 July 2023; pp. 24–27. [Google Scholar]
- Audebert, N.; Le Saux, B.; Lefèvre, S. Deep learning for classification of hyperspectral data: A comparative review. IEEE Geosci. Remote. Sens. Mag. 2019, 7, 159–173. [Google Scholar] [CrossRef]
- Lu, G.; Fei, B. Medical hyperspectral imaging: A review. J. Biomed. Opt. 2014, 19, 010901. [Google Scholar] [CrossRef]
- Oliver, M.; Webster, R. A geostatistical basis for spatial weighting in multivariate classification. Math. Geol. 1989, 21, 15–35. [Google Scholar] [CrossRef]
- Fauvel, M.; Tarabalka, Y.; Benediktsson, J.A.; Chanussot, J.; Tilton, J.C. Advances in spectral-spatial classification of hyperspectral images. Proc. IEEE 2012, 101, 652–675. [Google Scholar] [CrossRef]
- Huang, X.; Zhang, L. A comparative study of spatial approaches for urban mapping using hyperspectral ROSIS images over Pavia City, northern Italy. Int. J. Remote Sens. 2009, 30, 3205–3221. [Google Scholar] [CrossRef]
- The Discrete Anisotropic Radiative Transfer Model. Available online: https://www.hyspex.com/hyperspectral-imaging/what-is-hsi/ (accessed on 15 November 2023).
- Kroese, D.P.; Rubinstein, R.Y. Monte carlo methods. Wiley Interdiscip. Rev. Comput. Stat. 2012, 4, 48–58. [Google Scholar] [CrossRef]
- MODIS UCSB Emissivity Library. Available online: https://icess.eri.ucsb.edu/modis/EMIS/html/em.html (accessed on 15 November 2023).
- Spectroscopy Lab. Available online: https://www.usgs.gov/labs/spectroscopy-lab (accessed on 15 November 2023).
- ECOSTRESS Spectral Library—Version 1.0. Available online: https://speclib.jpl.nasa.gov (accessed on 15 November 2023).
- Kotthaus, S.; Smith, T.E.; Wooster, M.J.; Grimmond, C. Derivation of an urban materials spectral library through emittance and reflectance spectroscopy. ISPRS J. Photogramm. Remote Sens. 2014, 94, 194–212. [Google Scholar] [CrossRef]
- NOAA Solar Calculator. Available online: https://gml.noaa.gov/grad/solcalc/ (accessed on 15 November 2023).
- Berk, A.; Bernstein, L.S.; Robertson, D.C. Modtran: A Moderate Resolution Model for LOWTRAN 7. Geophys. Lab. Tech. Rep. 1989, 89, 122. [Google Scholar]
- Berk, A.; Anderson, G.P.; Bernstein, L.S.; Acharya, P.K.; Dothe, H.; Matthew, M.W.; Adler-Golden, S.M.; Chetwynd, J.H., Jr.; Richtsmeier, S.C.; Pukall, B.; et al. MODTRAN4 radiative transfer modeling for atmospheric correction. In Proceedings of the Optical Spectroscopic Techniques and Instrumentation for Atmospheric and Space Research III, Denver, CO, USA, 19–21 July 1999; Volume 3756, pp. 348–353. [Google Scholar]
- Bingen, C.; Robert, C.; Hermans, C.; Vanhellemont, F.; Mateshvili, N.; Dekemper, E.; Fussen, D. A Revised Cross-Section Database for Gas Retrieval in the UV-Visible-Near IR Range, Applied to the GOMOS Retrieval Algorithm AerGOM. Front. Environ. Sci. 2019, 7, 118. [Google Scholar] [CrossRef]
- Kahn, R.A.; Gaitley, B.J.; Garay, M.J.; Diner, D.J.; Eck, T.F.; Smirnov, A.; Holben, B.N. Multiangle Imaging SpectroRadiometer global aerosol product assessment by comparison with the Aerosol Robotic Network. J. Geophys. Res. Atmos. 2010, 115, D23. [Google Scholar] [CrossRef]
- Levy, R.; Remer, L.; Kleidman, R.; Mattoo, S.; Ichoku, C.; Kahn, R.; Eck, T. Global evaluation of the Collection 5 MODIS dark-target aerosol products over land. Atmos. Chem. Phys. 2010, 10, 10399–10420. [Google Scholar] [CrossRef]


| Imaging System/Camera | VNIR-1600 |
|---|---|
| Spectral range | 416–992 nm |
| Spectral sampling interval | 3.6 mm |
| Spectral bandwidth | 3.5 mm |
| Radiometric error | 1% |
| Pixel size (microscope lens) | 24 m |
| Field of view | ∼ |
| Pixel/line (across track) | 1600 |
| Channels | 160 |
| Wavelengths | Trunk | Leaves | Grass | Roof (Tiles) | Building |
|---|---|---|---|---|---|
| 414 | 10.43 | 4.25 | 3.91 | 6.81 | 40.00 |
| 458 | 11.29 | 4.52 | 4.16 | 0.46 | 40.00 |
| 560 | 12.66 | 15.38 | 10.98 | 10.92 | 40.00 |
| 611 | 13.13 | 8.68 | 7.12 | 21.18 | 40.00 |
| 672 | 13.47 | 4.65 | 4.57 | 25.39 | 40.00 |
| 778 | 13.92 | 63.34 | 47.61 | 33.86 | 40.00 |
| 870 | 14.06 | 62.87 | 49.97 | 31.02 | 40.00 |
| 938 | 14.16 | 62.22 | 50.74 | 35.55 | 40.00 |
| LT | Azimuth Angle | Zenith Angle | Temperature (K) |
|---|---|---|---|
| 9:55 | 118 | 32 | 293 |
| 11:02 | 146 | 23 | 294 |
| 12:34 | 202 | 21 | 296 |
| 14:04 | 299 | 33 | 298 |
| 9:55 | 11:02 | 12:34 | 14:04 | |
|---|---|---|---|---|
| nRMSE | 3.8 | 3.5 | 2.9 | 2.8 |
| Correlation | 0.98 | 0.99 | 0.98 | 0.98 |
| RMSE | 8.0 | 7.1 | 6.1 | 7.2 |
| Pixels conserved 1 | 56 | 58 | 53 | 56 |
| Relative bias (excluding 938 nm) | 4 | 4 | 2 | −1 |
| 9:55 | 11:02 | 12:34 | 14:04 | |
|---|---|---|---|---|
| Bias | 0.007 | −0.002 | 0.014 | −0.015 |
| Relative bias | 7 | −3 | 20 | −17 |
| RMSE | 0.01 | 0.00 | 0.02 | 0.02 |
Disclaimer/Publisher’s Note: The statements, opinions and data contained in all publications are solely those of the individual author(s) and contributor(s) and not of MDPI and/or the editor(s). MDPI and/or the editor(s) disclaim responsibility for any injury to people or property resulting from any ideas, methods, instructions or products referred to in the content. |
© 2023 by the authors. Licensee MDPI, Basel, Switzerland. This article is an open access article distributed under the terms and conditions of the Creative Commons Attribution (CC BY) license (https://creativecommons.org/licenses/by/4.0/).
Share and Cite
Boulisset, V.; Attié, J.-L.; Tournier, R.; Ceamanos, X.; Andrey, J.; Pequignot, E.; Lauret, N.; Gastellu-Etchegorry, J.-P. Aerosol Optical Depth Measurements from a Simulated Low-Cost Multi-Wavelength Ground-Based Camera: A Clear Case over a Peri-Urban Area. Remote Sens. 2024, 16, 140. https://doi.org/10.3390/rs16010140
Boulisset V, Attié J-L, Tournier R, Ceamanos X, Andrey J, Pequignot E, Lauret N, Gastellu-Etchegorry J-P. Aerosol Optical Depth Measurements from a Simulated Low-Cost Multi-Wavelength Ground-Based Camera: A Clear Case over a Peri-Urban Area. Remote Sensing. 2024; 16(1):140. https://doi.org/10.3390/rs16010140
Chicago/Turabian StyleBoulisset, Valentin, Jean-Luc Attié, Ronan Tournier, Xavier Ceamanos, Javier Andrey, Eric Pequignot, Nicolas Lauret, and Jean-Philippe Gastellu-Etchegorry. 2024. "Aerosol Optical Depth Measurements from a Simulated Low-Cost Multi-Wavelength Ground-Based Camera: A Clear Case over a Peri-Urban Area" Remote Sensing 16, no. 1: 140. https://doi.org/10.3390/rs16010140