Article

All-Weather Monitoring of Ulva prolifera in the Yellow Sea Based on Sentinel-1, Sentinel-3, and NPP Satellite Data

1
Co-Innovation Center for Sustainable Forestry in Southern China, Laboratory of Biodiversity and Conservation, College of Ecology and Environment, Nanjing Forestry University, Nanjing 210037, China
2
National Positioning Observation Station of Hung-Tse Lake Wetland Ecosystem in Jiangsu Province, Hongze 223100, China
3
Jiangsu Provincial Environmental Monitoring Center, Jiangsu Marine Environment Monitoring and Forecasting Center, Nanjing 210019, China
4
School of Remote Sensing and Geomatics Engineering, Nanjing University of Information Science and Technology, Nanjing 210044, China
*
Author to whom correspondence should be addressed.
Remote Sens. 2023, 15(24), 5772; https://doi.org/10.3390/rs15245772
Submission received: 12 October 2023 / Revised: 17 November 2023 / Accepted: 14 December 2023 / Published: 18 December 2023
(This article belongs to the Special Issue Assessment of Ecosystem Services Based on Satellite Data)

Abstract

:
Ulva prolifera (U. prolifera), a global eco-environmental issue, has been recurring annually in the Yellow Sea of China since 2007, leading to significant impacts on the coastal ecosystem and the economies of coastal cities. To enhance the frequency of daily monitoring for U. prolifera and to advance the multi-source remote sensing monitoring system, a combination of the Sentinel-1 SAR remote sensing satellite and the Sentinel-3 OLCI and NPP VIIRS optical remote sensing satellites was employed. This comprehensive analysis encompassed the examination of Sentinel-1 C band characteristics, the range of influence of U. prolifera, and the migration trajectory of its enrichment zones. On 6 June 2021, three satellite images depicted the northwest drift of U. prolifera, followed by a southward movement after making contact with the coast of Qingdao, China, on 12 June. The most extensive impact area caused by U. prolifera was observed on 18 June. Subsequently, the images revealed a contraction and enrichment of U. prolifera in an eas–-west direction. The amalgamation of radar and optical remote sensing satellites in a multi-frequency monitoring approach allows for a continuous all-weather surveillance mechanism for U. prolifera. This mechanism serves to provide timely alerts for the prevention and management of U. prolifera outbreaks.

1. Introduction

U. prolifera, a floating mass of reproductive bodies formed by green algae breaking away from their fixation base due to coastal eutrophication, has been causing periodic and extensive outbreaks in the Yellow Sea waters every summer since 2007 [1,2,3]. These outbreaks have had a profound impact on the hydrological and ecological environment of the region, resulting in substantial economic losses and social disruptions in coastal cities [4].
Traditional monitoring approaches for U. prolifera heavily rely on extensive on-site activities at sea, including the deployment of survey ships, buoys, submersibles, and seabed installations [5,6]. However, due to the sudden occurrence of U. prolifera outbreaks and the unpredictable summer weather conditions in the Yellow Sea, effectively tracking the high-frequency evolution of U. prolifera using these conventional methods has proven challenging [7,8]. In contrast, satellite remote sensing technology, an emerging environmental monitoring method, offers the advantage of continuous, round-the-clock observations, providing real-time feedback in the form of monitoring data. This technology not only facilitates the collection of long-term observational data but also significantly reduces the demand for human, material, and financial resources. Consequently, it has become an indispensable tool for studying large-scale marine ecological disasters.
Remote sensing satellites are categorized into active and passive types of remote sensing based on the characteristics of the sensors they employ. The diverse working modes of these satellites offer a wide range of options for monitoring and early warning in the aftermath of U. prolifera outbreaks [9,10,11]. Optical remote sensing satellites, representing a form of passive remote sensing, utilize the spectral reflectance properties of U. prolifera to derive information through the construction of indices such as the NDVI or EVI based on remote sensing reflectance in the visible and near-infrared bands [12,13,14,15,16]. An active microwave radar remote sensing satellite emits a specific form of electromagnetic wave in the direction of the target, and subsequently, the sensor receives and records its reflected signal [17,18]. Due to noticeable discrepancies in gray values or backscattering coefficients obtained from the echo signals of U. prolifera and the water body, precise differentiation between U. prolifera information and sea surface data can be reliably achieved [19].
Presently, a substantial body of research and applications predominantly relies on optical remote sensing monitoring, utilizing data from a single type of satellite [10,20,21,22,23,24,25]. However, the imaging capabilities of optical remote sensing satellites over the Yellow Sea’s U. prolifera are significantly impacted by meteorological factors, such as sea fog and cloud cover, within the study area. Consequently, satellite passages are primarily concentrated between 10 a.m. and 2 p.m., posing challenges in achieving comprehensive, all-weather remote sensing monitoring of U. prolifera. Simultaneously, most daily monitoring utilizes MODIS satellite images, which are characterized by spatial resolutions ranging from 250 m to 1000 m, placing them in the category of medium- and low-resolution satellite remote sensing data. The presence of numerous mixed pixels within these data complicates the accurate delineation and matching of U. prolifera patches [23,25,26,27].
In recent years, scholars of relevance have deliberated on the utilization of Synthetic Aperture Radar (SAR) remote sensing data for the extraction of U. prolifera information. A study conducted by Qi et al. [28] utilized Sentinel-1 data to assess the efficacy of SAR in detecting floating macroalgae across spatial and temporal scales. By employing statistical analysis and comparing Sentinel-2 MSI with Sentinel-1 SAR imagery, it was consistently observed that macroalgal features were distinctly represented in the Sentinel-1 images, allowing for their clear differentiation from the surrounding waters. Notably, U. prolifera was the only species clearly identifiable in these images. Guo et al. [29] developed a texturally enhanced deep learning (DL) model for monitoring U. prolifera in Sentinel-1 SAR images which effectively distinguishes and classifies U. prolifera and provides a comprehensive understanding of the multi-year monitoring situation of the U. prolifera phenomenon in the Yellow Sea. Wang et al. [30] employed an automated threshold algorithm to detect U. prolifera in the Yellow Sea, successfully validating the efficacy of this method for identifying outbreak areas of U. prolifera and judging the response characteristics of different bands of microwave remote sensing radar to U. prolifera in the future. The aforementioned studies successfully validated the feasibility of monitoring U. prolifera through microwave remote sensing radar. However, there is a scarcity of reports on cases identifying U. prolifera by combining multi-scene and multi-type optical satellite data within a single day. Therefore, this paper utilizes Sentinel-1 SAR satellite remote sensing data in conjunction with Sentinel-3 OLCI and NPP VIIRS optical remote sensing data to analyze image examples for Yellow Sea green tide monitoring. Specifically, the threshold division of different U. prolifera regions was determined based on backscattering coefficient characteristics, while the combined application of optical remote sensing data enables a more accurate analysis of short-term trends in U. prolifera occurrence. The calculation of affected areas during U. prolifera outbreaks and the study of its migration process can be utilized for numerical simulation and prediction regarding the floating movement patterns of U. prolifera, thereby facilitating corresponding management efforts, providing valuable data support for reducing harmful algal bloom occurrences and serving as a more valuable reference for fishing activities and prevention measures against green tide disasters.

2. Materials and Methods

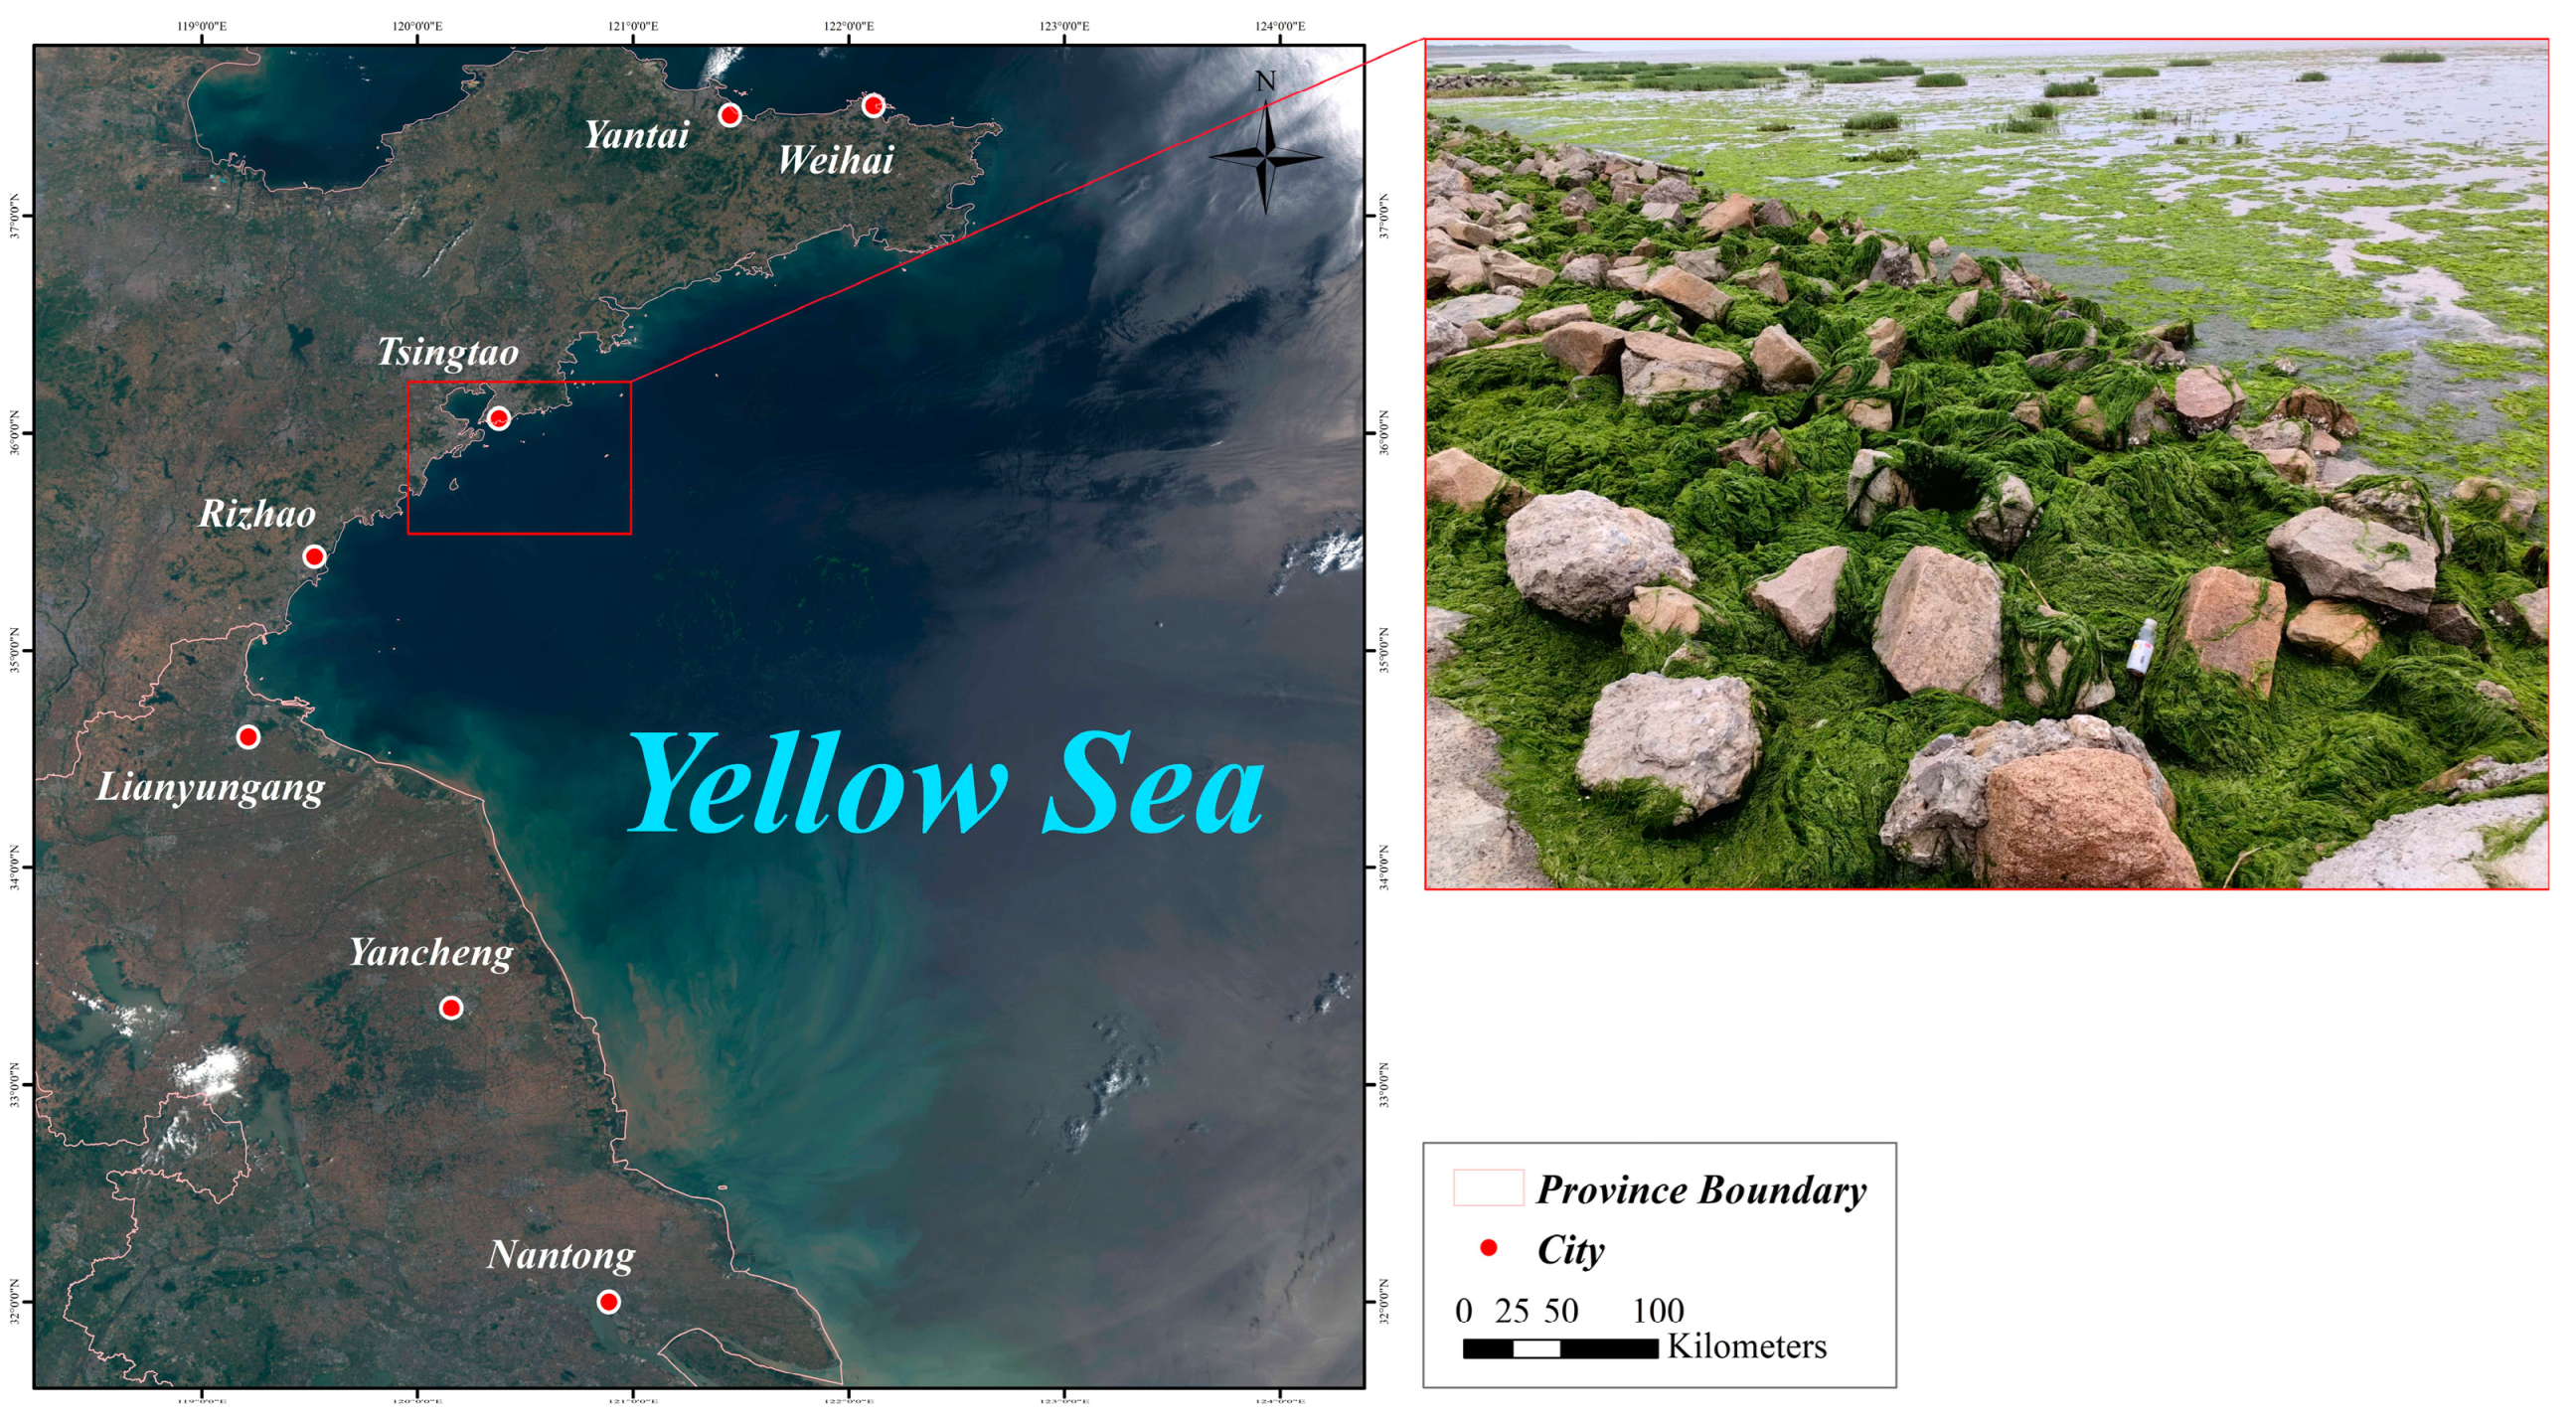
2.1. Study Area Overview

The Yellow Sea, a semi-open shelf sea in the western North Pacific, is located between the Chinese mainland and the Korean Peninsula, with a latitude and longitude of about 31°N~39°N and 119°E~127°E and sea area of about 400,000 square kilometers (Figure 1) [31]. The sea area covers subtropical and warm temperate zones, with a warm and humid summer and a cold and dry winter. The distribution of sea water temperature in the Yellow Sea exhibits distinct seasonal variations, with water temperatures ranging from 20 to 28 °C during summer and −2 to 4 °C during winter. Additionally, coastal areas experience lower water temperatures compared to those outside the sea. The rainy season of the Yellow Sea lasts from about June to August each year, with rainfall reaching 50~70% of the annual rainfall and fog frequently appearing for several days. The southern sea area of the Yellow Sea is affected by summer typhoons and storm tides, with weak overall sea circulation and surface ocean currents easily restricted by the wind field, showing obvious wind–sea current characteristics [32].

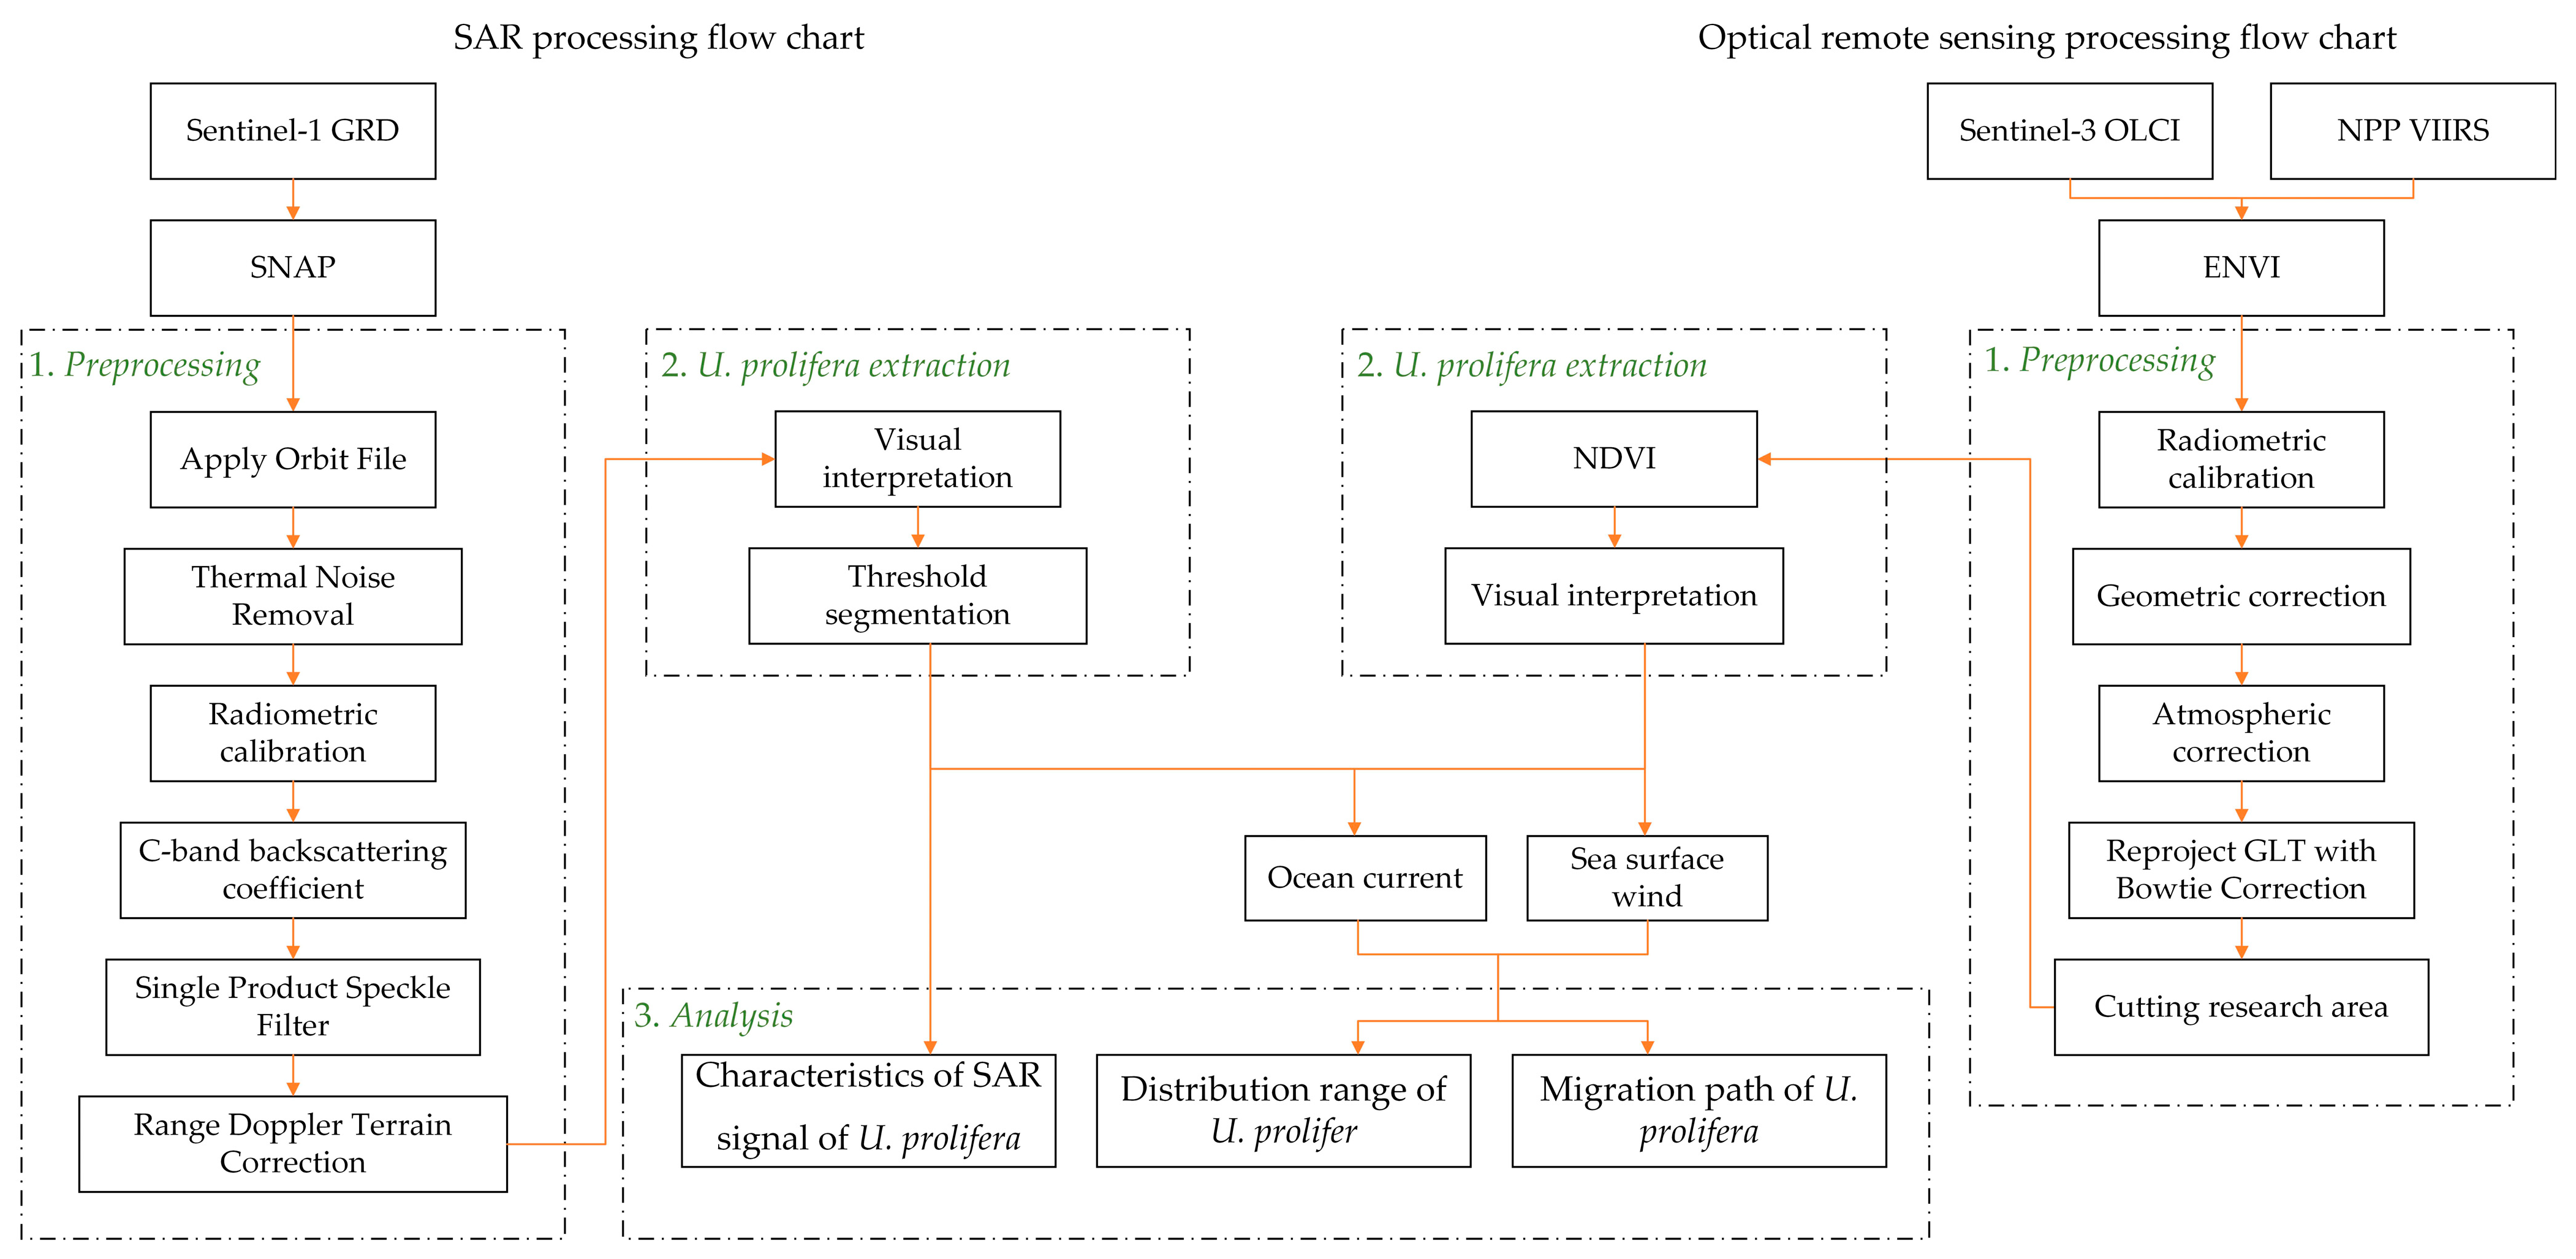
2.2. Remote Sensing Data Sources and Preprocessing

Optical remote sensing techniques are widely employed; prominent sensors are the OLCI system on the Sentinel-3 satellite from the European Space Agency (ESA) and the VIIRS system on the NPP satellite operated by the National Aeronautics and Space Administration (NASA). These optical data play a crucial role in effectively monitoring U. prolifera using remote sensing. The Sentinel-1 satellite [18,33,34,35], a key component of the ESA’s Copernicus program, is equipped with a C-band SAR sensor, making it an active microwave remote sensing satellite. Operating at a central frequency of 5.405 GHz, the satellite encompasses four imaging modes (SM, IW, EW, and WV), offering a maximum resolution of 5 m. It boasts polarimetric capabilities, revisiting occurs on a 6-day cycle, and it demonstrates rapid product generation. Functioning within a near-polar sun-synchronous orbit at an orbital altitude of approximately 700 km, Sentinel-1 operates as an all-weather radar imaging system. This study employed remote sensing imagery data comprising Sentinel-1 SAR, Sentinel-3 OLCI, and NPP VIIRS datasets (Table 1). Sentinel-1 and Sentinel-3 images were sourced from the ESA data center (https://scihub.copernicus.eu/maintenance.html, accessed on 10 April 2022). The Sentinel-1 SAR data includes Single Look Complex (SLC) and Ground Range Detected (GRD) products. Among these options, the GRD product represents focused data subjected to multi-view processing. It employs WGS84 ellipsoid projection for ground distance calculations, with ground distance coordinates resulting from oblique coordinates projected onto the Earth ellipsoid. The GRD product was chosen for the extraction and processing of SAR information related to U. prolifera. The NPP VIIRS image was obtained from the NASA website (https://ladsweb.modaps.eosdis.nasa.gov/view-data/, accessed on 10 April 2022). The remote sensing data selected for research were acquired on 6 June 2021, 18 June 2021, and 30 June 2021.
For Sentinel-1 SAR, SNAP was utilized for preprocessing, encompassing precise satellite orbit data correction, polarization data radiation correction, geographical correction, and WGS84/UTM51 projection conversion (Figure 2). Following preprocessing, the spatial resolution stood at 10 m. An ENVI remote sensing analysis was employed for OLCI and VIIRS data preprocessing, as well as for analyzing SAR and optical remote sensing image outcomes. Geometric center-point geographical coordinates of densely concentrated U. prolifera patches were determined through visual interpretation and NDVI threshold segmentation. Thematic mapping was conducted using ArcGIS [36].
To ensure data quality, capture the essence of data comparisons, and validate the efficacy and applicability of SAR image monitoring under cloud cover, four specific days in June 2021 were chosen within the Yellow Sea region: 6 June showcased clear skies, while 12 June and 18 June experienced continuous cloudiness, and 30 June exhibited partial cloud cover. The corresponding Sentinel-3 OLCI and NPP VIIRS optical remote sensing images for these four days are illustrated in Figure 3.

2.3. Backscattering Coefficient Calculation

A radar image is essentially a recorded representation of the intensity and phase of an echo scattered by a ground target in response to a radar signal. By analyzing the backscattering characteristics of the target object across various frequencies, incident angles, and polarization conditions, we can effectively characterize its physical or geometric properties. The computation formula for the backscattering coefficient of Sentinel-1 SAR GRD is as follows:
σ i 0 = D N i 2 + b A i ,
where σ i 0 is the backscattering coefficient of a pixel i; A i is the backscattering correction parameter of the pixel i in the GRD data file; b is the deviation correction quantity; and D N is the quantization value of the image reflecting the backscattering intensity. The σ V H 0 and σ V V 0 of the Sentinel-1 SAR VH and VV polarization modes are calculated, respectively, and the combination of σ V H 0 , σ V V 0 , and σ V V 0 σ V H 0 is used for RGB false color synthesis. The OLCI images are synthesized with oa8 (0.665 μm), oa6 (0.56 μm), and oa4 (0.49 μm) RGB true color, and the VIIRS images are synthesized with I3 (1.61 μm), I2 (0.865 μm), and I1 (0.64 μm) RGB false color. Table 2 displays the backscattering coefficients of GRD data from various ground targets observed by Sentinel-1 SAR on 6 June, 12 June, 18 June, and 30 June in 2021. Notably, the distribution pattern of U. prolifera manifests as pink, banded, and patchy in SAR images, while it appears as vibrant green, flocculent, and patchy in OLCI true-color images as well as VIIRS false-color images (as depicted in Figure 4).

3. Results

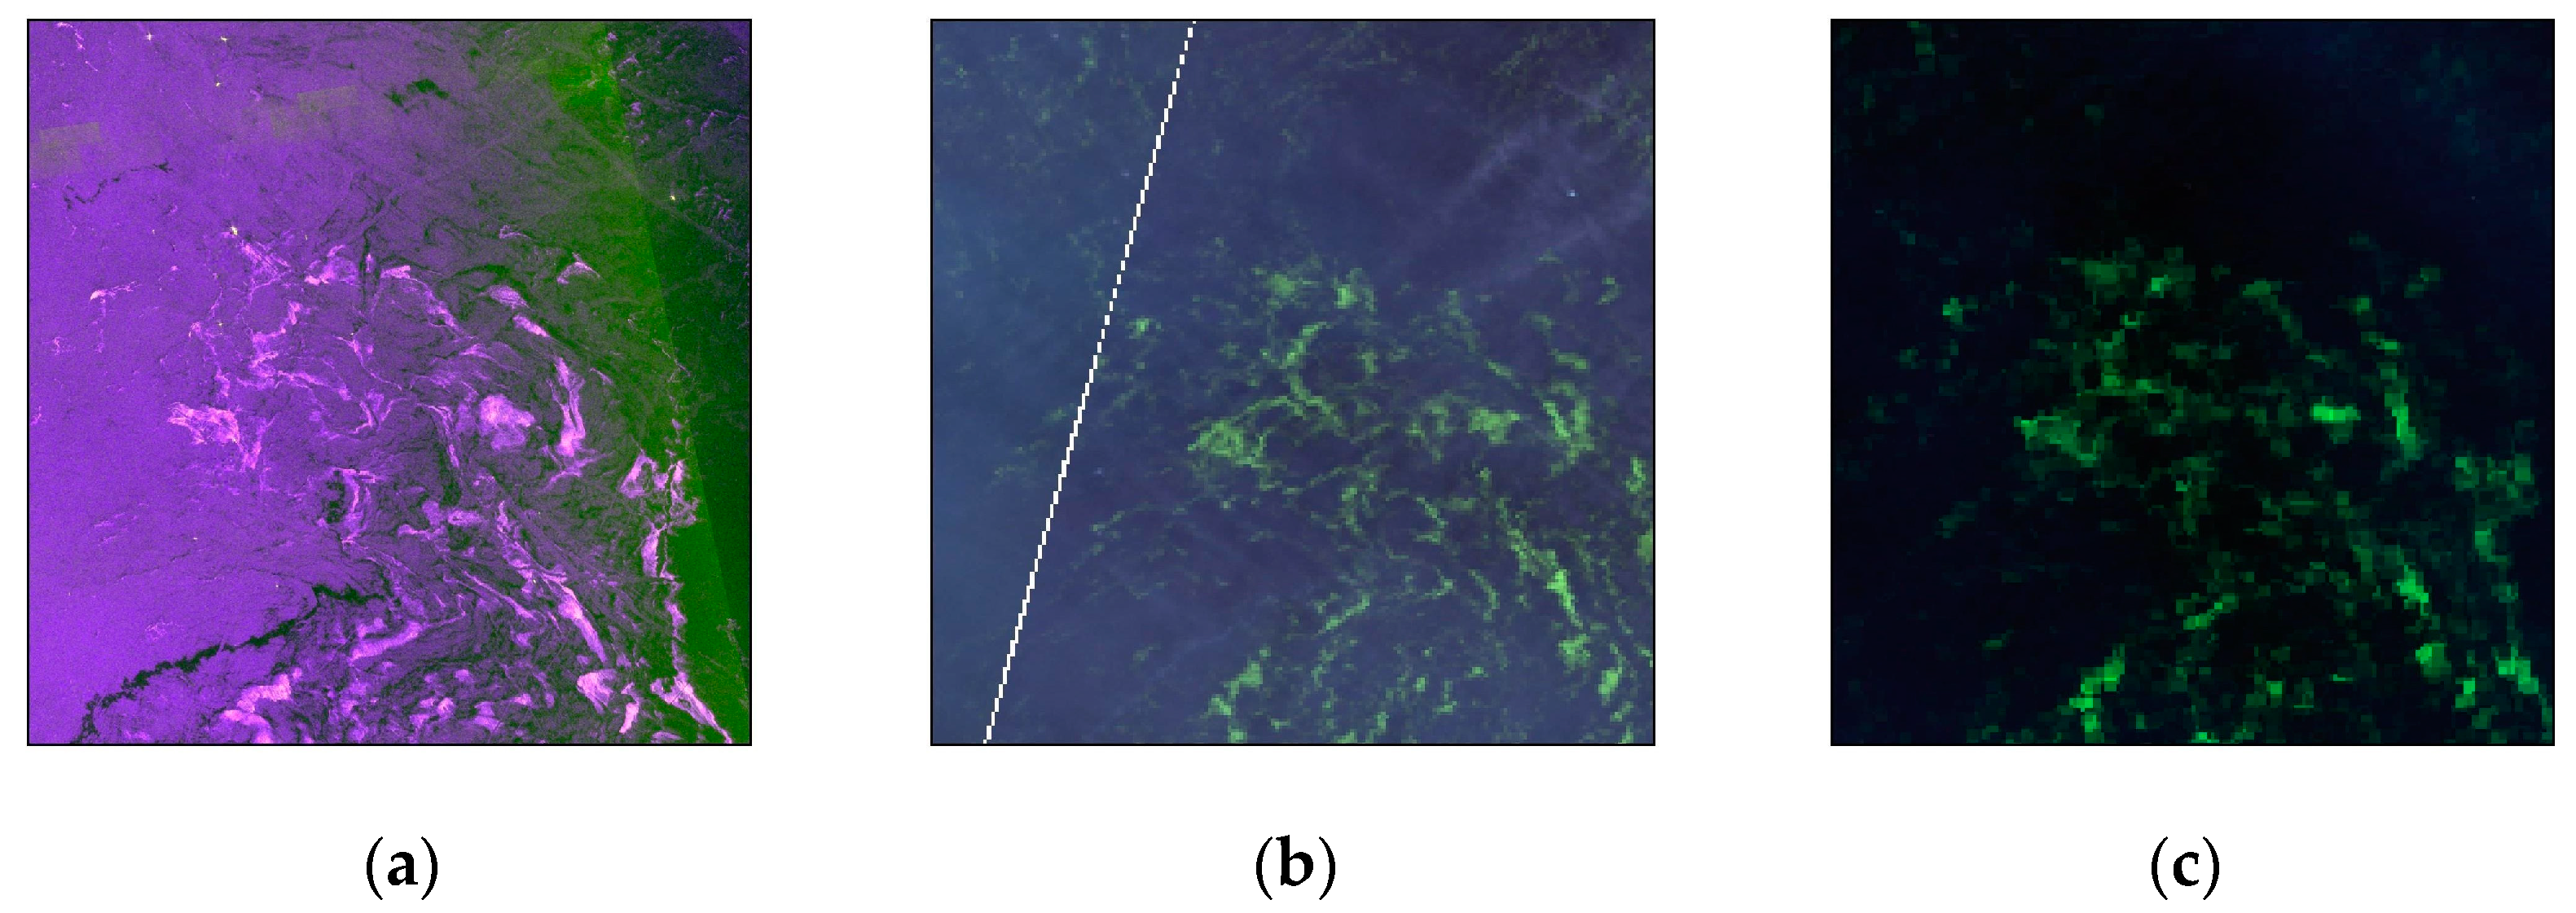
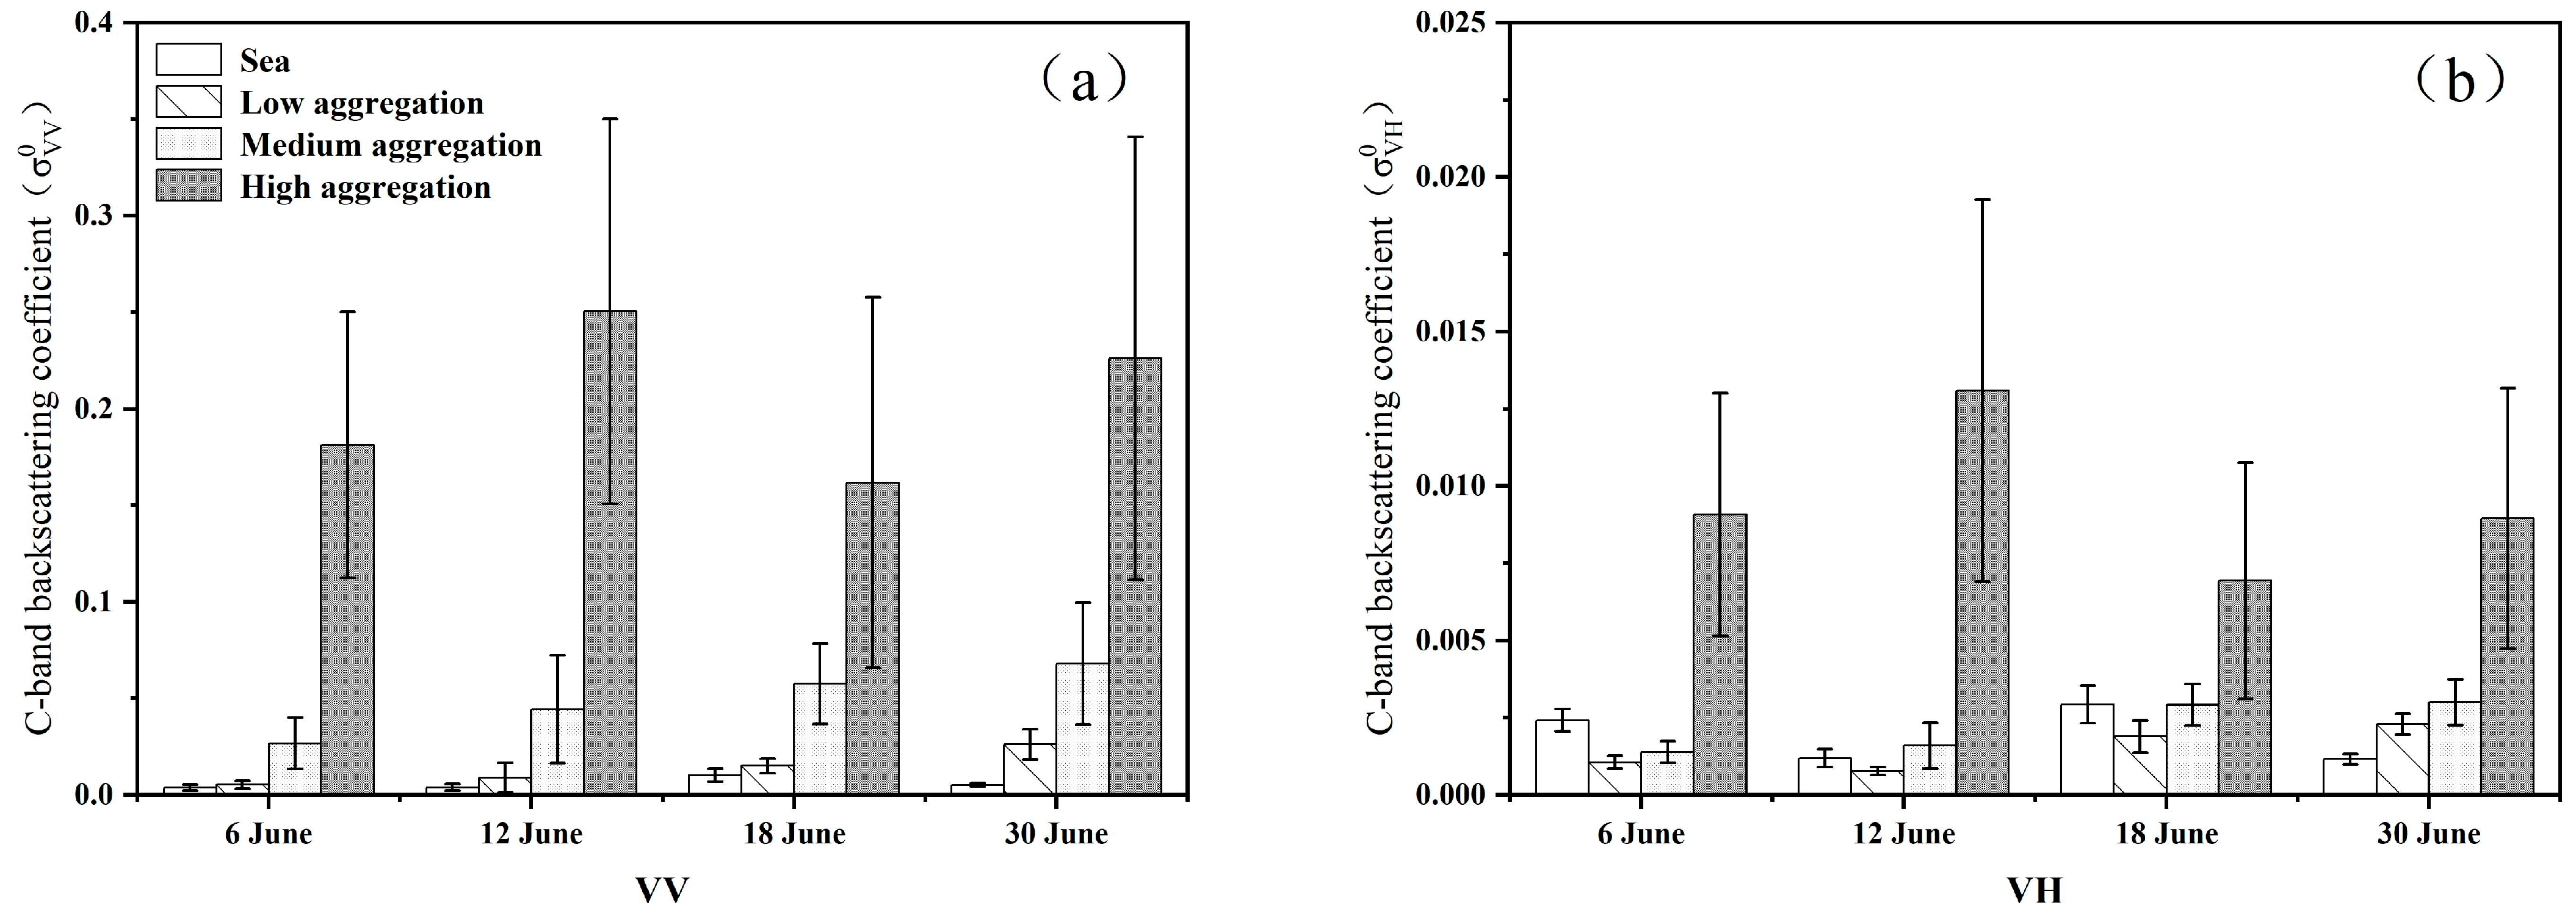
3.1. Characteristics of Sentinel-1 C Band SAR Signal of U. prolifera

SAR uses different polarization methods to transmit and receive radar signals, which enables the radar system to obtain rich information on the scattering characteristics of ground objects and targets. Different polarization modes can obtain a polarization scattering matrix of the intrinsic characteristics of a reactive ground target according to the electromagnetic wave polarization scattering characteristics of the target so the characteristics of the target can be analyzed and extracted [36,37,38]. The two polarization signal intensities, σ V H 0 and σ V V 0 , for the Sentinel-1 GRD images are shown in Figure 5.
Based on the backscattered signal intensities observed in different aggregation areas in Figure 5 in both VV polarization mode and VH polarization mode, regions characterized by high U. prolifera aggregation consistently exhibit signal strengths four to seven times higher than those in areas with low U. prolifera aggregation. This difference can be attributed to the accelerated vegetative growth of U. prolifera in highly aggregated zones [39]. As a result of photosynthesis, these algae produce bubbles, enhancing their buoyancy and causing the formation of U. prolifera patches on the sea surface. The radar scattering coefficient for an area of vegetation is not only influenced by radar system parameters but is also dependent on the complex dielectric constant, vegetation coverage, surface roughness, and vegetation moisture content, among other factors. As the exposed area of U. prolifera increases, its dielectric constant experiences a rapid rise accompanied by an amplification in radar echo intensity. Consequently, when radar waves interact with these floating U. prolifera clusters, strong scattering and angular reflection occur, leading to a significant portion of electromagnetic waves being reflected back and received by the radar antenna. However, in middle- and low-aggregation areas, U. prolifera exhibits reduced buoyancy and predominantly lies below sea level. Consequently, the majority of electromagnetic wave signals are reflected by the smooth surface of the sea, resulting in minimal signal reflection back to radar antennas. This discrepancy leads to significant variations in backscattered signals between areas of high and middle-to-low aggregation. From the perspective of different polarization modes, the backscattering coefficient in VV polarization mode for the C-band is 15 to 20 times higher than that in VH polarization mode. This is because SAR transmits and receives signals perpendicular to the water body in VV polarization mode, which makes radar signals penetrate the water body better to obtain the information of U. prolifera under the seawater surface [40]. Based on the scattering coefficients of various ground objects, the backscattering coefficients of low-, medium-, and high-aggregation areas of U. prolifera are from 1.4 to 4, from 7.1 to 13, and from 43 to 65 times higher than those of seawater, respectively, in VV polarization mode; this differentiation is significant and serves as an effective index for identifying U. prolifera with a good correlation to the intensity of its aggregation. In VH polarization mode, changes in σ V H 0 were not obvious for low- and middle-aggregation areas but only increased by more than three times for high-aggregation areas.
The threshold segmentation classification algorithm is widely employed as a practical method for water extraction in the field of remote sensing [41]. Its principle involves segmenting radar images by identifying the backscattering coefficient thresholds of different ground objects, and the accuracy of the final results greatly depends on the selection of these thresholds. A relatively accurate approach is to adjust and select suitable thresholds through human–computer interaction visual interpretation. The advantage of high threshold accuracy becomes evident when monitoring targets with clear ranges. Due to the uneven distribution of backscattering coefficients in seawater across different regions, U. prolifera was extracted using a multi-region mask and a dynamic threshold extraction method. The segmentation threshold for the regional classification of U. prolifera was determined through a dichotomy calculation. This threshold can be considered the optimal segmentation threshold when it closely aligns with statistical data from the Sentinel-3 and NPP satellites. By determining the segmentation threshold, the classification of U. prolifera with varying aggregation degrees was achieved, and the accuracy of backscattering coefficient extraction was quantitatively analyzed using a confusion matrix. Based on the signal characteristics of Sentinel-1 SAR GRD and manual visual interpretation results, σ V V 0   = 0.005 can be utilized as the boundary threshold between seawater and low aggregation, 0.03 as the threshold between low and medium aggregation, and 0.15 as the threshold between middle- and high-aggregation areas. Additionally, σ V H 0   = 0.007 serves as an auxiliary threshold for delineating high-aggregation regions of U. prolifera.
In order to validate the reliability of the information extracted from different aggregation areas of U. prolifera using the backscattering coefficient, the confusion matrix method was employed to assess its accuracy. The evaluation criteria utilized were overall accuracy and the Kappa statistical index (Table 3). It can be observed from Table 3 that the obtained U. prolifera aggregation area information exhibits an overall accuracy of 85% with a Kappa statistical index reaching 0.71, thereby essentially meeting the general requirements for data statistical analysis accuracy. Consequently, the selected threshold interval in this study was deemed accurate and consistent with actual circumstances.

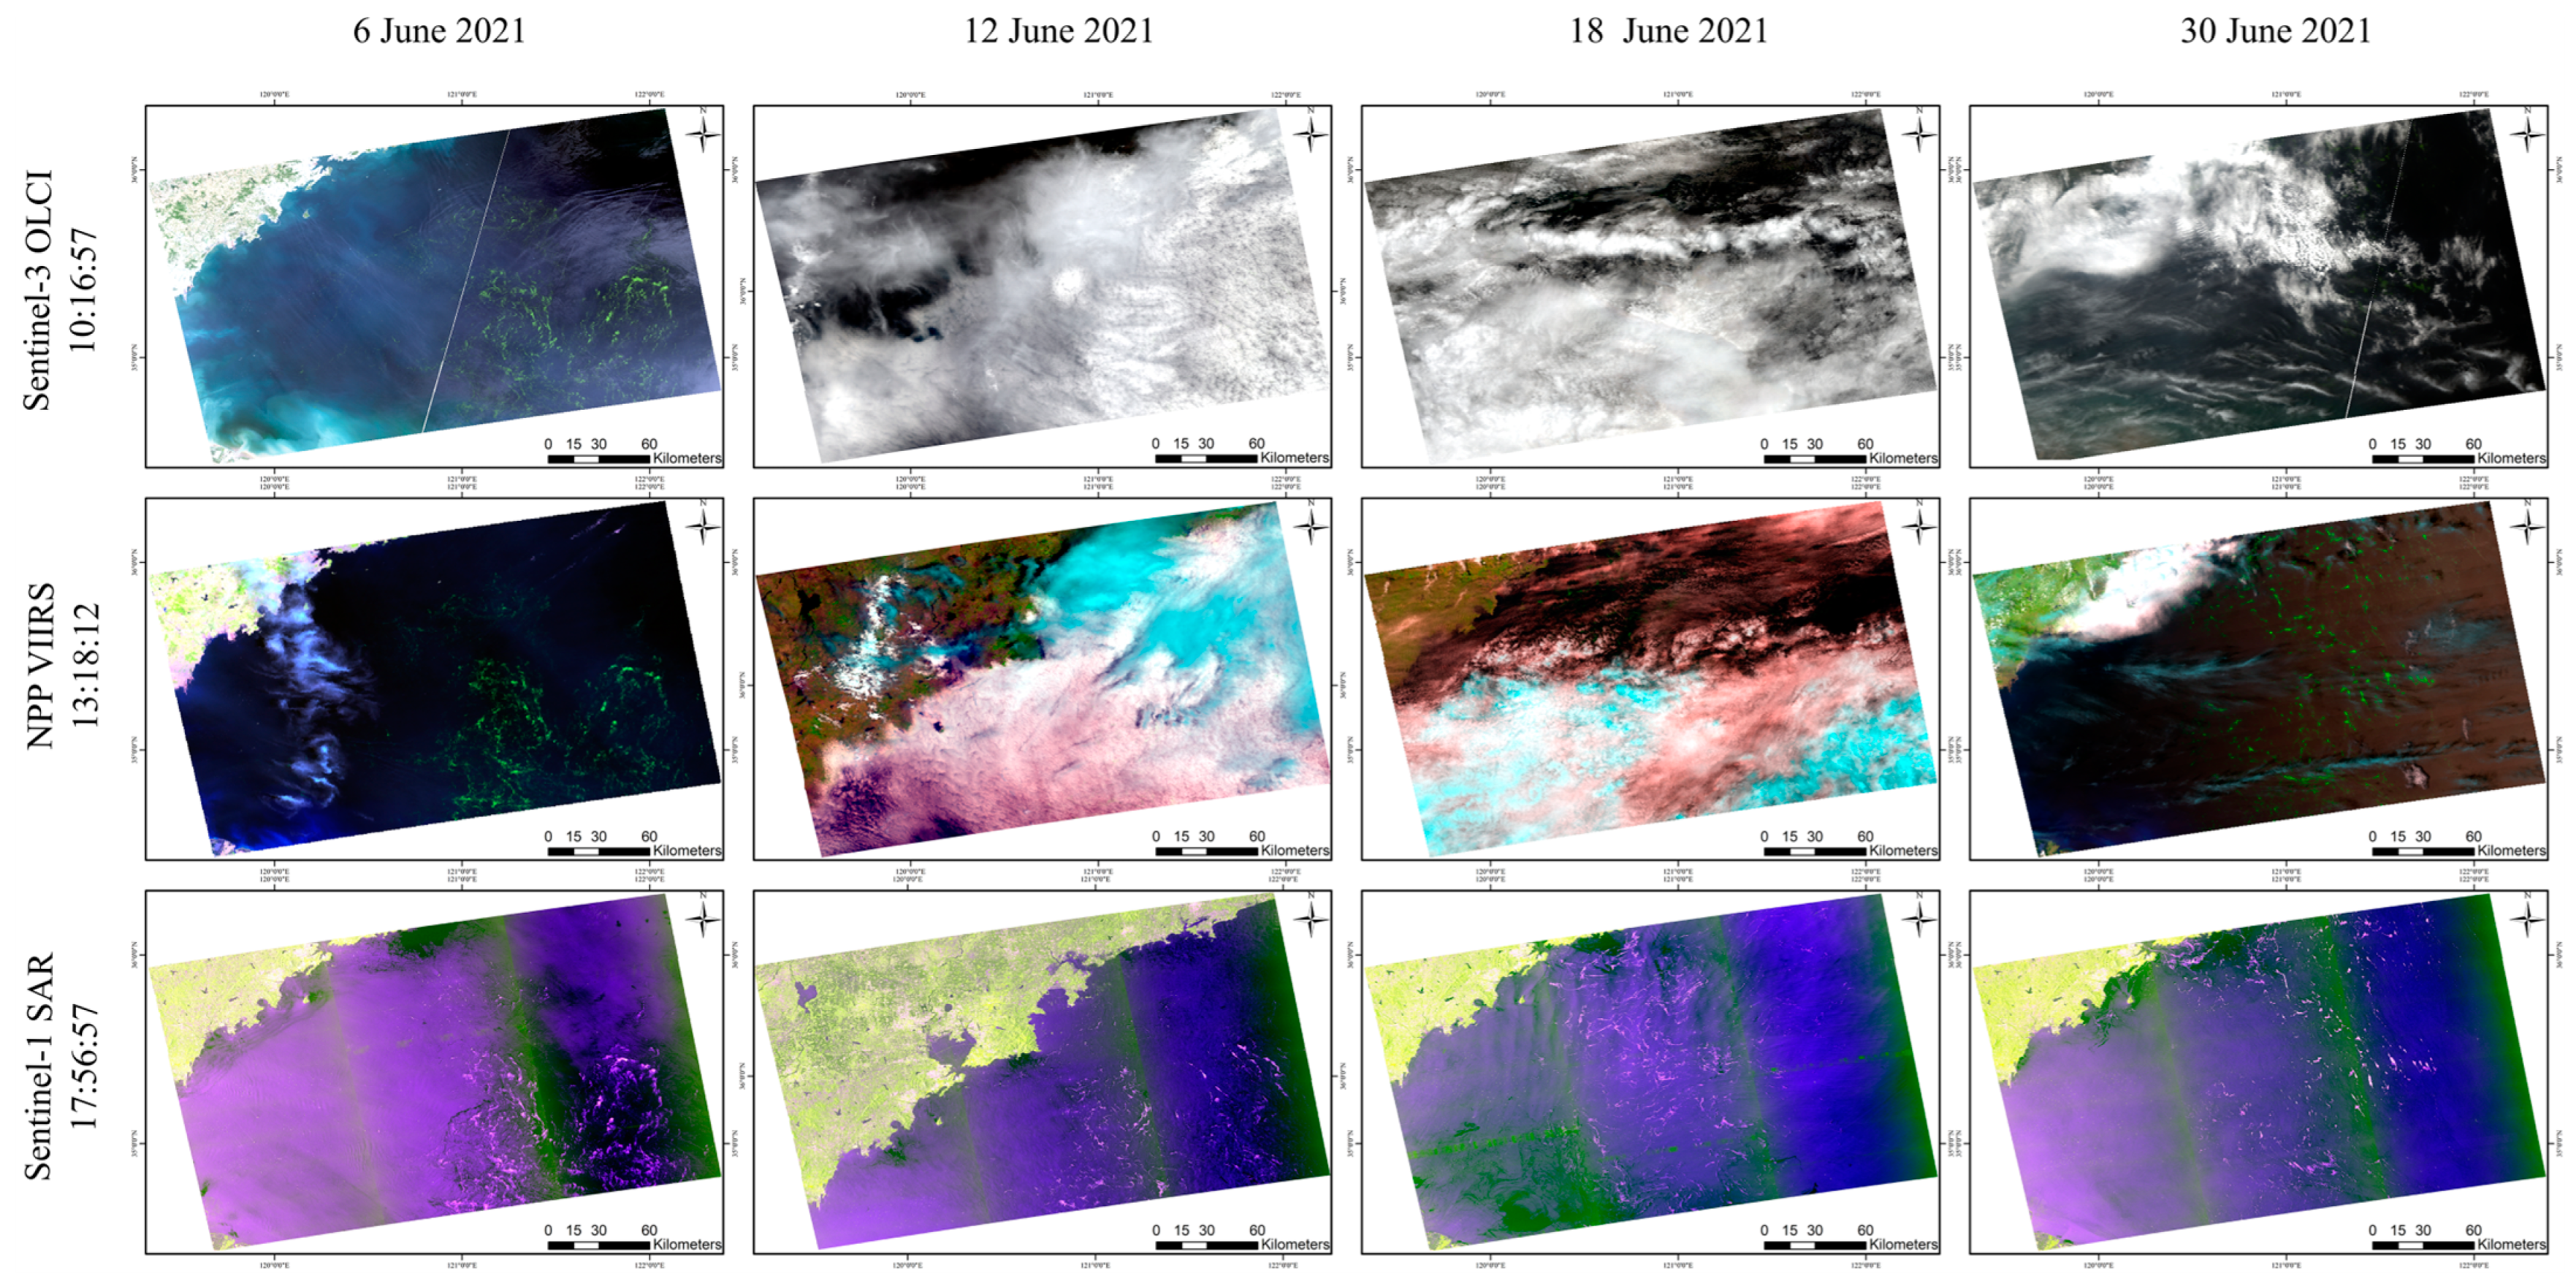
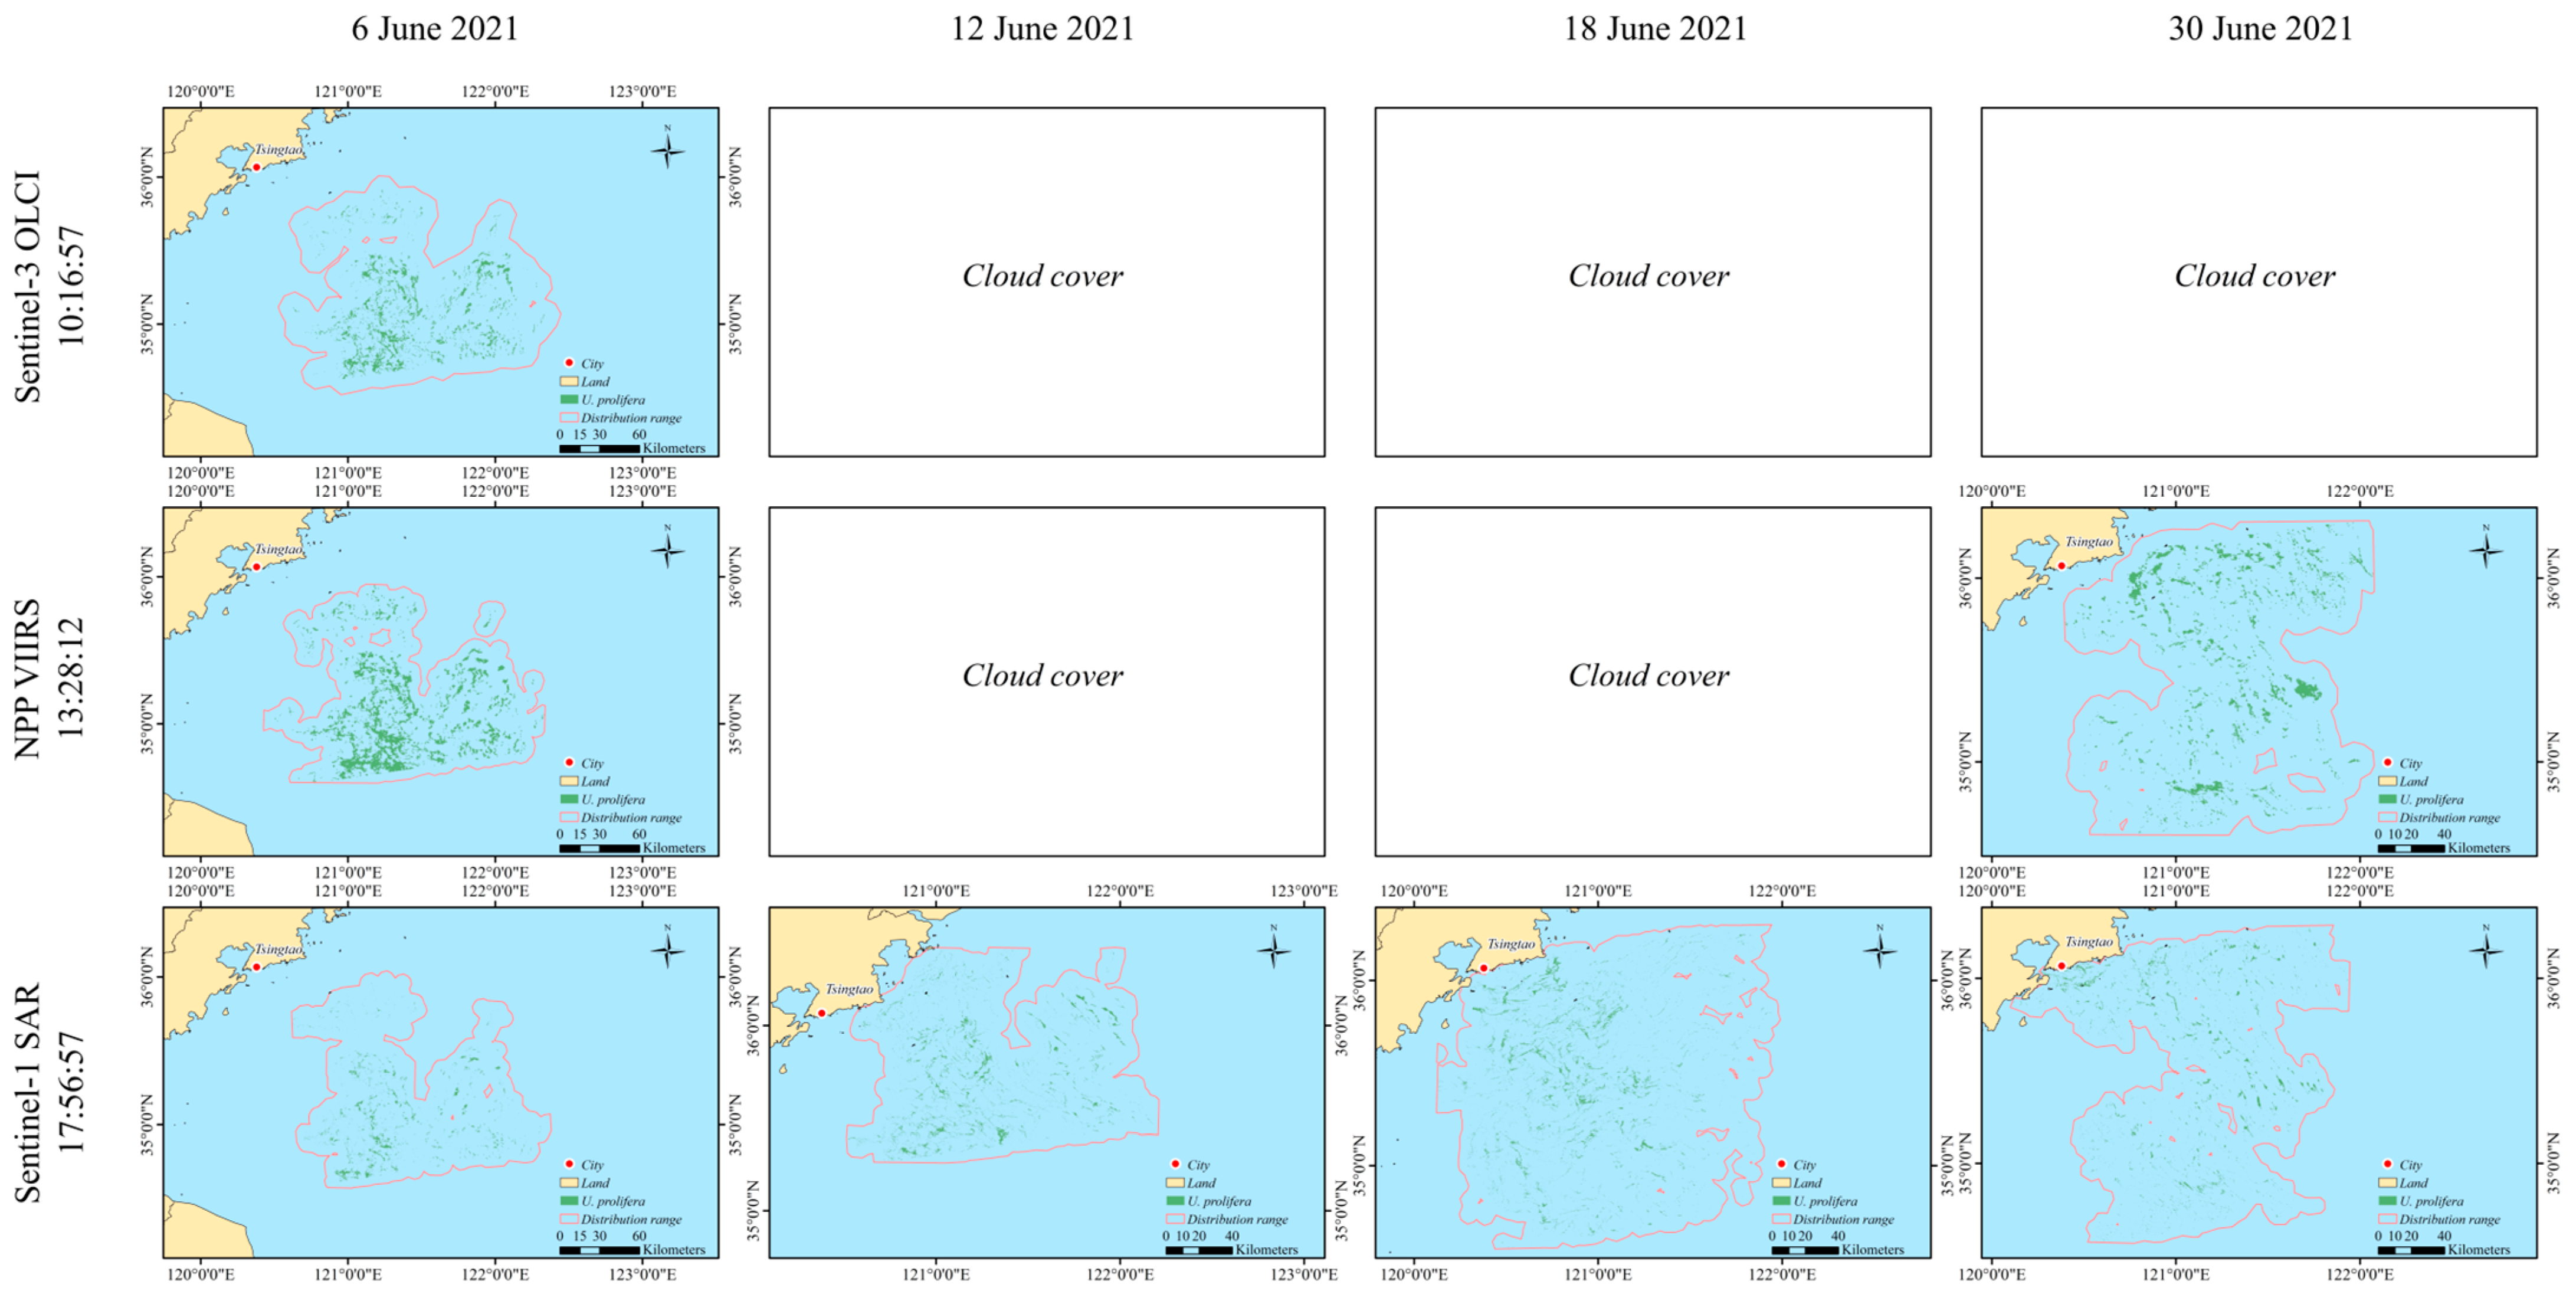
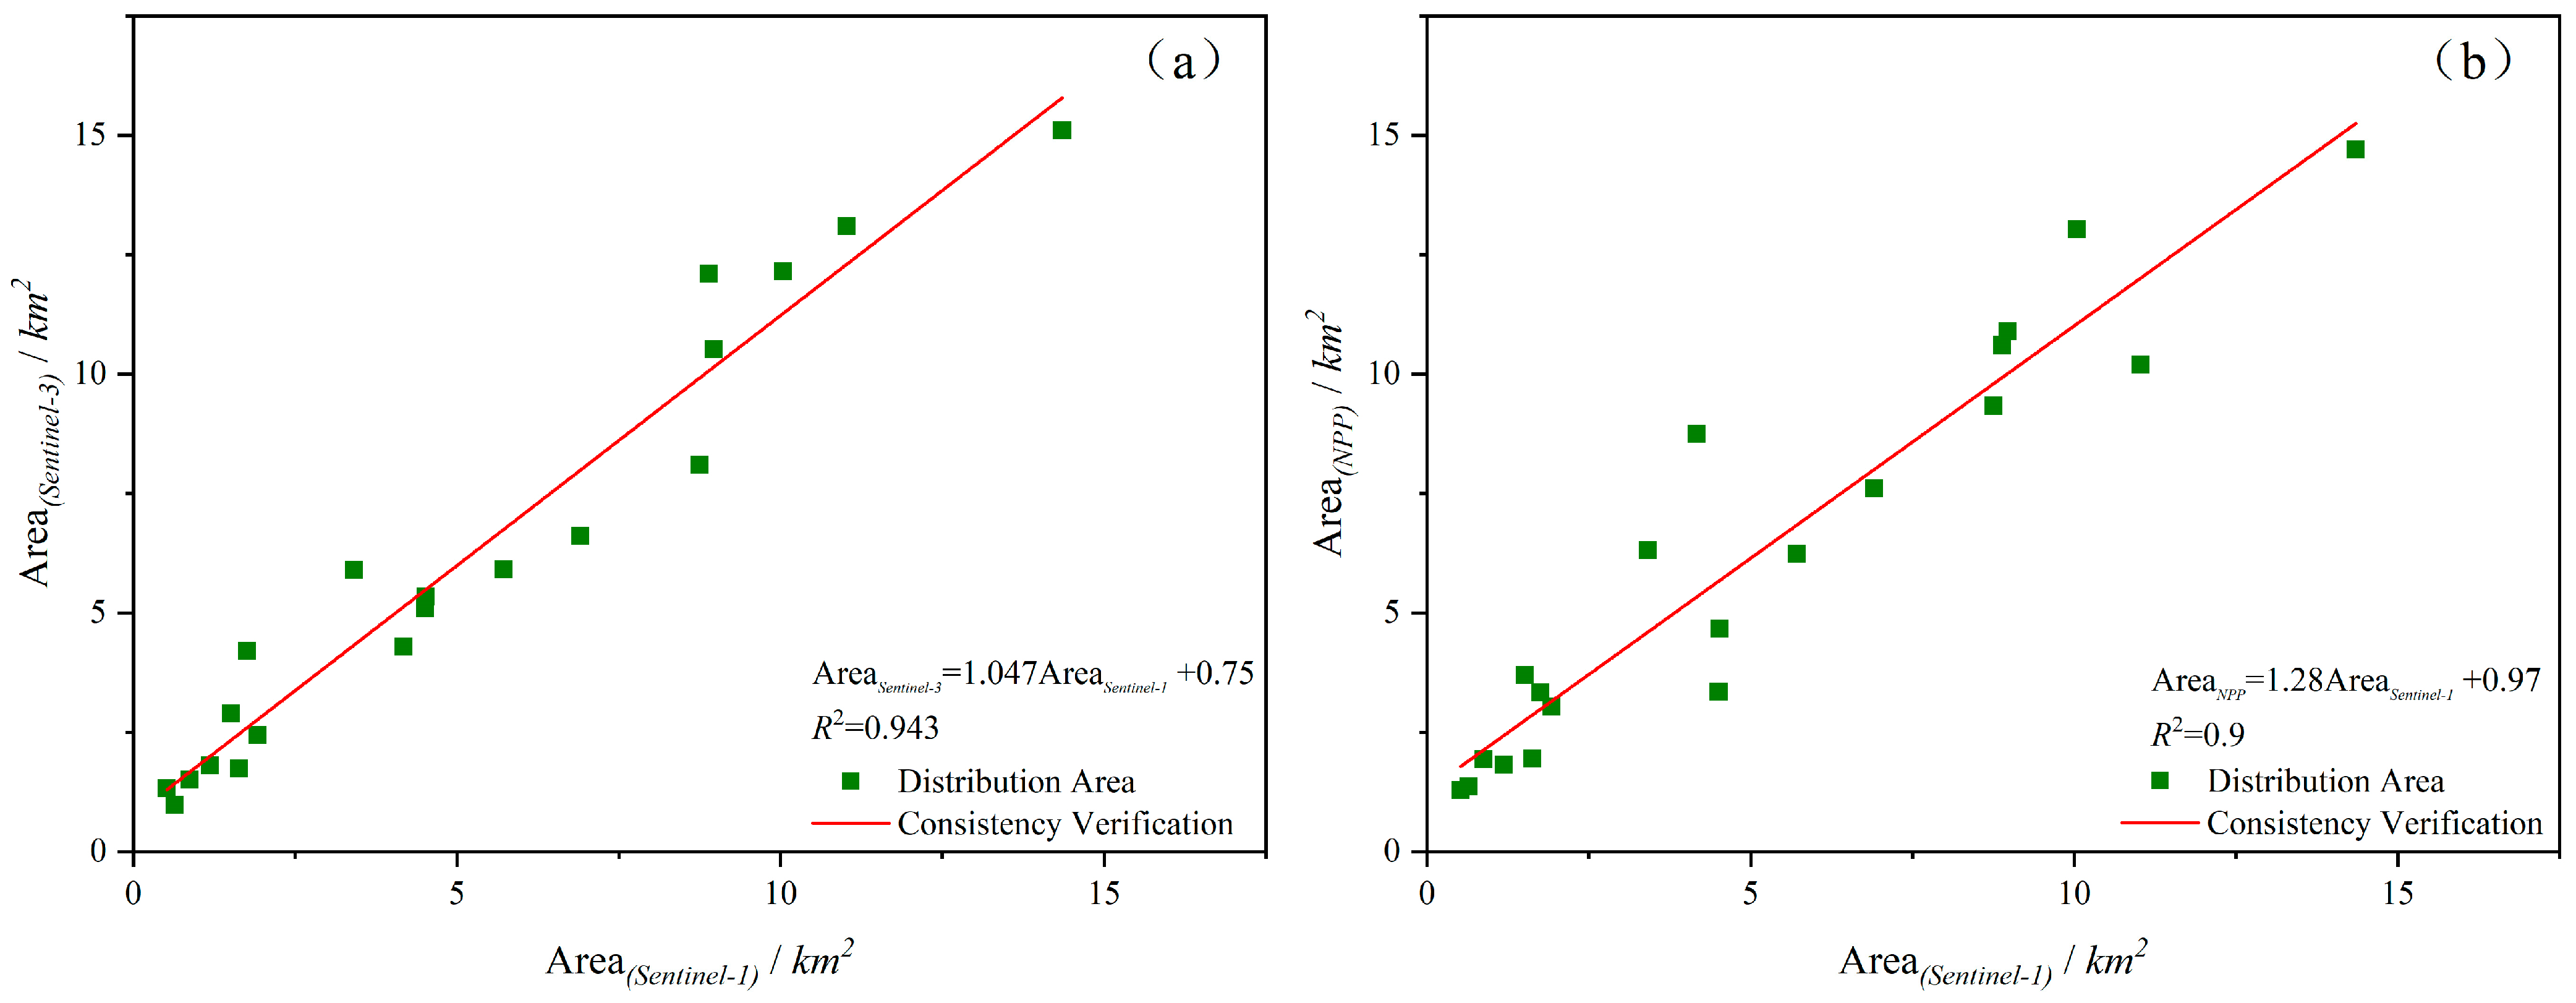
3.2. Distribution Range of U. prolifera

Area analysis is a widely employed quantitative method for analyzing U. prolifera, with a commonly used approach being to calculate the area by multiplying the ground area corresponding to each pixel (spatial resolution) by the number of detected green tide pixels [42]. However, when estimating the distribution area of U. prolifera using optical remote sensing satellites, various factors such as cloud cover and spatial resolution can significantly impact accuracy. In June, during the cloudy and rainy season in the Yellow Sea, obtaining cloud-free images is challenging. To ensure the precise estimation of monitoring data areas, a multi-source remote sensing data approach was adopted to analyze U. prolifera distribution areas. The backscattering coefficient method was applied, using Sentinel-1 SAR for extracting U. prolifera while Sentinel-3 OLCI and NPP VIIRS were utilized with the normalized vegetation index method for extraction purposes. The sentinel-3 and NPP satellites encountered significant cloud coverage on 12 June, 18 June, and 30 June. The extracted distribution range of U. prolifera from the remote sensing image depicted in Figure 3 is illustrated in Figure 6.
Overall, over the course of four days, the distribution range of U. prolifera shifted northward as a whole. The dense center of U. prolifera moved toward the northeast, and the overall distribution shape gradually expanded in an east–west trend. Table 4 illustrates the distribution range of U. prolifera over the span of four days, with the most extensive coverage (21,466.30 km2) observed on 18 June. U. prolifera spread along the northern coastline and invaded the offshore waters near Jiaozhou Bay by contacting the coastline of Qingdao in a square shape. Based on the three remote sensing images of the distribution of U. prolifera on 6 June, it can be observed that U. prolifera was divided into two regions with an average distribution area of 13,659.38 km2. During the day, U. prolifera mostly floats in a dense distribution, while it sinks in a strip distribution during the evening; however, its overall distribution remains relatively stable and tends to invade offshore waters. In June, the green tide enters its peak growth cycle and exerts a wide-ranging influence on the marine environment of the Yellow Sea. Upon reaching the coastal area of Shandong, it grows in the direction of the coastline. Without strong external driving factors, U. prolifera will shrink to the Qingdao maritime region during its peak period and eventually perish [43].
The specific distribution information of U. prolifera was obtained by selecting appropriate thresholds of NDVI remote sensing images from the Sentinel-3 and NPP satellites. Additionally, 20 samples were selected based on the shape and distribution state of U. prolifera patches to test the consistency of monitoring data from the Sentinel-3, NPP, and Sentinel-1 satellites. As depicted in Figure 7, the determination coefficient (R2) for consistency ranges between 0 and 1, with a higher R2 indicating greater consistency in extracting corresponding U. prolifera areas. The R2 value for Sentinel-3 and Sentinel-1 is larger than that of NPP and Sentinel-1 due to the lower spatial resolution of the NPP satellite compared to that of Sentinel-3, resulting in greater area coverage for U. prolifera identification. In general, the monitoring conducted by these three satellites exhibits high consistency in identifying areas with high concentrations of U. prolifera while being less influenced by satellite spatial resolution, thus demonstrating its feasibility.

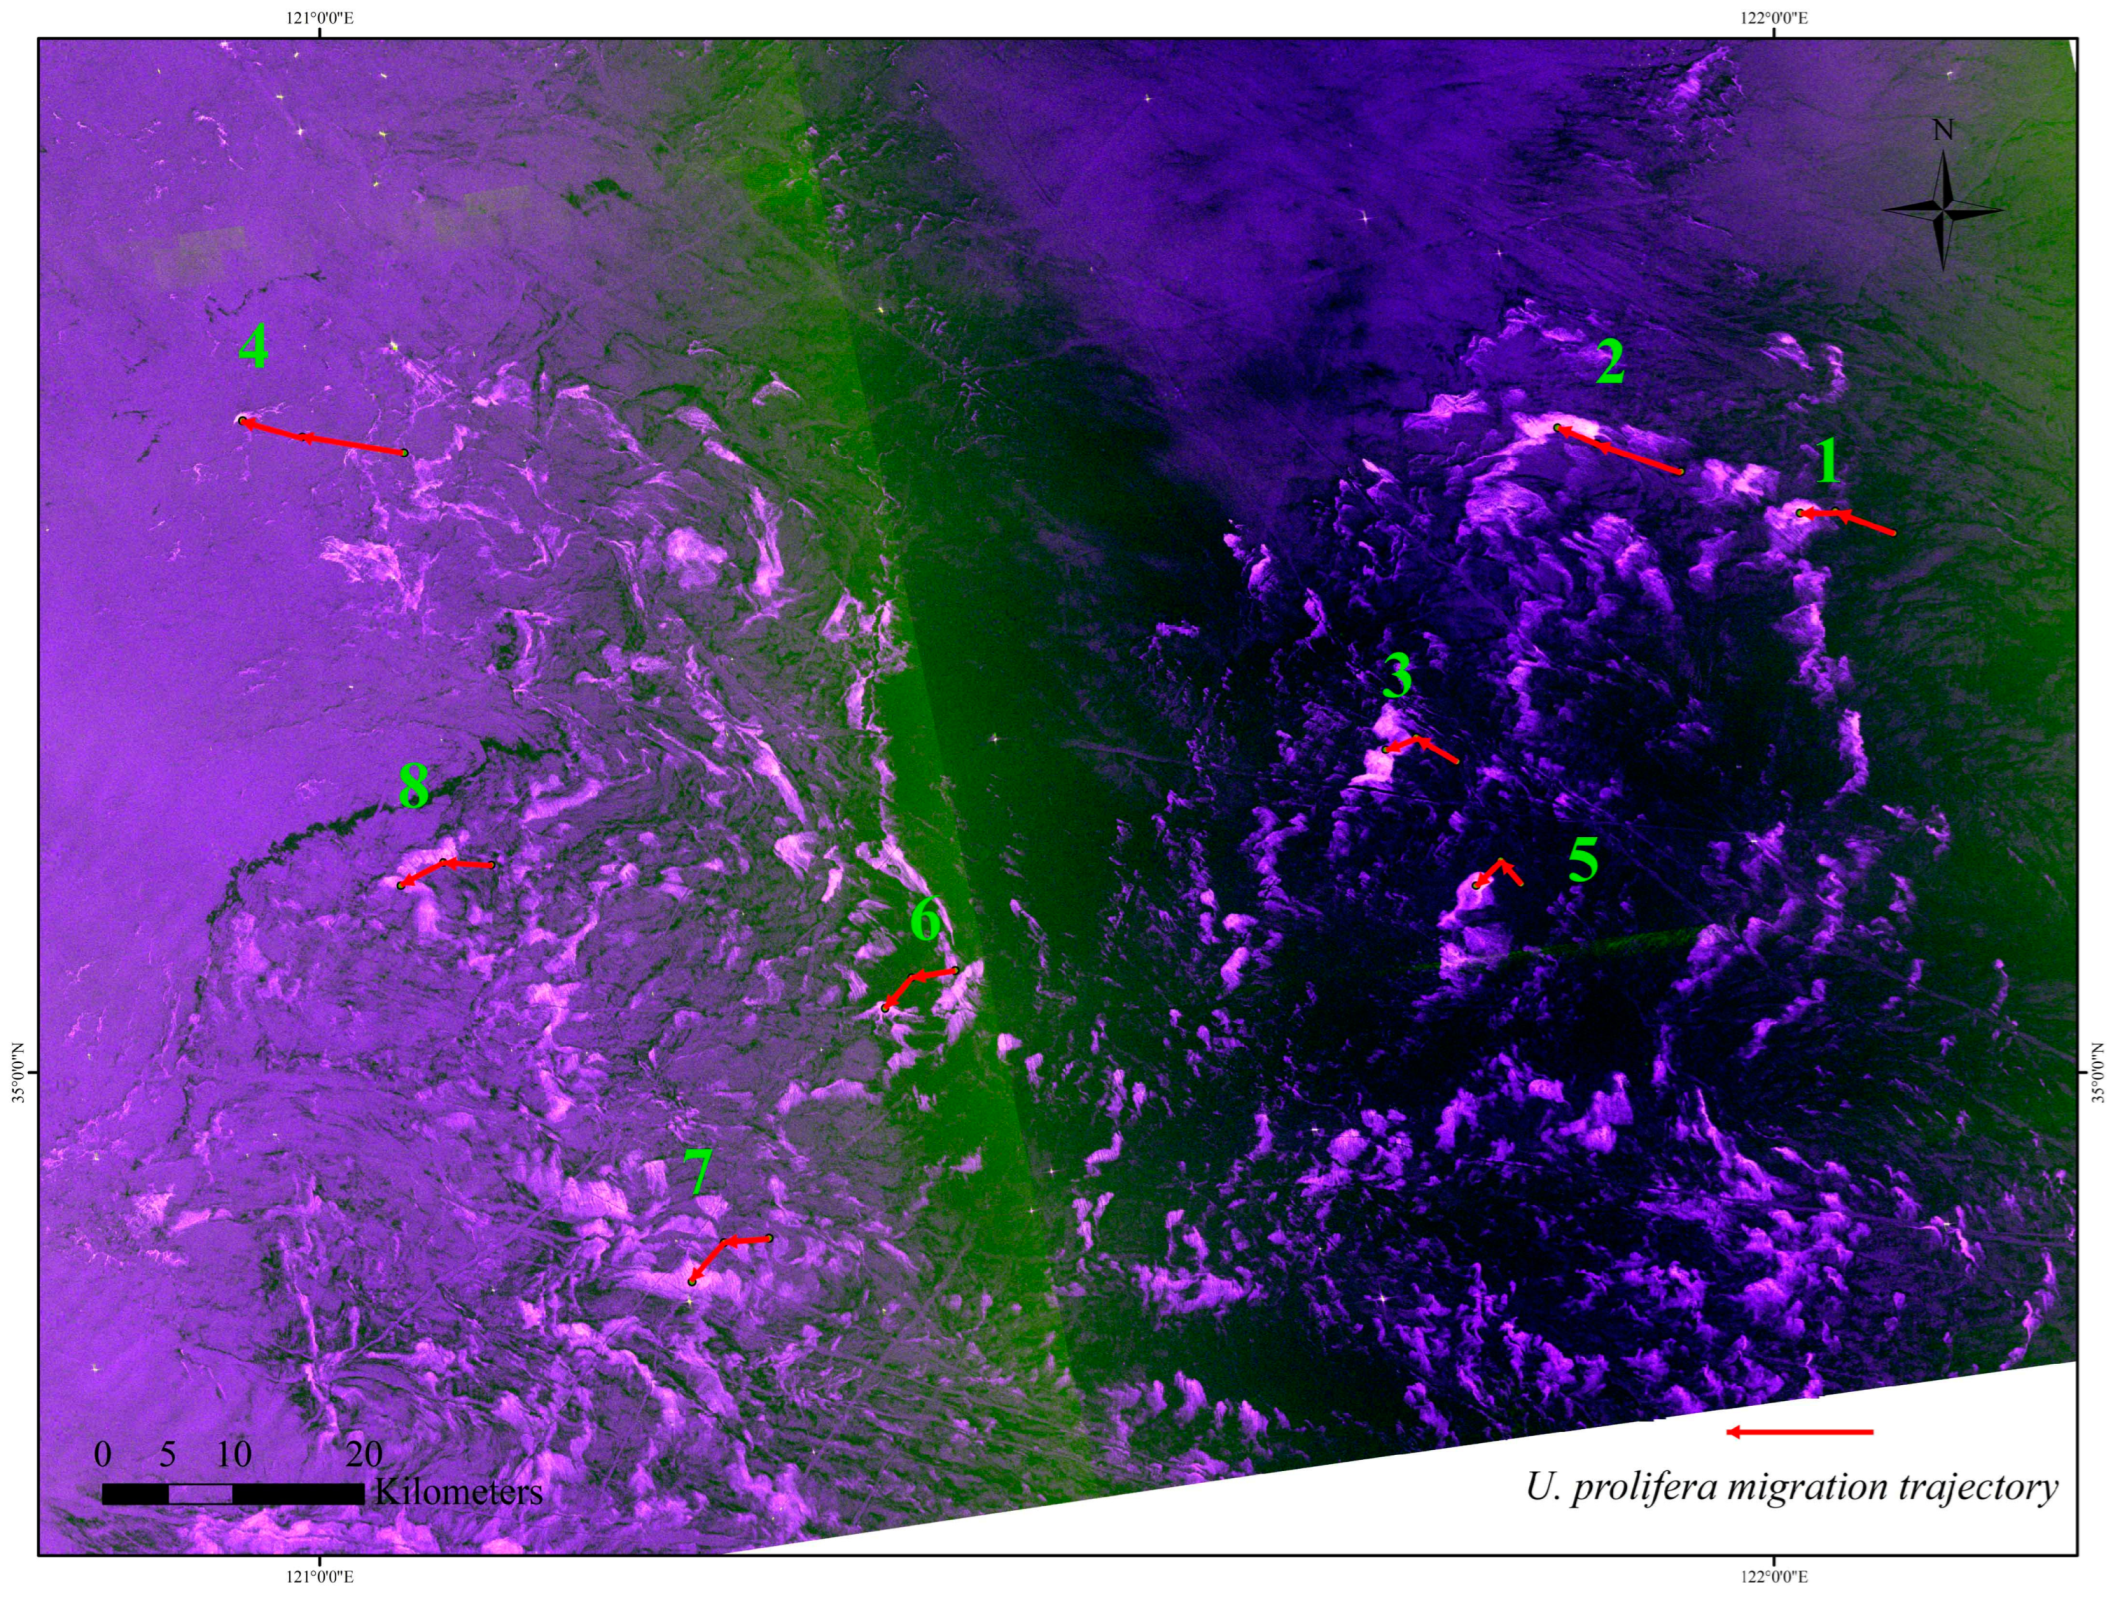
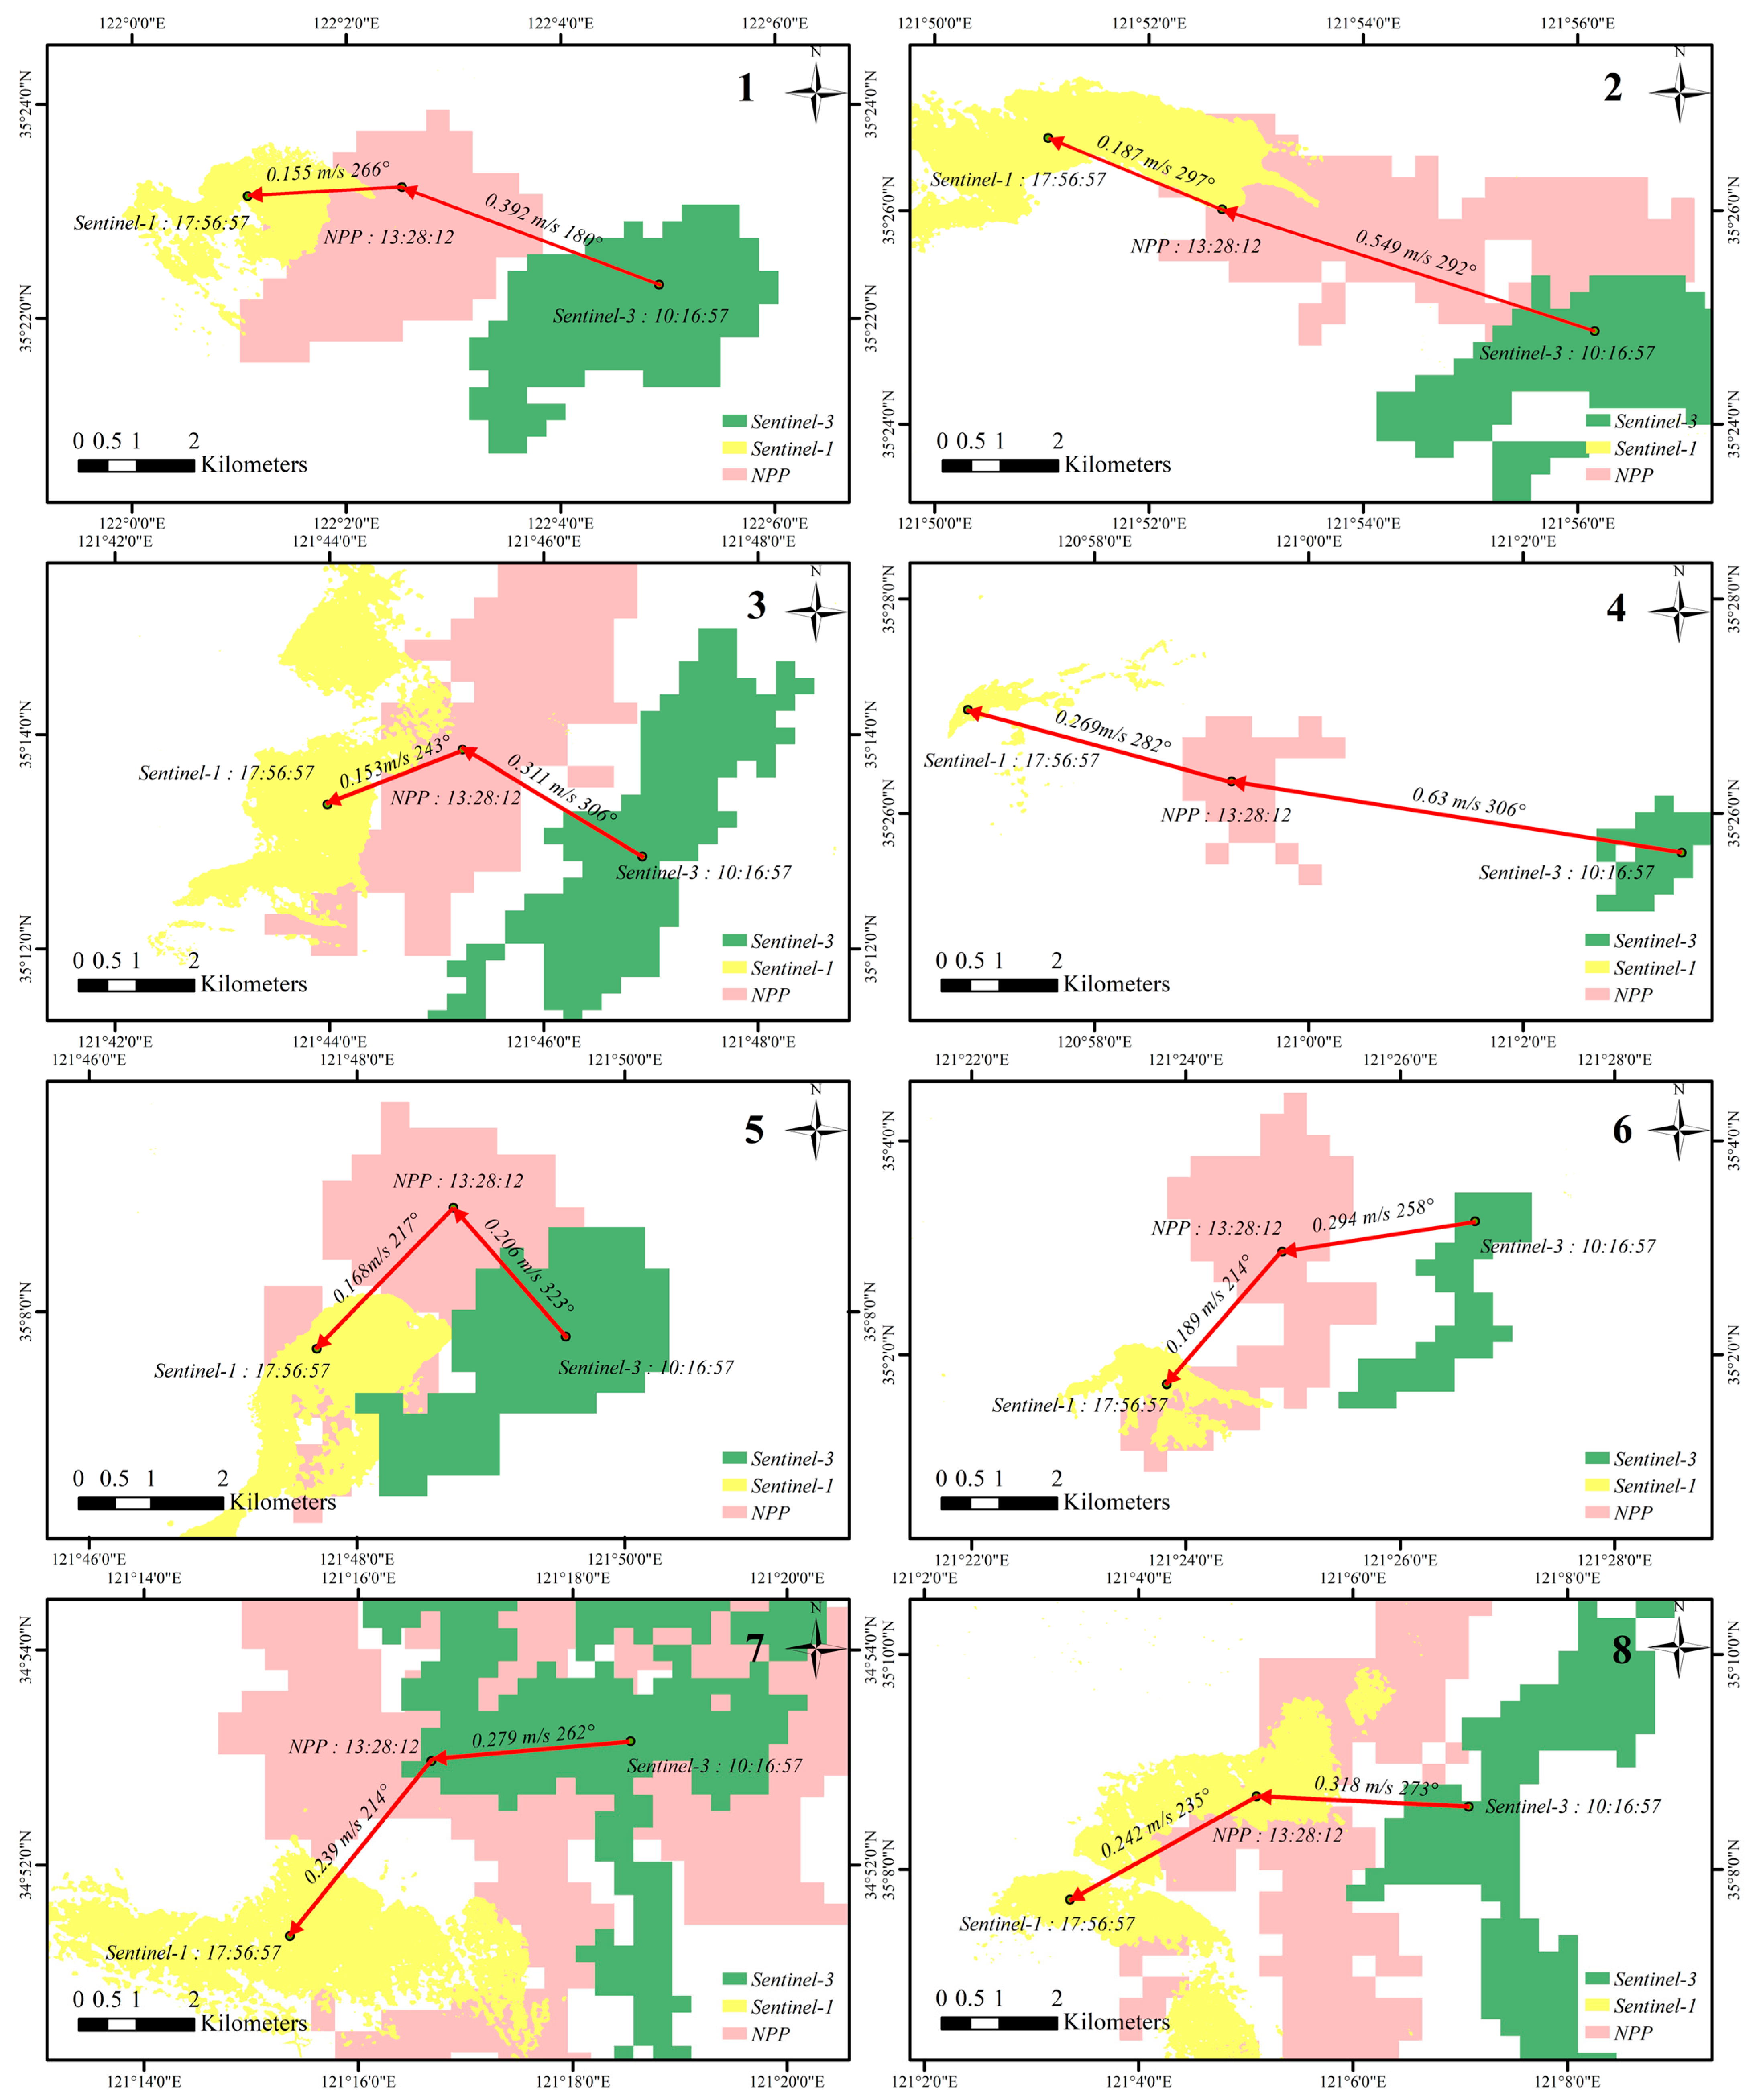
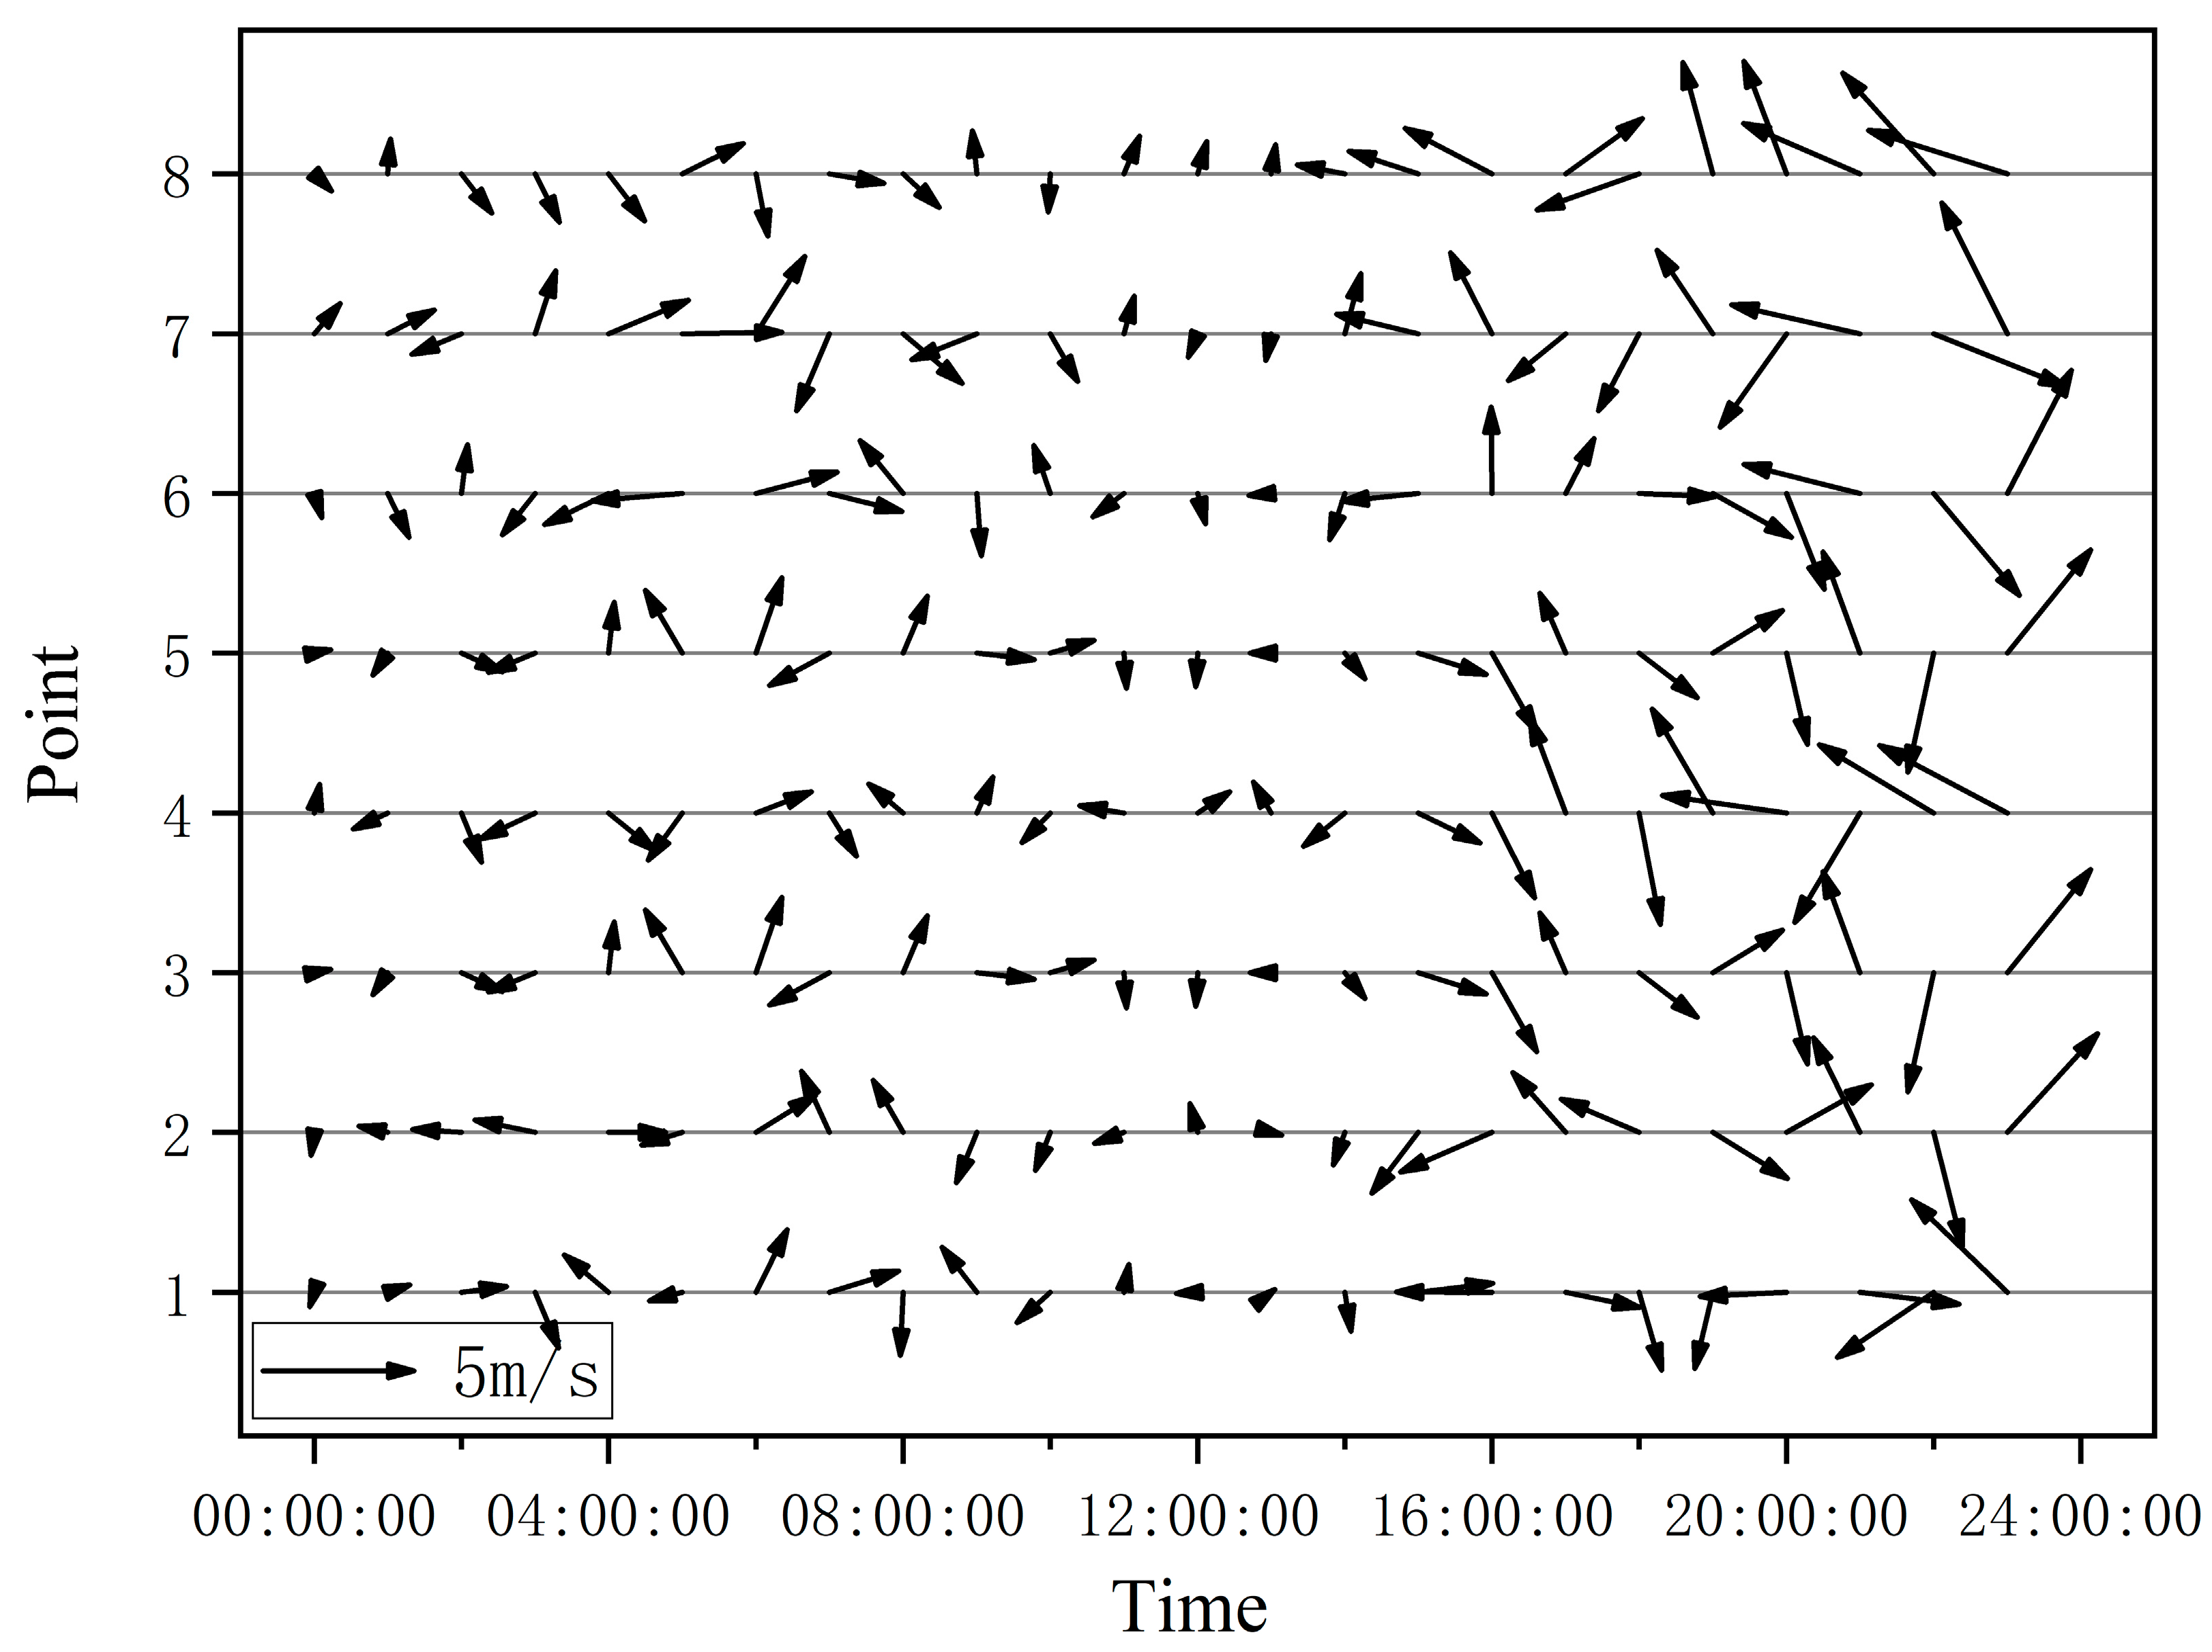
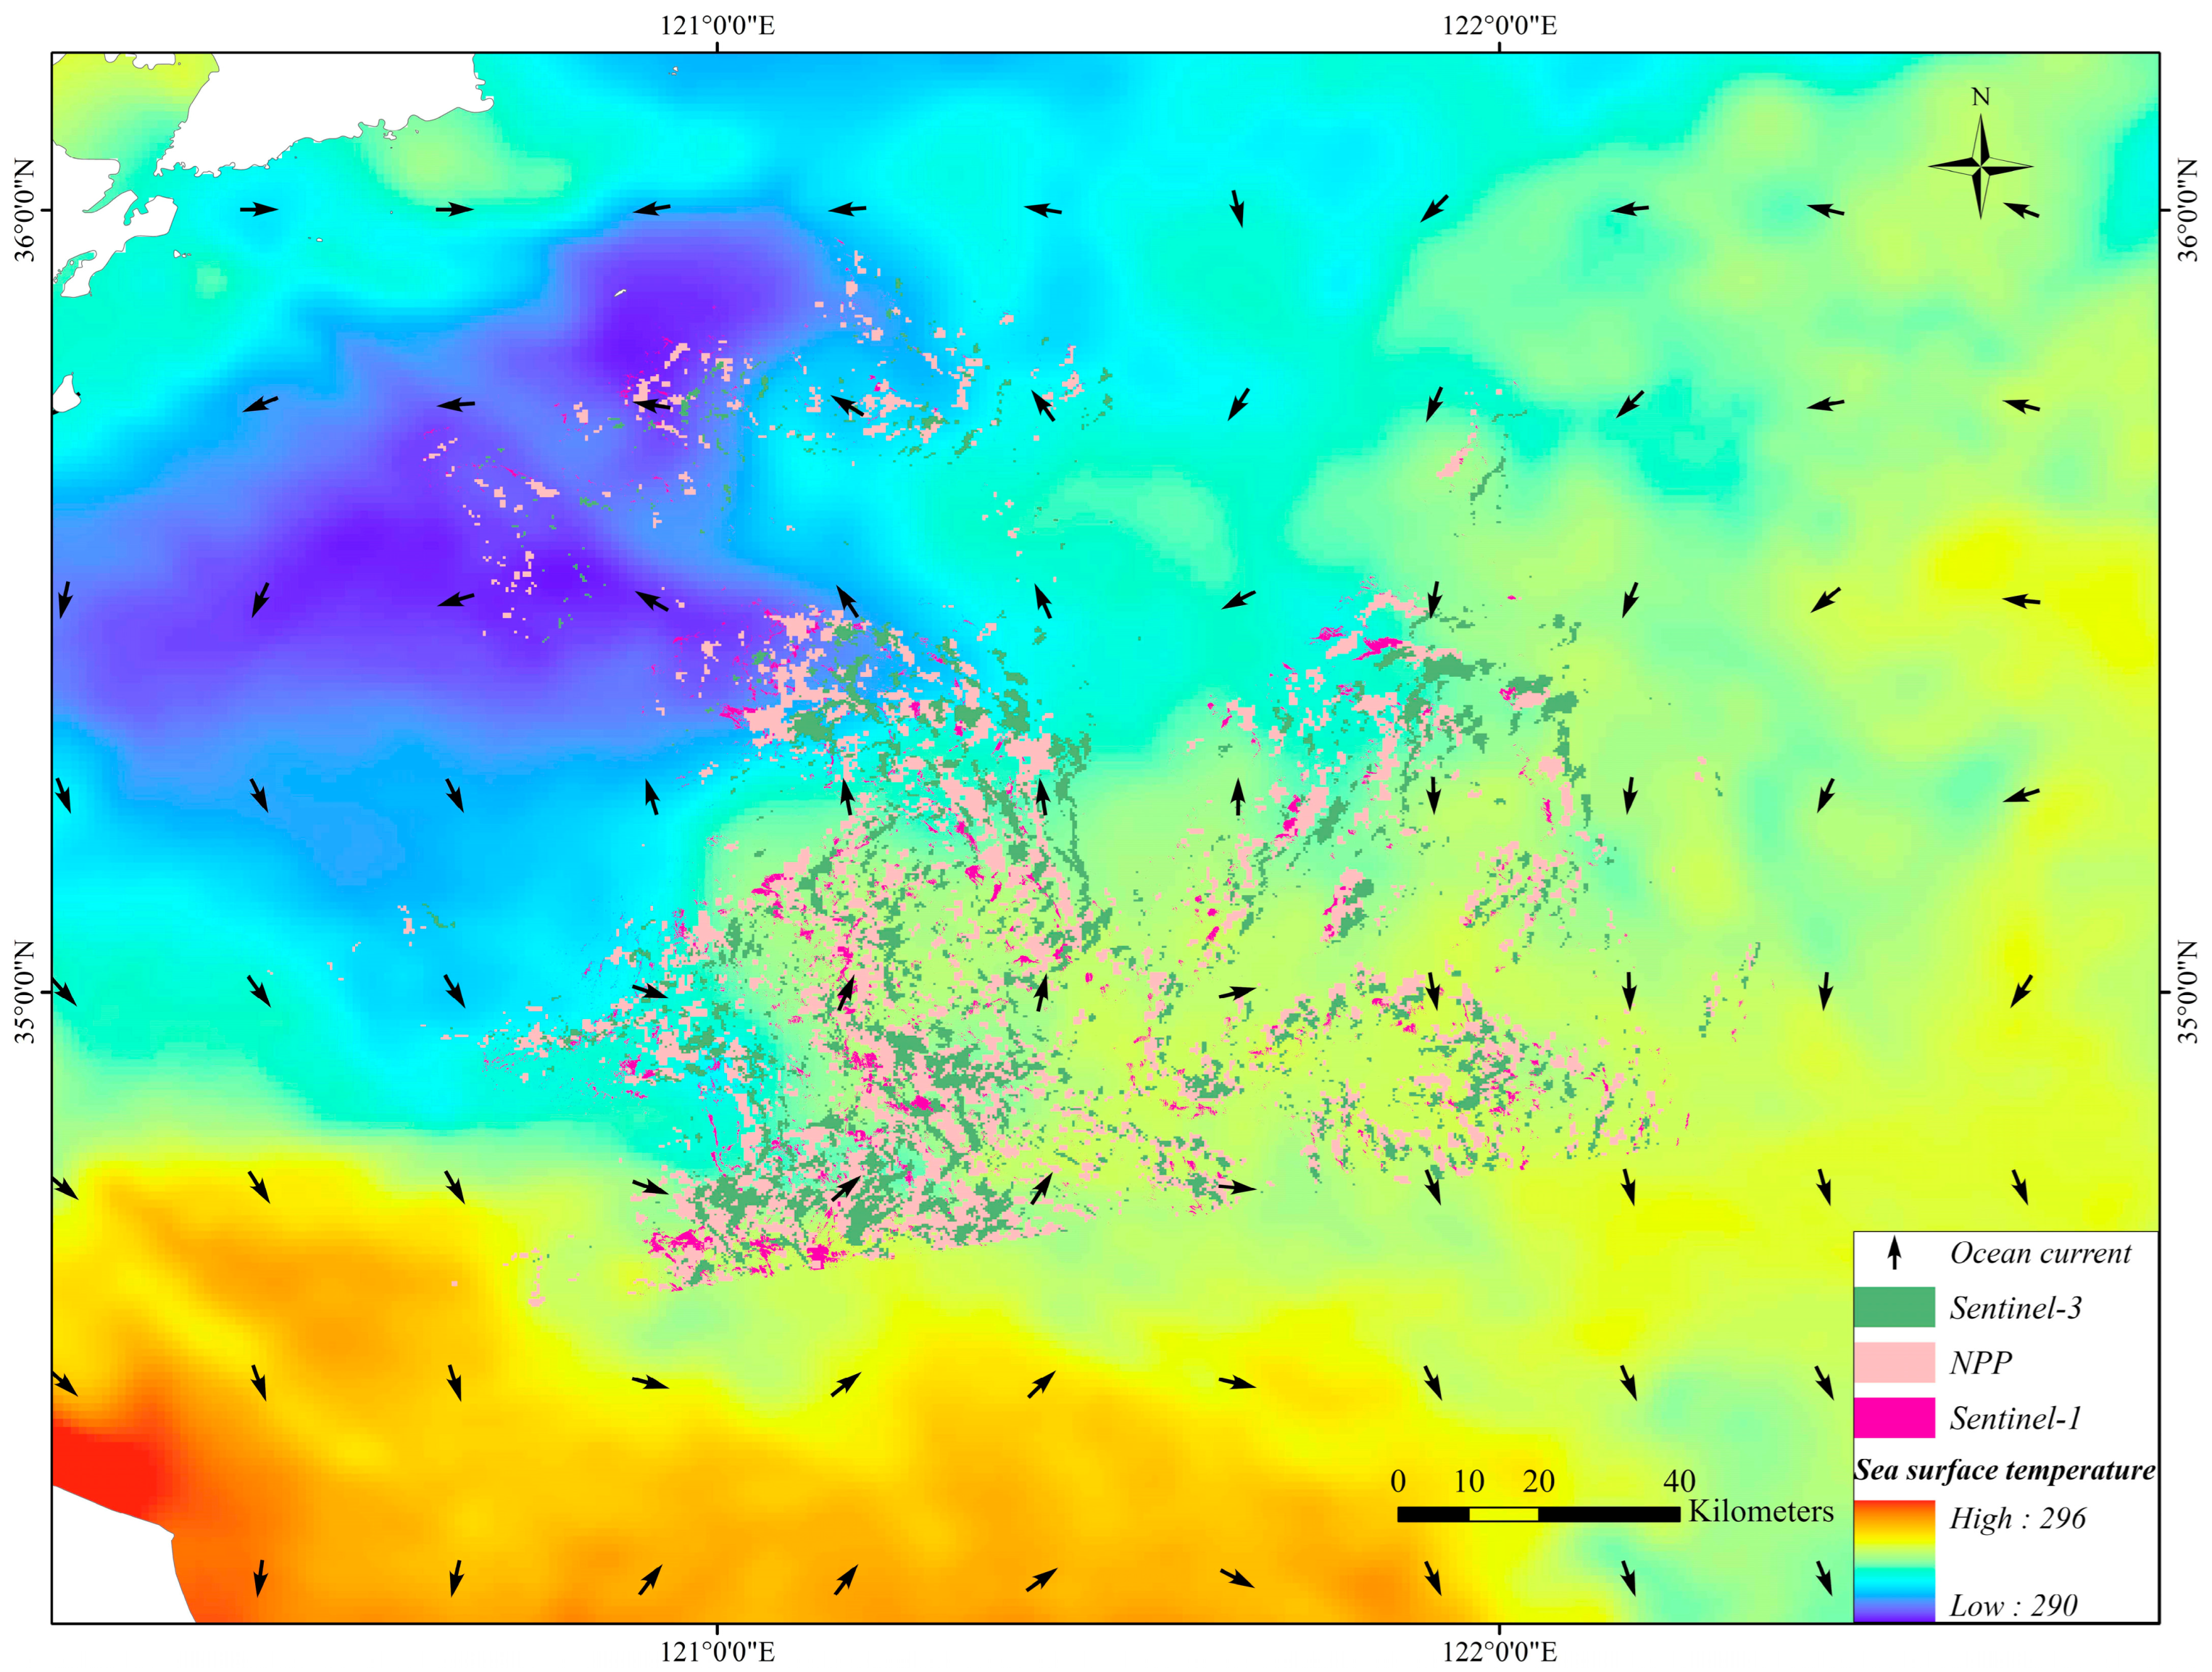
3.3. Remote Sensing Analysis of Migration Path of U. prolifera

The Sentinel-3, NPP, and Sentinel-1 remote sensing satellites traverse the Yellow Sea monitoring area in the morning, afternoon, and evening of the same day, respectively. By analyzing the migration trend of U. prolifera, researchers can provide short-term warnings for green tide development trends and effective information support for prevention and control efforts. In light of the driving force behind U. prolifera migration, this study utilized wind assimilation data from the European Centre for Medium-Range Weather Forecasts (ECMWF) and sea surface ocean current data with three-level resolution from NASA’s OSCAR to facilitate an analysis of the impact of external driving forces on U. prolifera migration. The detection of U. prolifera drift from a remote sensing image is based on the detection of the displacement of its patch characteristic points and the calculation of the drift speed combined with the time difference. The weather in the sea area of the study area on 6 June 2021 was clear and cloudless, and the distribution of U. prolifera corresponding to the imaging time is shown clearly in Figure 3. In order to analyze the migration path of the same high-aggregation area, spots representing the same high-aggregation area were delimited. Combined with the enhanced color composite image, the corresponding image point was determined by comparing the three images, and the output coordinate information was recorded to obtain the geographic latitude and longitude of the approximate center point of the high-aggregation block on the three satellite images on 6 June, totaling eight points of typical spot data (as depicted in Figure 8). The migration velocity of each point was then further analyzed and calculated.
According to Figure 8, it can be observed that in the morning of 6 June 2021, the outer edge of the area of high U. prolifera aggregation was approximately 110 km from the Qingdao coastline. Subsequently, the U. prolifera groups drifted northwestward by about 10 km, impacting coastal waters near Qingdao, China. The time interval between remote sensing imagery acquisition from the morning Sentinel-3 satellite pass to the afternoon NPP satellite pass was 3.183 h. The calculated movement speeds of the eight high-aggregation U. prolifera patches ranged from 0.21 to 0.63 m/s, with an average of 0.377 m/s (Figure 9). The general movement direction was roughly from east to west, with slight variations among the groups. Groups 1 to 4 exhibited a west–northwest direction, while groups 5 to 8 displayed a westward or west–southwest direction.
According to the ECMWF (Figure 10) and OSCAR (Figure 11) data, the average wind speed and maximum ocean current speed during the observation period were 3.23 m/s and 0.18 m/s, respectively. Additionally, the wave direction indicated by the flare was found to be in substantial agreement with the ECMWF wind direction. The sea surface current and sea surface wind direction in groups 3, 5, 7, and 8 within the remote sensing observation range exerted a reactive force, while in groups 1, 2, 4, 6, they resulted in a combined force. The entire mass of U. prolifera is situated between two ocean currents, with the U. prolifera at 4 positioned on the periphery of the U. prolifera cluster, resulting in its highest migration speed due to the combined forces. The movement speeds of U. prolifera patches at different locations did not show a significant correlation with their own aggregation areas. The patches near the right edge of the image exhibited slower movement speeds with an average of 0.273 m/s, which was only about half of the average speed in the left area. This result indicates the possible existence of local water mass fronts driven by the terrain near the right area, leading to significant differences in water flow speed on either side.
The angle between the central migration direction and the wind direction of the eight high-aggregation patches of U. prolifera was between 0° and 110°. The results show that in this sample observation, the movement direction of U. prolifera was mainly controlled by the site of the sea surface current when the wind speed was low and the wind stress was weak, and there was no obvious consistency with the wind direction. The locations 1, 2, 5, and 8 of U. prolifera were distributed in a chain pattern along the wind direction. The angle between the migration direction of U. prolifera and the wind direction at points 1, 7, and 8 was less than 10°, indicating that the distribution and migration of floating U. prolifera are or were affected by wind [6,25].

4. Discussion

Comparing the backscattering coefficient characteristics of U. prolifera under different polarization modes of Sentinel-1, it is evident that the identification of high-aggregation areas of U. prolifera is remarkable in both VV and VH polarization modes, while low-aggregation areas tend to be misjudged as seawater. This discrepancy can be attributed to the distinct features of reciprocating flow in the Yellow Sea. When the sea surface wind speed exceeds a certain threshold, abundant bubbles and foam often emerge on the water surface. Additionally, U. prolifera in low-aggregation areas tends to sink approximately 1~2 cm below the water surface due to insufficient buoyancy, resulting in less than 2% of reflected radar being received by the sensor receiver. These factors collectively pose challenges for solely relying on SAR remote sensing for U. prolifera, despite its ability to overcome occlusion caused by sea fog and clouds.
The remote sensing images of these four days show the outbreak stage of U. prolifera. Comparing the extraction areas of U. prolifera from the Sentinel-1 SAR satellite with the Sentinel-3 OLCI and NPP VIIRS satellites, it was found that Sentinel-1 SAR, as a high-resolution satellite, provides fewer conclusions on the distribution range of U. prolifera in the Yellow Sea than the Sentinel-3 OLCI and NPP VIIRS satellites. The attenuation of SAR signals by various factors, such as the sea surface wind field, surface roughness, and the dielectric constant of U. prolifera, cannot be ruled out [44]. It is crucial to address these attenuation effects and ensure the accurate calibration of SAR data for the precise quantification of U. prolifera distribution. At the same time, the existence of U. prolifera in the ocean itself is a dynamic process, and the floating and sinking of algae will interfere with the quantification of U. prolifera.
Compared to the method proposed by Ma et al. [45] for combining MODIS and investigating the temporal and spatial distribution of U. prolifera in the Yellow Sea, this study utilizes remote sensing satellites from different time periods on the same day to achieve a higher daily time resolution, and uses remote sensing data of U. prolifera migration on 6 June to predict the development direction of U. prolifera migration. The Sentinel-3 satellite entered the target area at 10:16 a.m. on 6 June 2021, followed by the arrival of Sentinel-1 at 17:56 p.m., resulting in a time gap of precisely 7 h and 46 min. On 6 June, the U. prolifera patches on the sea surface exhibited an overall west-to-north and west-to-south migration trend which was consistent with the observed migration pattern in the images from the four days. By integrating multi-source image data from a single day, it is possible to effectively predict the migration trend of U. prolifera patches. The integration of data from multiple SARs and diverse satellite platforms (e.g., hyperspectral, liDAR) enables a comprehensive understanding of the biological dynamics across the entire ocean. By incorporating information from different sensors, valuable insights for ecosystem modeling and impact assessment can be obtained.
Looking ahead, a wealth of satellite options is anticipated in the C, P, L, and S bands. Notably, new and multi-polarized SAR satellites like NISAR, BIOMASS, and TanDEM-L are on the horizon. Additionally, the growing availability of civil and commercial small satellite SAR data, exemplified by satellites like “Gaofen-3”, “Haisi-1”, and “Chaohu-1”, holds promise for significantly elevating the effectiveness of U. prolifera ecological disaster prevention and control measures.

5. Conclusions

In this paper, based on data from the Sentinel-1 SAR satellite, Sentinel-3 OLCI satellite, and NPP VIIRS satellite, the threshold of the backscattering coefficient of a radar remote sensing satellite was used in combination with two groups of optical remote sensing satellites, which improved the time resolution of the satellite remote sensing monitoring of U. prolifera. The research findings are outlined as follows:
  • By combining different entry times and different types of remote sensing satellites, the time resolution of a U. prolifera remote sensing monitoring system can be expanded, and more abundant monitoring information about U. prolifera can be obtained;
  • The accuracy of dividing the distribution of U. prolifera according to the backscattering coefficient threshold is ideal. Combined with the ocean current, sea surface wind, and other ocean parameters, the future development direction of U. prolifera can be predicted using the single-day migration trajectory of U. prolifera.

Author Contributions

Conceptualization, C.L., X.Z. and X.L.; methodology, C.L., X.Z. and X.L.; software, X.Z., X.L. and Y.Z.; validation, C.L., X.Z. and X.L.; formal analysis, C.L., S.J. and H.S.; data curation, X.L., Y.Z. and B.C.; writing—original draft preparation, C.L., X.Z. and B.C.; writing—review and editing, C.L., X.Z. and X.L.; supervision, X.L. and L.M.; project administration, C.L., X.Z. and X.L.; funding acquisition, Z.G., X.L. and L.M. All authors have read and agreed to the published version of the manuscript.

Funding

This research was funded by the Jiangsu Forestry Science & Technology Innovation and Extension Project (project no. LYKJ [2022]02); the Jiangsu Environmental Monitoring Scientific Research Fund (2207, 2216); a Scientific Research Project of Jiangsu Environmental Protection Group (JSEP-JC-2022-0166-S-RD); and a Jiangsu Social Development Project (project no. BE2022792).

Data Availability Statement

The data employed in this study can be made available in accordance with the precise requirements of the correspondent.

Acknowledgments

We would like to express our gratitude to the Biodiversity and Ecological Conservation Research group of Nanjing Forestry University for their invaluable guidance, as well as to the Environmental Monitoring Center of Jiangsu Province for their valuable assistance in data processing. Furthermore, we acknowledge the National Aeronautics and Space Administration (NASA) and the European Space Agency (ESA) for generously providing the Sentinel-1, Sentinel-3, and NPP data that contributed significantly to this study.

Conflicts of Interest

The authors declare no conflict of interest.

References

  1. Liu, D.Y.; Keesing, J.K.; He, P.M.; Wang, Z.L.; Shi, Y.J.; Wang, Y.J. The world’s largest macroalgal bloom in the Yellow Sea, China: Formation and implications. Estuar. Coast. Shelf Sci. 2013, 129, 2–10. [Google Scholar] [CrossRef]
  2. Han, W.; Chen, L.P.; Zhang, J.H.; Tian, X.L.; Hua, L.; He, Q.; Huo, Y.Z.; Yu, K.F.; Shi, D.J.; Ma, J.H.; et al. Seasonal variation of dominant free-floating and attached Ulva species in Rudong coastal area, China. Harmful Algae 2013, 28, 46–54. [Google Scholar] [CrossRef]
  3. Liu, J.L.; Xia, J.; Zhuang, M.M.; Zhang, J.H.; Yu, K.F.; Zhao, S.; Sun, Y.Q.; Tong, Y.C.; Xia, L.H.; Qin, Y.T.; et al. Controlling the source of green tides in the Yellow Sea: NaClO treatment of Ulva attached on Pyropia aquaculture rafts. Aquaculture 2021, 535, 8. [Google Scholar] [CrossRef]
  4. Cui, J.J.; Shi, J.T.; Zhang, J.H.; Wang, L.T.; Fan, S.Y.; Xu, Z.Y.; Huo, Y.Z.; Zhou, Q.Y.; Lu, Y.W.; He, P.M. Rapid expansion of Ulva blooms in the Yellow Sea, China through sexual reproduction and vegetative growth. Mar. Pollut. Bull. 2018, 130, 223–228. [Google Scholar] [CrossRef]
  5. Liu, X.Q.; Li, Y.; Wang, Z.L.; Zhang, Q.C.; Cai, X.Q. Cruise observation of Ulva prolifera bloom in the southern Yellow Sea, China. Estuar. Coast. Shelf Sci. 2015, 163, 17–22. [Google Scholar] [CrossRef]
  6. Bao, M.; Guan, W.B.; Yang, Y.; Cao, Z.Y.; Chen, Q. Drifting trajectories of green algae in the western Yellow Sea during the spring and summer of 2012. Estuar. Coast. Shelf Sci. 2015, 163, 9–16. [Google Scholar] [CrossRef]
  7. Huang, J.; Wang, B.; Wang, X.; Huang, F.; Lu, W.; Jing, T. The spring Yellow Sea fog: Synoptic and air-sea characteristics associated with different airflow paths. Acta Oceanol. Sin. 2018, 37, 20–29. [Google Scholar] [CrossRef]
  8. Wu, X.; Li, S. Automatic sea fog detection over Chinese adjacent oceans using Terra/MODIS data. Int. J. Remote Sens. 2014, 35, 7430–7457. [Google Scholar] [CrossRef]
  9. Zhao, S.; Wang, Q.; Li, Y.; Liu, S.; Wang, Z.; Zhu, L.; Wang, Z. An overview of satellite remote sensing technology used in China’s environmental protection. Earth Sci. Inform. 2017, 10, 137–148. [Google Scholar] [CrossRef]
  10. Wang, Z.; Fan, B.; Yu, D.; Fan, Y.; An, D.; Pan, S. Monitoring the Spatio-Temporal Distribution of Ulva prolifera in the Yellow Sea (2020–2022) Based on Satellite Remote Sensing. Remote Sens. 2023, 15, 157. [Google Scholar] [CrossRef]
  11. Liu, H.; Fan, W.; Xu, Y.; Lin, W. Research Progress in Forest Information Extraction Based on Multi—Source Data Collaboration Operation. World For. Res. 2020, 33, 33–37. [Google Scholar]
  12. Gao, W.D.; Zheng, C.; Liu, X.H.; Lu, Y.D.; Chen, Y.F.; Wei, Y.; Ma, Y.D. NDVI-based vegetation dynamics and their responses to climate change and human activities from 1982 to 2020: A case study in the Mu Us Sandy Land, China. Ecol. Indic. 2022, 137, 14. [Google Scholar] [CrossRef]
  13. Kong, R.; Zhang, Z.; Yu, Z.; Huang, R.; Zhang, Y.; Chen, X.; Xu, C.-Y. Increasing sensitivity of dryland water use efficiency to soil water content due to rising atmospheric CO2. Sci. Total Environ. 2023, 905, 167087. [Google Scholar] [CrossRef] [PubMed]
  14. Kong, R.; Zhang, Z.; Zhang, Y.; Wang, Y.; Peng, Z.; Chen, X.; Xu, C.-Y. Detection and Attribution of Changes in Terrestrial Water Storage across China: Climate Change versus Vegetation Greening. Remote Sens. 2023, 15, 3104. [Google Scholar] [CrossRef]
  15. Tian, J.; Wang, H.; Zhang, Z.; Fu, Y.; Zhao, T.; Tao, H. Unraveling the Connection between Vegetation Greening and Ter-restrial Water Storage Decline in the Arid and Semi-Arid Regions of Northwest China. J. Hydrol. Reg. Stud. 2023, 49, 101509. [Google Scholar] [CrossRef]
  16. Qiu, R.A.; Li, X.; Han, G.; Xiao, J.F.; Ma, X.; Gong, W. Monitoring drought impacts on crop productivity of the US Midwest with solar-induced fluorescence: GOSIF outperforms GOME-2 SIF and MODIS NDVI, EVI, and NIRv. Agric. For. Meteorol. 2022, 323, 13. [Google Scholar] [CrossRef]
  17. Cui, Z.Y.; Li, Q.; Cao, Z.J.; Liu, N.Y. Dense Attention Pyramid Networks for Multi-Scale Ship Detection in SAR Images. IEEE Trans. Geosci. Remote Sens. 2019, 57, 8983–8997. [Google Scholar] [CrossRef]
  18. Liang, J.Y.; Liu, D.S. A local thresholding approach to flood water delineation using Sentinel-1 SAR imagery. ISPRS-J. Photogramm. Remote Sens. 2020, 159, 53–62. [Google Scholar] [CrossRef]
  19. Jiang, L.L.; Zhao, D.Z.; Wang, L. Backscattering properties of marine phytoplankton Prorocentrum micans. Int. J. Remote Sens. 2014, 35, 4275–4286. [Google Scholar] [CrossRef]
  20. Hu, L.B.; Zeng, K.; Hu, C.M.; He, M.X. On the remote estimation of Ulva prolifera areal coverage and biomass. Remote Sens. Environ. 2019, 223, 194–207. [Google Scholar] [CrossRef]
  21. Qi, L.; Hu, C.A.M. To what extent can Ulva and Sargassum be detected and separated in satellite imagery? Harmful Algae 2021, 103, 11. [Google Scholar] [CrossRef] [PubMed]
  22. Qi, L.; Wang, M.H.; Hu, C.M. Uncertainties in MODIS-Derived Ulva Prolifera Amounts in the Yellow Sea: A Systematic Evaluation Using Sentinel-2/MSI Observations. IEEE Geosci. Remote Sens. Lett. 2023, 20, 5. [Google Scholar] [CrossRef]
  23. Wang, M.Q.; Hu, C.M. On the continuity of quantifying floating algae of the Central West Atlantic between MODIS and VIIRS. Int. J. Remote Sens. 2018, 39, 3852–3869. [Google Scholar] [CrossRef]
  24. Wang, Z.Y.; Fang, Z.X.; Wu, Y.C.; Liang, J.F.; Song, X. Multi-Source Evidence Data Fusion Approach to Detect Daily Distribution and Coverage of Ulva Prolifera in the Yellow Sea, China. IEEE Access 2019, 7, 115214–115228. [Google Scholar] [CrossRef]
  25. Zhou, Y.; Zhou, B.; Gai, Y.Y. Ulva prolifera Monitoring study in the Yellow Sea from Multi-Temporal Remote Sensing Images. In Proceedings of the 2nd International Conference on Renewable Energy and Environmental Technology (REET), Dalian, China, 19–20 August 2014; pp. 1201–1206. [Google Scholar]
  26. Hu, C.M.; Li, D.Q.; Chen, C.S.; Ge, J.Z.; Muller-Karger, F.E.; Liu, J.P.; Yu, F.; He, M.X. On the recurrent Ulva prolifera blooms in the Yellow Sea and East China Sea. J. Geophys. Res.-Oceans 2010, 115, 8. [Google Scholar] [CrossRef]
  27. Le, C.F.; Hu, C.M.; English, D.; Cannizzaro, J.; Chen, Z.G.; Feng, L.; Boler, R.; Kovach, C. Towards a long-term chlorophyll-a data record in a turbid estuary using MODIS observations. Prog. Oceanogr. 2013, 109, 90–103. [Google Scholar] [CrossRef]
  28. Qi, L.; Wang, M.H.; Hu, C.M.; Holt, B. On the capacity of Sentinel-1 synthetic aperture radar in detecting floating macroalgae and other floating matters. Remote Sens. Environ. 2022, 280, 16. [Google Scholar] [CrossRef]
  29. Guo, Y.; Gao, L.; Li, X.F. A Deep Learning Model for Green Algae Detection on SAR Images. IEEE Trans. Geosci. Remote Sens. 2022, 60, 14. [Google Scholar] [CrossRef]
  30. Wang, S.A.; Zhang, F.L.; Shao, Y.; Tian, W.; Gong, H.Z. Microwave Remote Sensing for Marine Monitoring: An Example of Enteromorpha Prolifera Bloom Monitoring. In Proceedings of the IEEE International Geoscience and Remote Sensing Symposium, Honolulu, HI, USA, 25–30 June 2010; pp. 4530–4533. [Google Scholar]
  31. Liu, X.Q.; Wang, Z.L.; Zhang, X.L. A review of the green tides in the Yellow Sea, China. Mar. Environ. Res. 2016, 119, 189–196. [Google Scholar] [CrossRef]
  32. Zhang, S.P.; Xie, S.P.; Liu, Q.Y.; Yang, Y.Q.; Wang, X.G.; Ren, Z.P. Seasonal Variations of Yellow Sea Fog: Observations and Mechanisms. J. Clim. 2009, 22, 6758–6772. [Google Scholar] [CrossRef]
  33. Mullissa, A.; Vollrath, A.; Odongo-Braun, C.; Slagter, B.; Balling, J.; Gou, Y.Q.; Gorelick, N.; Reiche, J. Sentinel-1 SAR Backscatter Analysis Ready Data Preparation in Google Earth Engine. Remote Sens. 2021, 13, 1954. [Google Scholar] [CrossRef]
  34. Adamo, M.; Matta, E.; Bresciani, M.; De Carolis, G.; Vaiciute, D.; Giardino, C.; Pasquariello, G. On the synergistic use of SAR and optical imagery to monitor cyanobacteria blooms: The Curonian Lagoon case study. Eur. J. Remote Sens. 2013, 46, 789–805. [Google Scholar] [CrossRef]
  35. Mandal, D.; Kumar, V.; Ratha, D.; Dey, S.; Bhattacharya, A.; Lopez-Sanchez, J.M.; McNairn, H.; Rao, Y.S. Dual polarimetric radar vegetation index for crop growth monitoring using sentinel-1 SAR data. Remote Sens. Environ. 2020, 247, 17. [Google Scholar] [CrossRef]
  36. Syrris, V.; Corbane, C.; Pesaresi, M.; Soille, P. Mosaicking Copernicus Sentinel-1 Data at Global Scale. IEEE Trans. Big Data 2020, 6, 547–557. [Google Scholar] [CrossRef]
  37. Dabrowska-Zielinska, K.; Budzynska, M.; Gurdak, R.; Musial, J.; Malinska, A.; Gatkowska, M.; Bartold, M. Application of Sentinel-1 VH and VV and Sentinel-2 for soil moisture studies. In Proceedings of the Conference on Active and Passive Microwave Remote Sensing for Environmental Monitoring, Warsaw, Poland, 12–14 September 2017. [Google Scholar]
  38. Wakabayashi, H.; Tonooka, H. Monitoring Ice Covering Lake Saroma by Using Sentinel-1 C-Band Sar Data. In Proceedings of the IEEE International Geoscience and Remote Sensing Symposium (IGARSS), Electr Network, Waikoloa, HI, USA, 26 September–2 October 2020; pp. 3047–3050. [Google Scholar]
  39. Wu, H.L.; Liu, Y.M.; Beardall, J.; Zhong, Z.H.; Gao, G.; Xu, J.T. Physiological acclimation of Ulva prolifera to seasonal environmental factors drives green tides in the Yellow Sea. Mar. Environ. Res. 2022, 179, 7. [Google Scholar] [CrossRef] [PubMed]
  40. Zhang, W.; Zhang, Y.; Fan, W.; Wu, G. Comparison of Biomass Accuracy with Different Polarization Data with Interferometric Water Cloud Model. J. North-East For. Univ. 2020, 48, 27–32. [Google Scholar]
  41. An, D.; Xing, Q.; Yu, D.; Pan, S. A simple method for estimating macroalgae area under clouds on MODIS imagery. Front. Mar. Sci. 2022, 9, 995731. [Google Scholar] [CrossRef]
  42. Liu, X.Q.; Wang, Z.L.; Fan, S.L.; Zhang, X.L.; Li, R.X.; Li, Y. The distribution of green algal micro-propagules and macroalgae at the early stage of green tide in the coastal area of South Jiangsu Province in 2014. J. Ocean Univ. 2017, 16, 81–86. [Google Scholar] [CrossRef]
  43. Zheng, L.X.; Wu, M.Q.; Zhou, M.; Zhao, L.J. Spatiotemporal distribution and influencing factors of Ulva prolifera and Sargassum and their coexistence in the South Yellow Sea, China. J. Oceanol. Limnol. 2022, 40, 1070–1084. [Google Scholar] [CrossRef]
  44. Tsokas, A.; Rysz, M.; Pardalos, P.M.; Dipple, K. SAR data applications in earth observation: An overview. Expert Syst. Appl. 2022, 205, 12. [Google Scholar] [CrossRef]
  45. Ma, Y.; Wong, K.; Tsou, J.Y.; Zhang, Y. Investigating Spatial Distribution of Green-Tide in the Yellow Sea in 2021 Using Combined Optical and SAR Images. J. Mar. Sci. Eng. 2022, 10, 127. [Google Scholar] [CrossRef]
Figure 1. Location of study area (the background image is a Sentinel-3 OLCI true color synthesis image from 6 June 2021); the accumulation of U. prolifera was observed along the coastline.
Remotesensing 15 05772 g001
Figure 2. The technical process flow chart.
Remotesensing 15 05772 g002
Figure 3. Sentinel-3 OLCI, NPP VIIRS and Sentinel-1 SAR remote sensing images of the study sea area on 6 June, 12 June, 18 June, and 30 June 2021.
Remotesensing 15 05772 g003
Figure 4. The comparison of local U. prolifera images from 6 June 2021 was conducted among Sentinel-1 SAR (a), Sentinel-3 OLCI (b), and NPP VIIRS (c) remote sensing satellites.
Remotesensing 15 05772 g004
Figure 5. The backscattering coefficients of the C-band VV (a) and VH (b) polarization modes were analyzed using Sentinel-1 satellite GRD data for various ground objects.
Remotesensing 15 05772 g005
Figure 6. Spatiotemporal distribution of U. prolifera by Sentinel-1 SAR, Sentinel-3 OLCI, and NPP VIIRS remote sensing.
Remotesensing 15 05772 g006
Figure 7. Consistency verification: (a) verification of consistency between Sentinel-3 and Sentinel-1 images; (b) verification of consistency between NPP and Sentinel-1 images.
Remotesensing 15 05772 g007
Figure 8. The centers of eight high-aggregation areas of U. prolifera were located in the longitude and latitude position of the map.
Remotesensing 15 05772 g008
Figure 9. The migration trajectory of the center points of eight groups of U.prolifera.
Remotesensing 15 05772 g009
Figure 10. Time series of wind speed and direction at the center points of eight U. prolifera high-aggregation blocks on 6 June.
Remotesensing 15 05772 g010
Figure 11. The current flow direction and sea surface temperature of the Yellow Sea on 6 June.
Remotesensing 15 05772 g011
Table 1. Main data sources and products.
SatelliteSensorResolution/mBandPolarization ModeRevisit Cycle/d
Sentinel-3OLCI300oa8/oa6/oa4 3
NPPVIIRS375I3/I2/I1 0.5
Sentinel-1SAR10CVV/VH6
Table 2. Backscattering coefficients of GRD data from Sentinel-1 satellite of different ground objects.
DateC-Band Backscattering CoefficientTarget Type
SeaLow Agg.Med Agg.High Agg.
6 June σ V V 0 Avg. *0.003 7640.005 2700.026 737 0.181 294
SD. *0.001 6130.002 0070.013 2180.068 870
σ V H 0 Avg.0.002 415 0.001 0580.001 3840.009 074
SD.0.000 3570.000 2100.000 3530.003 933
12 June σ V V 0 Avg.0.003 8530.008 8740.044 3340.250 420
SD.0.001 7400.007 6350.028 0670.099 731
σ V H 0 Avg.0.001 1970.000 7720.001 6020.013 081
SD.0.000 2900.000 1280.000 7400.006 185
18 June σ V V 0 Avg.0.010 2600.015 0620.057 6180.161 771
SD.0.003 5140.003 7510.020 8960.095 951
σ V H 0 Avg.0.002 9310.001 8900.002 9140.006 927
SD.0.000 6140.000 5270.000 6710.003 824
30 June σ V V 0 Avg.0.005 2410.026 1980.067 9990.226 059
SD.0.000 9430.007 7960.031 6150.114 716
σ V H 0 Avg.0.001 1620.002 2980.003 0040.008 952
SD.0.000 1630.000 3360.000 7390.004 217
* “Avg.” is a shorthand representation for “average.” “SD.” is an abbreviation for “standard deviation”.
Table 3. The evaluation of the accuracy in dividing information from different areas of U. prolifera aggregation.
Classification Data\Validation DataSeaLow Agg.Med Agg.High Agg.
Sea201700
Low Agg.181980
Med Agg.08121
High Agg.00125
Overall accuracy = 85.38%; Kappa statistical index = 0.71.
Table 4. Distribution area of U. prolifera.
DateSatelliteDistribution Area (km2)
6 JuneSentinel-314,117.38
NPP13,876.64
Sentinel-112,984.12
12 JuneSentinel-3
NPP
Sentinel-115,792.33
18 JuneSentinel-3
NPP
Sentinel-121,466.30
30 JuneSentinel-3
NPP18,794.57
Sentinel-118,210.94
Disclaimer/Publisher’s Note: The statements, opinions and data contained in all publications are solely those of the individual author(s) and contributor(s) and not of MDPI and/or the editor(s). MDPI and/or the editor(s) disclaim responsibility for any injury to people or property resulting from any ideas, methods, instructions or products referred to in the content.

