


A 20-Year Analysis of the Dynamics and Driving Factors of Grassland Desertification in Xilingol, China
 ,
,
Abstract
:
1. Introduction
2. Materials and Methods
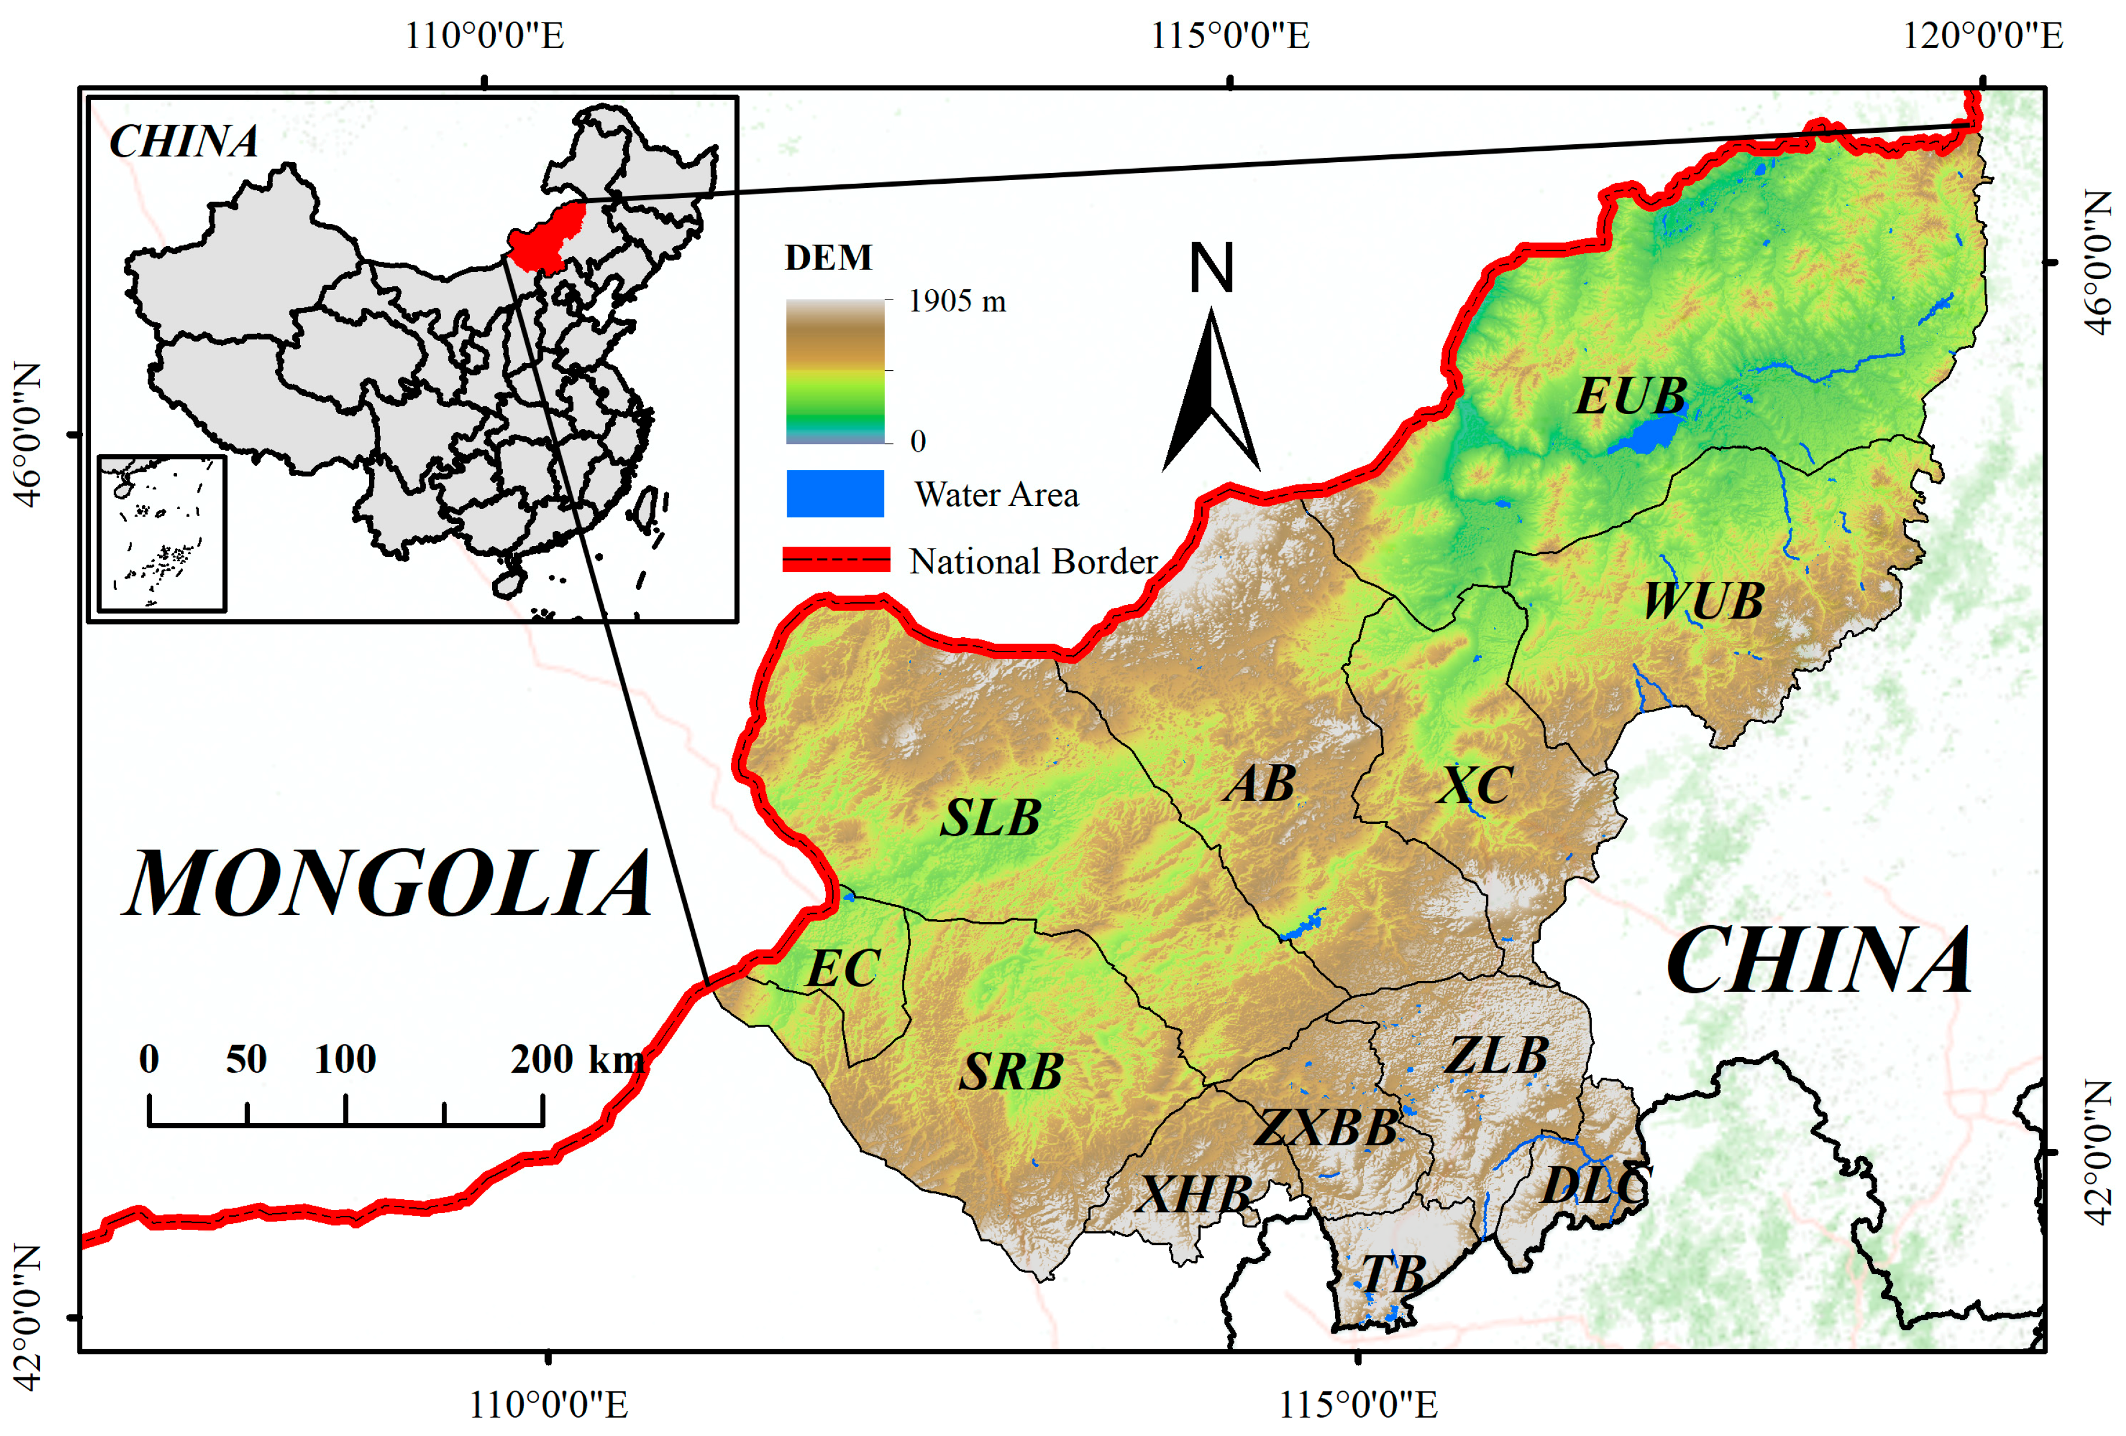
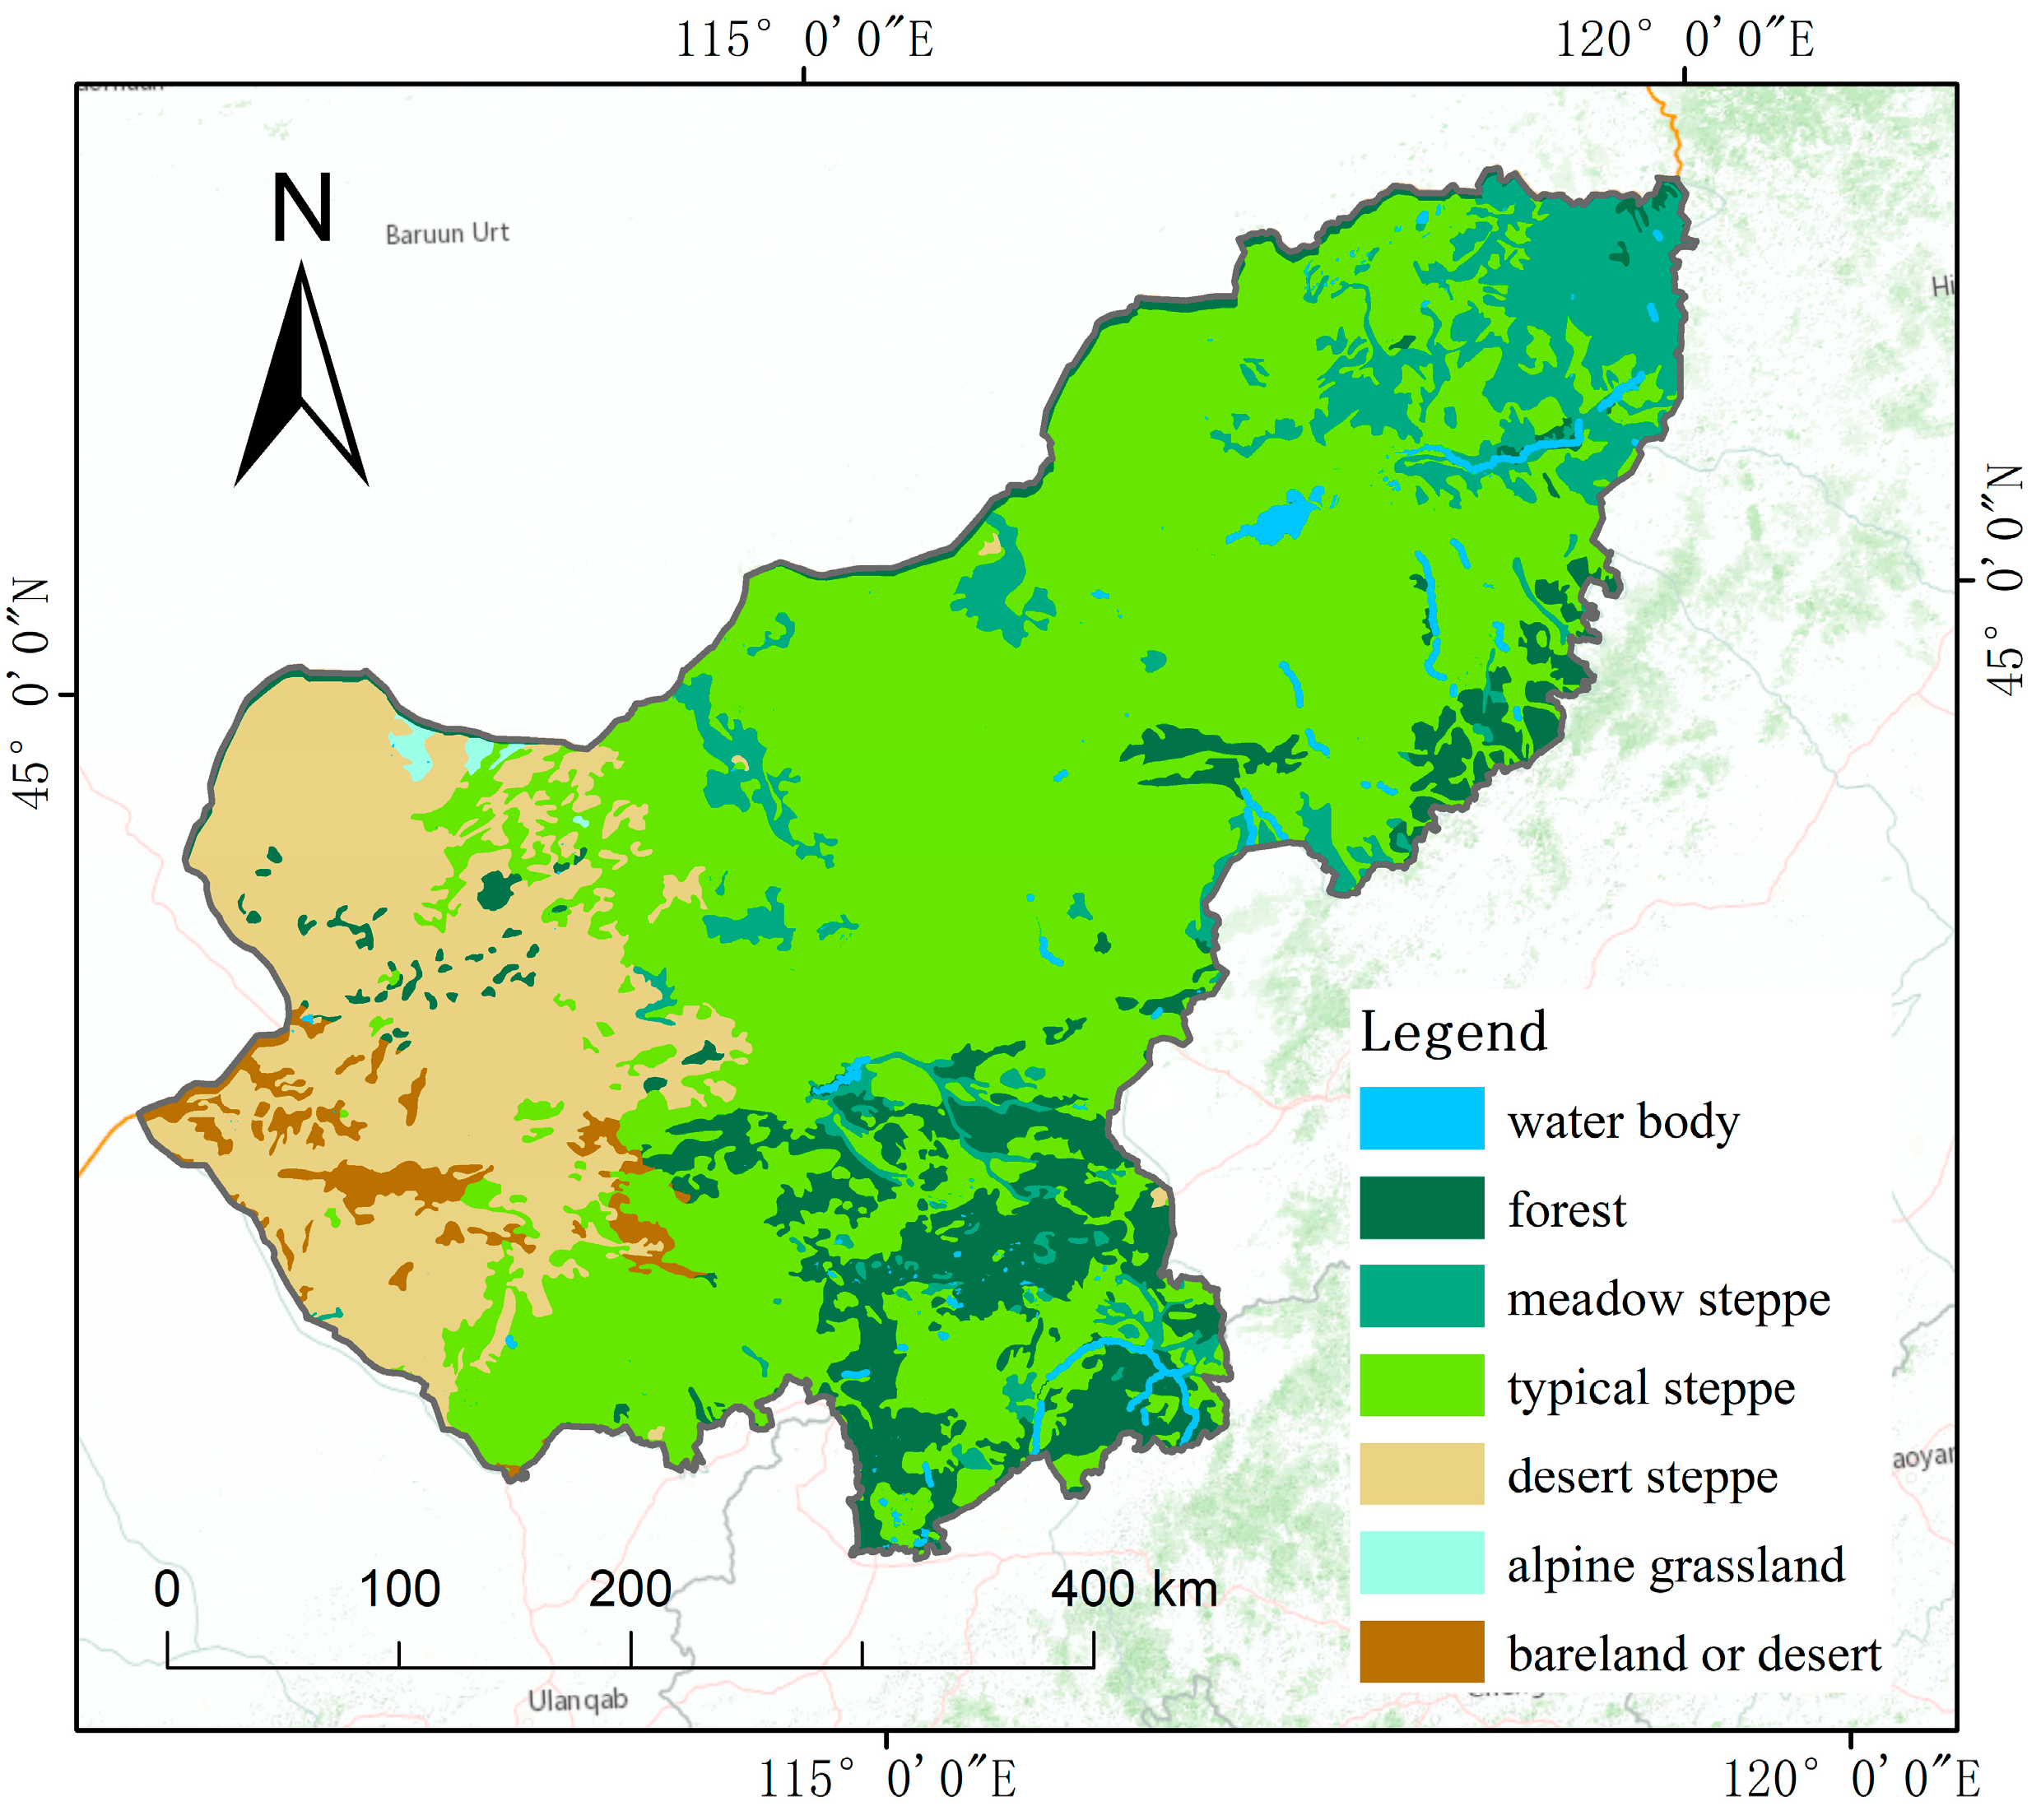
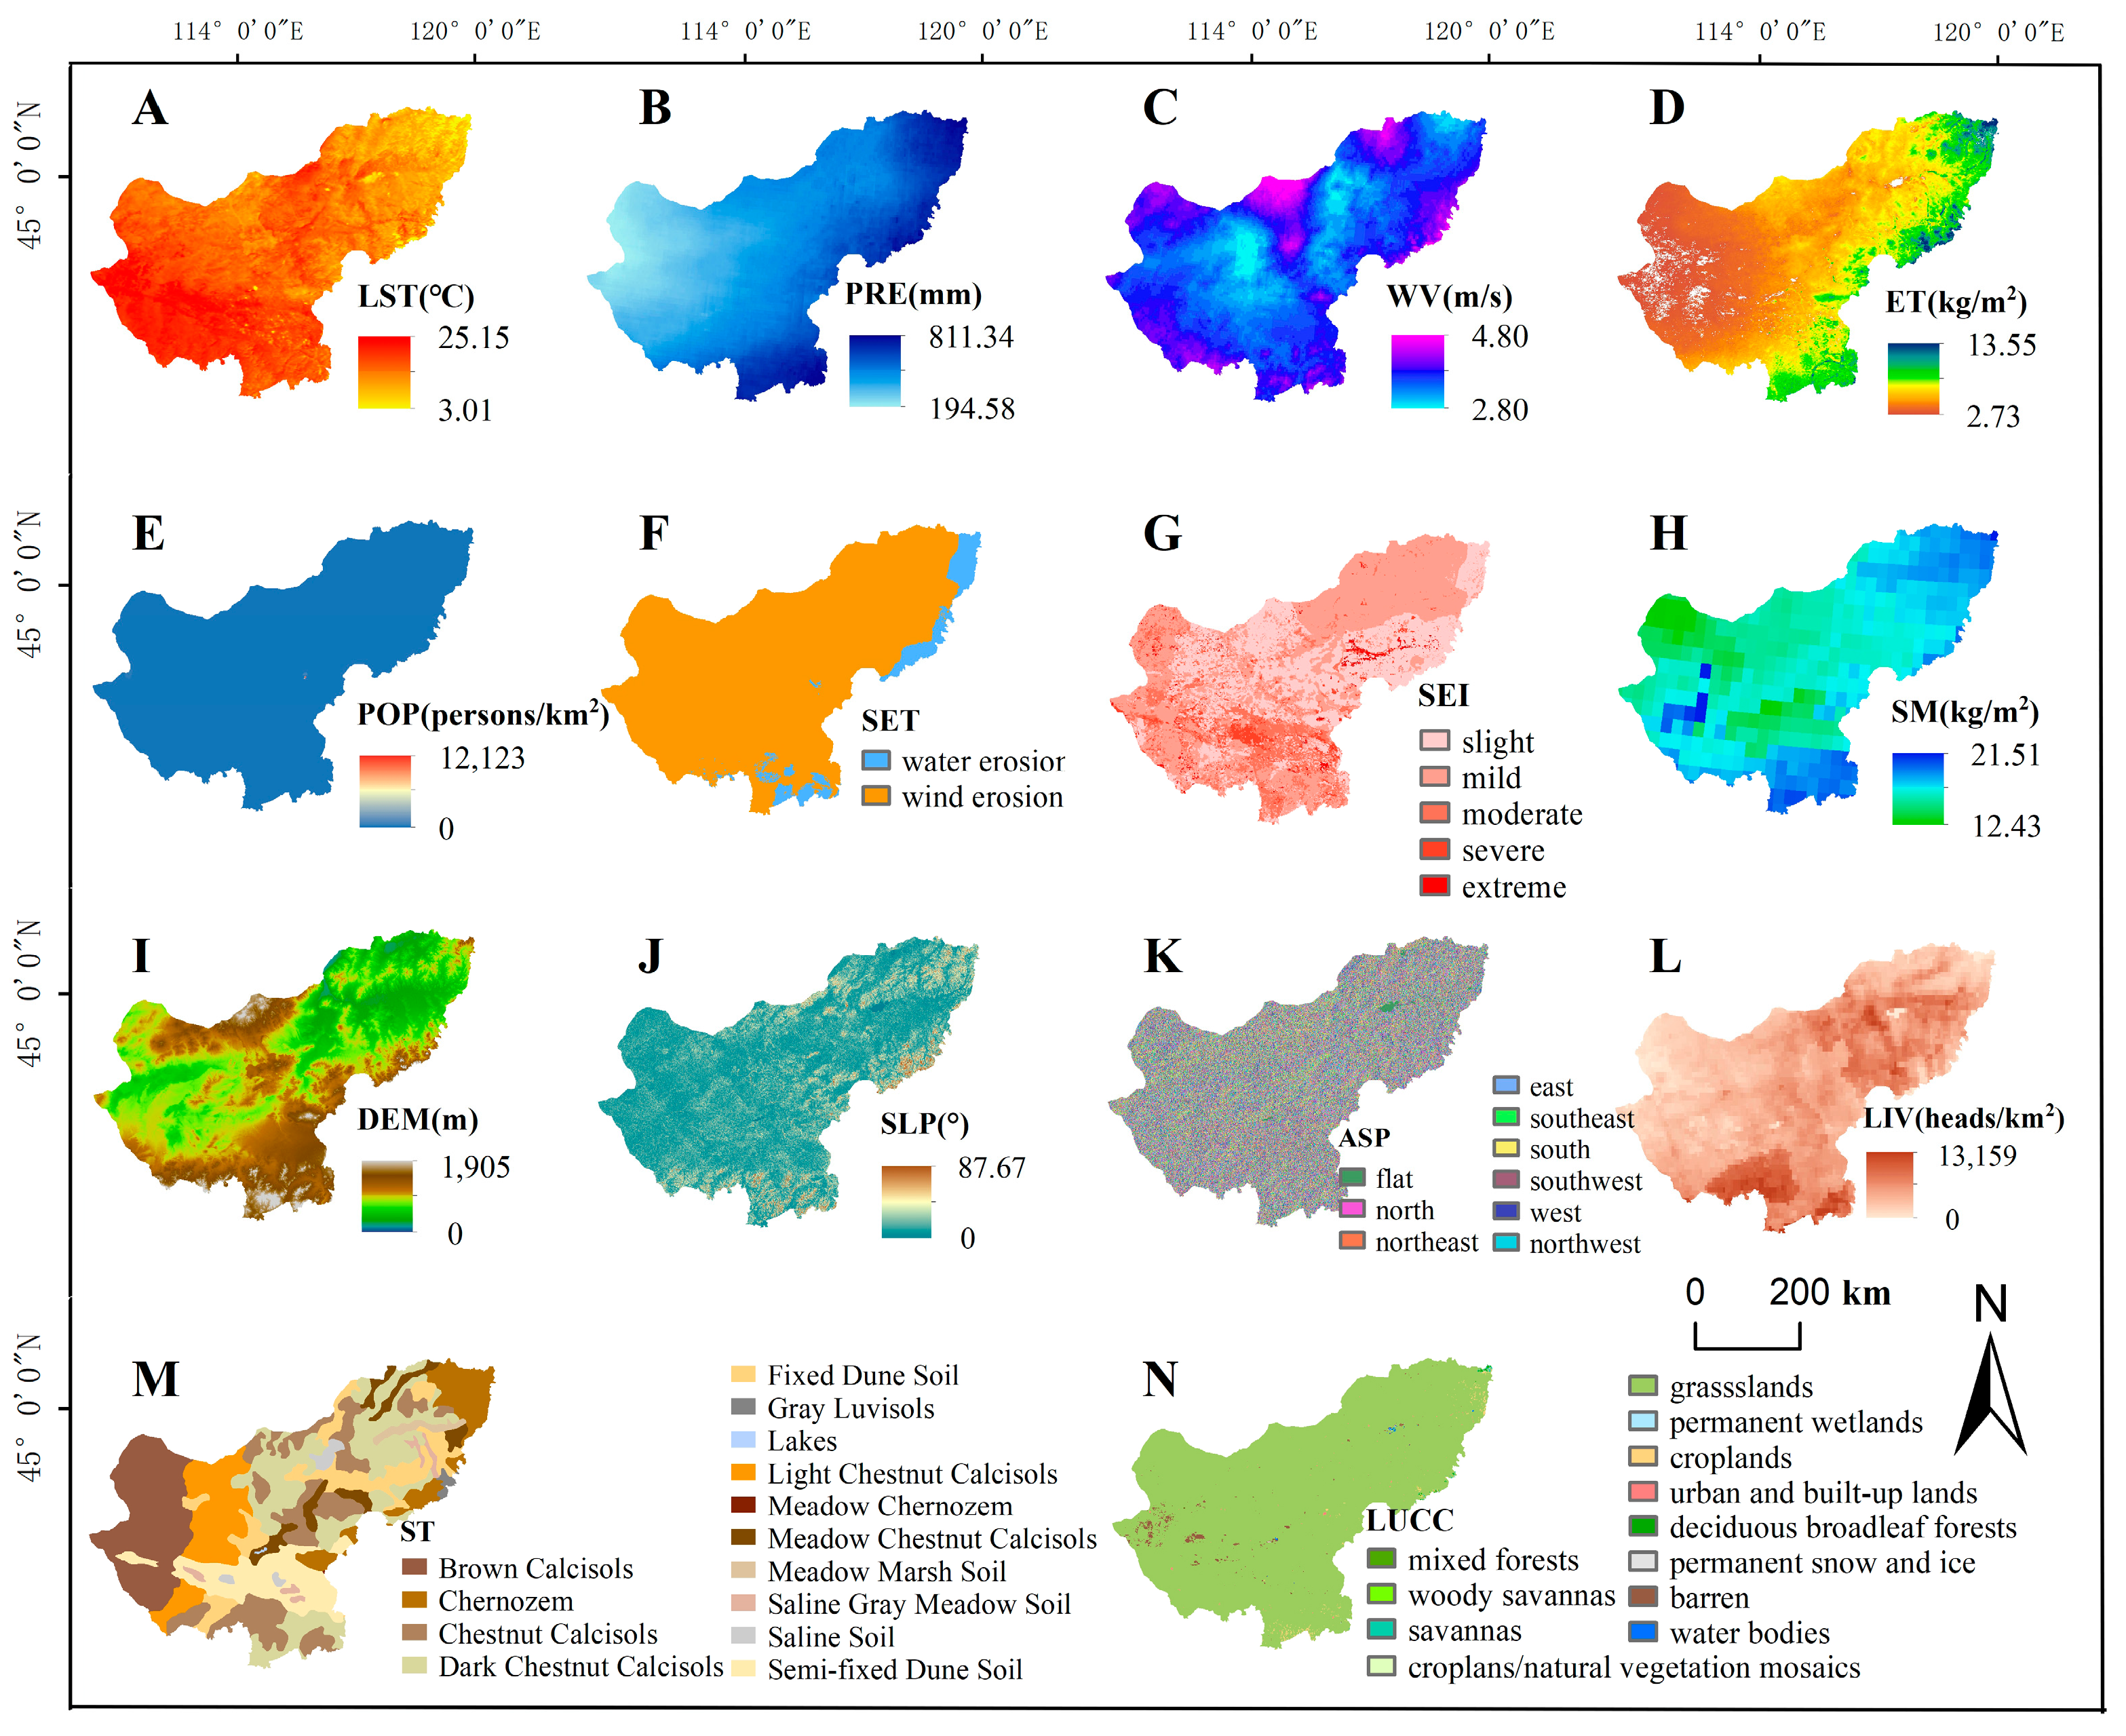
2.1. Study Area
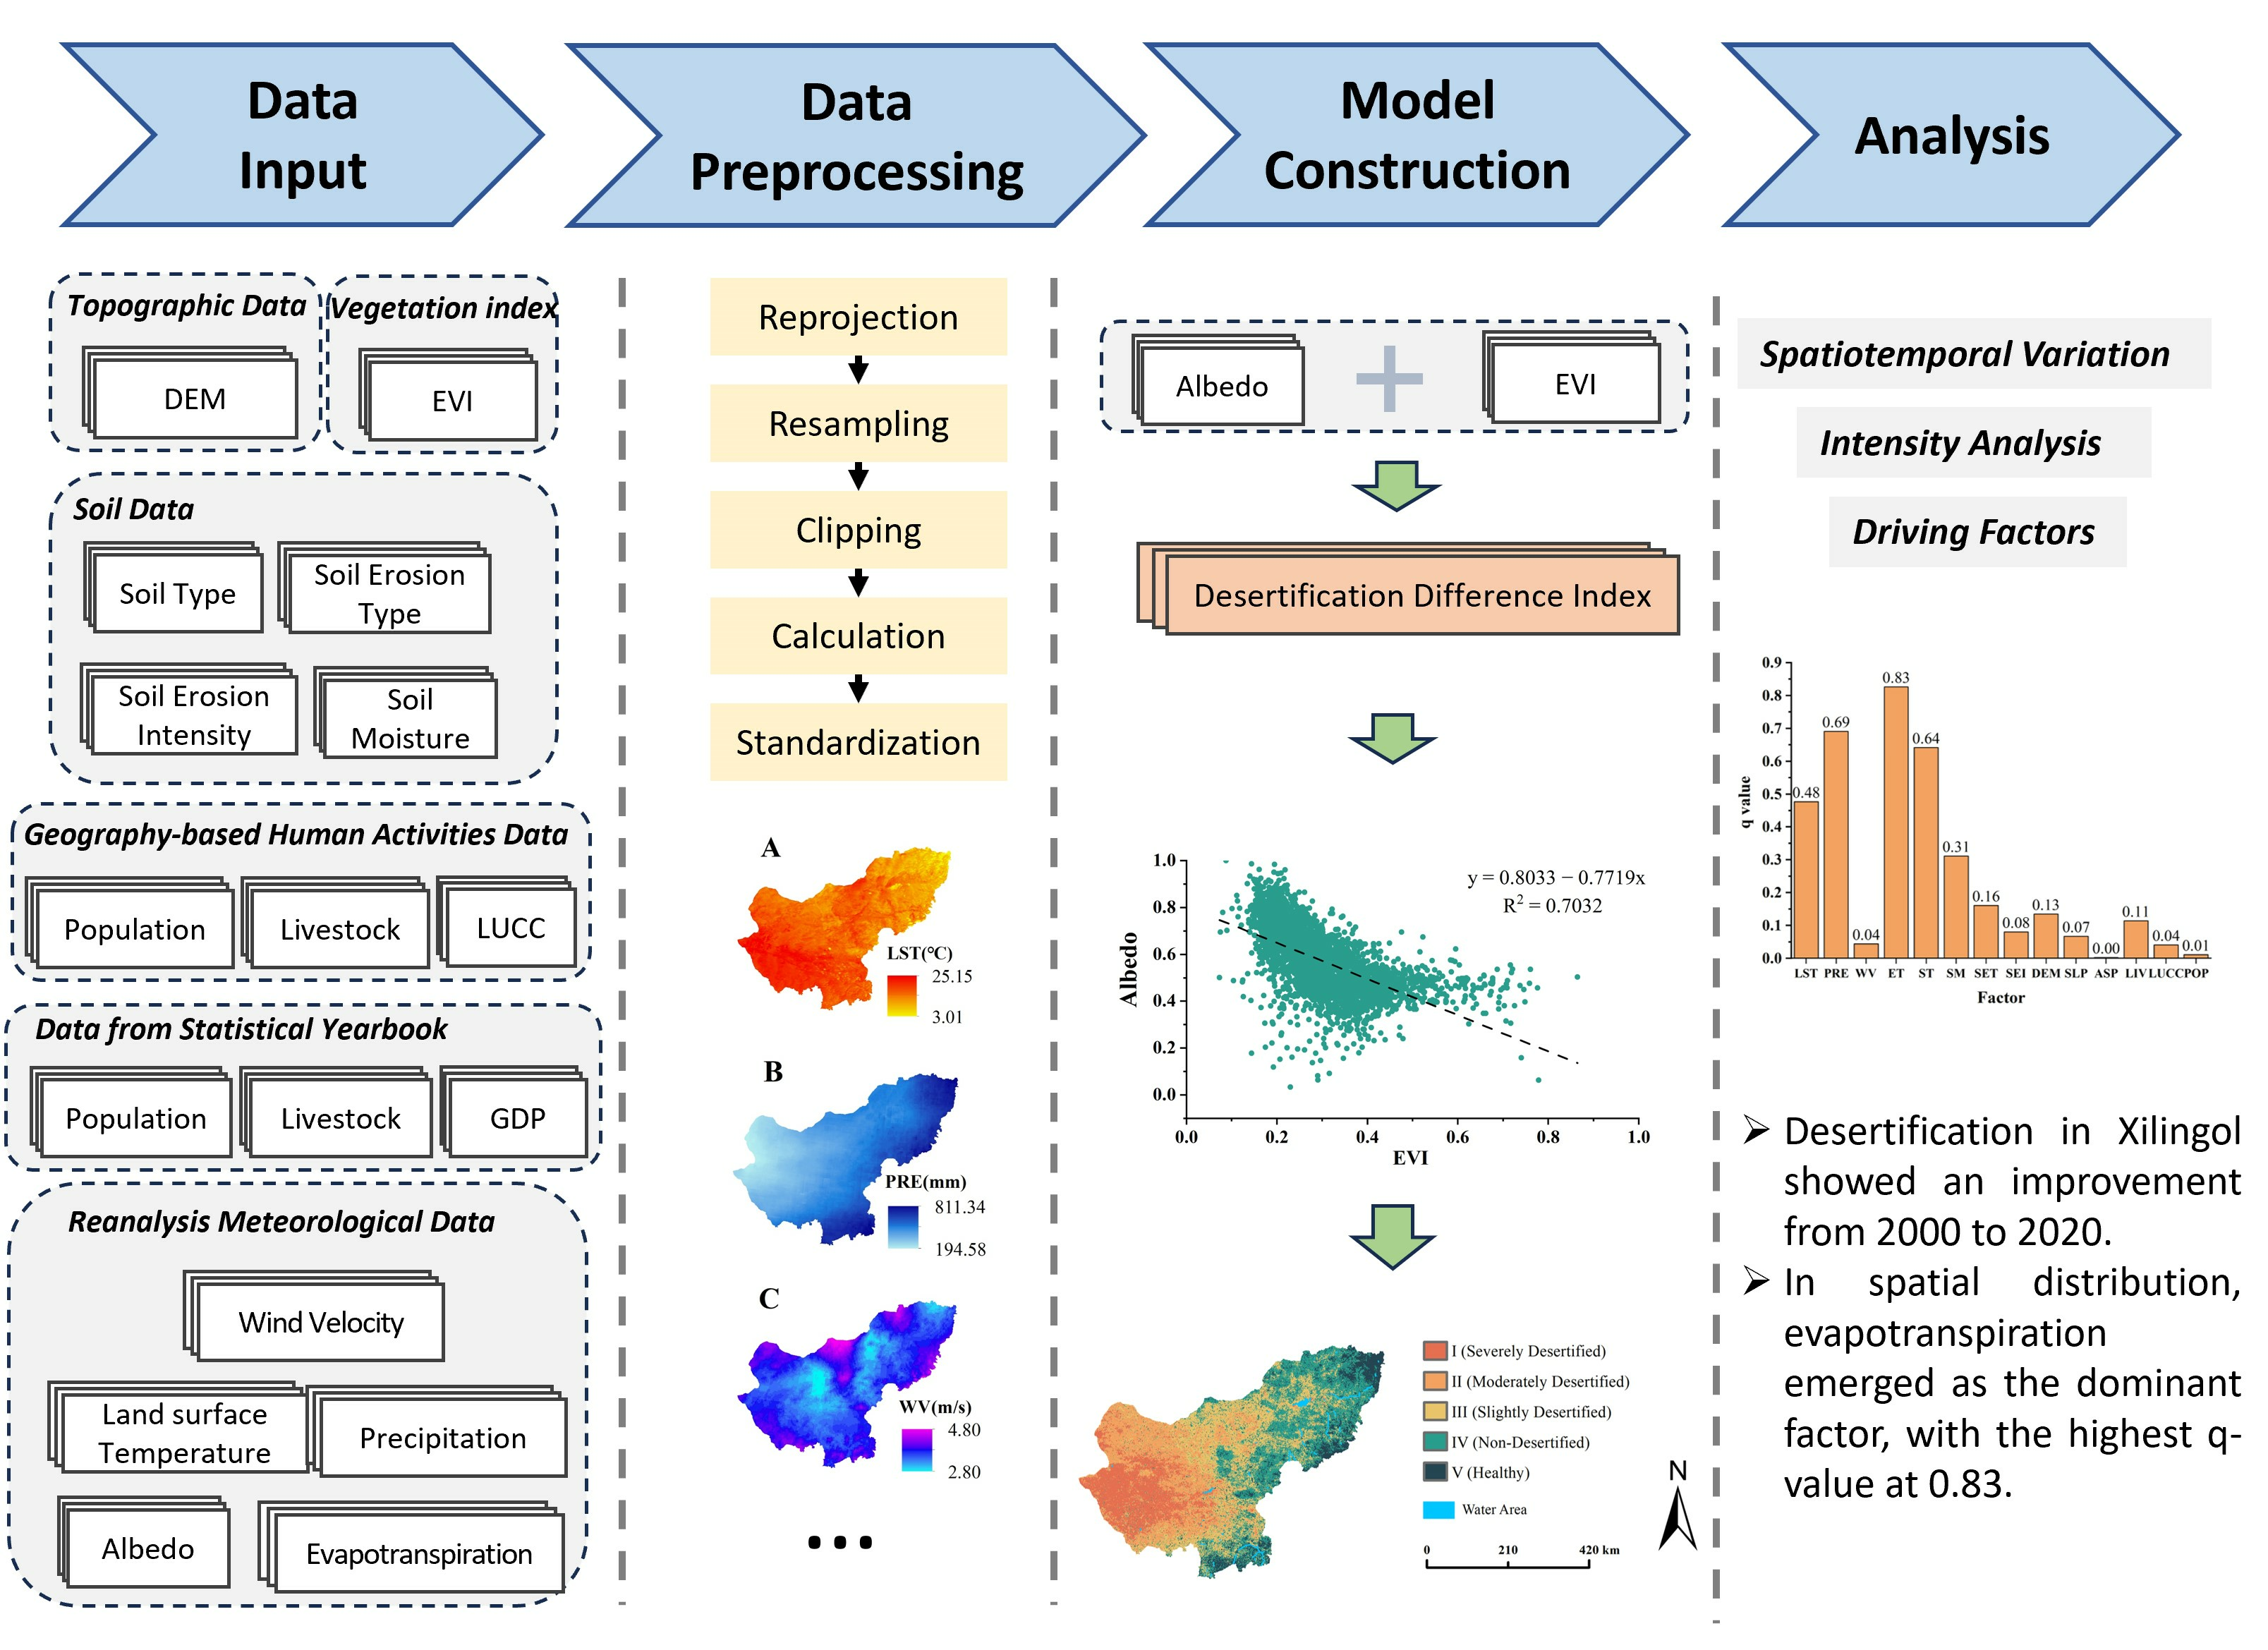
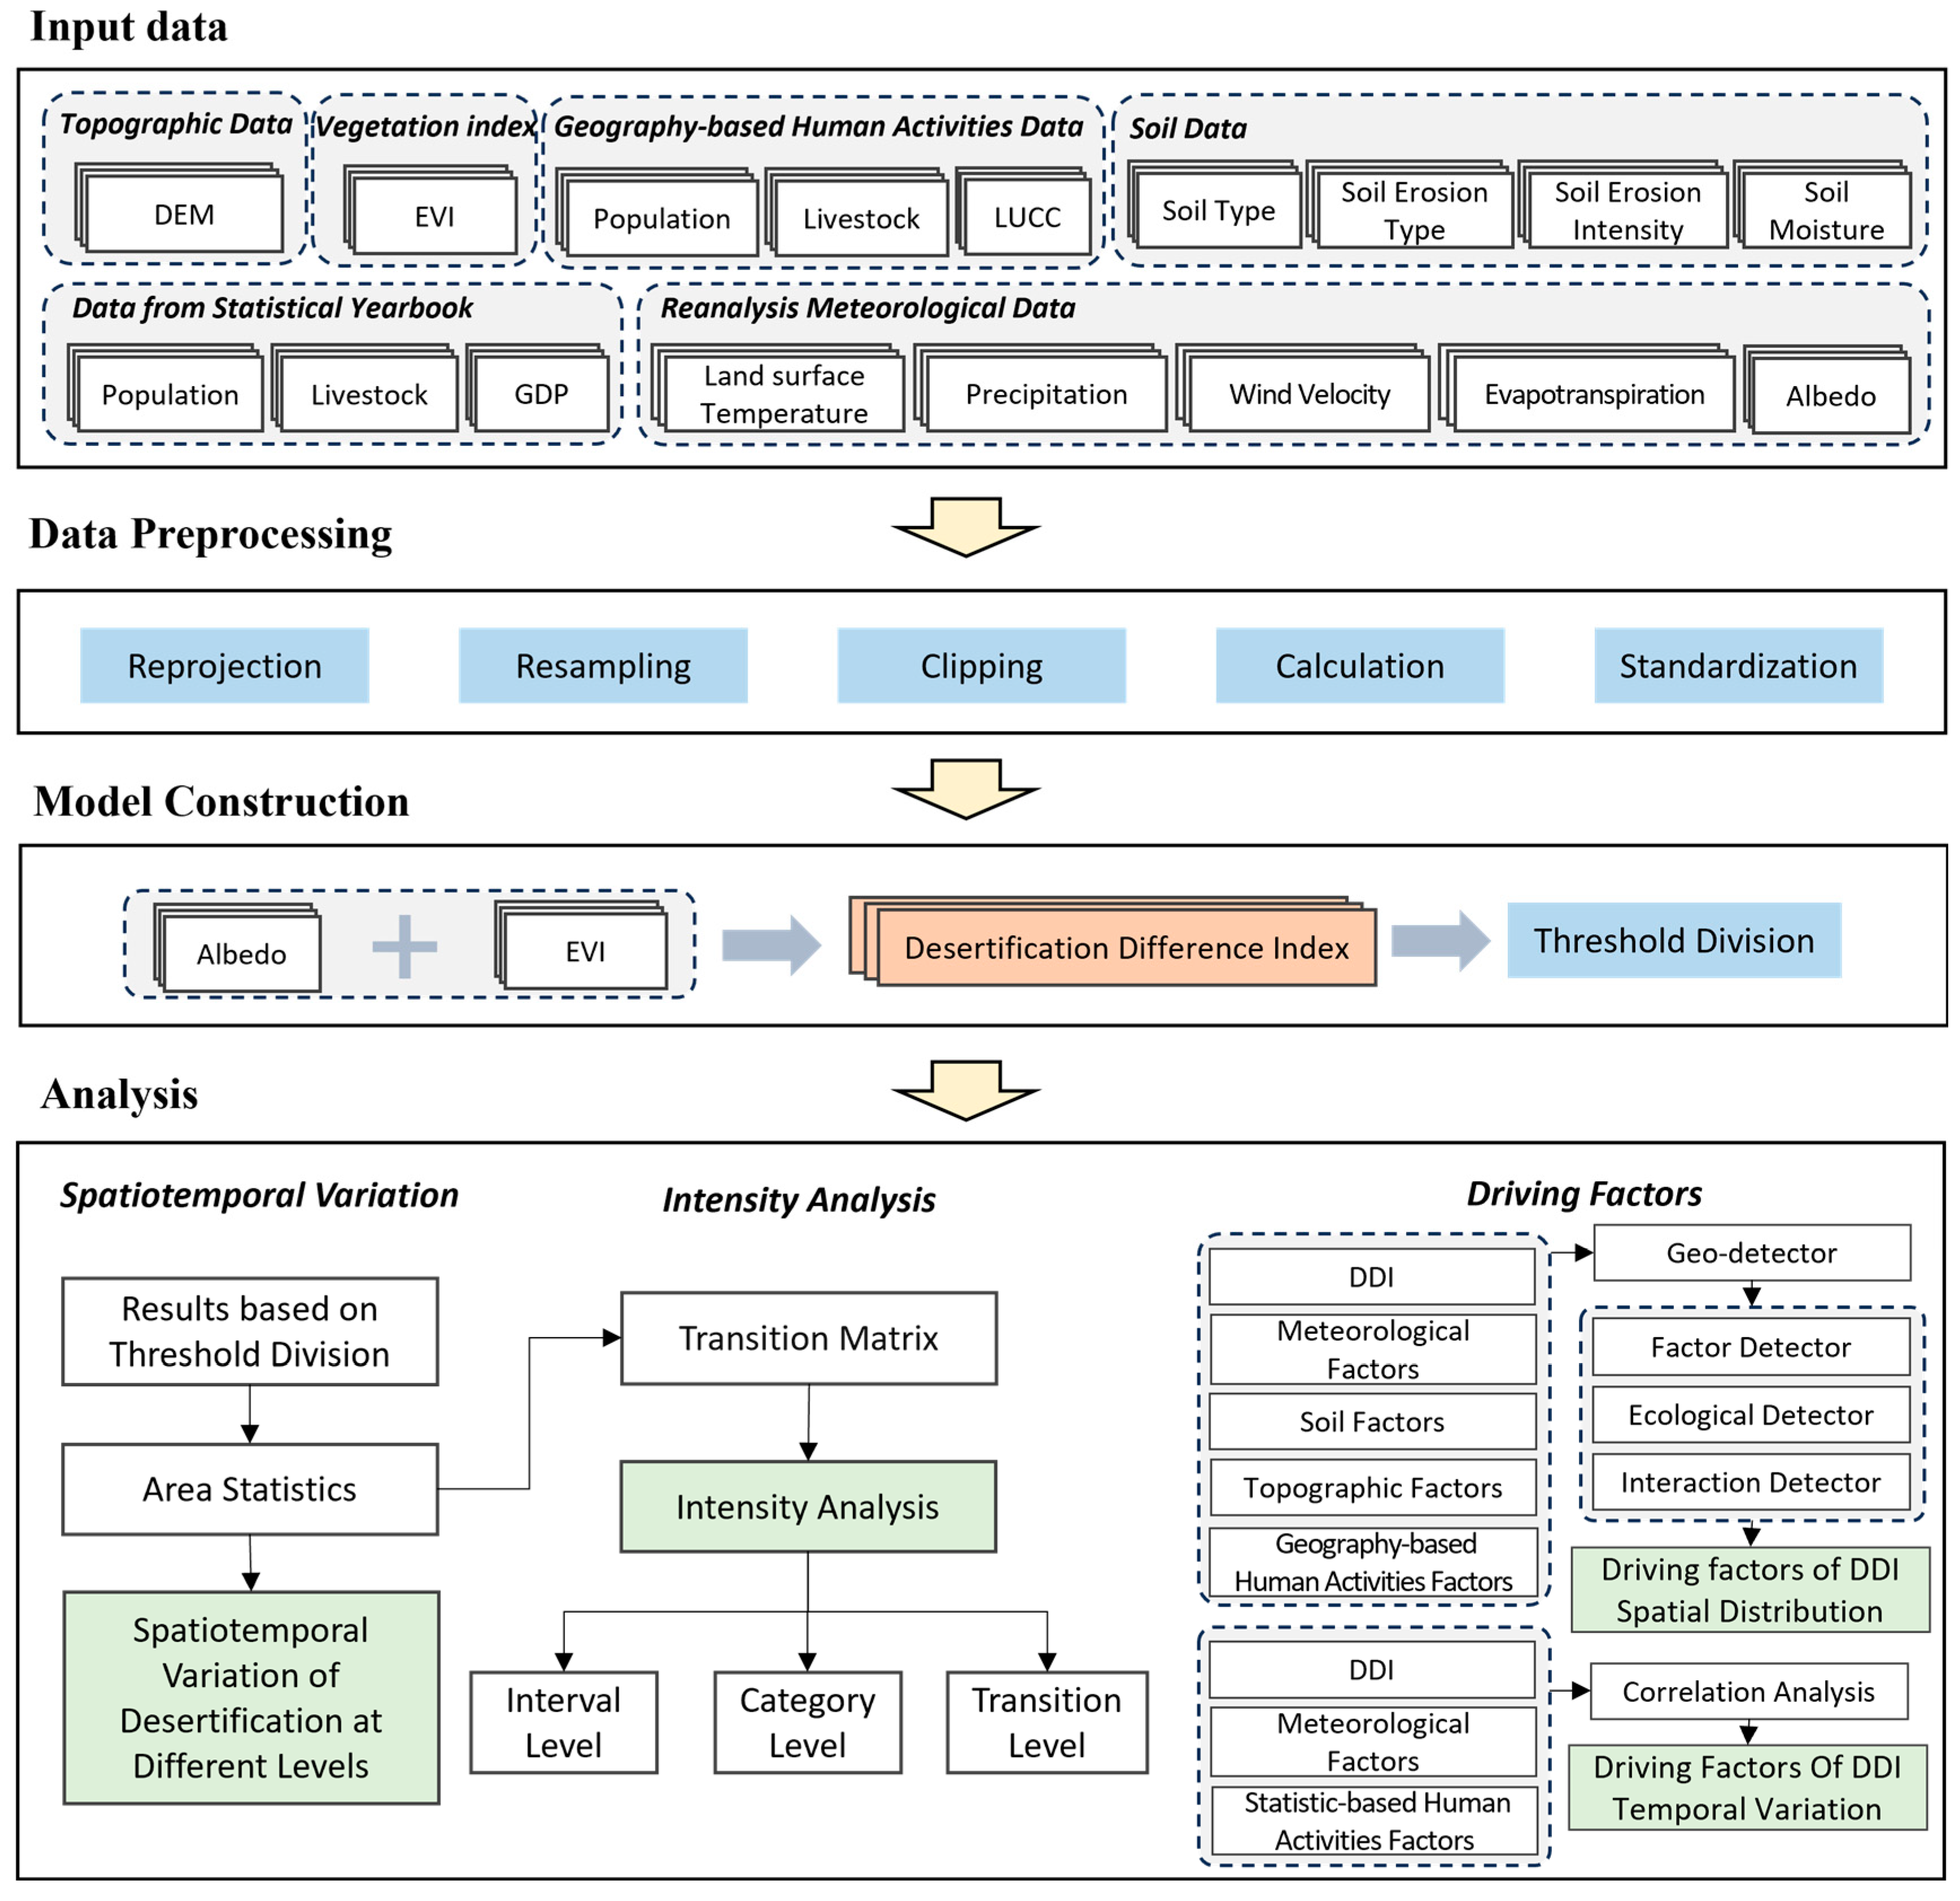
2.2. Data and Processing
2.3. Methods
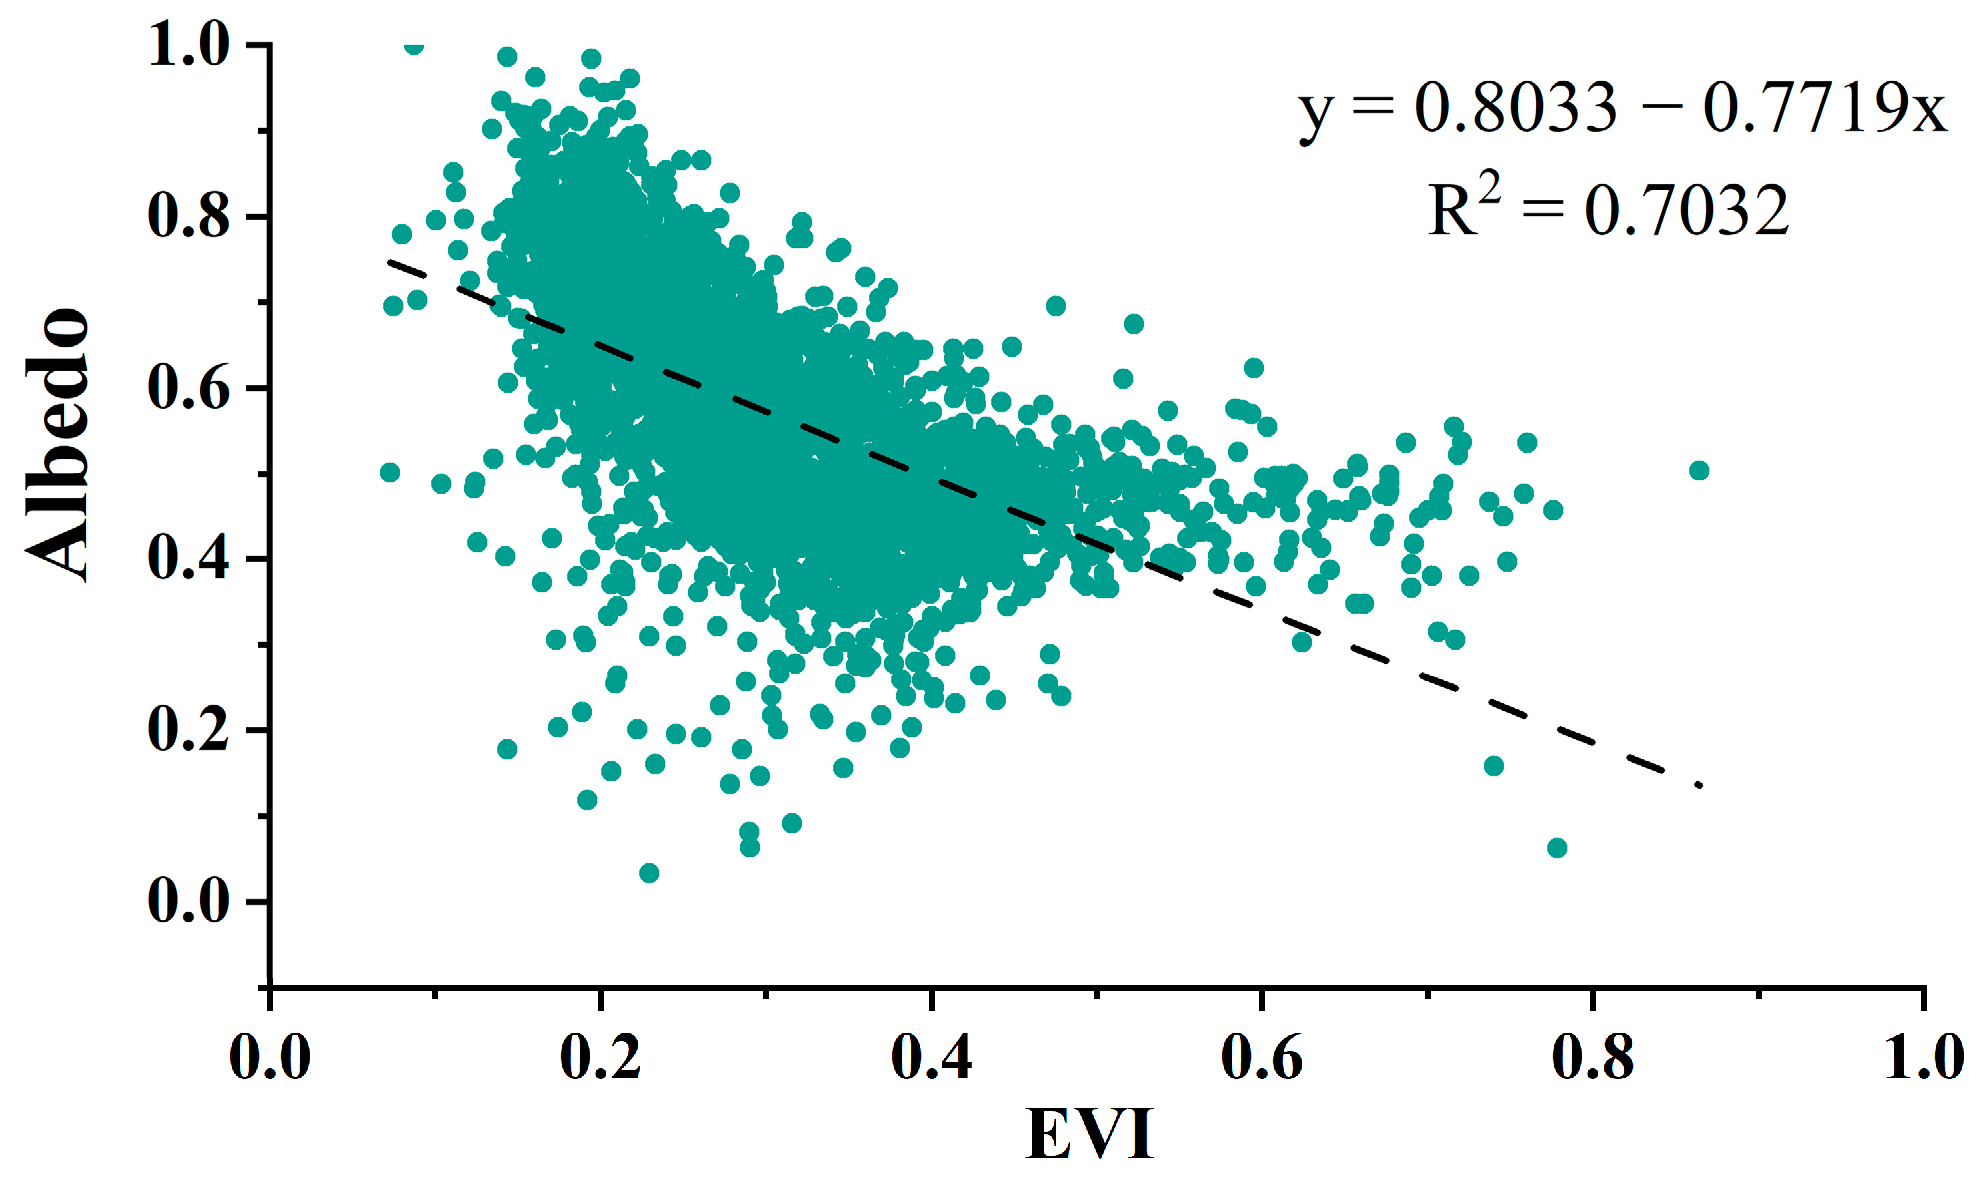
2.3.1. Desertification Difference Index (DDI) Model Construction
2.3.2. Data Normalization and Weighting
2.3.3. Spearman Correlation Coefficient
2.3.4. Intensity Analysis
- Interval level
- 2.
- Category level
- 3.
- Transition level
2.3.5. Geographical Detector
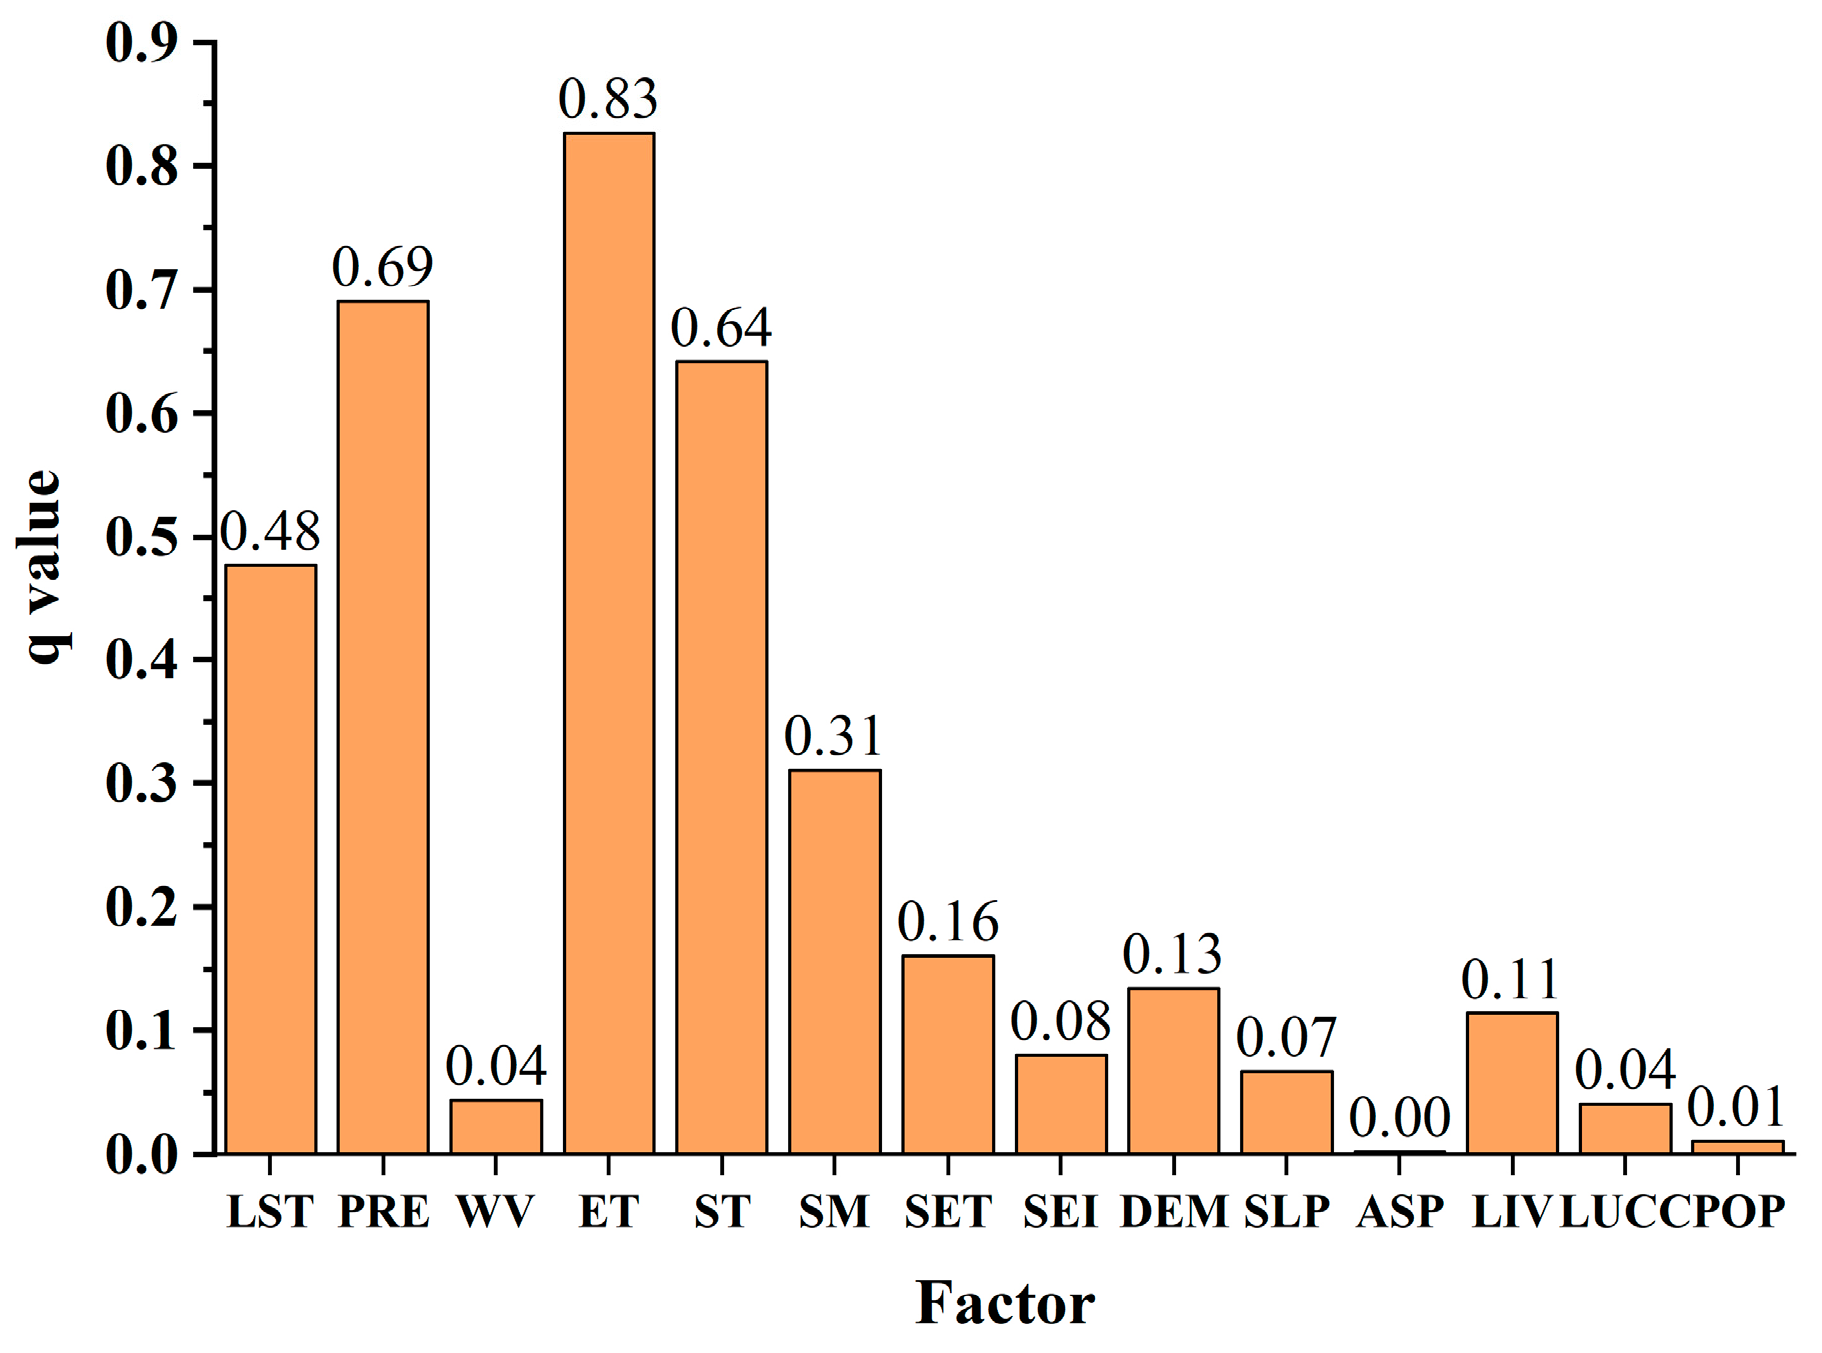
- Factor Detector
- 2.
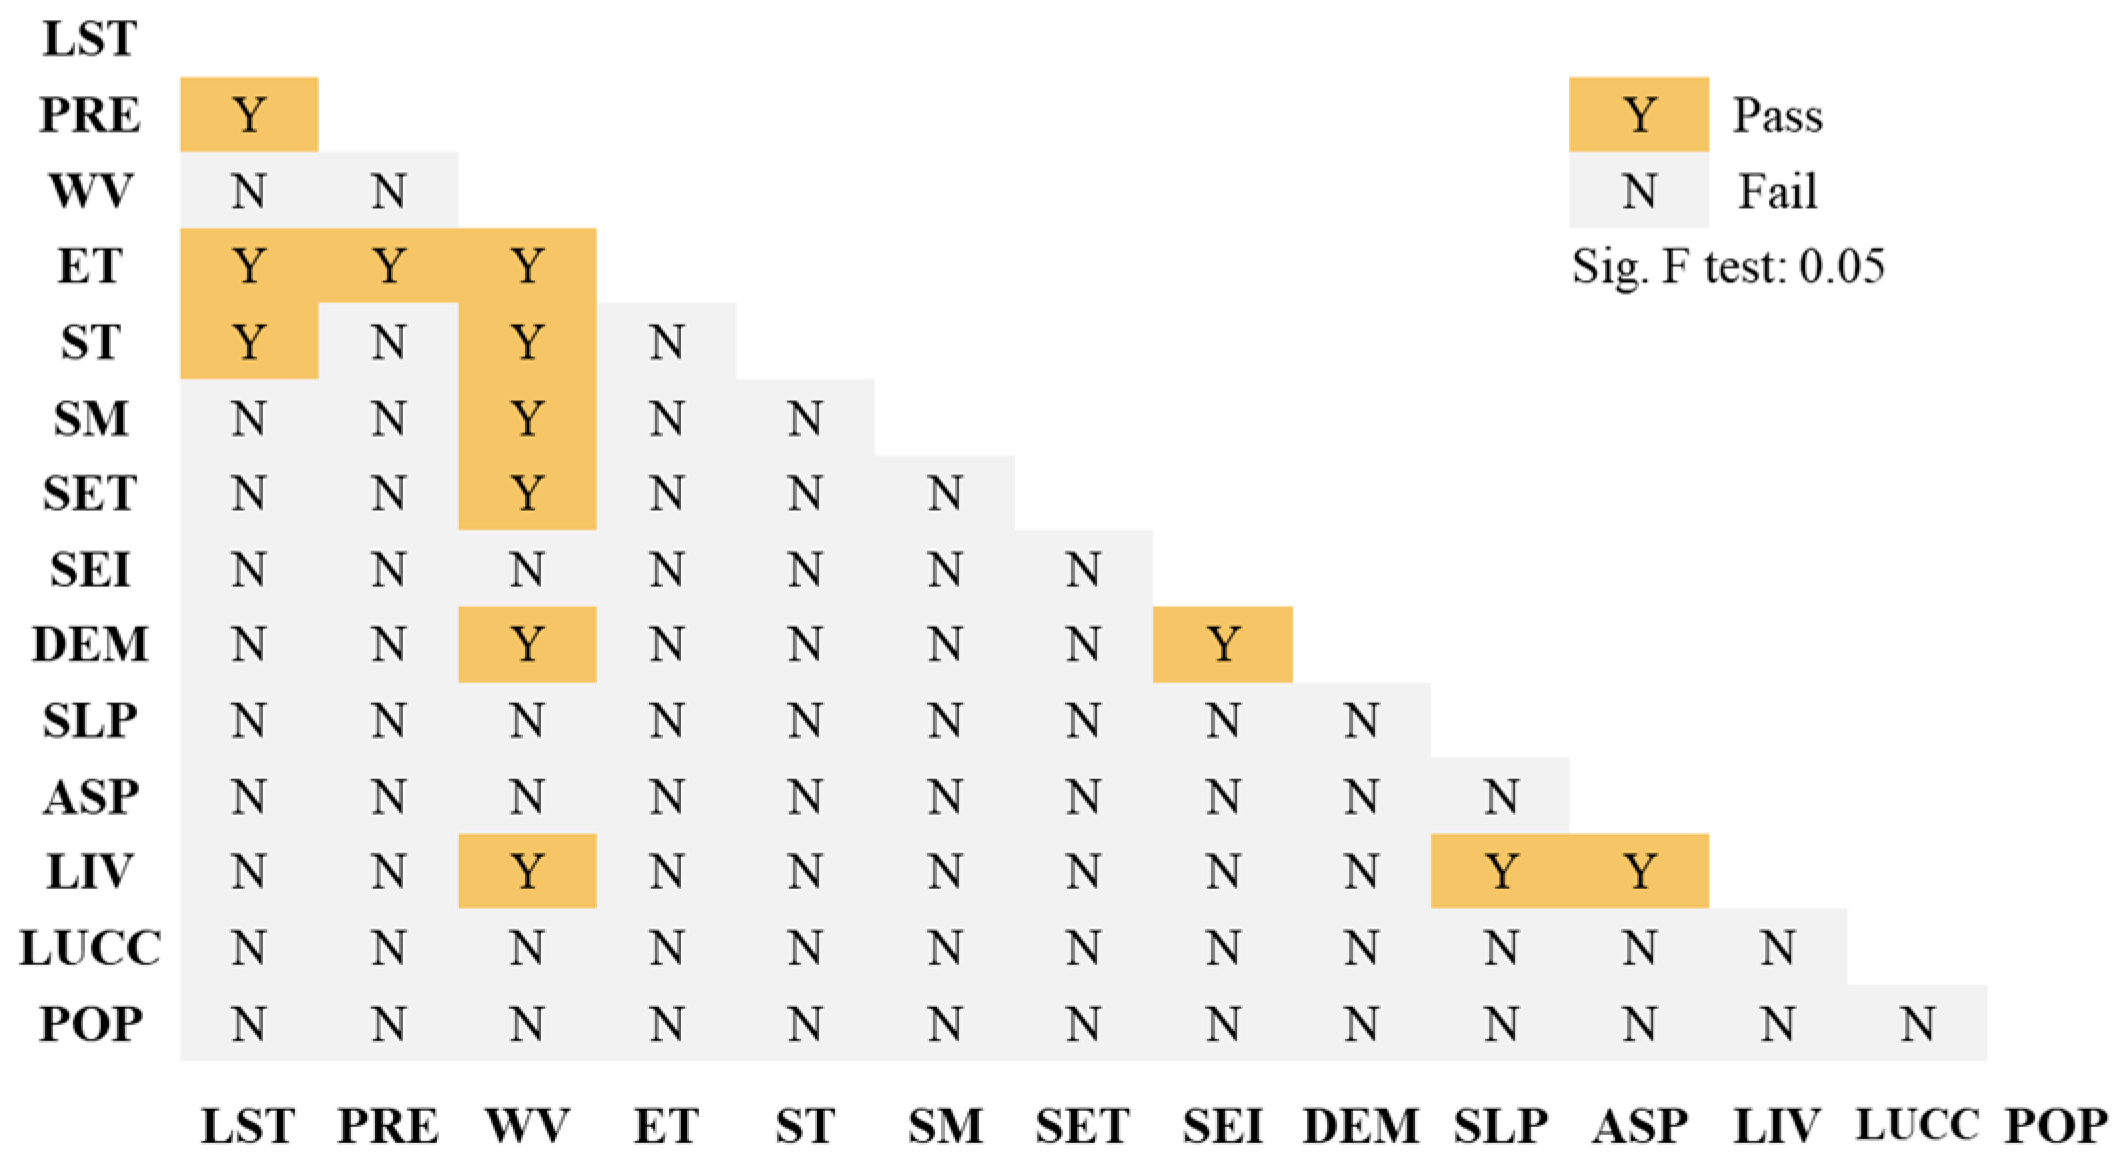
- Ecological Detector
- 3.
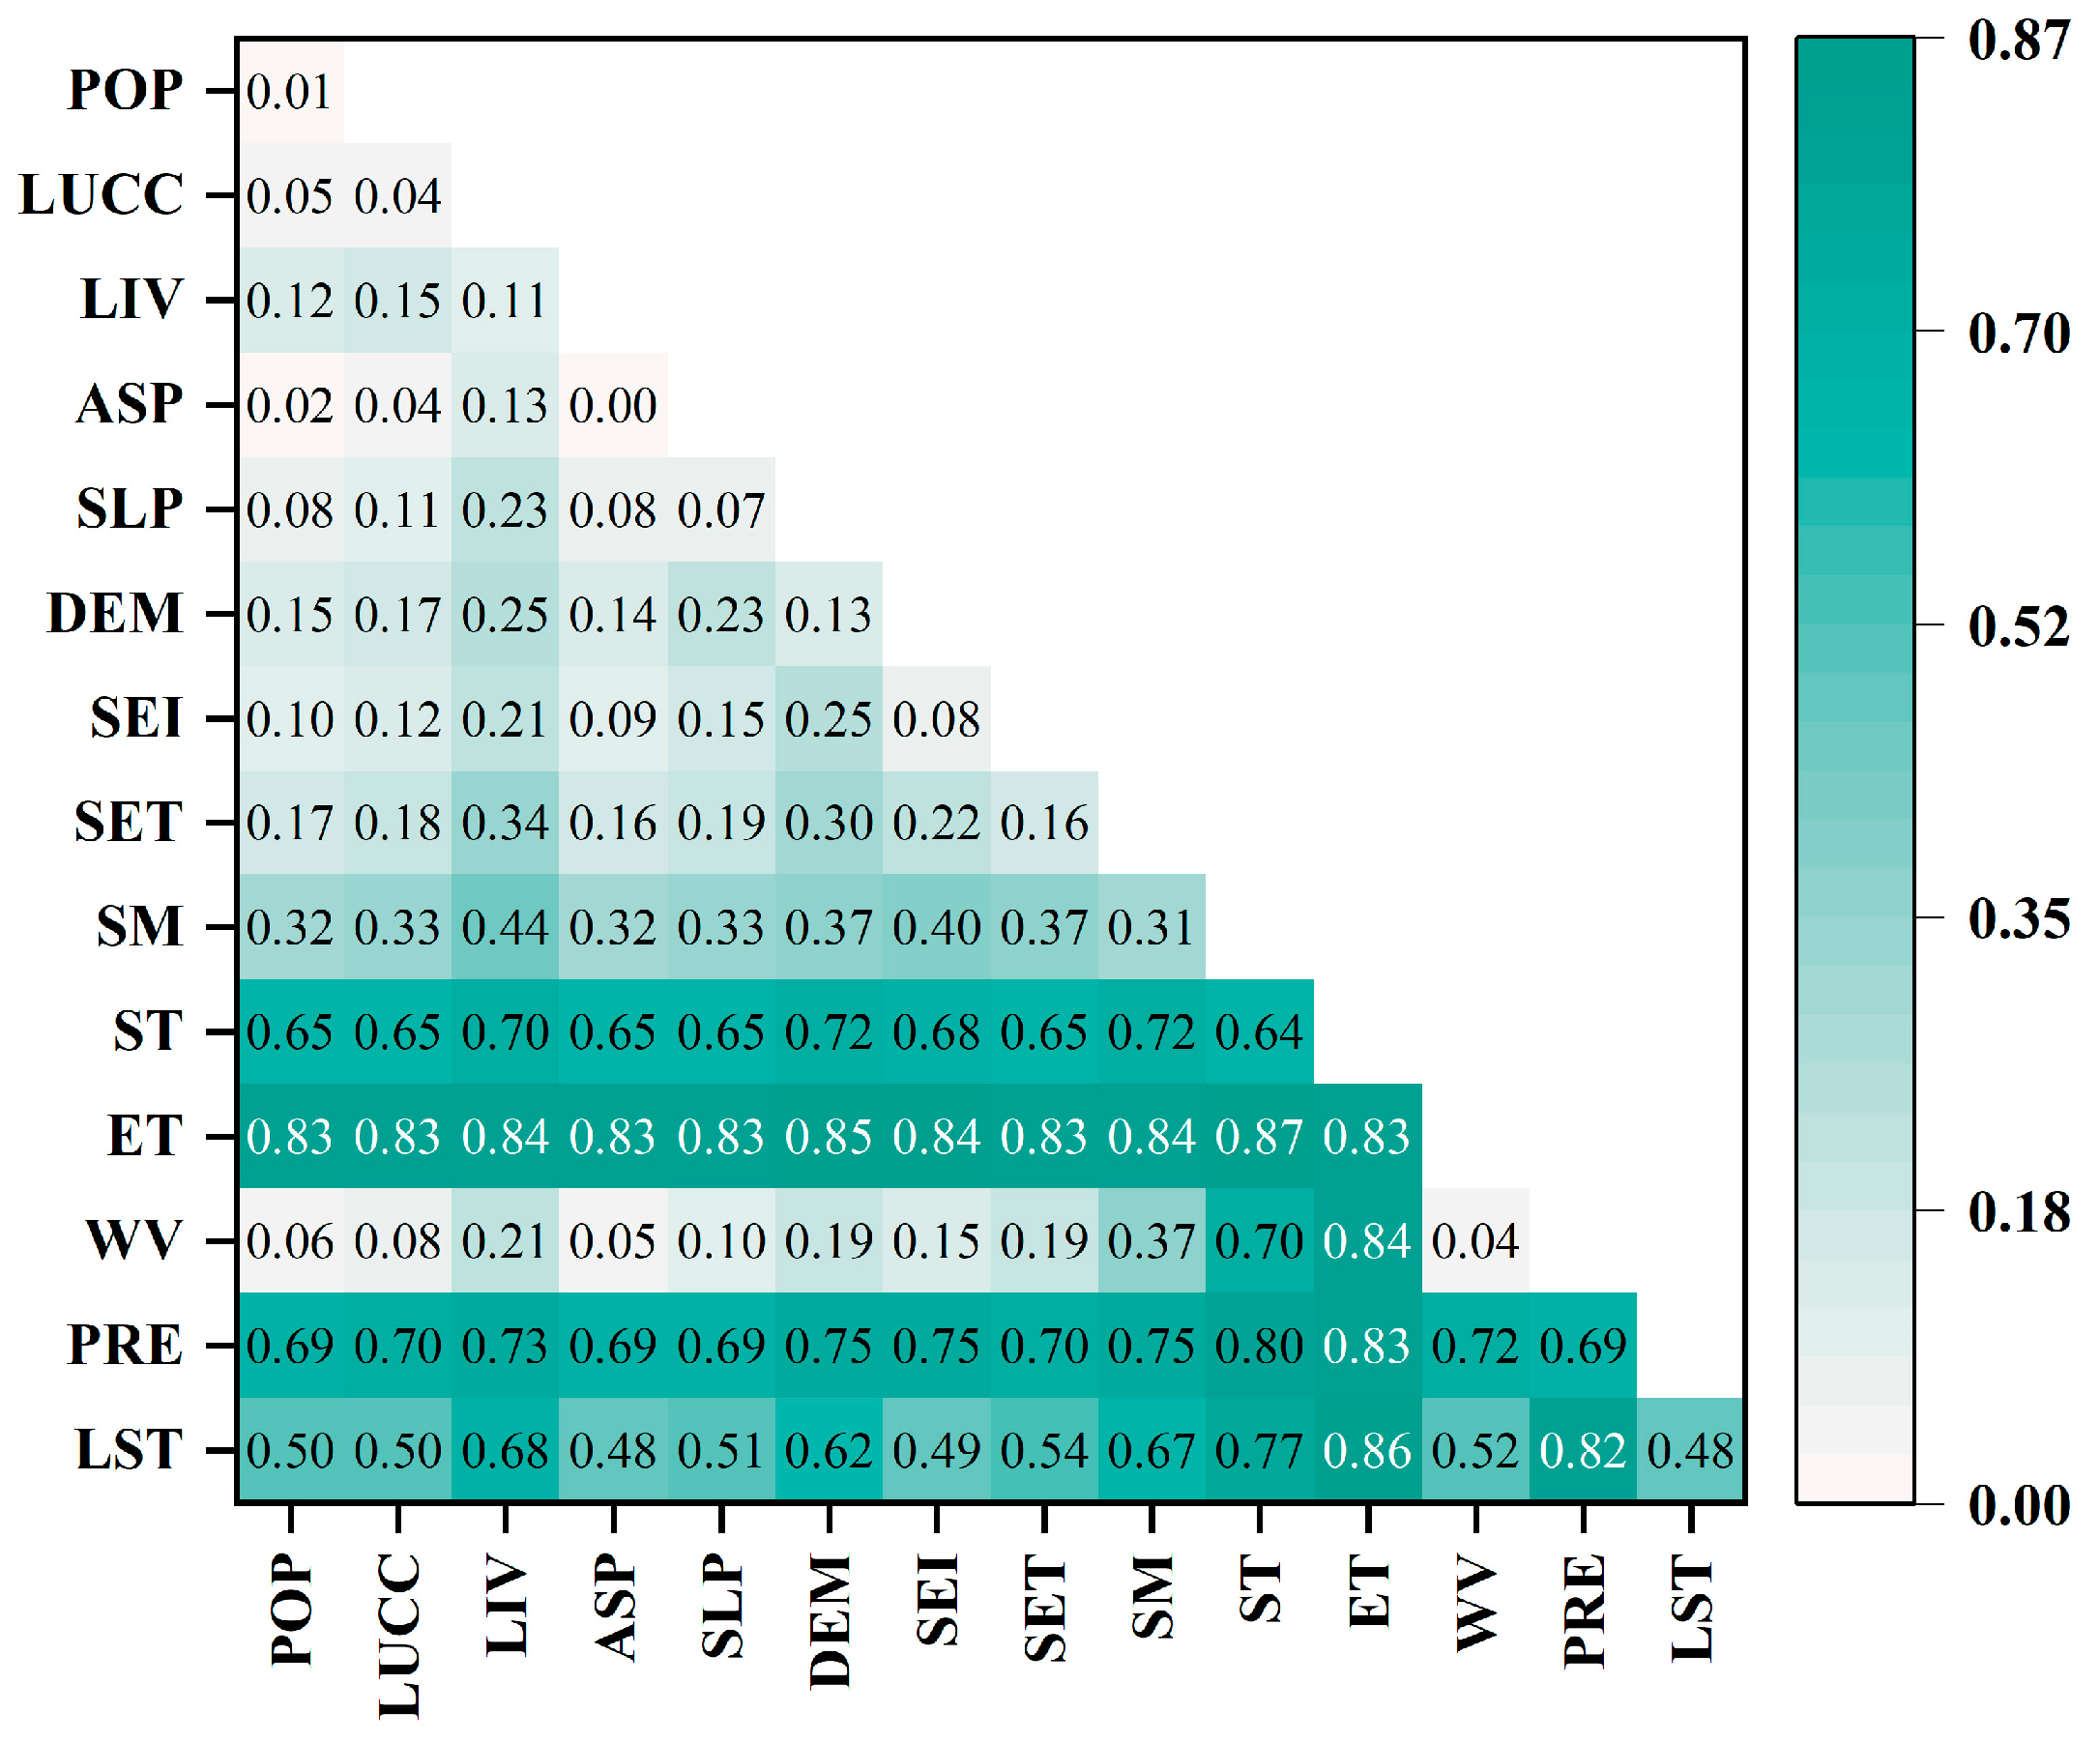
- Interaction Detector
3. Results
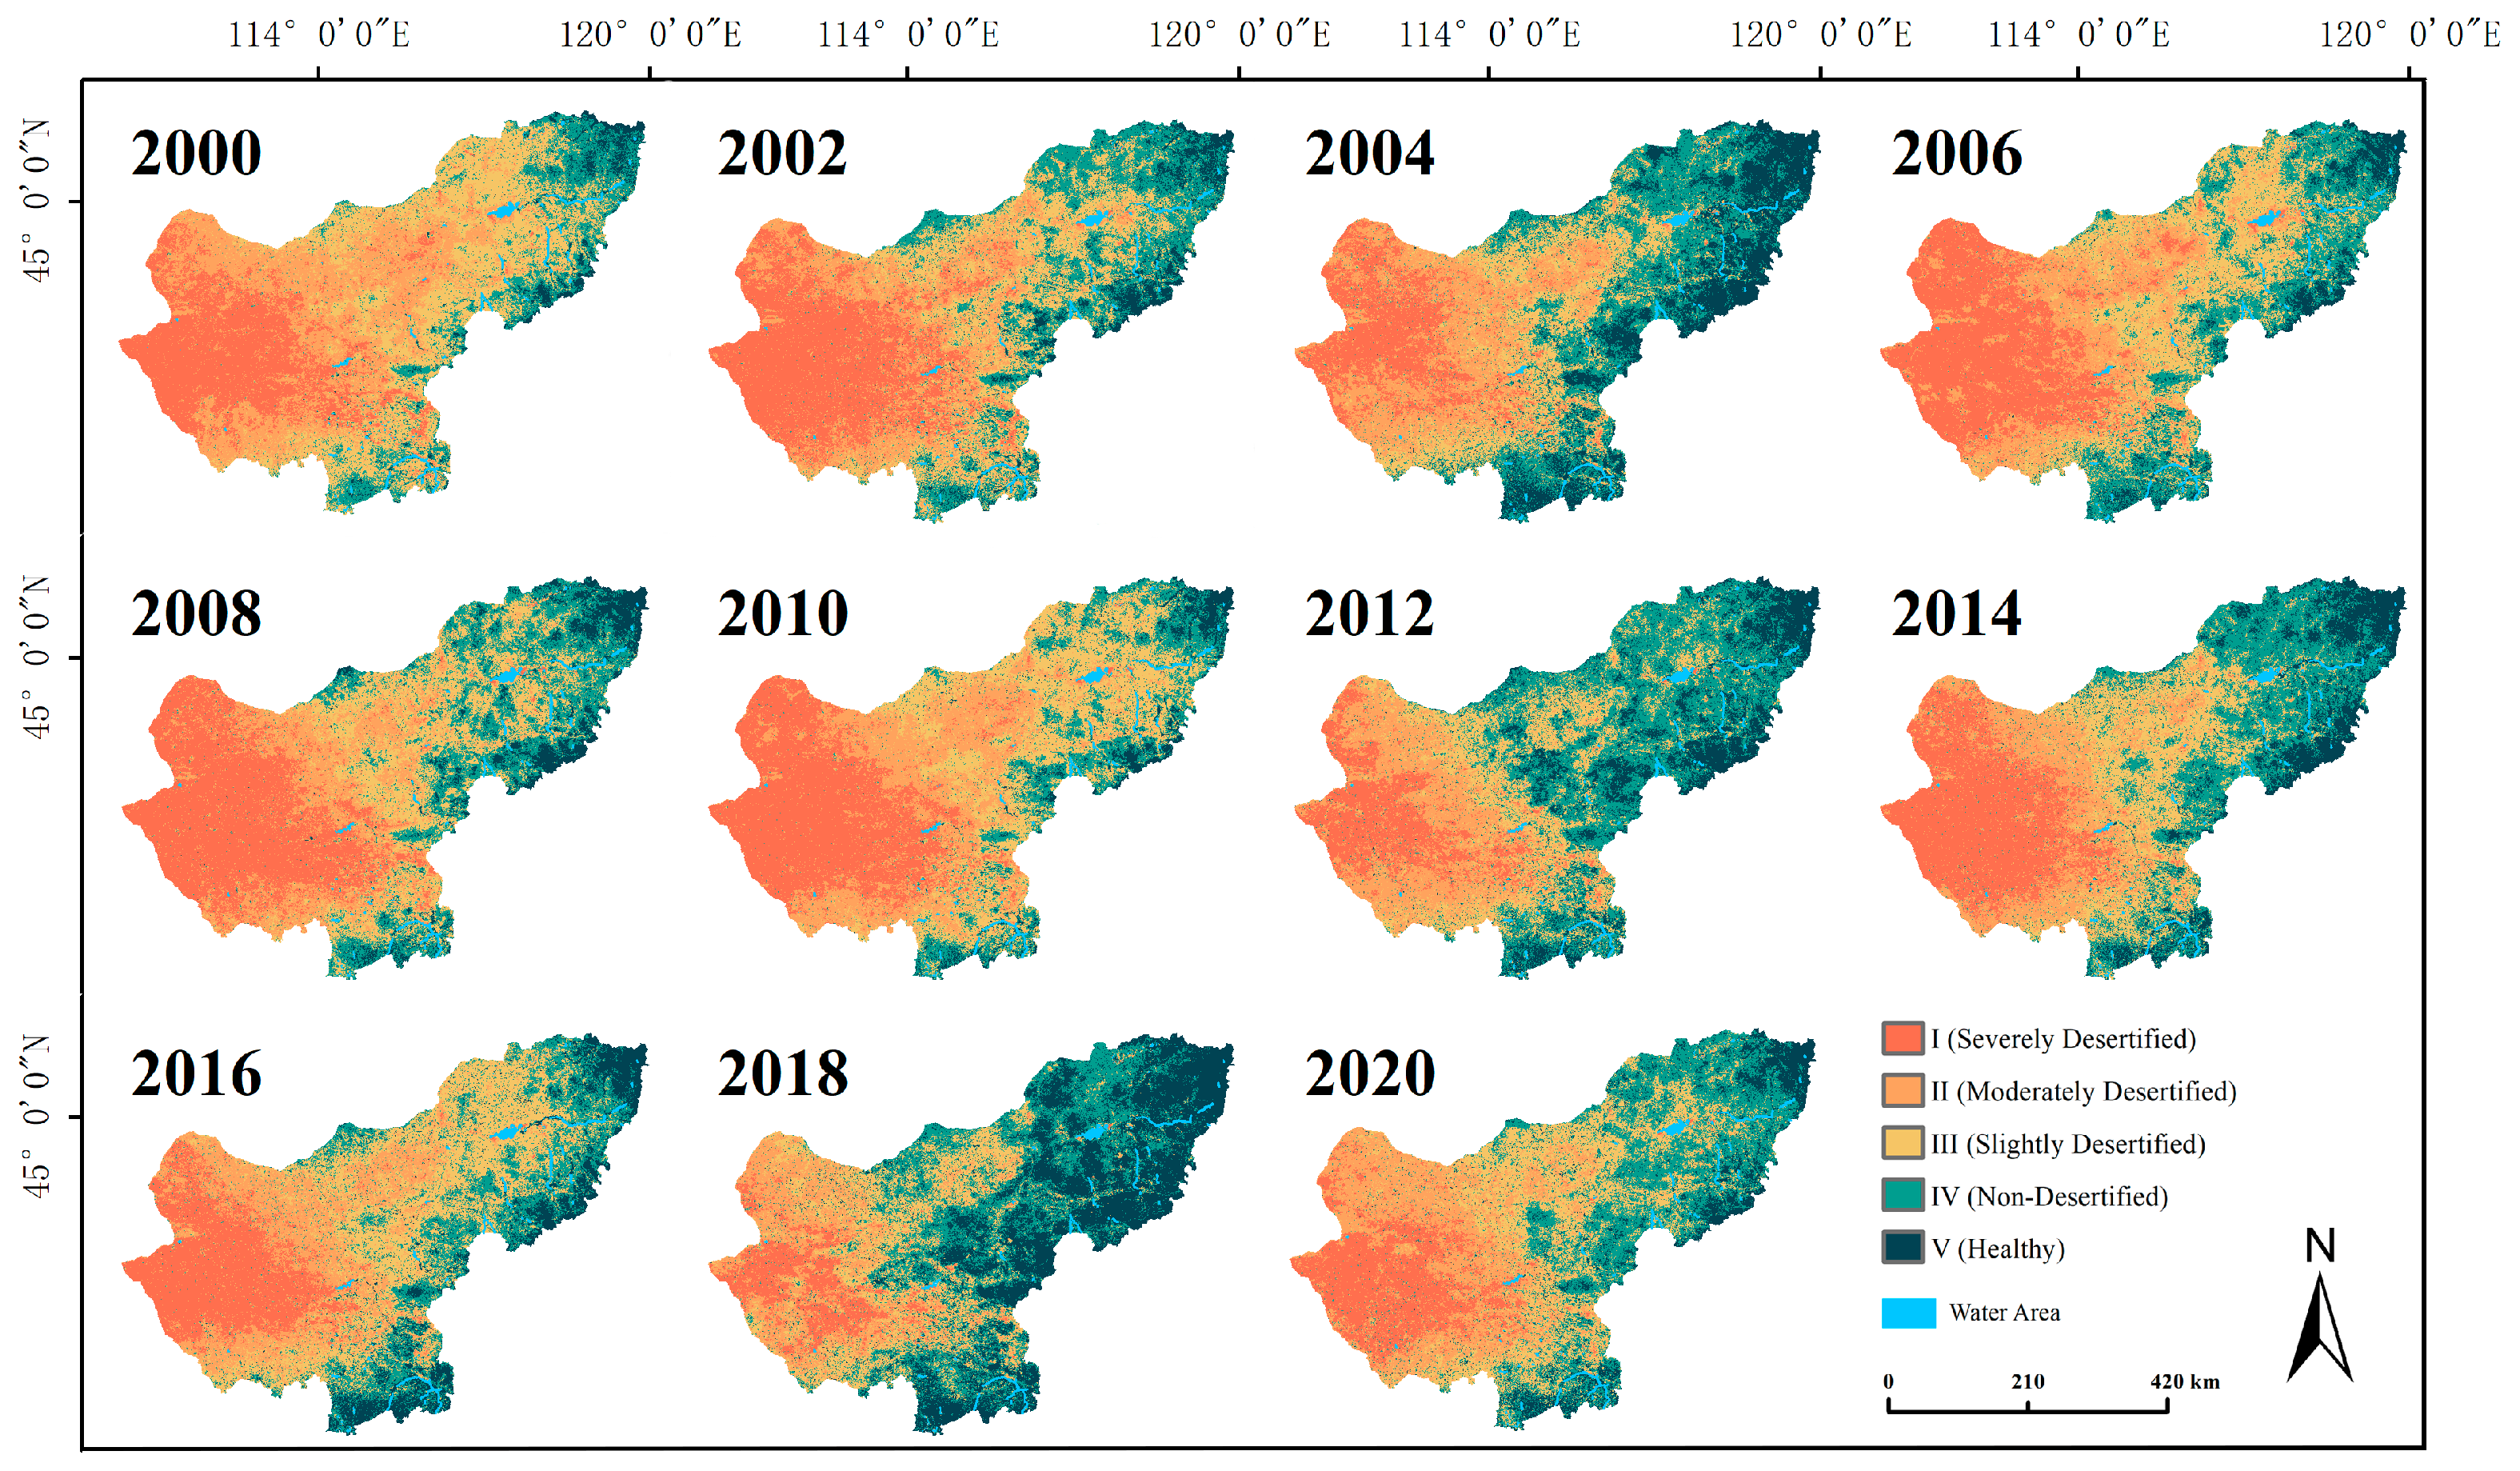
3.1. Analysis of DDI Distribution and Spatiotemporal Trends
3.1.1. Spatiotemporal Distribution Characteristics of DDI
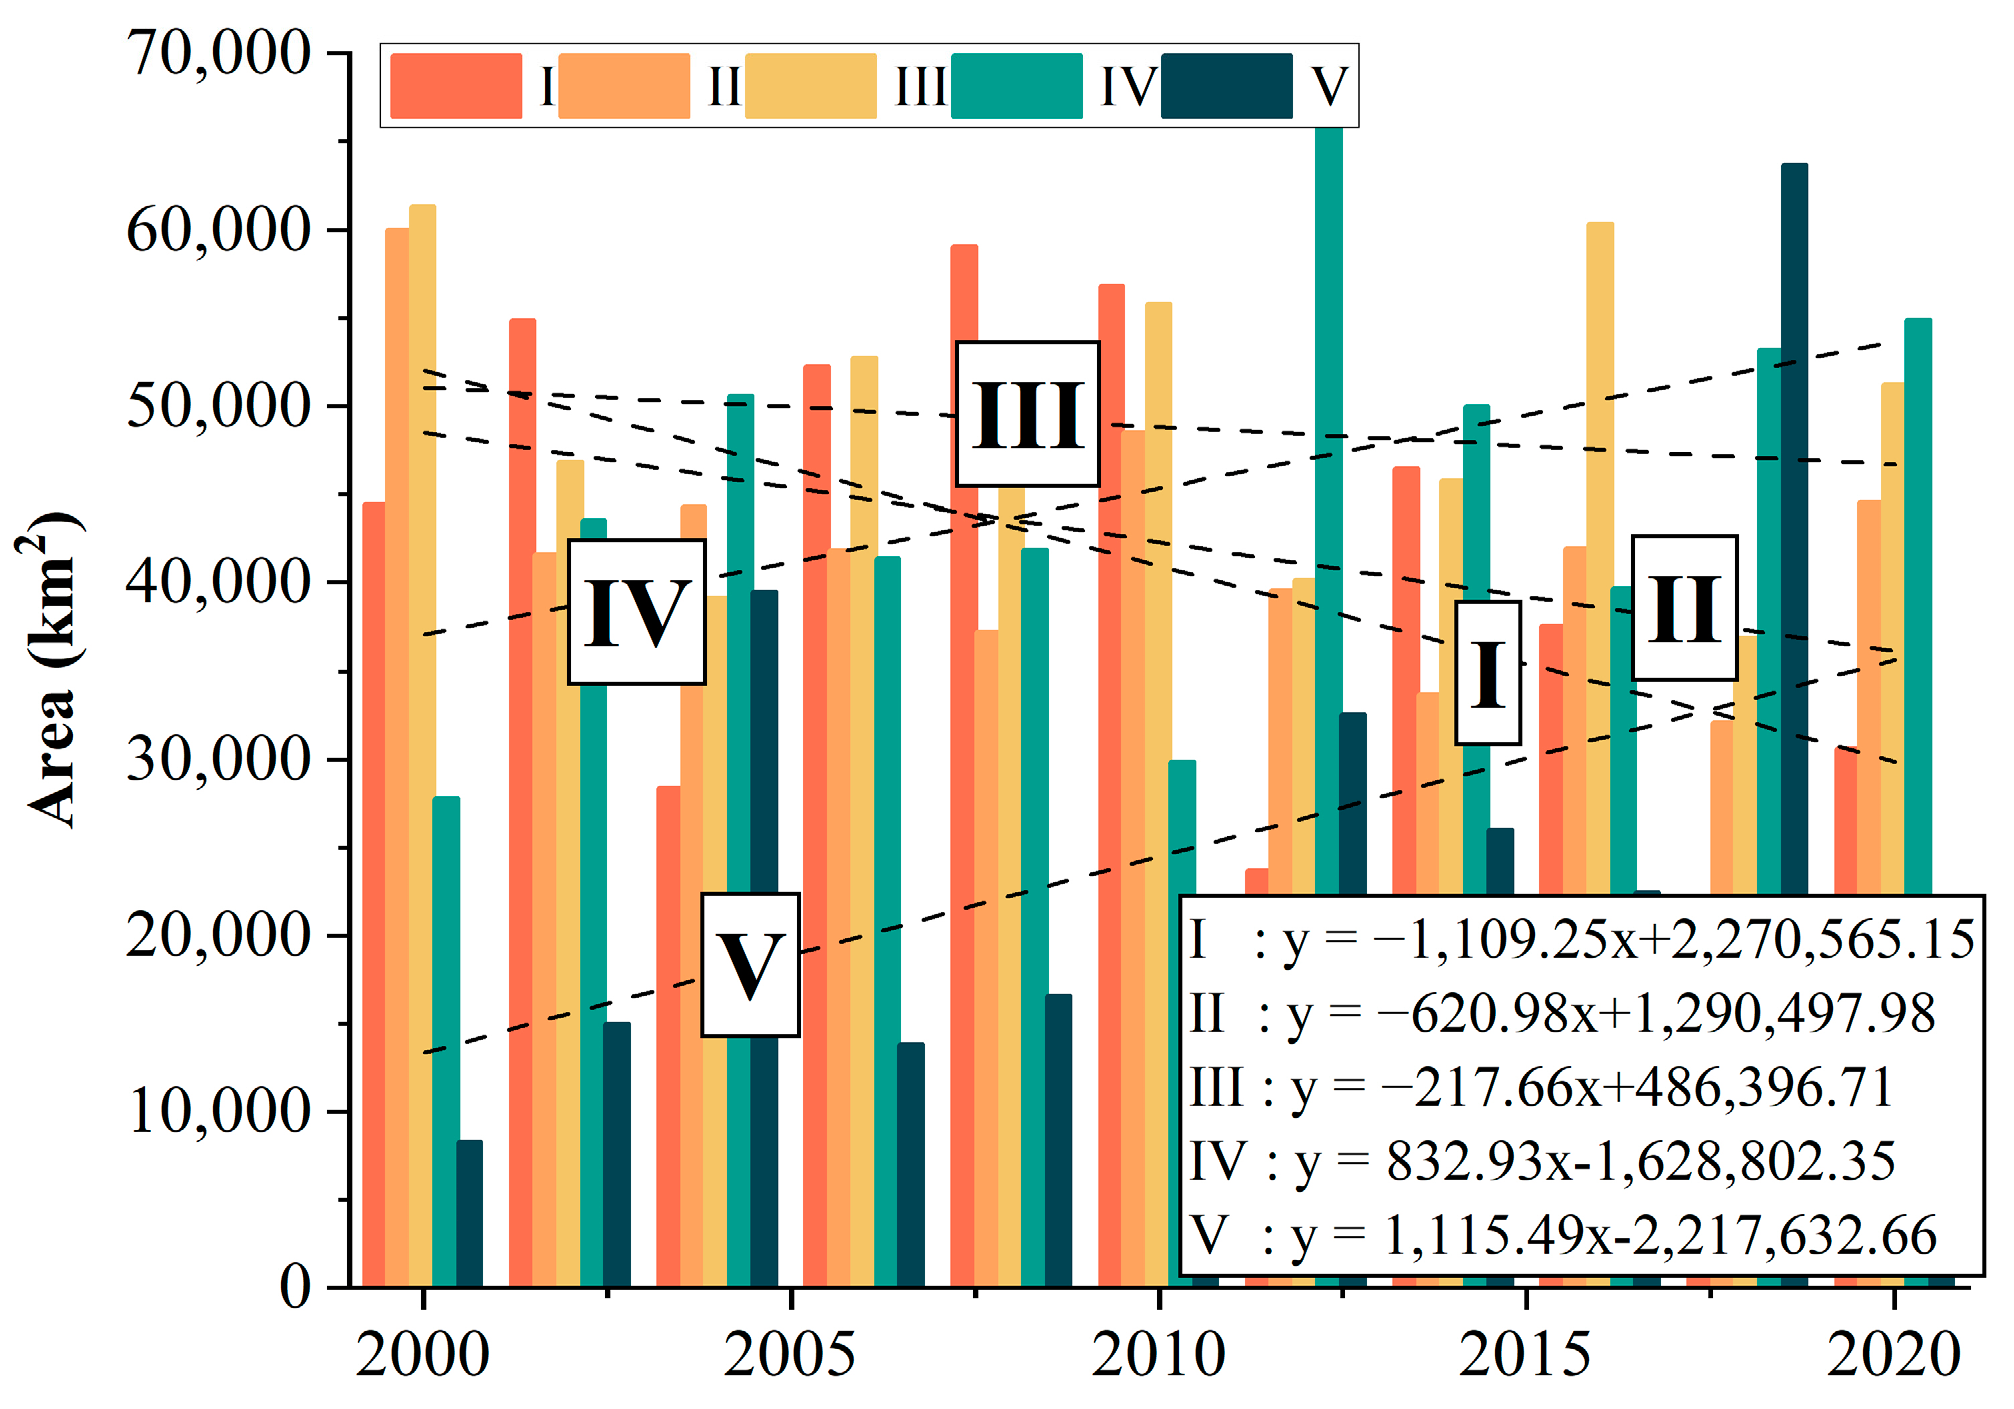
3.1.2. Spatiotemporal Variation of DGL
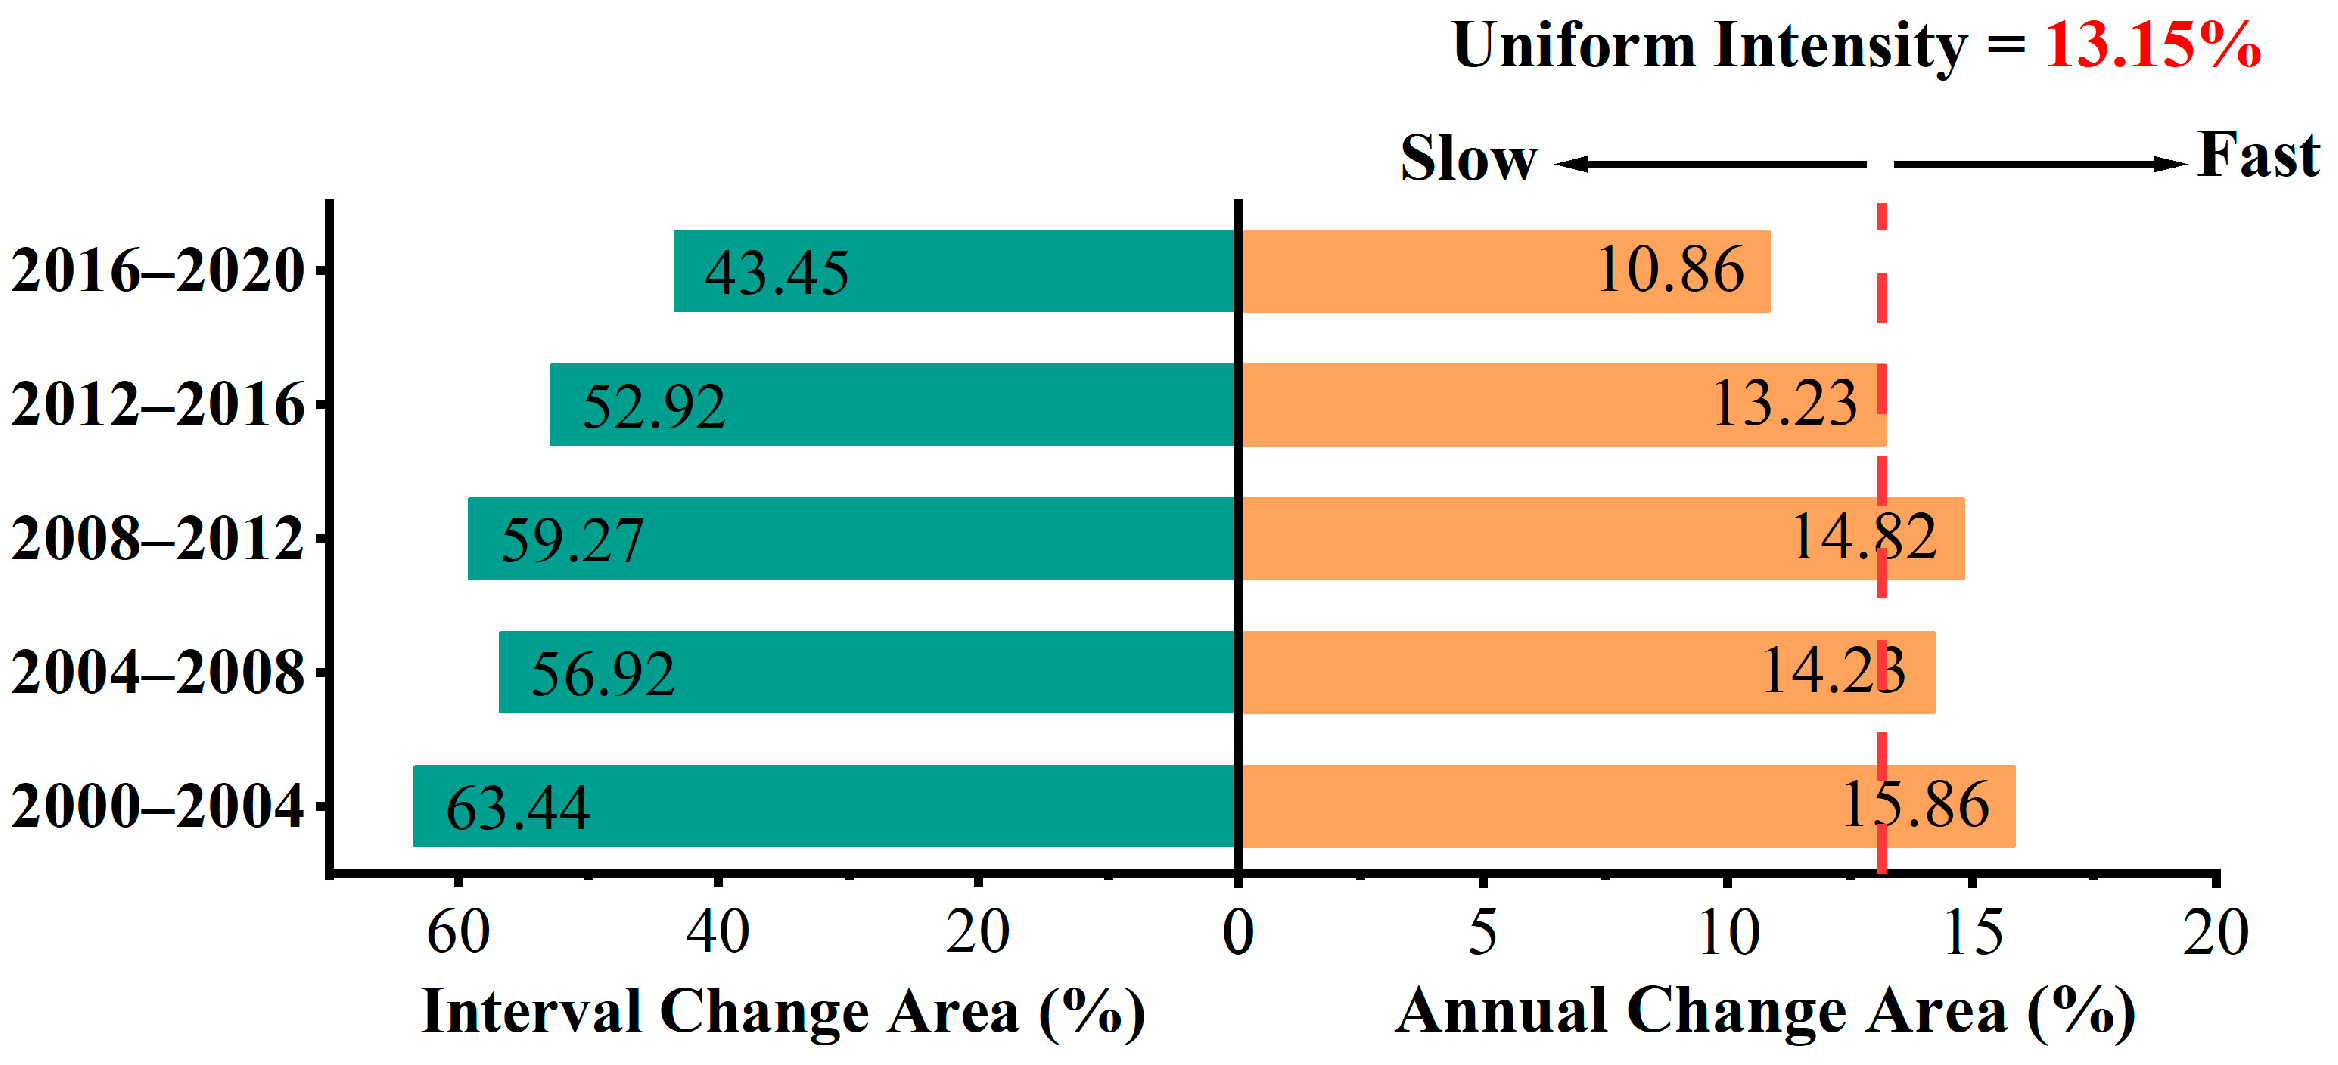
3.2. Intensity Analysis
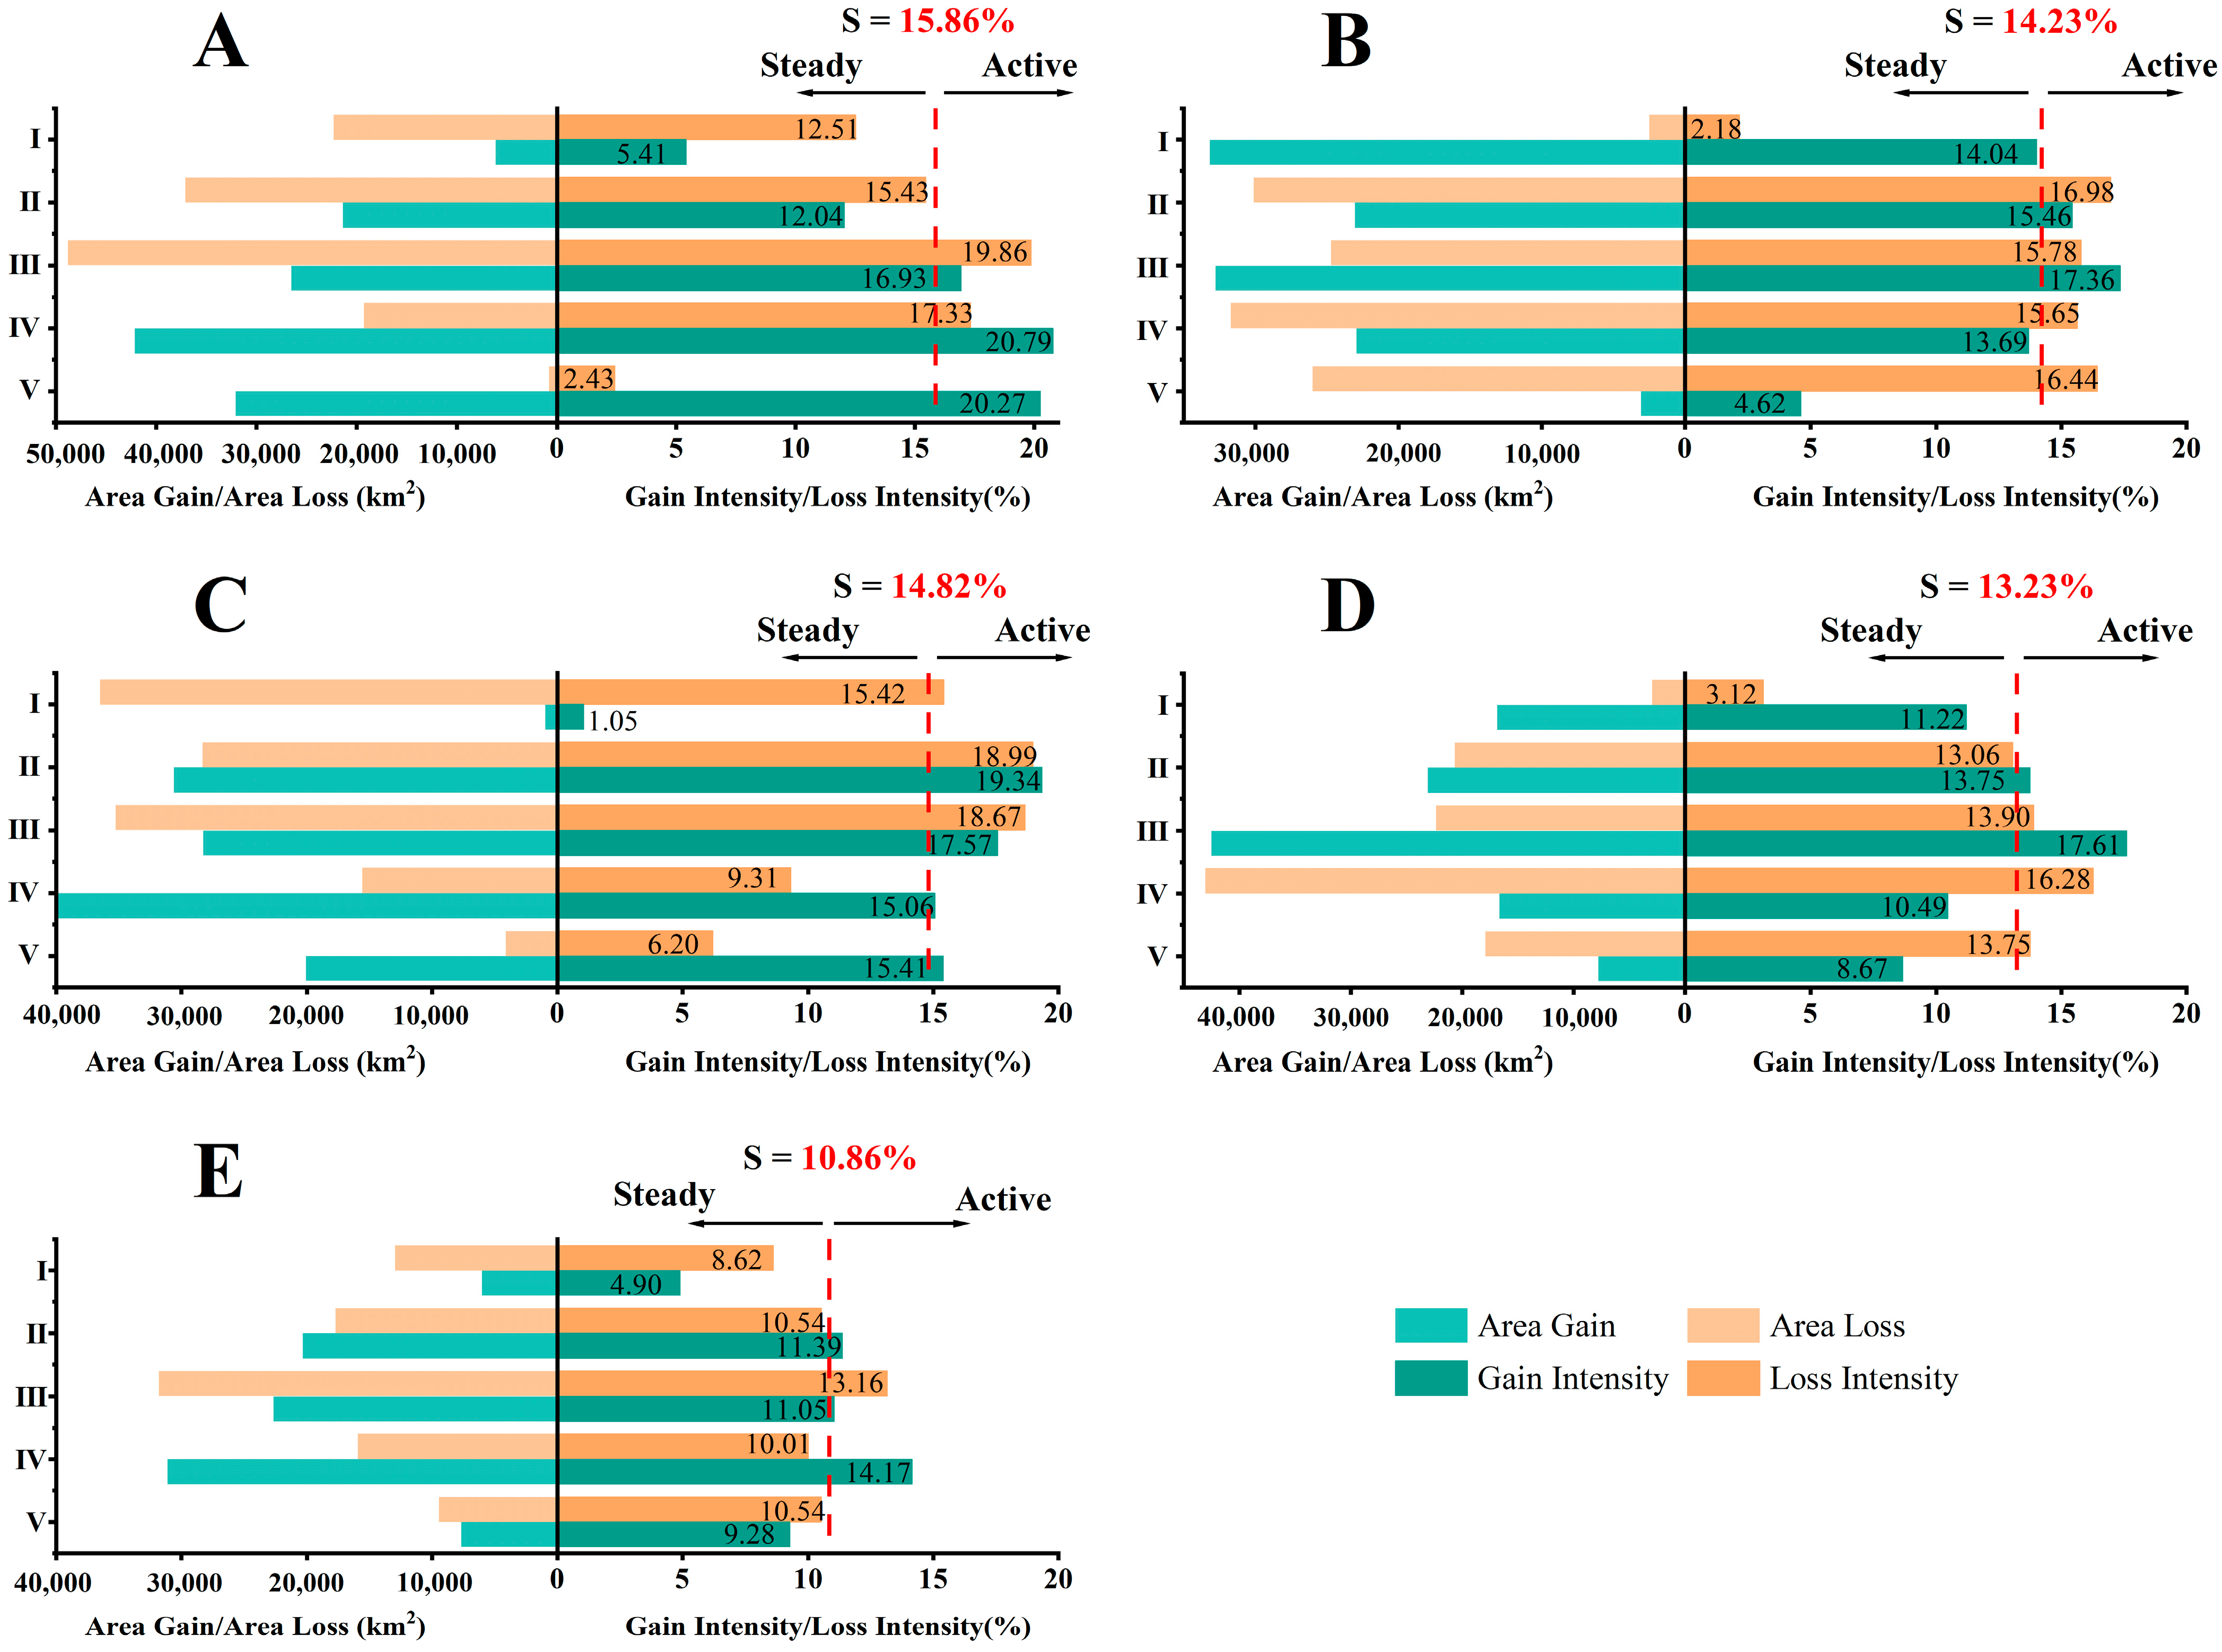
3.2.1. Interval Level
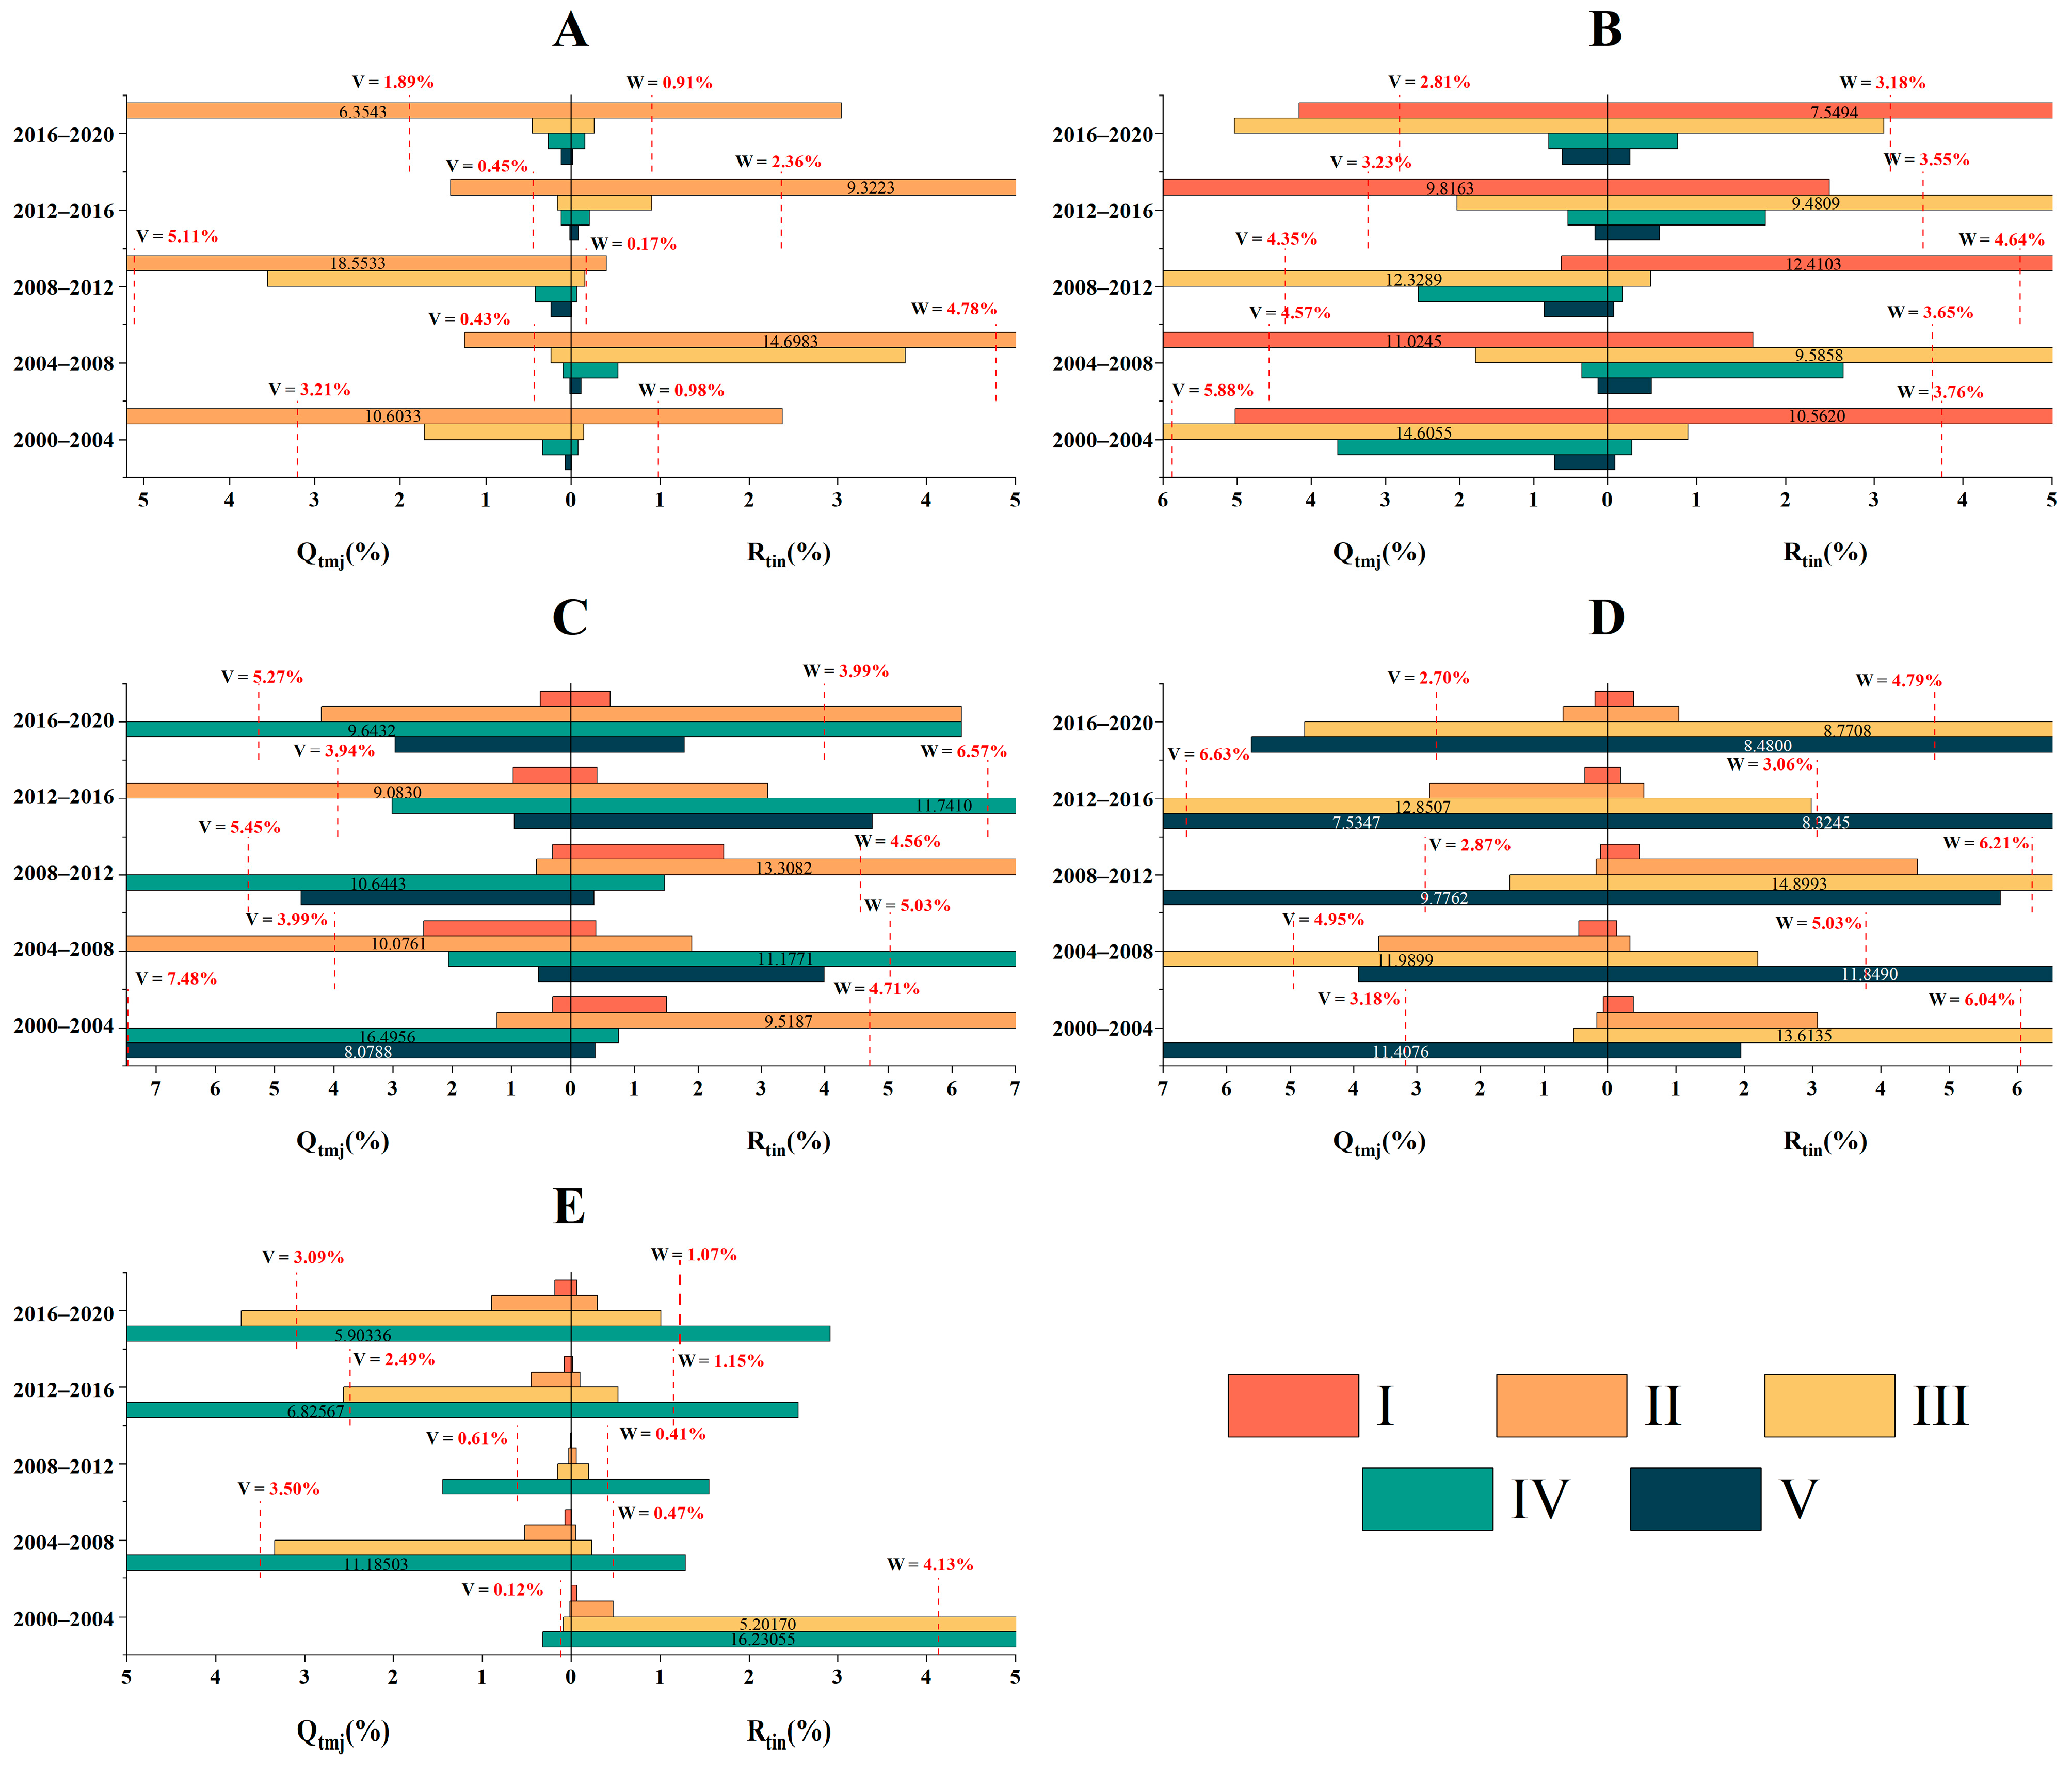
3.2.2. Category Level
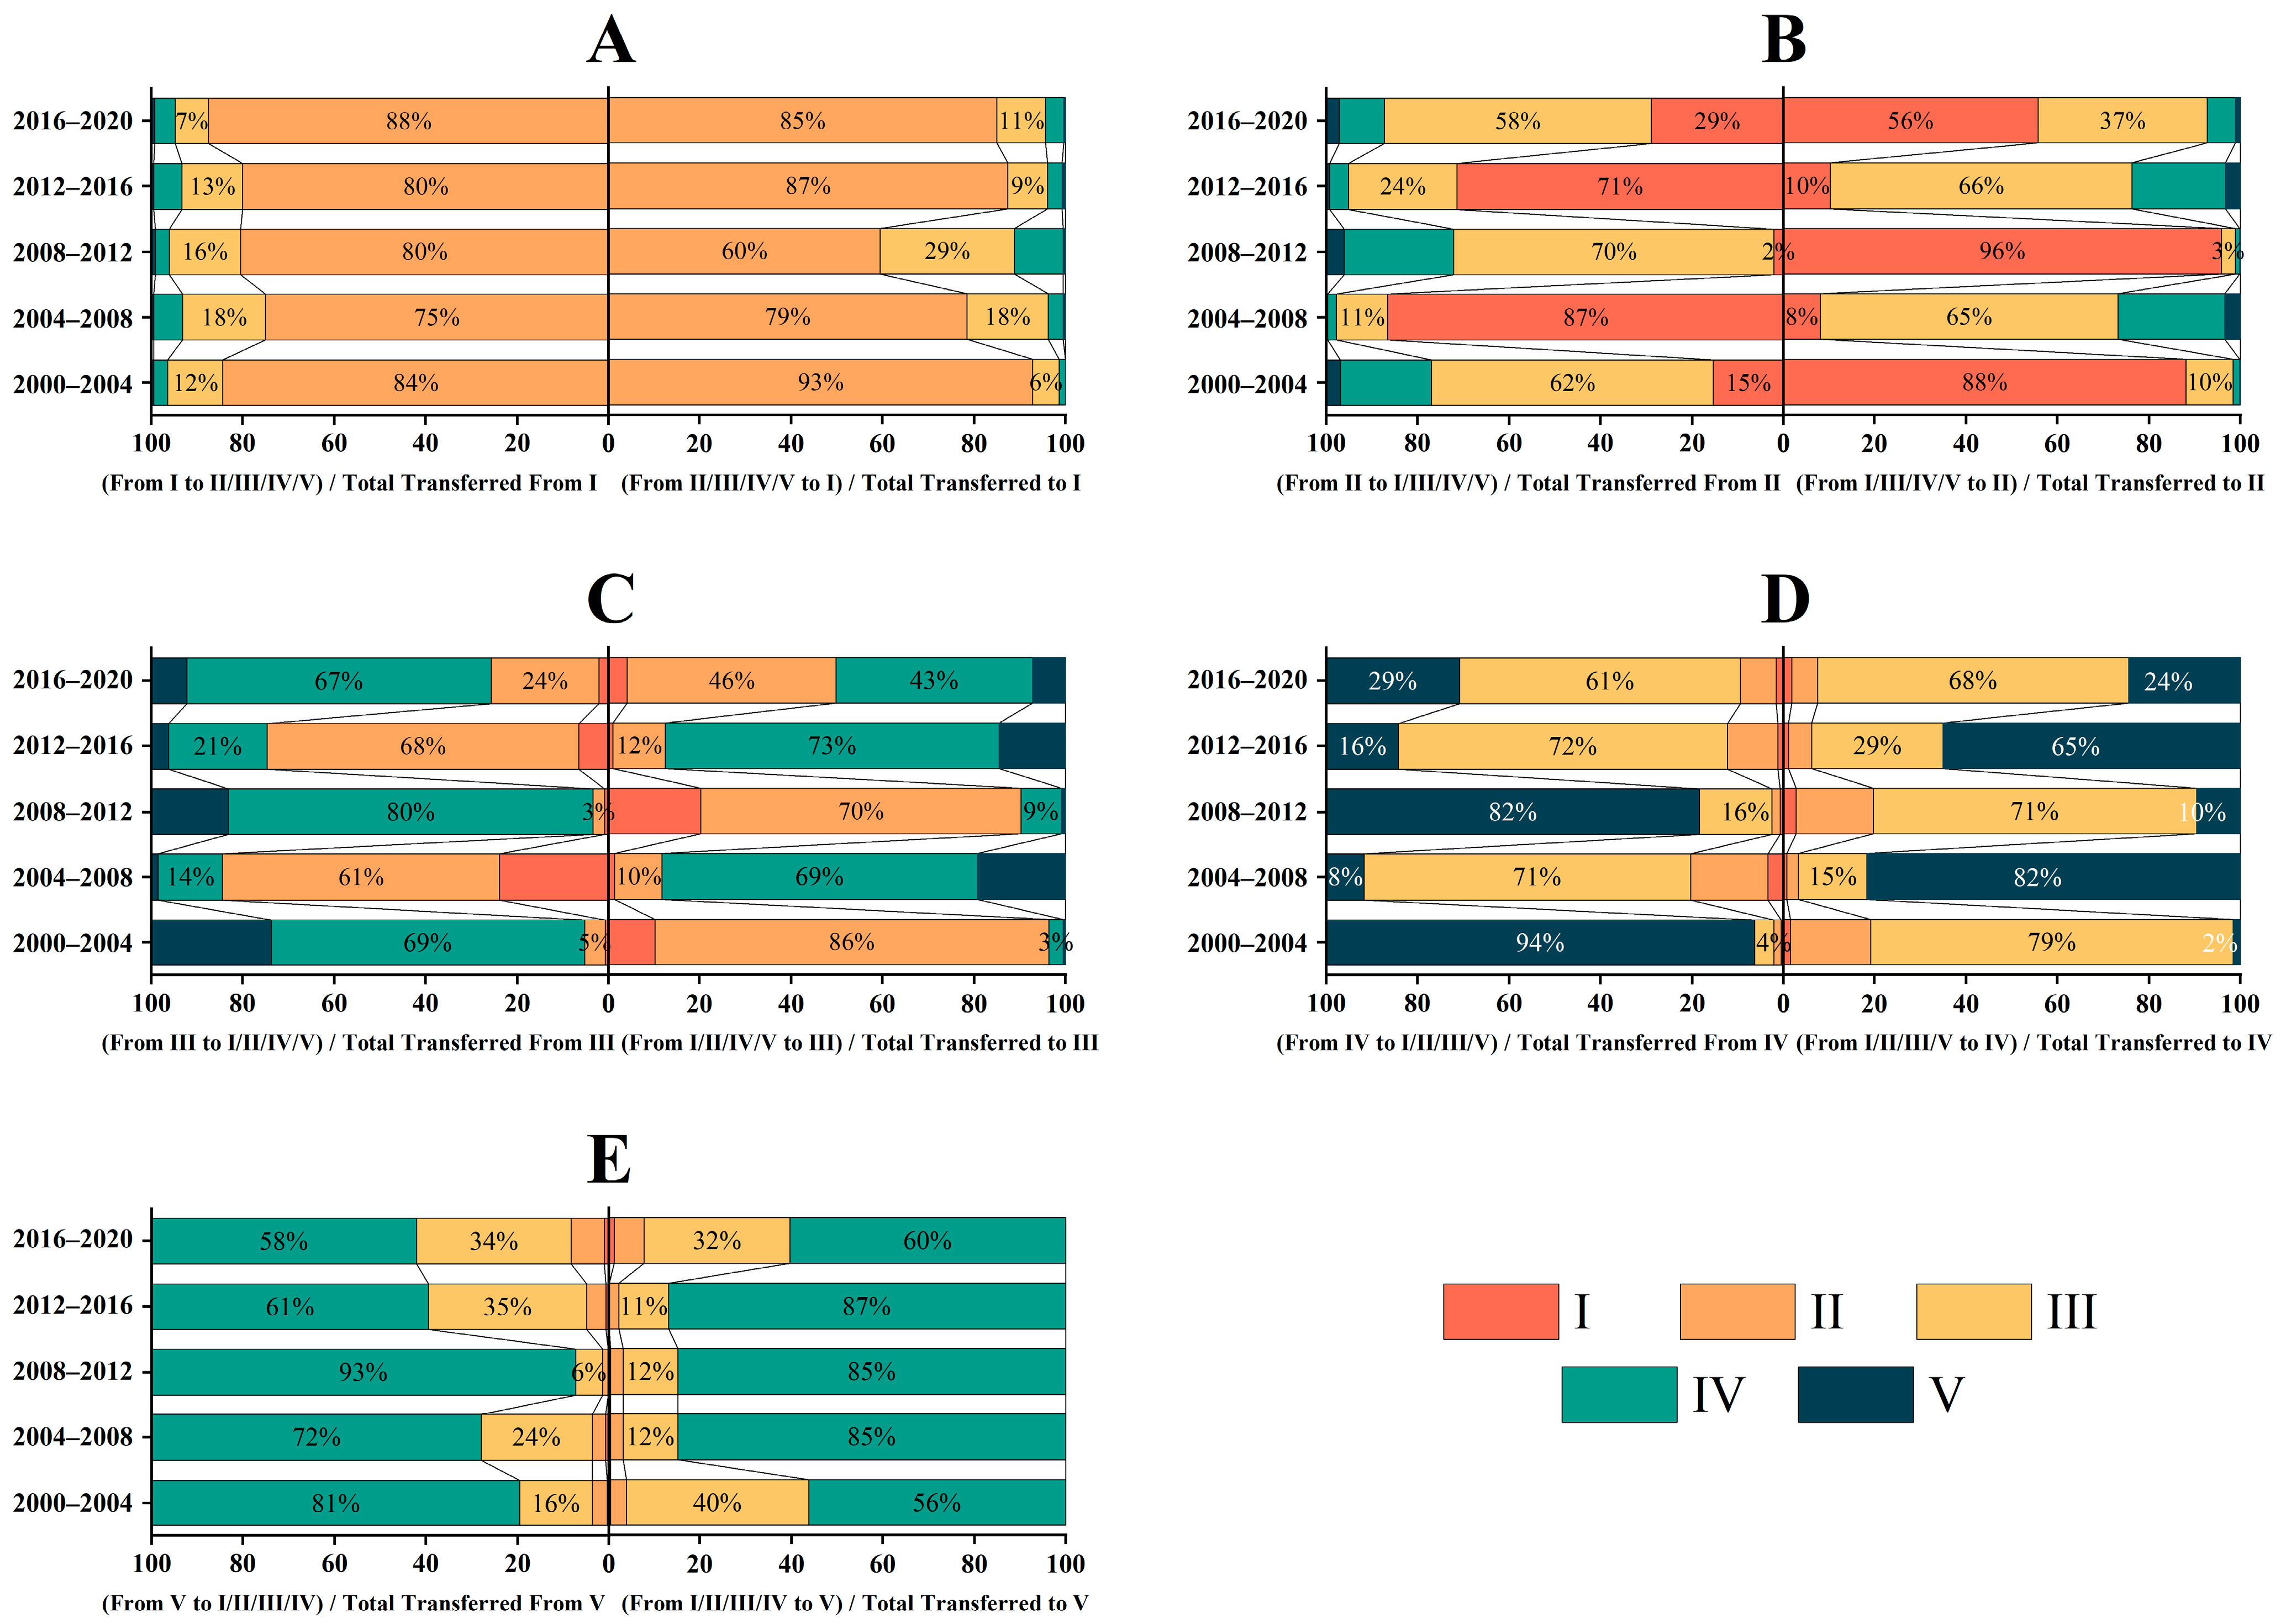
3.2.3. Transition Level
3.3. Driving Factors of Grassland Desertification
3.3.1. Driving Factors of DDI Spatial Distribution
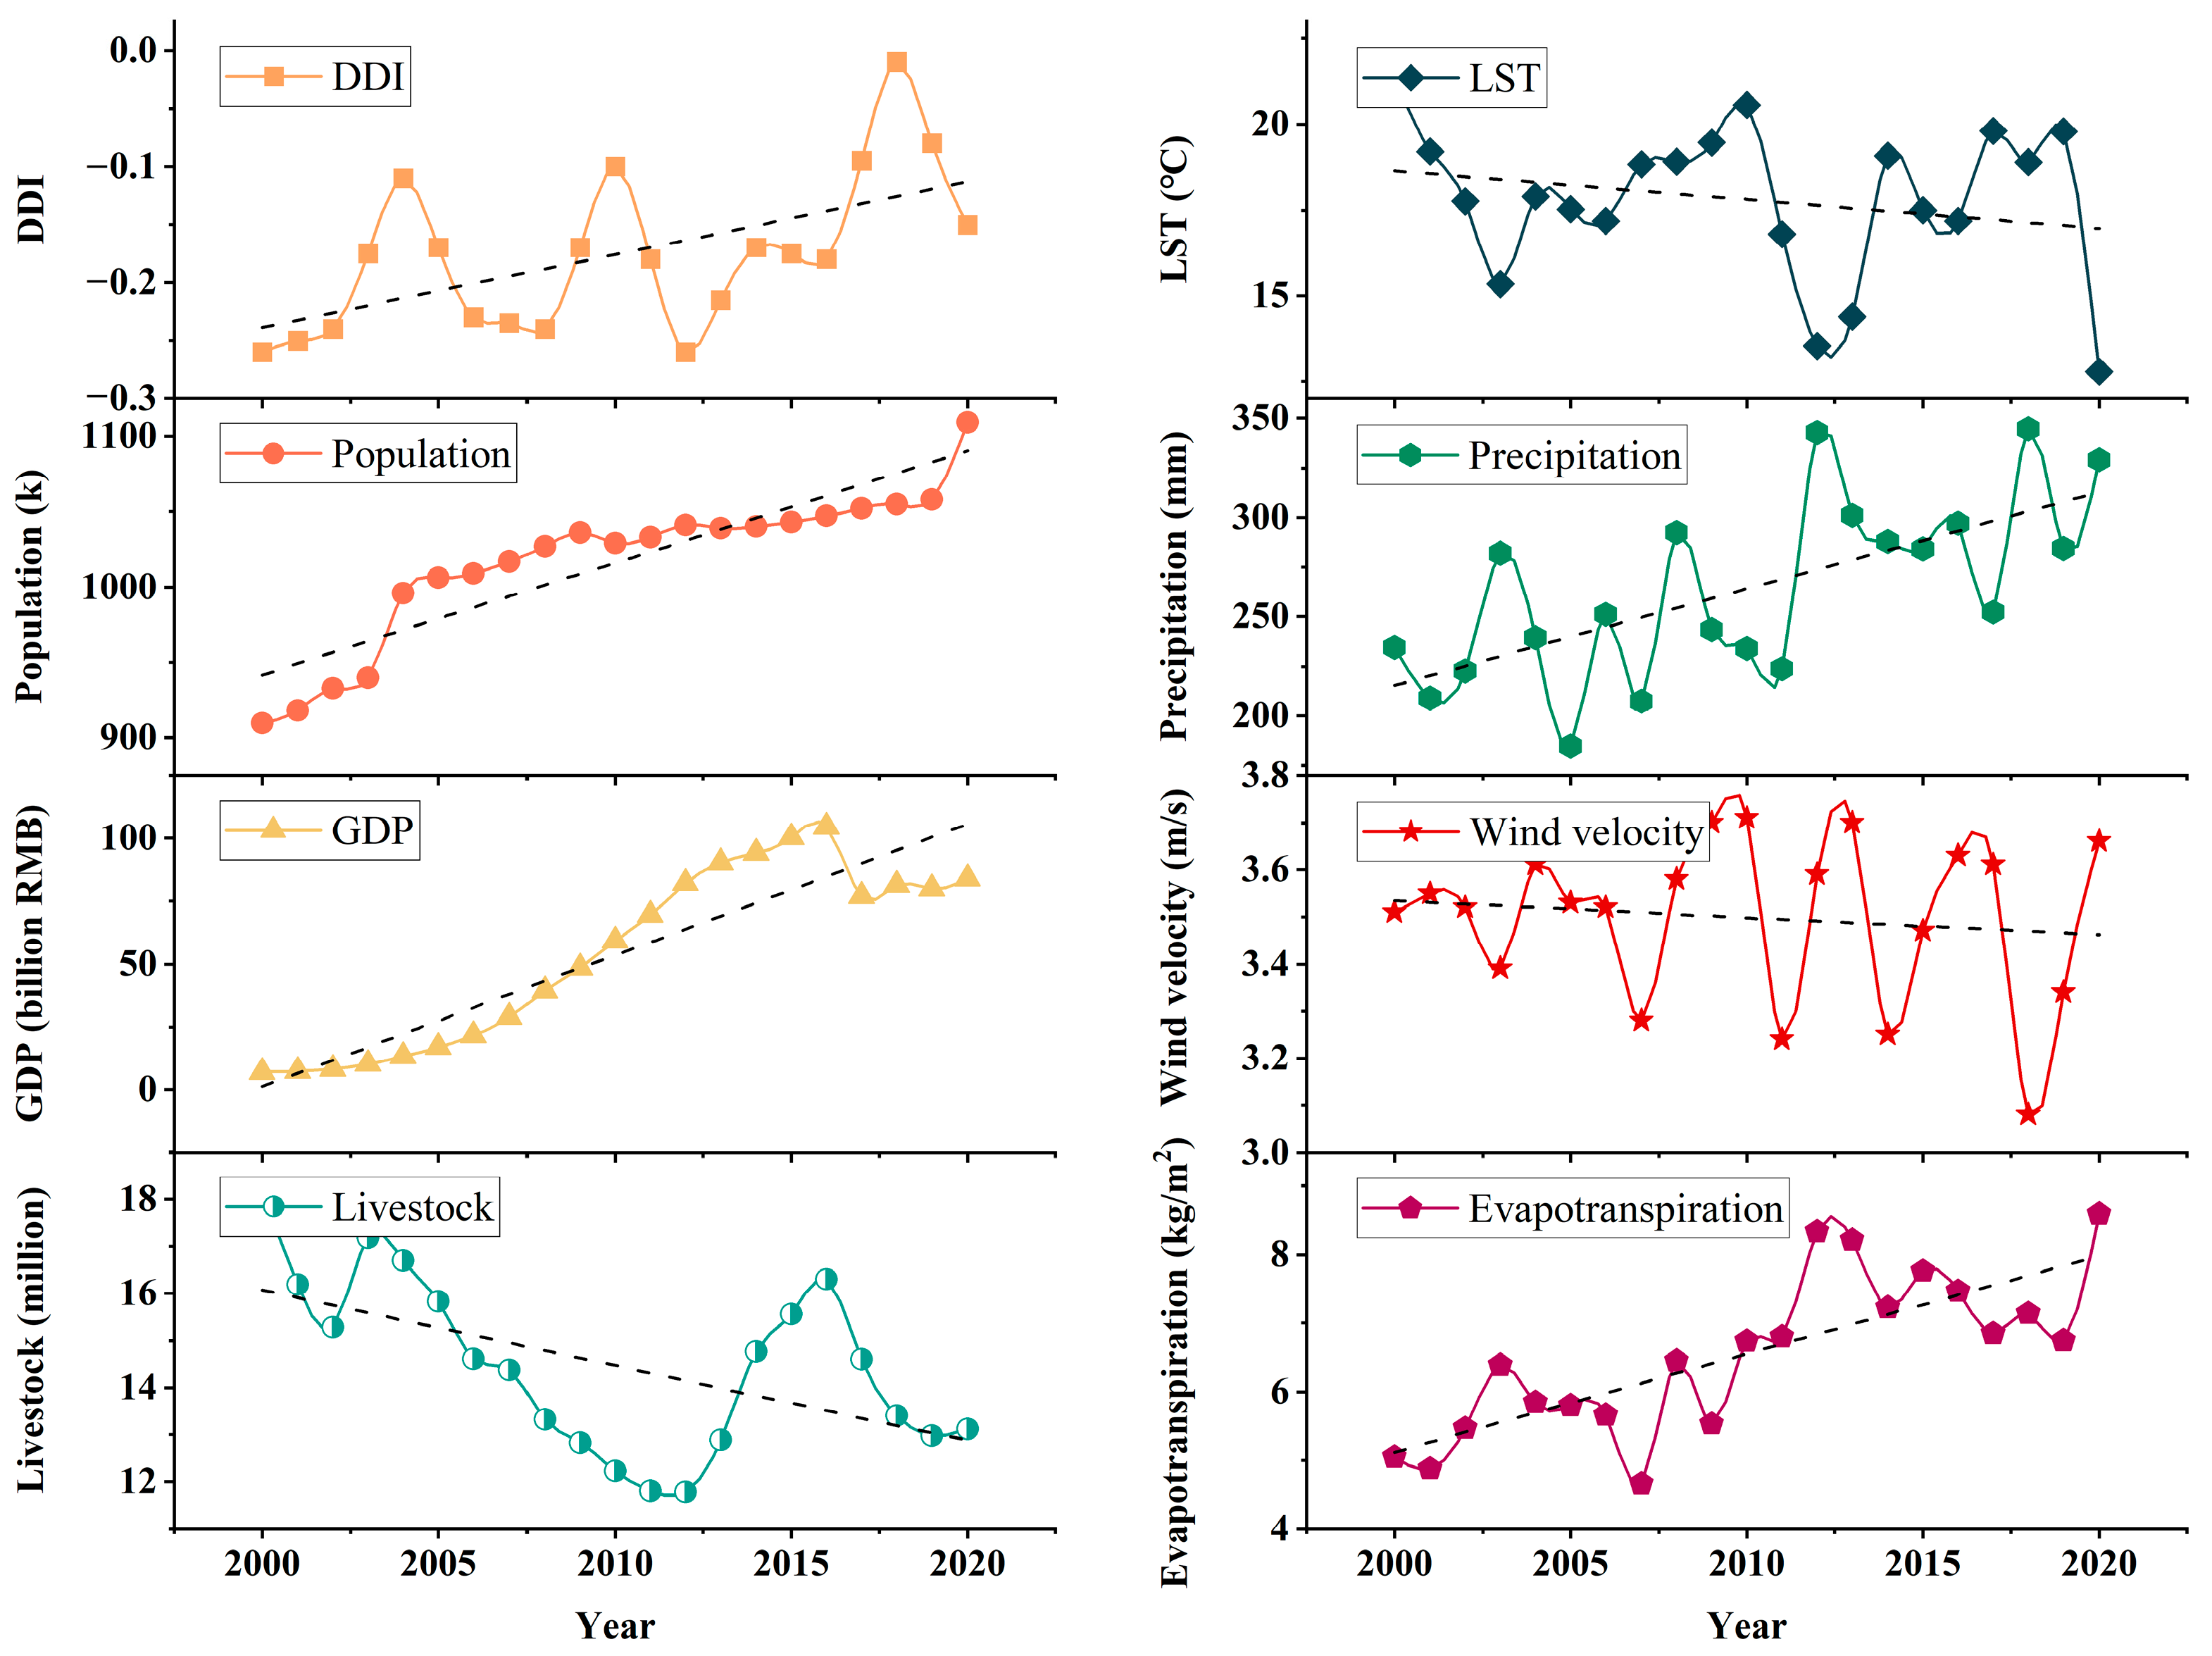
3.3.2. Driving Factors of DDI Temporal Variation
4. Discussion
4.1. Dynamics of Grassland Desertification in Xilingol
4.2. Driving Factors of Grassland Desertification in Xilingol
4.3. Limitations and Future Work
4.4. Contributions and Significance
5. Conclusions
Supplementary Materials
Author Contributions
Funding
Data Availability Statement
Acknowledgments
Conflicts of Interest
References
- UNCCD. United Nations Convention to Combat Desertification in Those Countries Experiencing Serious Drought and/or Desertification, Particularly in Africa; UN: Paris, France, 1994. [Google Scholar]
- Grainger, A. The Threatening Desert: Controlling Desertification; Routledge: London, UK, 2013. [Google Scholar]
- Feng, Q.; Tian, Y.; Yu, T.; Yin, Z.; Cao, S. Combating desertification through economic development in northwestern China. Land Degrad. Dev. 2019, 30, 910–917. [Google Scholar] [CrossRef]
- Liang, X.; Li, P.; Wang, J.; Shun Chan, F.K.; Togtokh, C.; Ochir, A.; Davaasuren, D. Research Progress of Desertification and Its Prevention in Mongolia. Sustainability 2021, 13, 6861. [Google Scholar] [CrossRef]
- National Forestry and Grassland Administration. Combating Desertification. Available online: https://www.forestry.gov.cn/main/6193/20220302/153916629457788.html (accessed on 6 October 2023).
- Tu, Z.; Li, M.; Sun, T. The Status and Trend Analysis of Desertification and Sandification. For. Resour. Manag. 2016, 1, 1–5+13. [Google Scholar] [CrossRef]
- Wang, Y. Building a Beautiful China Should Pay Attention to Grassland Ecological Governance and Protection. Available online: https://paper.cntheory.com/html/2020-10/07/nw.D110000xxsb_20201007_1-A7.htm (accessed on 7 October 2023).
- Reynolds, J.F.; Smith, D.M.S.; Lambin, E.F.; Turner, B.; Mortimore, M.; Batterbury, S.P.; Downing, T.E.; Dowlatabadi, H.; Fernández, R.J.; Herrick, J.E. Global desertification: Building a science for dryland development. Science 2007, 316, 847–851. [Google Scholar] [CrossRef] [PubMed]
- Kapfer, J.; Hédl, R.; Jurasinski, G.; Kopecký, M.; Schei, F.H.; Grytnes, J.A. Resurveying historical vegetation data–opportunities and challenges. Appl. Veg. Sci. 2017, 20, 164–171. [Google Scholar] [CrossRef]
- Wulder, M.A.; White, J.C.; Goward, S.N.; Masek, J.G.; Irons, J.R.; Herold, M.; Cohen, W.B.; Loveland, T.R.; Woodcock, C.E. Landsat continuity: Issues and opportunities for land cover monitoring. Remote Sens. Environ. 2008, 112, 955–969. [Google Scholar] [CrossRef]
- Rogan, J.; Chen, D. Remote sensing technology for mapping and monitoring land-cover and land-use change. Prog. Plan. 2004, 61, 301–325. [Google Scholar] [CrossRef]
- Feng, K.; Wang, T.; Liu, S.; Kang, W.; Chen, X.; Guo, Z.; Zhi, Y. Monitoring desertification using machine-learning techniques with multiple indicators derived from MODIS images in Mu Us Sandy Land, China. Remote Sens. 2022, 14, 2663. [Google Scholar] [CrossRef]
- Zeng, Y.; Xiang, N.; Feng, Z.; Xu, H. Albedo-NDVI Space and Remote Sensing Synthesis Index Models for Desertification Monitoring. Sci. Geogr. Sin. 2006, 26, 75–81. [Google Scholar] [CrossRef]
- Xie, Y.H.; Li, Z.H.; Zhu, L.; Zhou, Y.J.; Liu, H.Y.; Yu, T. Dynamic monitoring of desertification in response to climatic factors: A case study from the Gelintan Oasis on the southeastern edge of the Tengger Desert, China. Geocarto Int. 2022, 37, 9453–9473. [Google Scholar] [CrossRef]
- Wei, H.; Wang, J.; Han, B. Desertification Information Extraction Along the China–Mongolia Railway Supported by Multisource Feature Space and Geographical Zoning Modeling. IEEE J. Sel. Top. Appl. Earth Obs. Remote Sens. 2020, 13, 392–402. [Google Scholar] [CrossRef]
- Wei, H.; Wang, J.; Cheng, K.; Li, G.; Ochir, A.; Davaasuren, D.; Chonokhuu, S. Desertification Information Extraction Based on Feature Space Combinations on the Mongolian Plateau. Remote Sens. 2018, 10, 1614. [Google Scholar] [CrossRef]
- Li, Y.S.; Li, H.K.; Xu, F. Spatiotemporal changes in desertified land in rare earth mining areas under different disturbance conditions. Environ. Sci. Pollut. Res. 2021, 28, 30323–30334. [Google Scholar] [CrossRef] [PubMed]
- Feng, Y.Y.; Wang, S.H.; Zhao, M.S.; Zhou, L.M. Monitoring of Land Desertification Changes in Urat Front Banner from 2010 to 2020 Based on Remote Sensing Data. Water 2022, 14, 1777. [Google Scholar] [CrossRef]
- Becerril-Pina, R.; Diaz-Delgado, C.; Mastachi-Loza, C.A.; Gonzalez-Sosa, E. Integration of remote sensing techniques for monitoring desertification in Mexico. Hum. Ecol. Risk Assess. 2016, 22, 1323–1340. [Google Scholar] [CrossRef]
- Wang, Z.; Liu, C.; Alfredo, H. From AVHRR-NDVI to MODIS-EVI: Advances in vegetation index research. Acta Ecol. Sin. 2003, 23, 979–987. [Google Scholar] [CrossRef]
- Shang, X.; He, Z.; Zhang, T. Spatial and temporal variations and the driving mechanism of the enhanced vegetation index. J. For. Environ. 2020, 40, 478–485. [Google Scholar] [CrossRef]
- Li, Y.; Tao, C.; Zhao, Q. A Remote Sensing Classification Method of Land Desertification Based on EVI-Albedo Space. Remote Sens. Inf. 2022, 37, 8–14. [Google Scholar]
- Zhao, X.; Zhou, D.; Fang, J. Satellite-based studies on large-scale vegetation changes in China. J. Integr. Plant Biol. 2012, 54, 713–728. [Google Scholar] [CrossRef]
- Feng, Q.; Ma, H.; Jiang, X.; Wang, X.; Cao, S. What Has Caused Desertification in China? Sci. Rep. 2015, 5, 15998. [Google Scholar] [CrossRef]
- Zhu, L.; Meng, J.; Zhu, L. Applying Geodetector to disentangle the contributions of natural and anthropogenic factors to NDVI variations in the middle reaches of the Heihe River Basin. Ecol. Indic. 2020, 117, 106545. [Google Scholar] [CrossRef]
- Na, R.; Du, H.; Na, L.; Shan, Y.; He, H.S.; Wu, Z.; Zong, S.; Yang, Y.; Huang, L. Spatiotemporal changes in the Aeolian desertification of Hulunbuir Grassland and its driving factors in China during 1980–2015. Catena 2019, 182, 104123. [Google Scholar] [CrossRef]
- Zhou, W.; Yang, H.; Huang, L.; Chen, C.; Lin, X.; Hu, Z.; Li, J. Grassland degradation remote sensing monitoring and driving factors quantitative assessment in China from 1982 to 2010. Ecol. Indic. 2017, 83, 303–313. [Google Scholar] [CrossRef]
- Han, J.; Wang, J.; Chen, L.; Xiang, J.; Ling, Z.; Li, Q.; Wang, E. Driving factors of desertification in Qaidam Basin, China: An 18-year analysis using the geographic detector model. Ecol. Indic. 2021, 124, 107404. [Google Scholar] [CrossRef]
- Wang, F.; Gou, R.; Qi, G.; Wang, S.; Li, B.; Guo, X. Effect of Climate Change on Desertification in Qaidamu Basin. Arid Meteorol. 2007, 25, 28–33. [Google Scholar] [CrossRef]
- Han, J.; Dai, H.; Gu, Z. Sandstorms and desertification in Mongolia, an example of future climate events: A review. Environ. Chem. Lett. 2021, 19, 4063–4073. [Google Scholar] [CrossRef] [PubMed]
- Jiang, L.; Jiapaer, G.; Bao, A.; Kurban, A.; Guo, H.; Zheng, G.; De Maeyer, P. Monitoring the long-term desertification process and assessing the relative roles of its drivers in Central Asia. Ecol. Indic. 2019, 104, 195–208. [Google Scholar] [CrossRef]
- Wang, X.; Chen, F.; Hasi, E.; Li, J. Desertification in China: An assessment. Earth-Sci. Rev. 2008, 88, 188–206. [Google Scholar] [CrossRef]
- Ibáñez, J.; Martínez, J.; Schnabel, S. Desertification due to overgrazing in a dynamic commercial livestock–grass–soil system. Ecol. Model. 2007, 205, 277–288. [Google Scholar] [CrossRef]
- Hilker, T.; Natsagdorj, E.; Waring, R.H.; Lyapustin, A.; Wang, Y. Satellite observed widespread decline in Mongolian grasslands largely due to overgrazing. Glob. Chang. Biol. 2014, 20, 418–428. [Google Scholar] [CrossRef]
- D’Odorico, P.; Bhattachan, A.; Davis, K.F.; Ravi, S.; Runyan, C.W. Global desertification: Drivers and feedbacks. Adv. Water Resour. 2013, 51, 326–344. [Google Scholar] [CrossRef]
- Freier, K.P.; Schneider, U.A.; Finckh, M. Dynamic interactions between vegetation and land use in semi-arid Morocco: Using a Markov process for modeling rangelands under climate change. Agric. Ecosyst. Environ. 2011, 140, 462–472. [Google Scholar] [CrossRef]
- Vieira, R.M.D.; Tomasella, J.; Barbosa, A.A.; Martins, M.A.; Rodriguez, D.A.; Rezende, F.S.; Carriello, F.; Santana, M.D. Desertification risk assessment in Northeast Brazil: Current trends and future scenarios. Land Degrad. Dev. 2021, 32, 224–240. [Google Scholar] [CrossRef]
- Xu, D.; Song, A.; Tong, H.; Ren, H.; Hu, Y.; Shao, Q. A spatial system dynamic model for regional desertification simulation–A case study of Ordos, China. Environ. Model. Softw. 2016, 83, 179–192. [Google Scholar] [CrossRef]
- Yang, Z.W.; Gao, X.; Lei, J.Q.; Meng, X.Y.; Zhou, N. Analysis of spatiotemporal changes and driving factors of desertification in the Africa Sahel. Catena 2022, 213, 106213. [Google Scholar] [CrossRef]
- Wang, Y.; Guo, E.; Kang, Y.; Ma, H. Assessment of Land Desertification and Its Drivers on the Mongolian Plateau Using Intensity Analysis and the Geographical Detector Technique. Remote Sens. 2022, 14, 6365. [Google Scholar] [CrossRef]
- Qi, K.; Zhu, J.J.; Zheng, X.; Wang, G.G.; Li, M.C. Impacts of the world’s largest afforestation program (Three-North Afforestation Program) on desertification control in sandy land of China. GISci. Remote Sens. 2023, 60, 2167574. [Google Scholar] [CrossRef]
- Aldwaik, S.Z.; Pontius, R.G. Intensity analysis to unify measurements of size and stationarity of land changes by interval, category, and transition. Landsc. Urban Plan. 2012, 106, 103–114. [Google Scholar] [CrossRef]
- Qian, K.; Yuan, Q.Z.; Han, J.C.; Leng, R.; Wang, Y.S.; Zhu, K.H.; Lin, S.; Ren, P. A remote sensing monitoring method for alpine grasslands desertification in the eastern Qinghai-Tibetan Plateau. J. Mt. Sci. 2020, 17, 1423–1437. [Google Scholar] [CrossRef]
- Xu, M.R.; Zhang, J.; Li, Z.H.; Mo, Y. Attribution analysis and multi-scenario prediction of NDVI drivers in the Xilin Gol grassland, China. J. Arid Land 2022, 14, 941–961. [Google Scholar] [CrossRef]
- Li, H.; Yang, X. Temperate dryland vegetation changes under a warming climate and strong human intervention—With a particular reference to the district Xilin Gol, Inner Mongolia, China. Catena 2014, 119, 9–20. [Google Scholar] [CrossRef]
- Yang, X.; Xu, B.; Zhu, X.; Jin, Y.; Li, J.; Zhao, F.; Chen, S.; Guo, J.; Ma, H.; Yu, H. A monitoring indicator system for remote sensing of grassland vegetation growth and suitability evaluation—A case study of the Xilingol Grassland in Inner Mongolia, China. Int. J. Remote Sens. 2015, 36, 5105–5122. [Google Scholar] [CrossRef]
- Nemati Nasab, M.R.; Sattari Sarbangholi, H.; Pakdelfard, M.R.; Jamali, S. Structural equation modeling (SEM) the relationship between environmental quality and social cohesion components by explaining the mediating role of social resilience in urban cultural spaces. Int. J. Nonlinear Anal. Appl. 2022, 14, 153–167. [Google Scholar]
- Wang, K.; Delbaere, K.; Brodie, M.A.; Lovell, N.H.; Kark, L.; Lord, S.R.; Redmond, S.J. Differences between gait on stairs and flat surfaces in relation to fall risk and future falls. IEEE J. Biomed. Health Inform. 2017, 21, 1479–1486. [Google Scholar] [CrossRef] [PubMed]
- Huang, B.; Huang, J.; Pontius, R.G., Jr.; Tu, Z. Comparison of Intensity Analysis and the land use dynamic degrees to measure land changes outside versus inside the coastal zone of Longhai, China. Ecol. Indic. 2018, 89, 336–347. [Google Scholar] [CrossRef]
- Du, Z.; Yu, L.; Chen, X.; Gao, B.; Yang, J.; Fu, H.; Gong, P. Land use/cover and land degradation across the Eurasian steppe: Dynamics, patterns and driving factors. Sci. Total Environ. 2023, 909, 168593. [Google Scholar] [CrossRef]
- André, M. The ARTEMIS European driving cycles for measuring car pollutant emissions. Sci. Total Environ. 2004, 334, 73–84. [Google Scholar] [CrossRef]
- Liu, G.; Liu, H.; Yin, Y. Global patterns of NDVI-indicated vegetation extremes and their sensitivity to climate extremes. Environ. Res. Lett. 2013, 8, 025009. [Google Scholar] [CrossRef]
- Piedallu, C.; Cheret, V.; Denux, J.-P.; Perez, V.; Azcona, J.S.; Seynave, I.; Gégout, J.-C. Soil and climate differently impact NDVI patterns according to the season and the stand type. Sci. Total Environ. 2019, 651, 2874–2885. [Google Scholar] [CrossRef]
- Batunacun; Nendel, C.; Hu, Y.; Lakes, T. Land-use change and land degradation on the Mongolian Plateau from 1975 to 2015-A case study from Xilingol, China. Land Degrad. Dev. 2018, 29, 1595–1606. [Google Scholar] [CrossRef]
- Li, S.; Xie, Y. Investigating Coupled Impacts of Climate Change and Socioeconomic Transformation on Desertification by Using Multitemporal Landsat Images: A Case Study in Central Xilingol, China. IEEE Geosci. Remote Sens. Lett. 2013, 10, 1244–1248. [Google Scholar] [CrossRef]
- Zhang, Y.; Ya, X.; Wang, R.; Zou, Y.; Dong, X. Assessing and mapping human well-being for sustainable development amid drought and flood hazards: Dadu River Basin of China. Environ. Sci. Pollut. Res. 2022, 29, 90719–90737. [Google Scholar] [CrossRef] [PubMed]
- Saad, A.M.A.; Shariff, N.M.; Gairola, S. Nature and causes of land degradation and desertification in Libya: Need for sustainable land management. Afr. J. Biotechnol. 2011, 10, 13680–13687. [Google Scholar]
- Huang, J.; Li, Y.; Fu, C.; Chen, F.; Fu, Q.; Dai, A.; Shinoda, M.; Ma, Z.; Guo, W.; Li, Z. Dryland climate change: Recent progress and challenges. Rev. Geophys. 2017, 55, 719–778. [Google Scholar] [CrossRef]
- Fu, G.; Qiu, X.; Xu, X.; Zhang, W.; Zang, F.; Zhao, C. The role of biochar particle size and application rate in promoting the hydraulic and physical properties of sandy desert soil. Catena 2021, 207, 105607. [Google Scholar] [CrossRef]
- Kalma, J.D.; McVicar, T.R.; McCabe, M.F. Estimating land surface evaporation: A review of methods using remotely sensed surface temperature data. Surv. Geophys. 2008, 29, 421–469. [Google Scholar] [CrossRef]
- National Forestry and Grassland Administration. Improve the Grassland Governance System and Promote the Construction of Ecological Civilization. Available online: http://www.forestry.gov.cn/cys/3/20210816/163246652498542.html (accessed on 6 October 2023).
- Sarker, S. Fundamentals of Climatology for Engineers: Lecture Note. Eng 2022, 3, 573–595. [Google Scholar] [CrossRef]


| Category | Name | Code | Source | Spatial Resolution | Temporal Resolution | Unit |
|---|---|---|---|---|---|---|
| Vegetation index | Enhanced Vegetation Index | EVI | https://lpdaac.usgs.gov/ (accessed on 4 September 2023) | 250 m | 16 day | / |
| Meteorological factors | Land surface temperature | LST | https://lpdaac.usgs.gov (accessed on 4 September 2023) | 1000 m | Per day | °C |
| Precipitation | PRE | https://chc.ucsb.edu/data | 0.05° | Per day | mm | |
| Wind velocity | WV | https://www.climatologylab.org/terraclimate.html (accessed on 4 September 2023) | 4638.3 m | Per month | m/s | |
| Evapotranspiration | ET | https://lpdaac.usgs.gov/ (accessed on 4 September 2023) | 500 m | 8 day | kg/m2 | |
| Albedo | / | https://lpdaac.usgs.gov/ (accessed on 4 September 2023) | 500 m | Per day | / | |
| Soil factors | Soil type | ST | http://www.resdc.cn (accessed on 5 September 2023) | shapefile | / | / |
| Soil erosion type | SET | http://www.resdc.cn (accessed on 6 September 2023) | shapefile | / | / | |
| Soil erosion intensity | SEI | http://www.resdc.cn (accessed on 5 September 2023) | shapefile | / | / | |
| Soil moisture | SM | https://disc.gsfc.nasa.gov (accessed on 5 September 2023) | 27,830 m | / | kg/m2 | |
| Topographical factors | Digital elevation model | DEM | https://cmr.earthdata.nasa.gov/ (accessed on 4 September 2023) | 30 m | / | m |
| Slope | SLP | Calculated from DEM | 30 m | / | ° | |
| Aspect | ASP | Calculated from DEM | 30 m | / | / | |
| Human activities | Population | POP | https://sedac.ciesin.columbia.edu/ (accessed on 10 September 2023) | 1000 m | Per year | persons/km2 |
| Livestock | LIV | https://www.fao.org/ (accessed on 10 September 2023) | 10,000 m | / | heads/km2 | |
| Land use/cover change | LUCC | https://lpdaac.usgs.gov/ (accessed on 10 September 2023) | 500 m | Per year | / | |
| Statistics | Population | / | http://tjj.xlgl.gov.cn/ (accessed on 11 September 2023) | / | Per year | k |
| GDP | / | http://tjj.xlgl.gov.cn/ (accessed on 11 September 2023) | / | Per year | billion RMB | |
| Livestock | / | http://tjj.xlgl.gov.cn/ (accessed on 12 September 2023) | / | Per year | million |
| Category | Value of DDI |
|---|---|
| I (Severely Desertified) | DDI < −0.45 |
| II (Moderately Desertified) | −0.45 ≤ DDI < −0.25 |
| III (Slightly Desertified) | −0.25 ≤ DDI < −0.05 |
| IV (Nondesertified) | −0.05 ≤ DDI < 0.15 |
| V (Healthy) | DDI ≥ 0.15 |
| Description | Interaction |
|---|---|
| P(x1∩x2) < min(P(x1), P(x2)) | Nonlinear weaken |
| min(P(x1), P(x2)) < P(x1∩x2) < max(P(x1), P(x2)) | Uni-weaken |
| P(x1∩x2) > max(P(x1), P(x2)) and P(x1∩x2) < P(x1) + P(x2) | Bi-enhance |
| P(x1∩x2) > P(x1) + P(x2) | Nonlinearly enhance |
| P(x1∩x2) = P(x1) + P(x2) | Independent |
| Human Activities | Meteorological Factors | |
|---|---|---|
| 0.536 | 0.111 | |
| Significance | 0.012 | 0.632 |
Disclaimer/Publisher’s Note: The statements, opinions and data contained in all publications are solely those of the individual author(s) and contributor(s) and not of MDPI and/or the editor(s). MDPI and/or the editor(s) disclaim responsibility for any injury to people or property resulting from any ideas, methods, instructions or products referred to in the content. |
© 2023 by the authors. Licensee MDPI, Basel, Switzerland. This article is an open access article distributed under the terms and conditions of the Creative Commons Attribution (CC BY) license (https://creativecommons.org/licenses/by/4.0/).
Share and Cite
Li, J.; Cao, C.; Xu, M.; Yang, X.; Gao, X.; Wang, K.; Guo, H.; Yang, Y. A 20-Year Analysis of the Dynamics and Driving Factors of Grassland Desertification in Xilingol, China. Remote Sens. 2023, 15, 5716. https://doi.org/10.3390/rs15245716
Li J, Cao C, Xu M, Yang X, Gao X, Wang K, Guo H, Yang Y. A 20-Year Analysis of the Dynamics and Driving Factors of Grassland Desertification in Xilingol, China. Remote Sensing. 2023; 15(24):5716. https://doi.org/10.3390/rs15245716
Chicago/Turabian StyleLi, Jingbo, Chunxiang Cao, Min Xu, Xinwei Yang, Xiaotong Gao, Kaimin Wang, Heyi Guo, and Yujie Yang. 2023. "A 20-Year Analysis of the Dynamics and Driving Factors of Grassland Desertification in Xilingol, China" Remote Sensing 15, no. 24: 5716. https://doi.org/10.3390/rs15245716