


Spatial Heterogeneity of Combined Factors Affecting Vegetation Greenness Change in the Yangtze River Economic Belt from 2000 to 2020
Abstract
:
1. Introduction
2. Materials and Methods
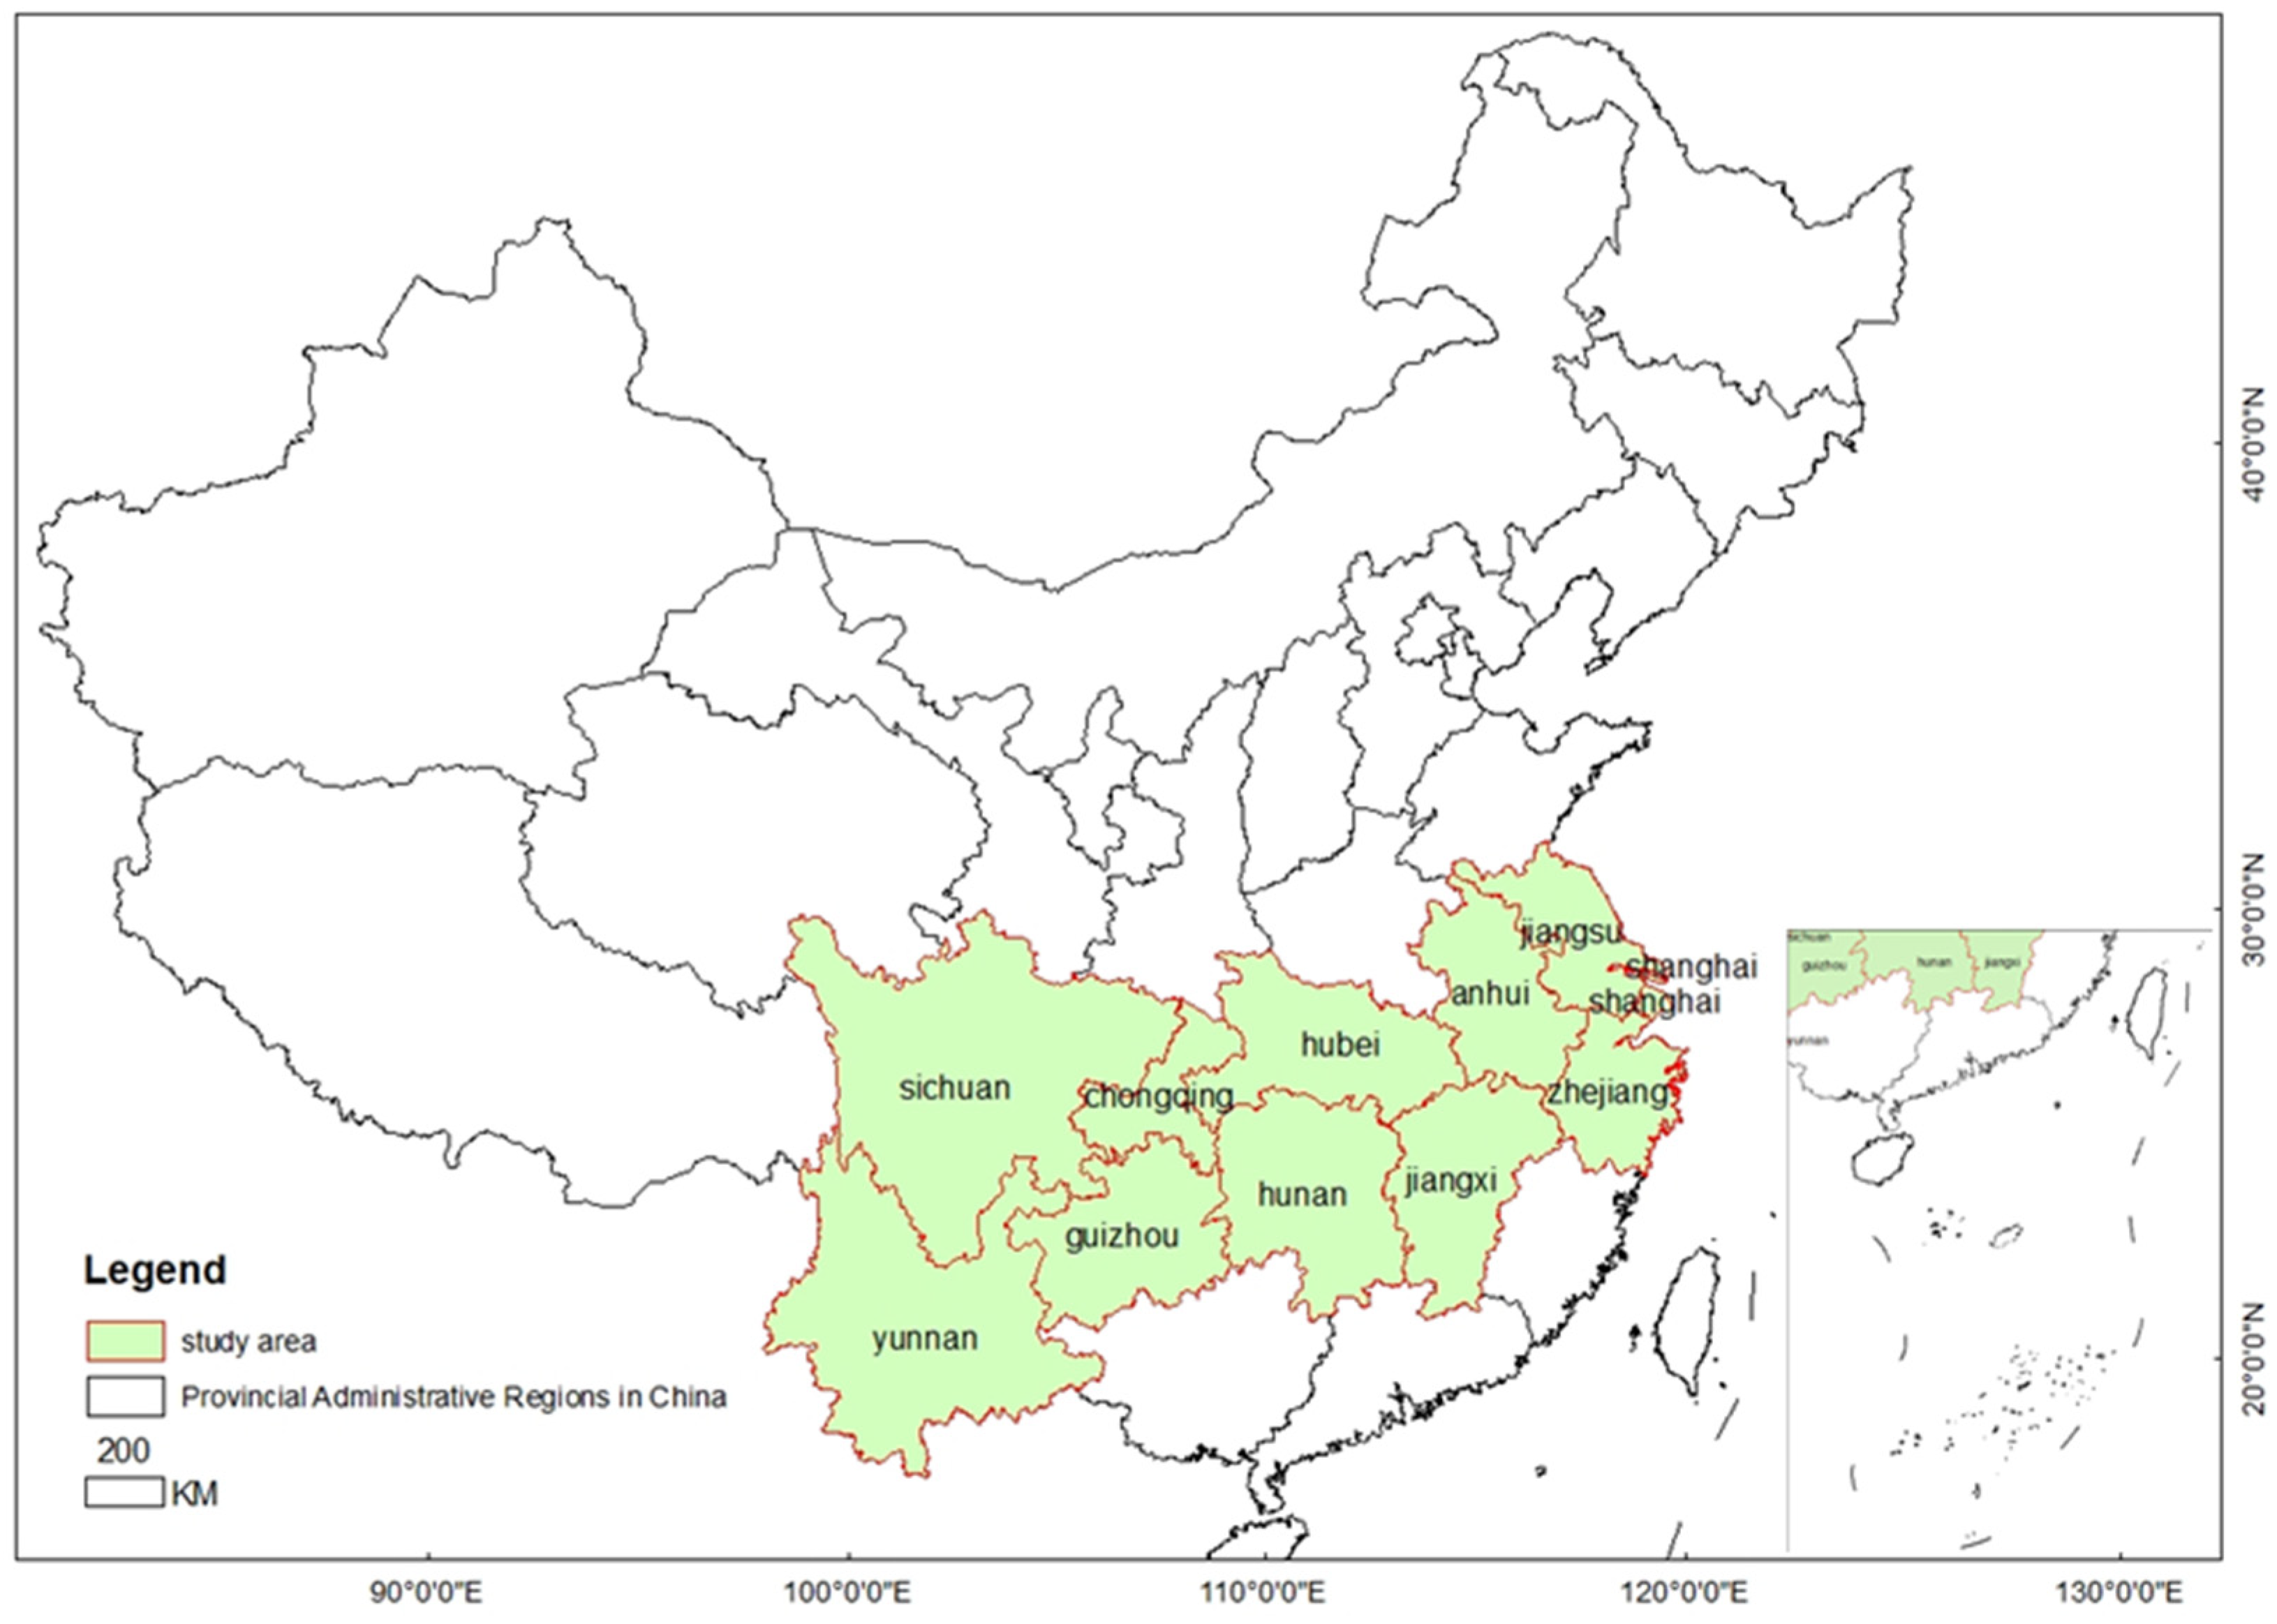
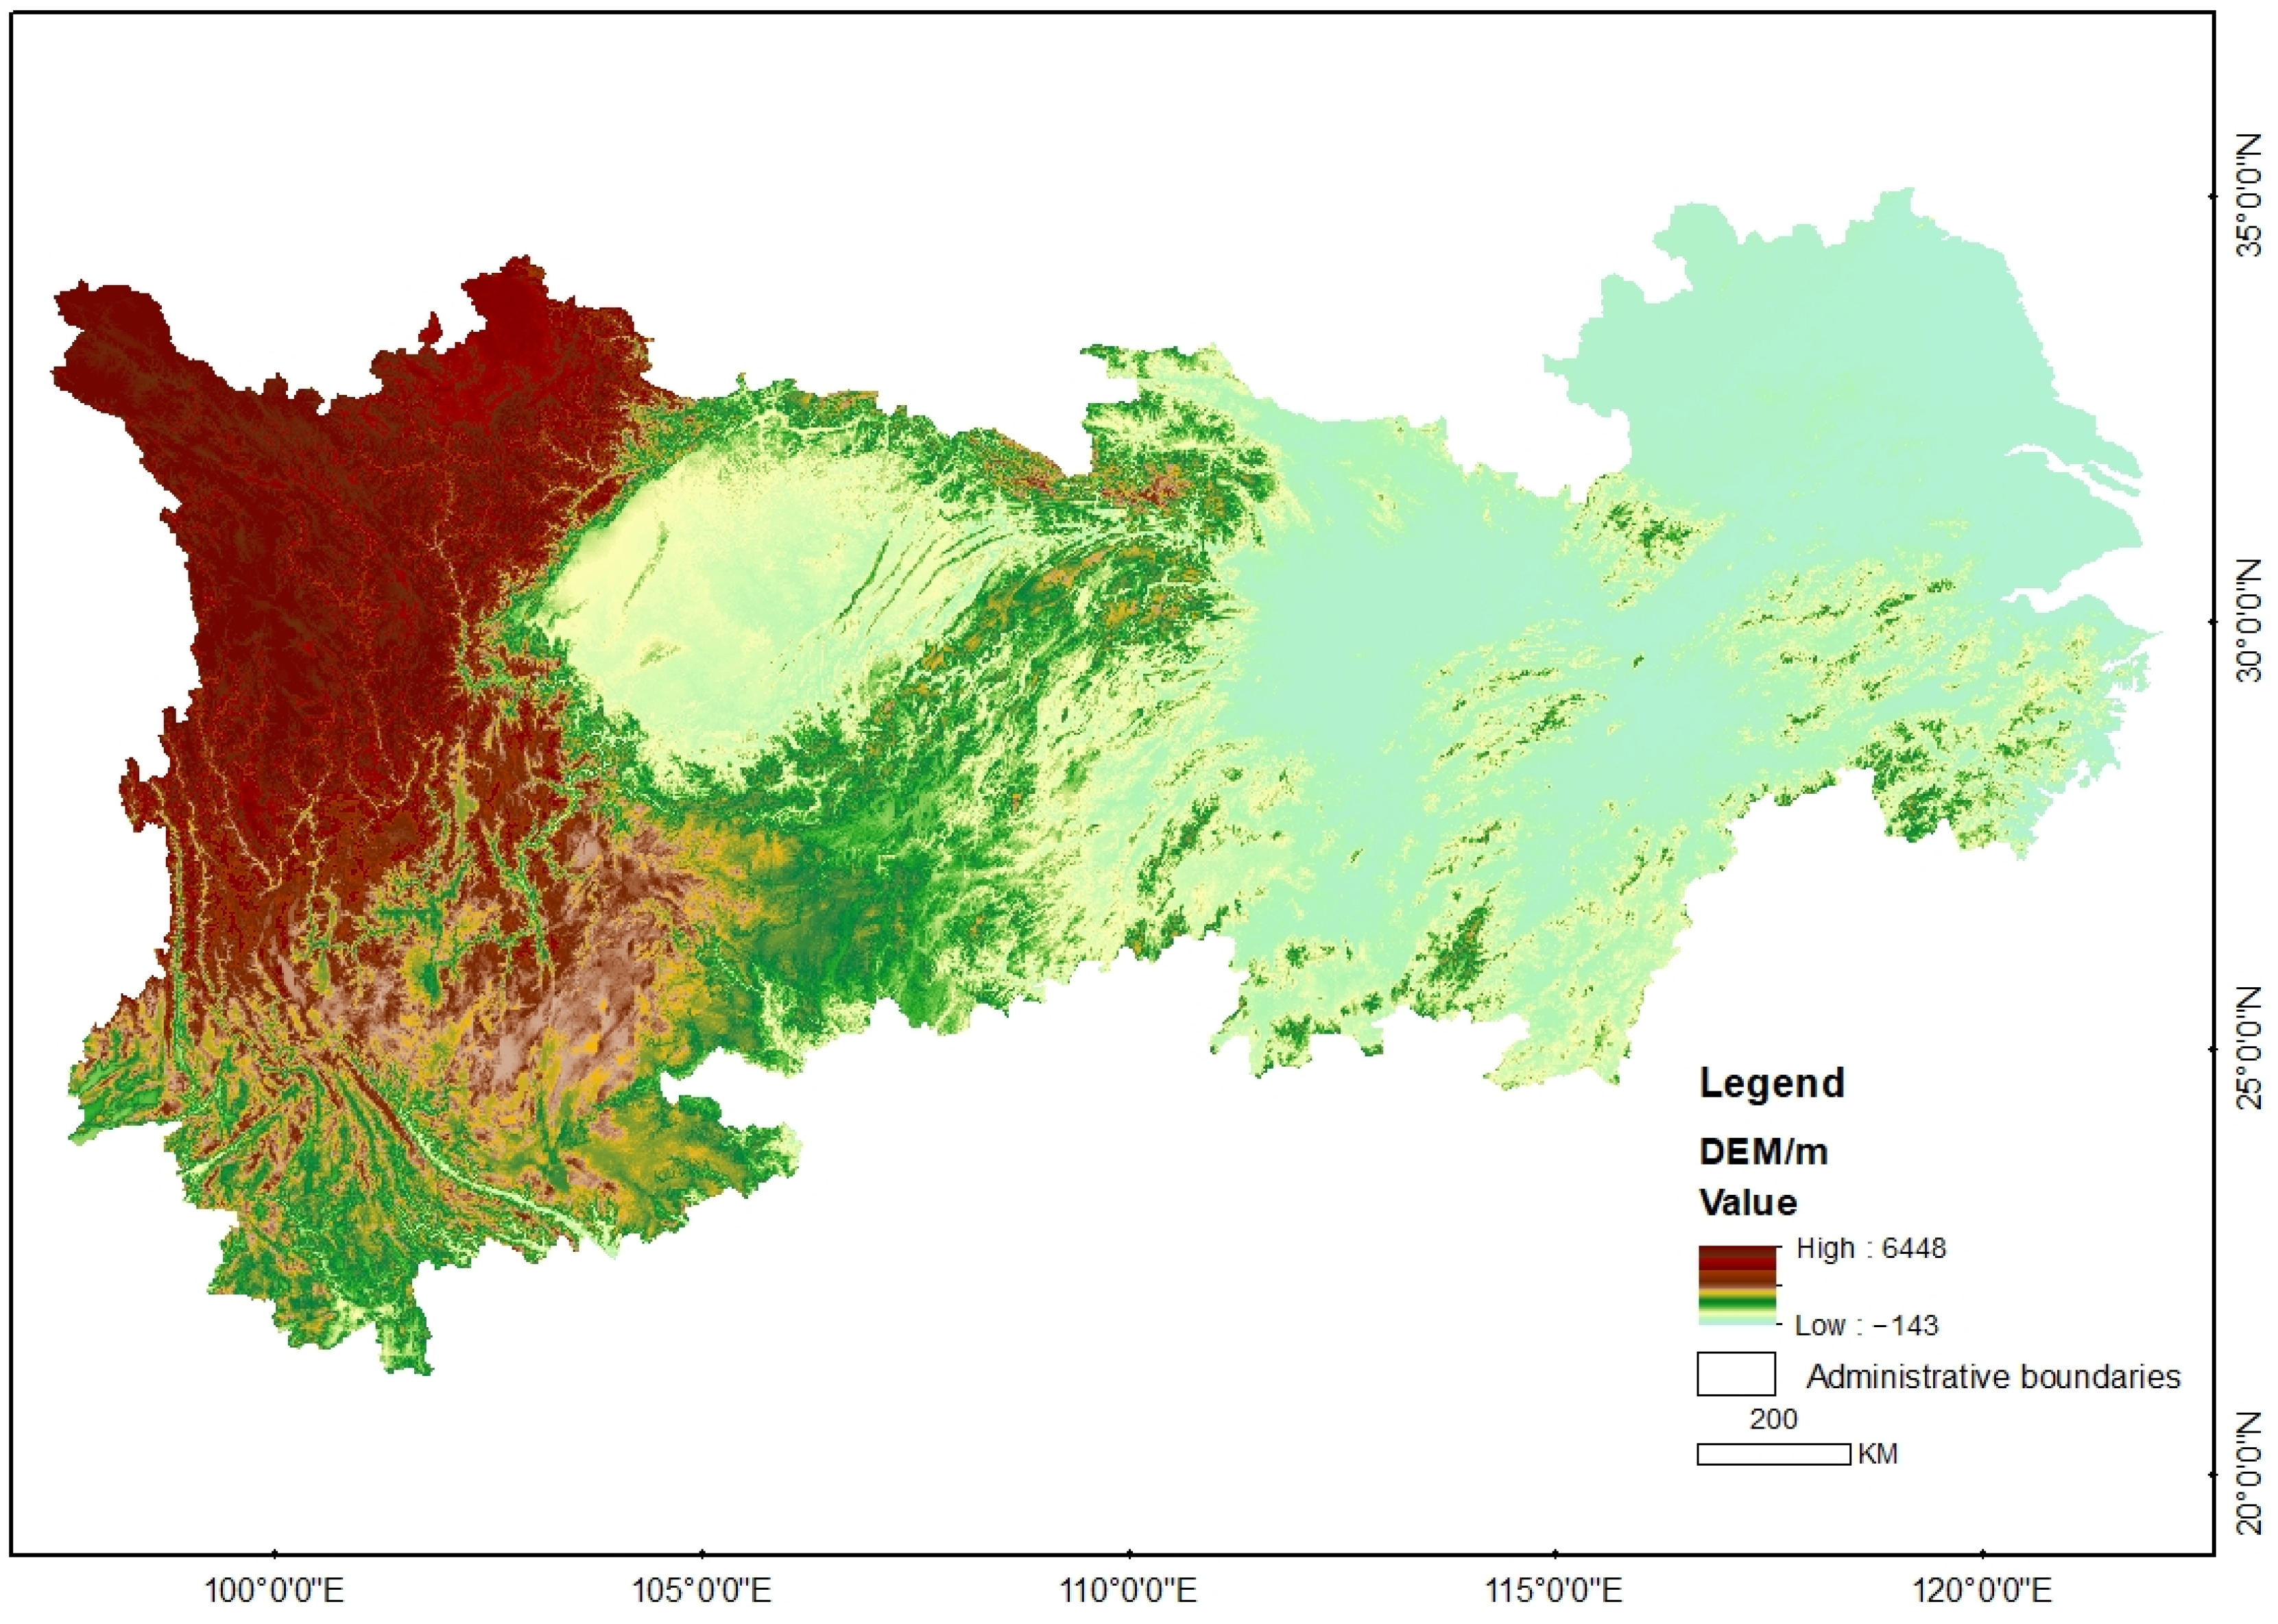
2.1. Study Area
2.2. Data
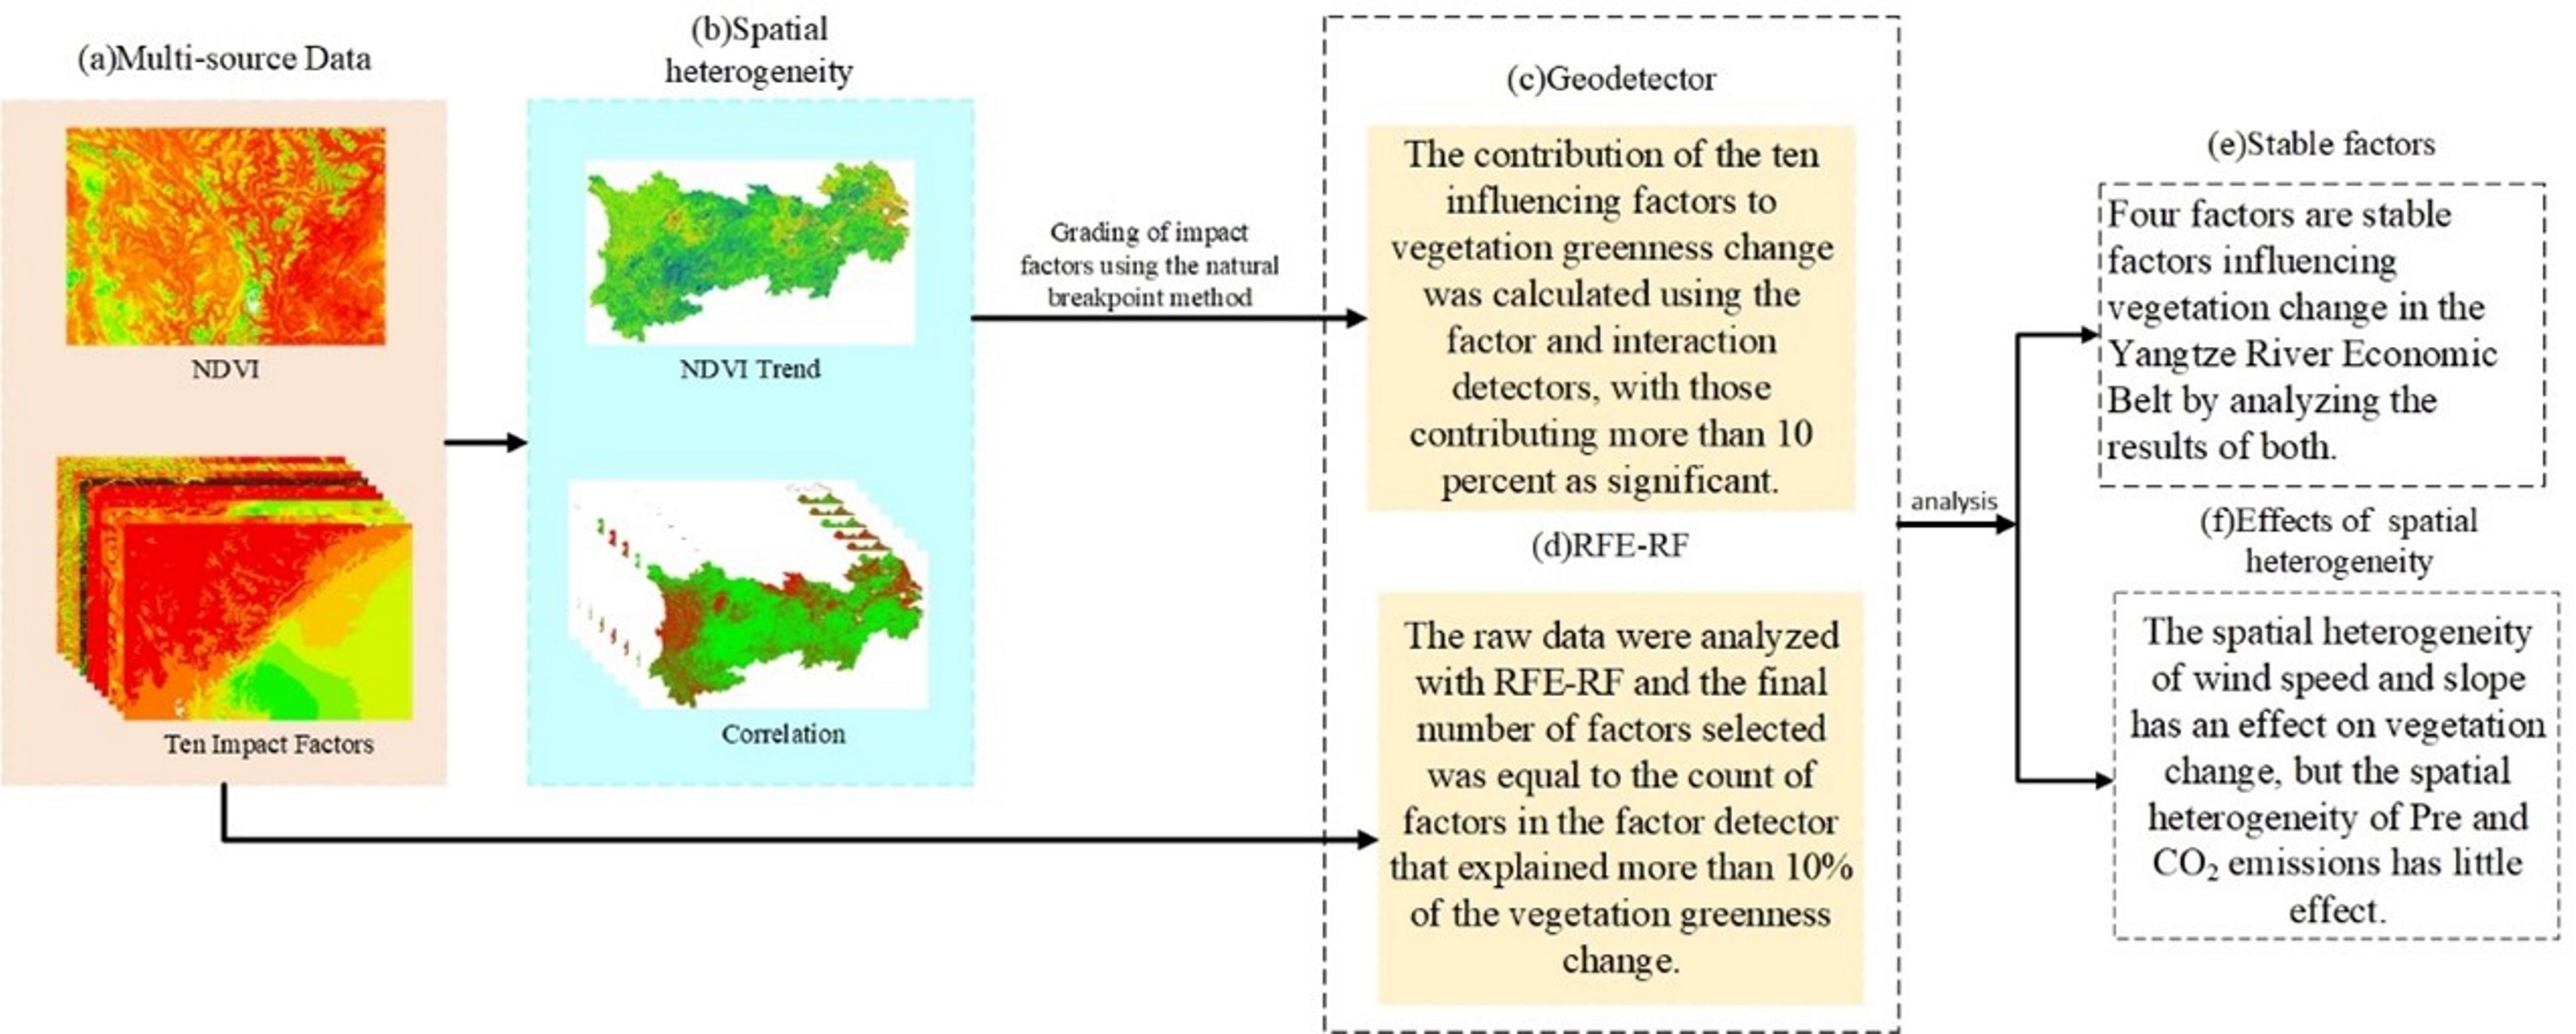
2.3. Methods
2.3.1. Factor Selection and Grading
2.3.2. Geographical Detector
2.3.3. Random Forest and Recursive Feature Elimination
3. Results
3.1. Effect of Factors on NDVI Changes
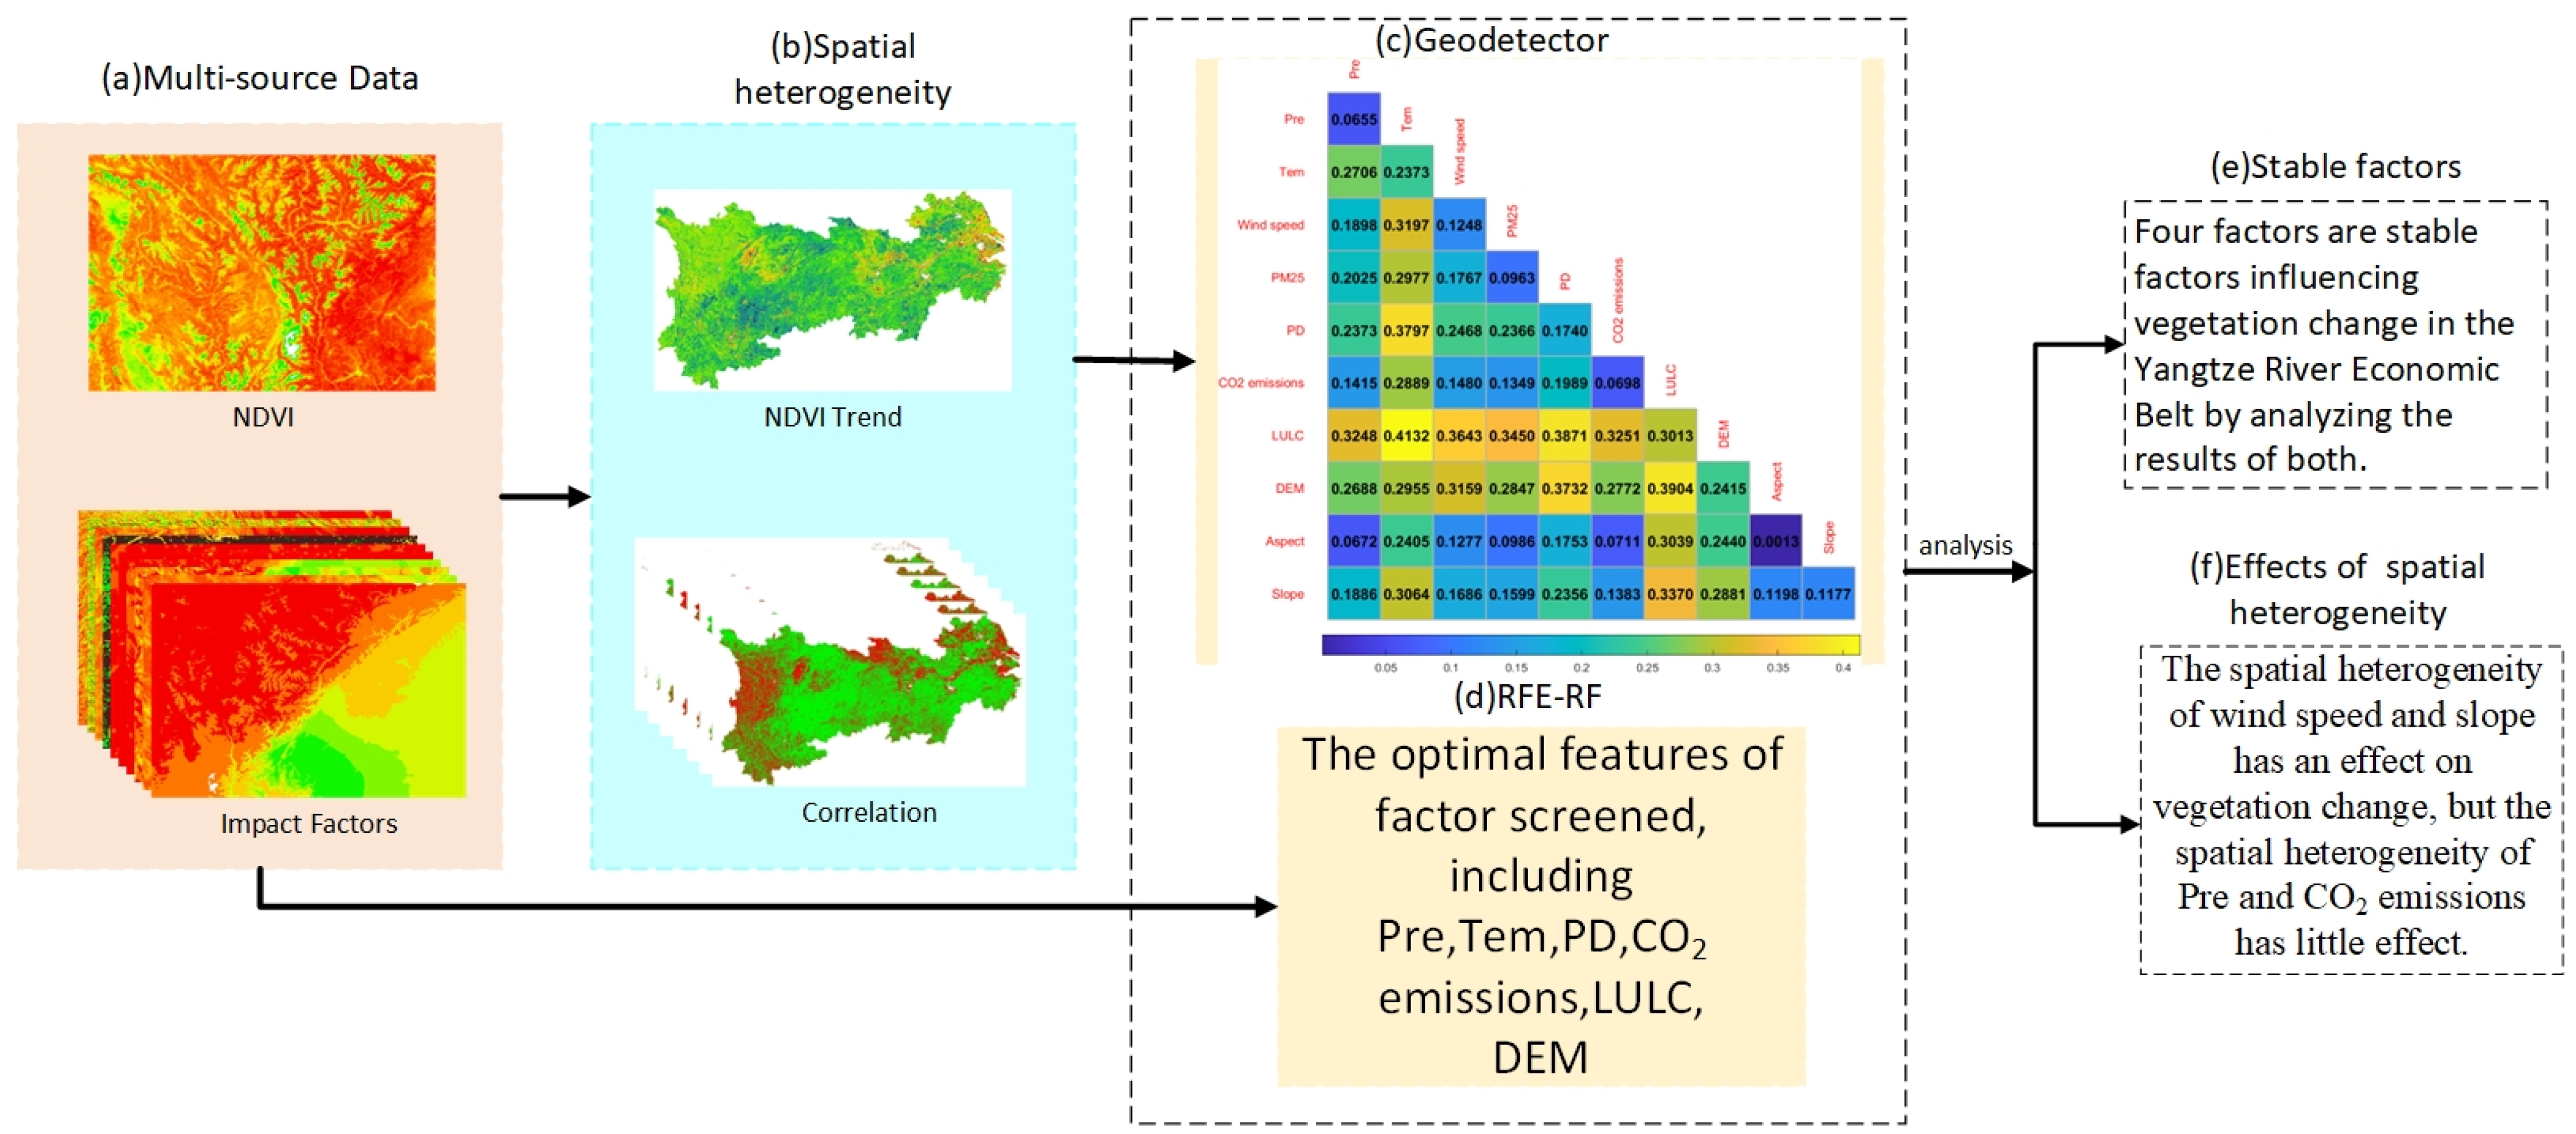
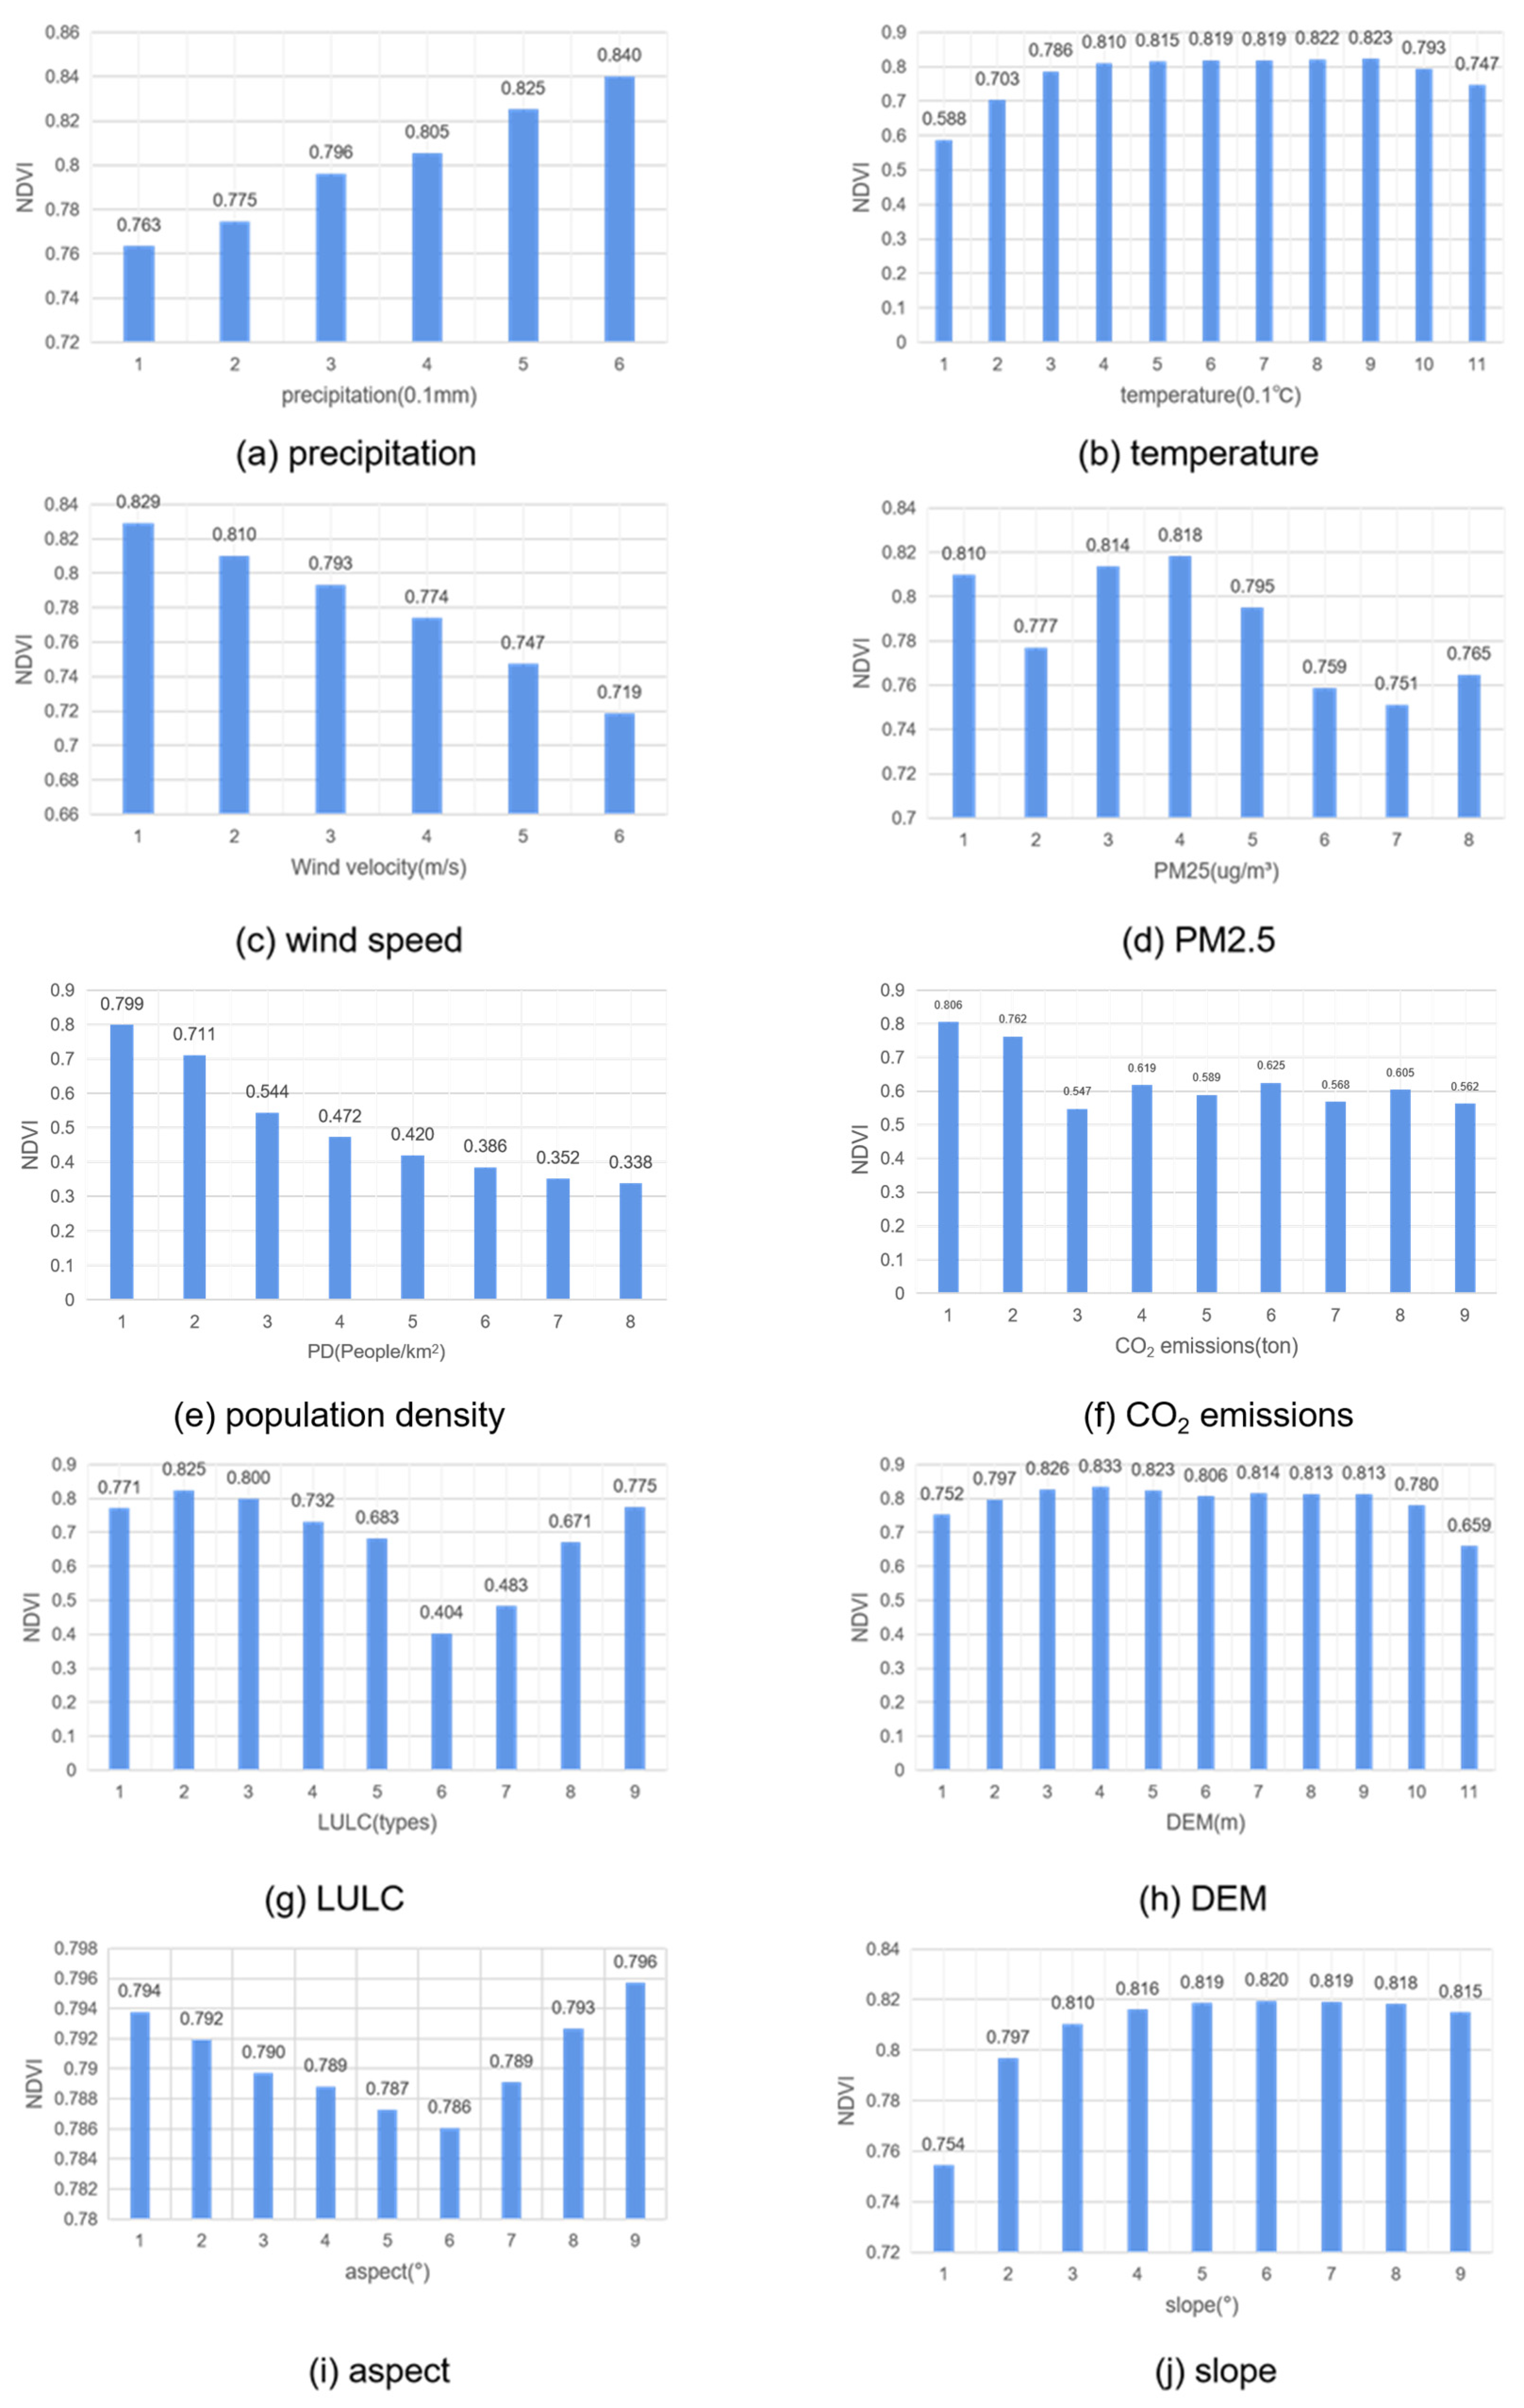
3.1.1. Independent Effects of Influencing Factors on NDVI
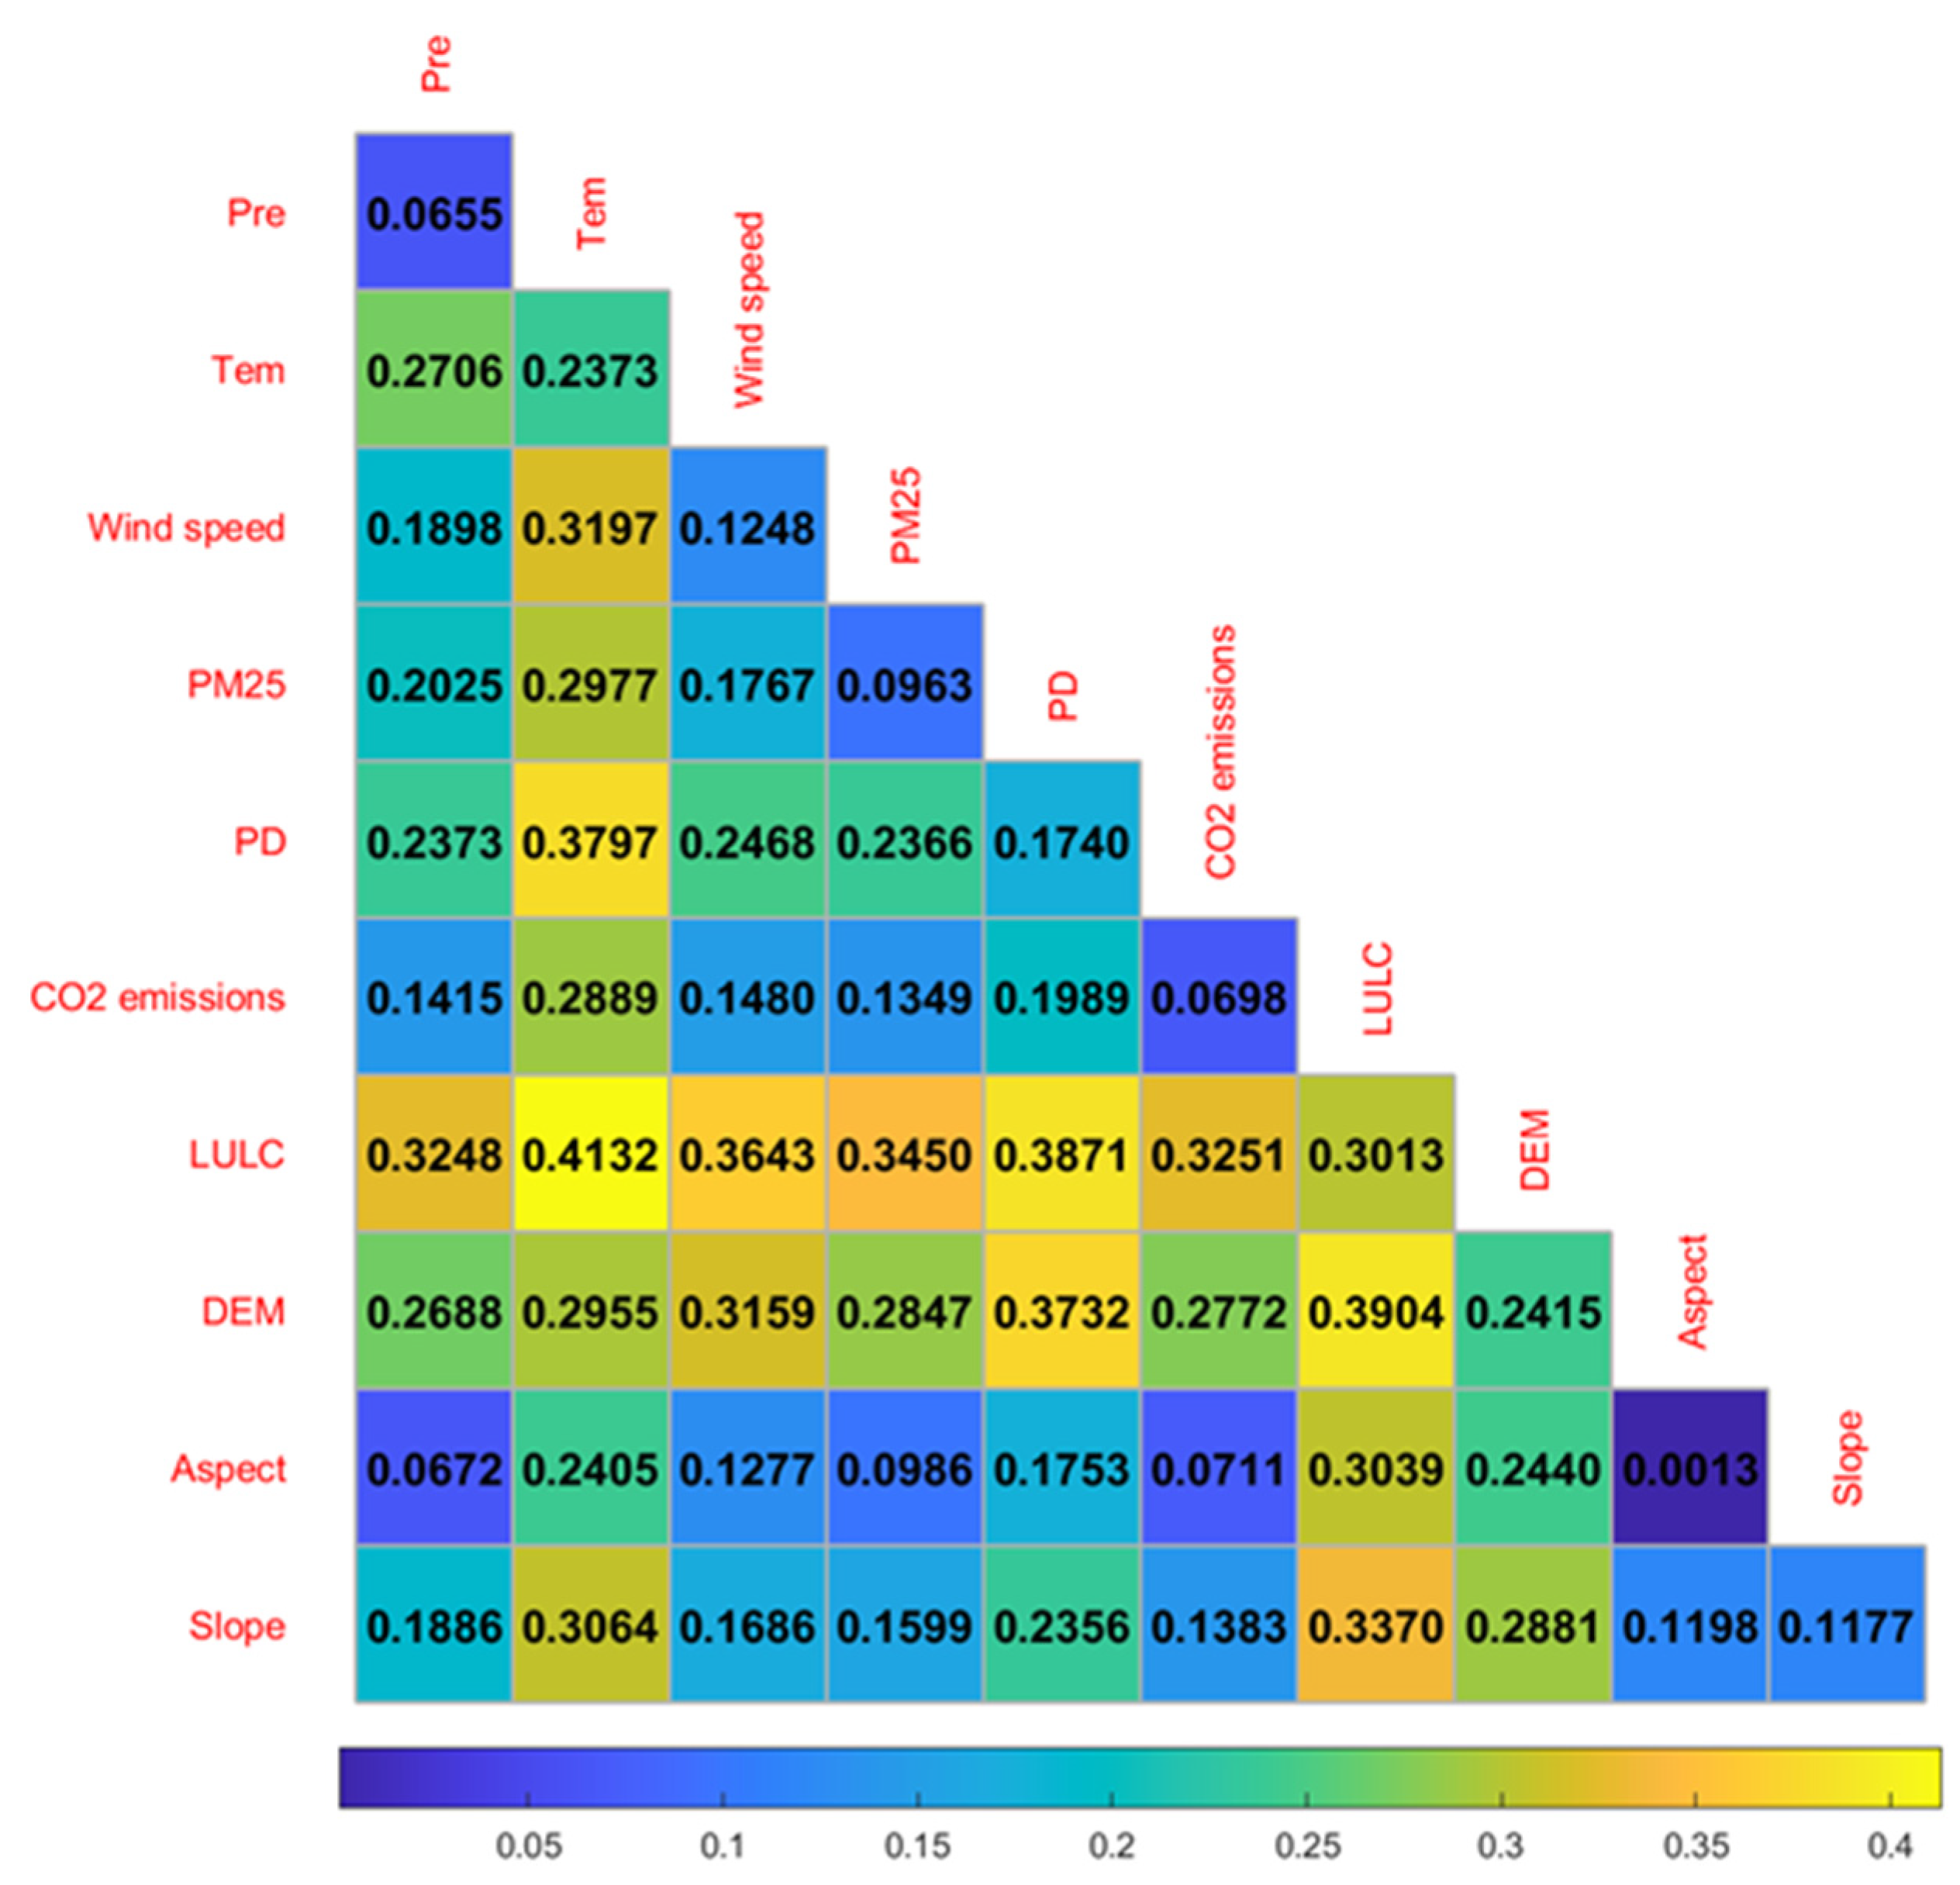
3.1.2. Interaction Analysis of Each Factor
3.1.3. Stable Factors Affecting Vegetation NDVI
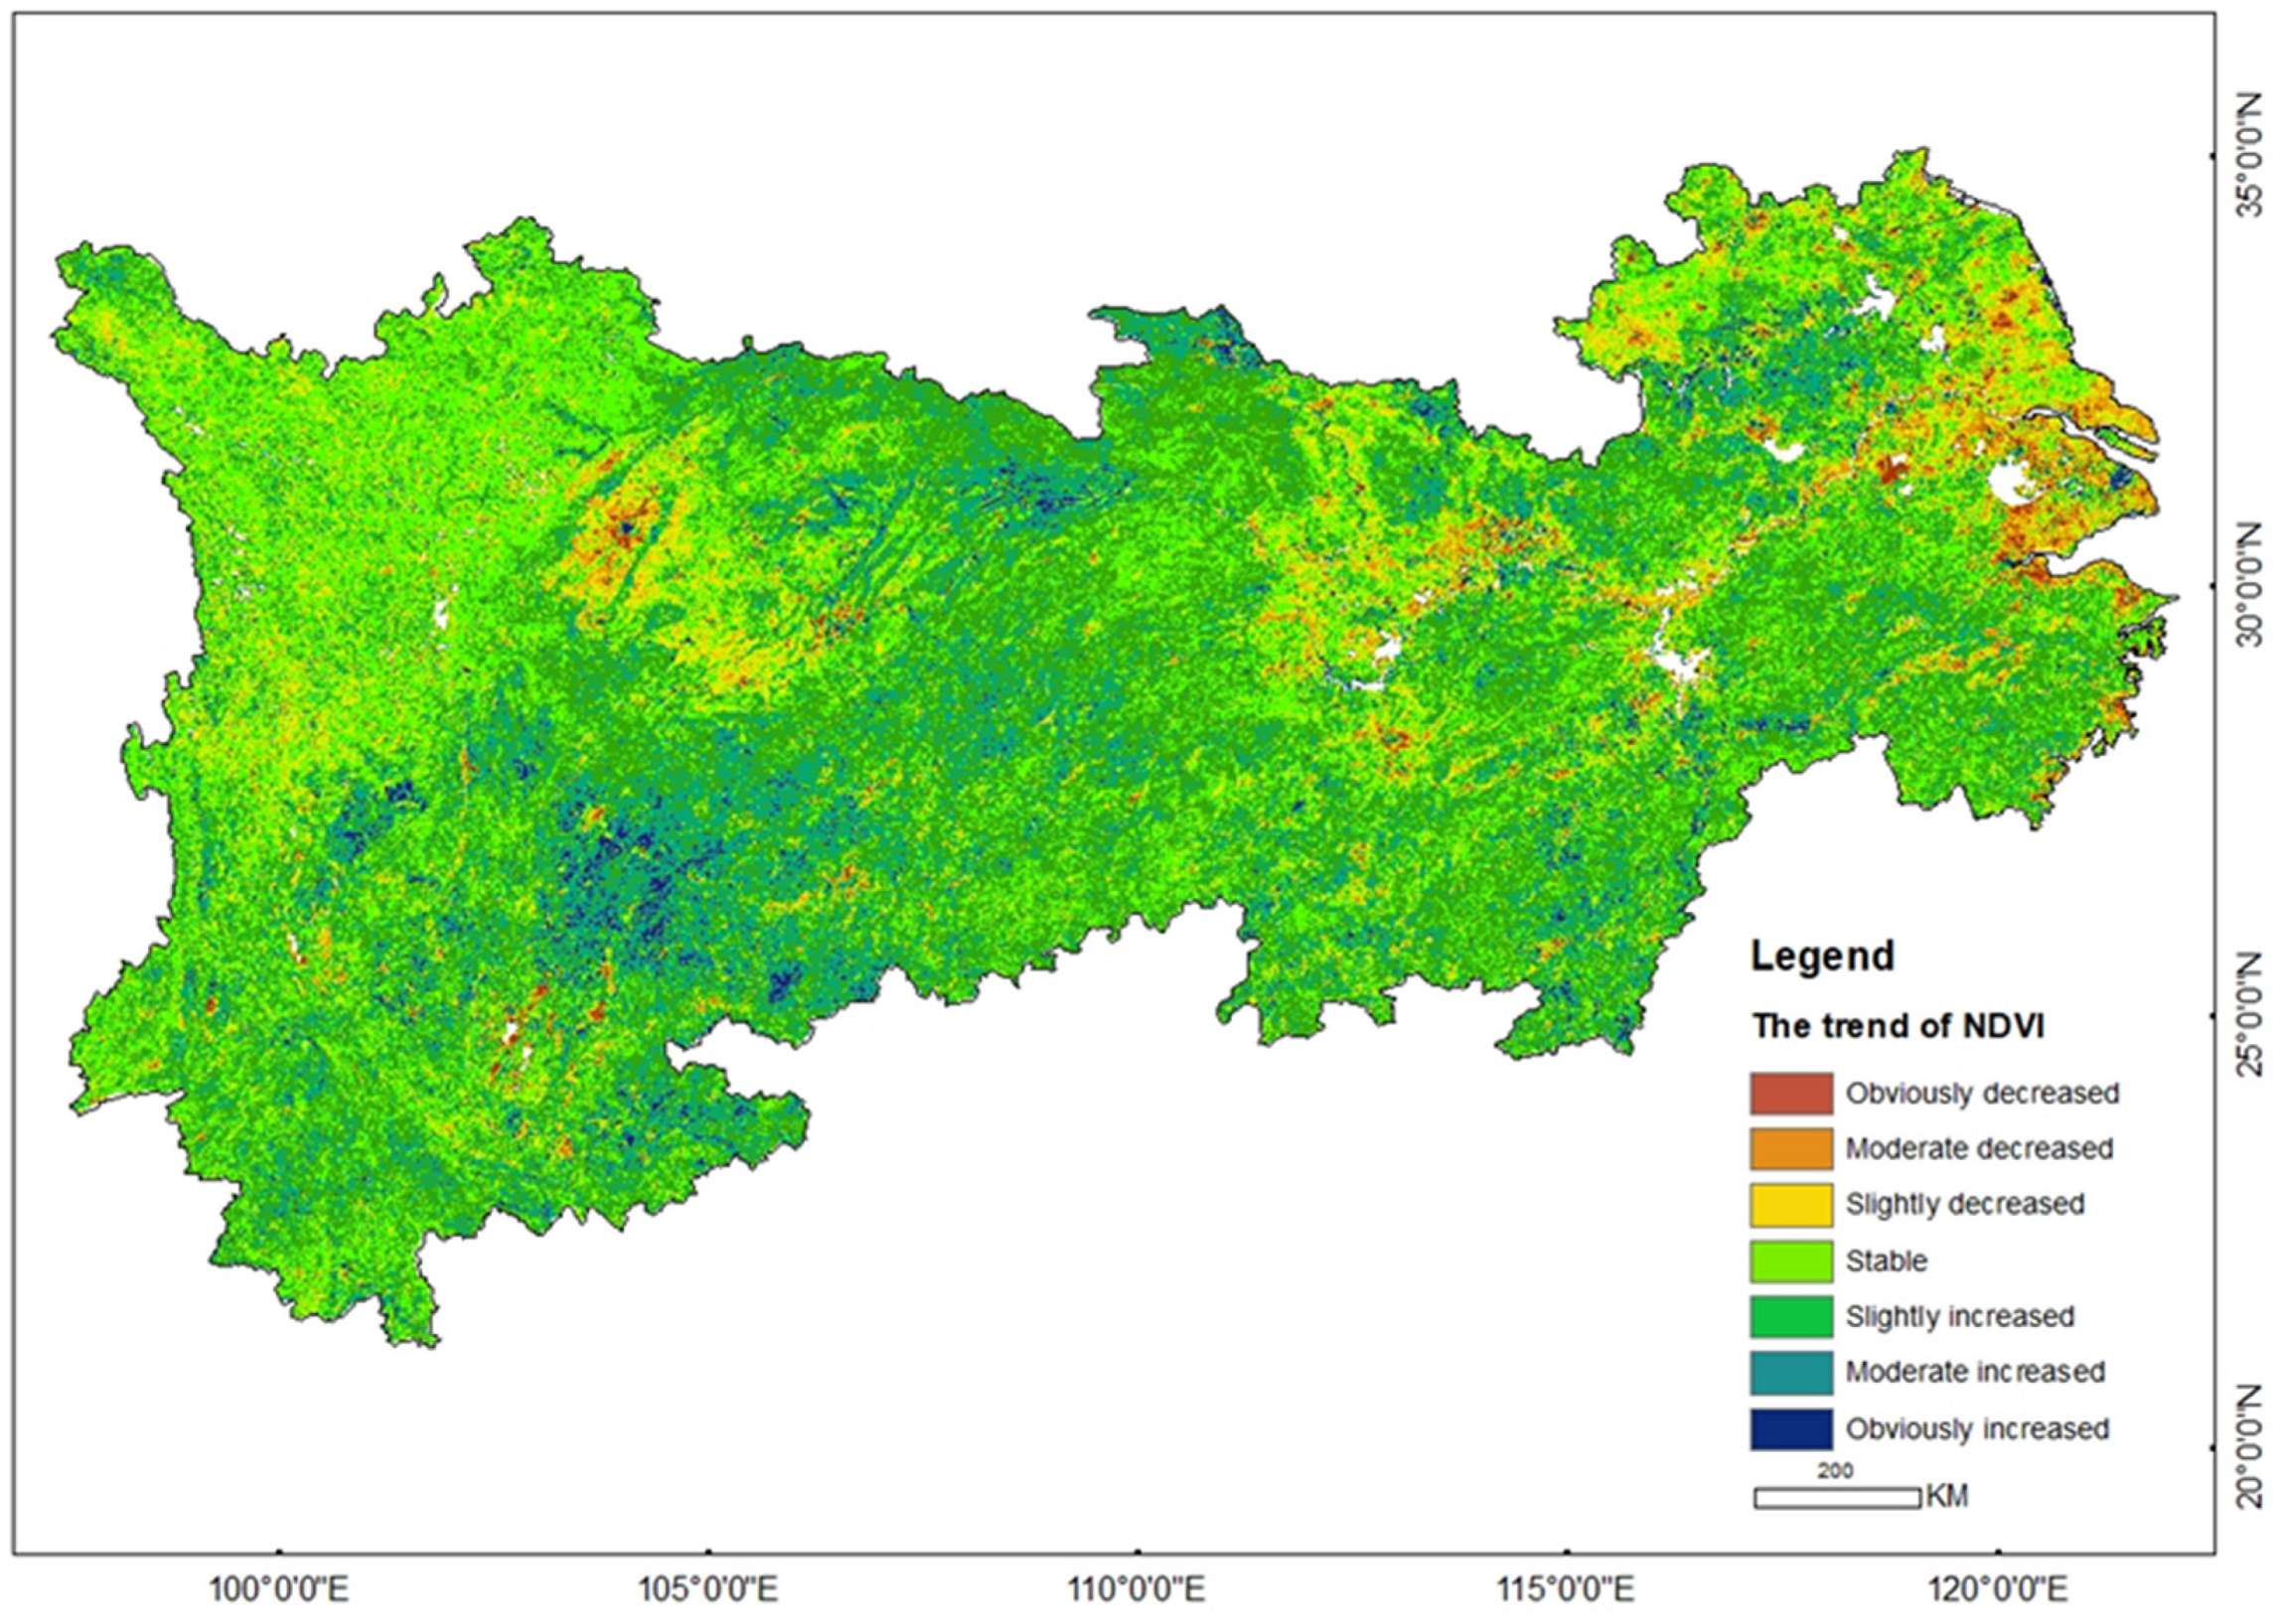
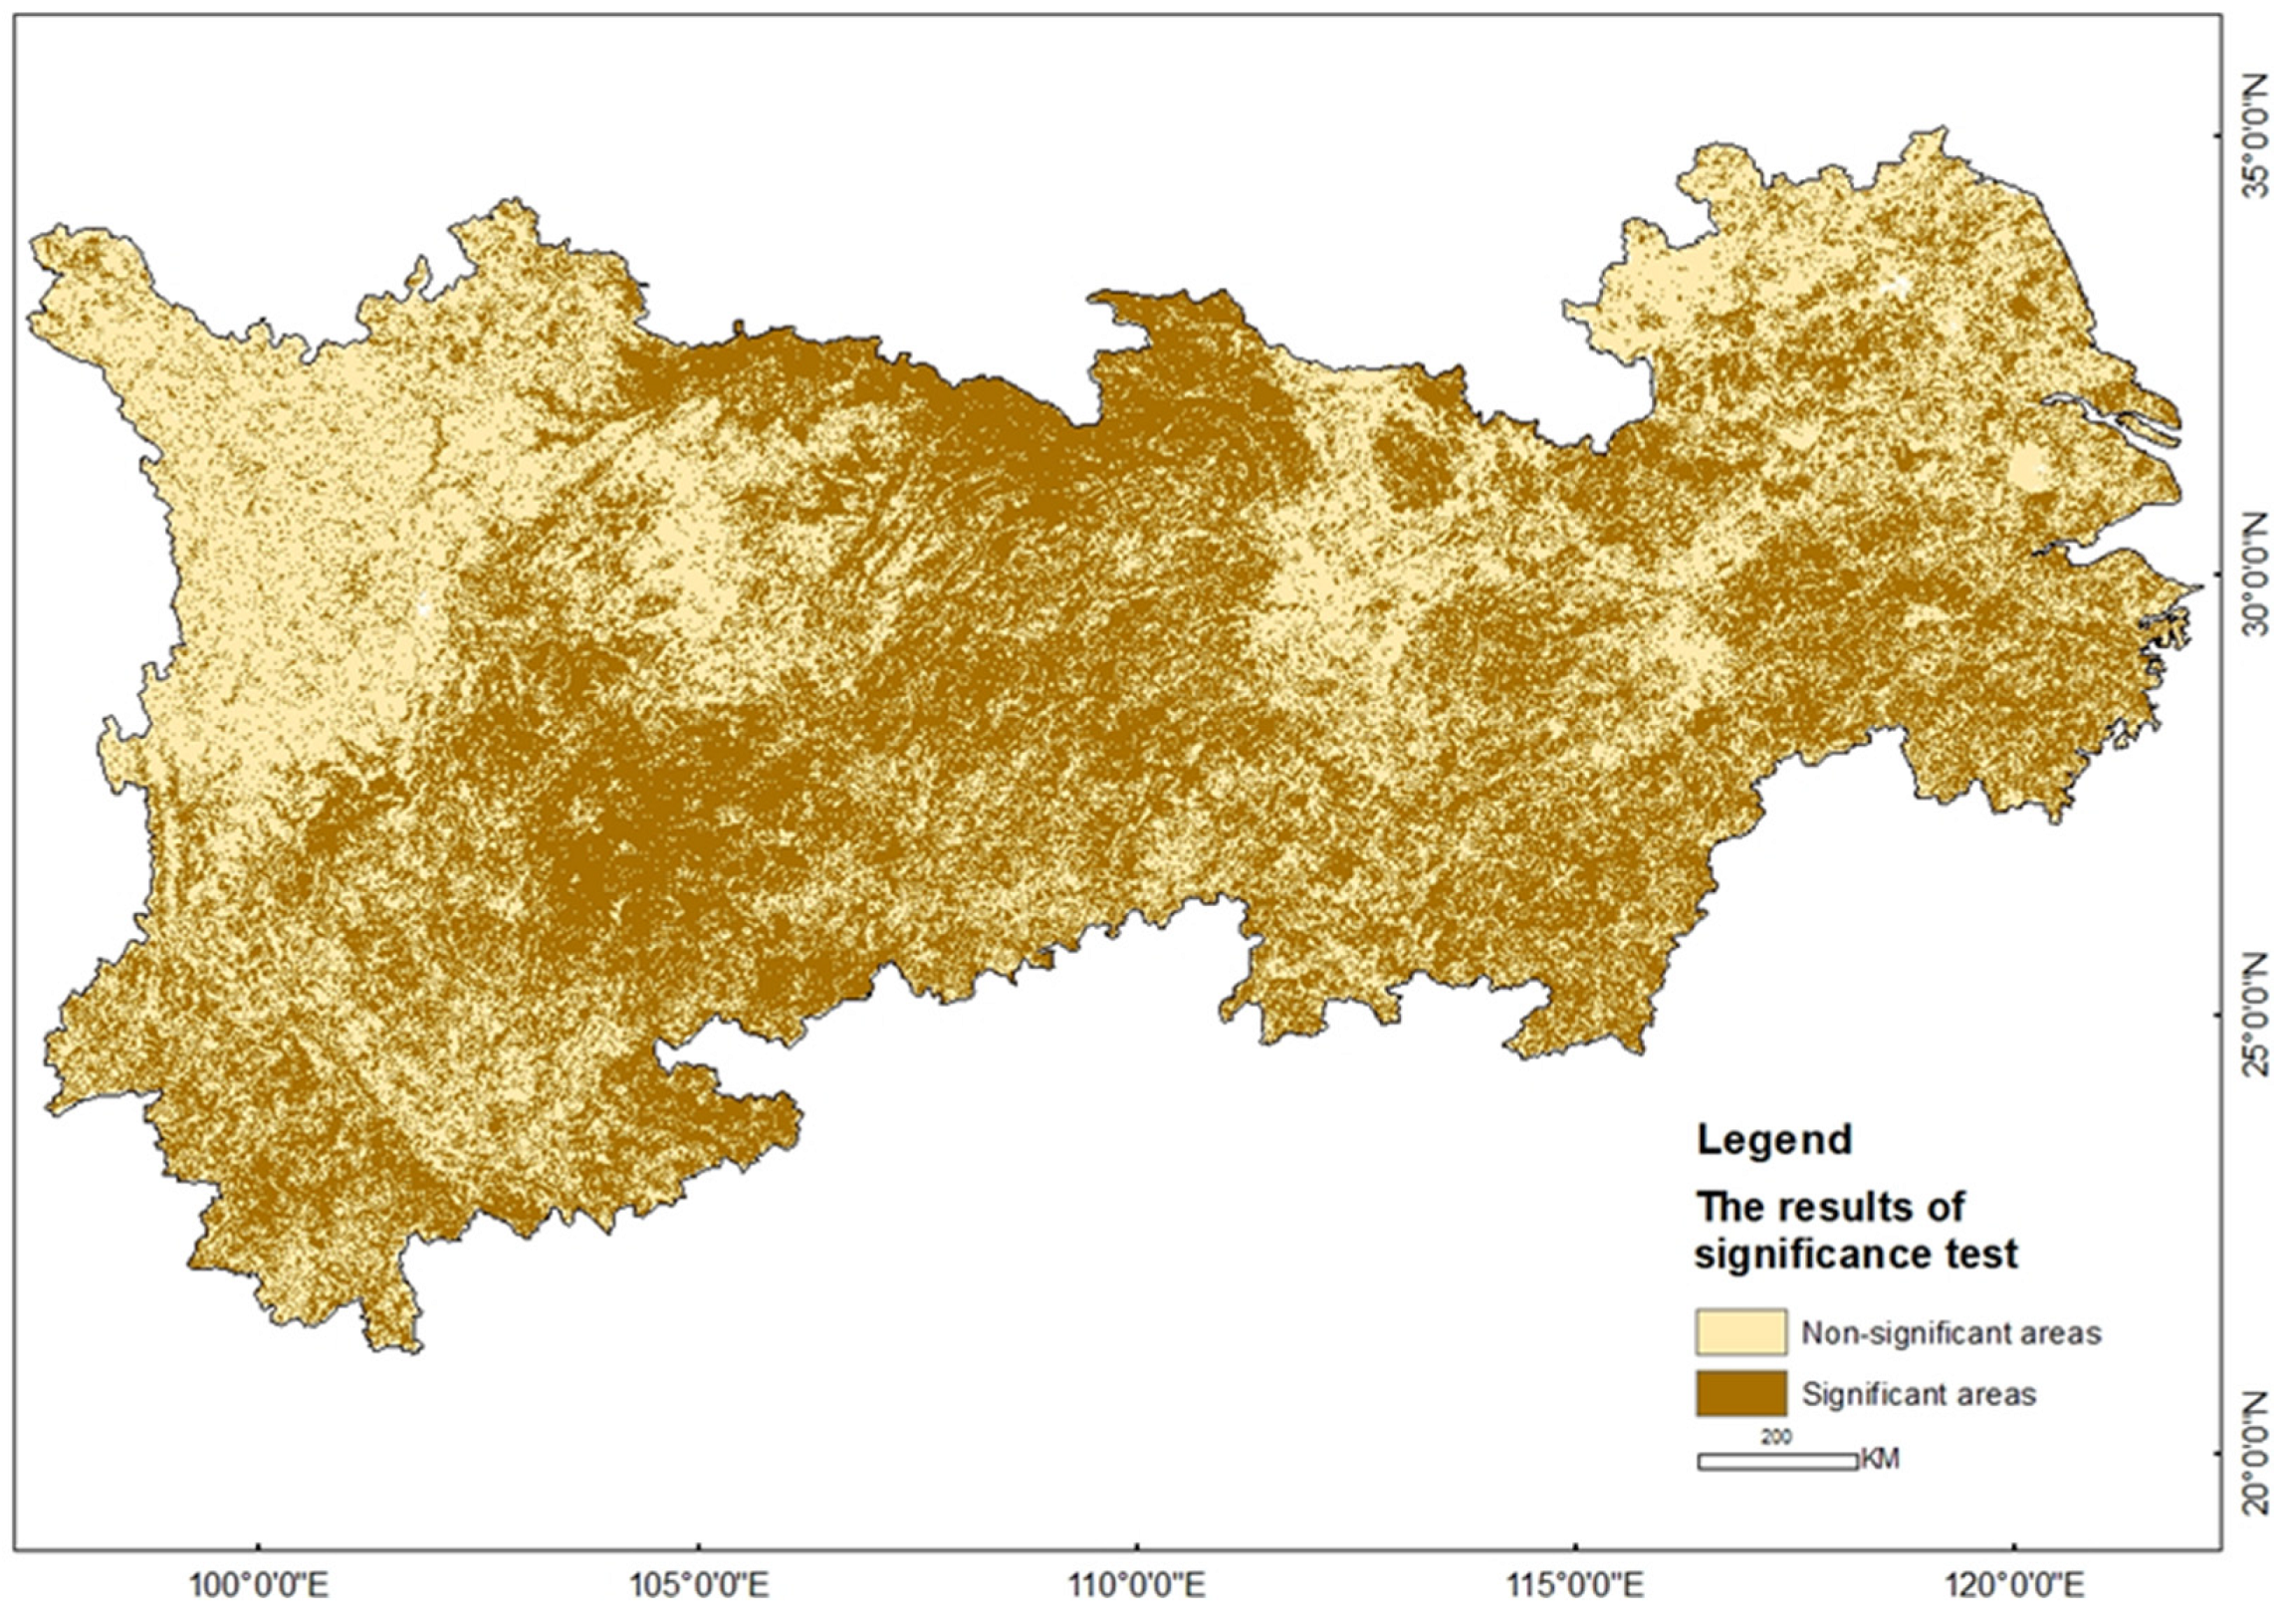
3.2. Spatial Distribution of Trends in Factors
4. Discussion
4.1. Vegetation Greenness Change
4.2. Linking of Methods
4.3. Effect of Factors on Vegetation Greenness Change
4.4. Spatial Heterogeneity of Factors
4.5. Outlooks
5. Conclusions
Supplementary Materials
Author Contributions
Funding
Data Availability Statement
Conflicts of Interest
References
- Piao, S.; Fang, J.; Zhou, L.; Guo, Q.; Henderson, M.; Ji, W.; Li, Y.; Tao, S. Interannual variations of monthly and seasonal normalized difference vegetation index (NDVI) in China from 1982 to 1999. J. Geophys. Res. Atmos. 2003, 108, 4401. [Google Scholar] [CrossRef]
- Bégué, A.; Vintrou, E.; Ruelland, D.; Claden, M.; Dessay, N. Can a 25-year trend in Soudano-Sahelian vegetation dynamics be interpreted in terms of land use change? A remote sensing approach. Glob. Environ. Chang. 2011, 21, 413–420. [Google Scholar] [CrossRef]
- Liu, H.; Zheng, L.; Yin, S. Multi-perspective analysis of vegetation cover changes and driving factors of long time series based on climate and terrain data in Hanjiang River Basin, China. Arab. J. Geosci. 2018, 11, 509. [Google Scholar] [CrossRef]
- Pettorelli, N.; Vik, J.O.; Mysterud, A.; Gaillard, J.-M.; Tucker, C.J.; Stenseth, N.C. Using the satellite-derived NDVI to assess ecological responses to environmental change. Trends Ecol. Evol. 2005, 20, 503–510. [Google Scholar] [CrossRef] [PubMed]
- Hao, F.; Zhang, X.; Ouyang, W.; Skidmore, A.K.; Toxopeus, A. Vegetation NDVI linked to temperature and precipitation in the upper catchments of Yellow River. Environ. Model. Assess. 2012, 17, 389–398. [Google Scholar] [CrossRef]
- Gu, Z.; Duan, X.; Shi, Y.; Li, Y.; Pan, X. Spatiotemporal variation in vegetation coverage and its response to climatic factors in the Red River Basin, China. Ecol. Indic. 2018, 93, 54–64. [Google Scholar] [CrossRef]
- Lamchin, M.; Lee, W.-K.; Jeon, S.W.; Wang, S.W.; Lim, C.H.; Song, C.; Sung, M. Long-term trend and correlation between vegetation greenness and climate variables in Asia based on satellite data. Sci. Total Environ. 2018, 618, 1089–1095. [Google Scholar] [CrossRef]
- Zhang, Y.; Gao, J.; Liu, L.; Wang, Z.; Ding, M.; Yang, X. NDVI-based vegetation changes and their responses to climate change from 1982 to 2011: A case study in the Koshi River Basin in the middle Himalayas. Glob. Planet. Chang. 2013, 108, 139–148. [Google Scholar] [CrossRef]
- Pang, G.; Wang, X.; Yang, M. Using the NDVI to identify variations in, and responses of, vegetation to climate change on the Tibetan Plateau from 1982 to 2012. Quat. Int. 2017, 444, 87–96. [Google Scholar] [CrossRef]
- Mao, D.; Wang, Z.; Luo, L.; Ren, C. Integrating AVHRR and MODIS data to monitor NDVI changes and their relationships with climatic parameters in Northeast China. Int. J. Appl. Earth Obs. Geoinf. 2012, 18, 528–536. [Google Scholar] [CrossRef]
- Li, Y.; Zheng, Z.; Qin, Y.; Rong, P. Relative contributions of natural and man-made factors to vegetation cover change of environmentally sensitive and vulnerable areas of China. J. Clean. Prod. 2021, 321, 128917. [Google Scholar] [CrossRef]
- Yu, W.; Wang, Y.; Wang, Y.; Li, B.; Liu, Y.; Liu, X. Application of a coupled model of photosynthesis and stomatal conductance for estimating plant physiological response to pollution by fine particulate matter (PM 2.5). Environ. Sci. Pollut. Res. 2018, 25, 19826–19835. [Google Scholar] [CrossRef]
- Liu, Y.; Huang, H.; Meng, L.; Liu, M.; Wu, Z.; Liu, T.; Labat, D. Spatial-temporal evolution of vegetation coverage and its relationship with terrain and human factors in the upper reaches of Ganjiang River Basin, China. Front. Earth Sci. 2023, 10, 1043403. [Google Scholar] [CrossRef]
- Feng, K.; Wang, T.; Liu, S.; Yan, C.; Kang, W.; Chen, X.; Guo, Z. Path analysis model to identify and analyse the causes of aeolian desertification in Mu Us Sandy Land, China. Ecol. Indic. 2021, 124, 107386. [Google Scholar] [CrossRef]
- Liu, X.; Pei, F.; Wen, Y.; Li, X.; Wang, S.; Wu, C.; Cai, Y.; Wu, J.; Chen, J.; Feng, K. Global urban expansion offsets climate-driven increases in terrestrial net primary productivity. Nat. Commun. 2019, 10, 5558. [Google Scholar] [CrossRef] [PubMed]
- Liu, D.; Chen, J.; Ouyang, Z. Responses of landscape structure to the ecological restoration programs in the farming-pastoral ecotone of Northern China. Sci. Total Environ. 2020, 710, 136311. [Google Scholar] [CrossRef] [PubMed]
- Sun, Z.; Mao, Z.; Yang, L.; Liu, Z.; Han, J.; Wanag, H.; He, W. Impacts of climate change and afforestation on vegetation dynamic in the Mu Us Desert, China. Ecol. Indic. 2021, 129, 108020. [Google Scholar] [CrossRef]
- Van der Geest, K.; Vrieling, A.; Dietz, T. Migration and environment in Ghana: A cross-district analysis of human mobility and vegetation dynamics. Environ. Urban. 2010, 22, 107–123. [Google Scholar] [CrossRef]
- Diffenbaugh, N.S.; Sloan, L.C.; Snyder, M.A.; Bell, J.L.; Kaplan, J.; Shafer, S.L.; Bartlein, P.J. Vegetation sensitivity to global anthropogenic carbon dioxide emissions in a topographically complex region. Glob. Biogeochem. Cycles 2003, 17, 1067. [Google Scholar] [CrossRef]
- Liu, T.; Zhang, Q.; Li, T.; Zhang, K. Dynamic Vegetation Responses to Climate and Land Use Changes over the Inner Mongolia Reach of the Yellow River Basin, China. Remote Sens. 2023, 15, 3531. [Google Scholar] [CrossRef]
- Yang, L.; Shen, F.; Zhang, L.; Cai, Y.; Yi, F.; Zhou, C. Quantifying influences of natural and anthropogenic factors on vegetation changes using structural equation modeling: A case study in Jiangsu Province, China. J. Clean. Prod. 2021, 280, 124330. [Google Scholar] [CrossRef]
- Zhang, P.; Cai, Y.; Yang, W.; Yi, Y.; Yang, Z.; Fu, Q. Contributions of climatic and anthropogenic drivers to vegetation dynamics indicated by NDVI in a large dam-reservoir-river system. J. Clean. Prod. 2020, 256, 120477. [Google Scholar] [CrossRef]
- Ren, Z.; Tian, Z.; Wei, H.; Liu, Y.; Yu, Y. Spatiotemporal evolution and driving mechanisms of vegetation in the Yellow River Basin, China during 2000–2020. Ecol. Indic. 2022, 138, 108832. [Google Scholar] [CrossRef]
- Peng, W.; Kuang, T.; Tao, S. Quantifying influences of natural factors on vegetation NDVI changes based on geographical detector in Sichuan, western China. J. Clean. Prod. 2019, 233, 353–367. [Google Scholar] [CrossRef]
- Wang, J.F.; Li, X.H.; Christakos, G.; Liao, Y.L.; Zhang, T.; Gu, X.; Zheng, X.Y. Geographical detectors-based health risk assessment and its application in the neural tube defects study of the Heshun Region, China. Int. J. Geogr. Inf. Sci. 2010, 24, 107–127. [Google Scholar] [CrossRef]
- Huo, H.; Sun, C. Spatiotemporal variation and influencing factors of vegetation dynamics based on Geodetector: A case study of the northwestern Yunnan Plateau, China. Ecol. Indic. 2021, 130, 108005. [Google Scholar] [CrossRef]
- Zhu, L.; Meng, J.; Zhu, L. Applying Geodetector to disentangle the contributions of natural and anthropogenic factors to NDVI variations in the middle reaches of the Heihe River Basin. Ecol. Indic. 2020, 117, 106545. [Google Scholar] [CrossRef]
- Cui, L.; Pang, B.; Zhao, G.; Ban, C.; Ren, M.; Peng, D.; Zuo, D.; Zhu, Z. Assessing the Sensitivity of Vegetation Cover to Climate Change in the Yarlung Zangbo River Basin Using Machine Learning Algorithms. Remote Sens. 2022, 14, 1556. [Google Scholar] [CrossRef]
- Bao, Z.; Zhang, J.; Wang, G.; Guan, T.; Jin, J.; Liu, Y.; Li, M.; Ma, T. The sensitivity of vegetation cover to climate change in multiple climatic zones using machine learning algorithms. Ecol. Indic. 2021, 124, 107443. [Google Scholar] [CrossRef]
- Shi, Y.; Jin, N.; Ma, X.; Wu, B.; He, Q.; Yue, C.; Yu, Q. Attribution of climate and human activities to vegetation change in China using machine learning techniques. Agric. For. Meteorol. 2020, 294, 108146. [Google Scholar] [CrossRef]
- Zhou, X.; Wen, H.; Zhang, Y.; Xu, J.; Zhang, W. Landslide susceptibility mapping using hybrid random forest with GeoDetector and RFE for factor optimization. Geosci. Front. 2021, 12, 101211. [Google Scholar] [CrossRef]
- Zhan, Y.; Fan, J.; Meng, T.; Li, Z.; Yan, Y.; Huang, J.; Chen, D.; Sui, L. Analysis on vegetation cover changes and the driving factors in the mid-lower reaches of Hanjiang River Basin between 2001 and 2015. Open Geosci. 2021, 13, 675–689. [Google Scholar] [CrossRef]
- Jiang, W.; Niu, Z.; Wang, L.; Yao, R.; Gui, X.; Xiang, F.; Ji, Y. Impacts of drought and climatic factors on vegetation dynamics in the Yellow River Basin and Yangtze River Basin, China. Remote Sens. 2022, 14, 930. [Google Scholar] [CrossRef]
- Yi, L.; Sun, Y.; Ouyang, X.; Yin, S. Identifying the Impacts of Climate Change and Human Activities on Vegetation Cover Changes: A Case Study of the Yangtze River Basin, China. Int. J. Environ. Res. Public Health 2022, 19, 6239. [Google Scholar] [CrossRef] [PubMed]
- Savitzky, A.; Golay, M.J. Smoothing and differentiation of data by simplified least squares procedures. Anal. Chem. 1964, 36, 1627–1639. [Google Scholar] [CrossRef]
- Jiang, W.; Yuan, L.; Wang, W.; Cao, R.; Zhang, Y.; Shen, W. Spatio-temporal analysis of vegetation variation in the Yellow River Basin. Ecol. Indic. 2015, 51, 117–126. [Google Scholar] [CrossRef]
- Peng, S.; Ding, Y.; Liu, W.; Li, Z. 1 km monthly temperature and precipitation dataset for China from 1901 to 2017. Earth Syst. Sci. Data 2019, 11, 1931–1946. [Google Scholar] [CrossRef]
- Jing, W.; Yang, Y.; Yue, X.; Zhao, X. A spatial downscaling algorithm for satellite-based precipitation over the Tibetan plateau based on NDVI, DEM, and land surface temperature. Remote Sens. 2016, 8, 655. [Google Scholar] [CrossRef]
- Wei, J.; Li, Z.; Lyapustin, A.; Sun, L.; Peng, Y.; Xue, W.; Su, T.; Cribb, M. Reconstructing 1-km-resolution high-quality PM2. 5 data records from 2000 to 2018 in China: Spatiotemporal variations and policy implications. Remote Sens. Environ. 2021, 252, 112136. [Google Scholar] [CrossRef]
- Oda, T.; Maksyutov, S. A very high-resolution (1 km × 1 km) global fossil fuel CO2 emission inventory derived using a point source database and satellite observations of nighttime lights. Atmos. Chem. Phys. 2011, 11, 543–556. [Google Scholar] [CrossRef]
- Yang, J.; Huang, X. The 30 m annual land cover dataset and its dynamics in China from 1990 to 2019. Earth Syst. Sci. Data 2021, 13, 3907–3925. [Google Scholar] [CrossRef]
- Theil, H. A rank-invariant method of linear and polynomial regression analysis. Indag. Math. 1950, 12, 173. [Google Scholar]
- Sen, P.K. Estimates of the regression coefficient based on Kendall's tau. J. Am. Stat. Assoc. 1968, 63, 1379–1389. [Google Scholar] [CrossRef]
- Jiang, L.; Bao, A.; Guo, H.; Ndayisaba, F. Vegetation dynamics and responses to climate change and human activities in Central Asia. Sci. Total Environ. 2017, 599, 967–980. [Google Scholar] [CrossRef] [PubMed]
- Liu, Y.; Li, J. Geographic detection and optimizing decision of the differentiation mechanism of rural poverty in China. Acta Geogr. Sin. 2017, 72, 161–173. [Google Scholar]
- Chen, Y.; Zhou, Y.; Zhang, H.; Wang, C.; Wang, X. Spatiotemporal variations of surface ozone and its influencing factors across Tibet: A Geodetector-based study. Sci. Total Environ. 2022, 813, 152651. [Google Scholar] [CrossRef] [PubMed]
- Breiman, L. Random forests. Mach. Learn. 2001, 45, 5–32. [Google Scholar] [CrossRef]
- Kohestani, V.; Hassanlourad, M.; Ardakani, A. Evaluation of liquefaction potential based on CPT data using random forest. Nat. Hazards 2015, 79, 1079–1089. [Google Scholar] [CrossRef]
- Sahin, E.K.; Colkesen, I.; Kavzoglu, T. A comparative assessment of canonical correlation forest, random forest, rotation forest and logistic regression methods for landslide susceptibility mapping. Geocarto Int. 2020, 35, 341–363. [Google Scholar] [CrossRef]
- Guyon, I.; Weston, J.; Barnhill, S.; Vapnik, V. Gene selection for cancer classification using support vector machines. Mach. Learn. 2002, 46, 389–422. [Google Scholar] [CrossRef]
- Zhang, L.; Luo, H.; Zhang, X. Land-Greening Hotspot Changes in the Yangtze River Economic Belt during the Last Four Decades and Their Connections to Human Activities. Land 2022, 11, 605. [Google Scholar] [CrossRef]
- Liu, C.; Liang, Y.; Zhao, Y.; Liu, S.; Huang, C. Simulation and analysis of the effects of land use and climate change on carbon dynamics in the Wuhan city circle area. Int. J. Environ. Res. Public Health 2021, 18, 11617. [Google Scholar] [CrossRef] [PubMed]
- Li, J.; Bi, M.; Wei, G. Investigating the Impacts of Urbanization on Vegetation Net Primary Productivity: A Case Study of Chengdu–Chongqing Urban Agglomeration from the Perspective of Townships. Land 2022, 11, 2077. [Google Scholar] [CrossRef]
- Du, J.; Shu, J.; Yin, J.; Yuan, X.; Jiaerheng, A.; Xiong, S.; He, P.; Liu, W. Analysis on spatio-temporal trends and drivers in vegetation growth during recent decades in Xinjiang, China. Int. J. Appl. Earth Obs. Geoinf. 2015, 38, 216–228. [Google Scholar] [CrossRef]
- Liu, L.; Wang, Y.; Wang, Z.; Li, D.; Zhang, Y.; Qin, D.; Li, S. Elevation-dependent decline in vegetation greening rate driven by increasing dryness based on three satellite NDVI datasets on the Tibetan Plateau. Ecol. Indic. 2019, 107, 105569. [Google Scholar] [CrossRef]
- Qu, S.; Wang, L.; Lin, A.; Zhu, H.; Yuan, M. What drives the vegetation restoration in Yangtze River basin, China: Climate change or anthropogenic factors? Ecol. Indic. 2018, 90, 438–450. [Google Scholar] [CrossRef]
- Liu, X.; Zhu, X.; Li, S.; Liu, Y.; Pan, Y. Changes in growing season vegetation and their associated driving forces in China during 2001–2012. Remote Sens. 2015, 7, 15517–15535. [Google Scholar] [CrossRef]
- Niu, X.; Li, Y.; Li, M.; Zhang, T.; Meng, H.; Zhang, Z.; Wang, B.; Zhang, W. Understanding vegetation structures in green spaces to regulate atmospheric particulate matter and negative air ions. Atmos. Pollut. Res. 2022, 13, 101534. [Google Scholar] [CrossRef]
- Rai, P.K. Impacts of particulate matter pollution on plants: Implications for environmental biomonitoring. Ecotoxicol. Environ. Saf. 2016, 129, 120–136. [Google Scholar] [CrossRef]
- Bai, L.; Jiang, L.; Yang, D.-y.; Liu, Y.-b. Quantifying the spatial heterogeneity influences of natural and socioeconomic factors and their interactions on air pollution using the geographical detector method: A case study of the Yangtze River Economic Belt, China. J. Clean. Prod. 2019, 232, 692–704. [Google Scholar] [CrossRef]
- Meng, X.; Gao, X.; Li, S.; Lei, J. Spatial and temporal characteristics of vegetation NDVI changes and the driving forces in Mongolia during 1982–2015. Remote Sens. 2020, 12, 603. [Google Scholar] [CrossRef]


| Class | Code | Factors | Unit | Spatial Resolution | Data Sources |
|---|---|---|---|---|---|
| Climate | X1 | Annual cumulative precipitation (Pre) | 0.1 mm | 1 km | http://www.geodata.cn/ accessed on 28 August 2022 |
| X2 | Annual average temperature (Tem) | 0.1 °C | 1 km | ||
| X3 | Annual average wind speed (wind speed) | m/s | 1 km | ||
| X4 | Annual average concentration of PM2.5 (PM2.5) | μg/m3 | 1 km | ||
| Humanity | X5 | Population density (PD) | People/km2 | 1 km | https://hub.worldpop.org/ accessed on 18 September 2022 |
| X6 | Annual average CO2 emissions (CO2 emissions) | ton | 1 km | https://db.cger.nies.go.jp/dataset/ODIAC/ accessed on 25 October 2022 | |
| X7 | The land-use/land-cover (LULC) | types | 30 m | http://irsip.whu.edu.cn/resources/CLCD.php accessed on 8 November 2022 | |
| Topography | X8 | DEM | m | 30 m | https://e4ftl01.cr.usgs.gov/MEASURES/SRTMGL1.003/2000.02.11/ accessed on 8 November 2022 |
| X9 | Aspect | 30 m | |||
| X10 | Slope | 30 m |
| X1 | X2 | X3 | X4 | X5 | X6 | X7 | X8 | X9 | X10 | |
|---|---|---|---|---|---|---|---|---|---|---|
| -value | 0.0655 | 0.2373 | 0.1248 | 0.0963 | 0.1740 | 0.0698 | 0.3013 | 0.2415 | 0.0013 | 0.1177 |
| p-value | 0.0000 | 0.0000 | 0.0000 | 0.0000 | 0.0000 | 0.0000 | 0.0000 | 0.0000 | 0.0000 | 0.0000 |
| X1 | X2 | X3 | X4 | X5 | X6 | X7 | X8 | X9 | X10 | |
|---|---|---|---|---|---|---|---|---|---|---|
| -value | 0.0255 | 0.1857 | 0.1152 | 0.0790 | 0.1779 | 0.1018 | 0.3649 | 0.2173 | 0.0013 | 0.1392 |
| p-value | 0.0000 | 0.0000 | 0.0000 | 0.0000 | 0.0000 | 0.0000 | 0.0000 | 0.0000 | 0.0000 | 0.0000 |
Disclaimer/Publisher’s Note: The statements, opinions and data contained in all publications are solely those of the individual author(s) and contributor(s) and not of MDPI and/or the editor(s). MDPI and/or the editor(s) disclaim responsibility for any injury to people or property resulting from any ideas, methods, instructions or products referred to in the content. |
© 2023 by the authors. Licensee MDPI, Basel, Switzerland. This article is an open access article distributed under the terms and conditions of the Creative Commons Attribution (CC BY) license (https://creativecommons.org/licenses/by/4.0/).
Share and Cite
Peng, C.; Du, L.; Ren, H.; Li, X.; Li, X. Spatial Heterogeneity of Combined Factors Affecting Vegetation Greenness Change in the Yangtze River Economic Belt from 2000 to 2020. Remote Sens. 2023, 15, 5693. https://doi.org/10.3390/rs15245693
Peng C, Du L, Ren H, Li X, Li X. Spatial Heterogeneity of Combined Factors Affecting Vegetation Greenness Change in the Yangtze River Economic Belt from 2000 to 2020. Remote Sensing. 2023; 15(24):5693. https://doi.org/10.3390/rs15245693
Chicago/Turabian StylePeng, Chuanjing, Lin Du, Hangxing Ren, Xiong Li, and Xiangyuan Li. 2023. "Spatial Heterogeneity of Combined Factors Affecting Vegetation Greenness Change in the Yangtze River Economic Belt from 2000 to 2020" Remote Sensing 15, no. 24: 5693. https://doi.org/10.3390/rs15245693