
Coastal Vulnerability Assessment of Thrace Peninsula: Implications for Climate Change and Sea Level Rise


1
Department of Geography, Faculty of Arts and Sciences, Tekirdag Namık Kemal University, Tekirdag 59030, Türkiye
2
Environmental Engineering, Faculty of Engineering, Tekirdag Namık Kemal University, Tekirdag 59030, Türkiye
3
School of Computing, Geographic Information Science Center, University of Wyoming, Laramie, WY 82071, USA
4
Faculty of Engineering, Soil Sciences and Plant Nutrition, Tekirdag Namık Kemal University, Tekirdag 59030, Türkiye
*
Author to whom correspondence should be addressed.
Remote Sens. 2023, 15(23), 5592; https://doi.org/10.3390/rs15235592
Submission received: 9 October 2023
/
Revised: 26 November 2023
/
Accepted: 28 November 2023
/
Published: 1 December 2023
(This article belongs to the Section Ocean Remote Sensing)
Abstract
:This study evaluates the susceptibility of the coastal regions on the Thrace Peninsula to sea-level rise (SLR) and the corresponding vulnerability to climate change. To achieve this, a high-resolution digital elevation model with a 5 m granularity was used to apply the Coastal Vulnerability Index, adjusted for region-specific coastal sensitivity factors. Various global mean sea-level rise scenarios were examined for the near-term (2020–2050), mid-term (2050–2100), and long-term (2100–2300) to assess the impact of SLR. The examination of the immediate consequences of SLR on coastal areas included the analysis of land cover characteristics in the near-term. Results indicate that the Thrace Peninsula is highly susceptible to natural and socio-economic hazards caused by SLR. The concentration of population and socio-economic activities in coastal regions is a primary contributing factor to this vulnerability. In addition, hydrodynamic models are used to enhance understanding of the effects of SLR. The study reveals limited preparedness for planned adaptations to SLR in the region. The data highlight the crucial necessity for policymakers, researchers, and stakeholders to collaborate in executing strategic interventions and proactive initiatives. Upholding the ecological, economic, and societal welfare of the Thrace Peninsula, as well as comparable areas, necessitates addressing both the vulnerability and resilience of immediate coastal regions.
1. Introduction
Sea level rise (SLR thereafter) caused by anthropogenic global climate change is a major threat leading to dramatic changes in natural and human systems in coastal regions [1,2,3,4]. As the most productive transition areas between land and sea, coastal zones correspond to ecosystems where a significant portion of the human population and socio-economic activities are concentrated [5,6]. Therefore, SLR-related coastal risks have increased with the development and demographic concentration in coastal areas [7]. In particular, low-lying coasts and their cities, which are defined as dynamic, ecologically, and economically valuable systems [8], have become vulnerable to such hazards [9].
SLR poses multiple challenges for coastal areas. It results in more frequent and severe coastal flooding, infrastructure damage, and threats to communities [10]. The loss of land due to coastal erosion affects residential areas, natural habitats, and agriculture [11]. Saltwater intrusion contaminates freshwater resources, impacting drinking water and ecosystems [12]. Infrastructure faces deterioration, leading to the potential displacement of populations. Coastal ecosystems and economic activities such fisheries and tourism are disrupted, while increased insurance costs affect coastal properties [13]. Cities must adapt by constructing sea defenses, elevated structures, and improved stormwater management. Thus, the need to adapt to the impacts of SLR has emerged. Adapting to changes in these areas requires planned interventions [7]. However, the implementation of these plans is still limited in many coastal areas where technical, economic, and social factors are unfavorable [14].
Hydrodynamic models are increasingly used both in scientific research [15] and in the private sector to understand the spatiotemporal effects of SLR [16]. Among these, “bathtub” models [17,18,19] are the most preferred approach [20], as they perform better than other models depending on environmental conditions. Recently, bathtub models have been applied more precisely and practically using spatiotemporal data and analysis based on geographic information systems (GIS) techniques [21]. Thus, the assessment of the spatiotemporal impacts of SLR is estimated more accurately [16]. In this regard, studies have been performed in many countries, including Jakarta [22], Indonesia [23], the United Arab Emirates [24], Egypt [25], Colombia [26], Guinea [8], China [27], Mexico [28], Greece [29], and India [30].
Given that Türkiye (previously known as Turkey) is encompassed by seas on three sides, it stands out as one of the countries that will encounter an extensive range of disasters attributable to SLR [31]. The coastal areas of the country may be exposed to some risks as a result of SLR effects in the short-, mid-, and long-term [32]. As a matter of fact, it has already been reported that SLR will cause salinization and increases in the cost of infrastructure systems and coastal planning in the short- and mid-term, migration and economic problems in the long-term [33]. Within this context, it has been determined that the locales that will encounter the most significant impact from SLR are anticipated to be the coastal cities throughout Türkiye, with a particular emphasis on the low-lying coastal regions [34,35]. Whilst it may not be feasible to eliminate the impacts of SLR through available tools and technologies, it is anticipated that a variety of risks facing low-lying coastal regions can be mitigated to a certain extent [36]. To undertake this objective, the initial step entails assessing the spatial implications of forthcoming alterations in the SLR. Nonetheless, the extant literature suggests a considerable gap in this particular domain [32,37,38,39,40,41,42]. The reason for this is twofold: first, the models used in studies struggle to keep pace with rapidly developing technology, making software updates difficult. Second, the inability to determine global SLR according to local conditions results in inaccurate findings, leading to another issue. Therefore, it is imperative to use modern methods and approaches to address the spatiotemporal effects of SLR and obtain objective outputs, as this is crucial for the future of coastal regions.
The rising sea levels in the Thrace Peninsula exert a multifaceted impact on population dynamics and subsequently shape the region’s economic development. As sea levels rise, coastal communities face increased vulnerabilities, prompting migrations and demographic shifts [32]. The influx or displacement of residents profoundly influences the demographic composition of the region, altering labor markets, skill sets, and social structures [43]. Concurrently, economic development undergoes transformation as these demographic changes impact local industries, employment patterns, and resource allocation [44]. Furthermore, the evolving socio-economic landscape is intricately tied to the adaptation strategies adopted in response to SLR, including infrastructure investments, land-use planning, and community resilience initiatives [45]. This interplay between SLR, population dynamics, and economic development forms a complex web of interactions, necessitating a nuanced understanding for effective policy formulation and sustainable development in the Thrace Peninsula region.
The Thrace Peninsula in Türkiye is a vulnerable area for SLR due to its location, with the Black Sea, the Marmara Sea, and the Aegean Sea surrounding it on three sides. This peninsula has a lengthy coastline of 922 km. The sensitive and delicate nature of the Thrace Peninsula renders it vulnerable to the impacts of climate change, necessitating the identification and evaluation of potential effects on its coastal regions. Specifically, one potential natural risk resulting from climate change is SLR, as noted by [24,44]. Moreover, Kuleli [40] demonstrated that the study area is among the most vulnerable regions in Türkiye in terms of natural and socio-economic risks, as determined by calculations using nine different parameters. Consequently, comprehending the spatiotemporal impacts of future SLR in the study area is critical in maintaining an acceptable balance between human activities and the environment.
The present study aims to investigate the areas of high sensitivity and vulnerability to SLR in the coastal region of the Thrace Peninsula of Türkiye. The research questions guiding this inquiry are as follows: (1) What are the areas that exhibit high susceptibility to SLR and are highly vulnerable to its effects in the coastal regions of the study area? (2) What alterations are expected in potential SLR areas based on distinct global mean sea level projections for short-, medium-, and long-term scenarios? (3) What are the direct impacts of SLR on coastal areas related to land cover of the study area in the near-term? (4) Can hydrodynamic models be utilized to gain insights into how changes in sea level will impact coastal areas? (5) What are the limitations associated with utilizing hydrodynamic models and global mean sea level estimates to comprehend the implications of climate change-induced SLR on coastal areas?
The present study utilizes geospatial data and GIS techniques to examine the effects of SLR. The study employs the Coastal Vulnerability Index (CVI) analysis to identify the vulnerable coastal areas against SLR impacts. The SLR projections for the near-term (2020–2050), mid-term (2050–2100), and long-term (2100–2300) are generated based on the low and high probability scenarios of the Intergovernmental Panel on Climate Change (IPCC) 2019, and local changes are considered. Subsequently, the potential risk and hazard maps are produced by considering the factors that influence the region. Additionally, the impact of SLR on different land cover features is examined to predict the direct effects of SLR on coastal areas in the near-term. The study aims to contribute to integrated planning for coastal land management in the Thracian Peninsula, where the severe impacts of SLR are expected to have dramatic consequences [24]. This study fills the research gap in the literature and provides valuable insights for climate change adaptation and reconstruction planning in the Thracian Peninsula.
2. Materials and Methods
2.1. The Study Area
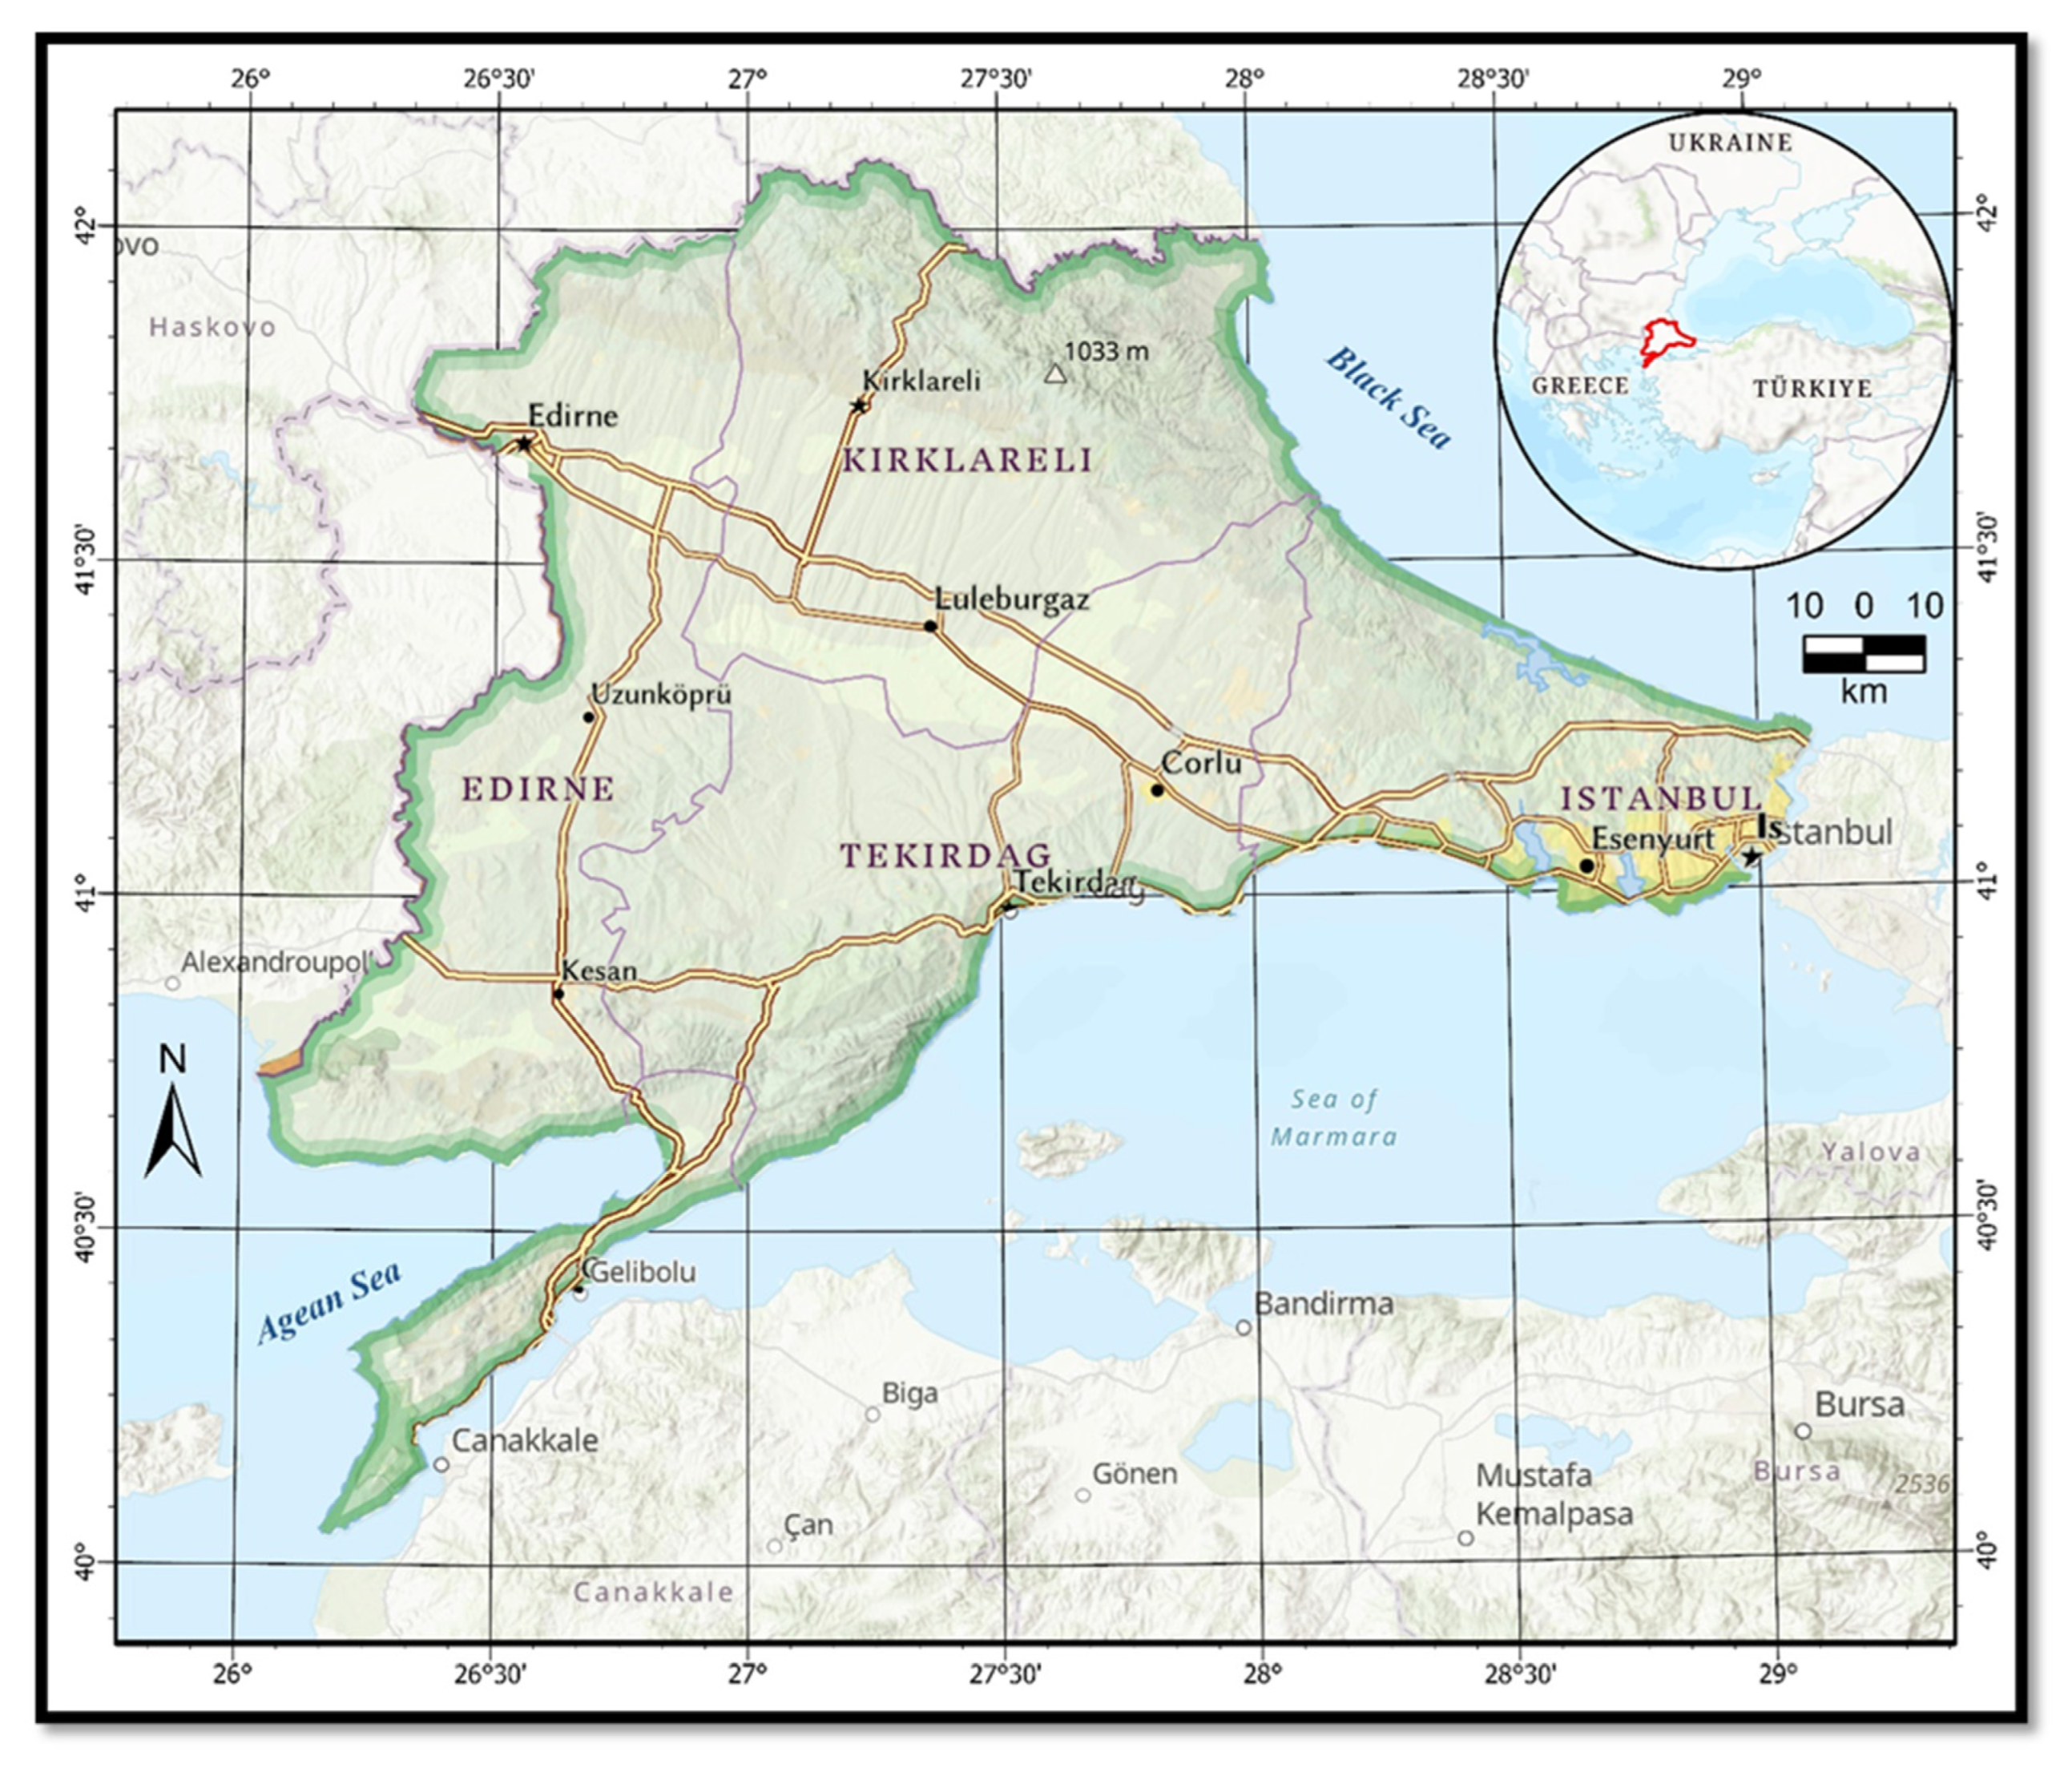
The study area is the north-western corner of Türkiye [46]. This area, called Turkish Thrace or Eastern Thrace, corresponds to the south-eastern border of the Balkan Peninsula and the entire territory of Türkiye in European continent (Figure 1). The study area lies between 26°02′02″–29°08′23″ eastern longitude and 40°01′29″–42°07′04″ northern latitude. Surrounded by natural borders, such as the Black Sea, Marmara Sea and Aegean Sea, the coastline length of the study area is 922 km.
In terms of agriculture and industry, the study area is one of the most valuable regions in Türkiye [47,48]. The study area encompasses natural areas of significant biodiversity, as well as critical economic sectors (including logistics, transportation, and tourism) and urban centers such as Istanbul and Tekirdağ, where the intersection of land, sea, and human resources is prominent.
2.2. Data and Methods
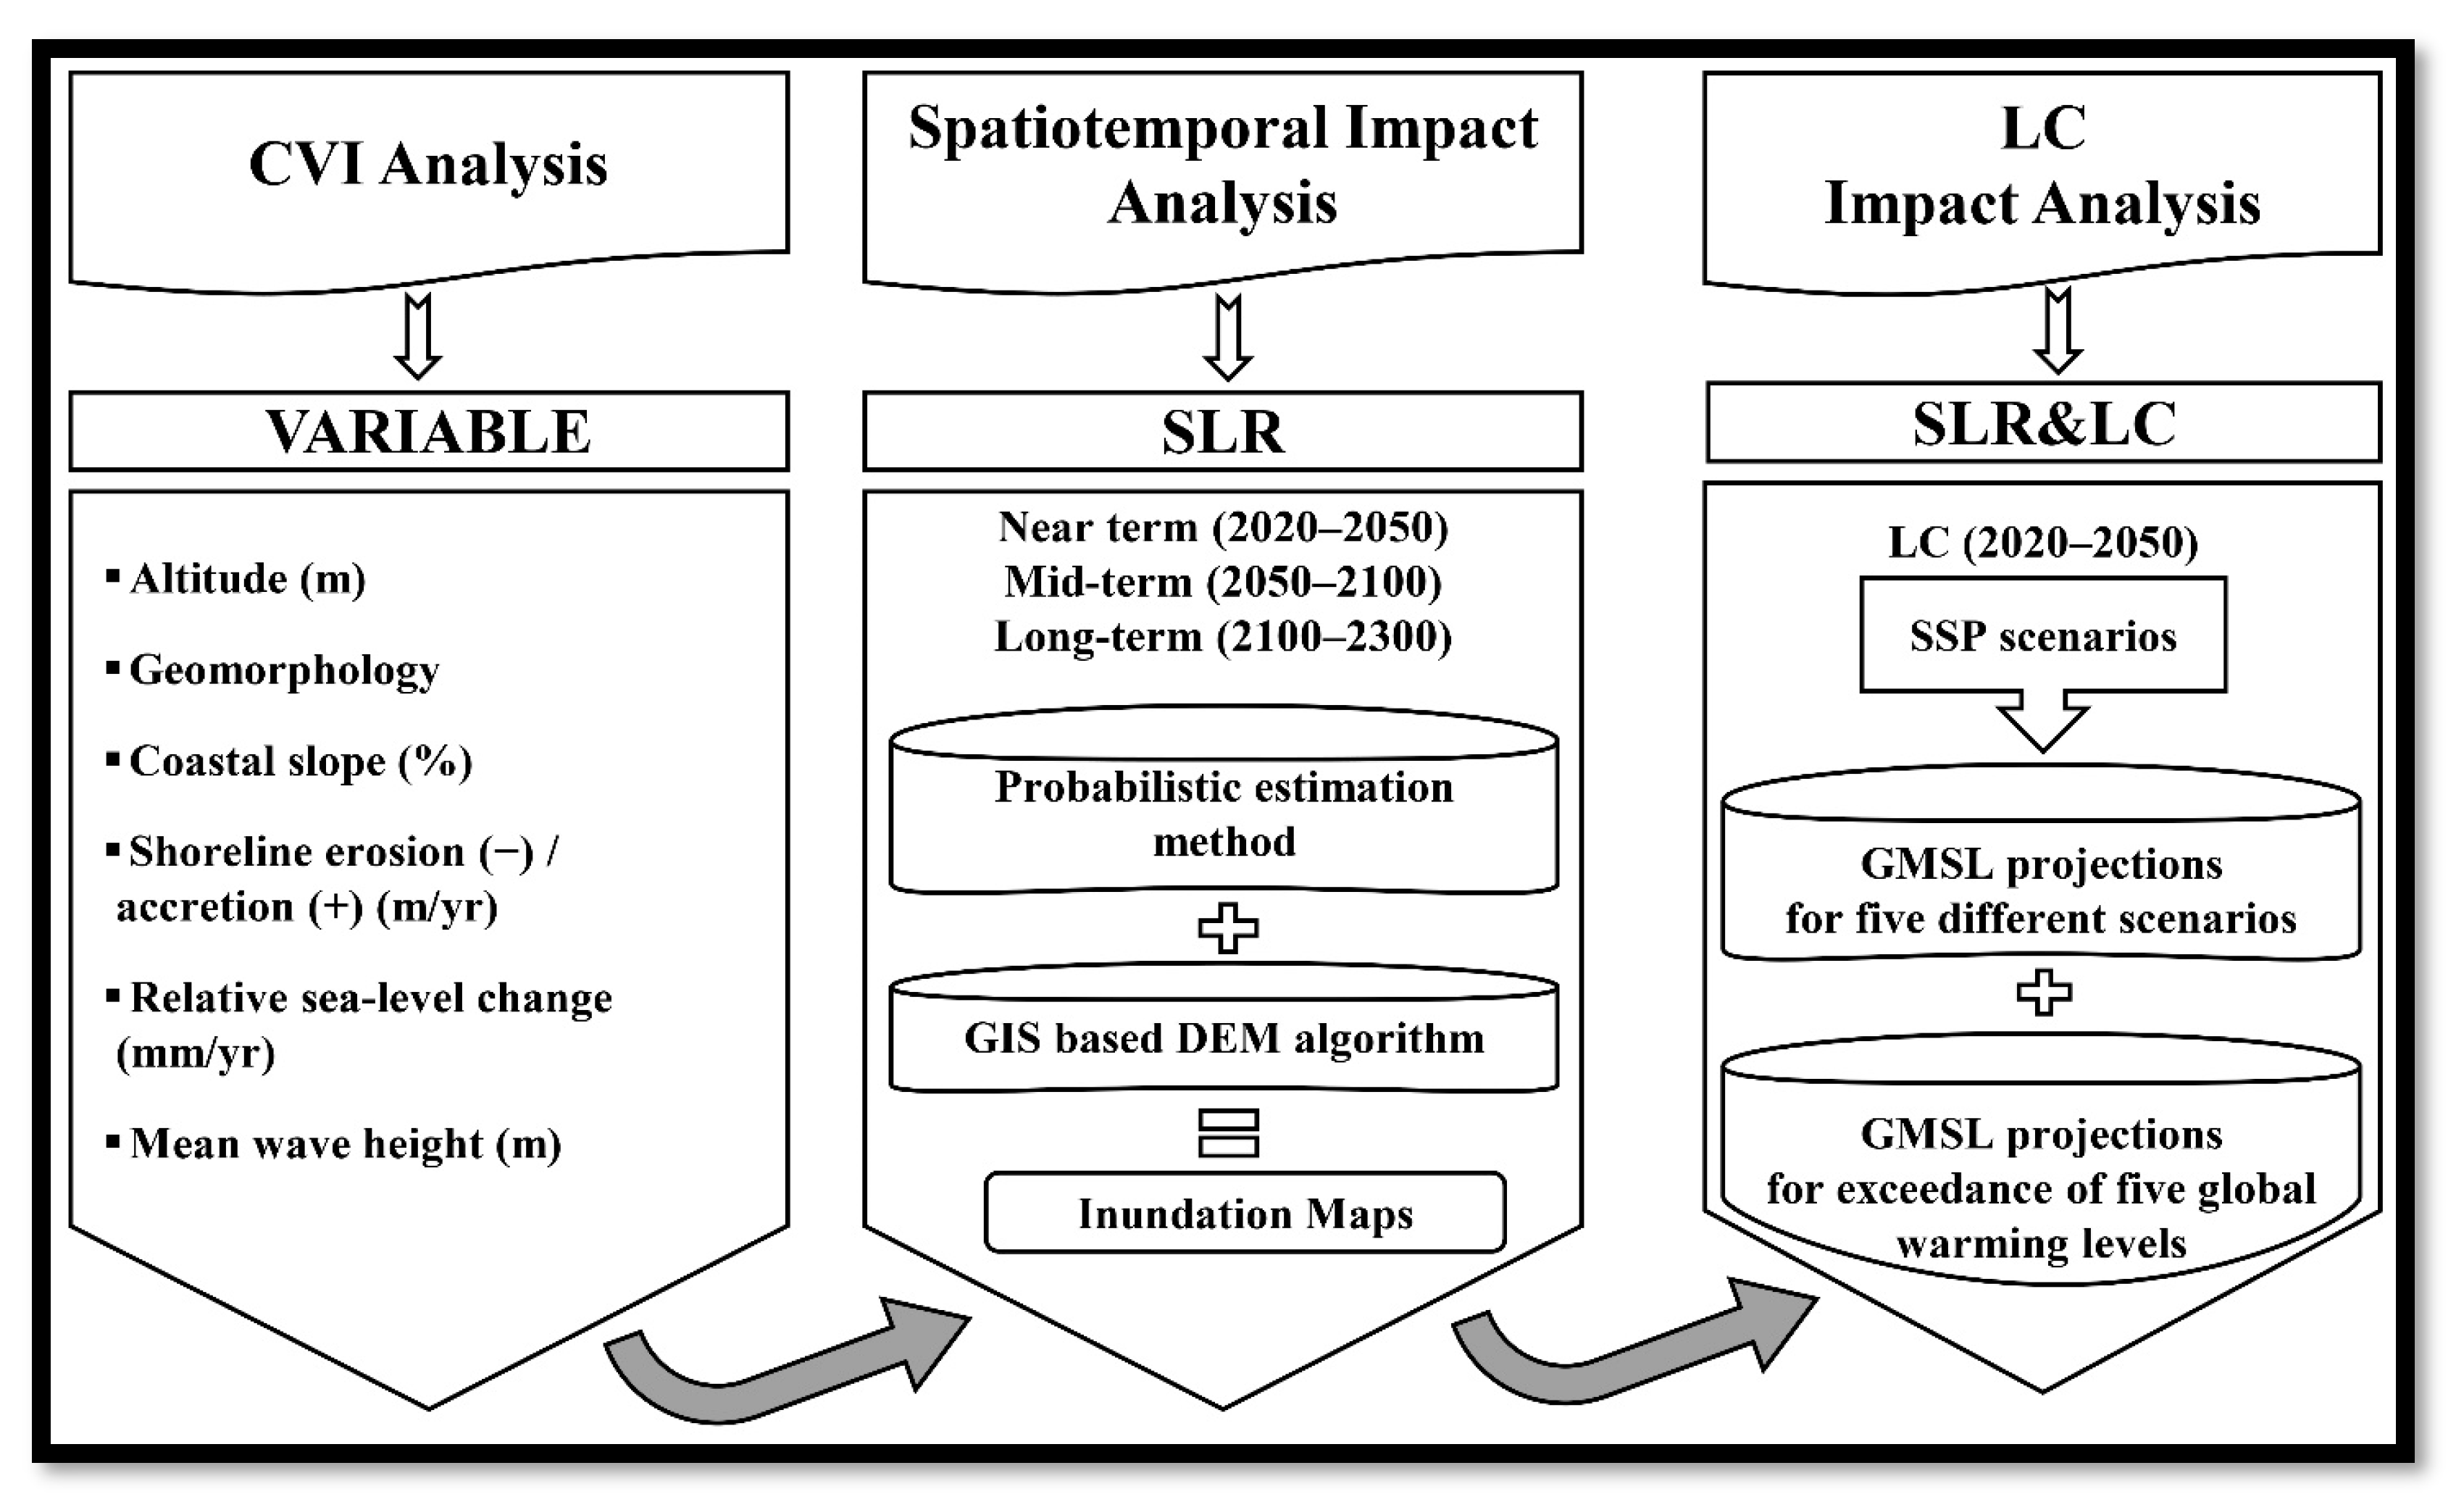
The study utilized 5 m spatial resolution digital elevation model (DEM) data [49]. These data are part of a series of digital elevation models (DEM) created by the Republic of Türkiye Ministry of National Defense General Directorate of Mapping. Generated through the automatic matching of stereo aerial photographs with a resolution of 5 m, this DEM has a confidence level of 90% and a vertical accuracy of ±3 m (https://www.harita.gov.tr/urun/sayisal-yuzey-modeli-5-m-seviye-0-sym5-l0-/1, accessed on 5 May 2021). The dataset is restricted by the governmental agency from public access but is available for scientific and educational purposes upon request. Moreover, the study integrated two data sources to augment its dataset for model development: ESRI’s land cover projection for 2050 and customized IPCC scenarios tailored to the local geography, as illustrated in Table 1. The study was conducted in three phases, as illustrated in Figure 2.
In the first phase, the highly vulnerable areas in the coastal zone were identified using CVI analysis. The CVI is a quantitative tool used to assess the vulnerability of coastal areas to the impacts of SLR [50]. It integrates several factors, such as altitude, geomorphology, coastal slope, shoreline changes, relative sea-level change, and mean wave height, to categorize vulnerability levels. The CVI provides a comprehensive evaluation of the potential risks posed by SLR in a particular coastal zone. The index helps identify areas with differing levels of vulnerability, assisting in the creation of tailored adaptation strategies and policies [48]. The analysis was modified according to the factors affecting coastal vulnerability in the Thrace Peninsula [51] and was applied according to Equation (1) [29].
where CVI is the Coastal Vulnerability Index, a is the altitude (m), b is the geomorphology, c is the coastal slope (%), d is the shoreline erosion (−)/accretion (+) (m/yr), e is the relative sea-level change (mm/yr), and f is the mean wave height (m).
Variables for the CVI were sourced from various datasets (Table 1). Variables a, b, and c in the equation are derived from digital elevation model; variable d is derived from shoreline changes monitored from ESRI land cover projection of 2050 [52]; and variables e and f are derived from data produced for the seas around the study area [53]. The resulting values were categorized into five vulnerability levels (1 = Very low; 2 = Low; 3 = Medium; 4 = High; 5 = Very high) following Karymbalis et al. [51] to determine coastal sensitivity.
In the second phase, the spatiotemporal effects of sea-level rise (SLR) due to climate change were assessed. Different scenarios from the Intergovernmental Panel on Climate Change (IPCC) 6th Assessment Report for the years 2020–2300 were adapted to the study area. To achieve this, we adapted the near-term (2020–2050), mid-term (2050–2100), and long-term (2100–2300) SLR measures of different global mean sea level (GMSL) projections from the low and high probability scenarios of the 6th Assessment Report of the IPCC 2019 to the study area. This was performed because SLR changes can differ significantly from the global average due to local characteristics [6]. The probabilistic forecasting method, as outlined by Bevacqua et al. [54], was then applied to calculate potential changes in local mean sea level (LMSL) using Equation (2), considering different SLR scenarios [30].
where LMSLProject is the total of LMSL based on different scenarios for the 2050–2100–2300 periods; LMSL0 is the original total of LMSL, relative to the reference period of 1993–2019; GMSL0 is the original total of GMSL for different scenarios, relative to the reference period of 1995–2014; and GMSLProject is total of GMSL based on different scenarios for the 2050–2100–2300 periods.
The spatiotemporal displacement of the coastline due to possible future changes in the LMSL in the study area was determined using a GIS-based DEM algorithm [22]. This algorithm, known as terrain analysis in arc GIS, creates a digital representation of Earth’s surface using geospatial data. It interpolates elevation values to generate a continuous surface model, valuable for mapping applications. This algorithm, as expressed in Equation (3), estimates changes in elevation over time, allowing for the assessment of how the coastline may shift due to SLR under different scenarios, facilitating spatial analysis within the GIS framework.
where is the DEM at time () (i.e., year) , is the DEM in the baseline year (), and s is the spatially differentiated rate of SLR based on different scenarios for 2050–2100–2300 periods.
Furthermore, the equations were employed to generate prospective SLR maps for varied scenario years. These inundation maps underwent analysis in the GIS-based spatial analyst module to assess SLR impact areas within the study region across diverse projection scenarios. Additionally, a pragmatic population projection for the region was derived by calculating the average annual growth rate (AAGR) based on population data from 2010 to 2020.
where is the population of the region in 2020 and is the population of the region in 2010.
Subsequently, the AAGR was utilized to project the population in 2050:
where is the projected population of the region in 2050 and the AAGR is calculated as 0.021.
In the final phase, we evaluated the impact of climate change induced SLR on the coastal zone using ESRI’s projected land cover data for the study area in 2020 and 2050 [8,52]. Land cover data comprise a dataset obtained using land cover data for the years 2010 and 2018, provided by Clark University. The dataset has a pixel resolution of 300 m and corresponds to the predicted land cover for the year 2050, modeled by country. The relevant data, produced using the multilayer perceptron (MLP) neural network method in the Land Change Modeler, focus on human-induced land cover changes but do not predict sea-level rise (https://www.arcgis.com/home/item.html?id=3cce97cba8394287bcaf60f7618a5500, accessed on 10 May 2021). ESRI’s data served as a basis for comparing and assessing SLR-induced changes in land cover by 2050. The choice of these years was influenced by Türkiye’s development of climate change adaptation strategies for the near-term (2020–2050) [55]. The land cover data were integrated with inundation maps based on the commitments of the Shared Socio-economic Pathway (SSP) scenario for 2050, considering various probability cases and global warming levels from the 6th Assessment IPCC. This approach aimed to enhance policy coherence and support climate adaptation planning and implementation [56].
The study utilized the latest version of GIS software, ArcGIS Pro (Version 3.0.1), for generating thematic maps and conducting spatial analyses. Various fieldwork activities were conducted to validate the accuracy and reliability of conditions in low coastal areas.
3. Results
3.1. Coastal Vulnerability Index Analysis Results
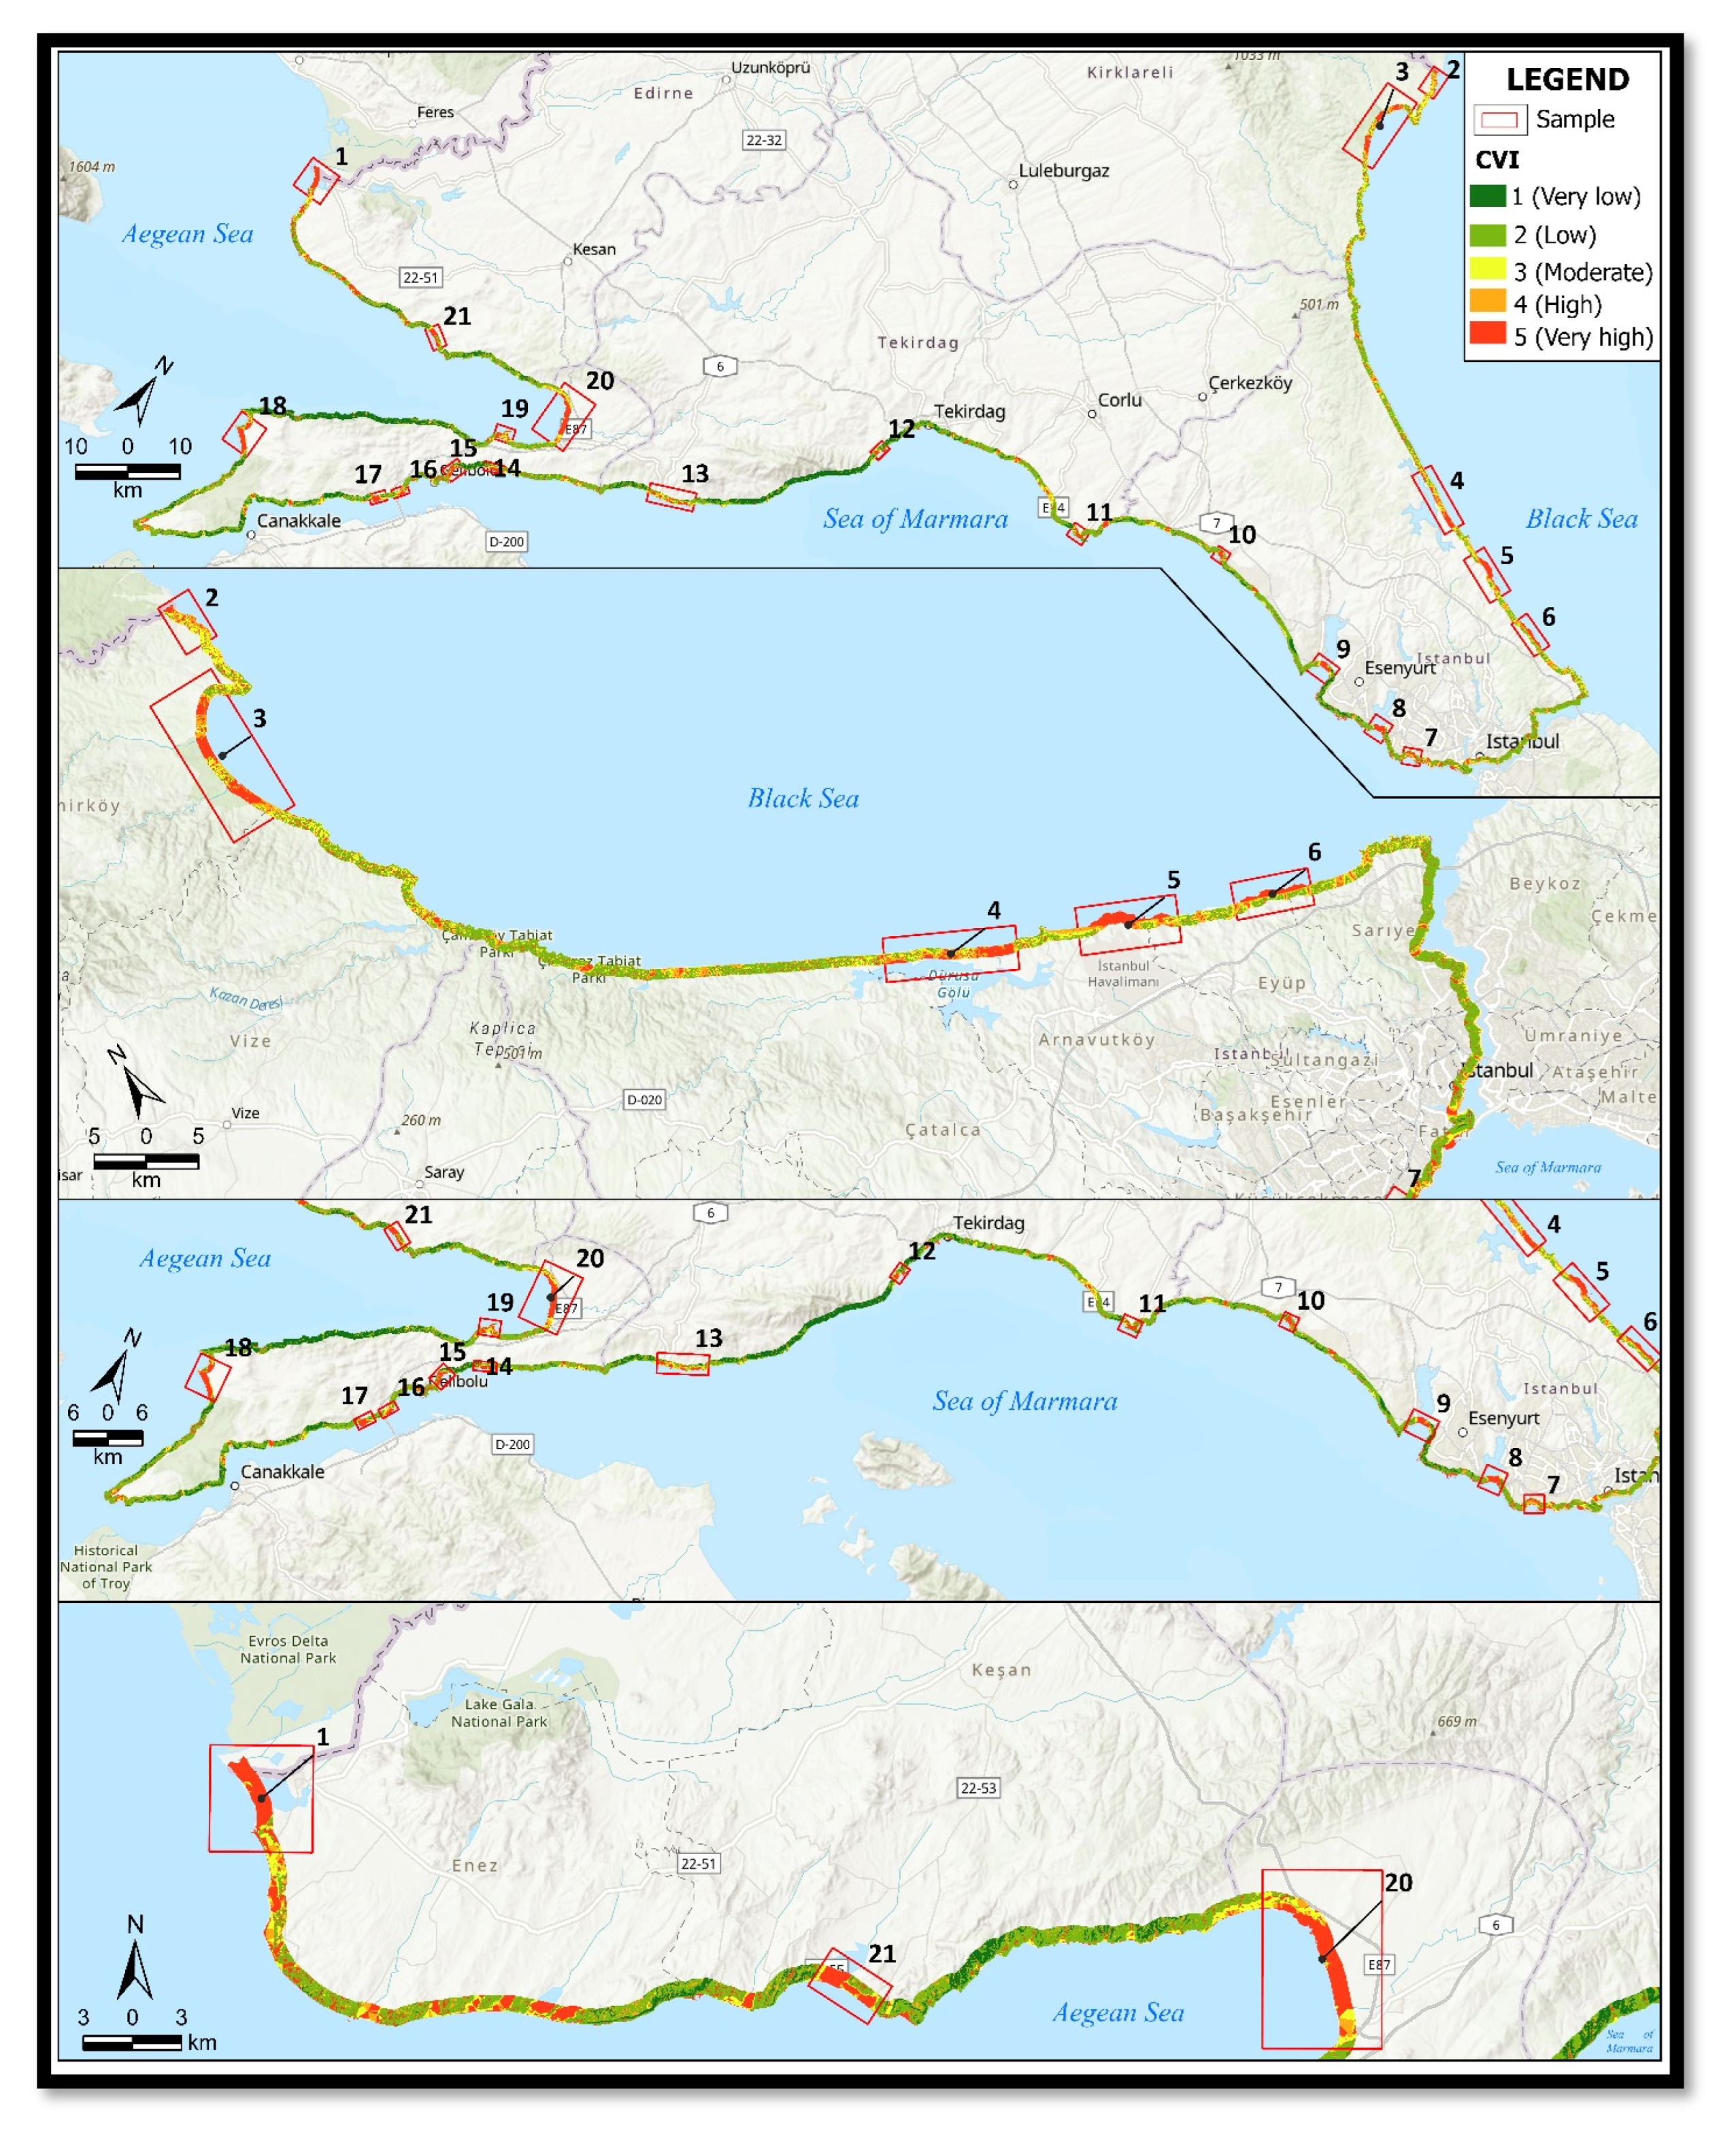
Six different variables characterizing the coastal features in the study area were categorized, scored, and combined with the Coastal Vulnerability Index (CVI) equation. Thus, the spatial distribution of vulnerability to SLR impacts caused by climate change in the coastal zone of the study area was mapped (Figure 3).
Based on the CVI analysis map, the study area exhibits coastal vulnerability across all categories, although the degree of vulnerability varies based on changes in the natural characteristics of the coastline. CVI values were calculated for the coastline in the study area, ranging from 0 to 51.03, with an average value of 5.97. The areas of highest vulnerability, where the coastline shows the most vulnerable characteristics, are natural regions with rich ecological areas and floodplains in the study area. The primary factor that contributes to risk in these high vulnerability areas is the sensitive natural structure of the land. Furthermore, the CVI values for the urban coastal regions in the study area, which are characterized by low coastal features and are directly or indirectly impacted by human and economic activities, fall into the high and very high categories. Consequently, the coastal areas that are numbered in Figure 3 are highly vulnerable.
3.2. Impacts of SLR on Local Projections with SSP
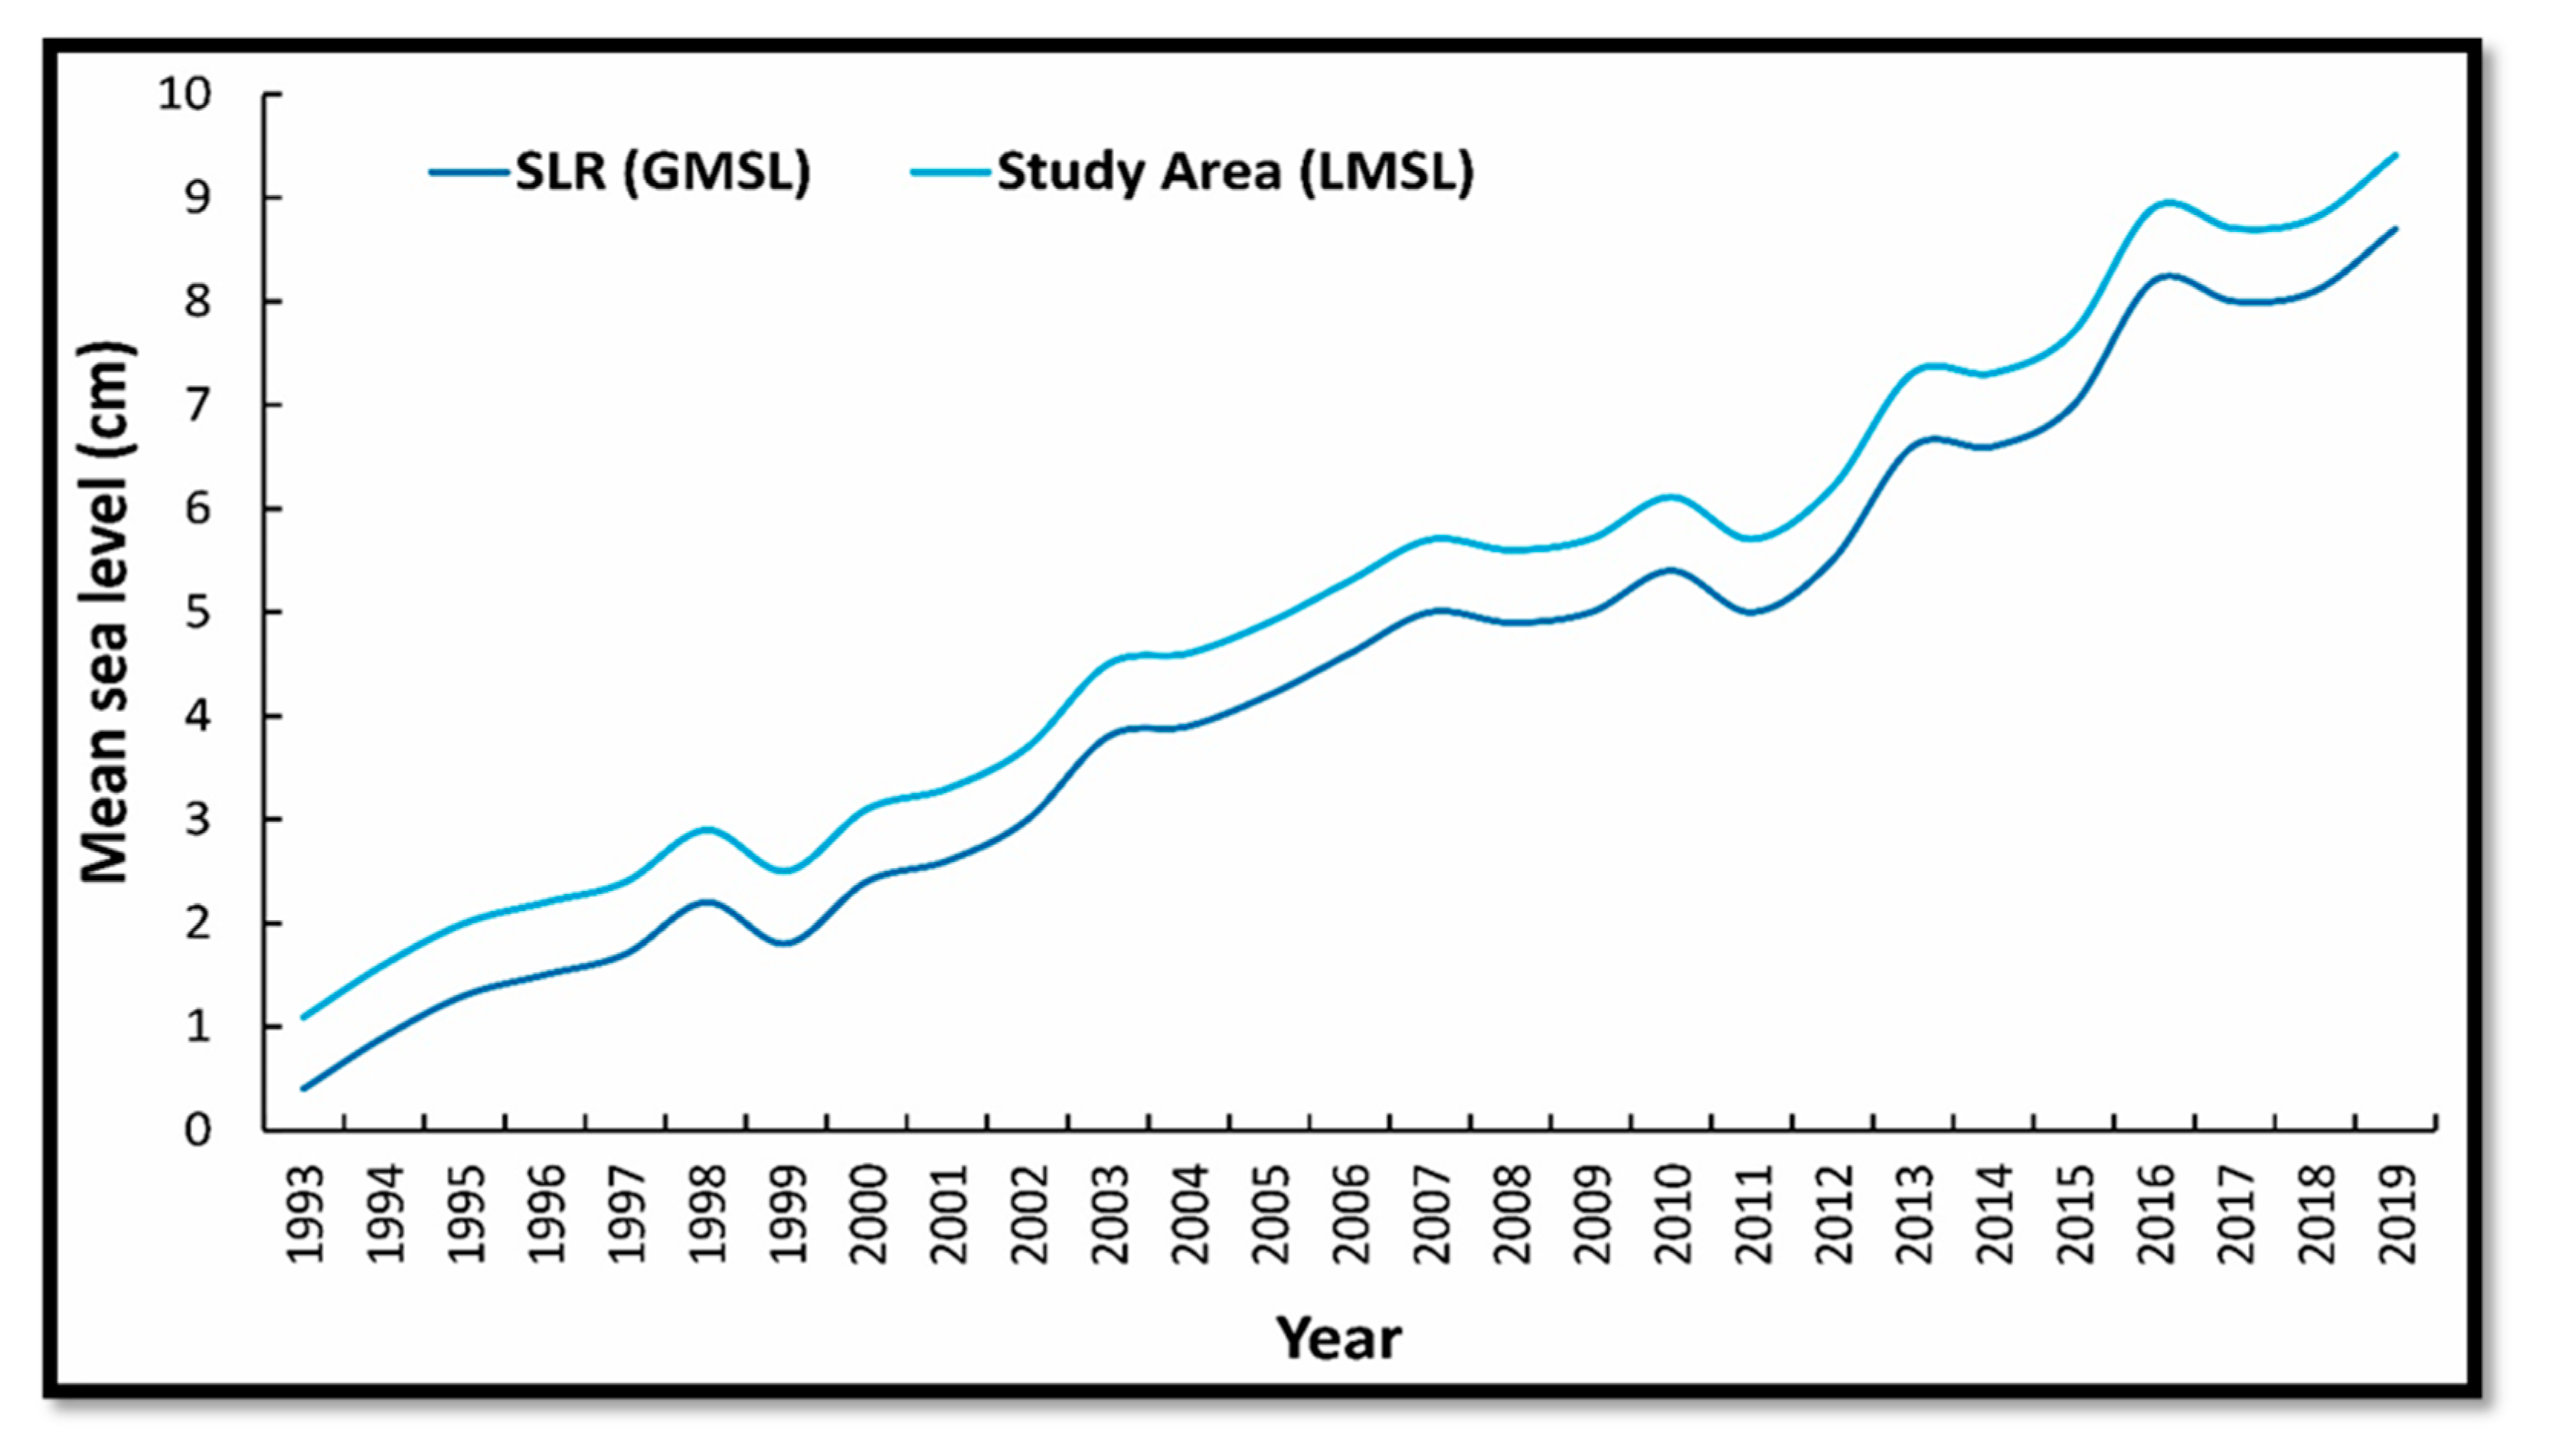
Sea level change measurements have been conducted in the study area since the 1950s, but more sensitive global mean sea level (GMSL) measurements have also been taken since 1993 (Figure 4). From 1993 to 2019, there has been an average of over 5 mm of SLR per year. The annual SLR was determined to be 5.31 mm (1874–2019) for the Black Sea region, 8.79 mm (1984–2019) for the Marmara Sea, and 0.84 mm (1969–2019) for the Aegean Sea based on measurements made on the shores of the study area [57]. These measurements indicate a higher level of sea level increase than GMSL measurements in the study area. Therefore, the spatiotemporal effect of possible future SLR measurements in the study area was estimated based on the LMSL estimates. It should be noted that although mean sea level has remained stable since the end of the last deglaciation (~3000 years ago), tide gauge measurements indicate an average SLR of 1.7 ± 0.3 mm/year since 1950 [58].
The LMSL values of the study area were determined in the present study for the 2050–2100 period based on measurements estimated using five different probability cases and five different global warming levels of the SSP scenario for 2050, as presented in the 6th Assessment Report of the IPCC. Additionally, LMSL values were calculated according to the estimation results of the low and high probability projections for the years 2100–2300. The estimated LMSL values were used to predict and map the spatiotemporal effects of SLR in the study area (Table 2; Figure 5 and Figure 6).
The SSP scenario [59], created through contemporary techniques, is a method that typically produces reliable outcomes. It has been ascertained that the study area exhibits a substantial SLR impact as a result of its local characteristics across five distinct probability scenarios and different warming levels between the period of 2050–2100 (Table 2). Thus, varying scenarios within the study area project SLR of 0.88–0.93 m and 1.08–1.47 m in 2050 and 2100, correspondingly. Similarly, differing levels of global warming in the same region are expected to lead to GMSL increases between 0.88–0.95 m and 1.14–1.51 m. These increases will impact the total area by 0.47–0.48% and 0.54–0.63% according to different scenarios and by 0.47–0.48% and 0.56–0.64% according to different global warming levels.
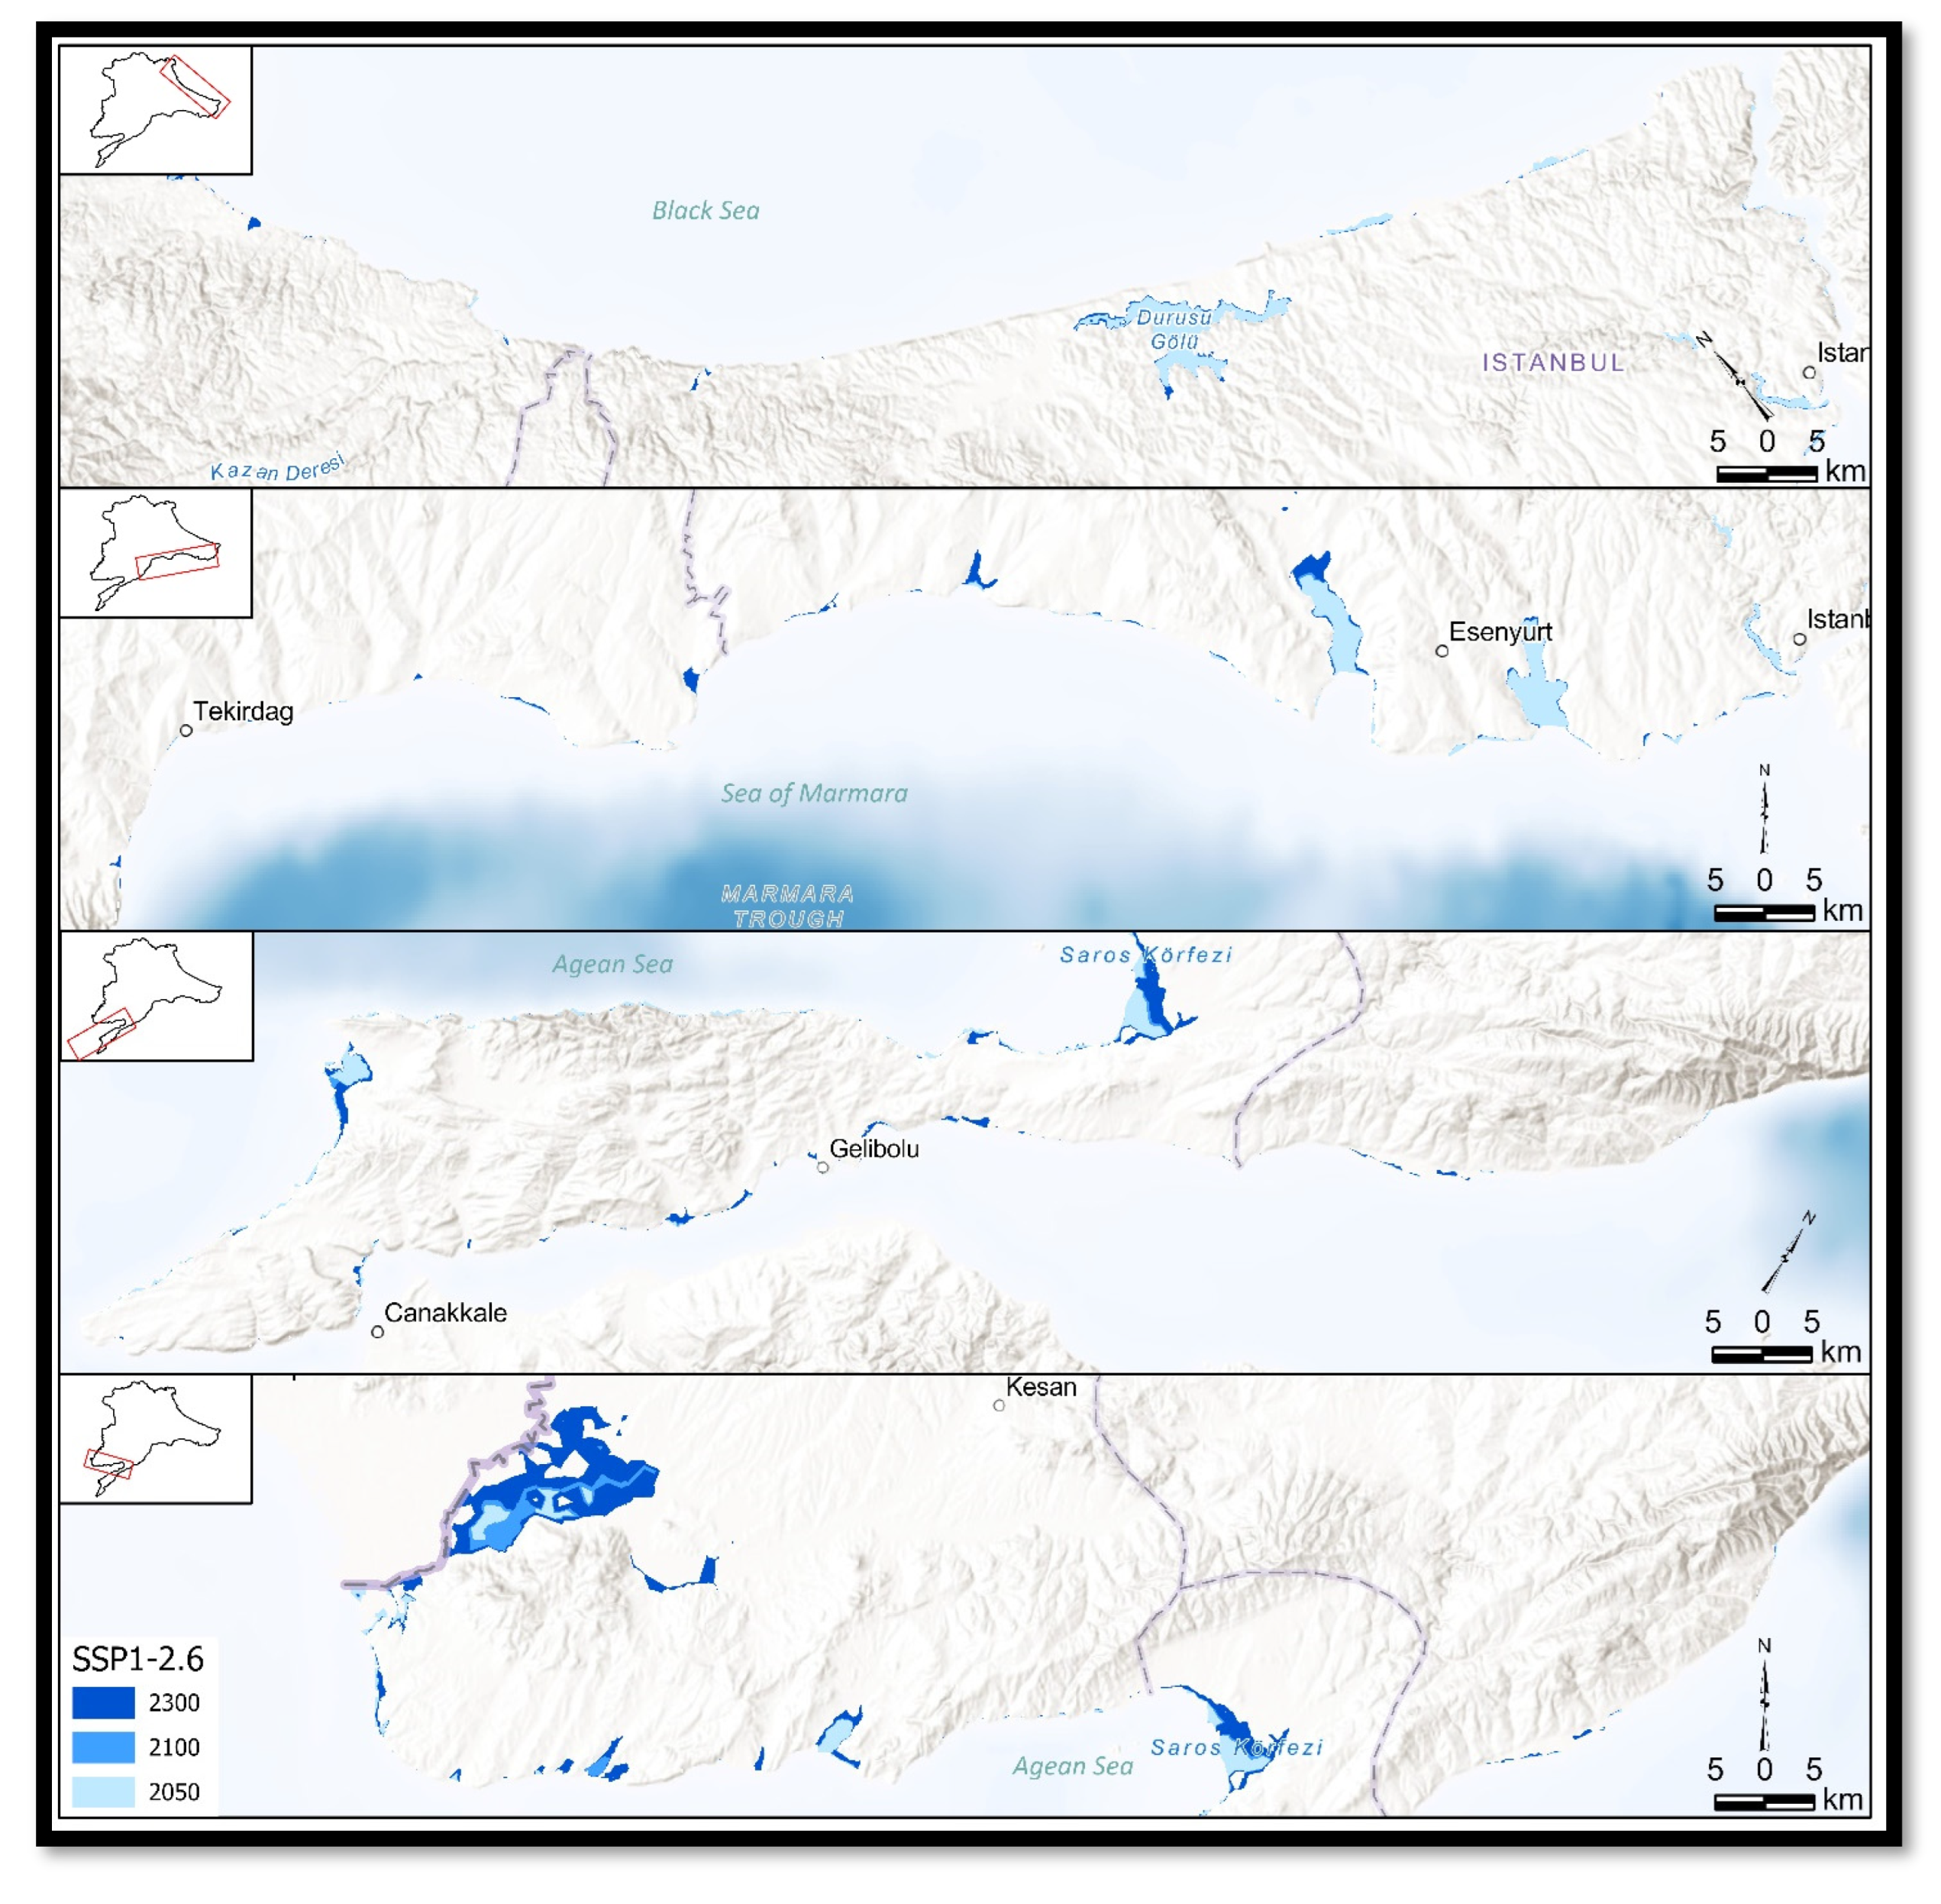
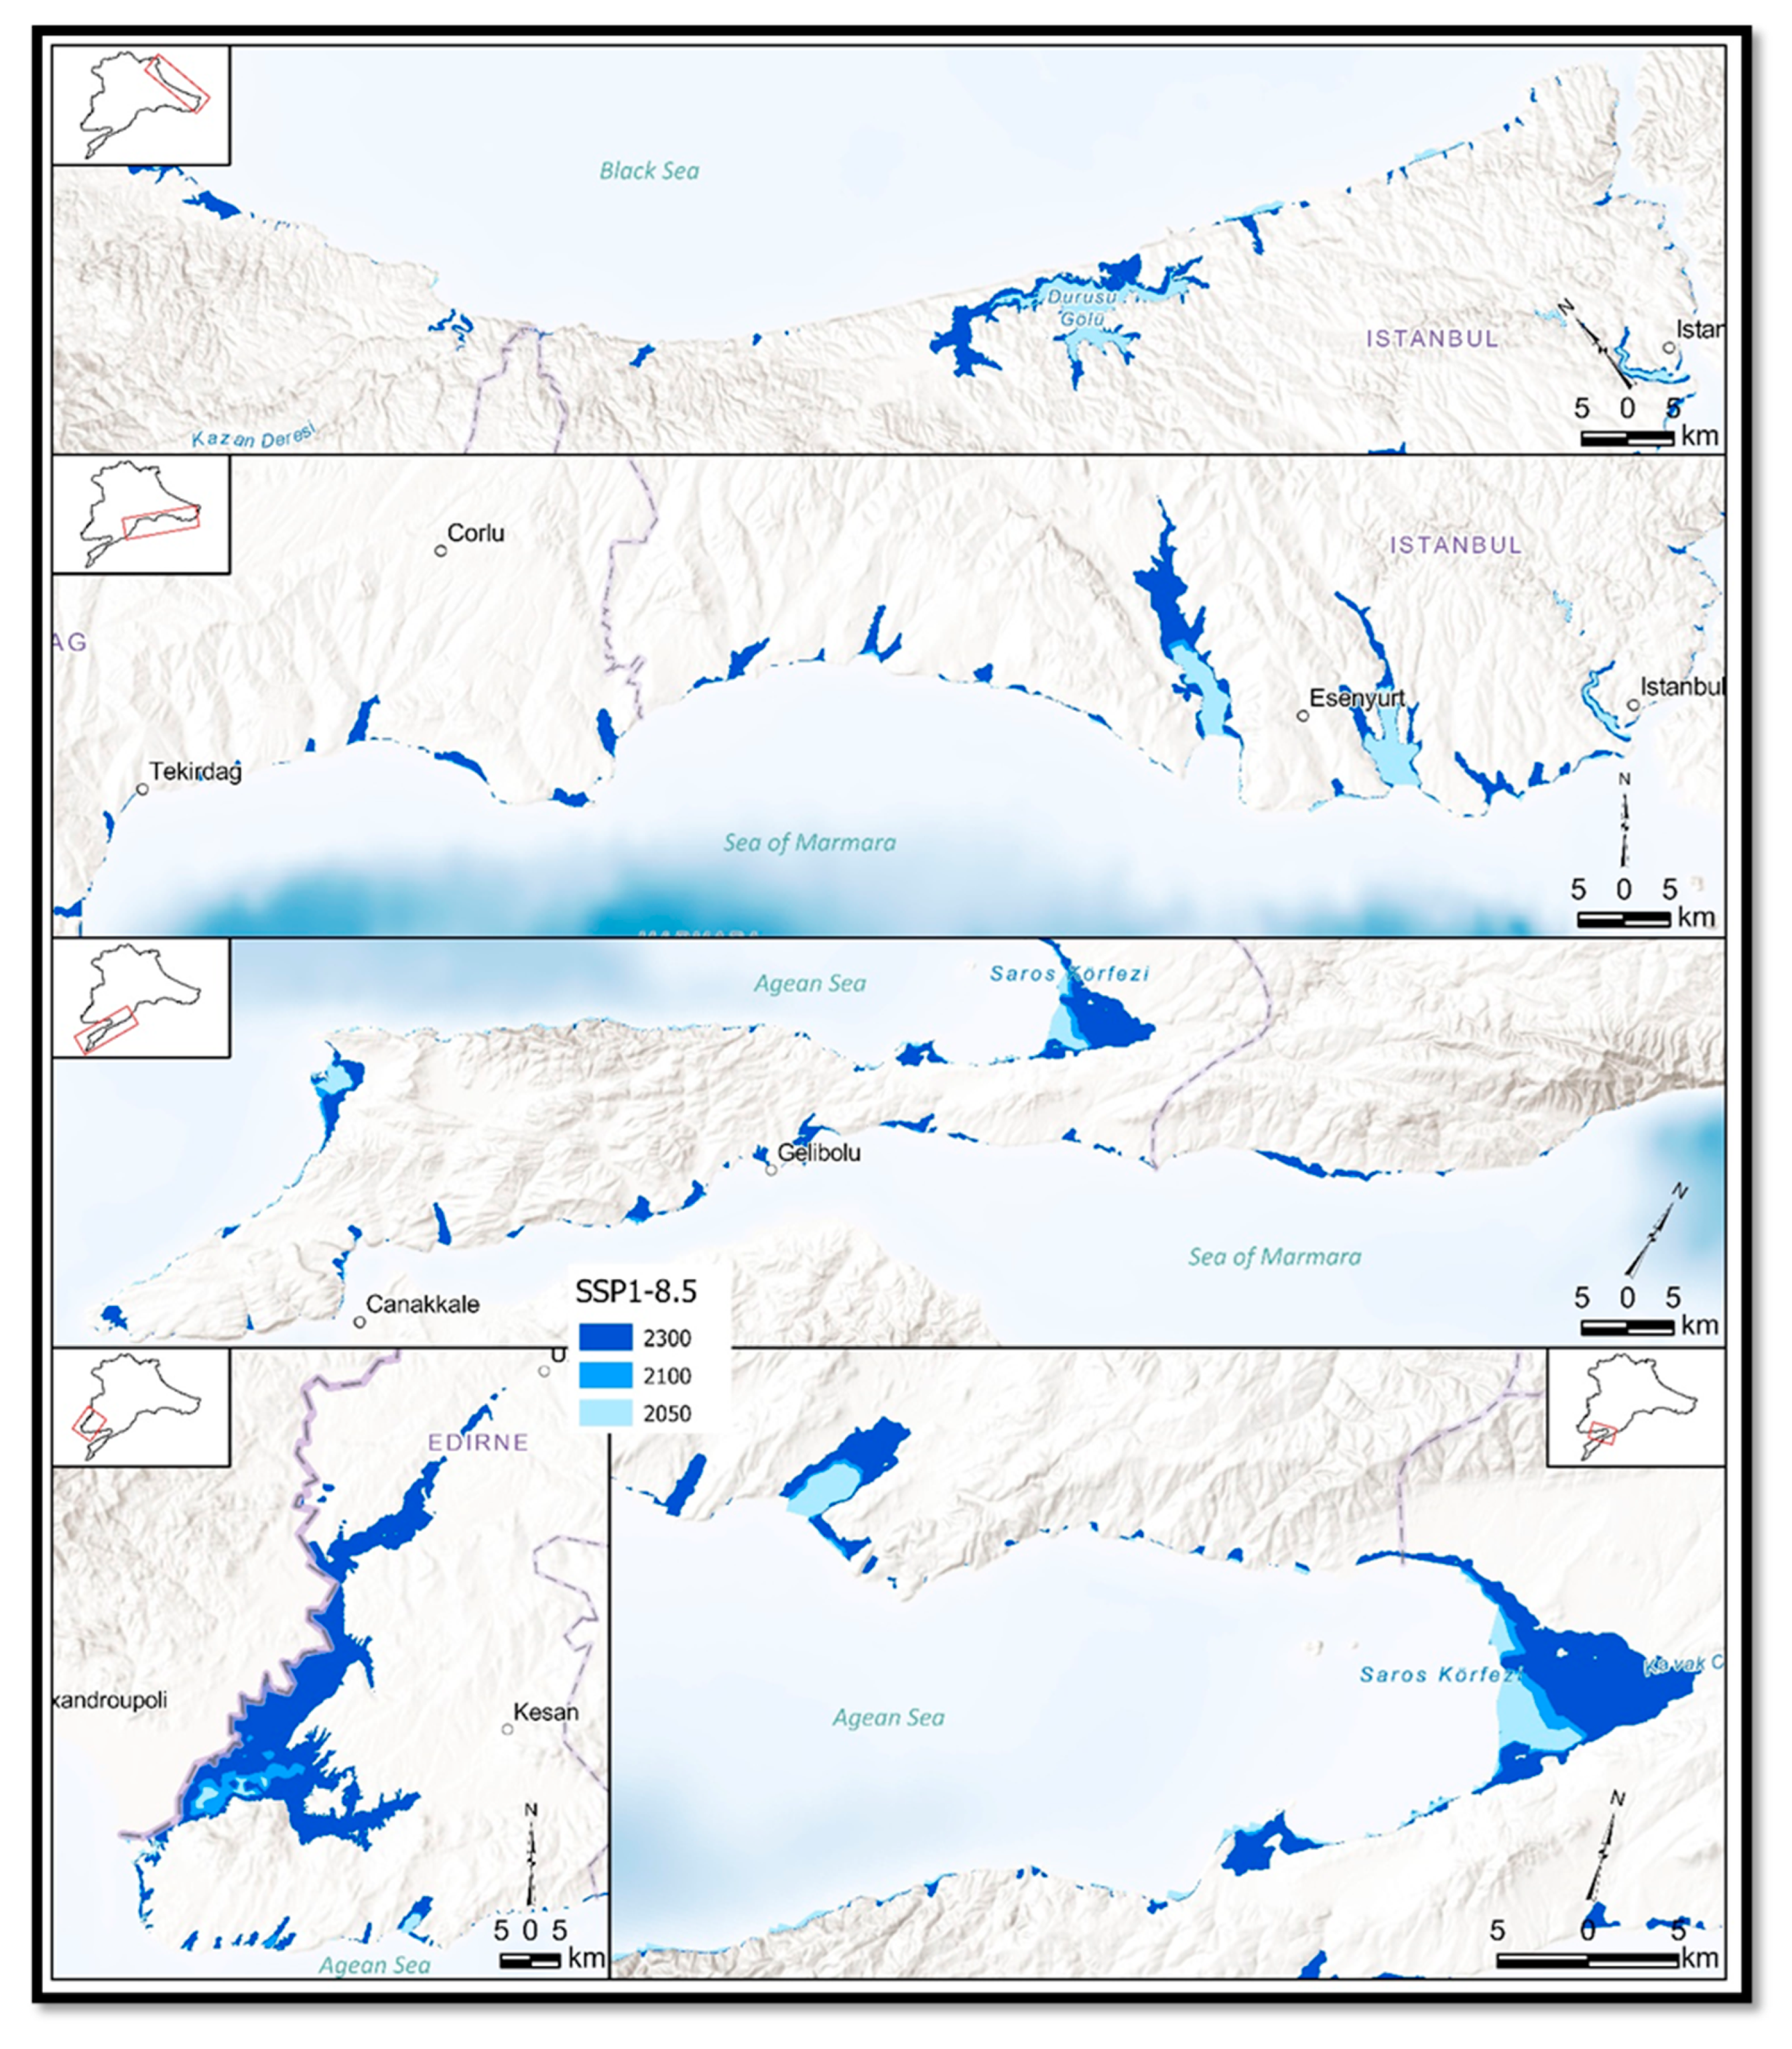
The findings from the scenarios predict a rise in sea level, leading to the flooding of 47,724 ha and 55,661 ha in the study area by 2100 for low- and high-emission projections, respectively. Similarly, by 2300, 67,936 ha and 216,170 ha are estimated to be inundated for low and high emission projections, respectively. Consequently, a significant portion of land utilized for diverse purposes such as agriculture, national parks, residential areas, and ports will be submerged, equating to a minimum of 2.02% and a maximum of 9.16% of the study area (Table 3).
3.3. SLR Impact on Coastal Land Use and Management
Assessing the impact of SLR caused by climate change on both the natural environment and socioeconomic activities in the coastal zone is of great importance [60]. A more comprehensive understanding of this impact can be achieved by considering land use and land cover characteristics [29,61]. Such assessments are critical for effective coastal and land management planning [23]. Therefore, in this study, SLR scenario results have been analyzed while considering the 2020–2050 land cover classes to provide a more complete picture of the potential impact of SLR (Figure 7).
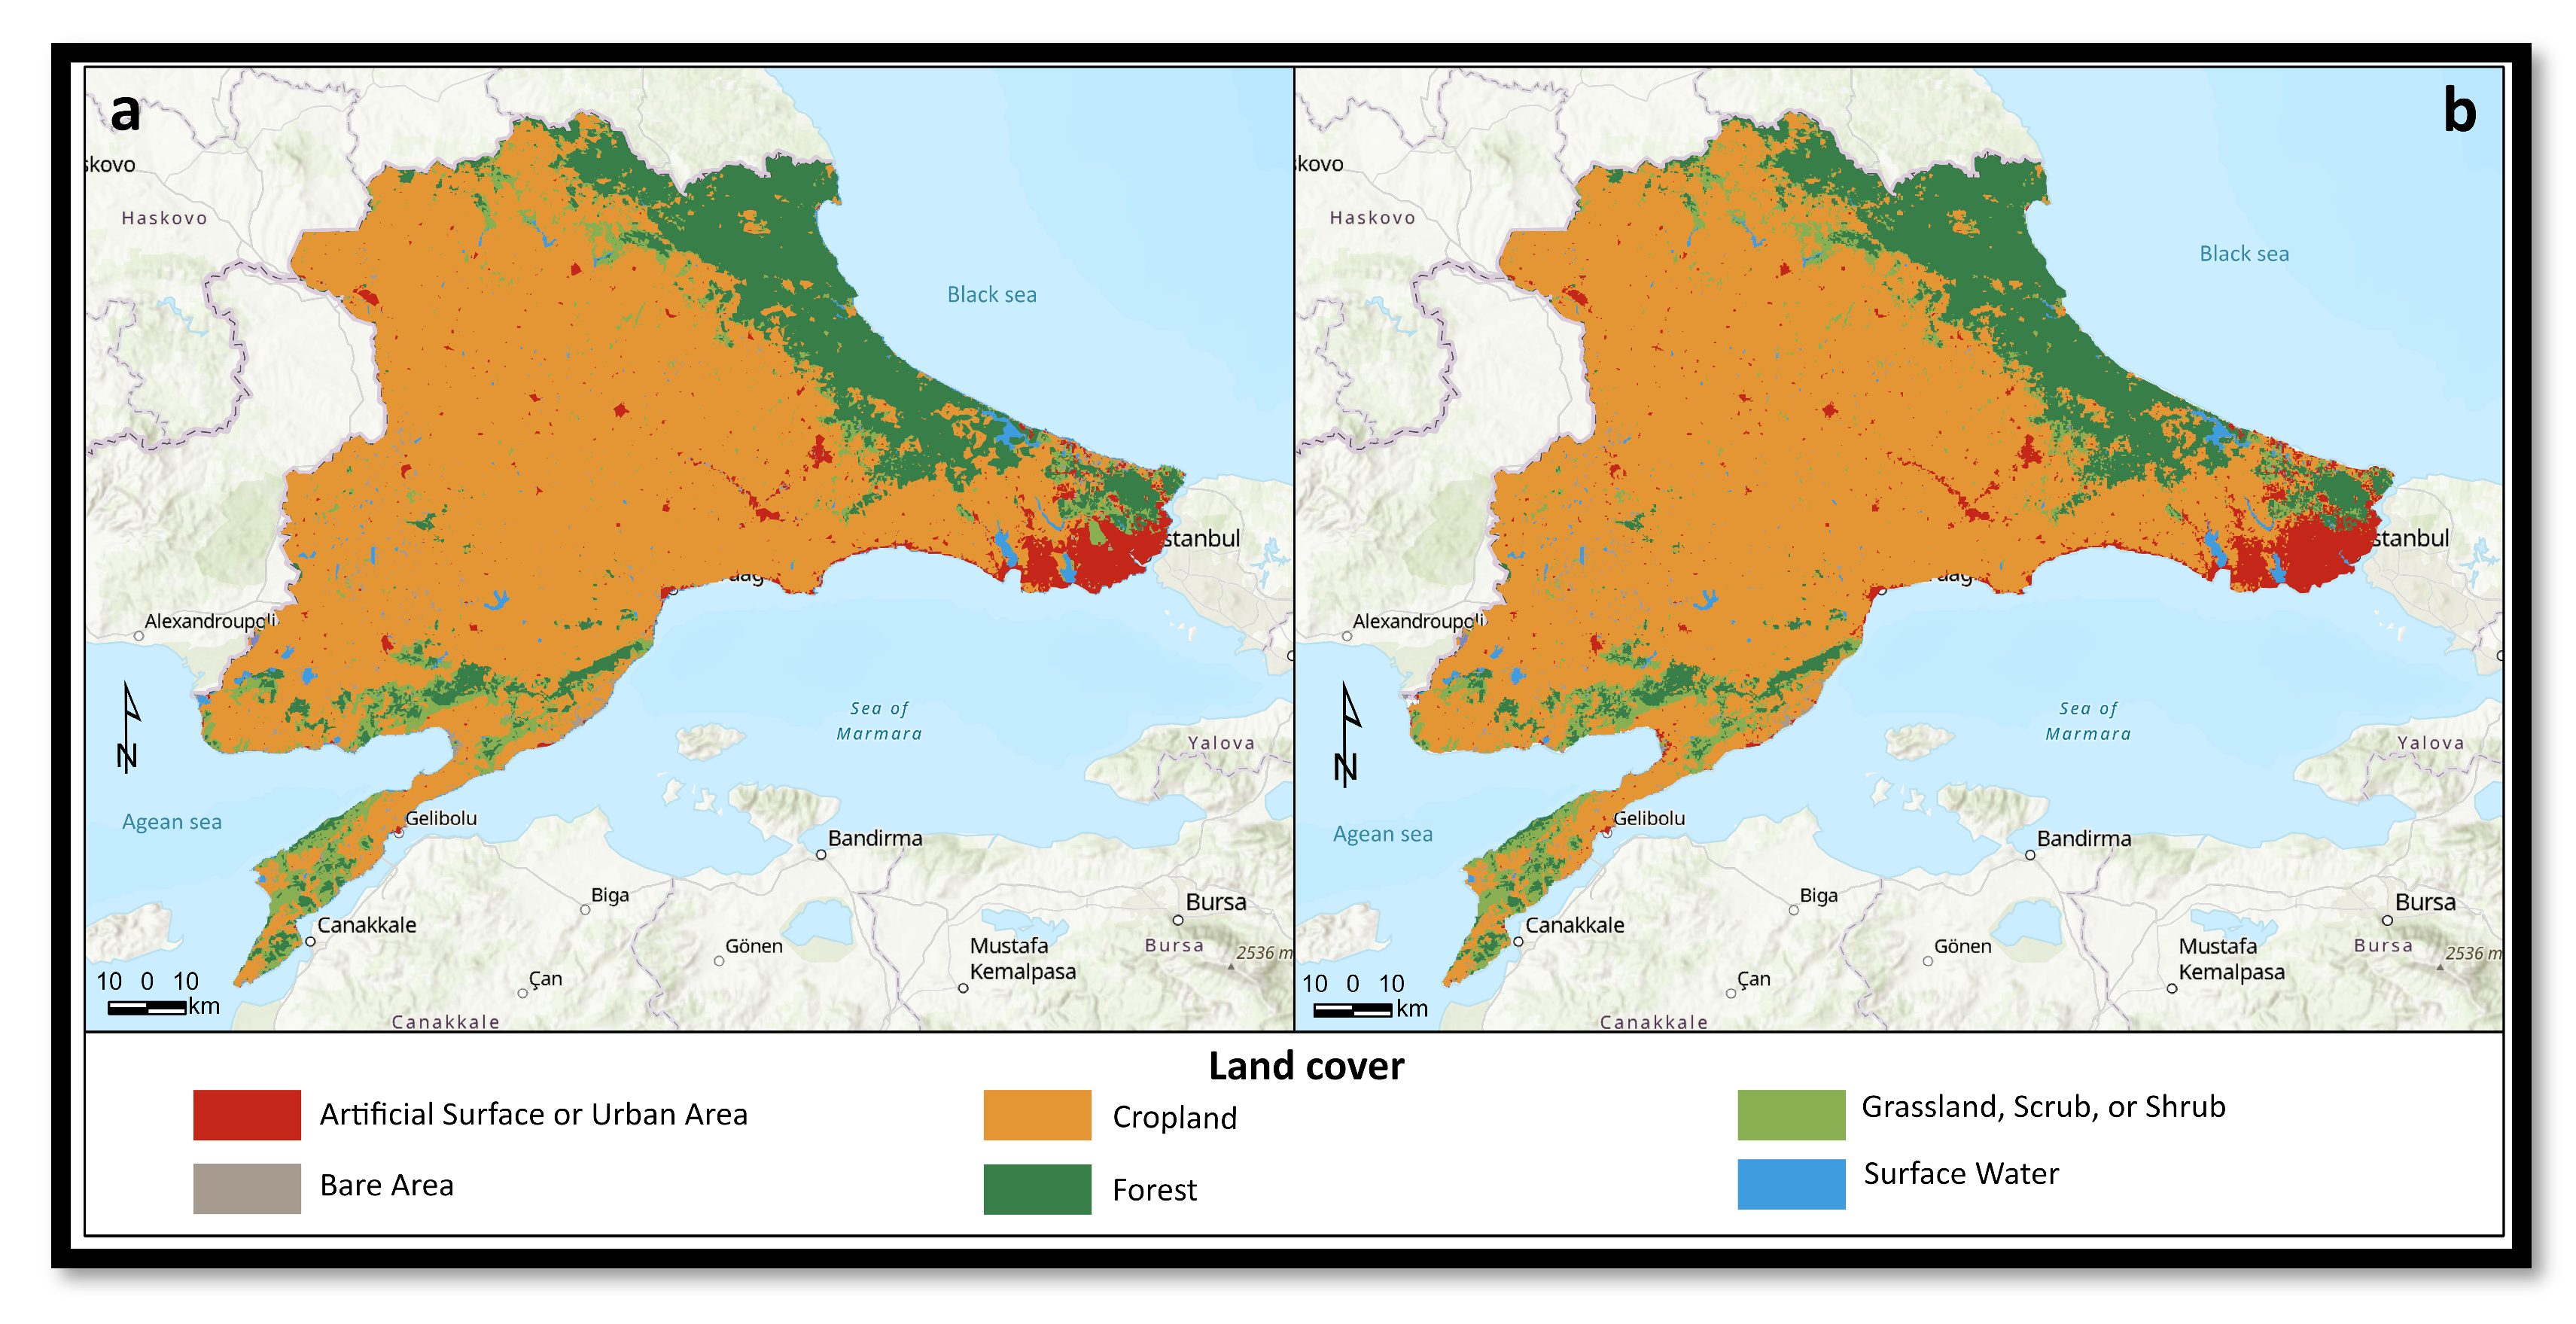
In the study area, cropland areas comprised the largest proportion (71.61%) of land cover area in 2020, as shown in Table 3. This proportion is expected to remain high in 2050. Although forests are the second most widespread land cover class in both 2020 and 2050, the proportion of forests is predicted to decrease in 2050. Proportions of all other land cover classes are below 10% in 2020, and a decrease is anticipated for all classes but artificial land cover classes in 2050 (Table 4).
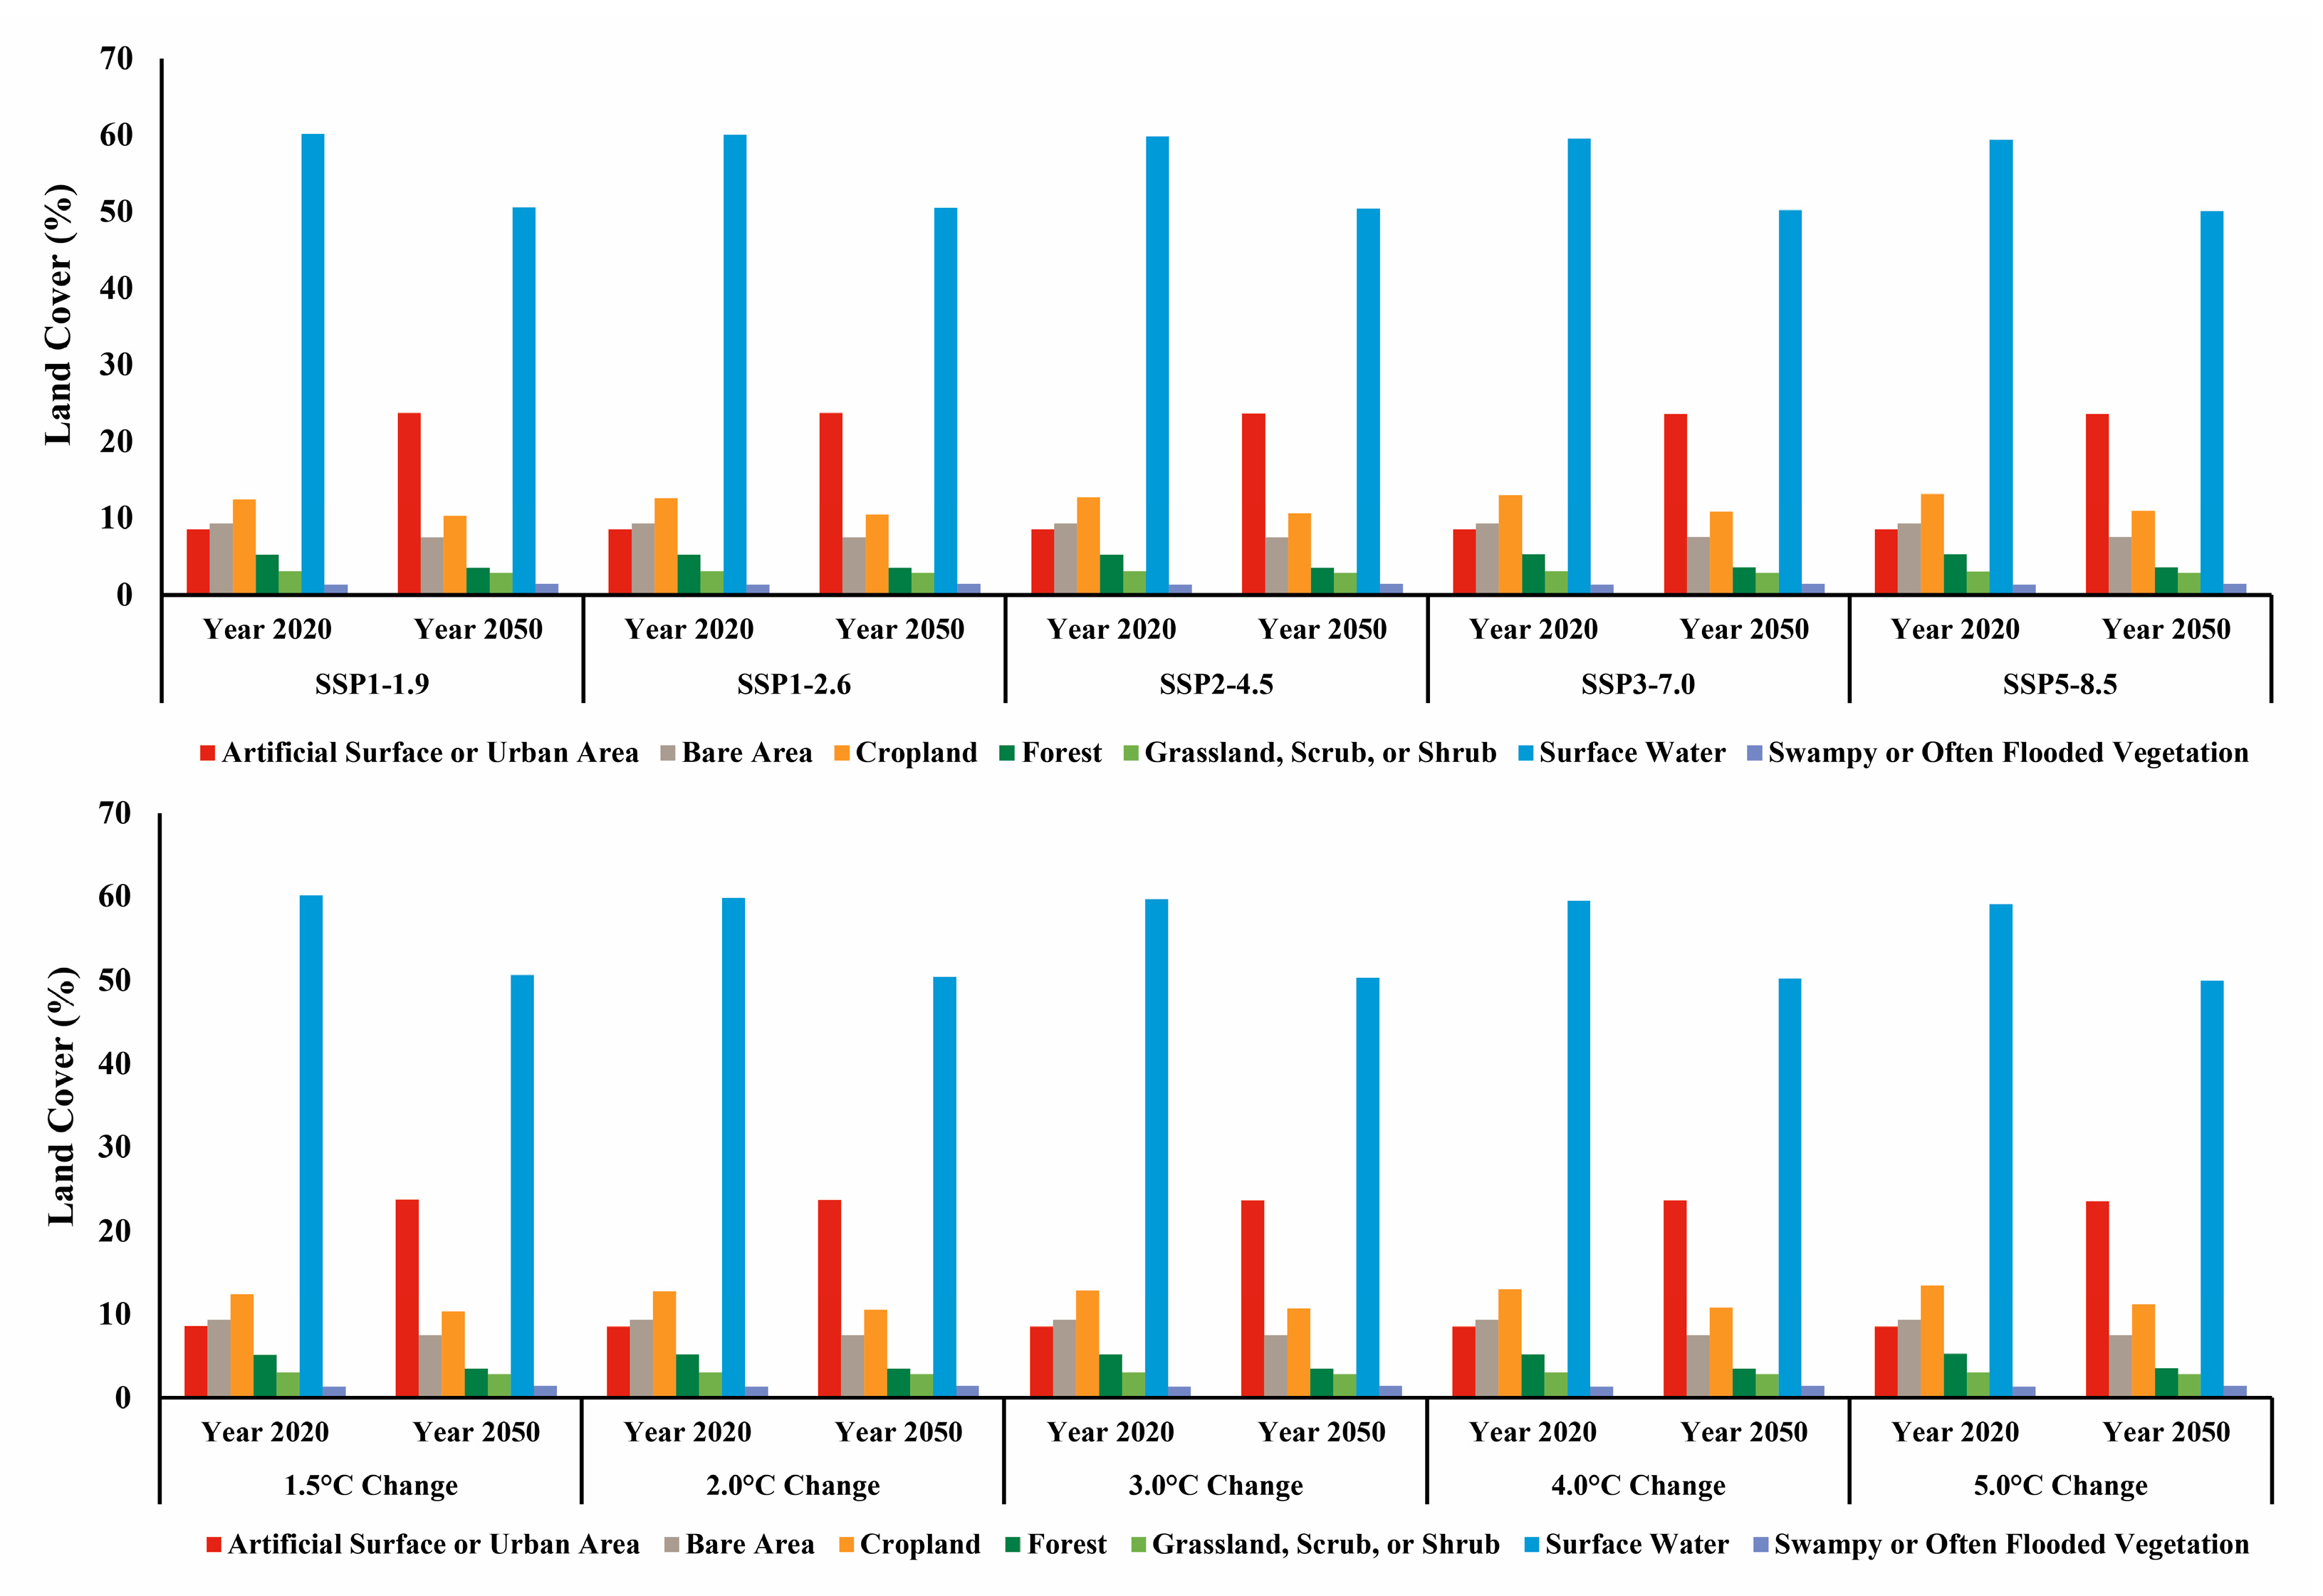
Based on the analysis of land cover impact, it has been determined that in the projected future, the effects of SLR in the study area will have a significantly adverse impact on surface water. Conversely, there appears to be an increase in the extent of artificial surfaces during this period. These findings were obtained by considering five distinct probability cases of the SSP scenario and five different levels of global warming (refer to Figure 8). Furthermore, the analysis revealed that bare areas, forests, and croplands demonstrate a tendency to expand, whereas grasslands, scrub or shrublands, and swamps and flooded vegetation exhibit a tendency to contract in response to SLR.
The anticipated consequence of SLR in the study area primarily manifests as a substantial reduction in surface water resources, particularly freshwater bodies, including the lake segments of wetlands, major river channels, dam reservoirs, and lagoon-type coastal waters with saline content [46]. As all potable and utility water requirements rely on terrestrial surface water sources, the infiltration of seawater into freshwater bodies resulting from SLR will give rise to a significant water scarcity concern.
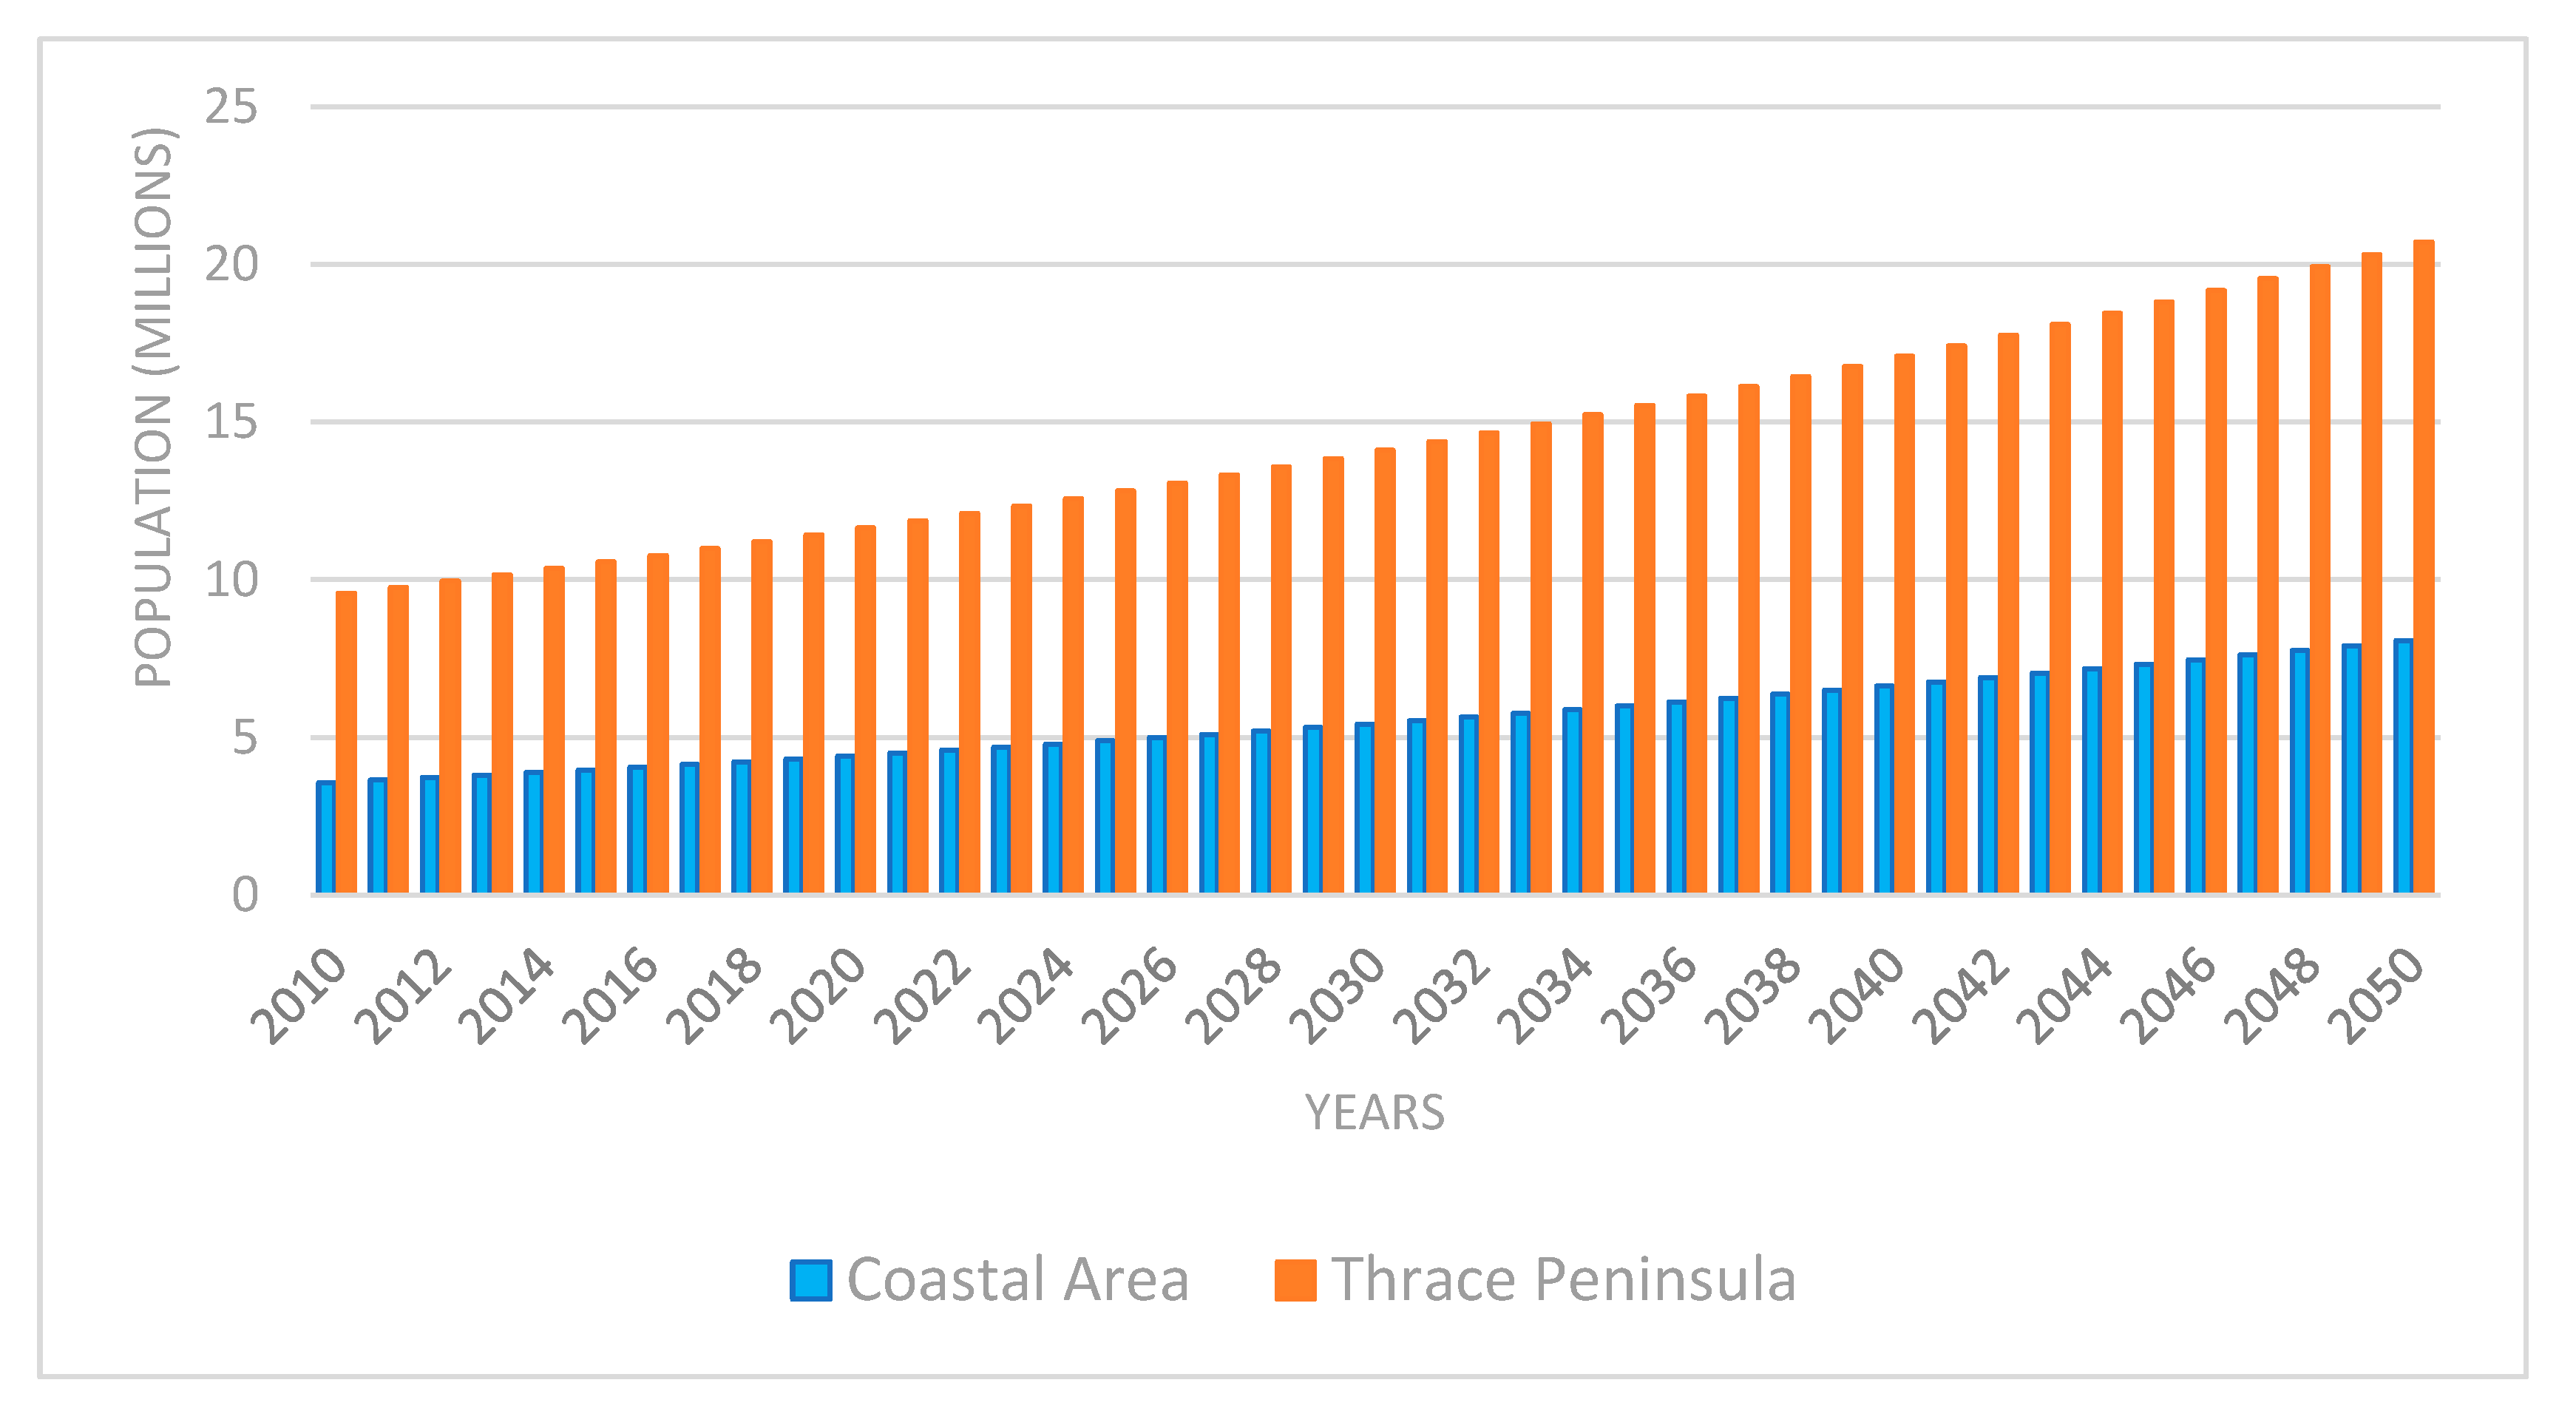
The projected population for 2050, as per Equation (5), is approximately 20,312,236. It is essential to note that this projection is a simplification, assuming a consistent growth rate and not incorporating various significant variables that could impact population dynamics over the next three decades.
As noted by Neumann et al. [62], a comprehensive evaluation of risk requires understanding not just the hazards but also the number of people and assets exposed. Using population data from the Turkish Statistical Institute [63], we show that the coastal population has increased by over 10% in the past decade, with over 4 million people now living in the zone prone to SLR impacts. Further, we project that the population will reach over 7 million by 2050 based on current growth rates. The concentration of people and economic activities in coastal cities highlighted in the land cover analysis underscores this growing exposure. As emphasized by Hinkel et al. [14], rapid and unplanned urbanization in coastal areas exacerbates the risks to densely populated cities from climate change impacts. According to Casiano Flores and Crompvoets [56], we have aligned our SLR scenarios with shared socioeconomic pathway assumptions to account for future socioeconomic conditions. Our integrated exposure assessment provides a more robust understanding of the population and resources vulnerable to SLR effects.
Unaccounted factors include environmental events such as drought, migrations, changes in political borders, conflicts, tourism and economic developments, shifts in healthcare, and fertility trends. These complex and interrelated factors can lead to unexpected population changes. Coastal areas correspond to first-class agricultural lands but have experienced unplanned and uncontrolled development of densely populated urban areas. These areas will be significantly affected by SLR. Additionally, secondary residences that have emerged due to coastal tourism in these areas will be highly vulnerable to the impacts of SLR. Over the past decade, approximately 35% of the population residing in these urban areas has been concentrated within the coastal zone (Figure 9). The growing population is leading to a more intricate configuration and composition of these settlements, thereby diminishing their resilience against the detrimental effects of SLR [41].
Urban areas, along with their associated artificial surface transportation and infrastructure systems, have experienced a heightened level of complexity due to rapid population growth [64,65]. The projected impact of SLR is anticipated to result in substantial damage to these systems, necessitating extensive time and financial resources for their reconstruction. Moreover, the prominent ports of Istanbul and Tekirdağ, crucial for facilitating the flow of goods and services, are highly susceptible to the adverse effects of SLR, placing them at direct risk [45].
The influence of SLR in the study area will also significantly affect the bare areas that stretch parallel to the coast in low-lying coastal regions. These areas, renowned for their sandy beaches and coastal tourism, may experience landward migration or complete disappearance due to SLR. The degradation of these areas in close proximity to coastal cities can directly and adversely impact coastal tourism activities within the region. The impact of SLR in the study area will have a substantial effect on grasslands and scrublands. These areas, crucial for small-scale and large-scale livestock farming activities in the region, are primarily situated around streams and wetlands. In addition to their agricultural significance, they play a vital role as carbon sinks in mitigating climate change [66]. These grasslands and scrubs are predominantly located on the borders of Edirne province within the study area. The potential consequences of SLR in the study area present a significant threat to the forests and bare areas, particularly within the coastal region. The İğneada Floodplain Forests, situated near the coastal region of Kırklareli province, and riparian habitats represent the forested areas in the study area. The İğneada Floodplain Forests, a unique ecosystem, have been designated as a National Park (İğneada Floodplain Forests National Park) by the Ministry of Agriculture and Forestry.
The impact of SLR in the study area is projected to affect cropland to the lowest extent in terms of spatial coverage. However, the agricultural areas corresponding to the Lower Maritsa Valley Floodplain and Delta (Maritsa/Evros Delta) within the study area constitute a highly significant food-producing region. The infiltration of seawater into these productive agricultural lands due to SLR would result in both economic and natural resource losses within the agricultural sector. This is particularly concerning as this region is home to Türkiye’s most important rice fields, which account for approximately 43% of the country’s total rice production [43,67].
The study area faces significant risks of wetland reduction, impacting both nationally and internationally significant wetland areas, due to SLR. The Maritsa/Evros Delta, classified as a Class A wetland, includes extensive reed beds, seasonal marshes, freshwater and brackish lakes, open areas, meadows, and grazing lands situated at elevations ranging from 0 to 210 m. A significant portion of the Maritsa/Evros Delta has been designated as a national park.
The Kavak Delta, acknowledged as a Special Environmental Protection Area and one of Türkiye’s most important wetlands, holds the status of a first-degree natural protected area. Suvla Salt Lake, characterized by its high biodiversity and importance for migratory and native bird species, faces threats due to inadequate protection measures. The İğneada Floodplain Forests, designated as a national park, nature reserve, wildlife development area, and natural protected area, encompass freshwater and saltwater lakes, floodplain forests, seasonal marshes, meadows, pastures, and open areas ranging in elevation from 0 to 180 m. All these ecosystems are endangered by SLR, which heightens the risks of biodiversity loss and species extinction.
4. Discussion
SLR, recognized as a key indicator of climate change, has garnered considerable attention in recent years [9]. The observed rise in sea levels attributed to increasing temperatures poses a significant threat to coastal regions [68]. Furthermore, the projected expansion and human utilization of coastal zones, coupled with the consequences of SLR, are expected to escalate in the future [62]. Consequently, planners and policymakers face the challenge of safeguarding coastal areas while considering prospective SLR scenarios and their spatiotemporal effects [30]. Moreover, the preferred adaptation strategy for this endeavor must be tailored to local circumstances [5].
To date, there is a lack of widely accepted and practical methodologies to effectively ascertain the potential impacts of SLR on coastal areas [29]. However, an assessment of coastal sensitivity can be readily conducted by considering factors influencing the coastline. The CVI analysis, among the simplest and widely employed methodologies, has recently been integrated with GIS techniques to reliably and consistently determine the natural vulnerability of coastlines to SLR impacts [69,70,71]. Ariffin et al. [71] emphasized that CVI analysis not only provides a systematic framework for coastal development programs but also facilitates more effective coastal management and planning. In alignment with prior research, the findings of this study unveiled remarkably high levels of sensitivity within the study area, as indicated by spatial statistics derived from the CVI analysis. Concurrently, the presence of vulnerable ecosystems exposed to substantial human activities, particularly in low-lying coastal regions, was observed in the locality. It has been determined that these areas will be subjected to adverse consequences, exacerbated by the influence of SLR.
A comprehensive understanding of the land cover characteristics in areas prone to inundation is paramount for assessing the potential future ramifications of SLR [26,72]. Therefore, the initial step towards implementing viable mitigation and adaptation measures entails analyzing the spatiotemporal effects of SLR on land cover characteristics within coastal regions [5]. Remote sensing data and techniques, widely employed as visualization and mapping tools, enable the spatial analysis of SLR under various scenarios and facilitate the evaluation of its interplay with land cover classes. This, in turn, supports the development of enhanced policies and strategies for the future. The outcomes of this study elucidated the intricate relationship between SLR and land cover characteristics in the study area, utilizing diverse remote sensing and GIS methodologies, which can serve as a foundation for further research in this field. Consequently, it is anticipated that SLR will induce alterations and disruptions to coastal ecosystems. Coastal plains and deltas characterized by relatively high agricultural yields and production, wetlands, and low-lying settlements are expected to bear the brunt of SLR impact. Within the study area, rich in such vulnerable regions, SLR is foreseen to engender potential consequences, including coastal erosion, loss of beach areas, and significant expenses associated with the protection and maintenance of port facilities [7].
The response of SLR in the coastal zone is influenced by local characteristics, as highlighted by Kopp et al. [3]. Relying solely on global average projections may cause misleading adaptation efforts and result in incompatibilities, as emphasized by Durand et al. [5]. To generate more accurate projections of SLR, it is recommended to utilize LMSL measurements that reflect the specific SLR information pertaining to the study area, as indicated by Kopp et al. [16]. A previous study reported annual SLR rates of 5.31 mm (1874–2019) for the Black Sea, 8.79 mm (1984–2019) for the Marmara Sea, and 0.84 mm (1969–2019) for the Aegean Sea based on measurements obtained along the coastlines of the study area [36].
The region faces substantial threats from SLR, particularly regarding the inundation of low-lying coastal regions. These coastal areas possess ecological and economic value and are highly vulnerable, with the Maritsa/Evros Delta being particularly susceptible. This delta encompasses a sensitive and dynamic low-lying coast that is already experiencing shoreline changes attributable to both natural and human-induced factors. With the impact of SLR, it is anticipated that the dune areas at the delta’s mouth will be encroached upon by the sea, potentially leading to ecological alterations in the lagoons and issues such as increased groundwater salinization due to elevated groundwater levels.
Additionally, SLR poses a significant threat to the fertile agricultural regions within the Lower Maritsa Valley Floodplain and its Delta [43], which constitute one of the most crucial areas for paddy cultivation in the entire region. This plain plays a critical role in fulfilling regional and national food security requirements and has been identified as one of the most vulnerable areas in Türkiye to SLR impacts. The risk of land salinization as a consequence of SLR exacerbates these vulnerabilities, potentially giving rise to agricultural and food security challenges in the future.
The vulnerability assessment results of this study are generally consistent with the extensive analyses for the Turkish coastline conducted by Ozturk [31] and Kuleli [40]. These previous studies utilizing earlier datasets, also classified the Thrace region as highly vulnerable to SLR impacts. The present study’s higher resolution mapping and focus on specific local conditions provide an important update to the nationwide assessments. Comparatively, the inundation levels projected in this analysis are higher than the estimates by Demirkesen et al. [37] for Izmir on the Aegean coast. As Demirkesen et al. [38] noted, SLR vulnerability is highly dependent on geomorphology. Field validation in the current study confirms the low-lying topography of the Thrace coast makes it especially prone to flooding. Looking beyond Türkiye, the Coastal Vulnerability Index values obtained are most similar to the results from Greece outlined by Karymbalis et al. [51]. This aligns with projections that the Mediterranean region as a whole will be a sea-level rise hotspot. The integrated exposure analysis in this study adds important context about population growth and land use pressures, which amplify Thrace’s vulnerability. Overall, this study provides a complete and globally useful picture of this vulnerable coastal area by combining up-to-date datasets, localized projections, and ground validation.
The projected population increase in coastal areas from around 4 million to over 7 million and from approximately 11 million to beyond 20 million across the study area by 2050 necessitates prompt attention within the context of regional policy and management. This demographic shift has multifaceted implications, primarily concerning the need for infrastructure expansion and alignment of urban services with climate resilience objectives. Simultaneously, it provides opportunities for sustainable economic growth, requiring a balance between development and environmental protection. Implementing sustainable land practices is essential to minimize habitat loss and pollution, and the region must also prepare for the impact of rising sea levels by implementing adaptive strategies. Resource management, education investments, and healthcare improvement are some of the most critical areas requiring priority. Further, the adoption of renewable energy and adaptation measures are imperative for mitigating climate change impacts. Lastly, community engagement ensures the promotion of inclusive policies, while regional cooperation is crucial in addressing common challenges and optimizing resources.
Comprehensive and coordinated strategies are essential to achieve a balance between development, sustainability, and resilience amid demographic and climatic changes [72,73]. Moreover, SLR poses a serious threat to low-lying coastal cities and secondary residential settlements that have emerged due to coastal tourism. These areas already face intense population pressure, rendering them particularly susceptible to the adverse consequences of SLR. This vulnerability is likely to have devastating implications for the historical, economic, and socio-cultural fabric of these regions. To mitigate these impacts, coastal cities in the study area must be planned as “resilient cities” capable of withstanding the effects of SLR. A comprehensive and holistic approach, framed within the context of climate change concepts, should be adopted to evaluate and periodically revise urban planning strategies.
SLR is also anticipated to have detrimental effects on the region’s open areas, such as dunes, which may recede inland or even disappear entirely due to SLR. Damage to these areas, located in proximity to coastal cities, is likely to negatively impact coastal tourism activities in the region. Furthermore, grasslands, scrub, or shrubland in the study area will become increasingly vulnerable to climate change and SLR, which may hinder the development of livestock-related activities.
SLR will pose a significant threat to the İğneada Floodplain Forests, which are dispersed throughout the coastal region. This unique ecosystem is at risk of degradation due to the anticipated salinization resulting from SLR. In conclusion, the study area confronts substantial and diverse threats arising from SLR, necessitating the implementation of appropriate measures to mitigate its impacts.
The present study possesses certain limitations that warrant careful consideration. Firstly, it is crucial to acknowledge that this research constitutes a case study focusing solely on a specific local area, thereby limiting the generalizability of the findings to other coastal regions across the globe. The applicability of the findings to other regions of the world is contingent upon the presence of comparable climatic and geographic conditions. In the absence of such similarities, the parameters used in this study would need to be adjusted accordingly to ensure appropriate adaptation to the specific context. Moreover, the utilization of global mean sea level estimates from the IPCC 2019 report for near-term, medium-term, and long-term sea level scenarios may not always accurately reflect the intricacies of local conditions. Furthermore, the study did not account for other factors that could influence coastal sensitivity, such as hurricane surges and tsunamis, as their minimal or non-existent occurrence in the study area rendered their consideration unnecessary. However, to enhance the model’s accuracy across diverse geographical regions, it is imperative to account for local variations. Lastly, while hydrodynamic models serve as valuable tools for comprehending the implications of sea level changes on coastal regions, they are susceptible to uncertainties and assumptions that can impact their precision. Incorporating a margin of error in the interpretation of results can contribute to the provision of more reliable information.
Overall, this study holds significance in identifying areas of high sensitivity that are susceptible to the hazards associated with SLR in coastal regions. Nonetheless, it is imperative to recognize the aforementioned limitations and underscore the necessity for deliberate interventions and proactive measures to adapt to these impacts. Further research is warranted to address these limitations and foster a more comprehensive understanding of the ramifications of climate change induced SLR on coastal regions.
5. Conclusions
The Thrace Peninsula is an area highly vulnerable to SLR caused by climate change, which poses natural and socio-economic risks that require deliberate action to adapt. To identify areas that are particularly vulnerable to SLR-related hazards, prioritize responses, and allocate resources more efficiently, the Coastal Vulnerability Index (CVI) analysis is an effective approach. This study used the CVI and identified several highly sensitive areas in coastal regions. The study demonstrated the usability of hydrodynamic models to understand how changes in sea level will affect coastal areas. The study found that SLR will have a maximum impact on low coasts with critical uses, corresponding to the Surface Water and Artificial Surface or Urban Area AAKK classes that will be most affected in the near-term (2020–2050). Coastal wetlands, densely populated urban areas, and secondary residences related to coastal tourism will be most exposed to the negative effects of SLR. Furthermore, significant losses in fertile agricultural areas corresponding to Class I lands in low coastal plains in the study area are also predicted.
To reduce the effects of SLR, coastal management and planning studies should be conducted to adapt to climate change. High-resolution SLR maps should be prepared in accordance with cadastral boundaries, identifying sensitive areas that will be affected temporally and spatially by seawater invasion and developing sustainable policies for protection. The durability of coastal cities with high population density and secondary residences should be enhanced, and housing and infrastructure systems should be developed to address the predicted SLR impacts for urban areas. Similar studies that consider local changes in SLR are crucial for coastal area management and future planning.
It is important to acknowledge that these models are subject to uncertainties and assumptions that may affect their accuracy, and decisions should be made accordingly. Findings from this research can be used to develop more effective strategies to reduce the impact of climate change on these areas. However, this study has limitations that should be considered when interpreting its findings, such as projections of global mean sea level for different time scenarios that may not accurately reflect local conditions. Therefore, additional research is required to create more accurate estimates. As a result, this study may possibly provide a valuable resource for policymakers, researchers, and stakeholders engaged in developing strategies to mitigate or adapt to the effects of climate change induced SLR. Planned interventions and informed action are indispensable to effectively address these risks, and the findings of this study can contribute to these efforts.
Author Contributions
Conceptualization, M.O. (Mehmet Ozdes) and E.O.; methodology, E.O.; software, M.O. (Mehmet Ozdes); validation, D.Y., M.O. (Mehmet Ozdes) and E.O.; formal analysis, E.O.; investigation, M.O. (Mehmet Ozdes); resources, E.O. and M.O. (Mikayil Ozturk); data curation, M.O. (Mikayil Ozturk); writing—original draft preparation, E.O. and M.O. (Mehmet Ozdes); writing—review and editing, D.Y. and M.O. (Mehmet Ozdes); visualization, E.O.; supervision, M.O. (Mehmet Ozdes) and D.Y.; project administration, E.O. All authors have read and agreed to the published version of the manuscript.
Funding
This research received no external funding.
Data Availability Statement
The data and programs used in this study can be found in Table 1. Most of the data are easily accessible and open to the public except the DEM data, which are restricted by the General Directorate of Mapping (Türkiye) and can be demanded through the government agency. The software used in this study is copyrighted and licensed. Users must acquire the necessary licenses in order to use the software.
Acknowledgments
We have no financial or personal interests that could bias the research in this paper. We are grateful to the General Directorate of Mapping (Türkiye) for providing us with free data (DEM) and aerial photographs. We extend our sincere appreciation to the editorial office of Remote Sensing (MDPI) for the invitation to publish a Feature Paper free of charge. This generous opportunity has allowed us to share our research with the scientific community and contribute to the open-access dissemination of knowledge. We also thank our colleagues, family, and friends for their support.
Conflicts of Interest
The authors declare no conflict of interest.
References
- Costa, Y.; Martins, I.; de Carvalho, G.C.; Barros, F. Trends of Sea-Level Rise Effects on Estuaries and Estimates of Future Saline Intrusion. Ocean. Coast. Manag. 2023, 236, 106490. [Google Scholar] [CrossRef]
- Nicholls, R.J.; Cazenave, A. Sea-Level Rise and Its Impact on Coastal Zones. Science 2010, 328, 1517–1520. [Google Scholar] [CrossRef]
- Kopp, R.E.; Horton, R.M.; Little, C.M.; Mitrovica, J.X.; Oppenheimer, M.; Rasmussen, D.J.; Strauss, B.H.; Tebaldi, C. Probabilistic 21st and 22nd Century Sea-Level Projections at a Global Network of Tide-Gauge Sites. Earth’s Future 2014, 2, 383–406. [Google Scholar] [CrossRef]
- Wahl, T.; Haigh, I.D.; Nicholls, R.J.; Arns, A.; Dangendorf, S.; Hinkel, J.; Slangen, A.B.A. Understanding Extreme Sea Levels for Broad-Scale Coastal Impact and Adaptation Analysis. Nat. Commun. 2017, 8, 16075. [Google Scholar] [CrossRef]
- Durand, G.; van den Broeke, M.R.; Le Cozannet, G.; Edwards, T.L.; Holland, P.R.; Jourdain, N.C.; Marzeion, B.; Mottram, R.; Nicholls, R.J.; Pattyn, F.; et al. Sea-Level Rise: From Global Perspectives to Local Services. Front. Mar. Sci. 2022, 8, 709595. [Google Scholar] [CrossRef]
- Intergovernmental Panel on Climate Change (IPCC). Climate Change 2013—The Physical Science Basis: Working Group I Contribution to the Fifth Assessment Report of the Intergovernmental Panel on Climate Change; Cambridge University Press: Cambridge, UK, 2014; ISBN 978-1-107-05799-9. [Google Scholar]
- Griggs, G.; Reguero, B.G. Coastal Adaptation to Climate Change and Sea-Level Rise. Water 2021, 13, 2151. [Google Scholar] [CrossRef]
- Lopes, N.D.R.; Li, T.; Zhang, P.; Matomela, N.; Ikhumhen, H.O.; Sá, R.M. Predicting Future Coastal Land Use/Cover Change and Associated Sea-Level Impact on Habitat Quality in the Northwestern Coastline of Guinea-Bissau. J. Environ. Manag. 2023, 327, 116804. [Google Scholar] [CrossRef] [PubMed]
- Sahana, M.; Hong, H.; Ahmed, R.; Patel, P.P.; Bhakat, P.; Sajjad, H. Assessing Coastal Island Vulnerability in the Sundarban Biosphere Reserve, India, Using Geospatial Technology. Environ. Earth Sci. 2019, 78, 304. [Google Scholar] [CrossRef]
- Dau, Q.V.; Wang, X.; Shah, M.A.; Kinay, P.; Basheer, S. Assessing the Potential Impacts of Climate Change on Current Coastal Ecosystems—A Canadian Case Study. Remote Sens. 2023, 15, 4742. [Google Scholar] [CrossRef]
- Vinay, S.; Bharath, H.A. Geo-Spatial Modeling of Coastal Flood Exposures Due to Local Sea-Level Rise and Landscape Dynamics: A Case of Sagar Island. In Application of Remote Sensing and GIS in Natural Resources and Built Infrastructure Management; Singh, V.P., Yadav, S., Yadav, K.K., Corzo Perez, G.A., Muñoz-Arriola, F., Yadava, R.N., Eds.; Springer International Publishing: Cham, Switzerland, 2022; pp. 349–374. ISBN 978-3-031-14096-9. [Google Scholar]
- Li, J.; Zheng, Z.; Liu, G.; Chen, N.; Lei, S.; Du, C.; Xu, J.; Li, Y.; Zhang, R.; Huang, C. Estimating Effects of Natural and Anthropogenic Activities on Trophic Level of Inland Water: Analysis of Poyang Lake Basin, China, with Landsat-8 Observations. Remote Sens. 2023, 15, 1618. [Google Scholar] [CrossRef]
- García-Romero, L.; Carreira-Galbán, T.; Rodríguez-Báez, J.Á.; Máyer-Suárez, P.; Hernández-Calvento, L.; Yánes-Luque, A. Mapping Environmental Impacts on Coastal Tourist Areas of Oceanic Islands (Gran Canaria, Canary Islands): A Current and Future Scenarios Assessment. Remote Sens. 2023, 15, 1586. [Google Scholar] [CrossRef]
- Hinkel, J.; Aerts, J.C.J.H.; Brown, S.; Jiménez, J.A.; Lincke, D.; Nicholls, R.J.; Scussolini, P.; Sanchez-Arcilla, A.; Vafeidis, A.; Addo, K.A. The Ability of Societies to Adapt to Twenty-First-Century Sea-Level Rise. Nat. Clim. Chang. 2018, 8, 570–578. [Google Scholar] [CrossRef]
- Hinkel, J.; Church, J.A.; Gregory, J.M.; Lambert, E.; Le Cozannet, G.; Lowe, J.; McInnes, K.L.; Nicholls, R.J.; van der Pol, T.D.; van de Wal, R. Meeting User Needs for Sea Level Rise Information: A Decision Analysis Perspective. Earth’s Future 2019, 7, 320–337. [Google Scholar] [CrossRef]
- Kopp, R.E.; Gilmore, E.A.; Little, C.M.; Lorenzo-Trueba, J.; Ramenzoni, V.C.; Sweet, W.V. Usable Science for Managing the Risks of Sea-Level Rise. Earth’s Future 2019, 7, 1235–1269. [Google Scholar] [CrossRef]
- Strauss, B.H.; Ziemlinski, R.; Weiss, J.L.; Overpeck, J.T. Tidally Adjusted Estimates of Topographic Vulnerability to Sea Level Rise and Flooding for the Contiguous United States. Environ. Res. Lett. 2012, 7, 014033. [Google Scholar] [CrossRef]
- Hallegatte, S.; Green, C.; Nicholls, R.J.; Corfee-Morlot, J. Future Flood Losses in Major Coastal Cities. Nat. Clim. Chang. 2013, 3, 802–806. [Google Scholar] [CrossRef]
- Rasmussen, D.J.; Bittermann, K.; Buchanan, M.K.; Kulp, S.; Strauss, B.H.; Kopp, R.E.; Oppenheimer, M. Extreme Sea Level Implications of 1.5 °C, 2.0 °C, and 2.5 °C Temperature Stabilization Targets in the 21st and 22nd Centuries. Environ. Res. Lett. 2018, 13, 034040. [Google Scholar] [CrossRef]
- Kumbier, K.; Cabral Carvalho, R.; Vafeidis, A.T.; Woodroffe, C.D. Modelling Inundation Extents of the June 2016 Storm Surge in Estuarine Environments Using Static and Dynamic Approaches; University of Wollongong: Wollongong, Australia, 2017. [Google Scholar]
- Gargiulo, C.; Battarra, R.; Guida, C.; Tremiterra, M.R. Chapter 26—A GIS-Based Tool for Planning Resilient Climate Cities. In Resilient and Sustainable Cities; Allam, Z., Chabaud, D., Gall, C., Pratlong, F., Moreno, C., Eds.; Elsevier: Amsterdam, The Netherlands, 2023; pp. 473–494. ISBN 978-0-323-91718-6. [Google Scholar]
- Ward, P.J.; Marfai, M.A.; Yulianto, F.; Hizbaron, D.R.; Aerts, J.C.J.H. Coastal Inundation and Damage Exposure Estimation: A Case Study for Jakarta. Nat. Hazards 2011, 56, 899–916. [Google Scholar] [CrossRef]
- Meilianda, E.; Pradhan, B.; Syamsidik; Comfort, L.K.; Alfian, D.; Juanda, R.; Syahreza, S.; Munadi, K. Assessment of Post-Tsunami Disaster Land Use/Land Cover Change and Potential Impact of Future Sea-Level Rise to Low-Lying Coastal Areas: A Case Study of Banda Aceh Coast of Indonesia. Int. J. Disaster Risk Reduct. 2019, 41, 101292. [Google Scholar] [CrossRef]
- Subraelu, P.; Sefelnasr, A.; Sherif, M.; Ebraheem, A.M. Global Warming Climate Change and Sea Level Rise: Impact on Land Use Land Cover Features along UAE Coast through Remote Sensing and GIS ONGC Sponsored Project on Landforms and Evolution of East Coast Deltas of India View Project ICSSR Senior Fellow Project View Project. J. Ecosyst. Ecography 2022, 12, 1–8. [Google Scholar]
- Abdrabo, M.A.; Abdelwahab, R.G.; Hassaan, M.A. Urban Dynamics and Potential Vulnerability of Coastal Urban Areas to Sea Level Rise in the Southeastern Levantine Basin. Urban Clim. 2022, 44, 101212. [Google Scholar] [CrossRef]
- Nevermann, H.; Becerra Gomez, J.N.; Fröhle, P.; Shokri, N. Land Loss Implications of Sea Level Rise along the Coastline of Colombia under Different Climate Change Scenarios. Clim. Risk Manag. 2023, 39, 100470. [Google Scholar] [CrossRef]
- Liang, S.; Hu, W.; Liu, J.; Su, S.; Chen, G.; Chen, S.; Xie, B.; Du, J.; Liu, W.; Chen, B. Mapping Mangrove Sustainability in the Face of Sea Level Rise and Land Use: A Case Study on Leizhou Peninsula, China. J. Environ. Manag. 2023, 325, 116554. [Google Scholar] [CrossRef] [PubMed]
- Enwright, N.M.; Cheney, W.C.; Evans, K.O.; Thurman, H.R.; Woodrey, M.S.; Fournier, A.M.V.; Gesch, D.B.; Pitchford, J.L.; Stoker, J.M.; Medeiros, S.C. Elevation-Based Probabilistic Mapping of Irregularly Flooded Wetlands along the Northern Gulf of Mexico Coast. Remote Sens. Environ. 2023, 287, 113451. [Google Scholar] [CrossRef]
- Filippaki, E.; Tsakalos, E.; Kazantzaki, M.; Bassiakos, Y. Forecasting Impacts on Vulnerable Shorelines: Vulnerability Assessment along the Coastal Zone of Messolonghi Area—Western Greece. Climate 2023, 11, 24. [Google Scholar] [CrossRef]
- Roy, P.; Pal, S.C.; Chakrabortty, R.; Chowdhuri, I.; Saha, A.; Shit, M. Effects of Climate Change and Sea-Level Rise on Coastal Habitat: Vulnerability Assessment, Adaptation Strategies and Policy Recommendations. J. Environ. Manag. 2023, 330, 117187. [Google Scholar] [CrossRef] [PubMed]
- Ozturk, D. Urban Growth Simulation of Atakum (Samsun, Turkey) Using Cellular Automata-Markov Chain and Multi-Layer Perceptron-Markov Chain Models. Remote Sens. 2015, 7, 5918. [Google Scholar] [CrossRef]
- Alpar, B. Vulnerability of Turkish Coasts to Accelerated Sea-Level Rise. Geomorphology 2009, 107, 58–63. [Google Scholar] [CrossRef]
- Hoell, A.; Funk, C.; Magadzire, T.; Zinke, J.; Husak, G. El Niño–Southern Oscillation Diversity and Southern Africa Teleconnections during Austral Summer. Clim. Dyn. 2015, 45, 1583–1599. [Google Scholar] [CrossRef]
- Abadie, L.M.; Sainz de Murieta, E.; Galarraga, I. Climate Risk Assessment under Uncertainty: An Application to Main European Coastal Cities. Front. Mar. Sci. 2016, 3, 00265. [Google Scholar] [CrossRef]
- Abadie, L.M.; Galarraga, I.; Markandya, A.; Sainz de Murieta, E. Risk Measures and the Distribution of Damage Curves for 600 European Coastal Cities. Environ. Res. Lett. 2019, 14, 064021. [Google Scholar] [CrossRef]
- Özyurt, G.; Ergin, A. Improving Coastal Vulnerability Assessments to Sea-Level Rise: A New Indicator-Based Methodology for Decision Makers. J. Coast. Res. 2010, 26, 265–273. [Google Scholar] [CrossRef]
- Demirkesen, A.C.; Evrendilek, F.; Berberoglu, S.; Kilic, S. Coastal Flood Risk Analysis Using Landsat-7 ETM+ Imagery and SRTM DEM: A Case Study of Izmir, Turkey. Environ. Monit. Assess. 2007, 131, 293–300. [Google Scholar] [CrossRef]
- Demirkesen, A.C.; Evrendilek, F.; Berberoglu, S. Quantifying Coastal Inundation Vulnerability of Turkey to Sea-Level Rise. Environ. Monit. Assess. 2008, 138, 101–106. [Google Scholar] [CrossRef] [PubMed]
- Karaca, M.; Nicholls, R.J. Potential Implications of Accelerated Sea-Level Rise for Turkey. J. Coast. Res. 2008, 24, 288–298. [Google Scholar] [CrossRef]
- Kuleli, T. City-Based Risk Assessment of Sea Level Rise Using Topographic and Census Data for the Turkish Coastal Zone. Estuaries and Coasts 2010, 33, 640–651. [Google Scholar] [CrossRef]
- Simav, Ö. Deniz Seviyesi Yükselmelerinin Kıyı Alanlarına Olası Etkilerinin Araştırılması. Ph.D. Dissertation, İstanbul Technical University, Institute of Science and Technology, İstanbul, Turkey, 2012. [Google Scholar]
- Duygu Kahraman, E.; Sılaydın Aydın, M.; Eylül Üniversitesi, D.; Kampüsü, T.; Fakültesi, M.; ve Bölge Planlama Bölümü, Ş. Deniz Seviyesinin Yükselmesi Tehdidine Karşı Kıyı Kentlerinin Morfolojik Açıdan Kırılganlık Düzeylerinin Belirlenmesi Determining Vulnerability Levels of Coastal Cities in Morphological Context against to Sea Level Rise Threat, Turkey; TUCAUM: Ankara, Turkey, 2016. [Google Scholar]
- Ozsahin, E.; Ozdes, M. Determining the Impact of Climate Change on Land Suitability for Rice Paddy Cultivation Using GIS and RS on FAO Maximum Limitation Approach. Theor. Appl. Climatol. 2022, 149, 53–68. [Google Scholar] [CrossRef]
- Özşahin, E.; Özdeş, M.; Eroglu, İ. TR21 Trakya Bölgesi’nde İklim Değişikliğinin Ekonomik Sektörler Üzerine Olası Etkileri. Bölüm 12, TR21 Trakya Bölge-Sinde İklim Değişikliğinin Etkileri ve Uyum Stratejileri. In TR21 Trakya Bölgesinde İklim Değişikliğinin Etkileri ve Uyum Stratejileri; Tekirdağ Namık Kemal Üniversitesi Yayınları: Tekirdag, Turkey, 2019; pp. 169–177. ISBN 2.08-027-0030/A-I. [Google Scholar]
- Özdeş, M.; Özşahin, E.; Eroğlu, İ. Reassessment of Land Use and Land Cover of Thrace Peninsula according to Corine Land Classification System. In Proceedings of the 1st Istanbul International Geography Congress, Istanbul, Turkey, 20–22 June 2019; Istanbul University: Istanbul, Turkey, 2019; pp. 679–686. [Google Scholar]
- ÖzşahiN, E.; Eroğlu, İ. Geomorphometric Features of Thrace Peninsula. J. Geomorphol. Res. 2018, 12, 87–98. [Google Scholar]
- Özdeş, M. Historical Development of Tekirdağ Urban Area from Past to Present. In Proceedings of the UCEK-2019, Eskisehir, Turkey, 3–5 October 2019. [Google Scholar]
- Thieler, E.R.; Hammar-Klose, E.S. National Assessment of Coastal Vulnerability to Sea-Level Rise: Preliminary Results for the U.S. Atlantic Coast; U.S. Geological Survey (USGS): Reston, VA, USA, 1999. [Google Scholar]
- HGM Digital Elevation Model, 5 m, (SYM5-L0), GeoTIFF 32 Bit Floating. Available online: https://www.harita.gov.tr/urun/sayisal-yuzey-modeli-5-m-seviye-0-sym5-l0-/1 (accessed on 5 May 2021).
- Mclauhlin, S.; Cooper, J.A.G. A Multi-Scale Coastal Vulnerability Index: A Tool for Coastal Managers? Environ. Hazards 2010, 9, 233–248. [Google Scholar] [CrossRef]
- Karymbalis, E.; Chalkias, C.; Chalkias, G.; Grigoropoulou, E.; Manthos, G.; Ferentinou, M. Assessment of the Sensitivity of the Southern Coast of the Gulf of Corinth (Peloponnese, Greece) to Sea-Level Rise. Cent. Eur. J. Geosci. 2012, 4, 561–577. [Google Scholar] [CrossRef]
- ESRI ESA CCI Land Cover from the Years 2010 and 2018. Projection of 2050. Clark University. Available online: https://earthobs3.arcgis.com/arcgis/rest/services/land_cover_projection_2050/ImageServer (accessed on 10 May 2021).
- Ayat, B. Wave Power Atlas of Eastern Mediterranean and Aegean Seas. Energy 2013, 54, 251–262. [Google Scholar] [CrossRef]
- Bevacqua, E.; Maraun, D.; Hobæk Haff, I.; Widmann, M.; Vrac, M. Multivariate Statistical Modelling of Compound Events via Pair-Copula Constructions: Analysis of Floods in Ravenna (Italy). Hydrol. Earth Syst. Sci. 2017, 21, 2701–2723. [Google Scholar] [CrossRef]
- Ministry of Climate, Environment and Urbanization. Türkiye’s National Climate Change Strategy and Action Plan for 2050: Türkiye’s Final Declaration on Combating Climate Change 2021; Çevre Şehircilik ve Iklim Değişikliği Bakanlığı: Ankara, Turkey, 2021. [Google Scholar]
- Casiano Flores, C.; Crompvoets, J. Climate Change Adaptation: The Role of Geospatial Data in Sustainable Infrastructures. ISPRS Int. J. Geo-Inf. 2023, 12, 68. [Google Scholar] [CrossRef]
- Bindoff, N.L.; Artale, V.; Cazenave, A.; Gregory, J.M.; Willebrand, J.; Artale, V.; Gregory, J.; Gulev, S.; Hanawa, K.; Le Quéré, C.; et al. Observations: Oceanic Climate Change and Sea Level Coordinating Lead Authors: Lead Authors: This Chapter Should Be Cited As; Cambridge University Press: Cambridge, UK, 2007. [Google Scholar]
- Church, J.A.; White, N.J. A 20th Century Acceleration in Global Sea-Level Rise. Geophys. Res. Lett. 2006, 33. [Google Scholar] [CrossRef]
- Intergovernmental Panel on Climate Change (IPCC). The Ocean and Cryosphere in a Changing Climate; Cambridge University Press: Cambridge, UK, 2022. [Google Scholar]
- Mimura, N. Sea-Level Rise Caused by Climate Change and Its Implications for Society. Proc. Jpn. Acad. Ser. B 2013, 89, 281–301. [Google Scholar] [CrossRef] [PubMed]
- Yang, Z.; Wang, T.; Voisin, N.; Copping, A. Estuarine Response to River Flow and Sea-Level Rise under Future Climate Change and Human Development. Estuar. Coast. Shelf Sci. 2015, 156, 19–30. [Google Scholar] [CrossRef]
- Neumann, B.; Vafeidis, A.T.; Zimmermann, J.; Nicholls, R.J. Future Coastal Population Growth and Exposure to Sea-Level Rise and Coastal Flooding—A Global Assessment. PLoS ONE 2015, 10, e0118571. [Google Scholar] [CrossRef]
- TUIK Turkish Statistical Institute. Population Statistics. Available online: https://www.Tuik.Gov.Tr (accessed on 15 November 2023).
- Ozsahin, E.; Alturk, B.; Ozdes, M.; Sari, H.; Eroglu, I. GIS-Based Spatial Prediction of Poor-Drainage Areas Using Frequency Ratio: A Case Study of Tekirdag Province, Turkey. Appl. Geomat. 2022, 14, 369–386. [Google Scholar] [CrossRef]
- Ozsahin, E.; Ozdes, M. Agricultural Land Suitability Assessment for Agricultural Productivity Based on GIS Modeling and Multi-Criteria Decision Analysis: The Case of Tekirdağ Province. Environ. Monit. Assess. 2022, 194, 41. [Google Scholar] [CrossRef]
- Hazar-Kalonya, D. The Significance of Pastures in Climate Change Mitigation and Adaptation Processes. Çevre Şehir İklim Dergisi 2022, 1, 128–157. [Google Scholar]
- Ozsahin, E.; Sari, H.; Ozdes, M.; Eroglu, I.; Yuksel, O. Determination of Suitable Lands for Rice Cultivation in Edirne Plain: GIS Supported FAO Limitation Method. Paddy Water Environ. 2022, 20, 325–338. [Google Scholar] [CrossRef]
- Stammer, D.; Cazenave, A.; Ponte, R.M.; Tamisiea, M.E. Causes for Contemporary Regional Sea Level Changes. Annu. Rev. Mar. Sci. 2013, 5, 21–46. [Google Scholar] [CrossRef] [PubMed]
- Özyurt, G.; Ergin, A. Application of Sea Level Rise Vulnerability Assessment Model to Selected Coastal Areas of Turkey. J. Coast. Res. 2009, I, 248–251. [Google Scholar]
- Görmüş, T.; Ayat, B. Vulnerability Assesment of Southwestern Black Sea. J. Fac. Eng. Archit. Gazi Univ. 2020, 35, 663–681. [Google Scholar] [CrossRef]
- Ariffin, E.H.; Mathew, M.J.; Roslee, A.; Ismailluddin, A.; Yun, L.S.; Putra, A.B.; Yusof, K.M.K.K.; Menhat, M.; Ismail, I.; Shamsul, H.A.; et al. A Multi-Hazards Coastal Vulnerability Index of the East Coast of Peninsular Malaysia. Int. J. Disaster Risk Reduct. 2023, 84, 103484. [Google Scholar] [CrossRef]
- Peters, M.K.; Kusimi, J.M. Changes in Wetland and Other Landscape Elements of the Keta Municipal Area of Ghana. J. Coast. Conserv. 2023, 27, 1. [Google Scholar] [CrossRef]
- Shen, X.; Liu, B.; Jiang, M.; Lu, X. Marshland Loss Warms Local Land Surface Temperature in China. Geophys. Res. Lett. 2020, 47, e2020GL087648. [Google Scholar] [CrossRef]
Figure 1.
Location of the study area.

Figure 2.
Flowchart of the study methods.

Figure 3.
Spatial distribution of Coastal Vulnerability Index results. The assessed zones encompass one kilometer buffer areas extending from the coastal line. The color spectrum, ranging from green to red, signifies the varying degrees of vulnerability along the coastline—with green indicating the least vulnerable and red highlighting the most vulnerable areas.

Figure 4.
Comparison of global and local mean sea level changes (1993–2019).

Figure 5.
The inundation maps of the study area in the 2050–2100–2300 period based on the SSP scenario of low emission projections (SSP1 2.6).
Figure 5.
The inundation maps of the study area in the 2050–2100–2300 period based on the SSP scenario of low emission projections (SSP1 2.6).

Figure 6.
The flooded area maps the study area in the 2050–2100–2300 period based on the SSP scenario of high emission projections (SSP5 8.5).
Figure 6.
The flooded area maps the study area in the 2050–2100–2300 period based on the SSP scenario of high emission projections (SSP5 8.5).

Figure 7.
Land cover of the study area in 2020 (a) and projected land cover in 2050 (b) (ESRI [52]).
Figure 7.
Land cover of the study area in 2020 (a) and projected land cover in 2050 (b) (ESRI [52]).

Figure 8.
Land cover class areas and their percentage changes in the study area under five different probability cases of the SSP scenario and five different global warming levels in the near-term.
Figure 8.
Land cover class areas and their percentage changes in the study area under five different probability cases of the SSP scenario and five different global warming levels in the near-term.

Figure 9.
The human population has increased during the last decade in the study area and in the coastal area [63] and projected population for 2050.
Figure 9.
The human population has increased during the last decade in the study area and in the coastal area [63] and projected population for 2050.


Table 1.
Variables and subcategories employed in the coastal vulnerability index (CVI) analysis.
| Variables | Very Low | Low | Moderate | High | Very High |
|---|---|---|---|---|---|
| (a) Altitude (m) | >30.01 | 30.00–20.01 | 20.00–10.01 | 10.00–5.01 | 5.00 |
| (b) Geomorphology | Rocky cliffy coasts | Medium cliffs, Indented coasts | Low cliffs, Glacial drift, Alluvial plains | Cobble Beaches, Estuary, Lagoon | Barrier, Sand beach, Mudflats. |
| (c) Coastal slope (%) | >1.20 | 1.20–0.90 | 0.90–0.60 | 0.60–0.30 | 0.30< |
| (d) Shoreline erosion (−)/accretion (+) (m/yr) | >2.00 | 1.00–2.00 | −1.00–1.00 | −2.00–−1.00 | −2.00< |
| (e) Relative sea-level change | <1.00 | 1.01–3.00 | 3.01–5.00 | 5.01–7.00 | 7.01> |
| (mm/yr) | |||||
| (f) Mean wave height (m) | <0.55 | 0.55–0.85 | 0.86–1.05 | 1.06–1.25 | 1.25> |
Table 2.
SLR impact area and ratio to total area based on 5 SSP probability cases and warming levels.
Table 2.
SLR impact area and ratio to total area based on 5 SSP probability cases and warming levels.
| Periods | Scenarios | SSP1-1.9 | SSP1-2.6 | SSP2-4.5 | SSP3-7.0 | SSP5-8.5 |
|---|---|---|---|---|---|---|
| 2050 | GMSL | 0.18 | 0.19 | 0.200 | 0.22 | 0.23 |
| LMSL | 0.88 | 0.89 | 0.90 | 0.92 | 0.93 | |
| The impact area (ha) | 11,090 | 11,124 | 11,159 | 11,230 | 11,265 | |
| The ratio of total area (%) | 0.47 | 0.47 | 0.47 | 0.48 | 0.48 | |
| 2100 | GMSL | 0.38 | 0.44 | 0.56 | 0.68 | 0.77 |
| LMSL | 1.08 | 1.14 | 1.26 | 1.38 | 1.47 | |
| The impact area (ha) | 12,800 | 13,093 | 13,695 | 14,313 | 14,785 | |
| The ratio of total area (%) | 0.54 | 0.56 | 0.58 | 0.61 | 0.63 | |
| Periods | Global warming level | 1.5 °C | 2.0 °C | 3.0 °C | 4.0 °C | 5.0 °C |
| 2050 | GMSL | 0.18 | 0.20 | 0.21 | 0.22 | 0.25 |
| LMSL | 0.88 | 0.90 | 0.91 | 0.92 | 0.95 | |
| The impact area (ha) | 11,090 | 11,159 | 11,195 | 11,230 | 11,336 | |
| The ratio of total area (%) | 0.47 | 0.47 | 0.48 | 0.48 | 0.48 | |
| 2100 | GMSL | 0.44 | 0.51 | 0.61 | 0.7 | 0.81 |
| LMSL | 1.14 | 1.21 | 1.31 | 1.40 | 1.51 | |
| The impact area (ha) | 13,094 | 13,442 | 13,950 | 14,416 | 14,998 | |
| The ratio of total area (%) | 0.56 | 0.57 | 0.59 | 0.61 | 0.64 |
Table 3.
The impact area and the ratio to the total area of the SLR in the study area, according to low- and high-emission projections scenarios for the years 2100 and 2300.
Table 3.
The impact area and the ratio to the total area of the SLR in the study area, according to low- and high-emission projections scenarios for the years 2100 and 2300.
| Model | Scenario | 2100 | 2300 | ||
|---|---|---|---|---|---|
| Low Impact | Impact Area (ha) | Total Area (%) | Impact Area (ha) | Total Area (%) | |
| RCP2.6 | AR5 | 11,844 | 0.50 | 12,489 | 0.53 |
| SROCC | 11,816 | 0.50 | 13,313 | 0.56 | |
| SSP1-2.6 | MICI | 11,844 | 0.50 | 19,827 | 0.84 |
| SEJ | 12,219 | 0.52 | 22,304 | 0.95 | |
| High Impact | 2100 | 2300 | |||
| Impact area (ha) | Total area (%) | Impact area (ha) | Total area (%) | ||
| RCP8.5 | AR5 | 12,936 | 0.55 | 23,460 | 0.99 |
| SROCC | 13,357 | 0.57 | 37,819 | 1.60 | |
| SSP5-8.5 | MICI | 14,165 | 0.60 | 43,466 | 1.84 |
| SEJ | 15,202 | 0.64 | 111,424 | 4.72 | |
Table 4.
Areal distribution of land cover classes in the study area (2020–2050).
| Land Cover Classes | 2020 | 2050 | ||
|---|---|---|---|---|
| ha | % | ha | % | |
| Surface Water | 27,700 | 1.17 | 20,935 | 0.89 |
| Forests | 381,466 | 16.16 | 377,093 | 16.05 |
| Grassland, Scrub, and Shrub | 149,399 | 6.33 | 143,076 | 6.09 |
| Swamps/Flooded Vegetation | 1691 | 0.07 | 1802 | 0.08 |
| Cropland | 1,690,600 | 71.61 | 1,692,529 | 72.02 |
| Artificial Surface/Urban Area | 83,442 | 3.53 | 97,348 | 4.14 |
| Bare Lands | 26,548 | 1.12 | 17,280 | 0.74 |
Disclaimer/Publisher’s Note: The statements, opinions and data contained in all publications are solely those of the individual author(s) and contributor(s) and not of MDPI and/or the editor(s). MDPI and/or the editor(s) disclaim responsibility for any injury to people or property resulting from any ideas, methods, instructions or products referred to in the content. |
© 2023 by the authors. Licensee MDPI, Basel, Switzerland. This article is an open access article distributed under the terms and conditions of the Creative Commons Attribution (CC BY) license (https://creativecommons.org/licenses/by/4.0/).
Share and Cite
MDPI and ACS Style
Ozsahin, E.; Ozdes, M.; Ozturk, M.; Yang, D. Coastal Vulnerability Assessment of Thrace Peninsula: Implications for Climate Change and Sea Level Rise. Remote Sens. 2023, 15, 5592. https://doi.org/10.3390/rs15235592
AMA Style
Ozsahin E, Ozdes M, Ozturk M, Yang D. Coastal Vulnerability Assessment of Thrace Peninsula: Implications for Climate Change and Sea Level Rise. Remote Sensing. 2023; 15(23):5592. https://doi.org/10.3390/rs15235592
Chicago/Turabian StyleOzsahin, Emre, Mehmet Ozdes, Mikayil Ozturk, and Di Yang. 2023. "Coastal Vulnerability Assessment of Thrace Peninsula: Implications for Climate Change and Sea Level Rise" Remote Sensing 15, no. 23: 5592. https://doi.org/10.3390/rs15235592
Note that from the first issue of 2016, this journal uses article numbers instead of page numbers. See further details here.