
Impacts of Land Use/Land Cover Distributions on Permafrost Simulations on Tibetan Plateau


1
Qinghai Lake Comprehensive Observation and Research Station, Chinese Academy of Sciences, Lanzhou 730000, China
2
Key Laboratory of Land Surface Process and Climate Change in Cold and Arid Regions, Northwest Institute of Eco-Environment and Resources, Chinese Academy of Sciences, Lanzhou 730000, China
3
Tianjin Meteorological Disaster Defense Technology Centre, Tianjin 300074, China
*
Author to whom correspondence should be addressed.
Remote Sens. 2023, 15(23), 5586; https://doi.org/10.3390/rs15235586
Submission received: 23 October 2023
/
Revised: 23 November 2023
/
Accepted: 29 November 2023
/
Published: 30 November 2023
(This article belongs to the Section Remote Sensing in Geology, Geomorphology and Hydrology)
Abstract
:The Tibetan Plateau (TP) is distributed with large areas of permafrost, which have received increasing attention as the climate warms. Accurately modeling the extent of permafrost and permafrost changes is now an important challenge for climate change research and climate modeling in this region. Uncertainty in land use and land cover (LULC), which is important information characterizing surface conditions, directly affects the accuracy of the simulation of permafrost changes in land surface models. In order to investigate the effect of LULC uncertainty on permafrost simulation, we conducted simulation experiments on the TP using the Community Land Model, version 5 (CLM5) with five high-resolution LULC products in this study. Firstly, we evaluated the simulation results using shallow soil temperature data and deep borehole data at several sites. The results show that the model performs well in simulating shallow soil temperatures and deep soil temperature profiles. The effect of different land use products on the shallow soil temperature and deep soil temperature contours is not obvious due to the small differences in land use products at these sites. Although there is little difference in the simulating results of different land use products when compared to the permafrost distribution map, the differences are noticeable for the simulation of the active layer. Land cover had a greater impact on soil temperature simulations in regions with greater land use inconsistency, such as at the junction of bare soil and grassland in the northwestern part of the TP, as well as in the southeast region with complex topography. The main way in which this effect occurs is that land cover affects the net surface radiation, which in turn causes differences in soil temperature simulations. In addition, we discuss other factors affecting permafrost simulation results and point out that increasing the model plant function types as well as carefully selecting LULC products is one of the most important ways to improve the simulation performance of land-surface models in permafrost regions.
1. Introduction
The Tibetan Plateau (TP), with an average elevation of over 4000 m, has the largest area of permafrost in the mid-latitudes. With global warming, the degradation of permafrost is expected to intensify, which in turn will have significant impacts on regional ecology, hydrology, and infrastructure engineering [1,2,3,4,5,6]. Permafrost distribution and its changes have always been the focus of research on regional climate and environment at the TP. Accurately obtaining the distribution of permafrost has been an important challenge for climate research; nowadays, in addition to relying on field surveys and monitoring via remote sensing [7,8], numerical simulation based on a land model is gradually becoming a useful method, especially in studies analyzing the interaction between climate and cryosphere [9,10]. However, the uncertainty in the simulation of permafrost extent can reduce the reliability of climate prediction and affect the prediction of engineering safety in permafrost regions. Currently, improving the accuracy of permafrost extent simulations is an important research direction for the development and application of climate models in permafrost regions.
The simulation of permafrost extent in climate models and land surface models can be affected by numerous factors, such as atmospheric forcing, land surface conditions, surface radiation balance, soil conditions, and deficiencies in the model schemes. Land use and land cover (LULC), as an important component of surface characteristics in land surface models, is directly affecting the surface energy balance and the simulation results of the permafrost process. Many observation-based studies have shown that there are significant differences in energy fluxes, including net radiation, latent heat fluxes, sensible heat fluxes, and soil temperature and moisture conditions, across different land covers [11,12,13,14]. Such differences in surface fluxes are directly related to surface roughness, albedo, and other attributes of land-use types, and they affect the exchange of water and energy between the surface and atmosphere, leading to variations in local climate change across different underlying surfaces under global change. These effects have also been continuously updated in the model parameterization scheme over the years of model development [15]. Several studies have used the climate model or land surface model to investigate the effects of surface vegetation, snowpack, and other LULC types on soil temperatures as well as permafrost changes [16,17,18]. They found that these LULC changes in surface cover directly altered the surface energy fluxes, which in turn had a significant effect on the simulation results of soil temperature and permafrost.
Many high-resolution LULC products based on remote sensing data from different satellites have been released in the past decades. There are several commonly used global high-resolution LULC products, including: the moderate-resolution imaging spectroradiometer (MODIS) LULC dataset produced by the National Aeronautics and Space Administration (NASA) [19], the Copernicus Climate Change Service Global Land Cover (C3S-LC) product produced by the European Space Agency (ESA) [20], the 30 m global land cover (GlobeLand30) produced by the National Geomatics Center of China [21], Global Land Cover Fine Surface Covering 30 (GLC-FCS30) produced by the Academy of Aerospace Technology [22], and the ESA World Cover 10 m 2020 product produced by EAS [23]. Compared to the default 1 km LULC data for most models, these high-resolution LULC products can provide resolutions up to 30 m or even 10 m. Theoretically, high-resolution data can improve the detailed characterization of land surface use and have the potential to substantially reduce the simulation uncertainty of land surface models over complex surfaces [24,25]. However, numerous studies have evaluated these high-resolution LULC products in recent years and have found that there is low agreement between these products in mixed classes and in heterogeneous landscape areas [26,27,28,29]. Pan et al. [30] discussed the effects of differences in LULC products on land surface temperature simulations in East China. They found that significant differences in model-simulated forested subsurface surface temperatures occurred due to the low agreement of forest type identification using different LULC products. However, there is still little work on how disagreement in LULC data affects the applicability of land surface models in cold regions and the simulation of the permafrost extent. Therefore, more attention needs to be paid to the impact of differences in LULC products on the simulation of surface energy balance and permafrost distribution in cold regions.
In this paper, six sets of simulation results from the Community Land Model, version 5 (CLM5), produced based on five different LULC products and CLM default land surface data, are evaluated to investigate the effects of uncertainty in LULC products on permafrost simulation in the TP. We evaluate the permafrost simulations for different LULC types by comparing them with permafrost maps and borehole site measurements. At the same time, we investigated the effect of land use disagreements on permafrost extent and active layer simulations and tried to explore the processes of LULC influence on soil temperature simulation results. This work helps to improve the performance of the land surface model in the permafrost region and provides a reference for the selection of LULC products in the land surface model.
2. Materials and Methods
2.1. Study Area
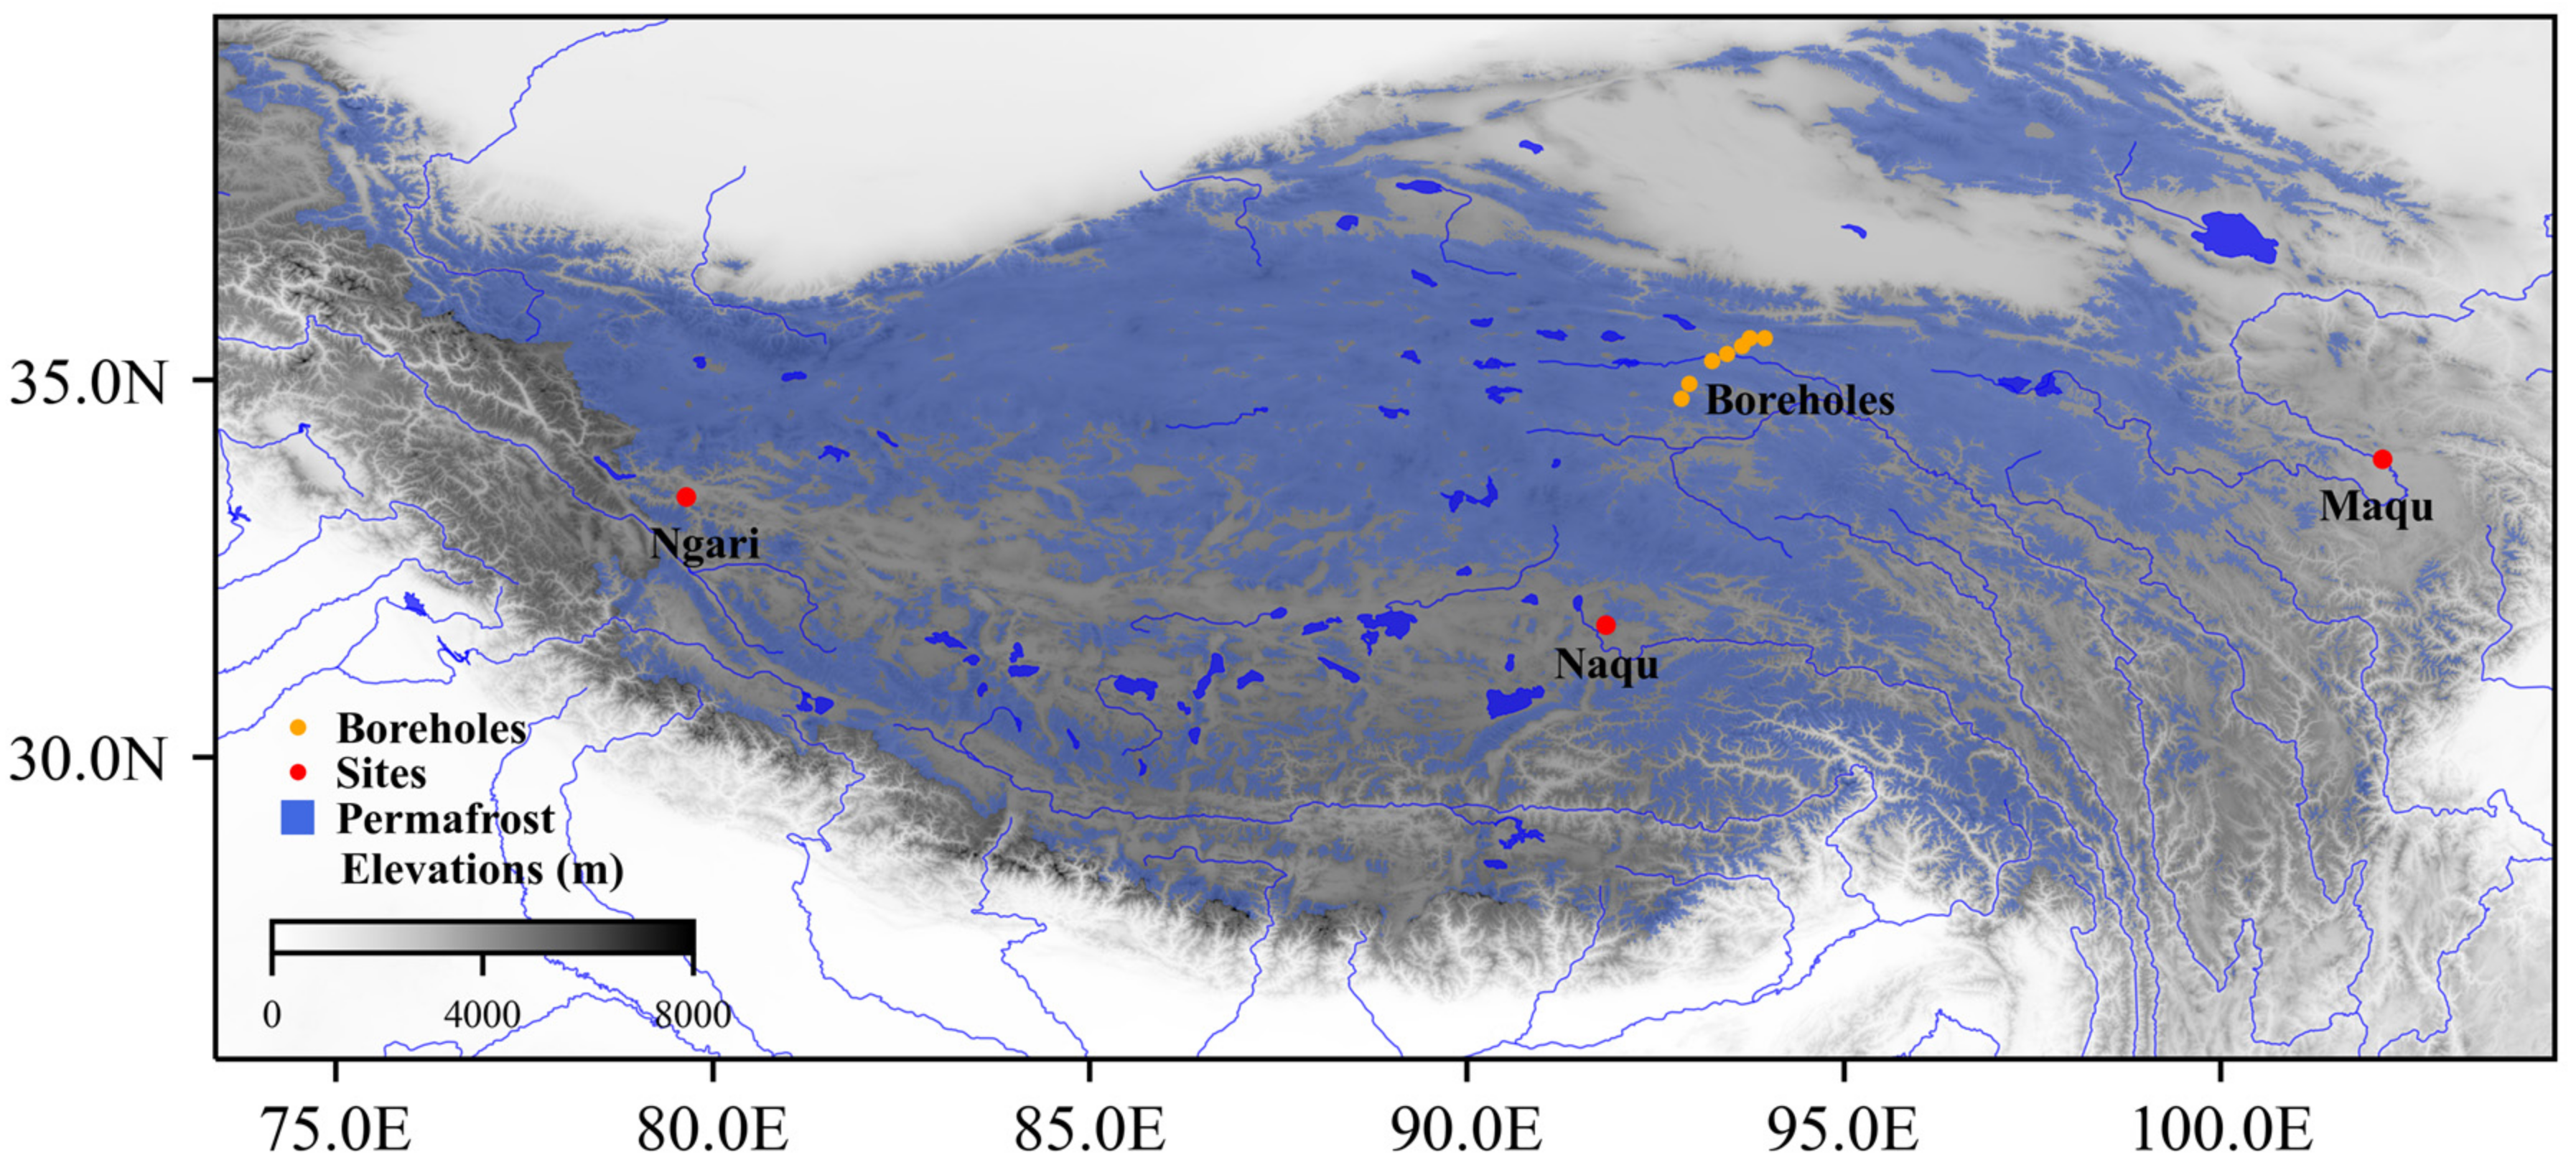
The TP, the highest plateau in the world with an average altitude of 4000 m and an area of about 2.5 million square kilometers, is known as the third pole. The high elevation topography of the TP leads to a mean annual temperature below −1.7 °C [31], and as a result, the region distributes the largest area of permafrost in the mid-latitudes (Figure 1). According to the latest map of permafrost distribution, the total area of permafrost on the TP is estimated to be 1.09 million square kilometers [32]. The average thickness of permafrost on the TP is about 43.20 m [33]. The existence of ground ice is an important characteristic of permafrost. On the TP, in the permafrost layer at a depth of 3.0–10.0 m, the total volume of ground ice is about 52 km3, and the volume of ground ice is 0.31 m3/m3 [34]. In the context of global warming, observations show that the TP is also warming and that the warming trend has accelerated in recent years [35]. Continued warming has caused degradation of the permafrost in this region, seriously affecting the ecology and engineering safety of the TP [36,37]. The TP is characterized by complex topography and high heterogeneity in the LULC. These complex surface features may make climate models perform unsatisfactorily in this region. Therefore, we chose this region as the study area for this study.
2.2. LULC Products
We selected five LULC products from different remote sensing instruments, all of which provide global LULC information for 2020 and are available online (see Table 1 for their detailed classifications):
- (1)
- The Copernicus Climate Change Service has generated global land cover (C3S_LC) maps for 2016–2020. This product provides global LULC data with a spatial resolution of 0.002778° (approximately 300 m at the equator). This set of global land cover products was generated based on the Project for On-Board Autonomy-Vegetation and S3-OLCI satellites. The typology of C3S_LC uses the land cover classification system (LCCS) developed by the Food and Agriculture Organization of the United Nations. In addition, UN-LCCS is compatible with the plant functional types used in climate models. It was also easier to introduce into the CLM5 in this study;
- (2)
- The ESA World Cover 2020 (ESA_WC10), produced by ESA in collaboration with a number of scientific institutions around the world, is based on Sentinel-1 and Sentinel-2 data and has a spatial resolution of 10 m. Higher resolution provides finer land cover information and also improves the accuracy of the model’s description of subgrid information. The data are currently freely available in 2020 and 2021 data products based on different algorithms. The product is also using UN-LCCS for definitions, and the classification provides 11 land cover classes;
- (3)
- GlobeLand30 is a global land cover mapping product with a spatial resolution of 30 m produced by the National Geomatics Center of China. The product is developed based on Landsat TM and ETM+ multispectral images and multispectral images from the Chinese Environmental Disaster Alleviation Satellite. The classification system of GlobeLand30 includes ten land cover types, with data available for three years: 2000, 2010, and 2020;
- (4)
- Global Land Cover Fine Surface Covering 30 (GLC-FCS30) is produced by the Institute of Remote Sensing and Digital Earth, Chinese Academy of Sciences. The new 2020 product is produced based on the 2015 global land cover product with a fine classification system and combines 2019–2020 time series Landsat surface reflectance data, Sentinel-1 SAR data, DEM topographic elevation data, global thematic auxiliary datasets, and a priori knowledge datasets. The land cover of this dataset is classified into 30 land cover types with a spatial resolution of 30 m;
- (5)
- The MODIS Land Cover Type Product (MODIS_LC) was created from classifications of spectro-temporal features derived from data from the Moderate Resolution Imaging Spectroradiometer (MODIS). It provides a global land cover dataset from 2001 to the present at a spatial resolution of 500 m. Although the resolution of this dataset is only 500 m, it is widely used in climate models and land surface models. Therefore, it is also included in this study for comparison. This product includes six different land cover classification systems, and we use the Food and Agriculture Organization’s land cover classification system to make it easier to apply to the land surface model.
2.3. Forcing and Soil Datasets
In this study, the China Meteorological Forcing Dataset (CMFD) was used to drive CLM5. The dataset was produced by the Hydrometeorology Research Group of the Institute of Tibetan Plateau Studies, Chinese Academy of Sciences [38]. Seven variables are included in this dataset, i.e., temperature, precipitation, wind speed, specific humidity, atmospheric pressure, downward shortwave radiation flux, and downward longwave radiation. The dataset has a 3 h temporal resolution, 0.1° spatial resolution, and spans the period 1979–2018. This forcing dataset has been evaluated in several studies in recent years, and the results indicate that it is very accurate and suitable for land surface process modeling [30,39,40,41]. Since our simulation period in this study is 2000–2012, we only used data from the corresponding time period of this dataset.
To better improve the accuracy of the soil characteristics of the model in this study, we used the China Dataset of Soil Properties for Land Surface Modeling (CDSP-LSM) to update the surface data. The soil dataset combines 8979 soil profiles and 1:1 million soil physical and chemical properties from the Soil Map of China. More detailed information on the production and evaluation of the CDSP-LSM dataset can be found in the work of Shangguan et al. [42] and Dai et al. [43]. We used data from the CDSP-LSM to update multilayered soil texture data in the CLM5 surface data, including the percentages of sand and clay, soil organic matter content, and soil color.
2.4. Reference Datasets
A new 2010 map of permafrost distribution on the TP (available at https://essd.copernicus.org/articles/15/3905/2023/#section5, accessed on 1 November 2023) was used to validate the modeled permafrost extent. Cao et al. [32] produced this map using satellite-derived surface thaw and freeze indices as inputs and survey-based subregional permafrost maps as constraints. They compared this map with other permafrost distribution maps and found it to be more realistic [32].
We downloaded an observational dataset of plateau soil temperature and moisture from the National Tibetan Plateau Data Center to evaluate the simulation results. The dataset is from four site reference networks, namely the Naqu Network, the Maqu Network, the Ngari Network, and the Pari Network [44]. Among these datasets, Naqu, Maqu, and Ngari have the time periods from January 2011 to December 2012, which is consistent with our simulation time period. So, we extracted observations from the three sites to evaluate the shallow soil temperature simulation results. In addition, we also downloaded seven borehole temperature measurements along the Qinghai-Tibet Railway from the National Cryosphere Desert Data Center (http://www.ncdc.ac.cn/portal/metadata/5be04672-0d1b-11e6-b319-5cc5d45ad3ae, accessed on 1 November 2023) to evaluate the permafrost simulation results. Table 2 shows the details of the three sites and seven boreholes.
2.5. Model and Experimental Setup
The CLM5 is the terrestrial component of the Community Earth System Model (CESM) and can be used to carry out offline or coupled simulations of regional or global land–atmosphere interaction processes. It succeeds most of the biophysical–chemical modules of the CLM4.5 and also includes many updates in soil and plant hydrology, snow density, river modeling, carbon and nitrogen cycling, and crops [15]. The hydrology of CLM5 has been improved to include a dry surface layer for surface evaporation [45] and spatially variable soil depths [46]. Default vertical soils were deepened, and resolution improvements were made, particularly in the top 3 m range, to represent the thickness of the active layer more clearly in the permafrost zone [15]. The default vertical stratification of the model is 25 layers, and the maximum simulated depth is 42 m. Compared to the CLM4.5, these modifications improve the consistency of soil temperature simulations with observations and their applicability in permafrost regions [15]. CLM5 uses a variety of land units, including glaciers, lakes, cities, vegetation, and crops, as well as 15 plant functional types (PFTs) and bare ground to represent surface heterogeneity. Thus, the CLM5 can properly describe spatial land surface heterogeneity and is suitable for modeling the effects of different land cover types on the surface energy balance. The spatial heterogeneity of land cover is characterized in the CLM5 using a nested sub-grid hierarchy, where grid cells consist of multiple land units, columns, and patches. Land units include vegetation, lakes, cities, glaciers, and crops. Within the vegetation land units, there are different numbers of columns and patches, each with a specific PFT or crop function type [15]. Land units and PFT patches can reflect differences in biogeophysical parameterization across land cover, which in turn affects surface energy and water balance processes.
In this study, we conducted six simulation experiments using the five sets of LULC products and model default surface data. Each of the five simulations based on LULC products is named according to the product names, including C3S_LC, ESA_WC10, GlobeLand30, GLC-FCS30, and MODIS_LC, while the CLM5 simulation using default land surface data is named as a controlled experiment (CTL). The LULC classes in the five LULC products were converted to CLM5 land units and PFTs based on the classification descriptions associated with each product (Table 3). The five LULC products have different spatial resolutions, including 500, 300, 30, and 10 m. In the CLM5, the spatial heterogeneity of land cover is described by a nested subgrid hierarchy. Therefore, we extracted and calculated percentages of different types of reclassified LULC information based on the coordinates of the simulated grid and then replaced the land units and PFT classification information in the model surface data. The reclassified surface data in the study area is presented in Figure 2. Since we focused on modeling surface physical processes in this study, the CLM5 in the simulation experiments was run in satellite phenology (CLMSP) and with inactive biogeochemistry. In the CLMSP model, prescribed LAI were derived from MODIS satellite data using the de-clustering method [47], which can effectively increase the speed of model runs. Also, the complex crop module was not activated in the simulations because the study area is a high-elevation area with a small percentage of cropland. For each simulation case, the CLM5 was driven by the CMFD 2002 data as atmospheric forcing data and was run cyclically for 50 years to reach equilibrium in soil temperature and moisture. We note that the recommended spin-up time for simulating permafrost using the Noah LSM is 500 years. [48]. However, considering that the model we used is CLM5, and referring to other researchers who have simulated permafrost using CLM with a spin-up time of 30–100 years [49,50], we examine the balance results and find that a spin-up time of 50 is acceptable. Considering the amount of computation required for high-resolution simulations, a spin-up time of 50 is considered acceptable. The output of the spin-up simulation was used as the initial condition. All cases were run for 10 years of simulations, from 2003 to 2012, at a spatial resolution of 0.1°. This 10-year simulation can include the satellite remote sensing data time period of 2005–2010 utilized for the permafrost maps [32]. The permafrost map we obtained is from 2010, and the site observations and borehole data obtained are from 2012 and 2010, respectively. Therefore, the simulation period in this study was chosen as 2000–2012. Due to the different time intervals between the release of these five LULC products, 2020 is the year in which all data were released. In addition, due to the relatively low human activities on the TP, we assume that the land use and land cover on the plateau have not changed significantly in the last two decades. Therefore, we consider that the mismatch between the simulation period and the time of the LULC product is acceptable.
3. Results
3.1. Comparison of Spatial Pattern of the Land Cover Products
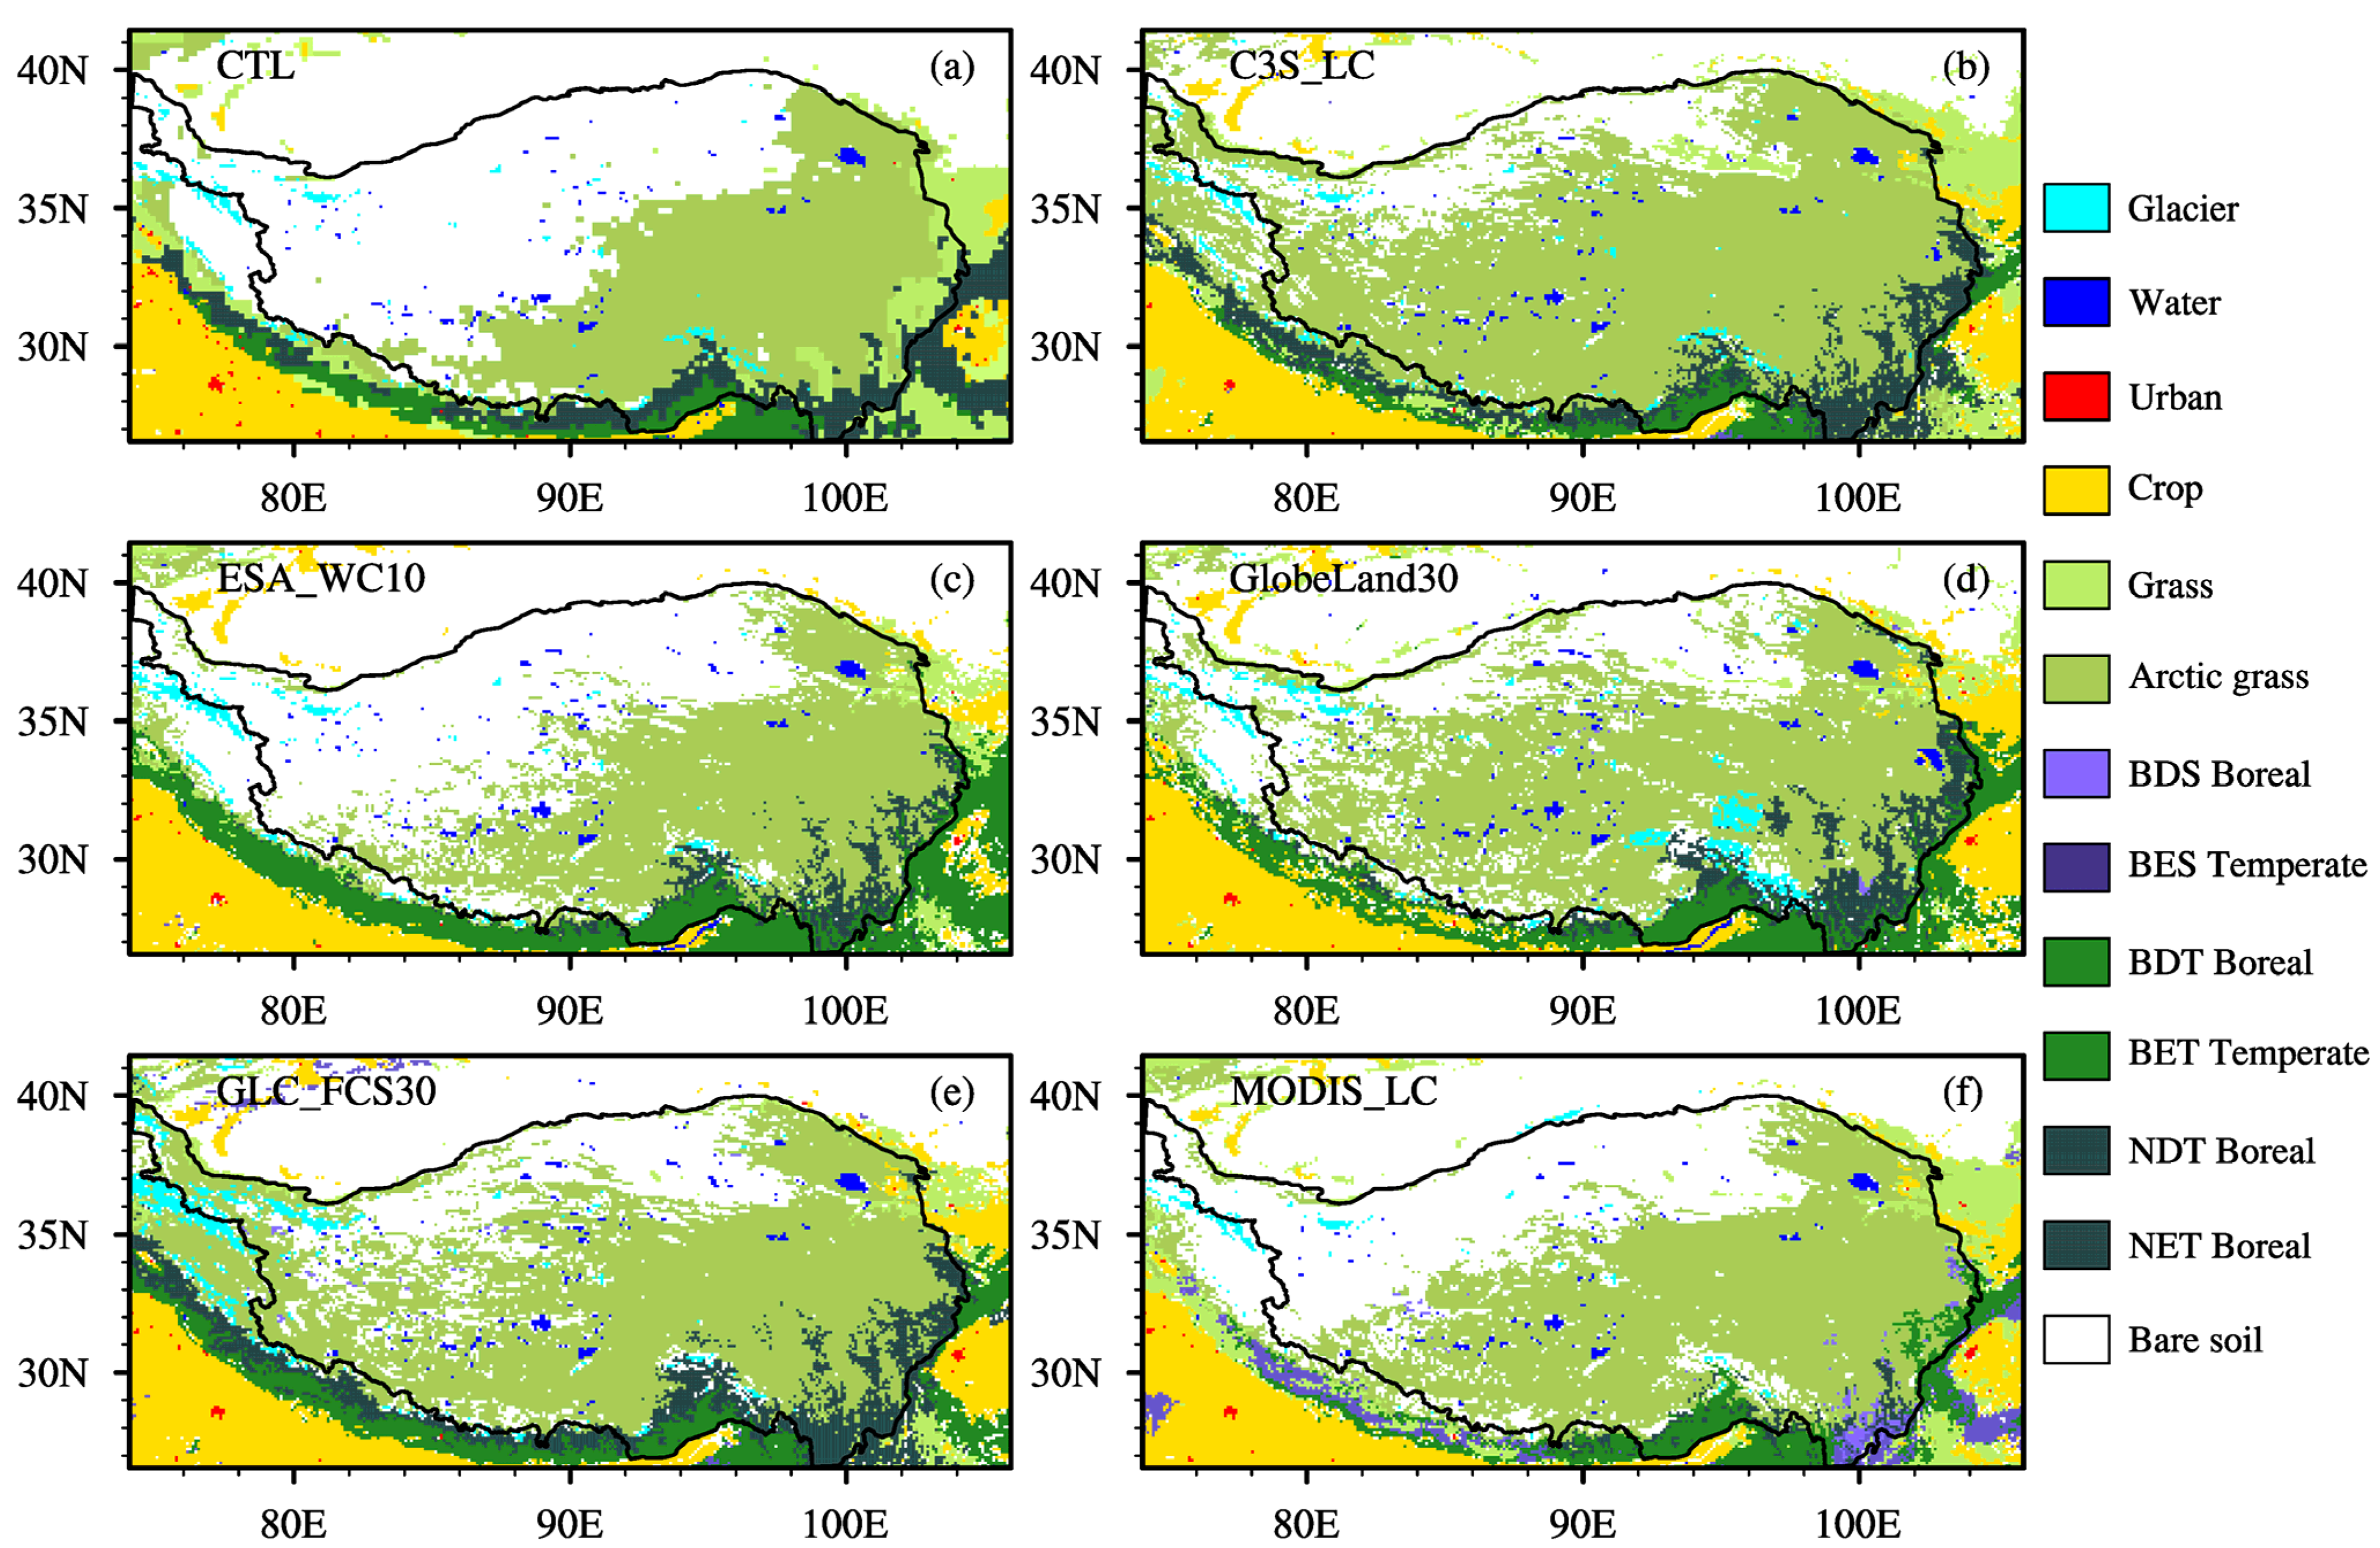
The spatial distribution of CLM5 default LULC and the five LULC products after reclassification over the TP are shown in Figure 2. It should be noted that the land cover type shown for each pixel point in Figure 2 is the land cover type that has the largest percentage of area fraction at that grid point. All land cover products show a similar distribution pattern, with the northwestern region of the TP being dominated by bare soil, the central part of the TP being covered with grassland for most parts, and the southeastern and lower-elevation regions being covered with forests and shrubs. At the same time, some apparent differences can be seen among these products. CLM5, ESA_WC10, and MODIS_LC identify the land cover in the northwestern TP as bare soil, while C3S_LC, GlobeLand30, and GLC-FCS30 identify more grassy land areas. In addition, GlobeLand30 identified more snow and glaciers in the Nyenchen Tanglha mountain.
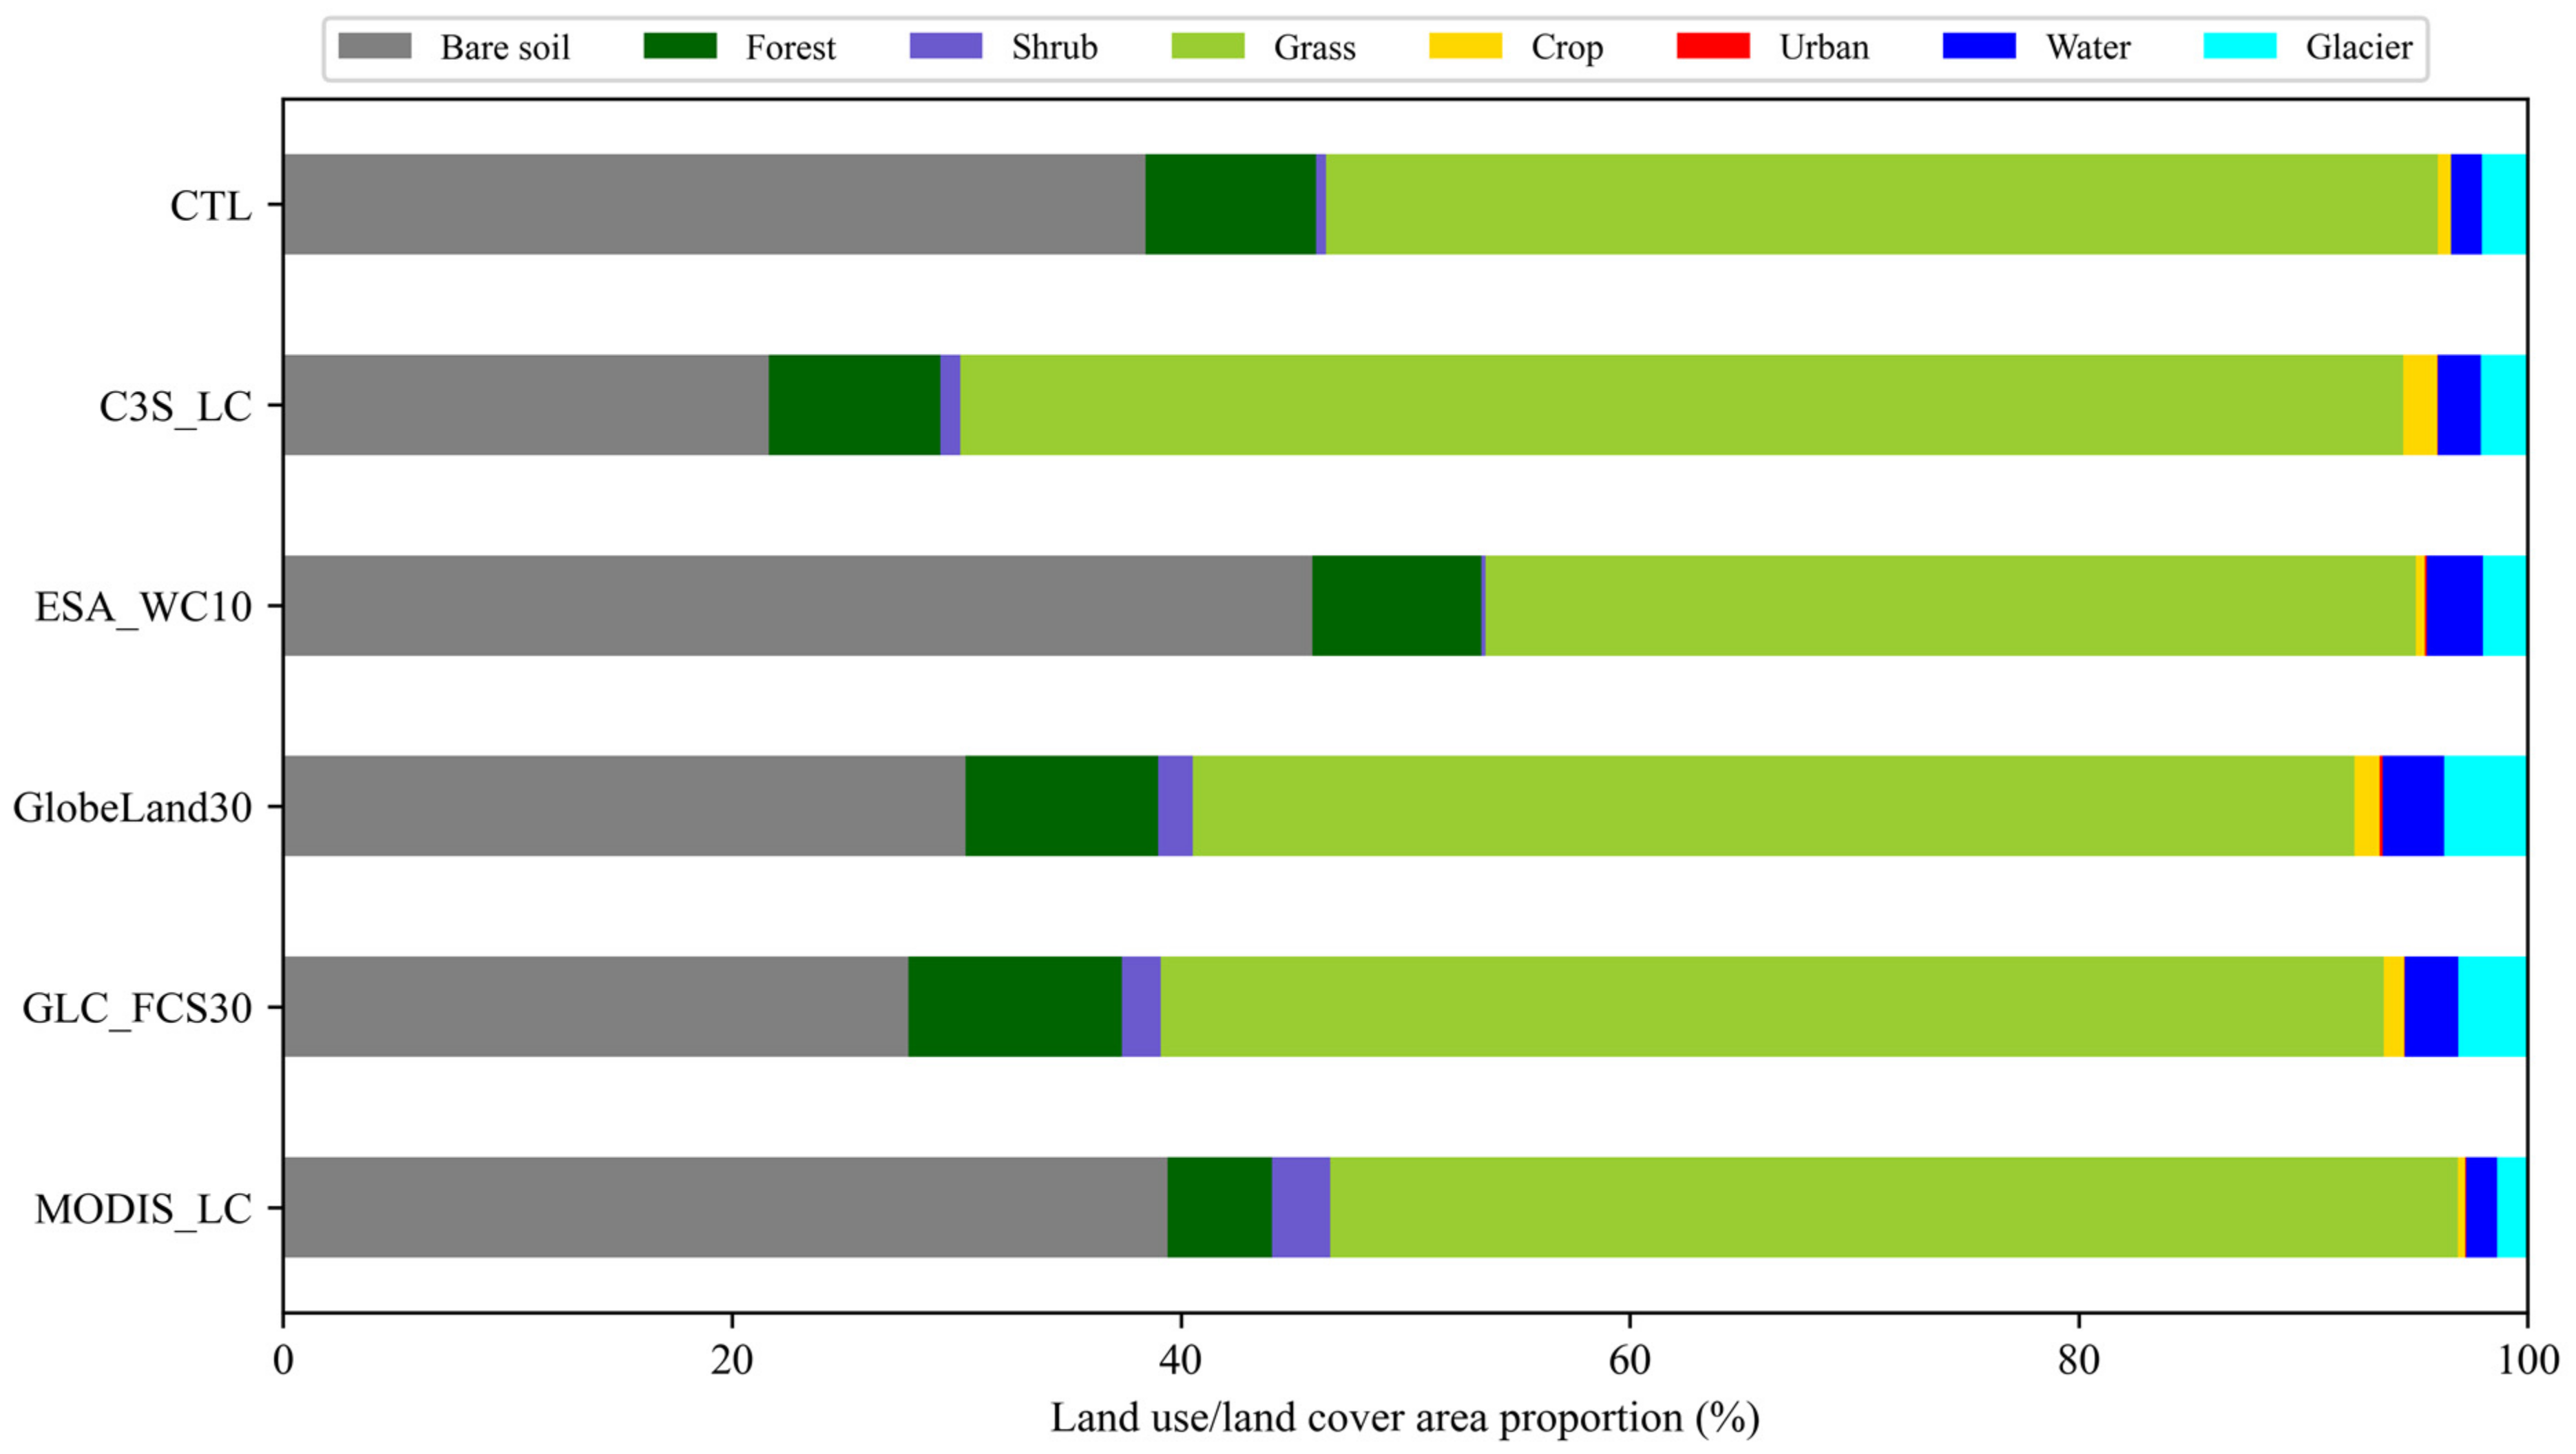
In order to more accurately compare and quantify the differences between the LULC products, we calculated the total percent area of each land cover type for CLM5, C3S_LC, EAS10, GlobeLand30, GLC-FCS30, and MODIS_LC in Figure 3. It can be seen that all of the LULC products generally show the same TP land cover types, i.e., the TP is dominated by grassland and bare soil. The average proportion of grassland in the six LULC products is 51.95%, and the average bare soil is 33.92%. The C3S_LC products have the largest area of grassland coverage, with area proportions of 64.28%, and the lowest proportion of bare soil, with 31.63%. The ESA_WC10 shows the lowest grassland coverage area, with a proportion of 41.44%, and the highest proportion of bare soil at 45.86%. Forest, water, wetland, glacier, crop, and urban have smaller distributions. The average proportion of forest, shrubland, water, and glacier in the six products is 7.58%, 1.24%, 2.05%, and 2.38%, respectively. Consistent with Figure 2d, the GlobeLand30 product produces the highest proportion of glacier area at 3.73%, appreciably higher than the other products.
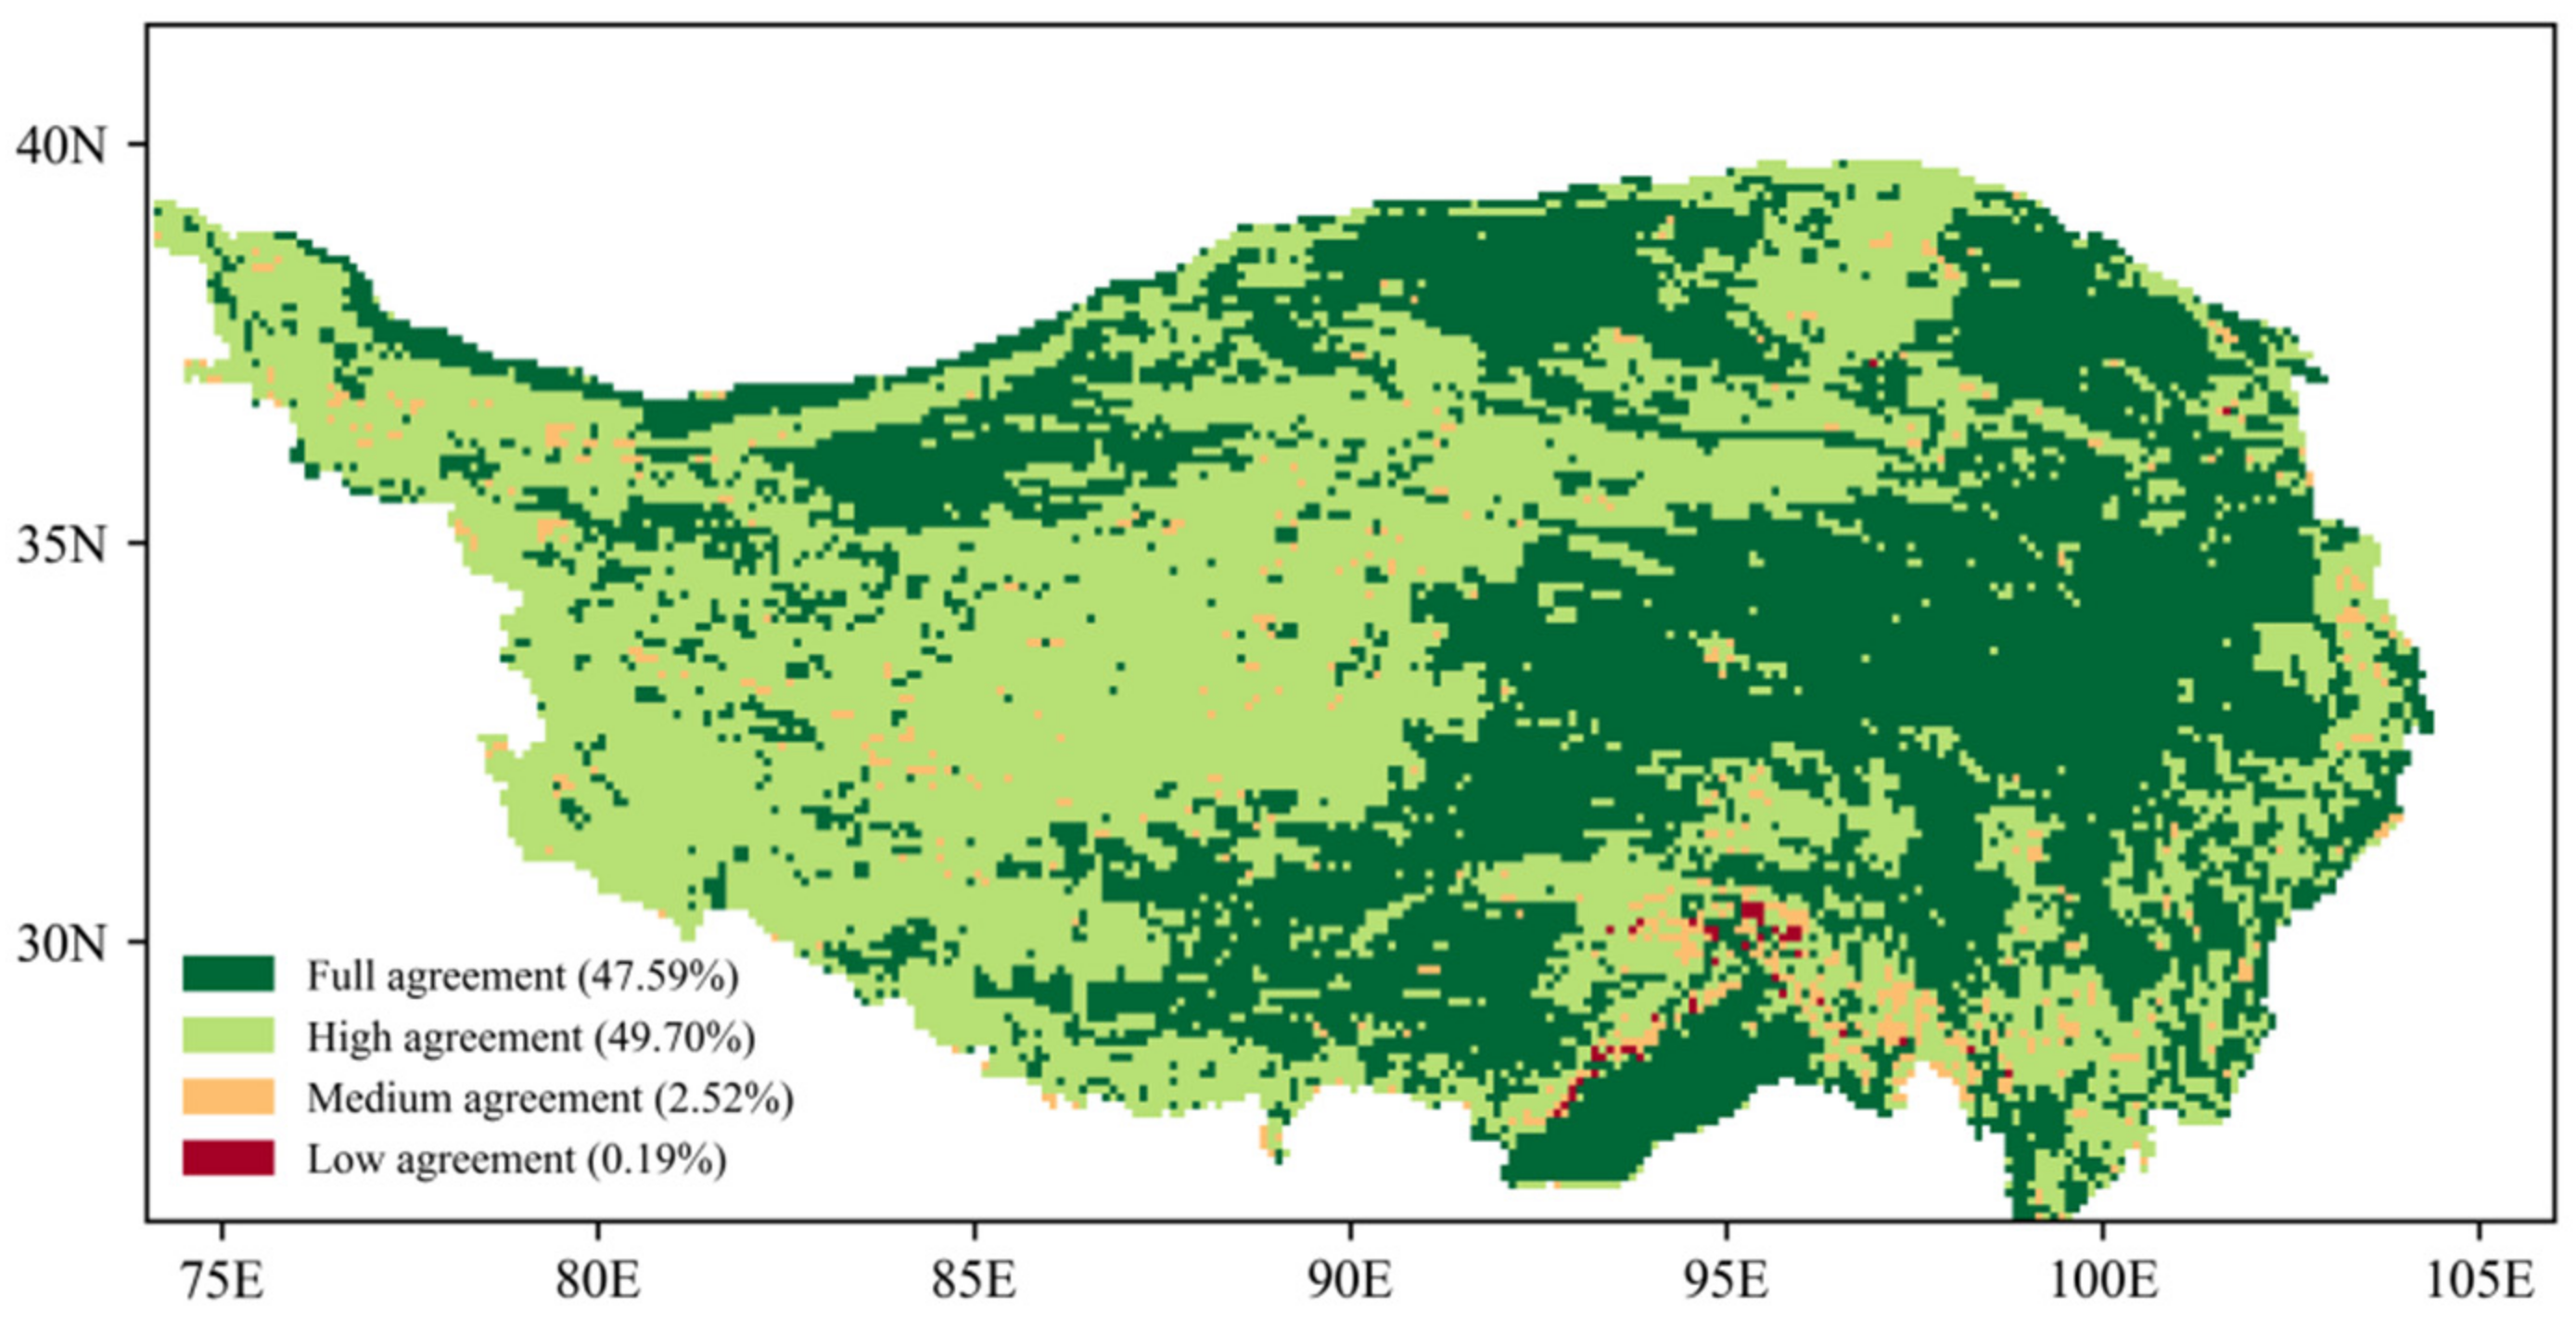
The spatial consistency among the six land cover products over the TP is shown in Figure 4. Full agreement is where the six datasets show exactly the same land cover type in the corresponding simulation grids. High agreements are where the six datasets show only two land cover types in the corresponding simulation grids. Medium agreements are where the six datasets show only three land cover types in the corresponding simulation grids. Low agreements are where the six datasets show four or more land cover types in the corresponding simulation grids. The highly consistent regions of the six products were mainly distributed in the grassland areas of the central and eastern parts of the TP. The statistics show that in 47% of the area, the six products have the same land cover type per pixel. There is about half of the plateau area, primarily in the northwestern part of the plateau at the interface of bare soil and grassland, where these six LULC products identify two land cover types. The medium agreement and low agreement pixels occupy a relatively small area, with about 2.52% and 0.19%, respectively. These pixels are mainly found in the Nyenchen Tanglha mountain in the southern part of the TP. The main cover types in these low-consistency areas were glacier, bare soil, grassland, and forest.
3.2. Simulation Evaluation
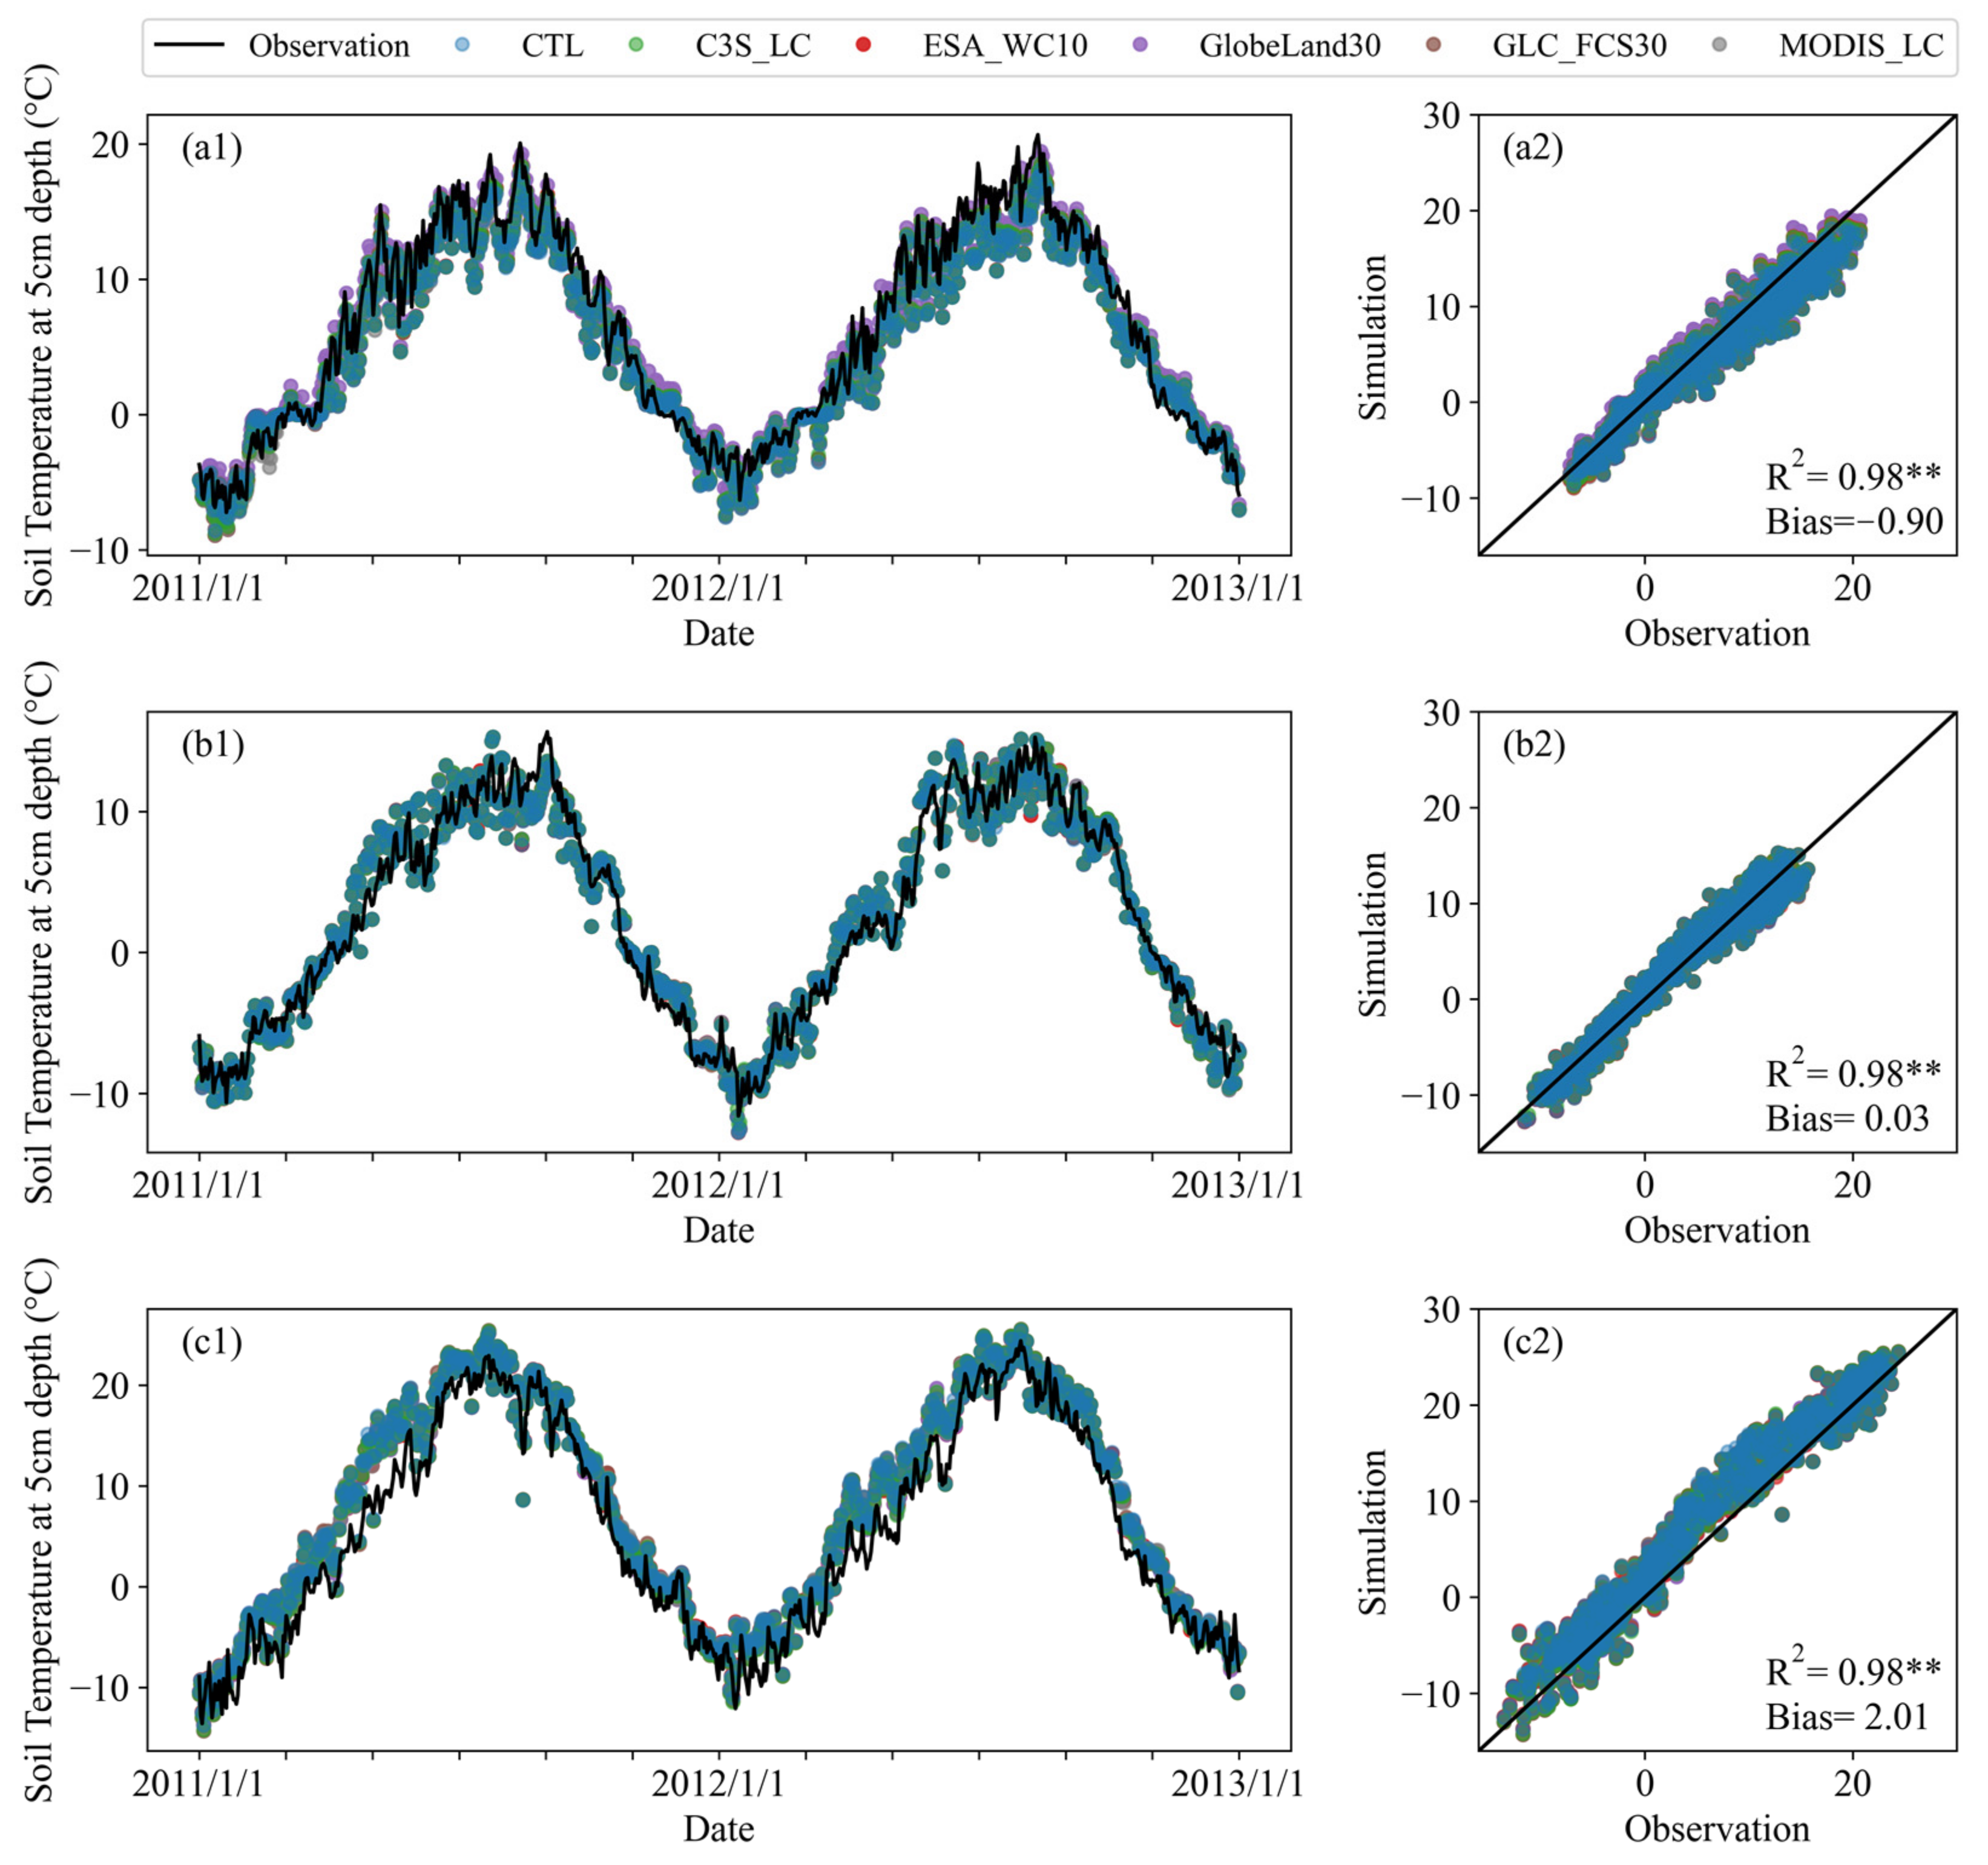
Figure 5 shows that the soil temperature simulations of all six cases are significantly in agreement with the observations, with an average R of 0.98. The model can well represent the magnitude and seasonal variation of the shallow soil temperature at the three sites. In addition, there is little difference in the simulation of soil temperatures between the different cases. We have checked the land cover dataset at the three sites and found that the land cover showed high agreement with the six products. This high agreement on land cover could explain the consistent simulation results among the six cases. In addition, there are some errors between the simulation and observation, with the bias ranging from a minimum of 0.03 in Nagqu station to a maximum of 2.01 in Ngari station.
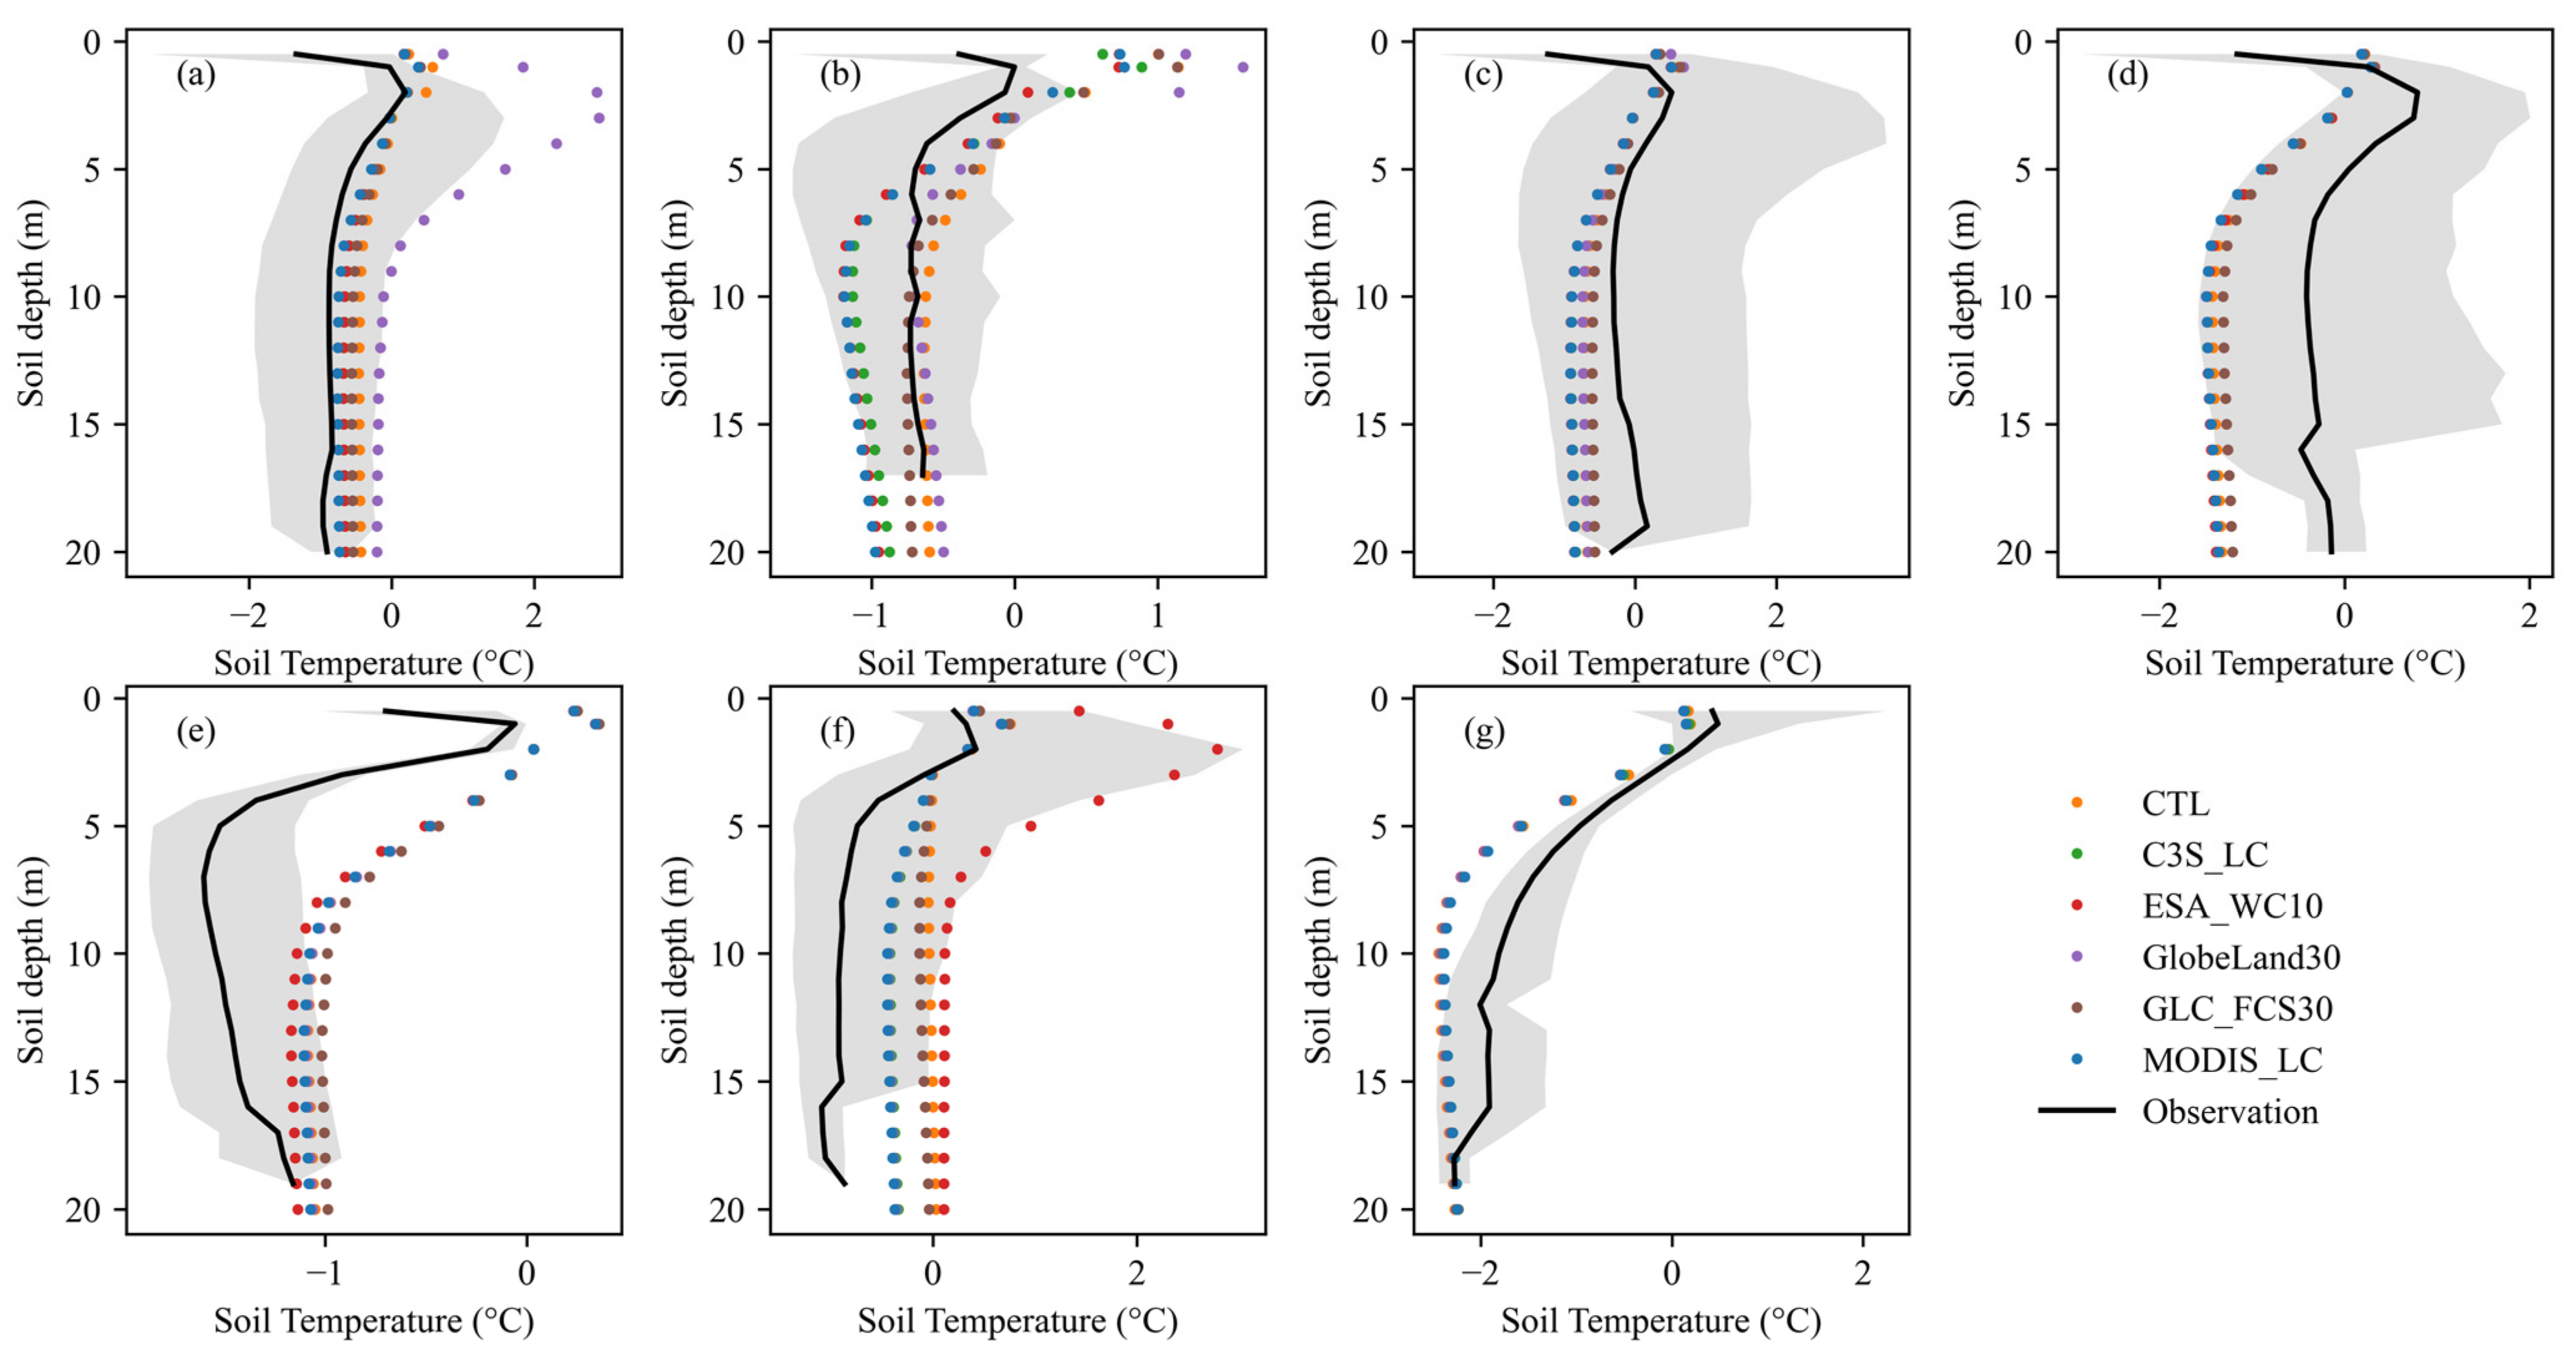
Furthermore, we also compared simulated and observed borehole soil temperatures in the permafrost region (Figure 6). Since the time of the borehole dataset was created in November 2001, the simulation results for this time were extracted for analysis. We extracted the simulation results nearest to the location of these boreholes. Figure 6 exhibits that the simulated soil temperatures can well reproduce the vertical profile of the soil temperatures compared to the borehole observations at most of the borehole sites, and the simulated values are generally within the variation range of the observed values. However, Figure 6e shows that the simulation results of the shallow temperature profile at the Wudaoliang site differ substantially from the observations. This may be due to differences between the spatial scales of the gridded data and the site borehole data. Differences in simulated temperatures for different land use products were found at the Budongquan (Figure 6a) and K3040 (Figure 6f) borehole sites. From Table 4, it can be seen that the GlobeLand30 product identified more grassland at the Budongquan borehole sites, while the other products identified more bare soil. Similarly, at borehole K3040, ESA identified more bare soil, while the other products identified grassland as predominant. This result suggests that surface vegetation cover has a strong influence on the simulation of soil temperature vertical profiles. From the RMSE (Root Mean Square Error) statistics in Table 5, it can be seen that the simulation results from MODIS_LC have the lowest multi-site mean of RMSE relative to the other products.
3.3. Permafrost Extent and Active Layer Thickness Simulation Results
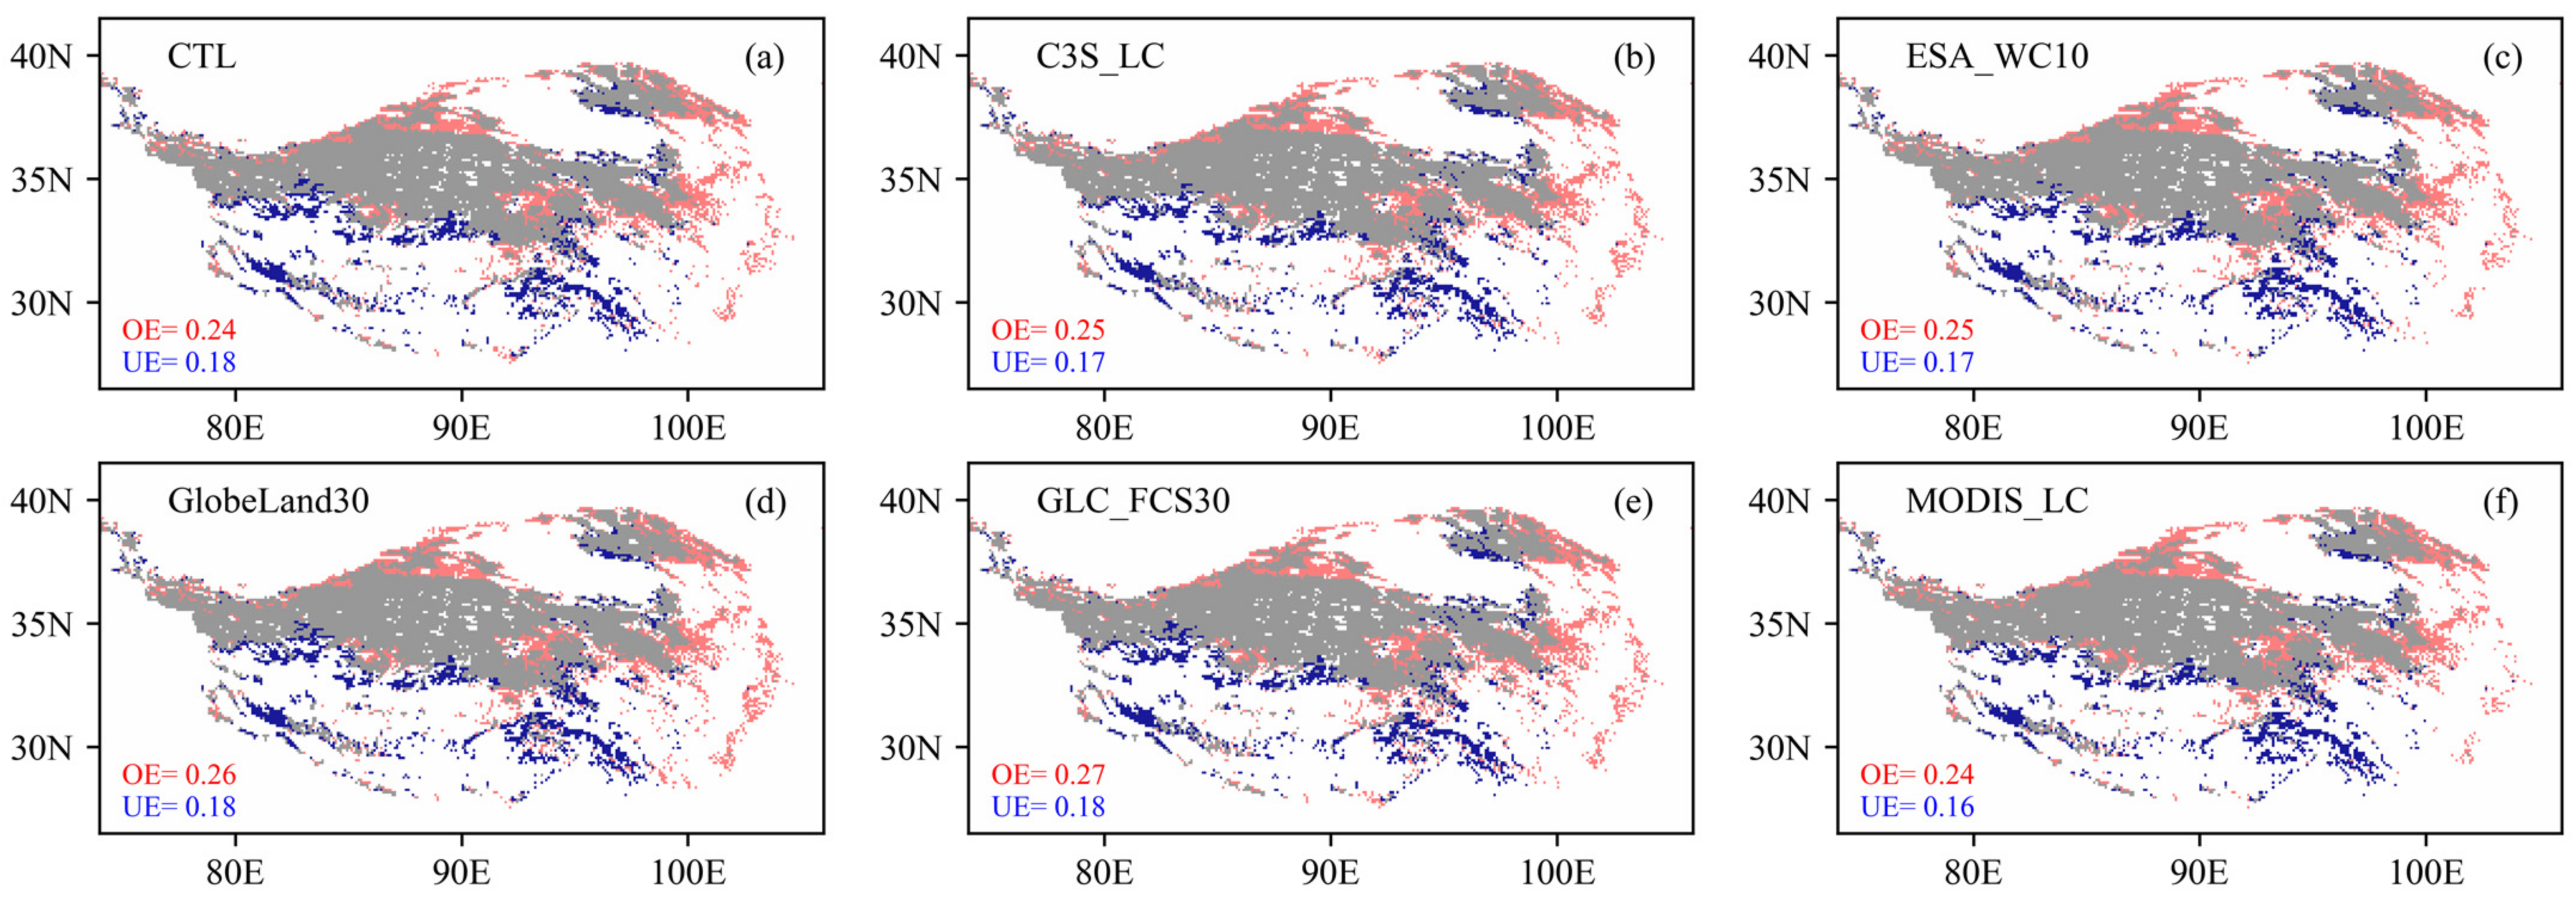
In this section, we have calculated the permafrost extent based on the daily soil temperature simulated with the CLM5, which introduces six LULC products. According to the definition of permafrost, a grid cell is identified as permafrost if the maximum monthly mean temperature in at least one soil layer remains below 0 °C for two consecutive years. We compared those simulated permafrost extents with permafrost maps to assess the influence of different LULC products on permafrost simulations, as shown in Figure 7. The CLM5 introduced with different LULC products can reproduce the spatial distribution of the permafrost extent, i.e., permafrost is mainly continuously distributed in the central part of the TP. The overestimated area fraction (OE) and underestimated area fraction (UE) of the simulation results introducing different LULC products compared to the permafrost map are also calculated. The calculated OE and UE values were essentially the same for the different cases, with an average of 0.15 for OE and 0.23 for UE. The MODIS_LC case simulates the highest level of agreement with the permafrost map, with the smallest sum of OE and UE. The GlobeLand30 case simulates the lowest level of agreement with the permafrost map, with the largest sum of OE and UE. The distribution characteristics of the OE and UE permafrost areas simulated with different LULC products are somewhat similar. Most of the UE areas are distributed in the southern part of the TP and at the edge of continuous permafrost. These common features of simulated permafrost extent are not caused by differences in different LULC products but may be due to uncertainties in the atmospheric forcing and permafrost map.
Changes in active layer thickness (ALT) have important implications for ecosystems, the hydrological cycle, and engineering works in permafrost regions. Therefore, we compared the differences in ALT for the simulated cases with different LULC products introduced in Figure 8. ALT is defined as the annual thaw depth of the permafrost. By linearly interpolating the simulated soil temperatures, the depth between two adjacent depths above and below 0 °C was determined to be the ALT. Figure 8a shows that the ALT is below 4 m in most of the permafrost area. The average ALT in the permafrost region of the TP is 2.86 m. The ALT increases from the continuous permafrost zone in the hinterland of the Northern TP to its surroundings, reaching a maximum at the edge of the permafrost zone. The simulated ALT from different LULC products shows obvious variations compared to the CTL results. The largest ALT error reaches 2 m, which may significantly affect the engineering construction in permafrost regions. The average ALT of the ESA_WC10 and MODIS_LC case simulations is 0.31 m and 0.34 m shallower than CTL. The areas where ESA_WC10 and MODIS_LC cases simulated ALT are lower than simulations from the CTL are mainly located in the northwestern part of the TP. The difference between the simulated ALT and CTL cases for the C3S_LC, GlobeLand30, and GLC-FCS30 cases is approximately 0.04 m, −0.06 m, and 0.0 m, respectively.
3.4. Analysis of the Impact for LULC Products on Soil Temperature Simulation
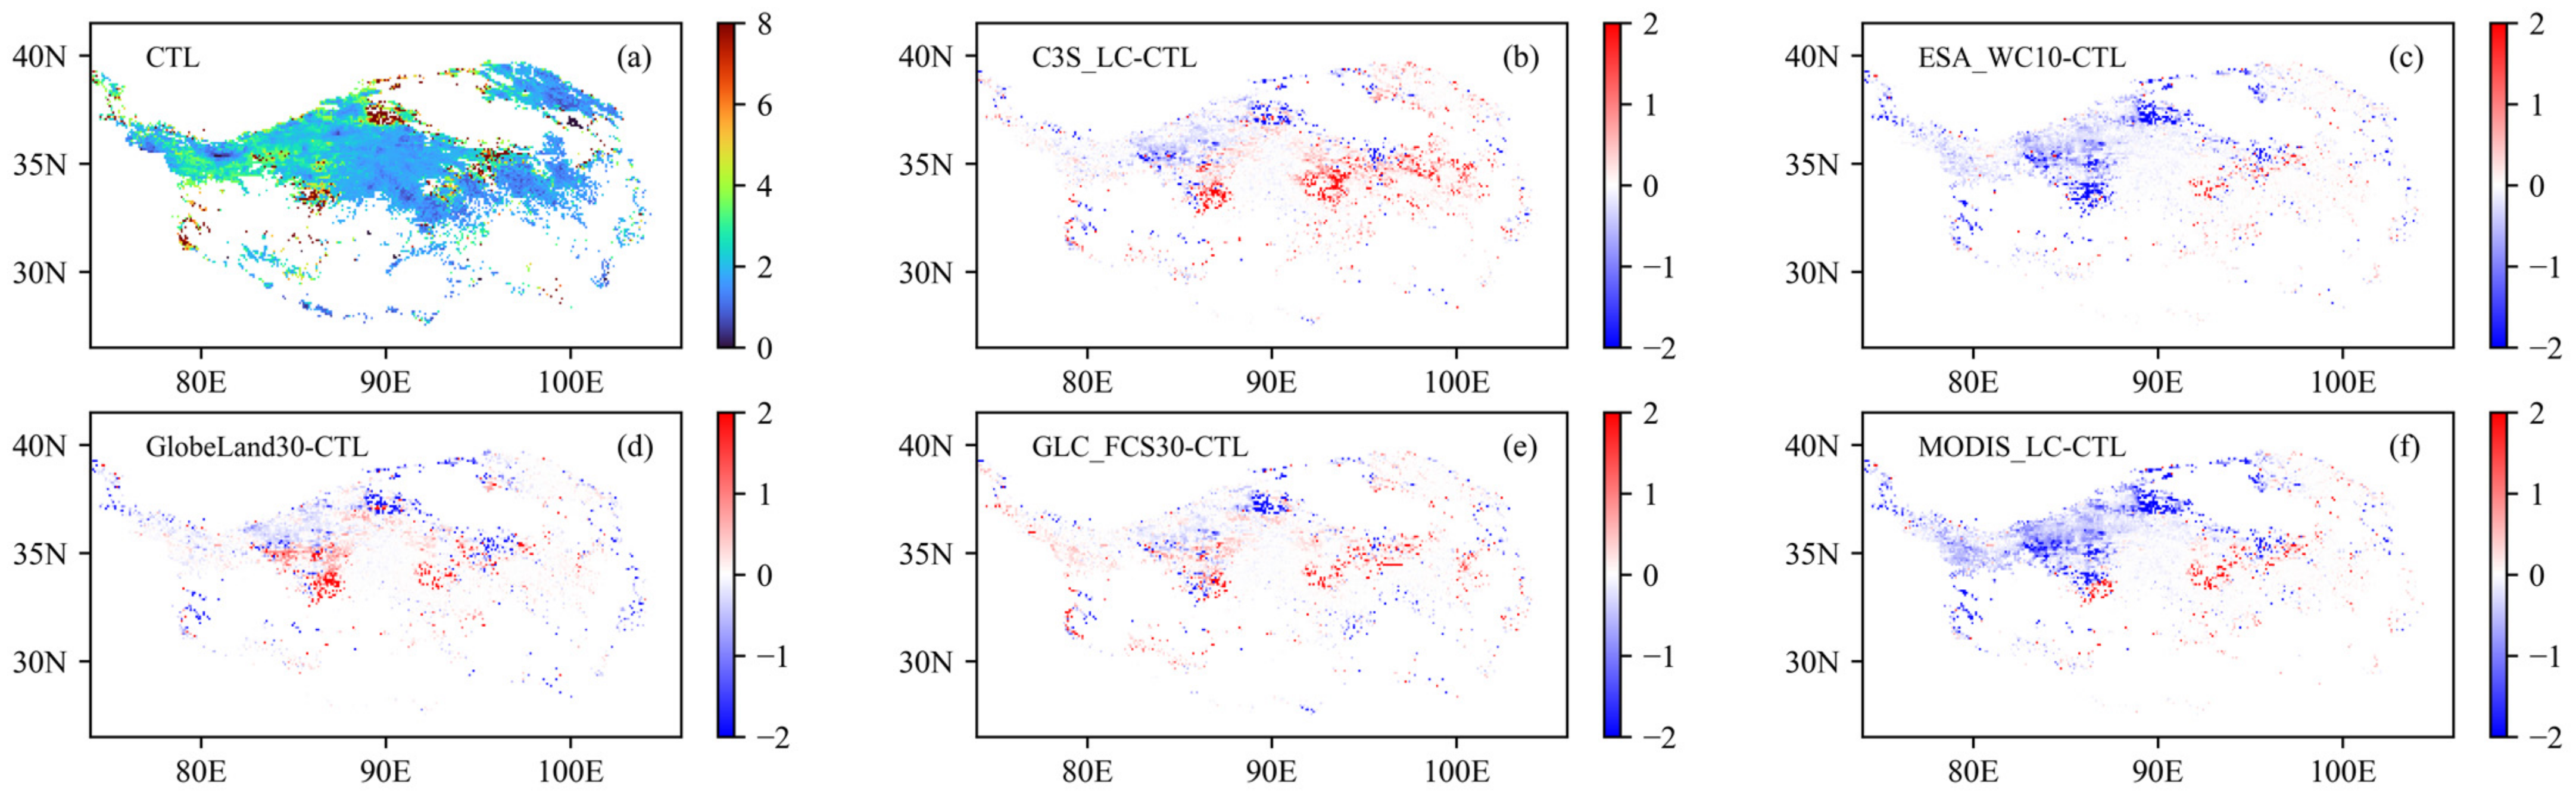
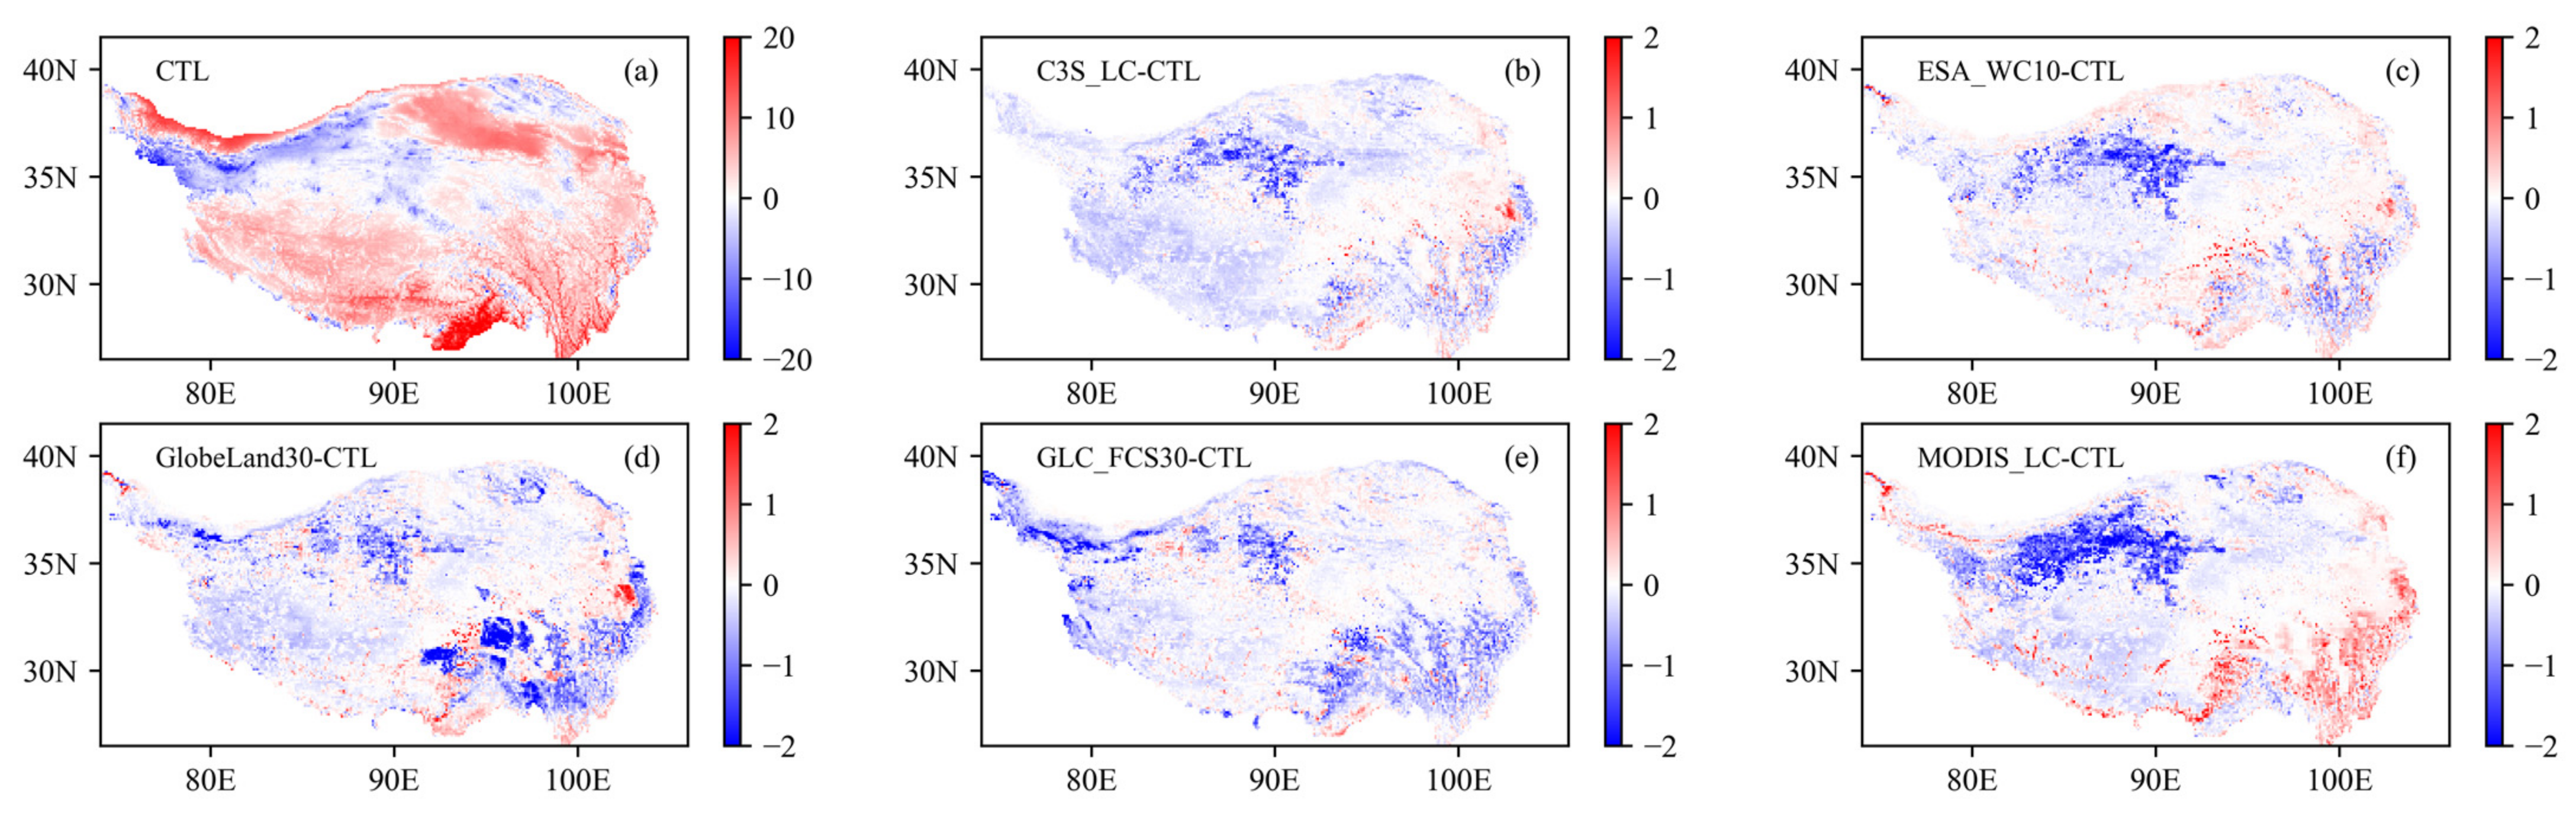
Differences in the simulated ALTs of the different LULC products are directly attributable to differences in ground and soil temperature simulations. Figure 9 shows the distribution of annual mean ground temperatures from the CTL and the differences in ground temperature between five LULC cases and the CTL. From Figure 9a, it can be seen that the ground temperature in the central and northwestern parts of the TP is below 0 °C, and in the southern part of the TP, it is above 0 °C. The difference in ground temperature between the CTL and the five LULC cases simulated results varies. This suggests that the different LULC products have a strong influence on the simulation of ground temperatures over the TP. Consistent with Figure 8c,f, Figure 9c,f shows that ESA_WC10 and MODIS_LC cases underestimate the soil temperature in the northwestern part of the TP compared to the CTL. EAS10 and MODIS_LC cases overestimate the ground temperature in the southeastern part of the TP, especially for MODIS_LC in Figure 9f. The ground temperature simulated by C3S_LC, GlobeLand30, and GLC-FCS30 cases is generally consistent or slightly higher in the central part of the TP compared to CTL. In addition, we notice that the ground temperatures modeled with the GlobeLand30 case are underestimated in the southern region. Figure 2d shows that GlobeLand30 identifies more snow cover in this region, and we believe that the underestimation here is due to the land cover being recognized as snow.
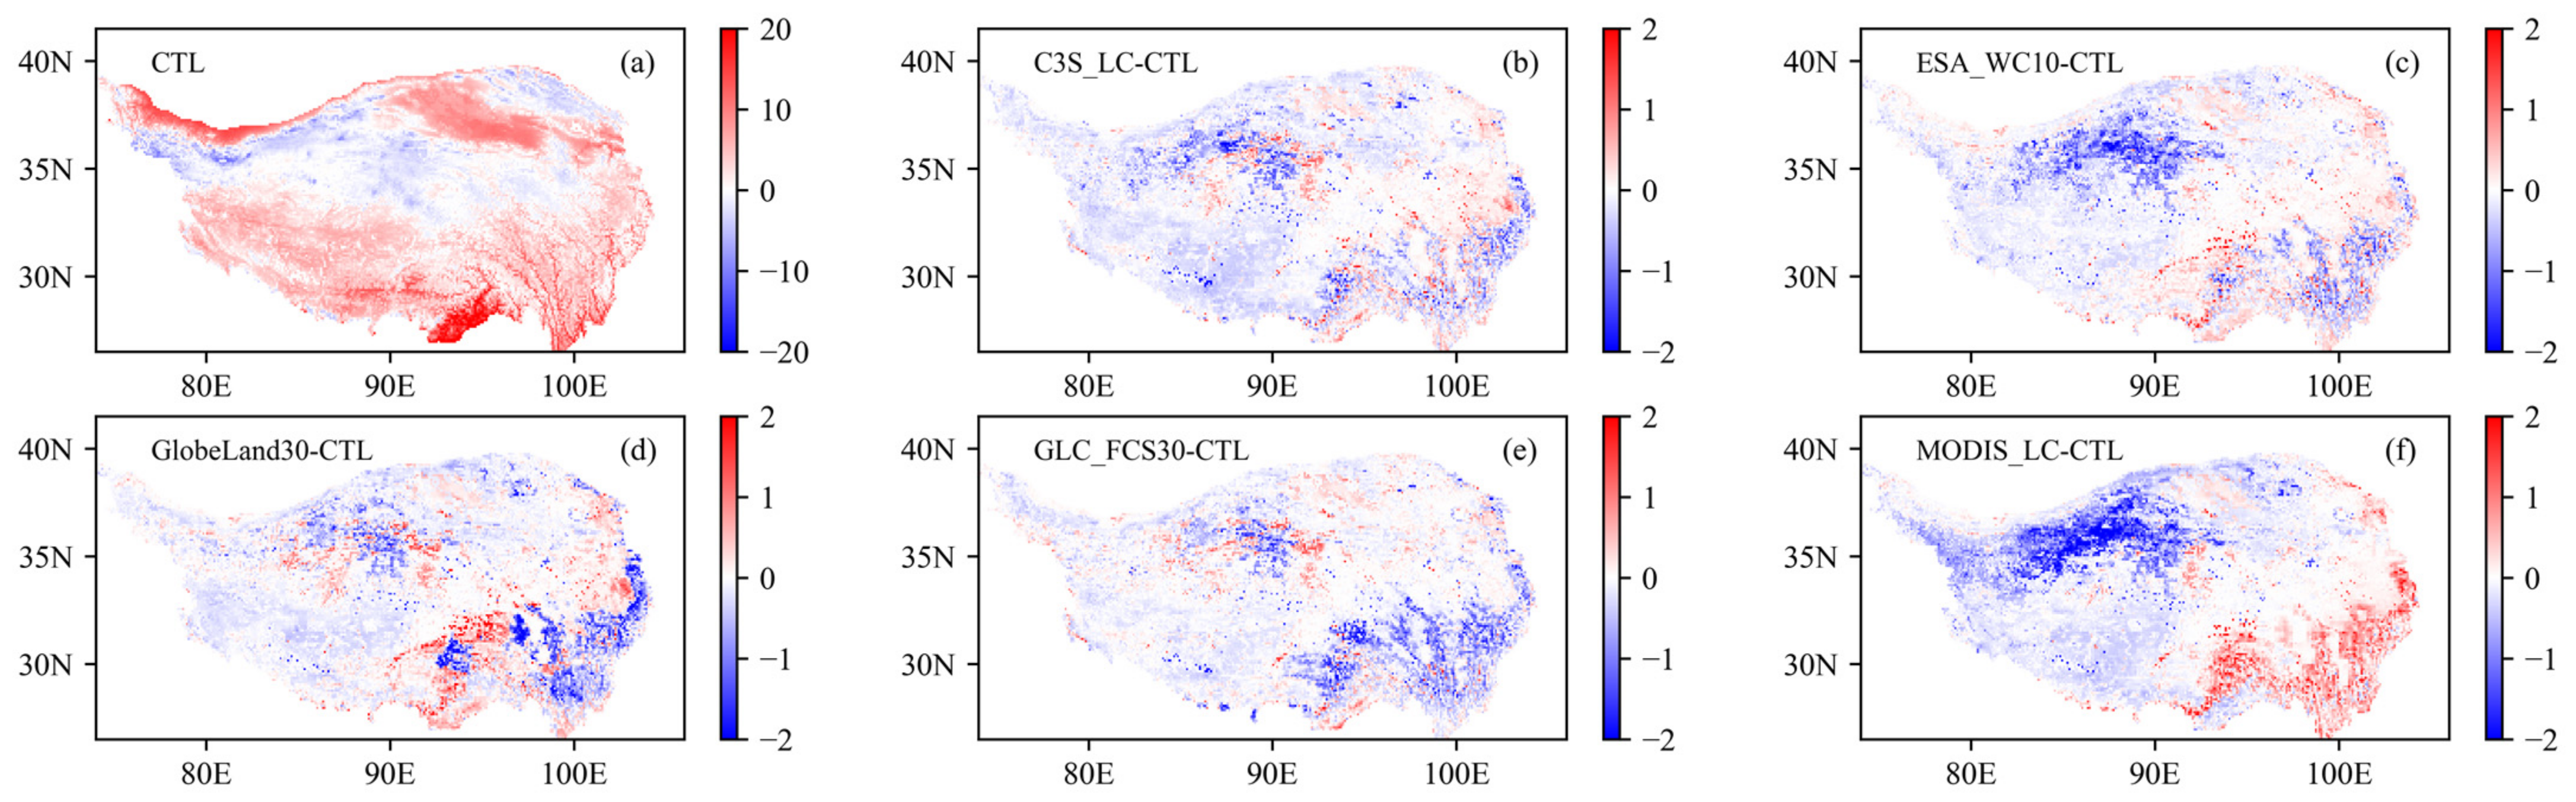
Figure 10 shows the distribution of annual mean soil temperatures at 3 m depth simulated with the CTL and the differences in soil temperature between five LULC cases and the CTL. It can be seen that the spatial distribution of 3 m soil temperatures in Figure 10 and ground temperatures in Figure 9 are basically consistent, except for GlobeLand30, for which there is a difference between Figure 9d and Figure 10d. The reason for this difference is the effect of the snow cover on the ground temperature and the deep soil temperature in the form of cooling and insulating effects, respectively. The cooling effect on shallow soils can be explained by the fact that the higher albedo of the snow cover reduces the net shortwave radiation and thus reduces the soil heat flux. The insulating effect on deep soils is mainly because soils radiate longwave radiation to the atmosphere in winter, and the presence of snow prevents soil from radiating longwave energy to the atmosphere, making deep soil warmer in snow-covered areas [51].
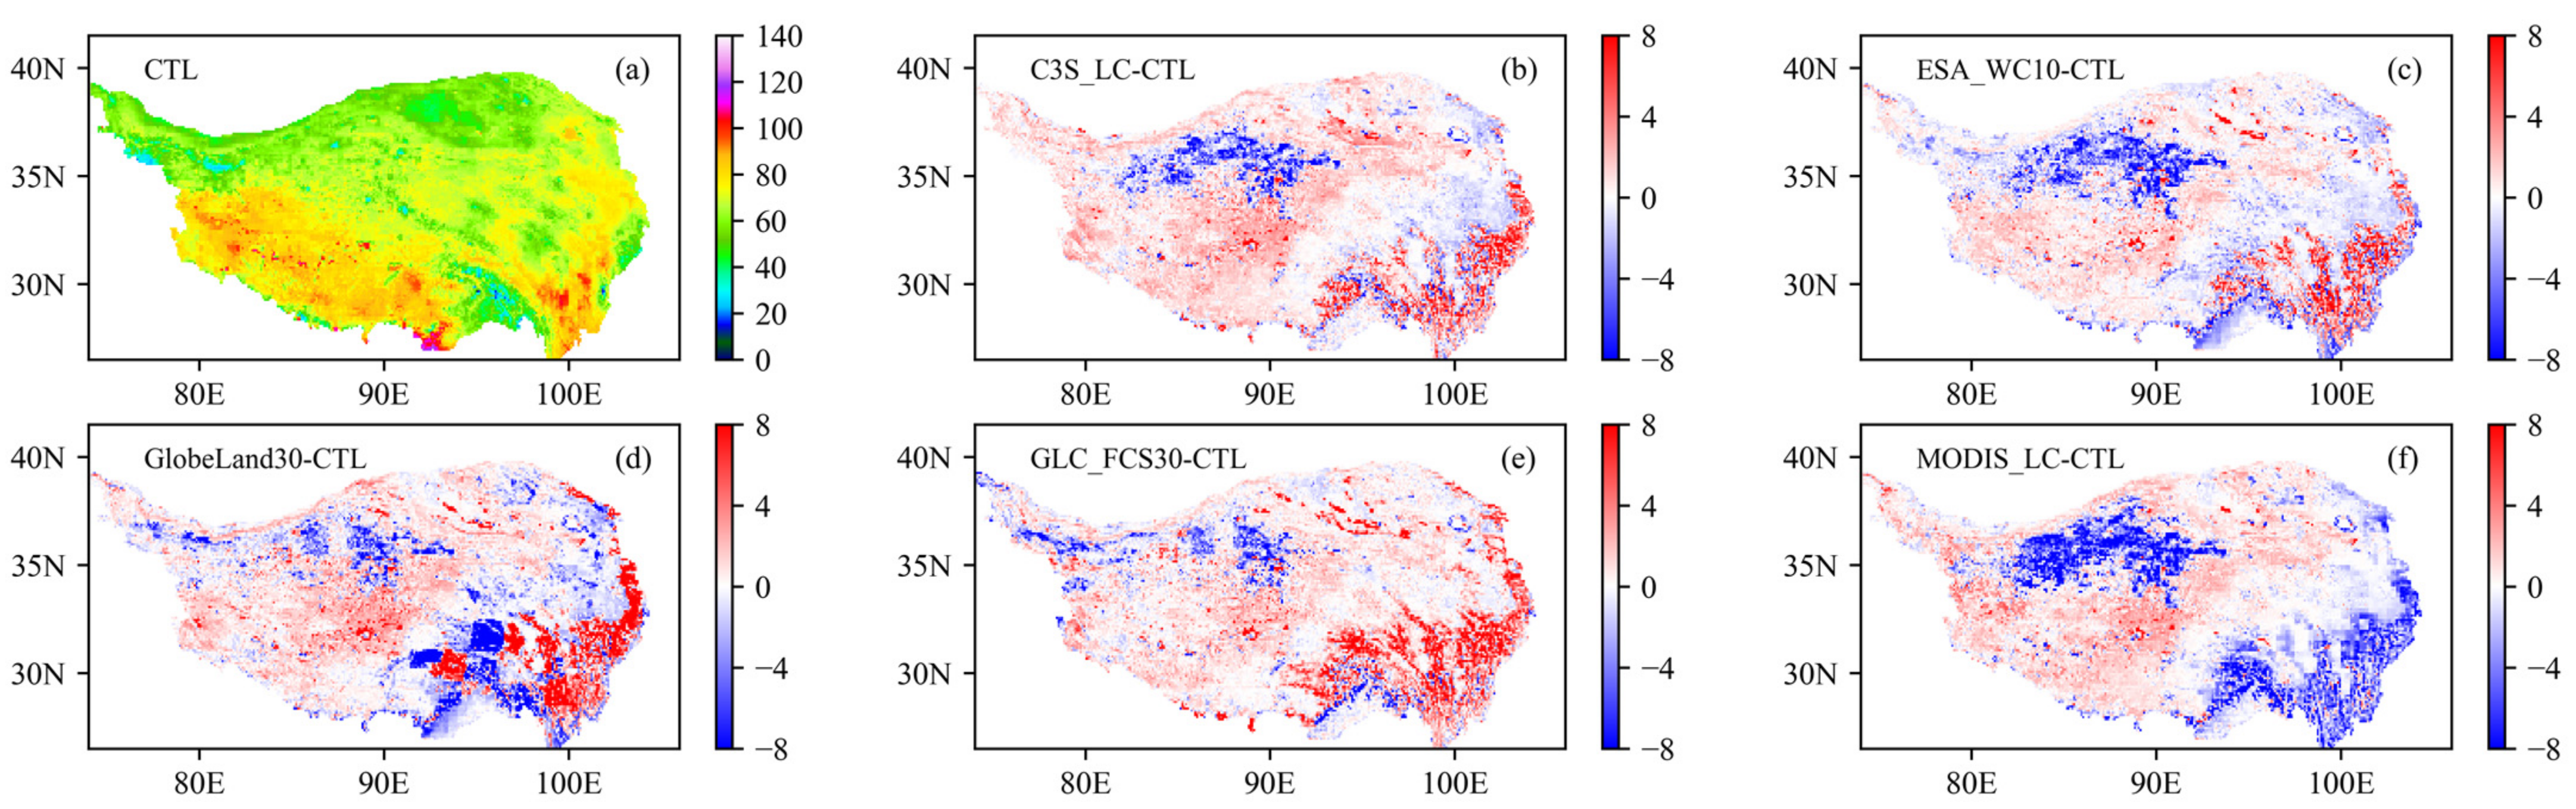
The spatial distributions of net radiation (Rnet) are shown in Figure 11. The regional average Rnet simulated by the CTL is 68 W/m2. Rnet is higher in the southwestern and southeastern parts of the TP and lower in most of the northern part of the TP. The differences in Rnet between the simulation from the CTL and the five LULC cases show substantial variations. The ESA_WC10 and MODIS_LC cases obviously underestimate the Rnet in the northwest of the TP compared to the CTL in Figure 11c,d. These underestimations are in good agreement with the ground and soil temperatures shown in Figure 9 and Figure 10. The GlobeLand30 LULC product identifies more snow cover in the Nyenchen Tanglha mountain, leading to a low Rnet in this region as well (Figure 11d), which is consistent with the underestimation of ground temperature in Figure 9d. The Rnet simulated with the C3S_LC and GLC-FCS30 cases is higher in most areas compared to the CTL simulations, especially in the southeastern part of the TP. It is also clearly demonstrated in Figure 11 that net radiation and soil temperature in the southeastern part of the TP show an opposite relationship. This is due to the fact that soil temperatures in vegetated areas, especially in forested areas, are not only affected by Rnet but also via evapotranspiration and shading. However, permafrost in this region is sporadic and was not the focus of our analysis, so we did not conduct any further analysis.
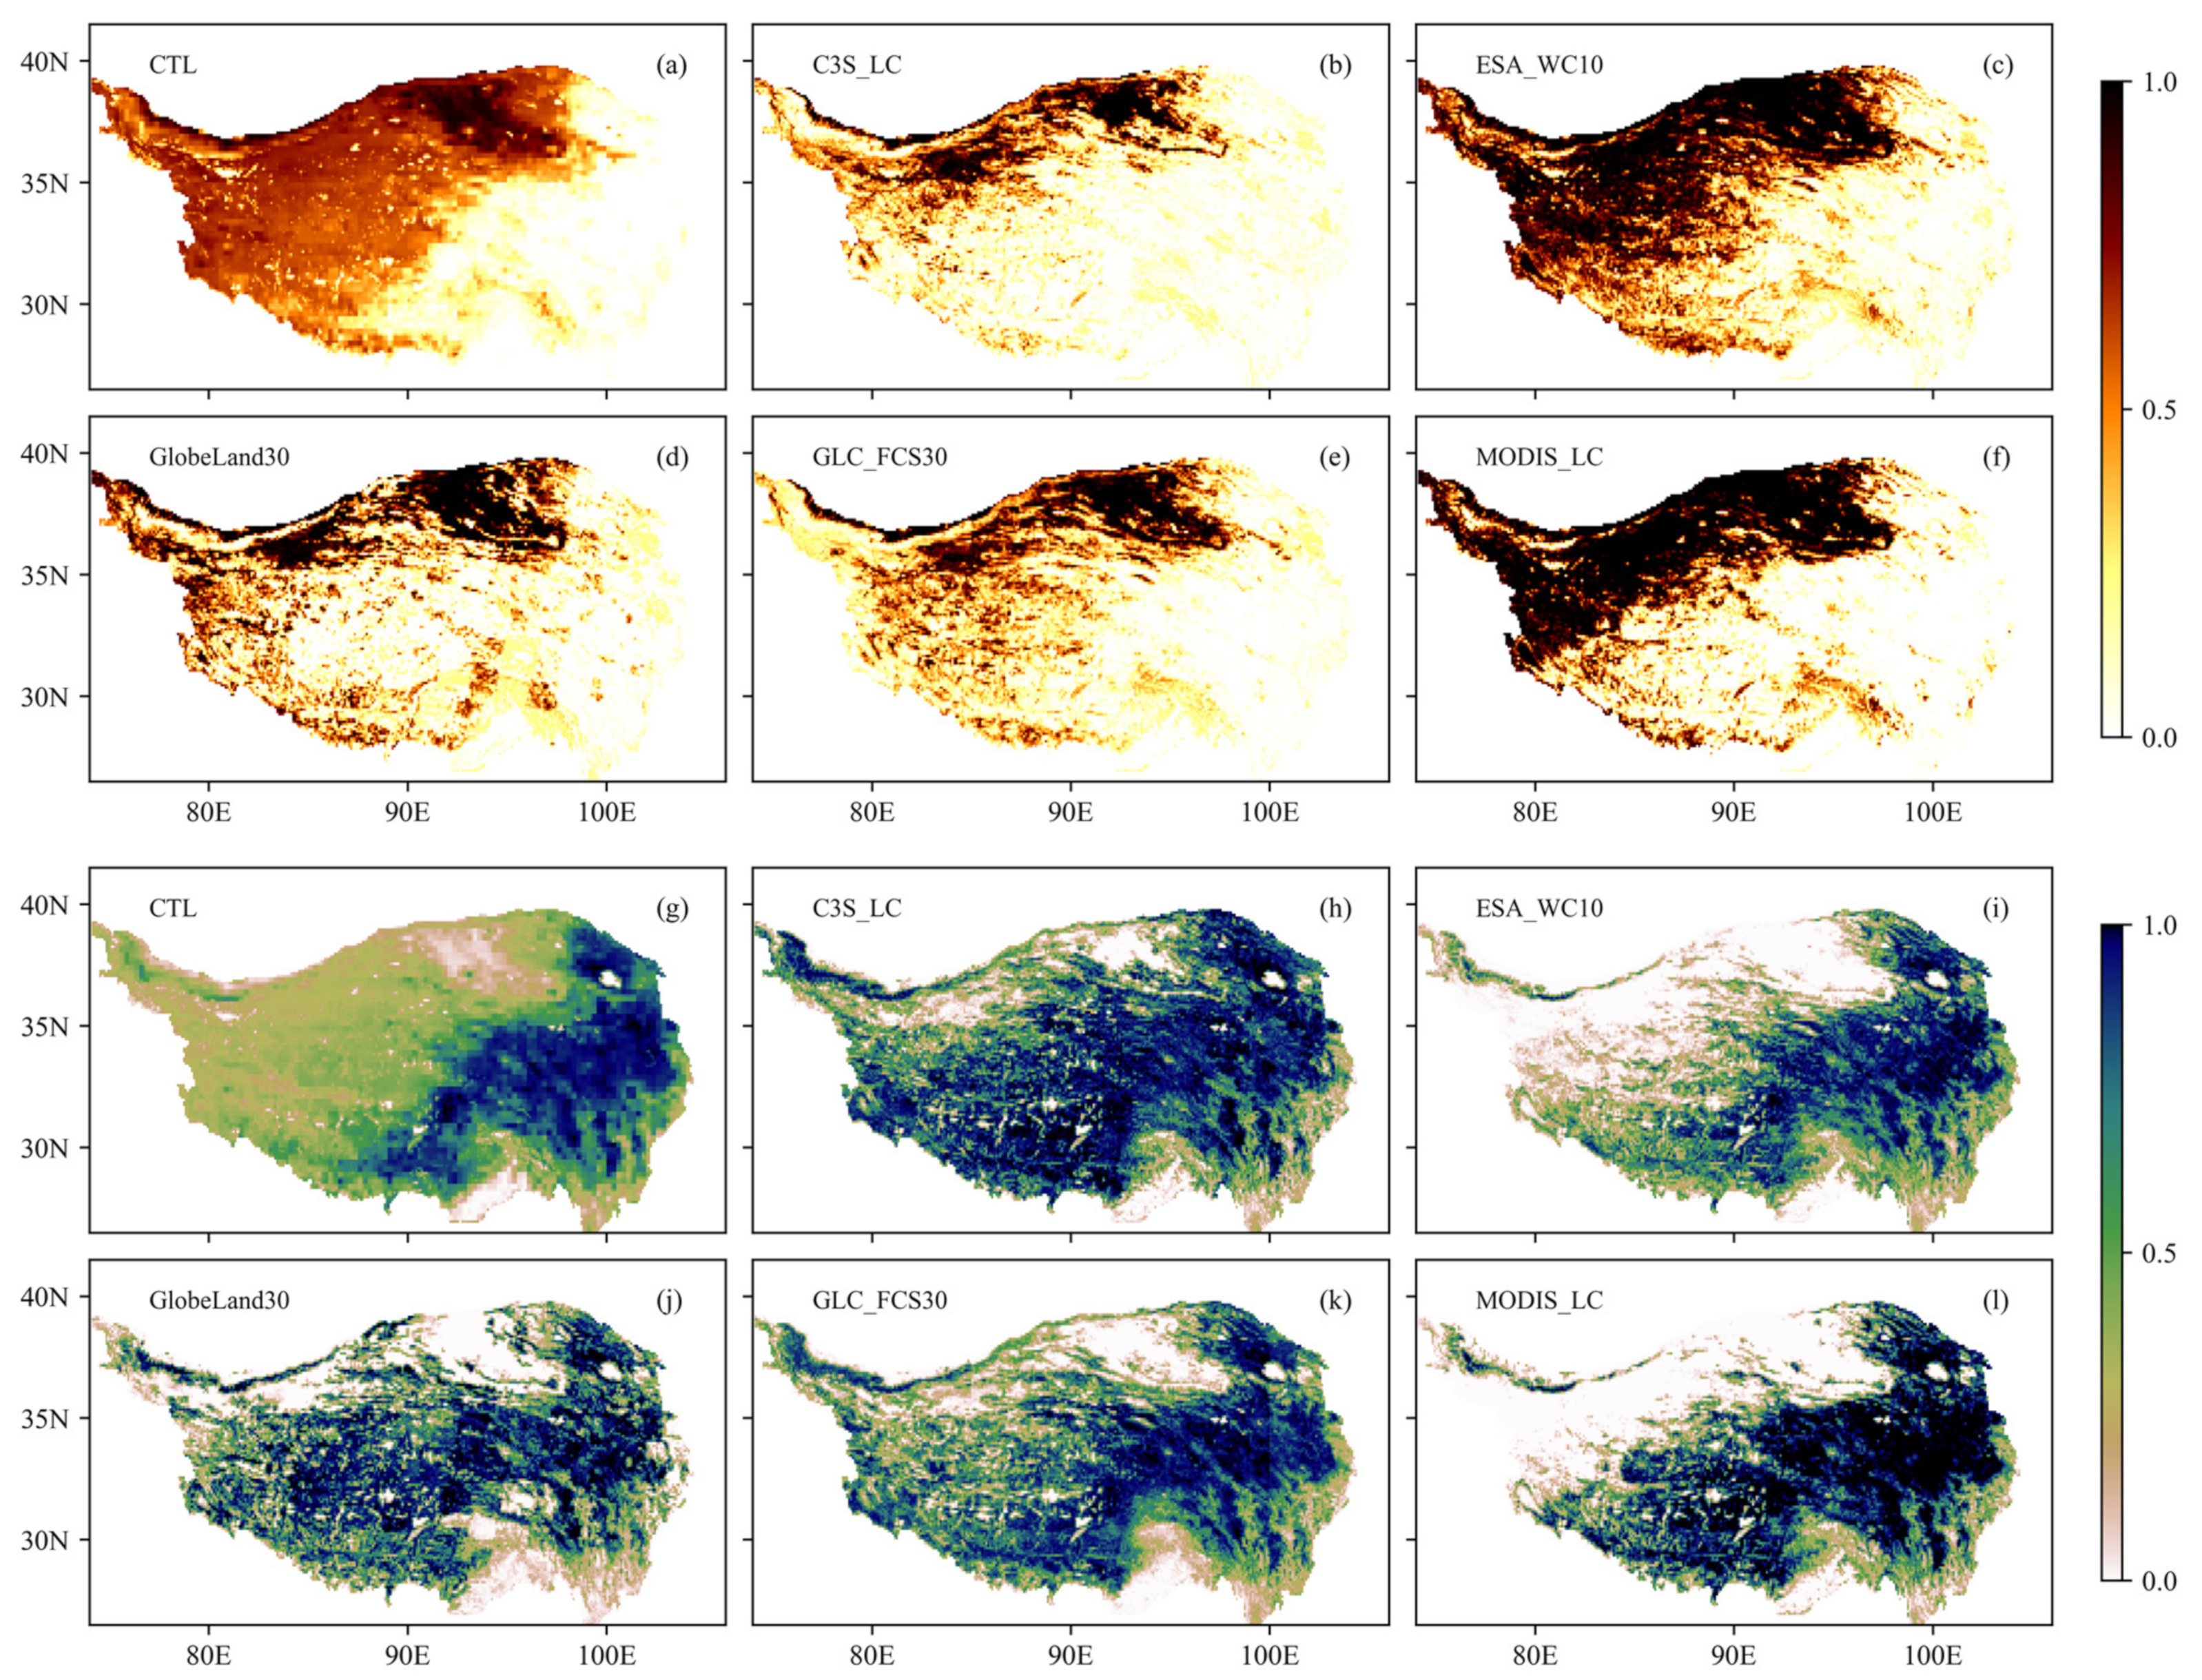
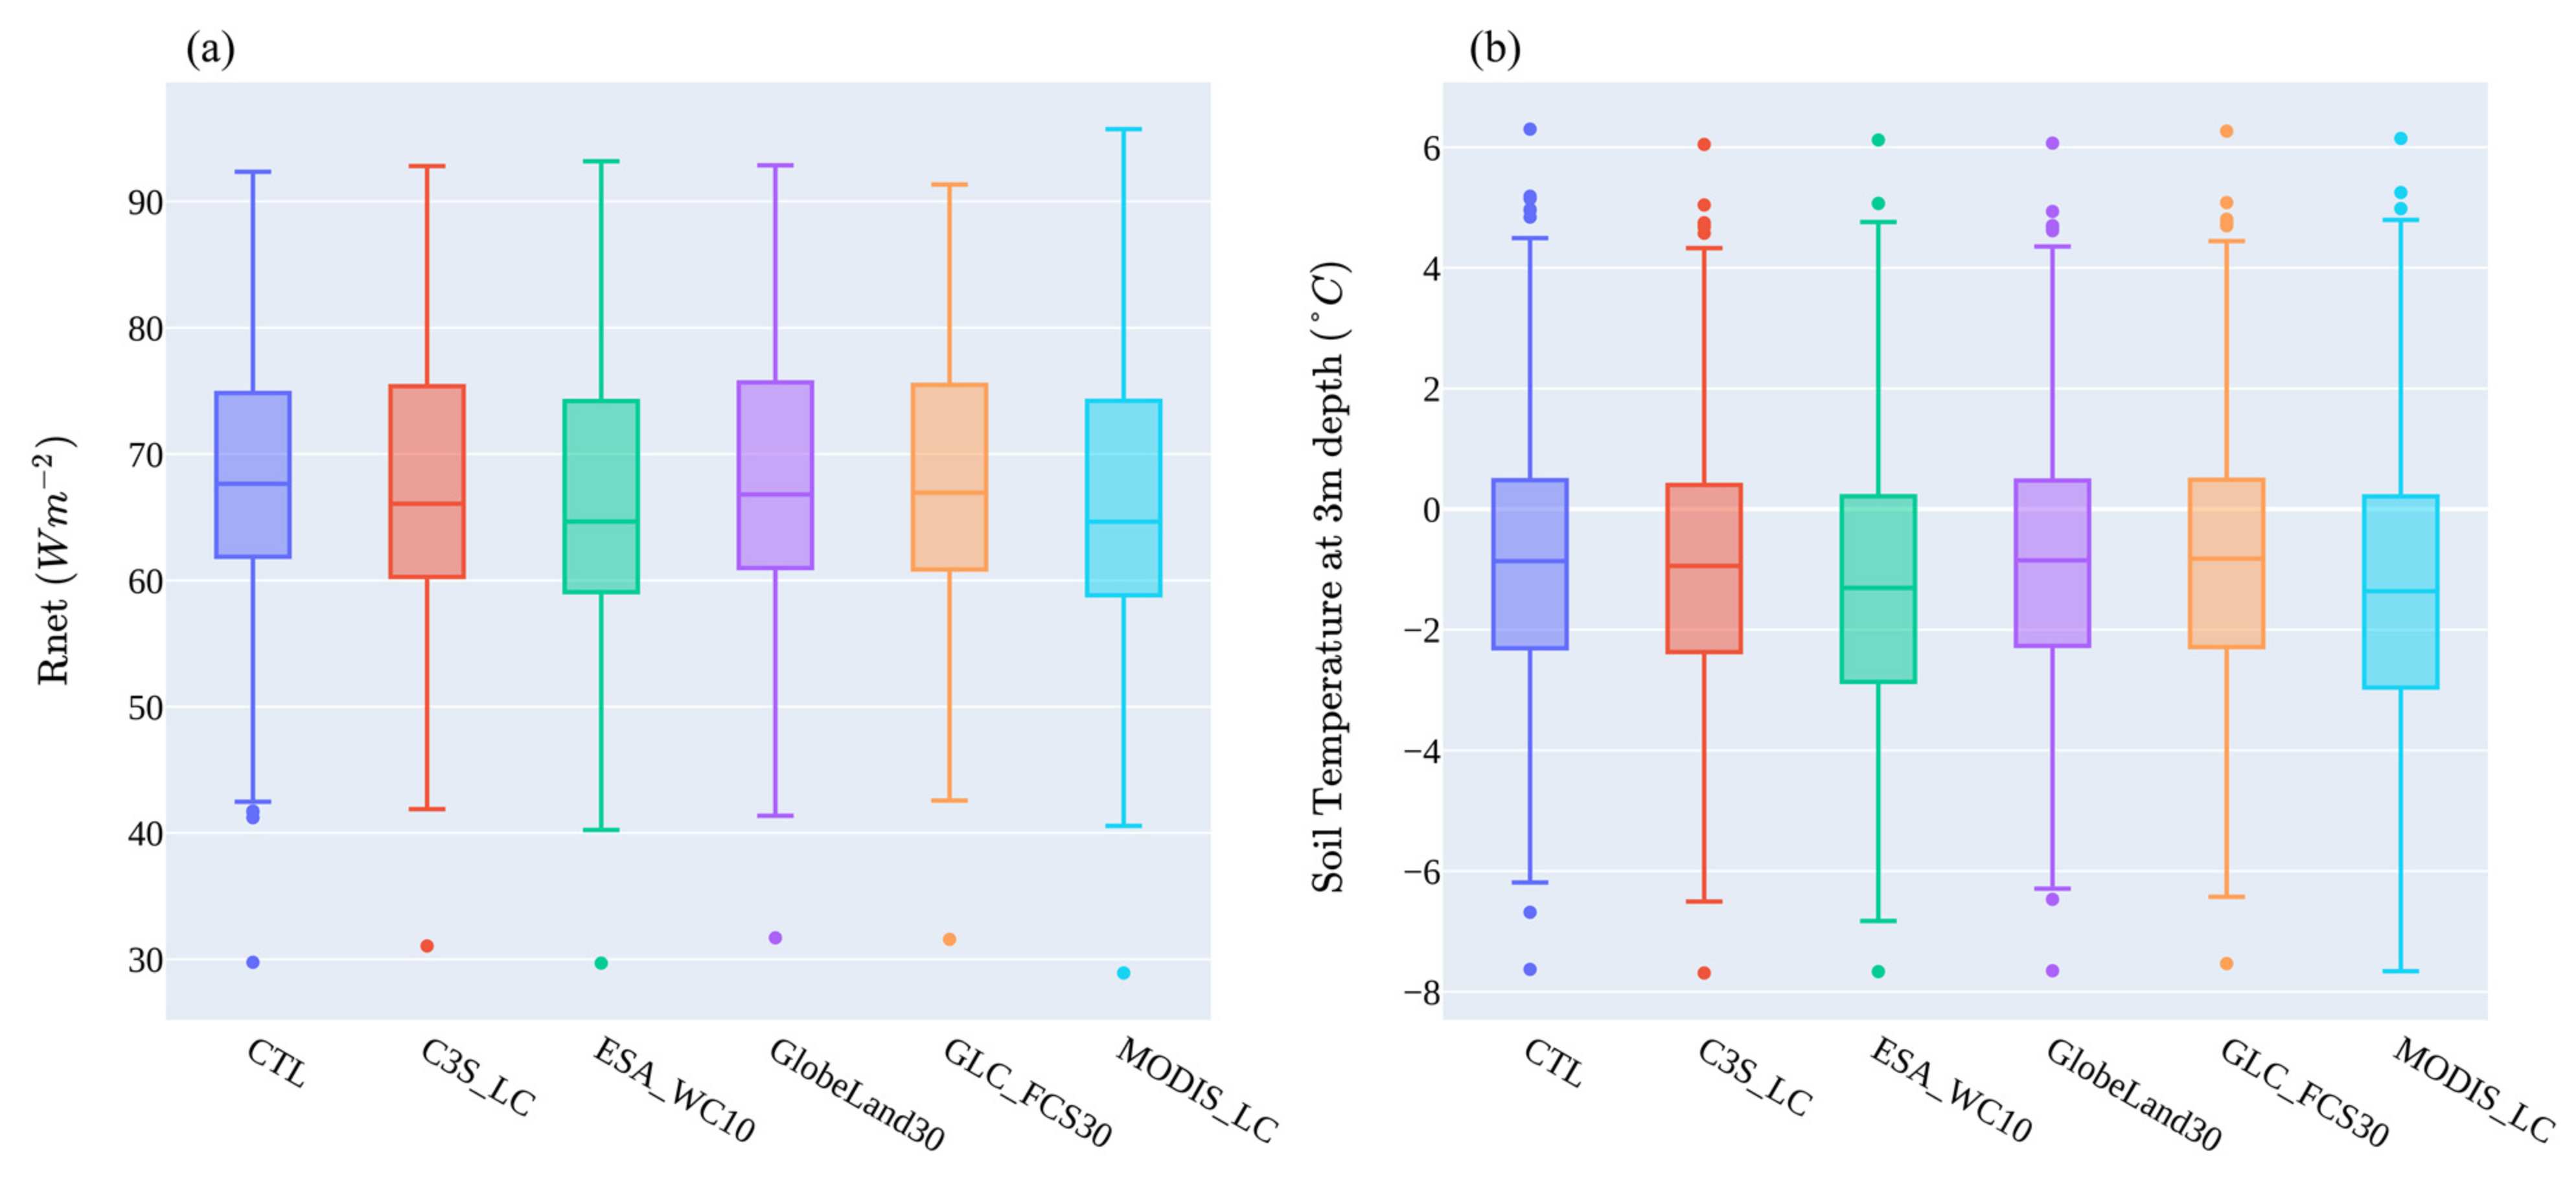
By comparing the differences in land cover type among the six LULC products in Figure 2, it is easy to see that the differences among the six datasets on the TP are mainly in the distribution of bare soil and grassland. Therefore, in the following, we mainly focus on the analysis of LULC difference areas to explore the impact of LULC differences on the simulation of surface energy and soil temperature. Bare soil and grassland are also the main LULC types in the permafrost region. Figure 12 shows the coverage of bare soil and grass on the TP for different LULC products. Although the different products consistently show that bare soil is predominantly located in the northwest of the TP, there are large differences in coverage and area between the six LULC products. ESA_WC10 and MODIS_LC show a high percentage of bare soil in the northwest of the TP. The CLM5 default LULC identified a large area but a lower percentage of bare soil in this region. C3S_LC, GlobeLand30, and GLC-FCS30 were generally consistent in identifying bare soil in this area, with the smallest area of bare soil identified. The six datasets showed the opposite situation for the distribution of grassland and bare soil in the northwestern part of the TP. ESA_WC10 and MODIS_LC have a low percentage of grassland, CLM5 default LULC has a medium percentage of grassland, and C3S_LC, GlobeLand30, and GLC-FCS30 have a high percentage of grassland. Therefore, we focused on the effect of differences in bare soil and grassland cover on soil temperature and permafrost simulations in the northwestern part of the TP. By extracting grid points in the region where the difference in land cover was distinct, we compared the difference in annual Rnet and soil temperature in Figure 13. The averaged Rnet values simulated with six cases ranging from 66.66 to 68.30 Wm−2. The averaged Rnet simulated from ESA_WC10 and MODIS_LC cases are 66.66 and 66.69, which are significantly lower than the simulations for the other products. There is a good agreement between the modeled soil temperatures and the net radiation. The simulated soil temperature averages from the ESA_WC10 and MODIS_LC cases are −1.12 °C and −1.20 °C, respectively, which are lower than those of the other cases.
4. Discussion
4.1. Uncertainty in Permafrost Simulation
In this study, we compared and analyzed the effects of different LULC products on permafrost simulation by introducing them into the CLM5, hoping to improve the accuracy of the land surface model on permafrost simulation. However, the accuracy of permafrost simulation results is affected by not only land use but also atmospheric forcing data, soil texture, and the model parameterization scheme. In this study, we used the CMFD, which was developed by fusing ground-based observations with datasets from multiple sources, such as remote sensing and reanalysis [38], to drive CLM5 to simulate the extent of permafrost over the TP. Some studies have shown that the CMFD still has uncertainties in certain regions where observations are sparse, such as on the TP. Guo and Wang compared CMFD air temperatures with observations from TP and found that CMFD air temperatures are 1.3 °C lower than observations [52]. Peng et al. [53] also reported an average air temperature bias of −1.72 °C for the CMFD data compared to the observation. The warming rate of CMFD air temperatures from 1981 to 2007 is slower than that of meteorological station observations [52].
The simulation results of soil temperature and moisture are largely affected by soil texture and soil organic matter. CDSP-LSM is widely used and recognized as high-resolution soil property data for the simulation of land surface processes in the TP. In this study, we used this data to update the CLM5 default soil texture and soil organic matter. However, soil texture uncertainty is still an important source of simulation error in our model because of the limited soil sample data on which this dataset is based, especially the deep soil texture data, which still has large uncertainties. In addition, the soils on the TP contain a large amount of gravel. However, the model used in this study does not include gravel, an important soil texture, and its associated parameters. Pan et al. [54] found that gravel increases porosity, which could reduce thermal conductivity values in the soil.
Although the CLM5 has been updated and developed several times and is widely used, there are still some uncertainties in some parameterization schemes related to soil hydrological and thermal processes in the simulation. For example, Ma et al. [55] evaluated the simulation performance of the CLM5 on the TP using soil temperature and moisture as well as energy flux observations, and they found that the default roughness scheme and dry surface layer scheme in the CLM5 produce a large error in the simulation of surface energy flux and soil temperature. Several other studies of thermal conductivity evaluations have shown that the CLM5 default thermal conductivity scheme provides inaccurate predictions and significantly overestimates thermal conductivity for some local soil samples [56,57]. Yang et al. [49] evaluated the model default thermal conductivity scheme using site measurements and found that the performance of the CLM5 default scheme varied widely in modeling soil temperature simulations at different observation sites. Therefore, uncertainties in the data and model schemes used in this study will inevitably affect the simulation results to varying degrees.
4.2. Disparities between LULC Products and PFTs
This study found that although the TP is considered to have a low heterogeneity of land use types and is dominated by grasslands, there is some disagreement between the different land use products. The disagreement in LULC products is mainly in the grassland-bare soil transition zone in the west-central part of the TP and in the complex terrain region in the southeastern region. This result is consistent with the results of [58], who assessed the spatial consistency of four LULC products on the TP. Our study found that this disagreement in data products can have a non-negligible impact on the results of permafrost simulation, especially the ALT. A number of other studies have also demonstrated the impact of LULC on the simulation accuracy of land surface models and regional climate models, as they directly affect the radiative properties of the land surface, roughness length, albedo, emissivity, and regulate the exchange of energy, moisture, and momentum between the atmosphere and land surface [24,30,59]. Therefore, to obtain accurate simulation results, it is necessary to carefully select reasonable land use data and update the land use data in the model in a timely manner.
In addition, the difference between the LULC data classification and the model PFT classification makes it possible to cause some errors in the process of converting the different classification systems. Mixed forests, for example, which occur in MODIS_LC products, are difficult to correspond directly to specific PFT classifications due to the limited PFTs used in CLM5. Although the model allows us to use mosaics to describe the sub-grid information of land use, the simple way of calculating the weights according to the proportion is also difficult to describe the mixed growth of vegetation in the real world. In addition, grasslands on the TP can be subdivided into two vegetation types, alpine steppe and alpine meadow, which differ in their influence on surface thermal and hydrological processes [60,61]. However, there is only one alpine grass type, arctic grass, in the model, which may cause errors in the permafrost simulation results. Therefore, increasing the number of PFTs in CLM5 and optimizing the model’s description of multiple vegetation types, especially alpine vegetation types, is the key to improving the model’s simulation of permafrost on the TP.
5. Conclusions
In this study, we evaluated the consistency of five LULC products on the TP and introduced these five products into the CLM5 model to assess their impact on permafrost simulation. The consistency analyses show that these LULC products are able to properly characterize the distribution of land-cover types on the TP, i.e., the main surface types are bare soil and grassland, with a few glaciers, lakes, shrubs, and forests. However, the consistency of the LULC products was lower at the interface of bare soil and grassland and in the southeastern region with complex topography. Evaluation of the model simulation shows that CLM5 can accurately simulate the shallow soil temperature variation. In addition, the simulation can also well represent the characteristics of the observed permafrost extent distribution and the borehole soil temperature profiles.
A comparison of the simulation cases with different land use products shows that the effect of the different land use products on the permafrost extent is slight, while the effect on the borehole temperature profile and the depth of the active layer is more pronounced. The most pronounced effect is in the northwestern part of the TP, at the junction of bare soil and grassland, where the difference in surface cover type significantly affects the net surface radiation, which in turn affects the results of the soil temperature simulation. In addition, we also discuss other factors affecting the results of permafrost simulation and suggest that the careful use of land use products and increasing the classification of vegetation types in the model will help to improve the model’s simulation performance for permafrost. The results of this study will motivate the level of application of land surface modeling on the TP.
Author Contributions
Conceptualization, Y.P. and S.L.; methodology, Y.P.; software, Y.P.; validation, Y.P., D.W. and X.L.; investigation, Y.P., X.L., D.W., S.L. and L.W.; data curation, Y.P., D.W. and X.L.; writing—original draft preparation, Y.P.; writing—review and editing, Y.P., X.L., S.L. and L.W.; visualization, Y.P. All authors have read and agreed to the published version of the manuscript.
Funding
This research was jointly supported by the National Natural Science Foundation of China (42275092, 42075090, and 42275096).
Data Availability Statement
MODIS_LC MCD12Q1 is from National Aeronautics and Space Administration (NASA) (https://ladsweb.modaps.eosdis.nasa.gov, accessed on 8 January 2023); C3S-LC is from European Space Agency (ESA) (https://www.esa-landcover-cci.org/, accessed on 2 January 2023); GlobeLand30 is from National Geomatics Center of China (NGCC) (http://www.globallandcover.com, accessed on 20 January 2023); GLC_FCS30 is from Aerospace Information Research Institute, Chinese Academy of Sciences (AIR, CAS) (https://data.casearth.cn/sdo/detail/5fbc7904819aec1ea2dd7061, accessed on 25 January 2023); ESA World Cover 2020 (ESA2020) is from European Space Agency (ESA) (https://esa-worldcover.org/en, accessed on 16 January 2023); and the China Meteorological Forcing Dataset is from the National Tibetan Plateau Data Center (https://data.tpdc.ac.cn/en/data/8028b944-daaa-4511-8769-965612652c49, accessed on 1 January 2023). A China dataset of soil properties for land surface modeling is also from the National Tibetan Plateau Data Center (https://data.tpdc.ac.cn/en/data/8ba0a731-5b0b-4e2f-8b95-8b29cc3c0f3a/, accessed on 1 January 2023).
Acknowledgments
We acknowledge the National Tibetan Plateau Data Center for providing the China Meteorological Forcing Dataset, a Chinese dataset of soil properties for land surface modeling, and time-lapse observation dataset of soil temperature and humidity on the Tibetan Plateau (2008–2016). We also thanks the anonymous reviewers and editors for their comments to improve this paper.
Conflicts of Interest
The authors declare no conflict of interest.
References
- Zhao, L.; Zou, D.; Hu, G.; Du, E.; Pang, Q.; Xiao, Y.; Li, R.; Sheng, Y.; Wu, X.; Sun, Z.; et al. Changing Climate and the Permafrost Environment on the Qinghai–Tibet (Xizang) Plateau. Permafr. Periglac. Process. 2020, 31, 396–405. [Google Scholar] [CrossRef]
- Miner, K.R.; D’Andrilli, J.; Mackelprang, R.; Edwards, A.; Malaska, M.J.; Waldrop, M.P.; Miller, C.E. Emergent Biogeochemical Risks from Arctic Permafrost Degradation. Nat. Clim. Chang. 2021, 11, 809–819. [Google Scholar] [CrossRef]
- Jin, X.; Jin, H.; Luo, D.; Sheng, Y.; Wu, Q.; Wu, J.; Wang, W.; Huang, S.; Li, X.; Liang, S.; et al. Impacts of Permafrost Degradation on Hydrology and Vegetation in the Source Area of the Yellow River on Northeastern Qinghai-Tibet Plateau, Southwest China. Front. Earth Sci. 2022, 10, 845824. [Google Scholar] [CrossRef]
- Schneider Von Deimling, T.; Lee, H.; Ingeman-Nielsen, T.; Westermann, S.; Romanovsky, V.; Lamoureux, S.; Walker, D.A.; Chadburn, S.; Trochim, E.; Cai, L.; et al. Consequences of Permafrost Degradation for Arctic Infrastructure—Bridging the Model Gap between Regional and Engineering Scales. Cryosphere 2021, 15, 2451–2471. [Google Scholar] [CrossRef]
- Zhang, G.; Nan, Z.; Hu, N.; Yin, Z.; Zhao, L.; Cheng, G.; Mu, C. Qinghai-Tibet Plateau Permafrost at Risk in the Late 21st Century. Earth’s Future 2022, 10, e2022EF002652. [Google Scholar] [CrossRef]
- Li, W.; Weng, B.; Yan, D.; Lai, Y.; Li, M.; Wang, H. Underestimated Permafrost Degradation: Improving the TTOP Model Based on Soil Thermal Conductivity. Sci. Total Environ. 2023, 854, 158564. [Google Scholar] [CrossRef] [PubMed]
- Wang, T.; Shi, Y.; Guo, D. Frozen Ground Map of China Based on a Map of the Glaciers, Frozen Ground and Deserts in China (1981–2006); A Big Earth Data Platform Three Poles: Lanzhou, China, 2012. [Google Scholar]
- Zou, D.; Zhao, L.; Sheng, Y.; Chen, J.; Hu, G.; Wu, T.; Wu, J.; Xie, C.; Wu, X.; Pang, Q.; et al. A New Map of the Permafrost Distribution on the Tibetan Plateau. Cryosph. Discuss. 2016, 1–28. [Google Scholar] [CrossRef]
- Guo, D.; Wang, H. Simulated Historical (1901–2010) Changes in the Permafrost Extent and Active Layer Thickness in the Northern Hemisphere. J. Geophys. Res. Atmos. 2017, 122, 12285–12295. [Google Scholar] [CrossRef]
- Slater, A.G.; Lawrence, D.M. Diagnosing Present and Future Permafrost from Climate Models. J. Clim. 2013, 26, 5608–5623. [Google Scholar] [CrossRef]
- Heijmans, M.M.P.D.; Magnússon, R.; Lara, M.J.; Frost, G.V.; Myers-Smith, I.H.; van Huissteden, J.; Jorgenson, M.T.; Fedorov, A.N.; Epstein, H.E.; Lawrence, D.M.; et al. Tundra Vegetation Change and Impacts on Permafrost. Nat. Rev. Earth Environ. 2022, 3, 68–84. [Google Scholar] [CrossRef]
- Gao, Z.; Lin, Z.; Niu, F.; Luo, J. Soil Water Dynamics in the Active Layers under Different Land-Cover Types in the Permafrost Regions of the Qinghai–Tibet Plateau, China. Geoderma 2020, 364, 114176. [Google Scholar] [CrossRef]
- Oehri, J.; Schaepman-Strub, G.; Kim, J.S.; Grysko, R.; Kropp, H.; Grünberg, I.; Zemlianskii, V.; Sonnentag, O.; Euskirchen, E.S.; Reji Chacko, M.; et al. Vegetation Type Is an Important Predictor of the Arctic Summer Land Surface Energy Budget. Nat. Commun. 2022, 13, 6379. [Google Scholar] [CrossRef] [PubMed]
- Grünberg, I.; Wilcox, E.J.; Zwieback, S.; Marsh, P.; Boike, J. Linking Tundra Vegetation, Snow, Soil Temperature, and Permafrost. Biogeosciences 2020, 17, 4261–4279. [Google Scholar] [CrossRef]
- Lawrence, D.M.; Fisher, R.A.; Koven, C.D.; Oleson, K.W.; Swenson, S.C.; Bonan, G.; Collier, N.; Ghimire, B.; van Kampenhout, L.; Kennedy, D.; et al. The Community Land Model Version 5: Description of New Features, Benchmarking, and Impact of Forcing Uncertainty. J. Adv. Model. Earth Syst. 2019, 11, 4245–4287. [Google Scholar] [CrossRef]
- Yi, S.; Woo, M.K.; Arain, M.A. Impacts of Peat and Vegetation on Permafrost Degradation under Climate Warming. Geophys. Res. Lett. 2007, 34, 1–5. [Google Scholar] [CrossRef]
- Liu, Z.; Chen, B.; Wang, S.; Wang, Q.; Chen, J.; Shi, W.; Wang, X.; Liu, Y.; Tu, Y.; Huang, M.; et al. The Impacts of Vegetation on the Soil Surface Freezing-Thawing Processes at Permafrost Southern Edge Simulated by an Improved Process-Based Ecosystem Model. Ecol. Modell. 2021, 456, 109663. [Google Scholar] [CrossRef]
- Wang, Z.; Kim, Y.; Seo, H.; Um, M.J.; Mao, J. Permafrost Response to Vegetation Greenness Variation in the Arctic Tundra through Positive Feedback in Surface Air Temperature and Snow Cover. Environ. Res. Lett. 2019, 14, 044024. [Google Scholar] [CrossRef]
- Friedl, M.A.; Sulla-Menashe, D.; Tan, B.; Schneider, A.; Ramankutty, N.; Sibley, A.; Huang, X. MODIS Collection 5 Global Land Cover: Algorithm Refinements and Characterization of New Datasets. Remote Sens. Environ. 2010, 114, 168–182. [Google Scholar] [CrossRef]
- Buontempo, C.; Hutjes, R.; Beavis, P.; Berckmans, J.; Cagnazzo, C.; Vamborg, F.; Thépaut, J.N.; Bergeron, C.; Almond, S.; Amici, A.; et al. Fostering the Development of Climate Services through Copernicus Climate Change Service (C3S) for Agriculture Applications. Weather Clim. Extrem. 2020, 27, 100226. [Google Scholar] [CrossRef]
- Chen, J.J.; Chen, J.J.; Liao, A.; Cao, X.; Chen, L.; Chen, X.; He, C.; Han, G.; Peng, S.; Lu, M.; et al. Global Land Cover Mapping at 30 m Resolution: A POK-Based Operational Approach. ISPRS J. Photogramm. Remote Sens. 2015, 103, 7–27. [Google Scholar] [CrossRef]
- Zhang, X.; Liu, L.; Chen, X.; Gao, Y.; Xie, S.; Mi, J. GLC_FCS30: Global Land-Cover Product with Fine Classification System at 30 m Using Time-Series Landsat Imagery. Earth Syst. Sci. Data 2021, 13, 2753–2776. [Google Scholar] [CrossRef]
- Zanaga, D.; Van De Kerchove, R.; Daems, D.; De Keersmaecker, W.; Brockmann, C.; Kirches, G.; Wevers, J.; Cartus, O.; Santoro, M.; Fritz, S.; et al. ESA WorldCover 10 m 2021 V200. Meteosat Second Generation Evapotranspiration. 2022; Zenodo, 28 October 2022. Available online: https://zenodo.org/records/7254221 (accessed on 22 October 2023).
- Jiménez-Esteve, B.; Udina, M.; Soler, M.R.; Pepin, N.; Miró, J.R. Land Use and Topography Influence in a Complex Terrain Area: A High Resolution Mesoscale Modelling Study over the Eastern Pyrenees Using the WRF Model. Atmos. Res. 2018, 202, 49–62. [Google Scholar] [CrossRef]
- Sertel, E.; Robock, A.; Ormeci, C. Impacts of Land Cover Data Quality on Regional Climate Simulations. Int. J. Climatol. 2010. [Google Scholar] [CrossRef]
- Bai, Y.; Feng, M.; Jiang, H.; Wang, J.; Zhu, Y.; Liu, Y. Assessing Consistency of Five Global Land Cover Data Sets in China. Remote Sens. 2014, 6, 8739–8759. [Google Scholar] [CrossRef]
- Pérez-Hoyos, A.; Rembold, F.; Kerdiles, H.; Gallego, J. Comparison of Global Land Cover Datasets for Cropland Monitoring. Remote Sens. 2017, 9, 1118. [Google Scholar] [CrossRef]
- Wu, W.; Shibasaki, R.; Yang, P.; Ongaro, L.; Zhou, Q.; Tang, H. Validation and Comparison of 1 Km Global Land Cover Products in China. Int. J. Remote Sens. 2008, 29, 3769–3785. [Google Scholar] [CrossRef]
- Yang, Y.; Xiao, P.; Feng, X.; Li, H. Accuracy Assessment of Seven Global Land Cover Datasets over China. ISPRS J. Photogramm. Remote Sens. 2017, 125, 156–173. [Google Scholar] [CrossRef]
- Pan, Y.; Gao, Y.; Li, S. Impacts of Land Use/Land Cover Distributions and Vegetation Amount on Land Surface Temperature Simulation in East China. Earth Space Sci. 2021, 8, e2020EA001544. [Google Scholar] [CrossRef]
- Cui, T.; Li, C.; Tian, F. Evaluation of Temperature and Precipitation Simulations in CMIP6 Models Over the Tibetan Plateau. Earth Space Sci. 2021, 8, e2020EA001620. [Google Scholar] [CrossRef]
- Cao, Z.; Nan, Z.; Hu, J.; Chen, Y.; Zhang, Y. A New 2010 Permafrost Distribution Map over the Qinghai--Tibet Plateau Based on Subregion Survey Maps: A Benchmark for Regional Permafrost Modeling. Earth Syst. Sci. Data 2023, 15, 3905–3930. [Google Scholar] [CrossRef]
- Zhao, Y.; Yao, Y.; Jin, H.; Cao, B.; Hu, Y.; Ran, Y.; Zhang, Y. Characterizing the Changes in Permafrost Thickness across Tibetan Plateau. Remote Sens. 2023, 15, 206. [Google Scholar] [CrossRef]
- Wang, S.; Sheng, Y.; Li, J.; Wu, J.; Cao, W.; Ma, S. An Estimation of Ground Ice Volumes in Permafrost Layers in Northeastern Qinghai-Tibet Plateau, China. Chin. Geogr. Sci. 2018, 28, 61–73. [Google Scholar] [CrossRef]
- Duan, A.; Xiao, Z. Does the Climate Warming Hiatus Exist over the Tibetan Plateau? Sci. Rep. 2015, 5, 13711. [Google Scholar] [CrossRef] [PubMed]
- Yang, M.; Nelson, F.E.; Shiklomanov, N.I.; Guo, D.; Wan, G. Permafrost Degradation and Its Environmental Effects on the Tibetan Plateau: A Review of Recent Research. Earth Sci. Rev. 2010, 103, 31–44. [Google Scholar] [CrossRef]
- Liu, L.; Zhuang, Q.; Zhao, D.; Zheng, D.; Kou, D.; Yang, Y. Permafrost Degradation Diminishes Terrestrial Ecosystem Carbon Sequestration Capacity on the Qinghai-Tibetan Plateau. Global Biogeochem. Cycles 2022, 36, e2021GB007068. [Google Scholar] [CrossRef]
- He, J.; Yang, K.; Tang, W.; Lu, H.; Qin, J.; Chen, Y.; Li, X. The First High-Resolution Meteorological Forcing Dataset for Land Process Studies over China. Sci. Data 2020, 7, 25. [Google Scholar] [CrossRef]
- Chen, Y.; Yang, K.; He, J.; Qin, J.; Shi, J.; Du, J.; He, Q. Improving Land Surface Temperature Modeling for Dry Land of China. J. Geophys. Res. 2011, 116, D20104. [Google Scholar] [CrossRef]
- Guo, D.; Wang, H. Simulated Change in the Near-Surface Soil Freeze/Thaw Cycle on the Tibetan Plateau from 1981 to 2010. Chin. Sci. Bull. 2014, 59, 2439–2448. [Google Scholar] [CrossRef]
- Pan, Y.; Li, X.; Li, S.; Li, Z. Different Responses of Soil Respiration to Climate Change in Permafrost and Non-Permafrost Regions of the Tibetan Plateau from 1979 to 2018. Int. J. Climatol. 2022, 42, 7198–7212. [Google Scholar] [CrossRef]
- Shangguan, W.; Dai, Y.; Liu, B.; Zhu, A.; Duan, Q.; Wu, L.; Ji, D.; Ye, A.; Yuan, H.; Zhang, Q.; et al. A China Data Set of Soil Properties for Land Surface Modeling. J. Adv. Model. Earth Syst. 2013, 5, 212–224. [Google Scholar] [CrossRef]
- Dai, Y.; Shangguan, W.; Duan, Q.; Liu, B.; Fu, S.; Niu, G.-Y.G. Development of a China Dataset of Soil Hydraulic Parameters Using Pedotransfer Functions for Land Surface Modeling. J. Hydrometeorol. 2013, 14, 869–887. [Google Scholar] [CrossRef]
- Bob, S.; Yang, K. Time-Lapse Observation Dataset of Soil Temperature and Humidity on the Tibetan Plateau (2008–2016); National Tibetan Plateau Data Center: Lanzhou, China, 2019. [Google Scholar]
- Swenson, S.C.; Lawrence, D.M. Assessing a Dry Surface Layer-Based Soil Resistance Parameterization for the Community Land Model Using GRACE and FLUXNET-MTE Data. J. Geophys. Res. Atmos. 2014, 119, 10299–10312. [Google Scholar] [CrossRef]
- Pelletier, J.D.; Broxton, P.D.; Hazenberg, P.; Zeng, X.; Troch, P.A.; Niu, G.Y.; Williams, Z.; Brunke, M.A.; Gochis, D. A Gridded Global Data Set of Soil, Intact Regolith, and Sedimentary Deposit Thicknesses for Regional and Global Land Surface Modeling. J. Adv. Model. Earth Syst. 2016, 8, 41–65. [Google Scholar] [CrossRef]
- Lawrence, P.J.; Chase, T.N. Representing a New MODIS Consistent Land Surface in the Community Land Model (CLM 3.0). J. Geophys. Res. Biogeosci. 2007, 112. [Google Scholar] [CrossRef]
- Ji, H.; Nan, Z.; Hu, J.; Zhao, Y.; Zhang, Y. On the Spin-Up Strategy for Spatial Modeling of Permafrost Dynamics: A Case Study on the Qinghai-Tibet Plateau. J. Adv. Model. Earth Syst. 2022, 14, e2021MS002750. [Google Scholar] [CrossRef]
- Yang, S.; Li, R.; Wu, T.; Wu, X.; Zhao, L.; Hu, G.; Zhu, X.; Du, Y.; Xiao, Y.; Zhang, Y.; et al. Evaluation of Soil Thermal Conductivity Schemes Incorporated into CLM5.0 in Permafrost Regions on the Tibetan Plateau. Geoderma 2021, 401, 115330. [Google Scholar] [CrossRef]
- Ekici, A.; Lee, H.; Lawrence, D.M.; Swenson, S.C.; Prigent, C. Ground Subsidence Effects on Simulating Dynamic High-Latitude Surface Inundation under Permafrost Thaw Using CLM5. Geosci. Model Dev. 2019, 12, 5291–5300. [Google Scholar] [CrossRef]
- Tan, X.; Luo, S.; Li, H.; Hao, X.; Wang, J.; Dong, Q.; Chen, Z. Investigating the Effects of Snow Cover and Vegetation on Soil Temperature Using Remote Sensing Indicators in the Three River Source Region, China. Remote Sens. 2022, 14, 4114. [Google Scholar] [CrossRef]
- Guo, D.; Wang, H. Simulation of Permafrost and Seasonally Frozen Ground Conditions on the Tibetan Plateau, 1981–2010. J. Geophys. Res. Atmos. 2013, 118, 5216–5230. [Google Scholar] [CrossRef]
- Peng, X.; Frauenfeld, O.W.; Jin, H.; Du, R.; Qiao, L.; Zhao, Y.; Mu, C.; Zhang, T. Assessment of Temperature Changes on the Tibetan Plateau during 1980–2018. Earth Space Sci. 2021, 8, e2020EA001609. [Google Scholar] [CrossRef]
- Pan, Y.; Lyu, S.; Li, S.; Gao, Y.; Meng, X.; Ao, Y.; Wang, S. Simulating the Role of Gravel in Freeze–Thaw Process on the Qinghai–Tibet Plateau. Theor. Appl. Climatol. 2017, 127, 1011–1022. [Google Scholar] [CrossRef]
- Ma, J.; Li, R.; Liu, H.; Huang, Z.; Wu, T.; Wu, X.; Zhao, L.; Hu, G.; Xiao, Y.; Jiao, Y.; et al. Evaluation of CLM5.0 for Simulating Surface Energy Budget and Soil Hydrothermal Regime in Permafrost Regions of the Qinghai-Tibet Plateau. Agric. For. Meteorol. 2023, 332, 109380. [Google Scholar] [CrossRef]
- Dai, Y.; Wei, N.; Yuan, H.; Zhang, S.; Shangguan, W.; Liu, S.; Lu, X.; Xin, Y. Evaluation of Soil Thermal Conductivity Schemes for Use in Land Surface Modeling. J. Adv. Model. Earth Syst. 2019, 11, 3454–3473. [Google Scholar] [CrossRef]
- Wang, X.; Yang, M.; Pang, G.; Wan, G.; Chen, X. Simulation and Improvement of Land Surface Processes in Nameqie, Central Tibetan Plateau, Using the Community Land Model (CLM3.5). Environ. Earth Sci. 2015, 73, 7343–7357. [Google Scholar] [CrossRef]
- Cai, L.; Wang, S.; Jia, L.; Wang, Y.; Wang, H.; Fan, D.; Zhao, L. Consistency Assessments of the Land Cover Products on the Tibetan Plateau. IEEE J. Sel. Top. Appl. Earth Obs. Remote Sens. 2022, 15, 5652–5661. [Google Scholar] [CrossRef]
- Pedruzzi, R.; Andreão, W.L.; Baek, B.H.; Hudke, A.P.; Glotfelty, T.W.; Dias de Freitas, E.; Martins, J.A.; Bowden, J.H.; Pinto, J.A.; Alonso, M.F.; et al. Update of Land Use/Land Cover and Soil Texture for Brazil: Impact on WRF Modeling Results over São Paulo. Atmos. Environ. 2022, 268, 118760. [Google Scholar] [CrossRef]
- Yang, Z.; Ouyang, H.; Zhang, X.; Xu, X.; Zhou, C.; Yang, W. Spatial Variability of Soil Moisture at Typical Alpine Meadow and Steppe Sites in the Qinghai-Tibetan Plateau Permafrost Region. Environ. Earth Sci. 2011, 63, 477–488. [Google Scholar] [CrossRef]
- Zou, D.; Zhao, L.; Liu, G.; Du, E.; Hu, G.; Li, Z.; Wu, T.; Wu, X.; Chen, J. Vegetation Mapping in the Permafrost Region: A Case Study on the Central Qinghai-Tibet Plateau. Remote Sens. 2022, 14, 232. [Google Scholar] [CrossRef]
Figure 1.
Study area and location of observation sites and boreholes. The permafrost map of the Tibetan Plateau (TP) was derived from Cao et al. [32].
Figure 1.
Study area and location of observation sites and boreholes. The permafrost map of the Tibetan Plateau (TP) was derived from Cao et al. [32].

Figure 2.
Distributions of land cover types in the study region for (a) CLM5 model default and five LULC products: (b) C3S_LC; (c) ESA_WC10; (d) GlobeLand30; (e) GLC_FCS30; and (f) MODIS_LC.
Figure 2.
Distributions of land cover types in the study region for (a) CLM5 model default and five LULC products: (b) C3S_LC; (c) ESA_WC10; (d) GlobeLand30; (e) GLC_FCS30; and (f) MODIS_LC.

Figure 3.
Coverage fraction of different land cover types for the CLM5 model default and five LULC products.
Figure 3.
Coverage fraction of different land cover types for the CLM5 model default and five LULC products.

Figure 4.
Spatial consistency pattern of all LULC products on TP.

Figure 5.
Comparison of simulated and observed daily values of soil temperature at 5 cm depth at three sites: (a1,a2) Maqu, (b1,b2) Naqu, and (c1,c2) Ngari. ** indicates significant level at p < 0.001.
Figure 5.
Comparison of simulated and observed daily values of soil temperature at 5 cm depth at three sites: (a1,a2) Maqu, (b1,b2) Naqu, and (c1,c2) Ngari. ** indicates significant level at p < 0.001.

Figure 6.
Comparison of simulated and observed borehole temperature profiles for (a) Budongquan, (b) Xieshuihe, (c) Qingshuihe, (d) K2985, (e) Wudaoliang, (f) K3040, and (g) Fenghuoshan during November 2001. The solid line indicates the observation mean, the gray shading indicates the observation range, and the different colored dots indicate the simulation results from different LULC products.

Figure 7.
Comparison of the simulated permafrost extent and permafrost map on the TP in 2010. The permafrost extents were simulated with the CLM5 model with the introduction of different LULC products: (a) CTL, (b) C3S_LC, (c) ESA_WC10, (d) GlobeLand30, (e) GLC_FCS30, and (f) MODIS_LC. Gray areas represent agreement with observation, red areas represent overestimated areas, and blue areas represent underestimated areas.

Figure 8.
(a) The simulated ALT for the CTL and (b–f) the differences for ALT between the simulation using five LULC products and the CTL (unit: m).
Figure 8.
(a) The simulated ALT for the CTL and (b–f) the differences for ALT between the simulation using five LULC products and the CTL (unit: m).

Figure 9.
(a) The simulated ground surface temperature for the CTL and (b–f) the differences for ground surface temperature between the simulation using five LULC products and the CTL (unit: °C).
Figure 9.
(a) The simulated ground surface temperature for the CTL and (b–f) the differences for ground surface temperature between the simulation using five LULC products and the CTL (unit: °C).

Figure 10.
(a) The simulated soil temperature at 3 m for the CTL and (b–f) the differences for soil temperature at 3 m between the simulation using five LULC products and the CTL (unit: °C).
Figure 10.
(a) The simulated soil temperature at 3 m for the CTL and (b–f) the differences for soil temperature at 3 m between the simulation using five LULC products and the CTL (unit: °C).

Figure 11.
(a) The simulated net radiation for the CTL and (b–f) the differences for net radiation between the simulation using five LULC products and the CTL (unit: Wm−2).
Figure 11.
(a) The simulated net radiation for the CTL and (b–f) the differences for net radiation between the simulation using five LULC products and the CTL (unit: Wm−2).

Figure 12.
Distribution of the percentage of (a–f) bare soil and (g–l) grassland based on the TP according to the PFTs generated through the conversion of different land use products.
Figure 12.
Distribution of the percentage of (a–f) bare soil and (g–l) grassland based on the TP according to the PFTs generated through the conversion of different land use products.

Figure 13.
Box plots of (a) net radiation and (b) soil temperature at a 3 m depth in the northwestern part of the plateau modeled with different land use products.
Figure 13.
Box plots of (a) net radiation and (b) soil temperature at a 3 m depth in the northwestern part of the plateau modeled with different land use products.


Table 1.
The original classification and codes of five LULC products.
| C3S-LC | ESA2020 | GlobeLand30 | GLC_FCS30 | MCD12Q1 | |||||
|---|---|---|---|---|---|---|---|---|---|
| 10 | Cropland, rainfed | 10 | Tree cover | 10 | Cropland | 10 | Rainfed cropland | 1 | Evergreen Needleleaf Forests |
| 20 | Cropland, irrigate or post-flooding | 20 | Shrubland | 20 | Forest | 11 | Herbaceous cover | 2 | Evergreen Broadleaf Forests |
| 30 | Mosaic cropland | 30 | Grassland | 30 | Grassland | 12 | Tree or shrub cover | 3 | Deciduous Needleleaf Forests |
| 40 | Mosaic natural vegetation | 40 | Cropland | 40 | Shrubland | 20 | Irrigated cropland | 4 | Deciduous Broadleaf Forests |
| 50 | Tree cover, broadleaved, evergreen | 50 | Built-up | 50 | Wetland | 51 | Open evergreen broadleaved forest | 5 | Mixed Forests |
| 60 | Tree cover, broadleaved, deciduous | 60 | Barren/sparse vegetation | 60 | Waterbodies | 52 | Open evergreen broadleaved forest | 6 | Closed Shrublands |
| 70 | Tree cover, needle-leaved, evergreen | 70 | Snow and ice | 70 | Tundra | 61 | Closed deciduous broadleaved forest | 7 | Open Shrublands |
| 80 | Tree cover, needle-leaved, deciduous | 80 | Open water | 80 | Artificial surface | 62 | Closed deciduous broadleaved forest | 8 | Woody Savannas |
| 90 | Tree cover, mixed-leaf type (broadleaved and needle-leaved) | 90 | Herbaceous wetland | 90 | Bare areas | 71 | Open evergreen needle-leaved forest | 9 | Savannas |
| 100 | Mosaic herbaceous cover | 95 | Mangroves | 100 | Glaciers and permanent snow | 72 | Closed evergreen needle-leaved forest | 10 | Grasslands |
| 110 | Mosaic herbaceous cover | 100 | Moss and lichen | 81 | Open deciduous needle-leaved forest | 11 | Permanent Wetlands | ||
| 120 | Shrubland | 82 | Closed deciduous needle-leaved forest | 12 | Croplands | ||||
| 130 | Grassland | 91 | Open mixed-leaf forest | 13 | Urban and Built-up Lands | ||||
| 140 | Lichens and mosses | 92 | Closed mixed-leaf forest | 14 | Cropland/Natural Vegetation Mosaics | ||||
| 150 | Sparse vegetation | 120 | Shrubland | 15 | Permanent Snow and Ice | ||||
| 160 | Tree cover, flooded | 121 | Evergreen shrubland | 16 | Barren | ||||
| 170 | Tree cover, flooded | 122 | Deciduous shrubland | 17 | Water Bodies | ||||
| 180 | Shrub or herbaceous cover, flooded | 130 | Grassland | ||||||
| 190 | Urban area | 140 | Lichen and mosses | ||||||
| 200 | Bare areas | 150 | Sparse vegetation | ||||||
| 210 | Water bodies | 152 | Sparse shrubland | ||||||
| 220 | Permanent snow and ice | 153 | Sparse herbaceous | ||||||
| 180 | Wetlands | ||||||||
| 190 | Impervious surfaces | ||||||||
| 200 | Bare areas | ||||||||
| 201 | Consolidated bare areas | ||||||||
| 202 | Unconsolidated bare areas | ||||||||
| 210 | Water body | ||||||||
| 220 | Permanent ice and snow | ||||||||
Table 2.
Information on the three observation sites and seven borehole sites.
| No. | Sites/Boreholes | Latitude (°) | Longitude (°) | Altitude (m) | Land Cover | ALT (m) | MAGT (°C) |
|---|---|---|---|---|---|---|---|
| 1 | Maqu | 33.9013 | 102.1752 | 3450 | grassland | 5.0 | |
| 2 | Naqu | 31.6712 | 91.8073 | 4650 | grassland | −0.40 | |
| 3 | Ngari | 33.4105 | 79.6805 | 4270 | sparse grass | 1.20 | |
| 4 | Budongquan | 35.6171 | 93.9633 | 4660 | sparse grass | 2.47 | −0.60 |
| 5 | Xieshuihe | 35.5037 | 93.7844 | 4592 | sparse grass | 1.06 | −1.20 |
| 6 | Qingshuihe | 35.4359 | 93.6074 | 4486 | sparse grass | 2.84 | −1.20 |
| 7 | K2985 | 35.2847 | 93.2441 | 4610 | sparse grass | 4.80 | −0.41 |
| 8 | Wudaoliang | 35.1931 | 93.0750 | 4655 | sparse grass | 1.93 | −1.53 |
| 9 | K3040 | 34.9598 | 92.9550 | 4600 | sparse grass | 2.36 | −1.11 |
| 10 | Fenghuoshan | 34.7037 | 92.9011 | 4886 | sparse grass | 4.01 | −0.65 |
ALT is active layer thickness. MAGT is mean annual ground temperature.
Table 3.
Conversion and reclassification of land cover types in the five original LULC products according to the CLM5 PFTs (plant functional types) classification system.
Table 3.
Conversion and reclassification of land cover types in the five original LULC products according to the CLM5 PFTs (plant functional types) classification system.
| Major Types | CLM5 | C3S-LC | ESA2020 | GlobeLand30 | GLC_FCS30 | MODIS_LC |
|---|---|---|---|---|---|---|
| Forest | Needleleaf evergreen tree (NET) boreal | 70/71/72 | 10 | 20 | 71/72 | 1 |
| Needleleaf deciduous tree (NDT) boreal | 80/81/82 | 81/82 | 3 | |||
| Broadleaf evergreen tree (BET) temperate | 50 | 51/52 | 2 | |||
| Broadleaf deciduous tree (BDT) boreal | 60/61/62/90 | 10 | 20 | 61/62/91/92 | 4/5 | |
| Shrub | Broadleaf evergreen shrub (BES) temperate | 121 | ||||
| Broadleaf deciduous shrub (BDS) boreal | 100/120/121/122 | 20 | 40 | 120/122 | 6/7/8 | |
| Grass | Arctic grass | 30/40/110/130/140 | 30/100 | 30/70 | 130/140 | |
| Grass | 30/40/110/130/140 | 30/100 | 30/70 | 130/140 | 8/9/10 | |
| Crop | Crop | 10/11/12/20 | 40 | 10 | 10/11/12/20 | 12/14 |
| Water | Wetland | 180 | 90 | 50 | 180 | 11 |
| Water bodies | 160/170/210 | 80 | 60 | 210 | 17 | |
| Urban | Urban | 190 | 50 | 80 | 190 | 13 |
| Glacier | Glacier | 220 | 70 | 100 | 220 | 15 |
| Bare soil | Bare land | 150/152/153/ 200/201/202 | 60 | 90 | 150/152/153/ 200/201/202 | 16 |
Table 4.
Percentage of major land cover types identified with different LULC products at simulated grid points for seven boreholes (unit: %).
Table 4.
Percentage of major land cover types identified with different LULC products at simulated grid points for seven boreholes (unit: %).
| Boreholes | LULC Types | CTL | C3S_LC | ESA_WC10 | GlobeLand30 | GLC_FCS30 | MODIS_LC |
|---|---|---|---|---|---|---|---|
| Budongquan | Bare soil | 61.91 | 72.50 | 72.74 | 0.81 | 71.39 | 85.44 |
| Grassland | 37.91 | 27.03 | 26.06 | 98.36 | 28.16 | 14.56 | |
| Xieshuihe | Bare soil | 64.57 | 57.87 | 83.06 | 1.92 | 89.83 | 89.83 |
| Grassland | 35.34 | 42.13 | 16.61 | 96.12 | 9.99 | 10.17 | |
| Qingshuihe | Bare soil | 59.84 | 67.87 | 82.59 | 3.58 | 57.11 | 77.00 |
| Grassland | 38.15 | 29.43 | 11.81 | 92.71 | 19.22 | 23.00 | |
| K2985 | Bare soil | 43.53 | 5.60 | 59.77 | 3.43 | 5.93 | 2.95 |
| Grassland | 54.04 | 93.79 | 37.46 | 93.01 | 79.64 | 97.05 | |
| Wudaoliang | Bare soil | 59.98 | 12.08 | 43.33 | 9.29 | 13.54 | 13.67 |
| Grassland | 40.00 | 85.76 | 51.13 | 80.37 | 83.09 | 86.33 | |
| K3040 | Bare soil | 41.2 | 6.64 | 66.77 | 3.12 | 22.13 | 0.17 |
| Grassland | 58.28 | 93.36 | 27.28 | 93.65 | 71.7 | 99.83 | |
| Fenghuoshan | Bare soil | 38.16 | 5.66 | 7.21 | 0.29 | 0.14 | 0.67 |
| Grassland | 60.94 | 88.33 | 92.75 | 99.42 | 99.85 | 99.33 |
Table 5.
RMSE between simulated and observed soil temperature for 7 boreholes (unit: °C).
| Boreholes | CTL | C3S_LC | ESA_WC10 | GlobeLand30 | GLC_FCS30 | MODIS_LC |
|---|---|---|---|---|---|---|
| Budongquan | 0.54 | 0.41 | 0.40 | 1.50 | 0.46 | 0.38 |
| Xieshuihe | 0.49 | 0.45 | 0.47 | 0.63 | 0.48 | 0.48 |
| Qingshuihe | 0.59 | 0.70 | 0.70 | 0.62 | 0.53 | 0.70 |
| K2985 | 1.01 | 1.06 | 1.05 | 1.06 | 0.92 | 1.05 |
| Wudaoliang | 0.61 | 0.60 | 0.57 | 0.60 | 0.65 | 0.59 |
| K3040 | 0.80 | 0.50 | 1.43 | 0.49 | 0.73 | 0.48 |
| Fenghuoshan | 0.48 | 0.47 | 0.49 | 0.49 | 0.47 | 0.47 |
Bold indicates the smallest RMSE of all simulation cases.
Disclaimer/Publisher’s Note: The statements, opinions and data contained in all publications are solely those of the individual author(s) and contributor(s) and not of MDPI and/or the editor(s). MDPI and/or the editor(s) disclaim responsibility for any injury to people or property resulting from any ideas, methods, instructions or products referred to in the content. |
© 2023 by the authors. Licensee MDPI, Basel, Switzerland. This article is an open access article distributed under the terms and conditions of the Creative Commons Attribution (CC BY) license (https://creativecommons.org/licenses/by/4.0/).
Share and Cite
MDPI and ACS Style
Pan, Y.; Li, X.; Wang, D.; Li, S.; Wen, L. Impacts of Land Use/Land Cover Distributions on Permafrost Simulations on Tibetan Plateau. Remote Sens. 2023, 15, 5586. https://doi.org/10.3390/rs15235586
AMA Style
Pan Y, Li X, Wang D, Li S, Wen L. Impacts of Land Use/Land Cover Distributions on Permafrost Simulations on Tibetan Plateau. Remote Sensing. 2023; 15(23):5586. https://doi.org/10.3390/rs15235586
Chicago/Turabian StylePan, Yongjie, Xia Li, Danyun Wang, Suosuo Li, and Lijuan Wen. 2023. "Impacts of Land Use/Land Cover Distributions on Permafrost Simulations on Tibetan Plateau" Remote Sensing 15, no. 23: 5586. https://doi.org/10.3390/rs15235586
Note that from the first issue of 2016, this journal uses article numbers instead of page numbers. See further details here.