
Seasonal Cooling Effect of Vegetation and Albedo Applied to the LCZ Classification of Three Chinese Megacities

1
School of Geography and Remote Sensing, Guangzhou University, Guangzhou 510006, China
2
School of Geography and Planning, Sun Yat-sen University, Guangzhou 510275, China
3
Faculty of Civil Engineering and Earth Sciences, Delft University of Technology, 2600 GA Delft, The Netherlands
4
State Key Laboratory of Remote Sensing Science, Institute of Remote Sensing and Digital Earth, Chinese Academy of Sciences, Beijing 100101, China
5
Department of Land Surveying and Geo-Informatics, Research Institute for Land and Space, The Hong Kong Polytechnic University, Hong Kong 999077, China
*
Author to whom correspondence should be addressed.
Remote Sens. 2023, 15(23), 5478; https://doi.org/10.3390/rs15235478
Submission received: 6 October 2023
/
Revised: 17 November 2023
/
Accepted: 21 November 2023
/
Published: 23 November 2023
(This article belongs to the Special Issue Thermal Remote Sensing for Monitoring Terrestrial Environment)
Abstract
:The urban heat island effect poses a growing threat to human society, especially in densely populated and developed megacities. With the introduction of the Local Climate Zones (LCZ) framework, new perspectives and findings have been brought to urban heat island studies. This study investigated the cooling effect of vegetation and albedo on the surface urban heat island (SUHI) in the classification system of LCZ during different seasons, using three Chinese megacities as case study areas. Single-factor linear regression and Pearson’s correlation coefficient were applied to analyze the seasonal cooling effect of both albedo and the NDVI on the SUHI within different LCZs. The results show that (1) the variability of the SUHI is reflected in its dominance and intensity within certain LCZs in different cities and in the efficiency of cooling factors; (2) the cooling effect of vegetation is dominant in each season, and the cooling effect produced by albedo within specific seasons can be differentiated by LCZs. This study provides valuable information for the mitigation of the SUHI magnitude in specific regions and at specific times of the year.
1. Introduction
The world is urbanizing, and this trend is projected to continue [1]. Rapid urbanization has caused dramatic changes in urban surface morphology, with increasing urban impervious surfaces and building density [2,3]. The changes in urban morphology, particularly the increase in impervious surfaces, have led to significant changes in the local thermal environments and microclimates of cities [4]. According to the principle of energy balance, a decrease in vegetation leads to a decrease in latent heat, and more energy is used to increase the surface temperature or sensible heat flux, both of which heat the surface and the atmosphere. In addition, changes in surface albedo due to changes in impervious cover and surface structure cause changes in the net radiation received by the city, which also changes the energy balance, resulting in changes in the thermal environment. This explains why the urban heat island effect develops in cities with changes in urban morphology. The increasingly significant urban heat island effect, with its spatial and temporal heterogeneity within cities, is becoming progressively obvious [5] and has attracted widespread attention as one of the most prominent climate effects. Thus, the study of the urban thermal environment is an important issue, and the research problem of how to mitigate the excess urban heat is of great interest.
The Earth system focus of UHI research can be categorized as follows: the canopy UHI (), the boundary layer UHI () and the surface UHI () [6,7,8]. The first two are based, in general, on observations of the air temperature (), while the SUHI is studied by observing the land surface temperature (LST). is measured by in situ sensors at standard meteorological height or spatial sampling by vehicle-mounted sensors, which are closer to actual human perception. However, meteorological networks in urban areas are not always fully integrated, which leads to the limited applicability of . The LST is derived from either airborne or satellite-borne remote sensing data, which can capture the full spatial distribution of the temperature over vast areas [9]. Remote sensing data have been validated for urban studies at various spatial, temporal, and spectral scales. Compared to in situ temperature measurements, remote sensing provides not only detailed land cover information, but also complete LST observations [10]. Thus, the SUHI based on the LST provided by remote sensing can reveal the effects of spatial and temporal heterogeneity in the urban space on the urban thermal environment.
Urban vegetation is an important nature-based solution to mitigate urban excess heat and reduce the SUHI intensity [11,12,13]. The main mechanisms of the cooling effect of vegetation on cities include energy dissipation as latent heat flux and shading [14,15,16]. Both latent heat flux and the shading conditions are affected by the local climate and the urban geometry. The urban geometry, combined with the local climate conditions, determines the urban aerodynamic resistance and blocking of solar radiation. These factors affect the vegetation transpiration rate and thus the remaining excess energy and, eventually, the vegetation cooling effect. Additionally, urban material properties, e.g., albedo, which determines the reflection of solar radiation, are also important factors to reduce urban excess heat, thus maintaining a lower LST during the day [17]. This also reduces sensible heat transfer to the atmosphere [18]. As a result, high albedo is helpful to reduce the excess heat and alleviate the SUHI effect [19].
Decreasing radiation absorption by increasing albedo and increasing heat dissipation by latent heat (increasing vegetation and water bodies) helps to mitigate the urban heat excess. The cooling effects of both albedo and vegetation are influenced by the background climate and the effects vary from season to season [20]. Yan (2023) studied the difference in the climate regulation capacity of vegetation in different seasons and showed that the cooling efficiency of vegetation increased significantly when the air temperature > 15.1 °C [21]. Kuang (2015) showed that thermal dissipation by transpiration was different in high-rise residential areas and traditional low-rise residential areas [22]. The albedo also changes with the seasons and urban geometry [23,24,25]. Yang (2015) showed that the urban albedo changed with the seasons and building density [26]. However, the cooling effects of albedo and vegetation for different climatic backgrounds and different seasons have still not been analyzed thoroughly in previous studies. In summary, we hope to uncover the cooling potential of albedo and vegetation under different climatic conditions and seasons.
The urban climate is determined by the urban land cover and geometry. To study the urban climate and its effects, it is necessary to select the appropriate scale. Stewart and Oke introduced the concept of Local Climate Zones (LCZ) [27] to provide a reference for an appropriate observation scale and classification system for urban climate zones when studying urban thermal environmental problems. LCZ (1–10 km) is an emerging scale situated between block (100 m–1 km) scales and city (10–100 km) scales, and it has played a major role in bridging the scale problem in urban climate studies [28]. The LCZ classification system considers the fractional abundance of impervious surfaces and vegetation, building density and height, urban texture, and anthropogenic heat. This classification is applied to map units of hundreds to thousands of square meters, comprising up to 10 types of buildings and 7 types of natural land cover. The analysis of the SUHI based on LCZ is attracting increasing attention. Bechtel (2019) analyzed the SUHI using LCZ and compared the SUHI of 50 cities globally, and the results showed that significant SUHI differences were found not only between the built-up and natural classes but also within the built-up classes [29]. Zhao (2021) analyzed the spatial variability and temporal heterogeneity of the SUHI based on LCZ in Shenyang, and the results showed that the SUHII and the applicability of the LCZ scheme exhibited spatiotemporal variations [5]. Current studies of the SUHI based on LCZ are mostly focused on the comparison of the SUHI intensity between different LCZ classifications. Although the LCZ classification includes the urban geometry and land cover information, the cooling effects of vegetation and material properties (e.g., albedo) on the SUHI of different LCZs are still unclear. The land cover and geometry change the surface albedo and roughness, and then affect the absorbed solar radiation and turbulent exchange. The difference in absorbed solar radiation affects the latent heat at the surface. Additionally, the albedo also changes with the seasons and background [30,31]. Urban vegetation is one of the main solutions for heat mitigation in urban areas, taking into account that the urban geometry and background climate affect the cooling efficiency of urban vegetation.
The study of the surface urban heat island effect (SUHI) in the urban thermal environment is an important issue. In order to explore the methods to reduce the SUHI at the local scale, we assessed the SUHI phenomenon in three Chinese megacities based on Local Climate Zones (LCZ), namely Beijing, Shanghai, and Guangzhou, as a case study. We then used linear regression and Pearson correlation coefficients to calculate the cooling effects of albedo and vegetation on the SUHI within different LCZs in different seasons, and we analyzed their response variables. In addition, in this paper, we provide our conclusions and analyze the key findings, some discrepancies, and future research. We conducted this study to (1) investigate the distribution of the SUHI across cities with different LCZs in different seasons and (2) investigate the cooling effect of vegetation and albedo on the SUHI in different LCZs and seasons.
2. Materials and Methods
2.1. Study Area
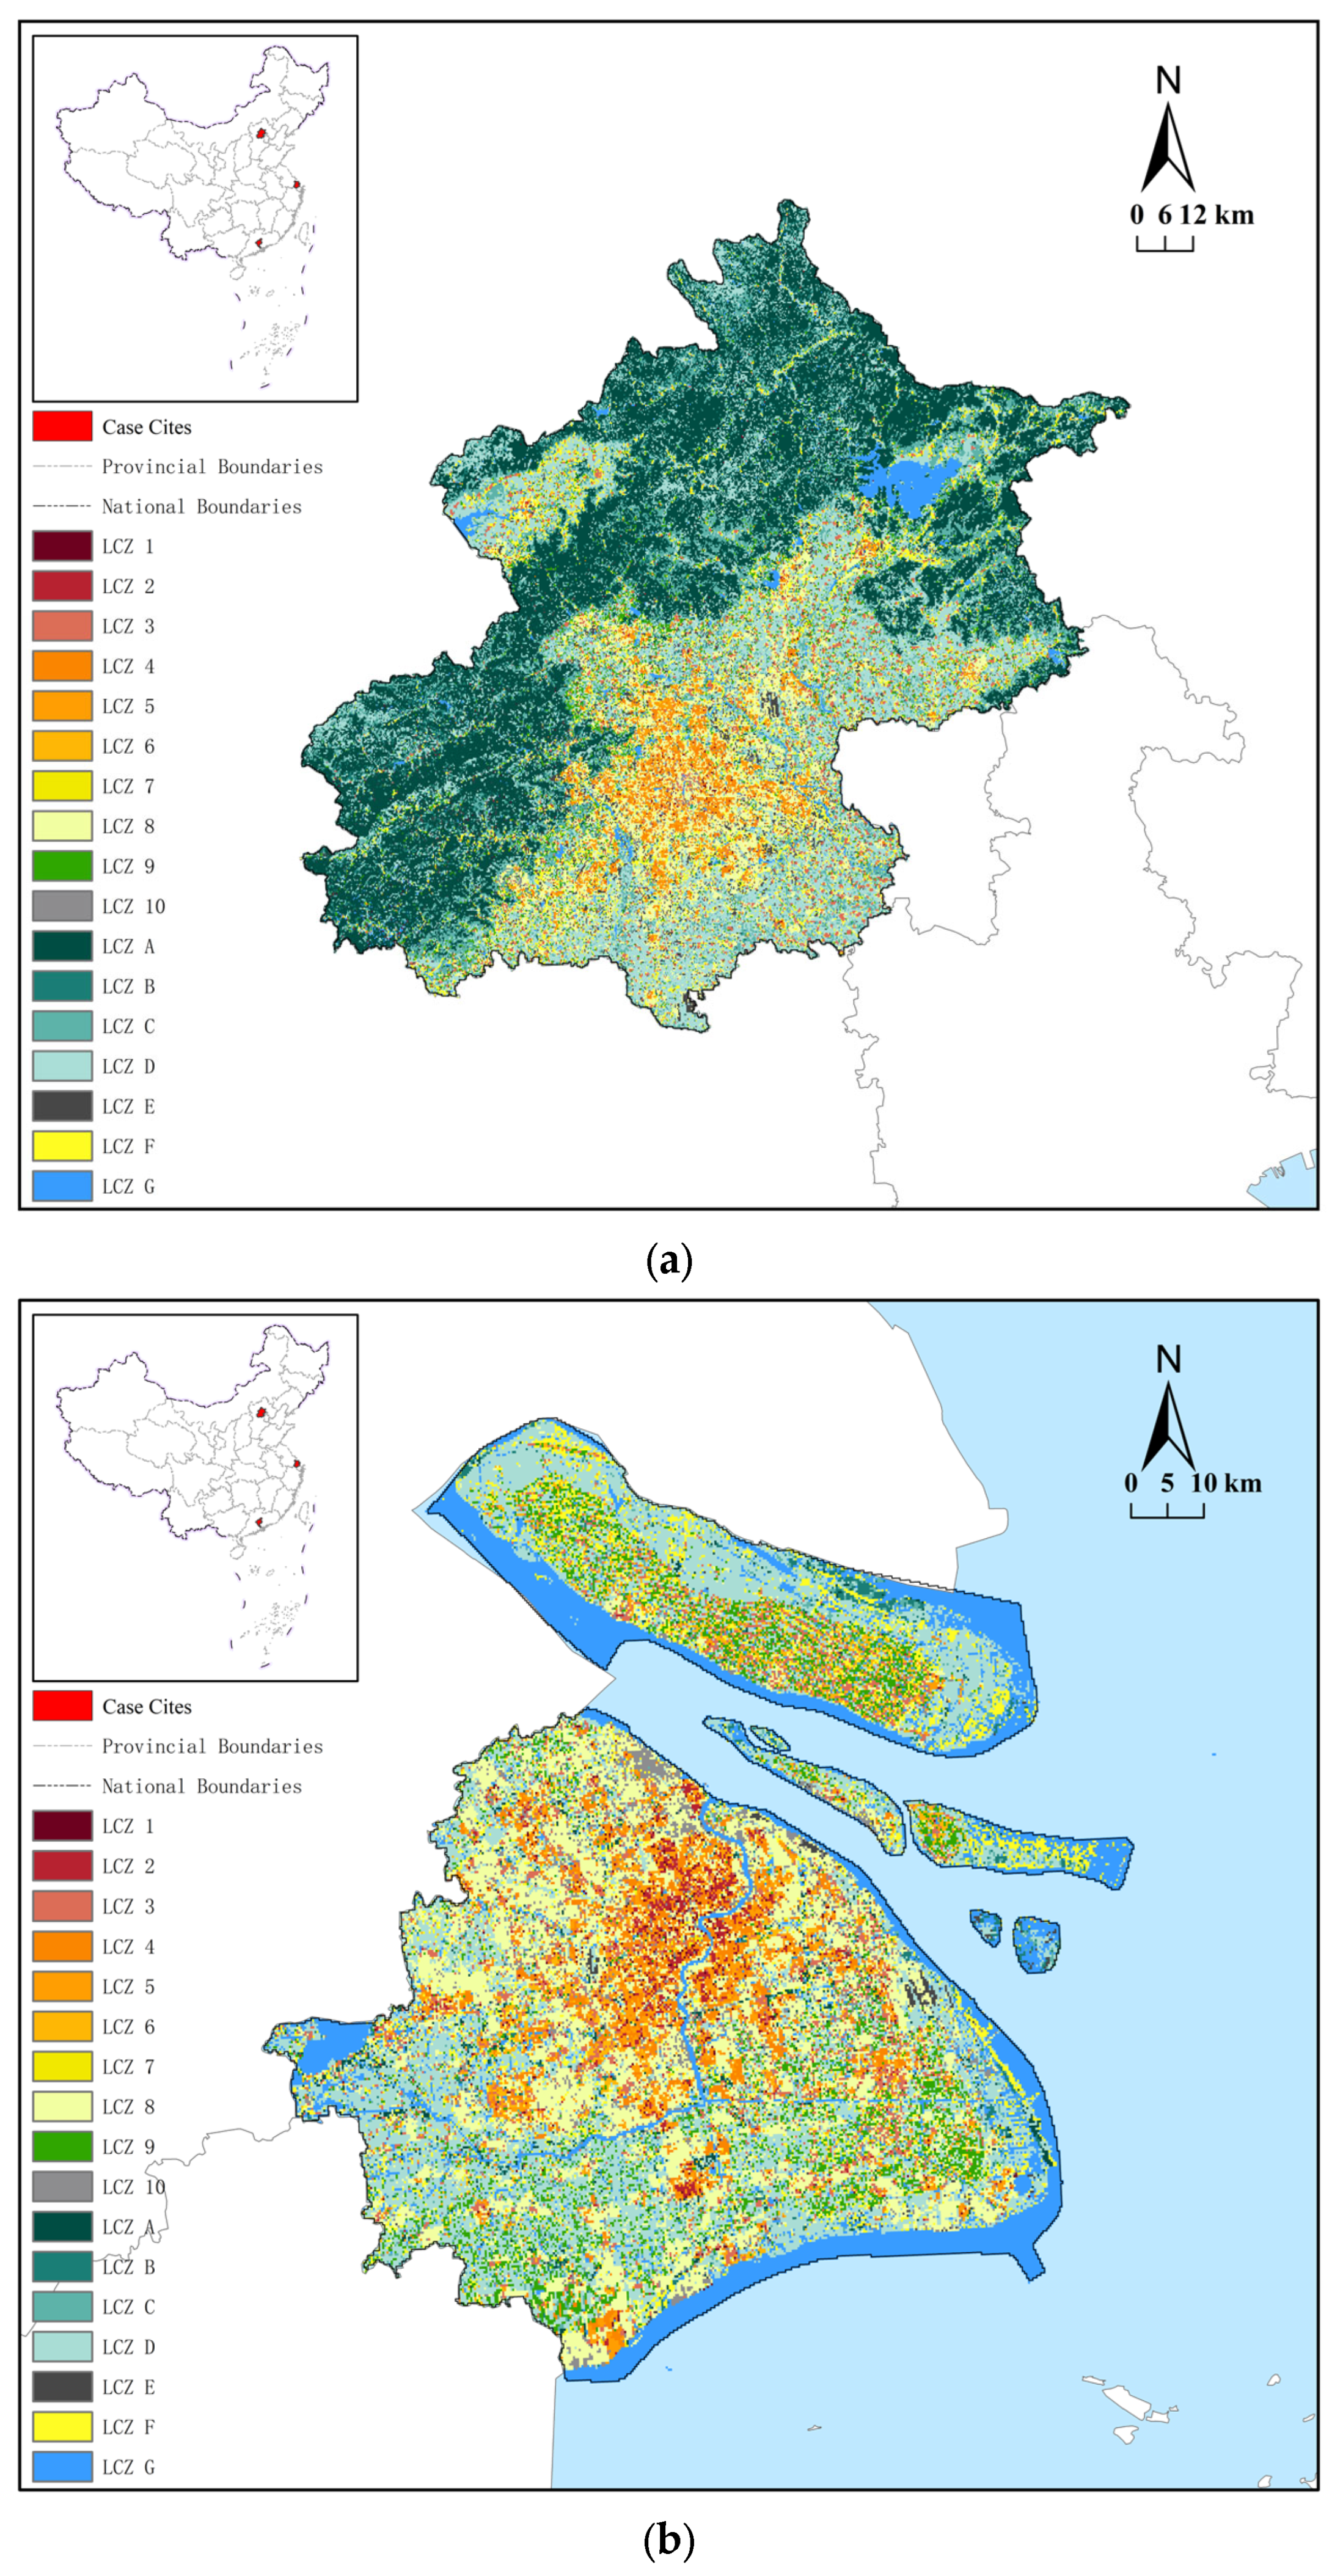
China is a vast country with diverse landscapes and cultures, and different cities have different urban morphological characteristics and climates. Therefore, three Chinese megacities in different climate zones were selected as case studies: Beijing (39°54′15″N, 116°24′27″E), Shanghai (31°13′43′′N, 121°28′29′′E), and Guangzhou (23°07′N, 113°15′E) (Figure 1a–c). Beijing has a monsoon-influenced humid continental climate (Köppen: Dwa). Shanghai has a humid subtropical climate (Köppen: Cfa). Guangzhou has a humid subtropical climate (Köppen: Cfa/Cwa) influenced by the East Asian monsoon. Beijing is the capital of China, with a historic urban core dating back 600 years [32]. Top-down central government policies heavily influence the design and development of the urban space due to the city’s numerous historic sites, dense population, and scarce water resources [33,34]. Shanghai is the economic center of China and one of the largest trading port cities to emerge worldwide in modern times; its traditional cityscape was influenced by Western culture in the early 20th century [35]. Located in the center of the Pearl River Delta, Guangzhou was China’s first nationwide pioneering urbanization area, beginning in 1978. As a result, market forces have driven urban development more strongly here than in other Chinese cities [36]. They also have similarities. For example, they are located in the country’s three major urban agglomerations (Beijing–Tianjin–Hebei, Yangtze River Delta, and Pearl River Delta urban agglomerations) (Figure 1a–c) and are densely populated, with 21.54 million, 24.28 million, and 15.3 million inhabitants, respectively. All cities have experienced rapid urbanization and large-scale urban morphological transformations in the last two decades [37]. The three cities have different climatic and physical conditions, such as humidity and radiation, which bring about differences in fractional vegetation cover and urban energy exchange. Therefore, Beijing, Shanghai, and Guangzhou are ideal large cities for a comparative study aimed at identifying and revealing the drivers of the SUHI from an LCZ perspective. LCZs are categorized into 17 classes, among which LCZ 1–LCZ 10 are built-up classes and LCZ A–LCZ G are natural classes. For a better understanding of the LCZs, we used Stewart and Oke’s table containing schematics and descriptions to represent each LCZ class (Table 1) [27].
2.2. Data Resource
2.2.1. Local Climate Zone
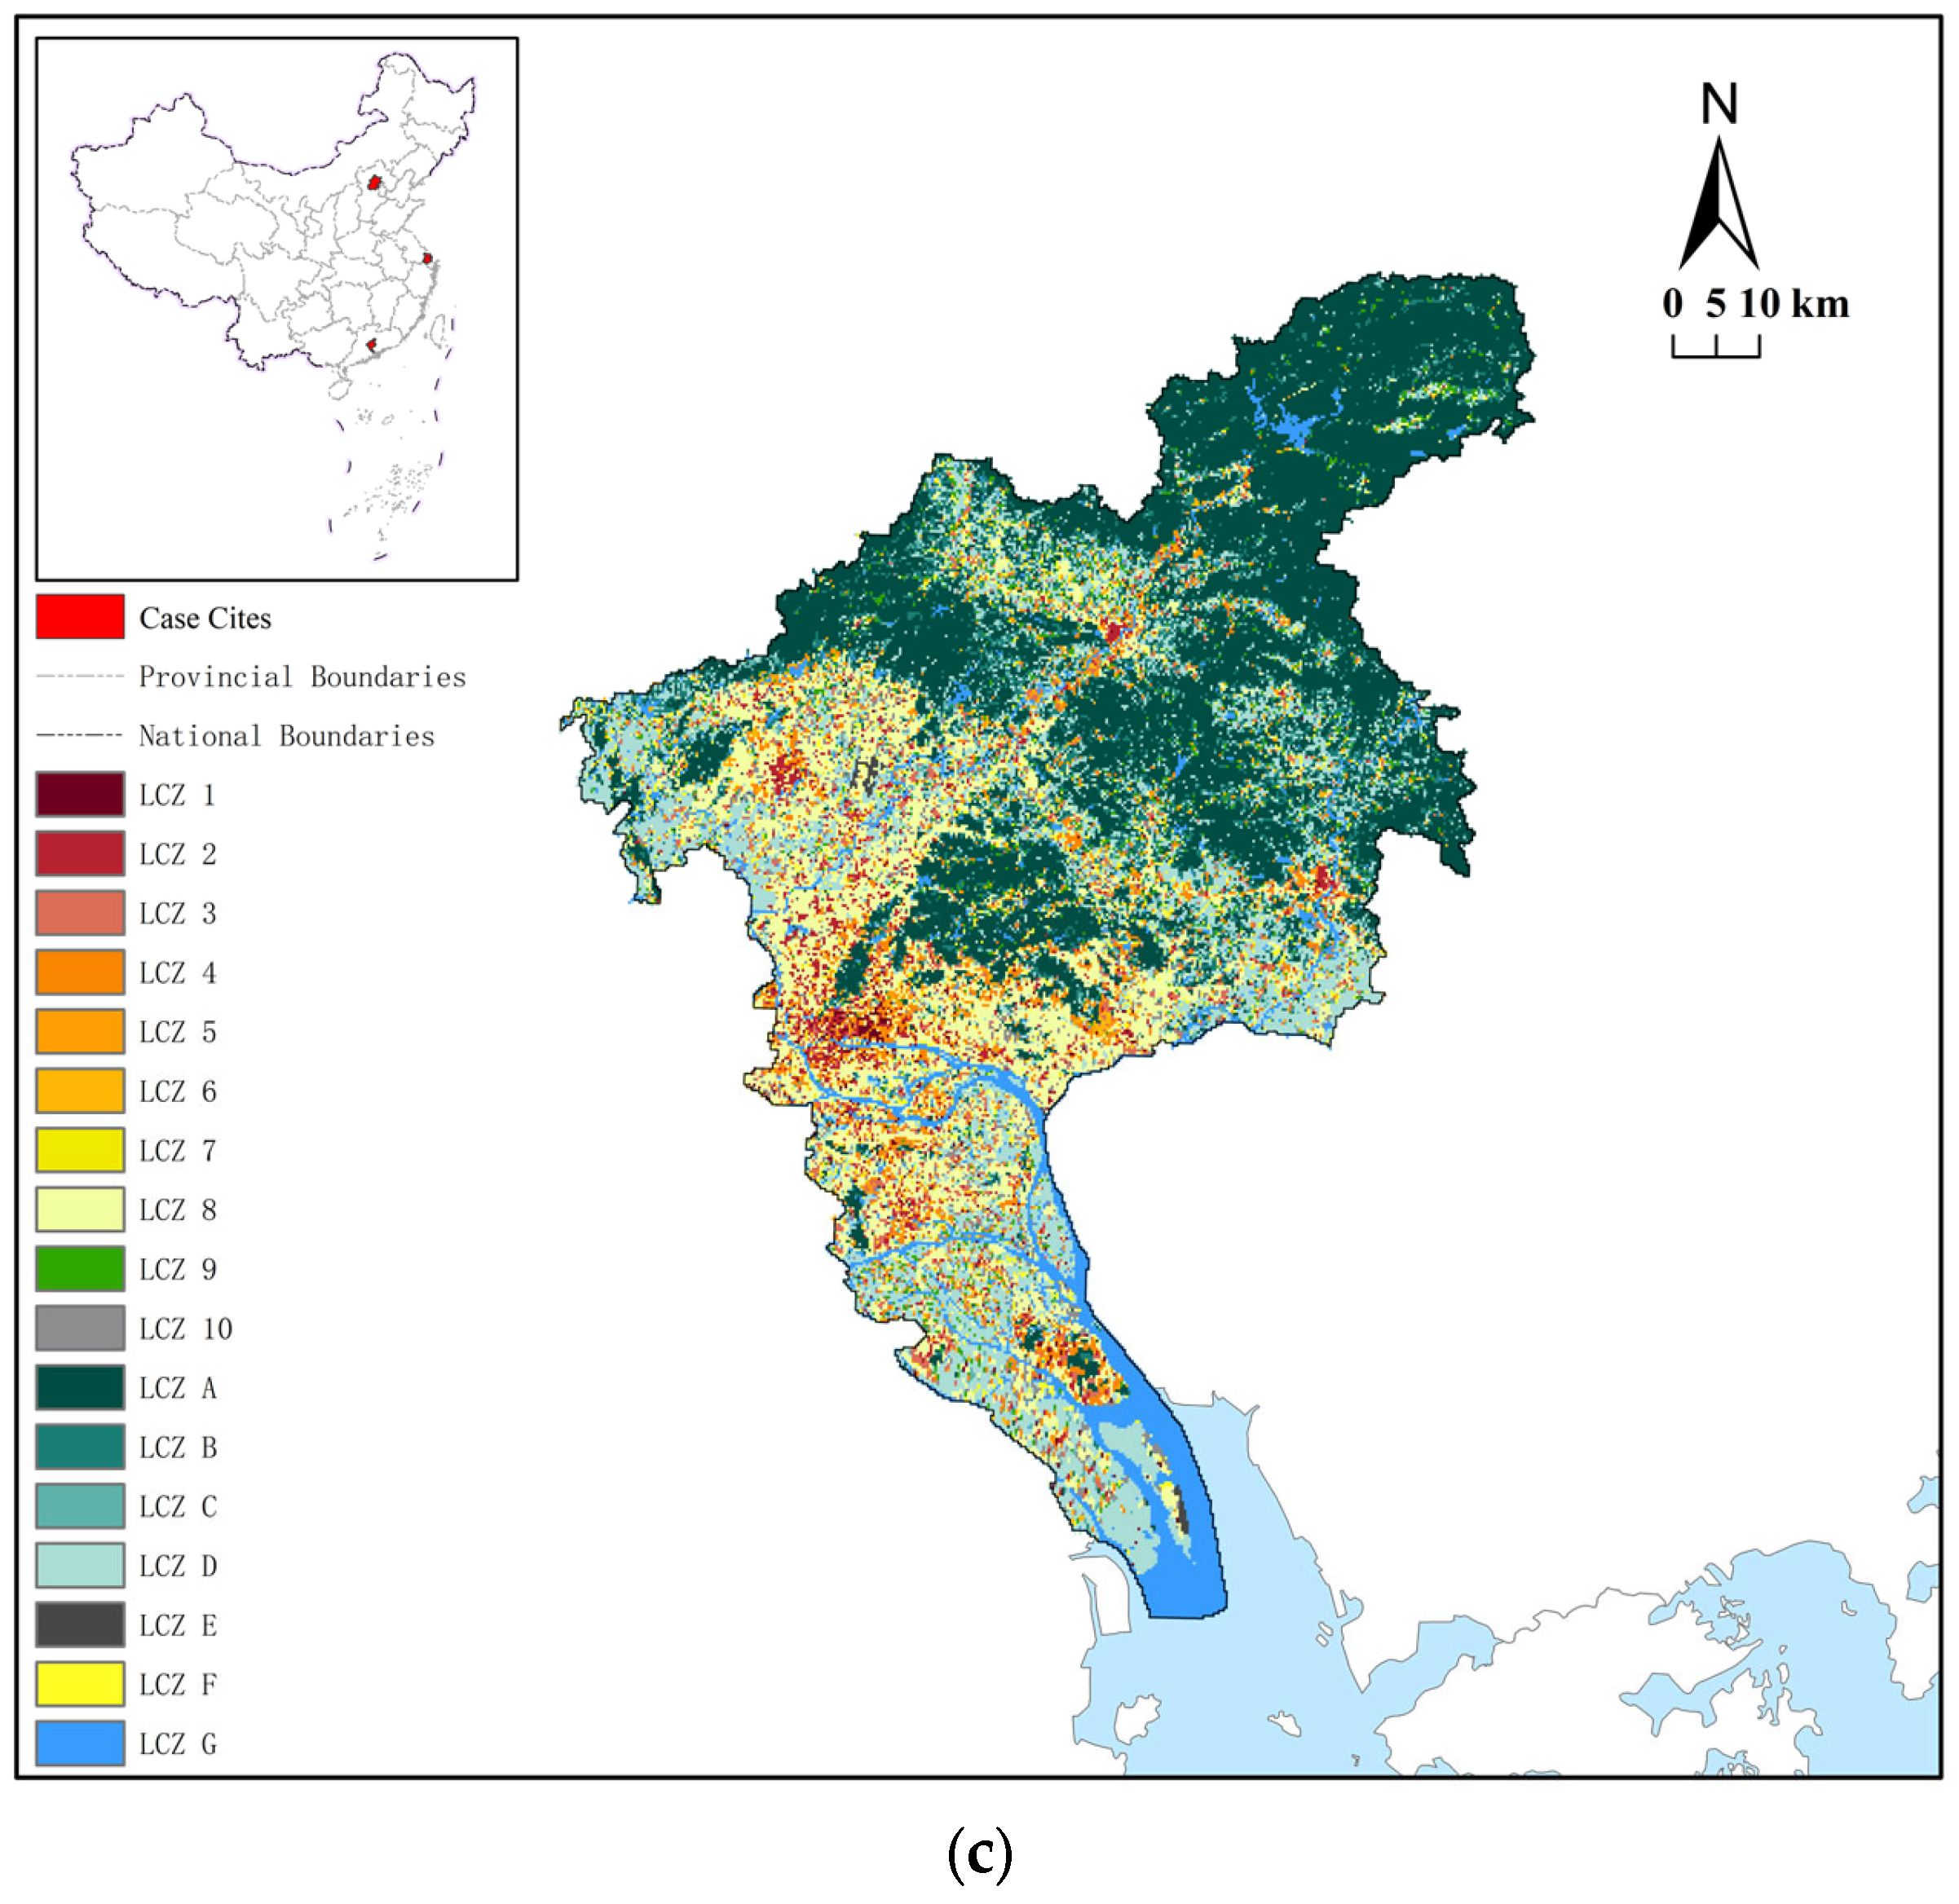
In this study, a local climate zone product from [38] was used. The LCZ map was generated by a deep learning network, based on multi-spectral satellite data acquired by the Sentinel-1 and Sentinel-2 satellites, by image classification of the impacts within a spatial resolution of 10 × 10 m. A fusion method was used in the network to integrate information from spectral reflectance from multi-spectral sensors and building structure and orientations from SAR. The network was trained using a benchmark dataset, So2Sat LCZ42 [39], which included 400,673 Sentinel-1 and Sentinel-2 image pairs globally distributed in 42 urban agglomerations and 10 different cultural zones, and corresponding labels with 85% confidence. This product used seven decisions to label certain LCZs for training samples: A: Is it homogeneous for at least five pixels of 100 × 100 m? B: Is the building occupying a large area? C: Does any obvious industrial feature exist (such as oil tanks, cranes, or conveyor belts)? D1: Buildings with up to three floors; D2: Buildings with three to ten floors; D3: Buildings with ten floors and higher; E1: Building surface fraction between 20% and 40%; E2: Building surface smaller than 20%; E3: Building surface fraction between 40% and 70%; E4: Light material built with surface fraction larger than 60%; F: Is the building surface fraction larger than 40%?; and G: Is the building surface fraction larger than 40%? The work-flow adopted for the labeling decision rules is shown in Figure 2. This LCZ product has a spatial resolution of 100 × 100 m and covers regions from 1692 cities around the world, whose population is greater than 300,000. These regions are rectangles centered on each city, with a factor of four in the Global Urban Footprint area [40], to ensure that there are rapid urbanization areas within the LCZ product.
2.2.2. Satellite Data Used and Processing Work-Flow
In this study, Landsat 8 OLI/TIRS data were used as the primary data source to calculate the albedo and NDVI, including OLI and TIRS images from November 2020 to October 2021, obtained from the USGS’s Earth Explorer website. We separated spring, summer, autumn, and winter at three-month intervals and averaged all images within each three-month period to represent the values for a season. Since the winter of 2021 was too cloudy and the data availability was too low, we used the images from the winter of 2020. The dataset included atmospherically corrected surface reflectance, which was derived from Landsat 8 OLI/TIRS sensor data. All LST products were jointly developed by the Jet Propulsion Laboratory (JPL) of NASA and the Rochester Institute of Technology (RIT), using a single-channel algorithm. In this study, we utilized the NDVI products and surface temperature products from these datasets on the Google Earth Engine cloud-based platform. All of our data had a spatial resolution of 30 m and were left unchanged throughout the processing. This was to ensure that we could lose as little information as possible from the data in the subsequent geographic processing. All the data that we used were accessed and analyzed using the Google Earth Engine API, which provides a library of operators (Table 2).
2.3. Work-Flow
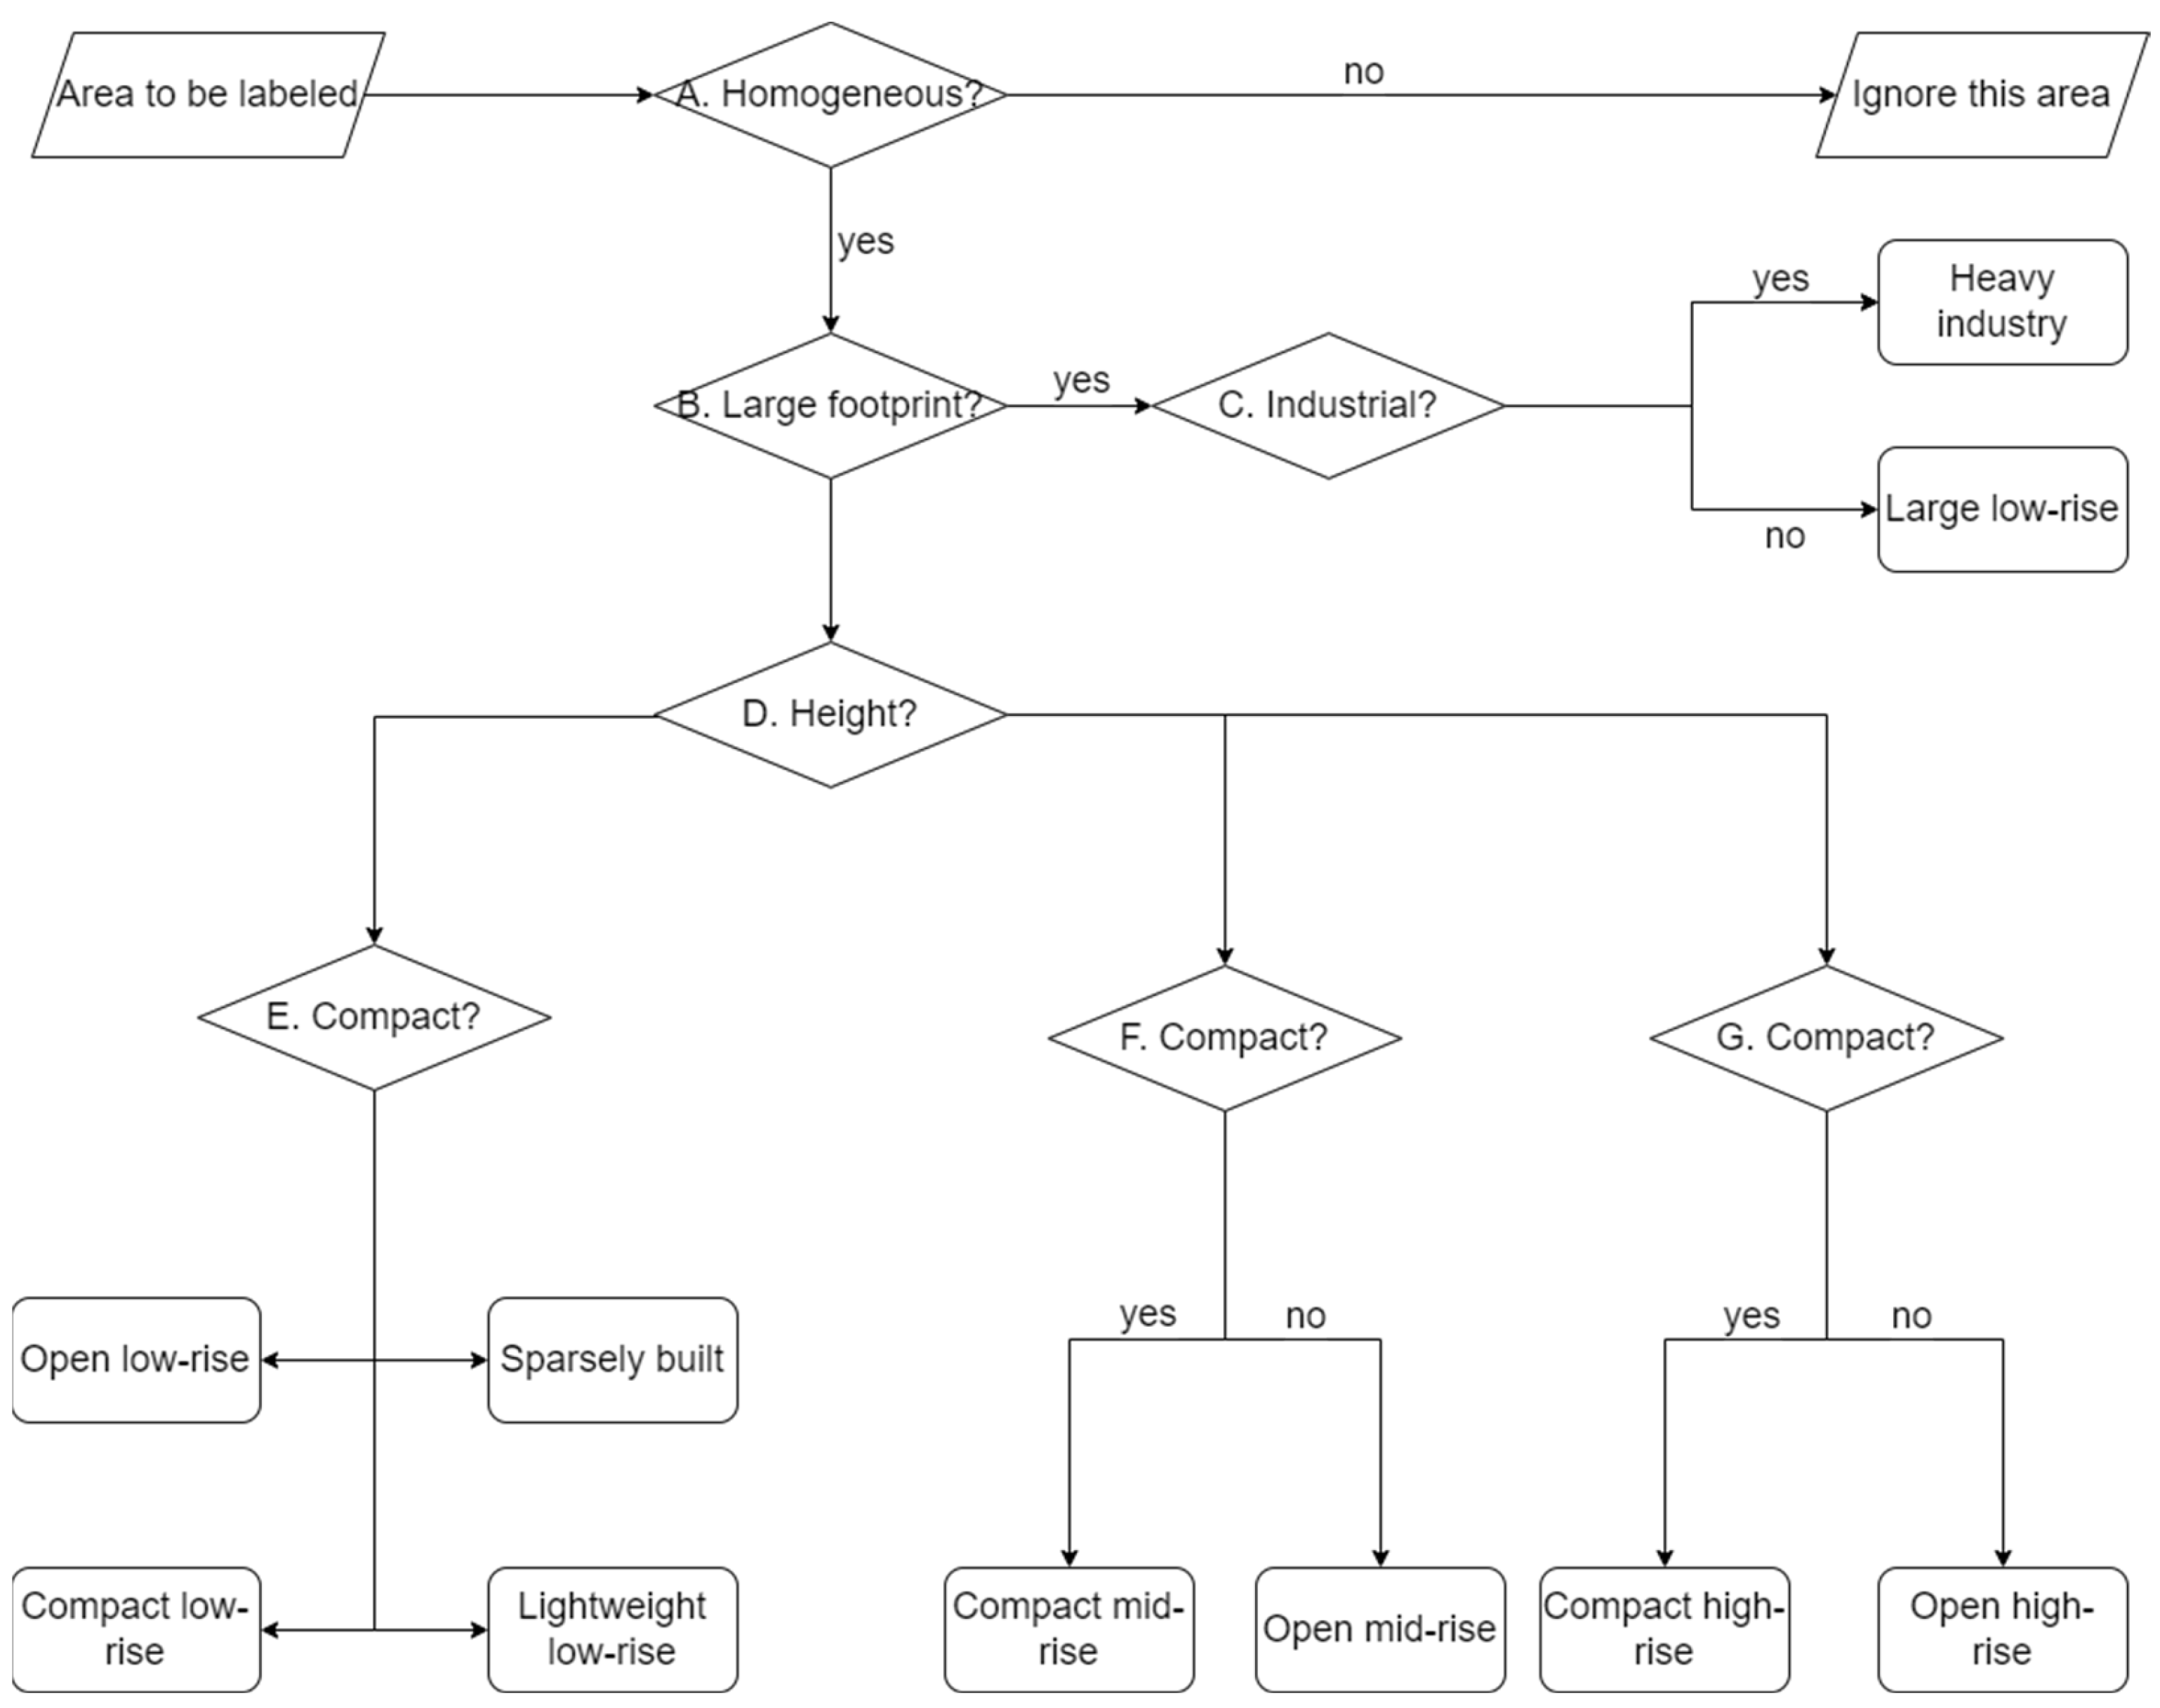
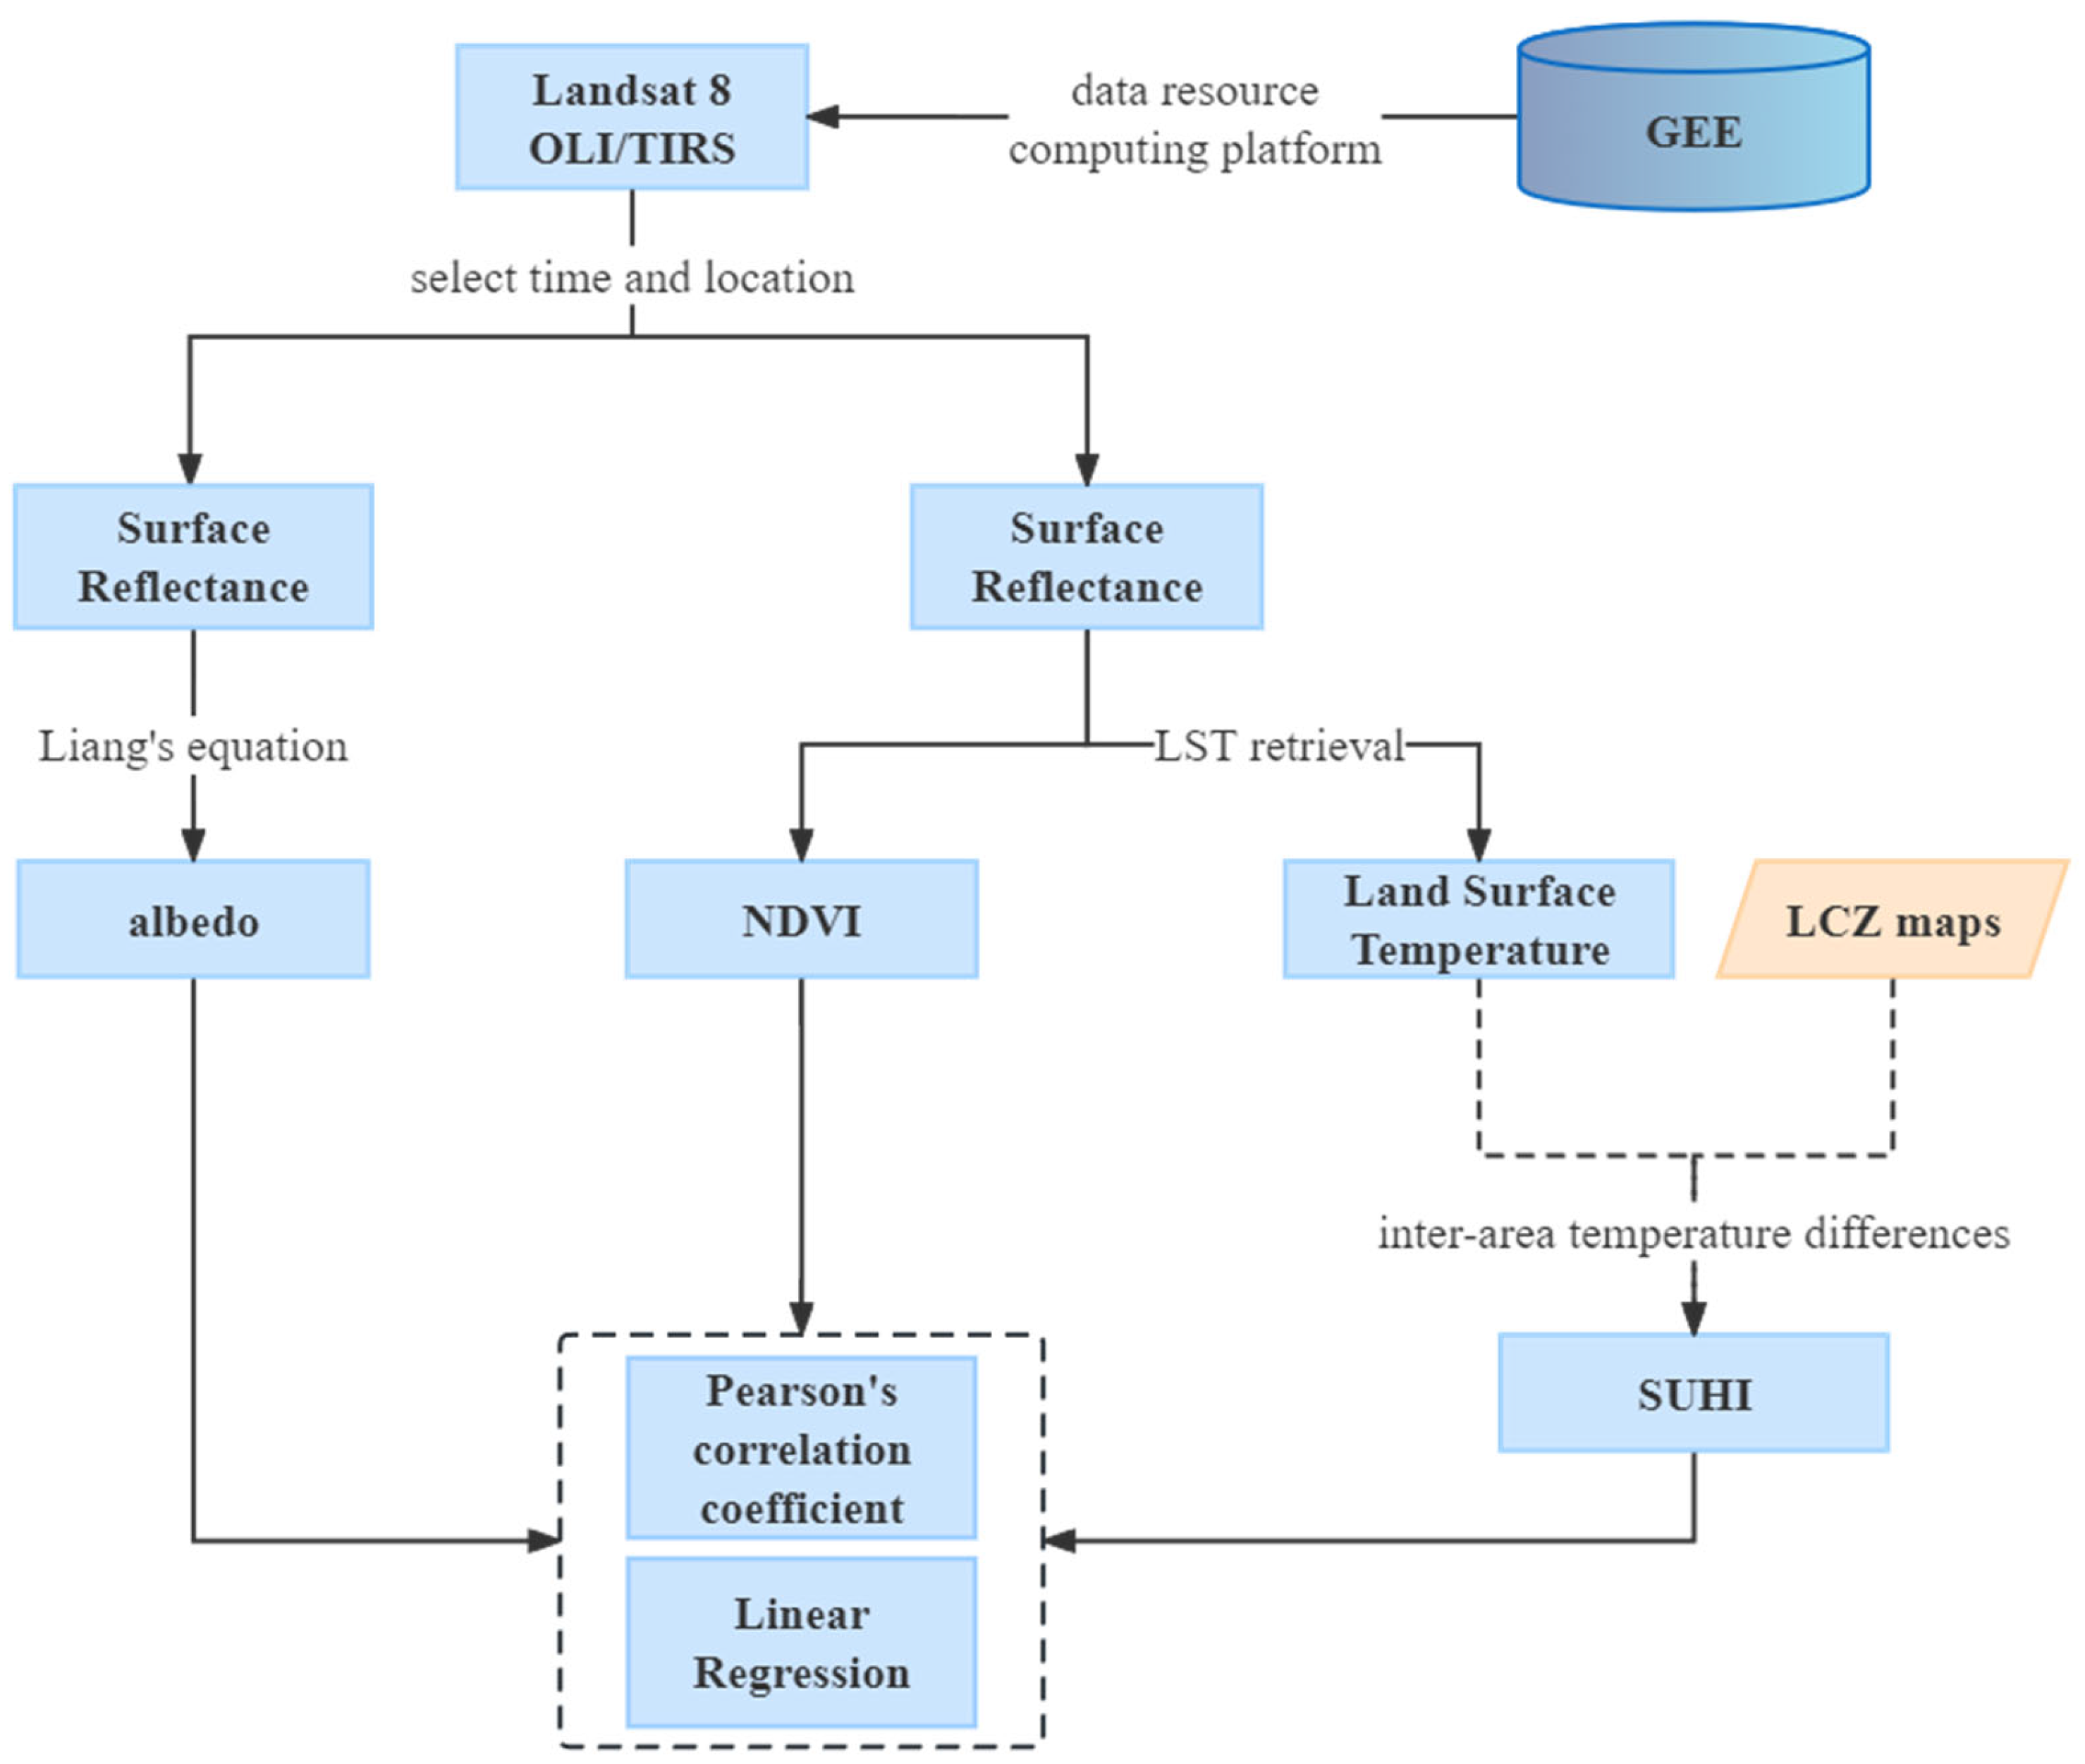
The research work-flow involved the following main technical steps (Figure 3): (1) surface reflectance dataset produced by the Landsat 8 OLI/TIRS sensors was obtained on GEE by selecting the time and place that fit our study; (2) for surface reflectance, Liang’s equation was used to calculate the albedo, and GEE’s built-in products were used to obtain the NDVI and LST; (3) we calculated the SUHI within each LCZ, and then calculated the Pearson correlation coefficient and linear regression coefficient.
2.4. Methodology
2.4.1. Analyze the SUHI in Different LCZs, Cities and Seasons
The SUHI intensity is commonly measured as the difference in surface temperature between downtown and suburban areas [3,8]. LCZ is a new, systematic classification developed to support urban climate research. Because a thermal contrast exists across LCZs, it is reasonable to subdivide the landscape into LCZs for SUHI research. The use of inter-LCZ temperature differences to quantify the SUHI intensity makes the SUHI intensity easier to interpret [41]. The SUHI intensity in this study is defined according to the method proposed by [29] as the difference between the LST value of an LCZ type and the value of LCZ D (low plants). Since the LST of LCZ D exhibits spatial variability as well, its mean value was established as the reference surface temperature for each city and observation period. For a particular LCZ (except LCZ D, which is the reference), the formula for SUHI calculation is as follows:
where is the i-th pixel’s urban heat island intensity on each image. is the ith pixel’s land surface temperature. n is the effective number of pixels of LCZ D for a particular case city.
2.4.2. Estimating Two Main Drivers of SUHI: Albedo and NDVI
Albedo is related to the properties and geometry of surface materials. Increasing the urban albedo reduces the net radiation at the surface, thus mitigating excess heat towards cooling the urban space [42]. The albedo reflects the physical properties of the land cover, and urban areas usually have higher albedo values compared to suburban areas.
To convert the Landsat surface reflectance to albedo, we used the method of [43] to estimate the value of albedo in the following equation:
where is the reflectance in of Landsat 8/OLI.
The Normalized Difference Vegetation Index (NDVI) is an indicator of vegetation greenness [44]. Due to its simplicity and robustness, the NDVI is the most commonly used indicator of vegetation conditions and has therefore long been used as a primary proxy variable to assess the potential of vegetation for urban cooling [45]. The NDVI is defined as
where and are the near-infrared (NIR) and red bands of Landsat 8/OLI, respectively.
2.4.3. Statistical Analysis of the Cooling Effects in Different LCZs
In the present study, Pearson’s correlation coefficient was used to calculate the seasonal correlation of the SUHI with the NDVI and albedo. This provided an indicator of the effect of the NDVI or albedo on the SUHI in different seasons. We then calculated the regression coefficients of the NDVI or albedo on the SUHI within each LCZ using single-factor linear regression. The main objective of our analysis was to estimate one of the two variables of interest from the other one. First, we divided the value fields of albedo and NDVI into 20 equally spaced bins. Subsequently, the mean values within each bin were calculated to match the corresponding mean SUHI. We generated scatter plots based on the data pairs of SUHI versus NDVI or albedo for each LCZ, in order to facilitate the observation of trends in the cooling capacity of the NDVI or albedo within different LCZs. The formula for Pearson’s correlation coefficient is as follows:
where r is the Pearson correlation coefficient. is the covariance of variables and . and are the standard deviations of and , respectively. In this section, and are the SUHI intensity value and NDVI value or albedo value, respectively.
3. Results
3.1. Seasonal SUHI Intensity within Different LCZs of Different Cities
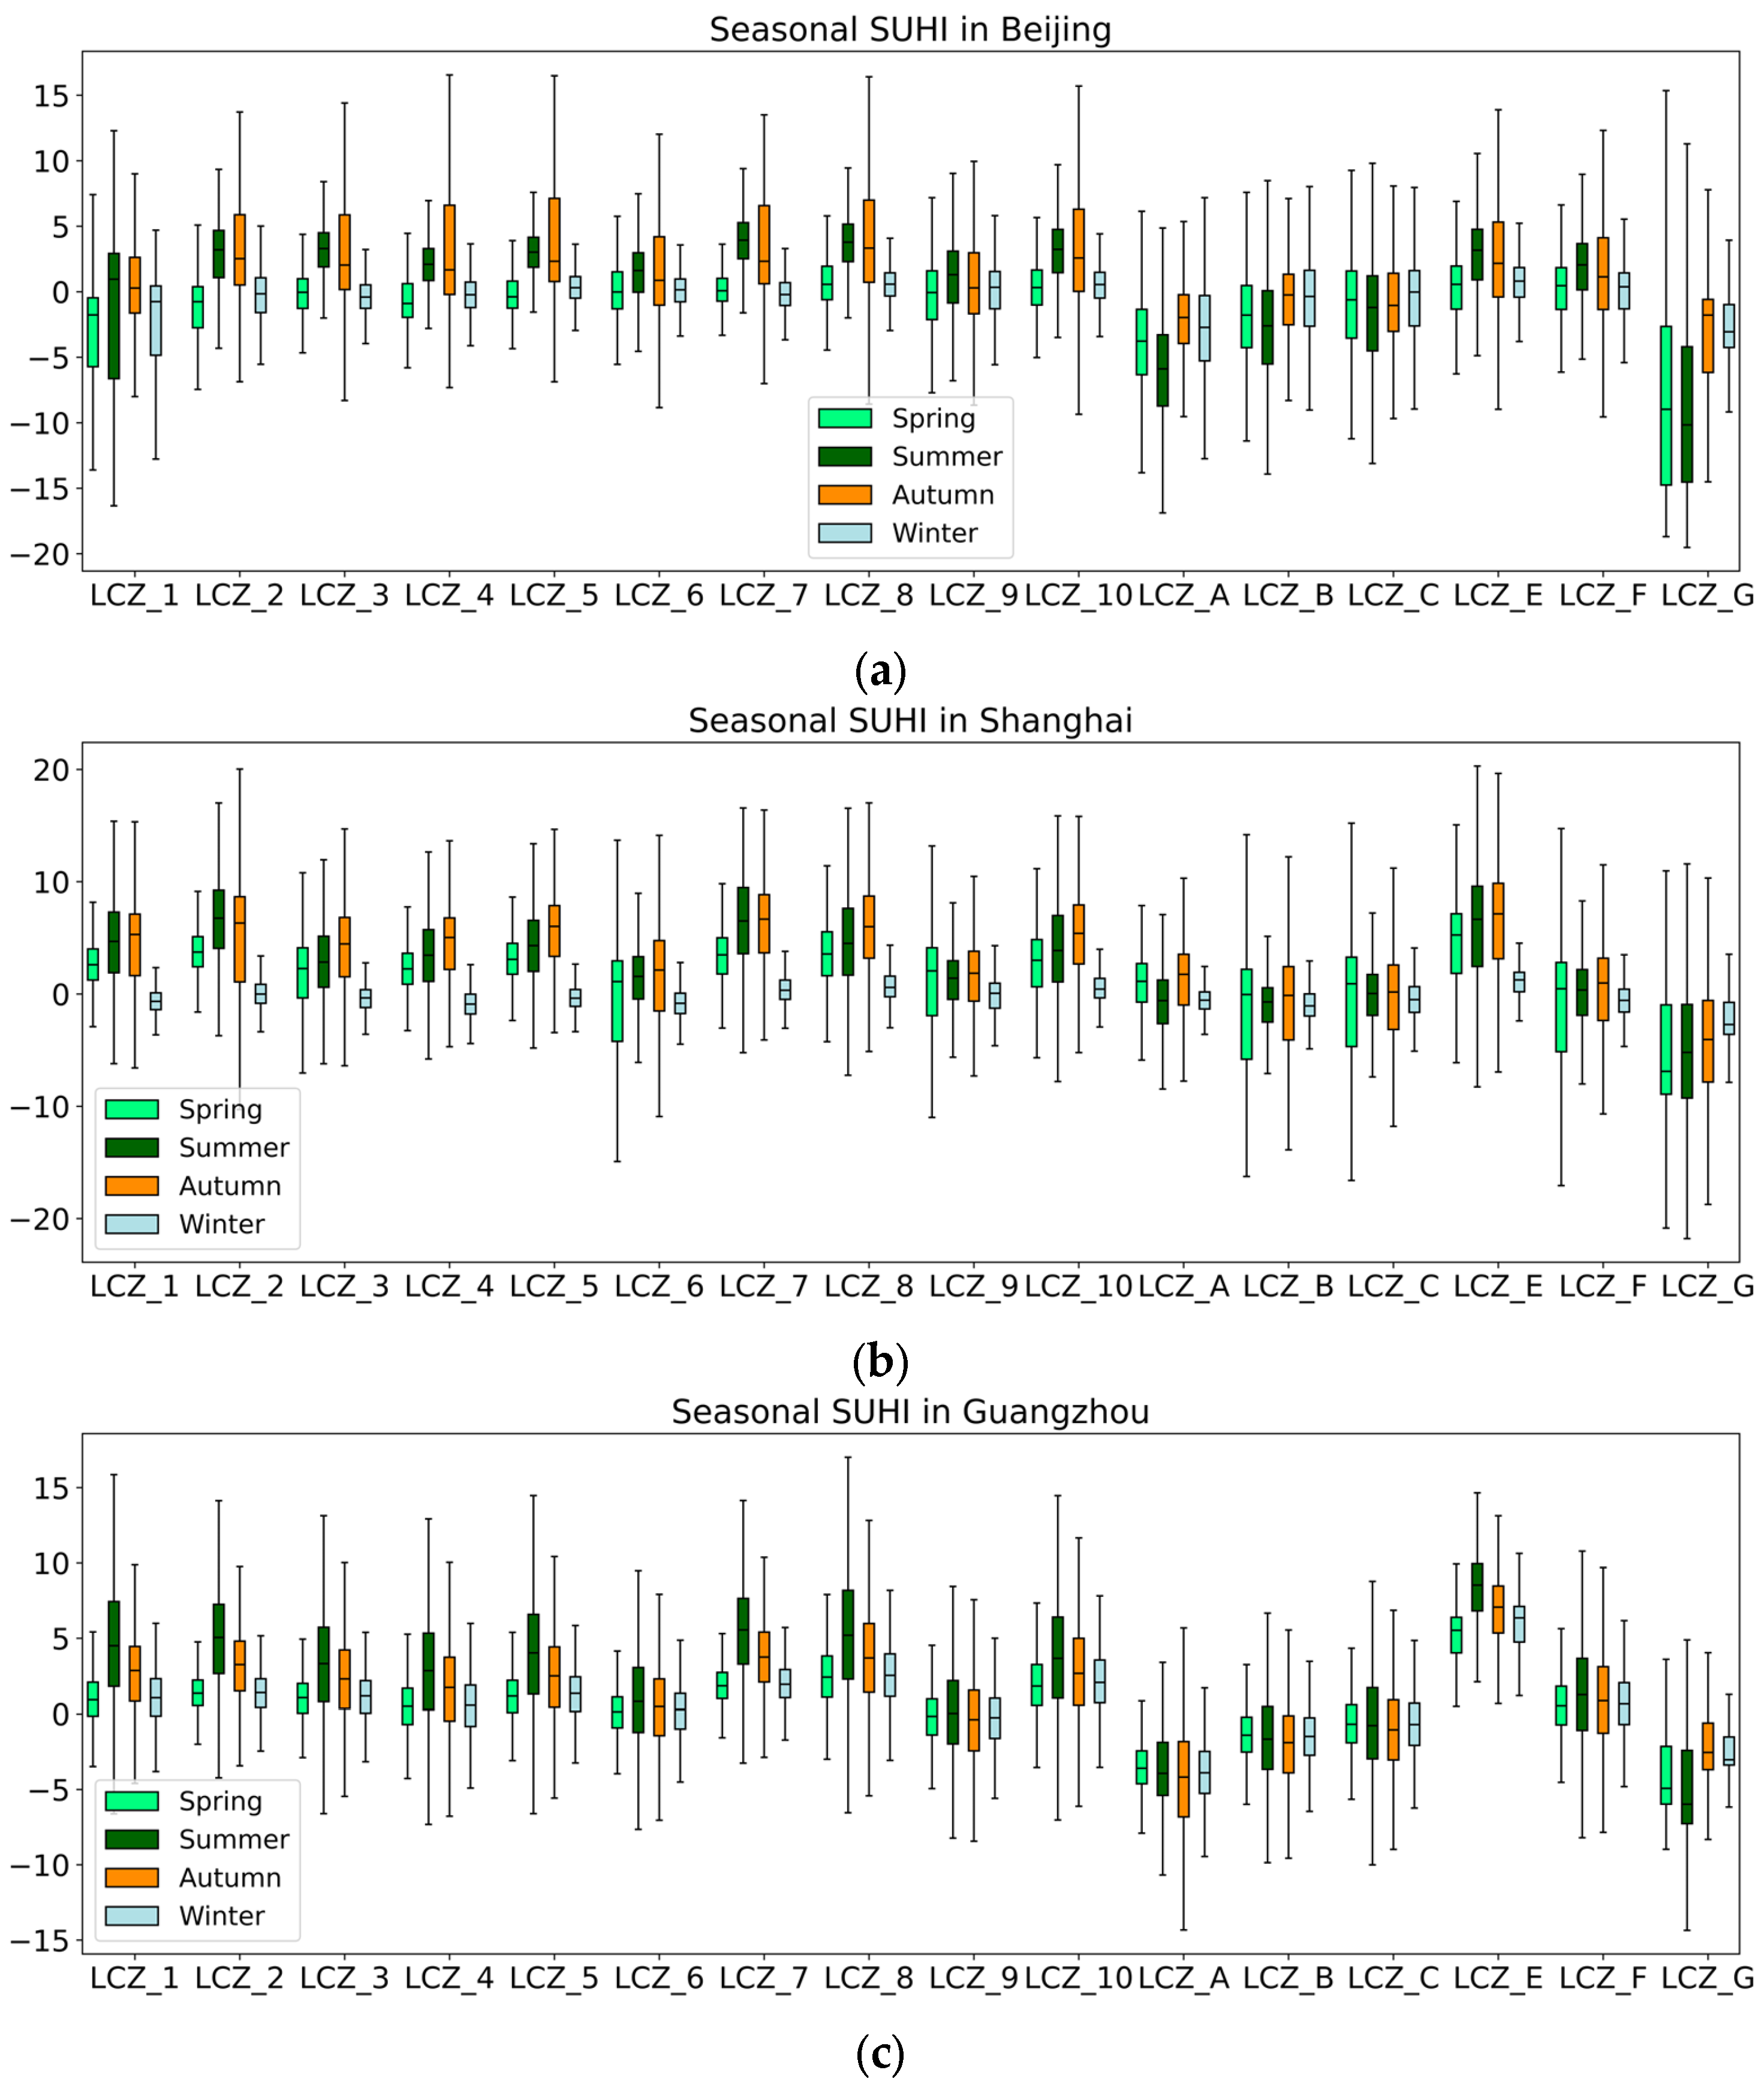
The distribution of the SUHI values for 17 classes in four seasons in the three megacities clearly illustrates the variability across the LCZs in the three megacities (Figure 4a–c). By definition, the SUHI intensity of LCZ D is zero, so the SUHI of LCZ D is not shown in the box plots. In general, the SUHI varies greatly within the different LCZs, whether observed from the perspective of different seasons or from the perspective of different locations.
From the perspective of different LCZs, the overall trend of the SUHI in the LCZs of the three cities is similar. The SUHI of all built-up classes (LCZ 1-10) is significantly higher than the SUHI in the natural classes LCZ A, LCZ B, and LCZ C. Among all natural classes of LCZ in the studied cities, the SUHI of LCZ E (bare rock or paved) is significantly higher than the other types, and LCZ G (water) has the lowest SUHI value among all LCZs, as expected. In the comparison between LCZs in the same city and in the same season, Guangzhou has the largest SUHI intensity in the summer median SUHI, which reaches 8.5 °C and occurs in LCZ E (Figure 4c). Beijing has the smallest SUHI intensity in summer, with the median SUHI being only −10.2 °C, which occurs in LCZ G (Figure 4a).
Seasonal changes in the SUHI in different cities and LCZs were large. In Guangzhou, the summer SUHI intensity was consistently the highest across all LCZ types. However, high values of the SUHI intensity in Shanghai were observed in both summer and autumn, with a rapid decrease in winter (Figure 4b). Beijing had the largest SUHI range of 10.2 °C compared to the other two cities. Shanghai and Guangzhou had SUHI ranges of 8.2 °C and 4.2 °C, respectively. The highest SUHI intensity in Beijing was observed in autumn in the vast majority of LCZs (Figure 4a). In Beijing, the maximum variability in the seasonal SUHI intensity within the same LCZ was 8.4 °C in LCZ G, which was the global maximum (Figure 4a), while the minimum was 1.2 °C in LCZ C. In Shanghai, the maximum variability in seasonal SUHI intensity within the same LCZ was 6.8 °C in LCZ 2, while the minimum was 1.0 °C in LCZ B (Figure 4b). In Guangzhou, the maximum variability in seasonal SUHI within the same LCZ was 3.7 °C in LCZ 7, and the minimum was 0.4 °C in LCZ 6, which was the global minimum (Figure 4c).
3.2. Factors Driving Seasonal Changes in SUHI Intensity
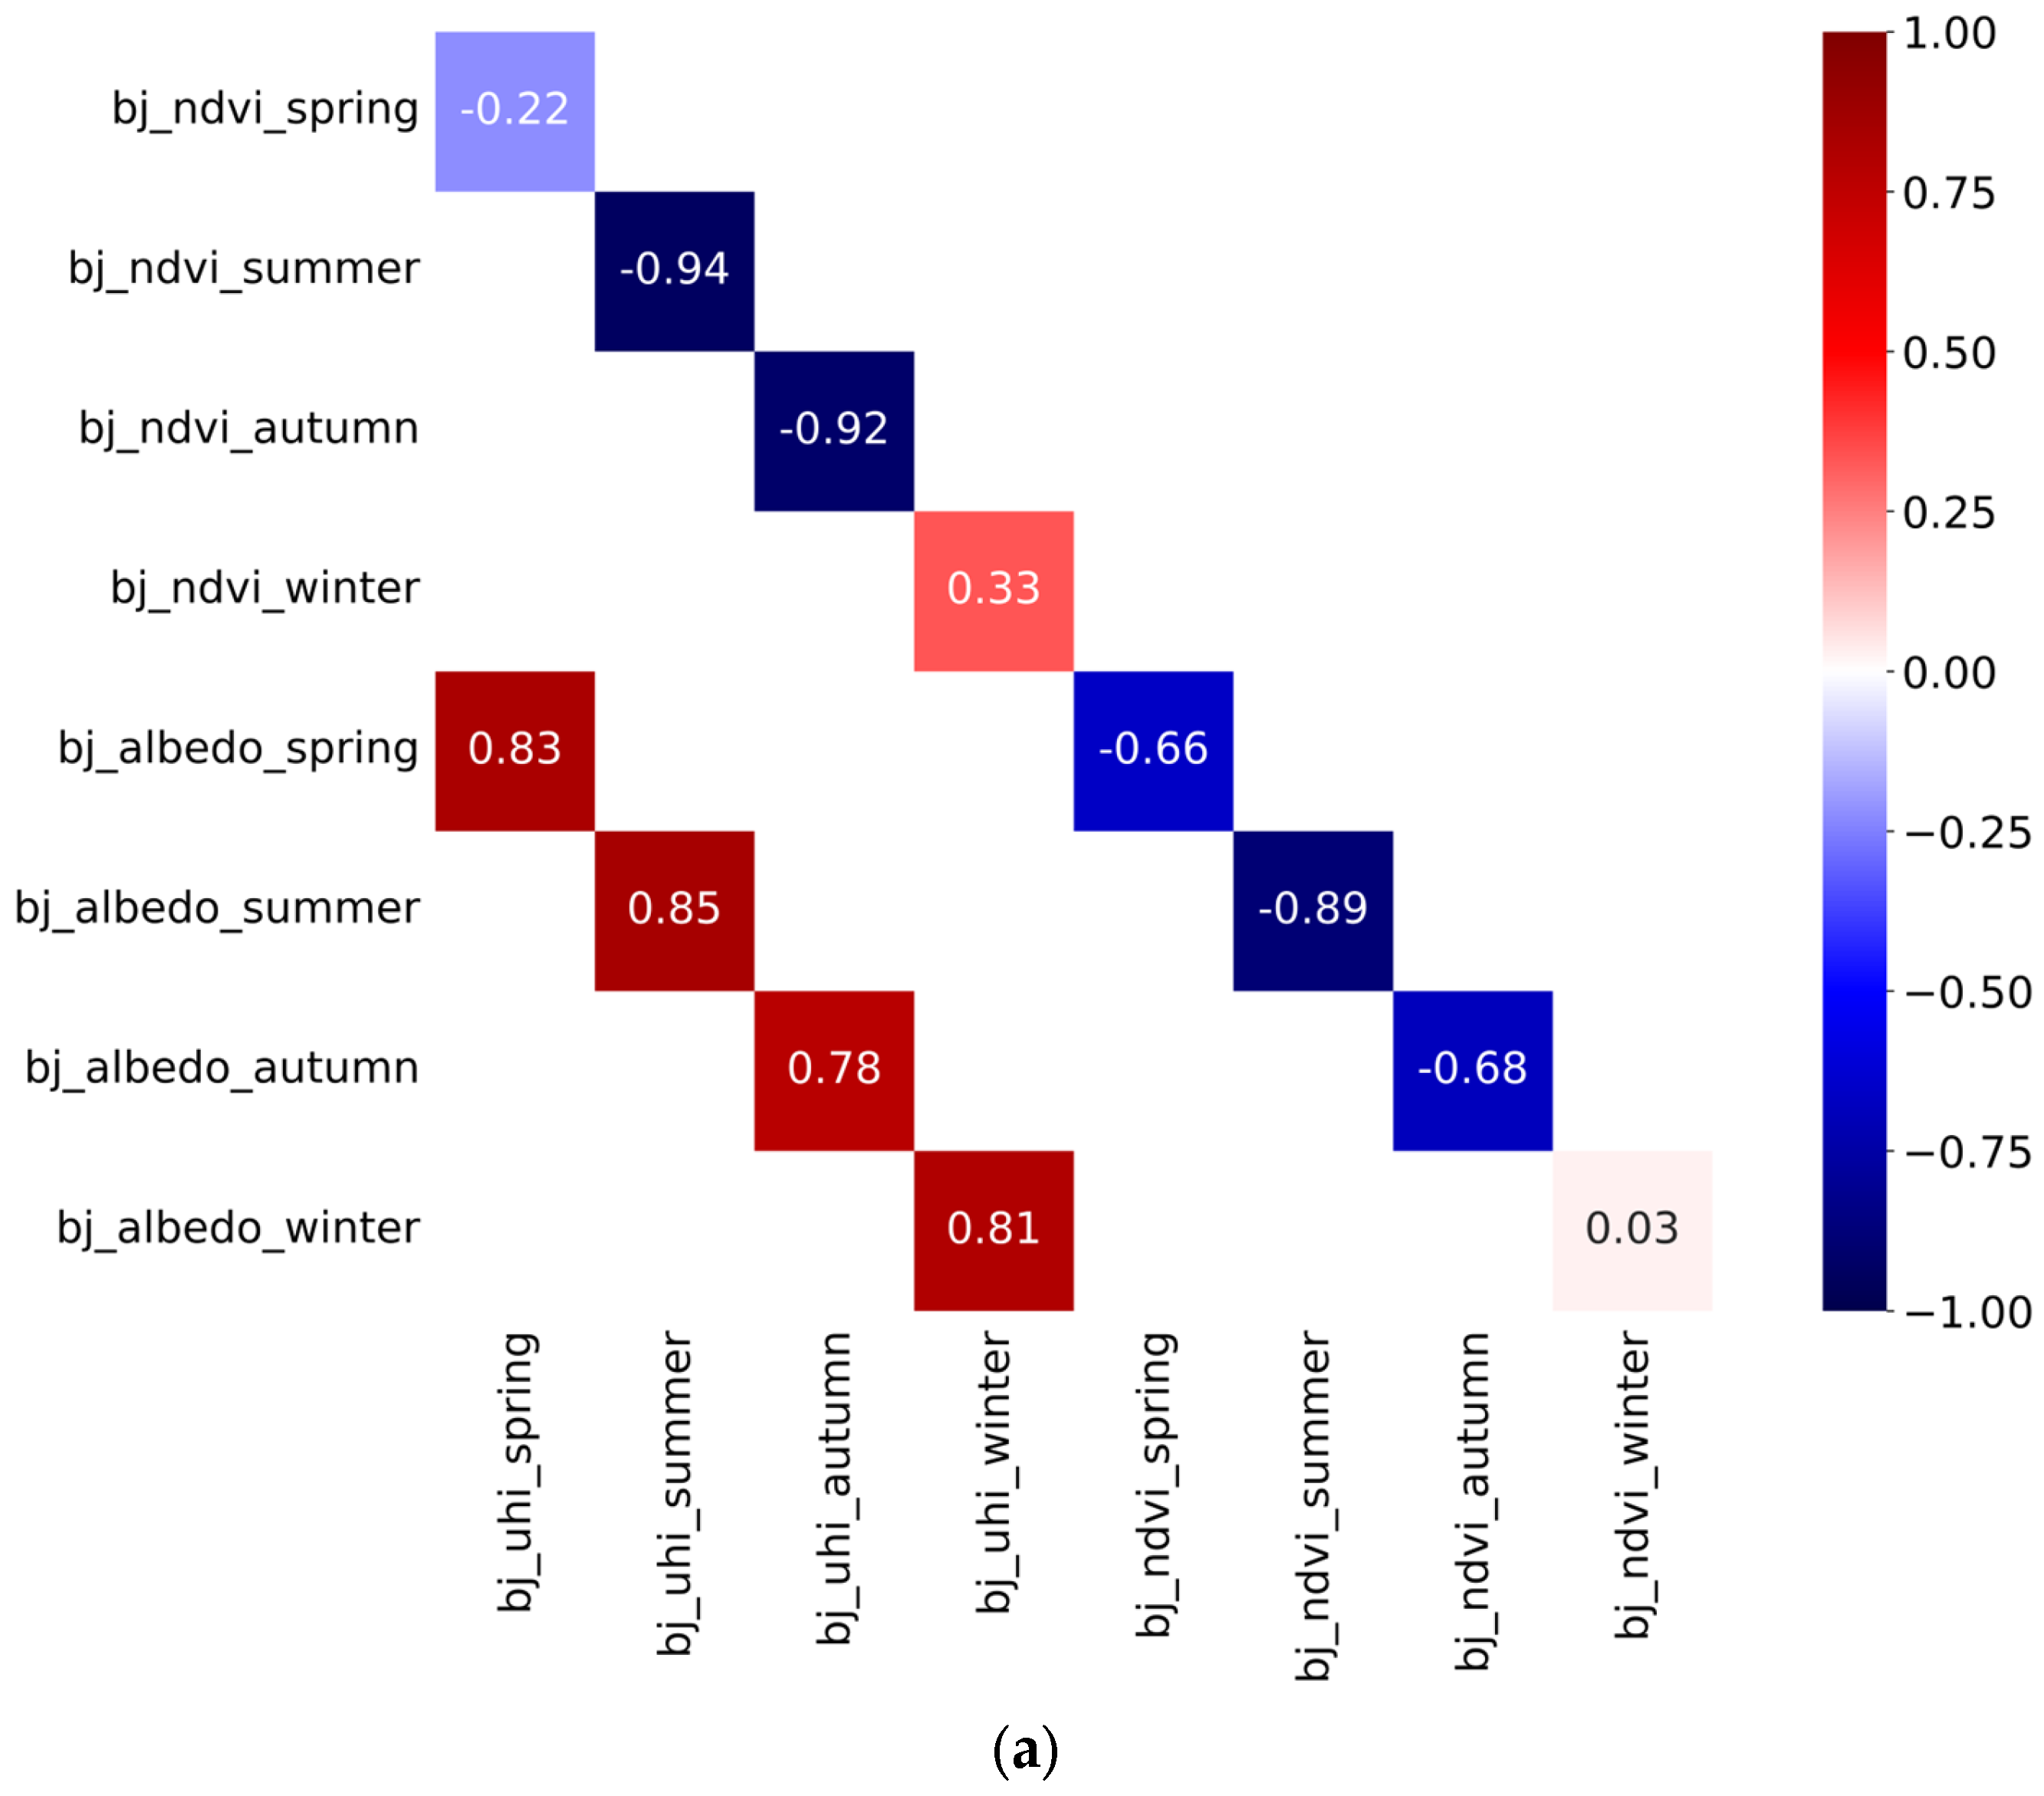
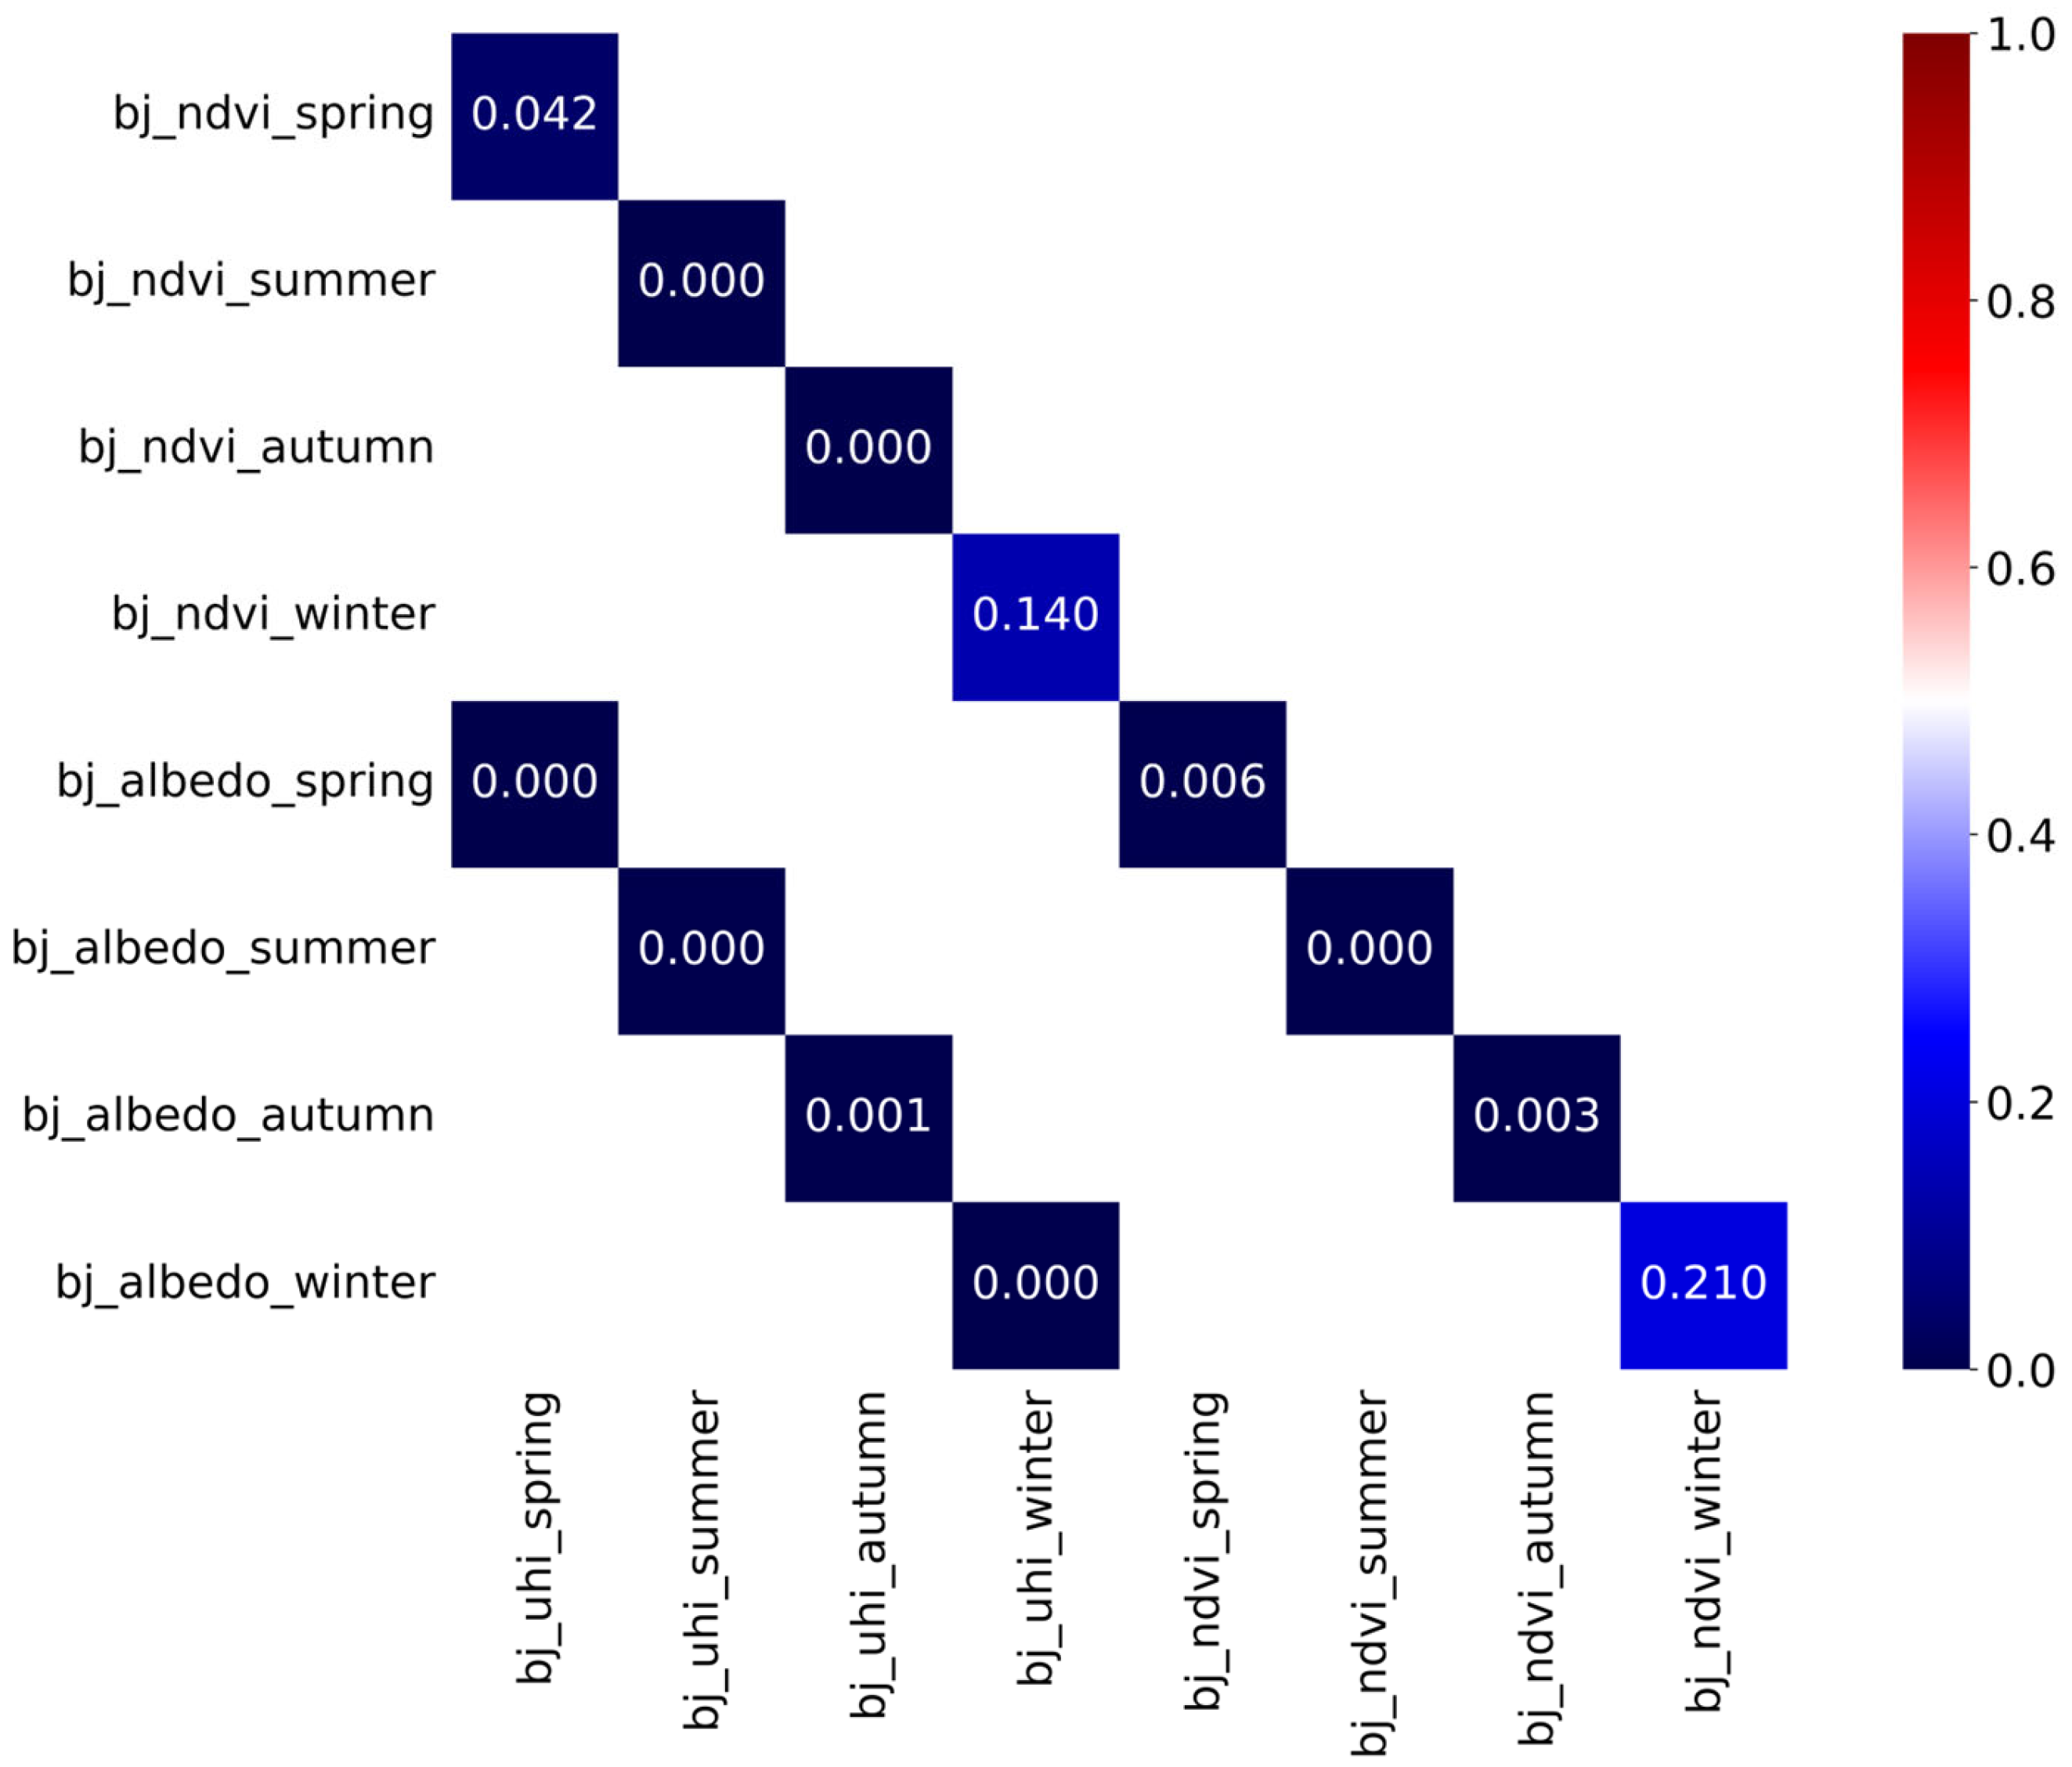
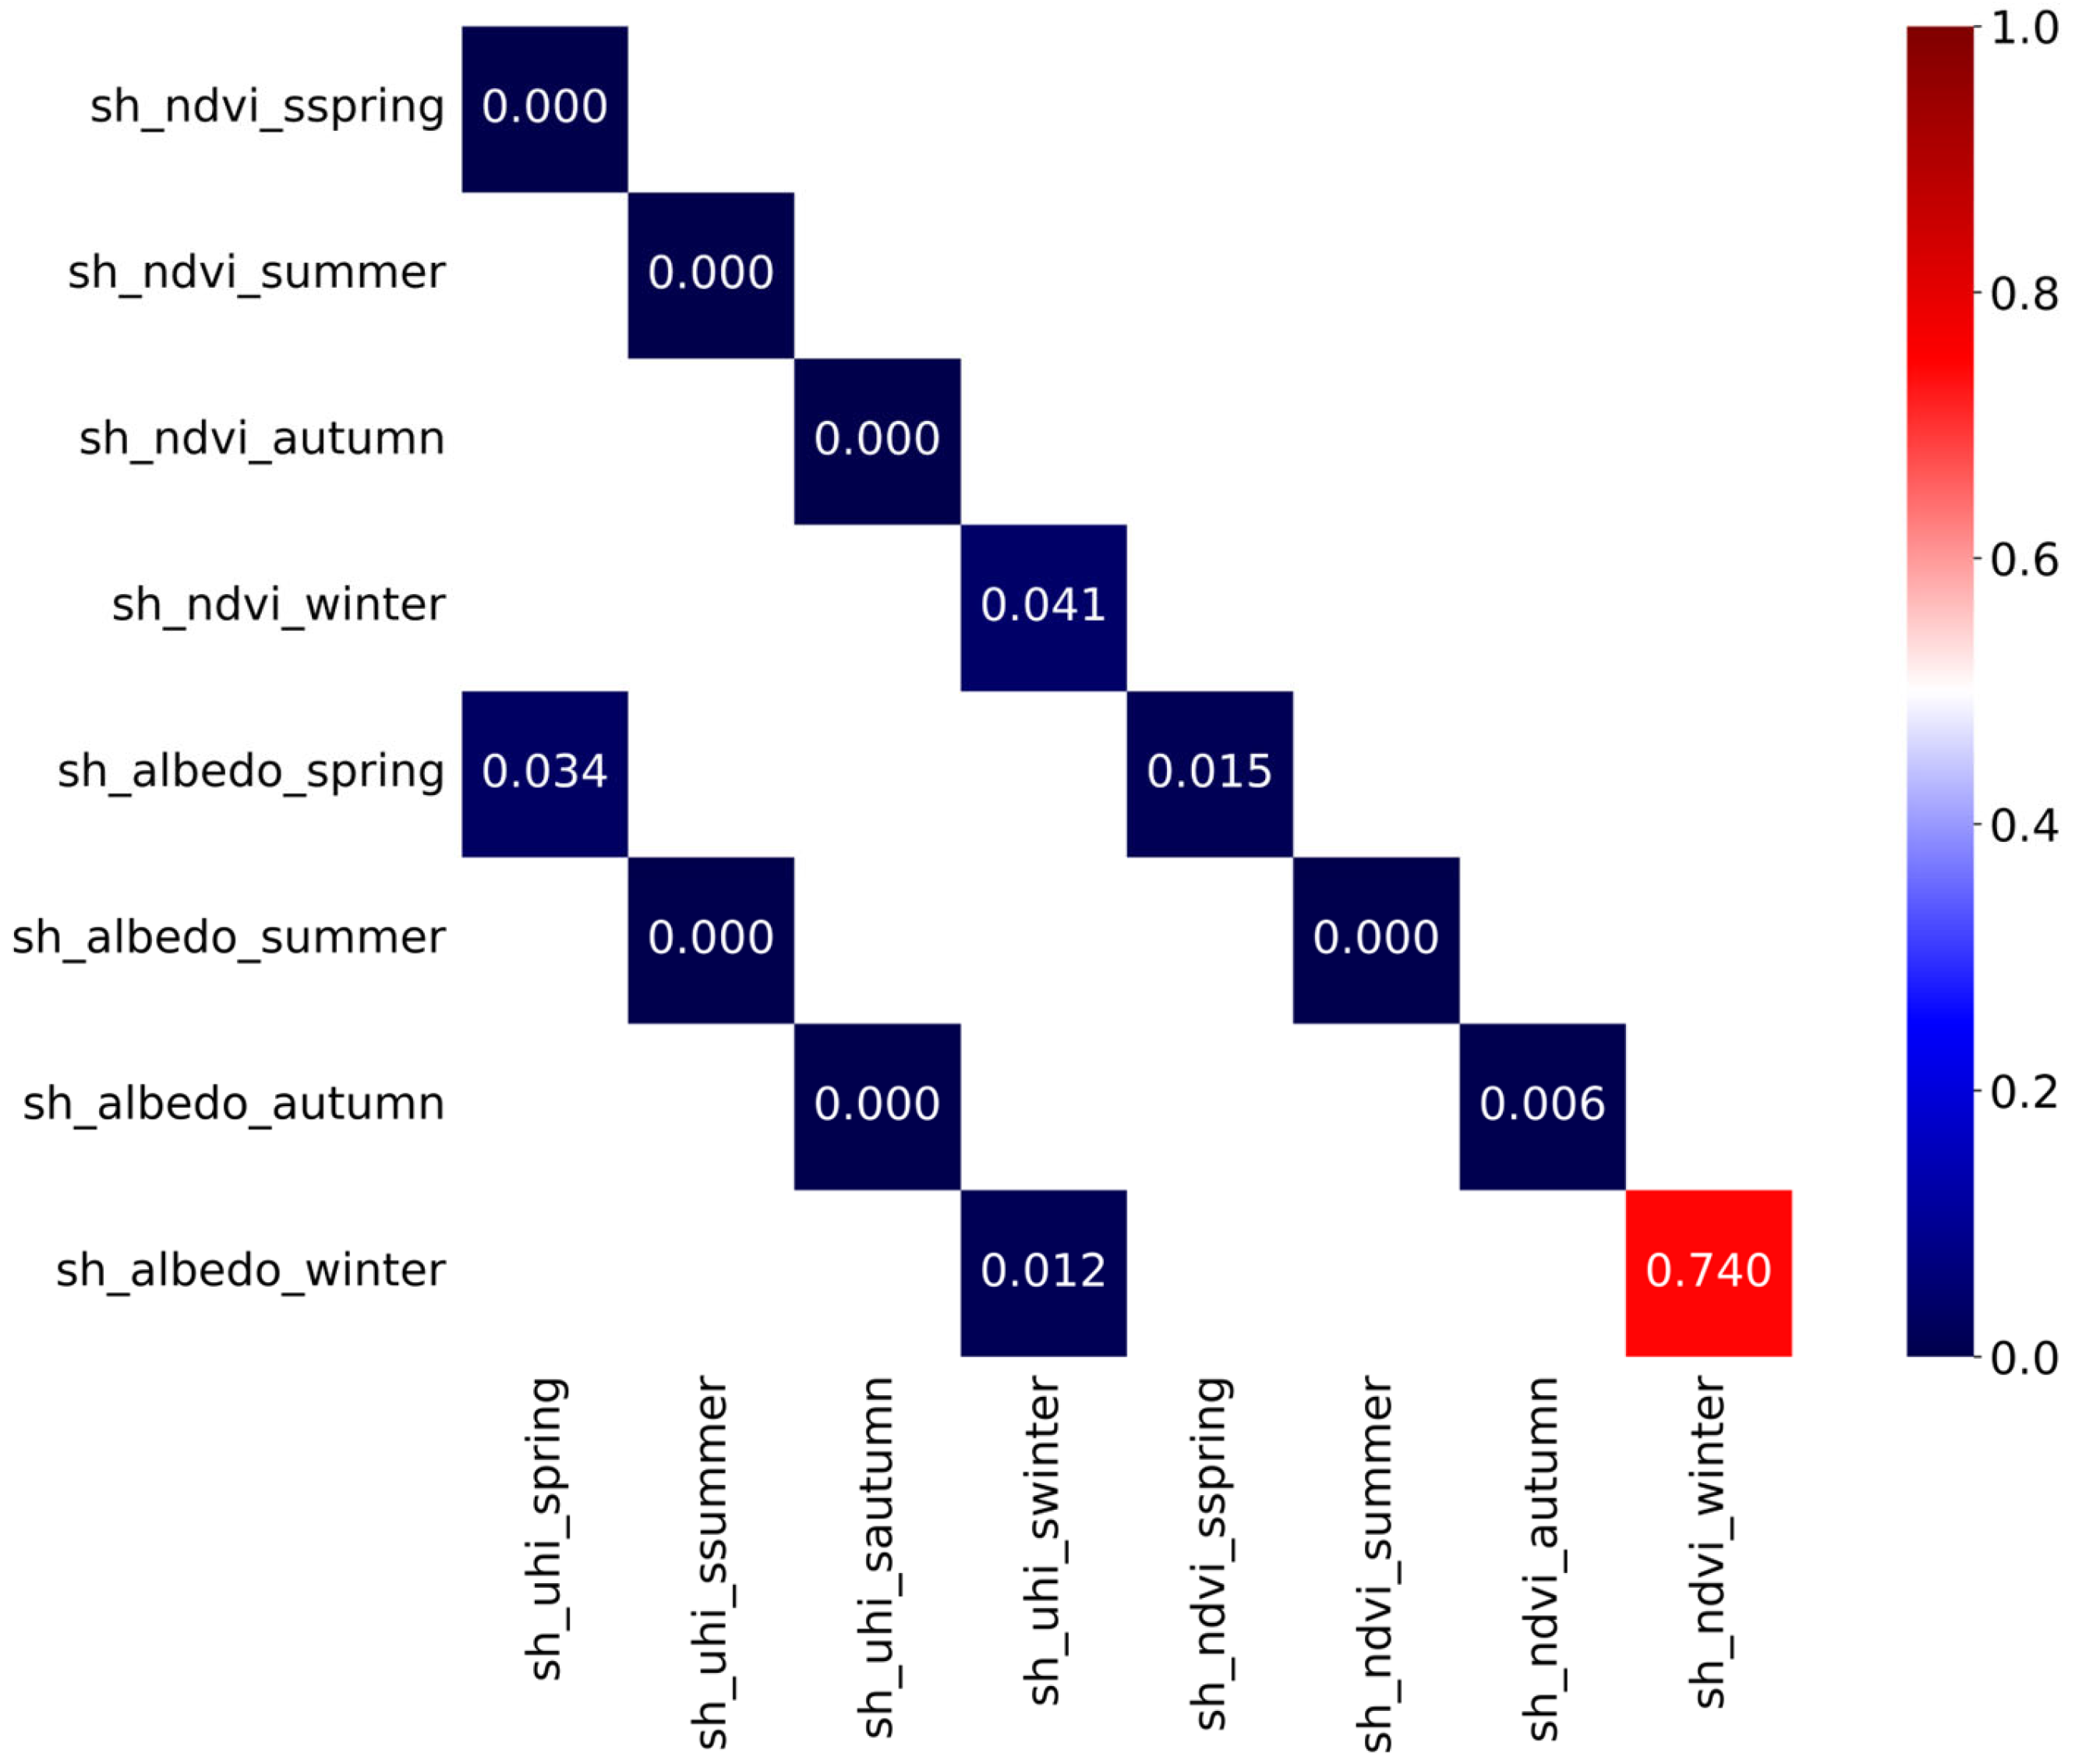
Increasing the number of urban green spaces and popularizing high-albedo materials are effective measures to mitigate UHI [46]. Albedo determines the net shortwave radiation at urban facets, i.e., the main contribution to the energy that must be dissipated, which is reduced by high-albedo urban materials. Surface irradiance, and thus net radiation, is higher in summer, and we attempted to evaluate the effectiveness of high-albedo materials to mitigate the heat load in the urban space, in line with the findings of [47]. On the other hand, the NDVI is a widely used indicator of vegetation cover and conditions. Transpiration by vegetation uses a significant fraction of net radiation, thus reducing excess heat and contributing to cooling the urban space. Shading in green areas containing large numbers of trees also contributes to reducing net radiation at the surface, thus also contributing to reducing excess heat [48]. To explore how albedo and the NDVI seasonally affected the SUHI intensity, we evaluated the contributions of multiple features to SUHI mitigation by applying the Pearson correlation coefficient as a metric. Specifically, we correlated the SUHI intensity with the NDVI and albedo in each city and in different seasons (Figure 5a–c). The corresponding p-values are shown in Figure A1, Figure A2 and Figure A3. In addition to the SUHI versus NDVI and NDVI versus albedo in winter in Beijing, and the NDVI versus albedo winter in Shanghai, all computed p-values were found to be less than 0.05 (significance level set at 0.05). This suggests that we have sufficient evidence to reject the null hypothesis and support the alternative hypothesis, indicating a statistically significant correlation between variables.
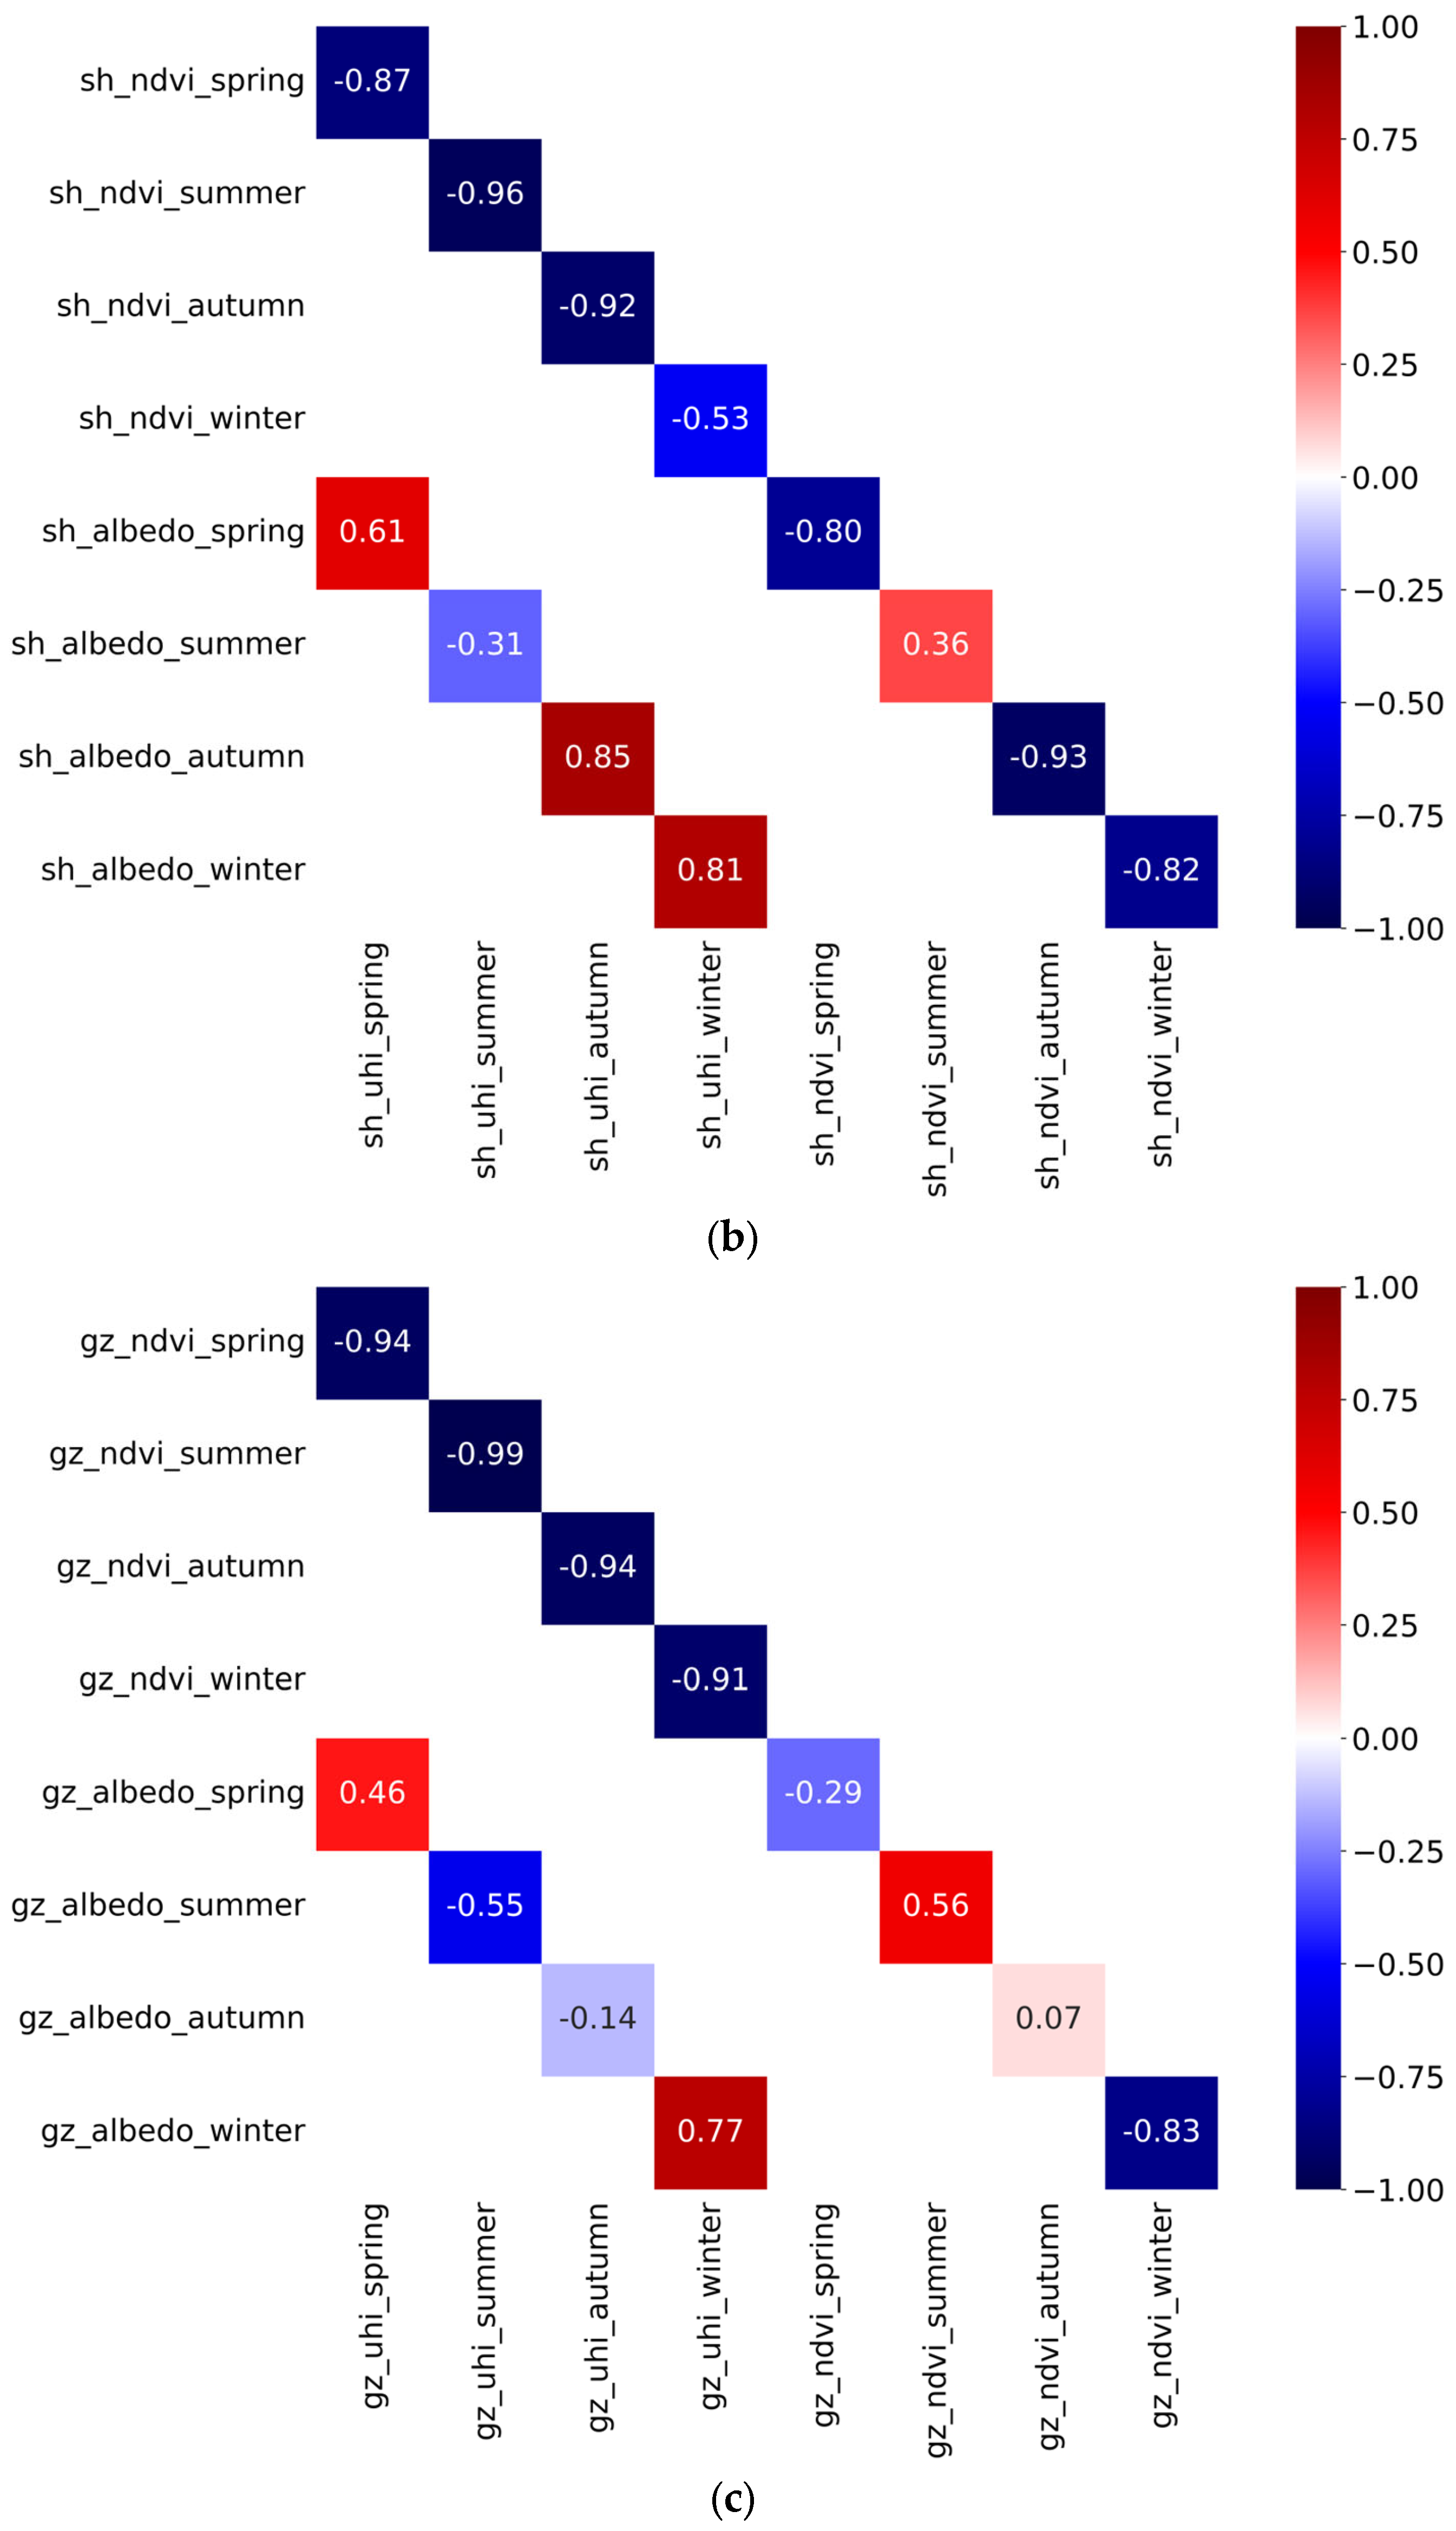
The three megacities of Beijing, Shanghai, and Guangzhou are located from north to south. The climate determines the seasonality of vegetation, leading to differences in the NDVI in different seasons. Although the NDVI and SUHI are generally negatively correlated in the three cities, the seasonality of this negative correlation varies from city to city. The vegetation type in Guangzhou is mostly evergreen broad-leaved forest [49], and the NDVI remains high in every season compared to the other two cities. Therefore, the NDVI shows a strong negative correlation with the SUHI throughout the year, with correlation coefficients reaching −0.91 to −0.99 (Figure 5c). This means that the NDVI contributes to cooling throughout the year in Guangzhou. The natural vegetation of Shanghai consists mainly of evergreen broadleaf forest, mixed broadleaf forest, and wetland vegetation [50]. This produces seasonal changes in Shanghai, i.e., the vegetation is not as stable as in Guangzhou. In particular, in Shanghai, the correlation between the NDVI and SUHI was significantly weaker in winter. From spring to autumn, the value of the correlation coefficient ranged from −0.87 to −0.96, while, in winter, this value was only −0.53 (Figure 5b). The zonal vegetation of Beijing is a temperate deciduous broad-leaved forest with temperate coniferous forests [51]. Compared to the former two, this vegetation type will be sparser and more prone to deciduousness in the autumn and winter. Figure 5a shows that the negative correlation between NDVI and SUHI in spring and winter is quite weak, or it even shows a positive correlation. The correlation coefficient between the NDVI and SUHI was −0.94 and −0.92 in summer and autumn, respectively, while, in spring, it was only −0.22. In winter, the correlation coefficient was positive at 0.33. From the standpoint of the life cycle of plants, the precipitation and temperatures in summer are more suitable for plants to thrive. With this comes an increase in plant stomatal conductivity and enhanced transpiration [52]. This means that more energy is converted into latent heat to lower the land surface temperature.
We can also see in Figure 5a–c that the correlation between the albedo and SUHI varies by city and by season. Changes in urban morphology and changes in the physical properties of the ground surface within each LCZ result in seasonal differences in albedo, especially in the ground surface. Guangzhou shows a negative correlation between albedo and the SUHI in summer and autumn. Among them, the correlation coefficient in summer reaches −0.55, which is the lowest correlation coefficient of albedo against the SUHI, whereas, in spring and winter, the correlation coefficients were positive, i.e., 0.46 and 0.77, respectively (Figure 5c). In Shanghai, only in the summer months, the albedo was negatively correlated with the SUHI, while the correlation was positive in all other seasons. In spring, autumn, and winter, the correlation coefficient of the SUHI with albedo ranged from 0.61 to 0.85. In summer, this value was −0.31 (Figure 5b). In Beijing, the SUHI intensity was positively correlated with albedo throughout the year, with correlation coefficients ranging from 0.78 to 0.85 over the course of a full year (Figure 5a).
The relationship between the NDVI and albedo is also of interest from an auxiliary perspective. The correlation coefficients between albedo and the NDVI in summer and autumn in Guangzhou were 0.56 and 0.07, respectively (Figure 5c). The correlation coefficient of albedo and the NDVI in Shanghai was also positive only in summer, with a value of 0.36 (Figure 5b). The rest of the cities and seasons showed a negative correlation, which is consistent with the results described in the previous paragraph (Figure 5a–c). The overall results, however, do not capture the possible influence of albedo within each LCZ. For example, skyscrapers tend to produce large shaded areas, which have a greater impact on the calculation of albedo in urban areas. Therefore, in the next section, we will calculate the regression coefficient of the SUHI versus albedo and present a scatter plot of the distribution of albedo, to further explore the cooling effect of albedo.
3.3. Analysis of the Importance of NDVI and Albedo in Mitigating SUHI
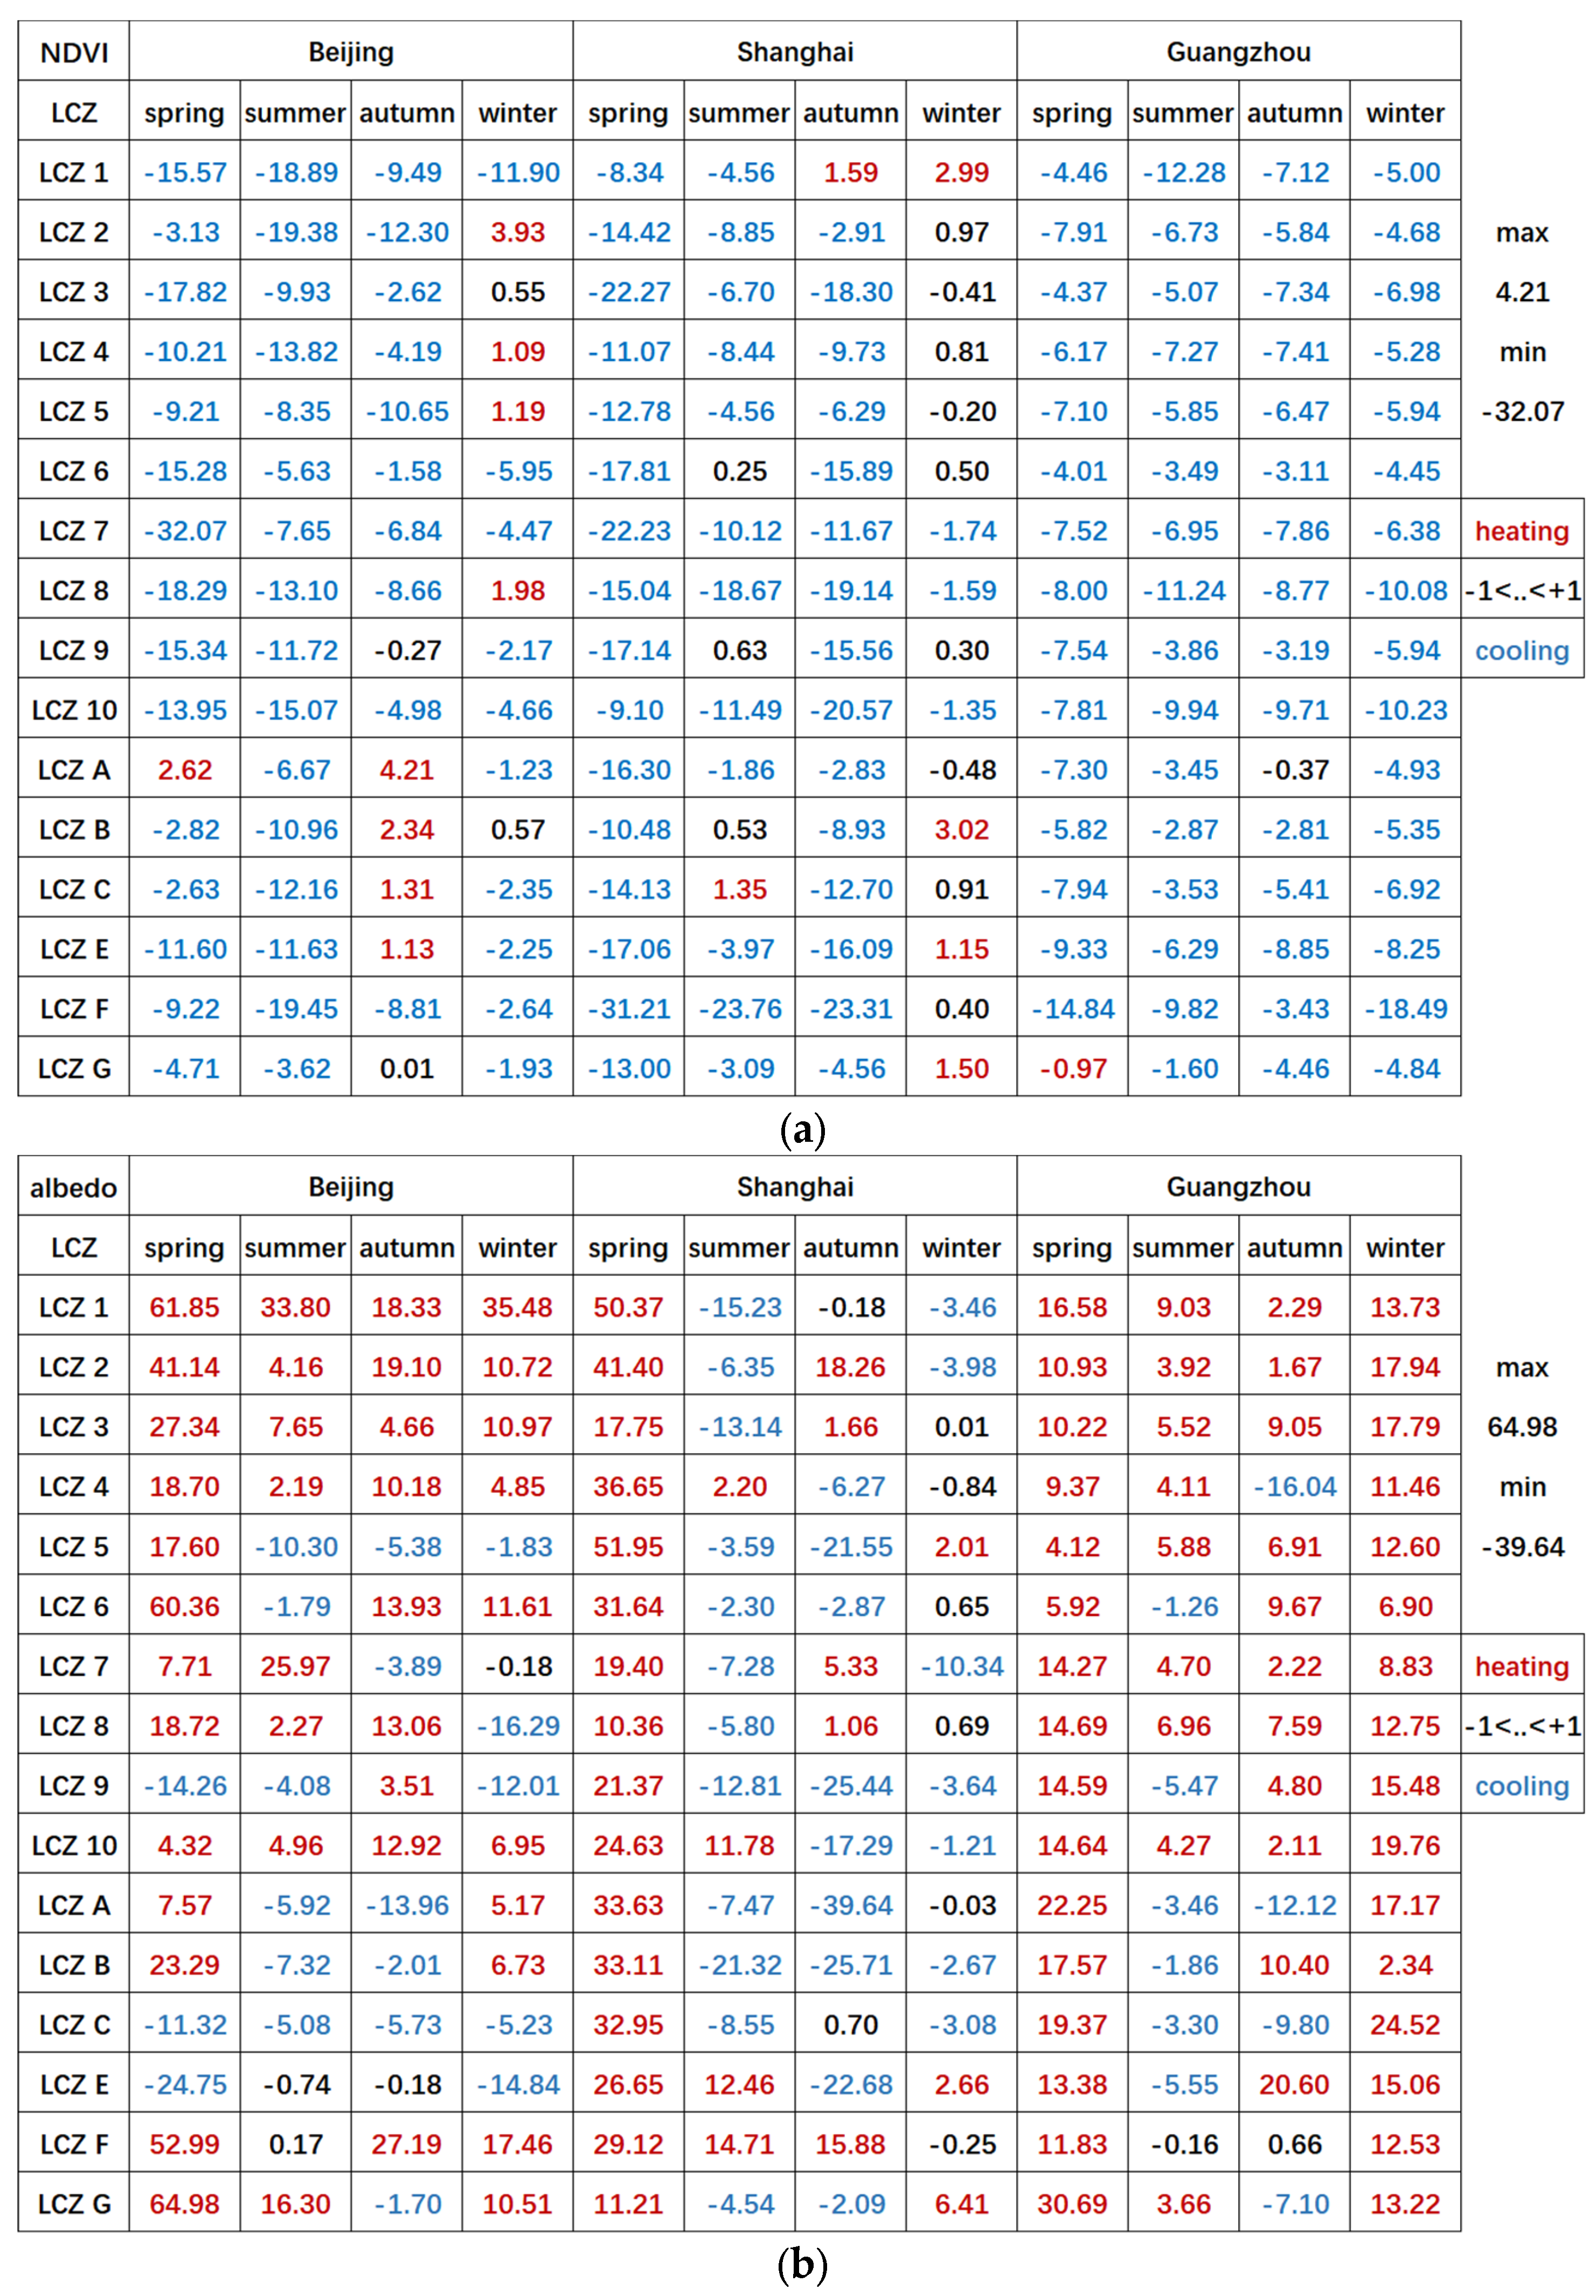
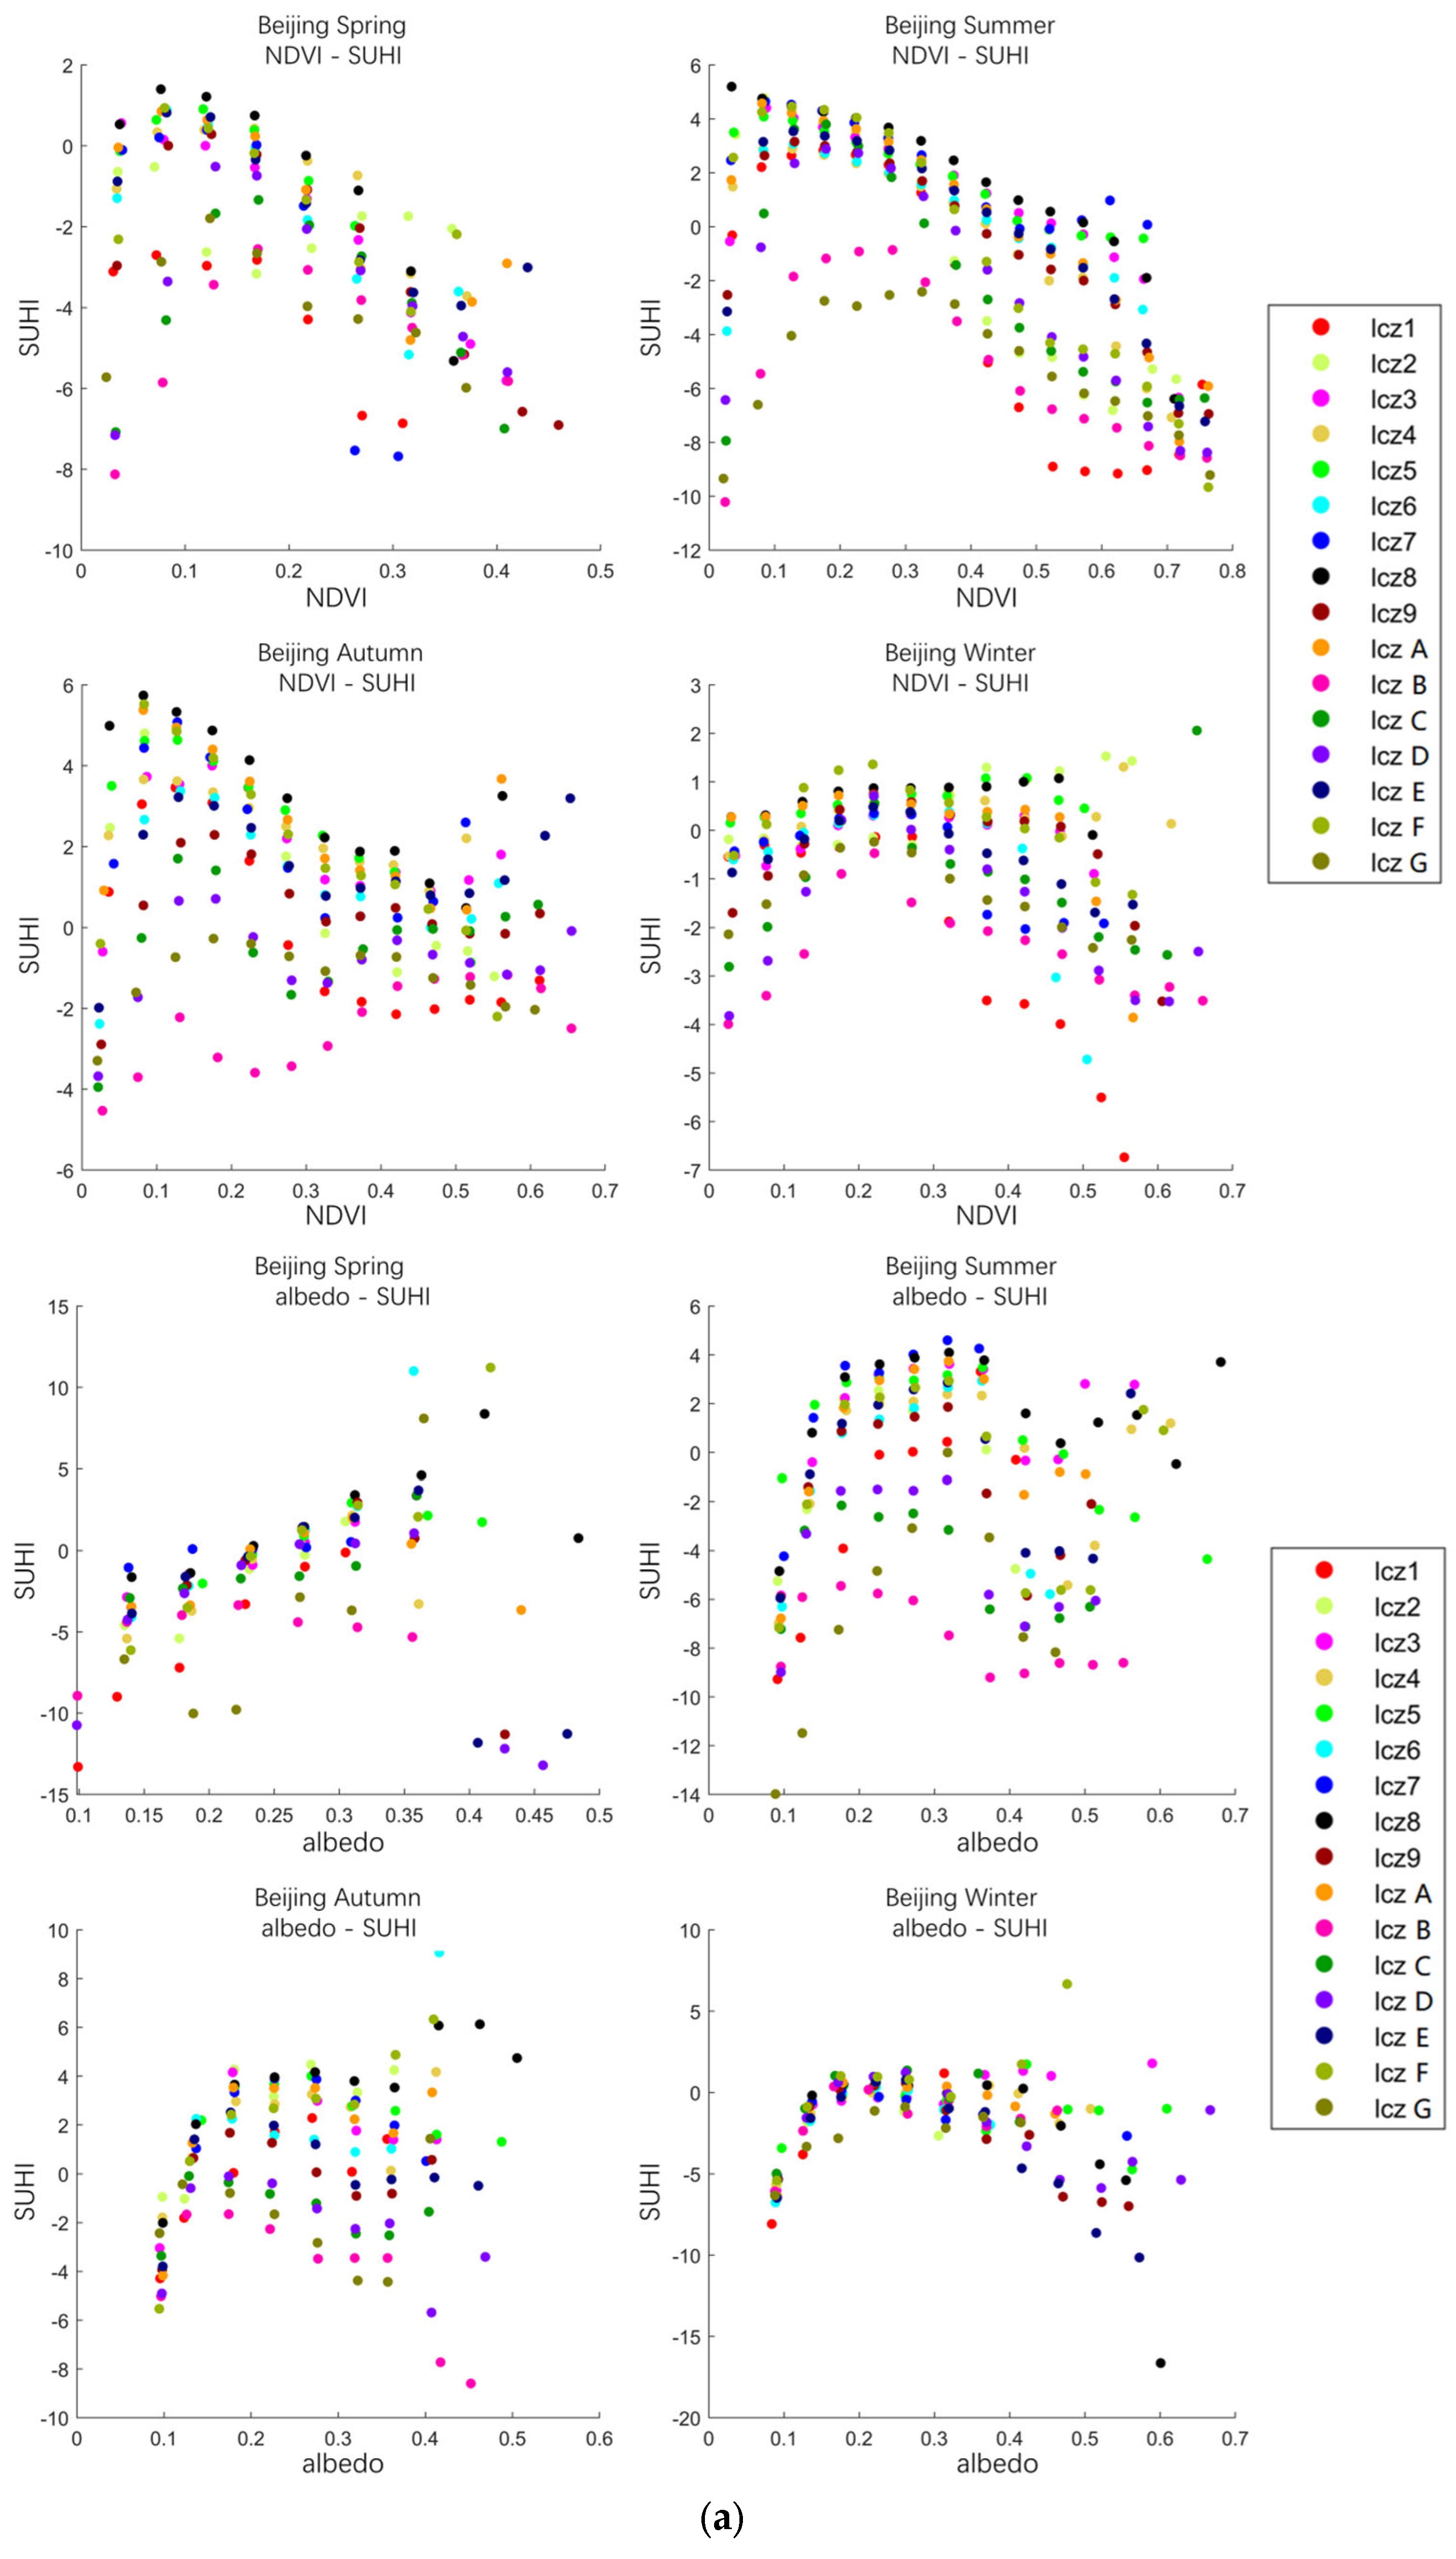
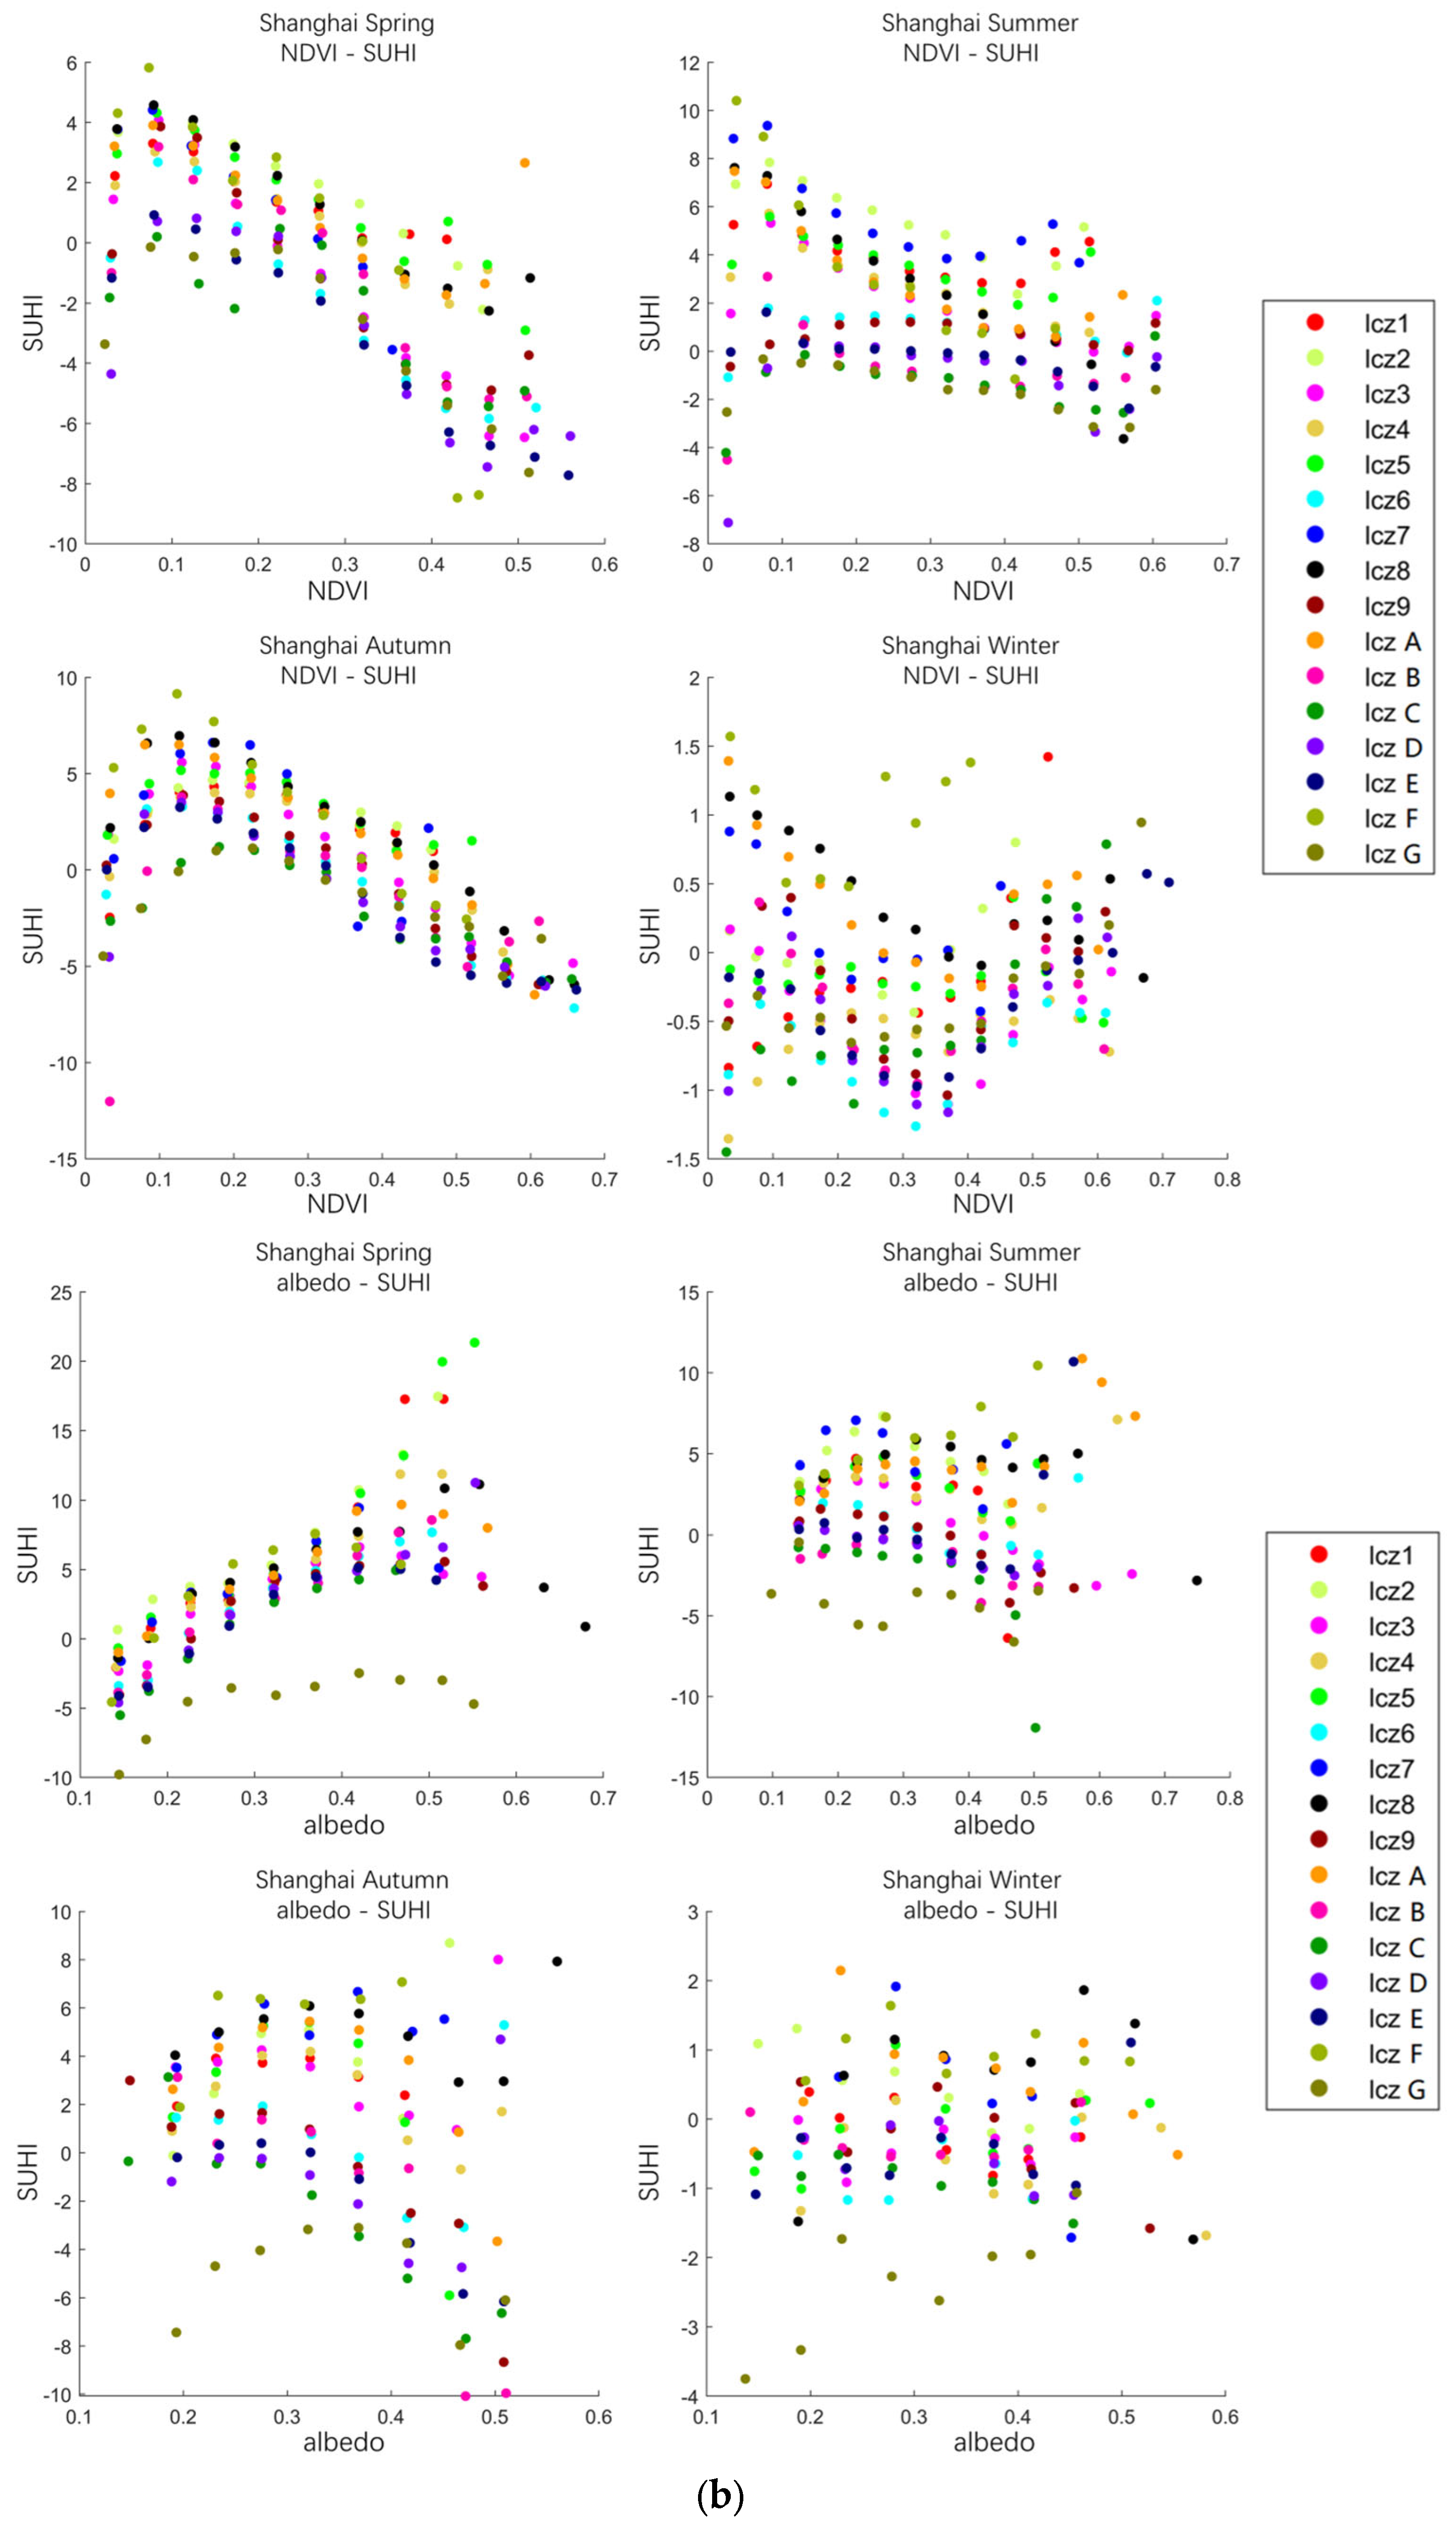
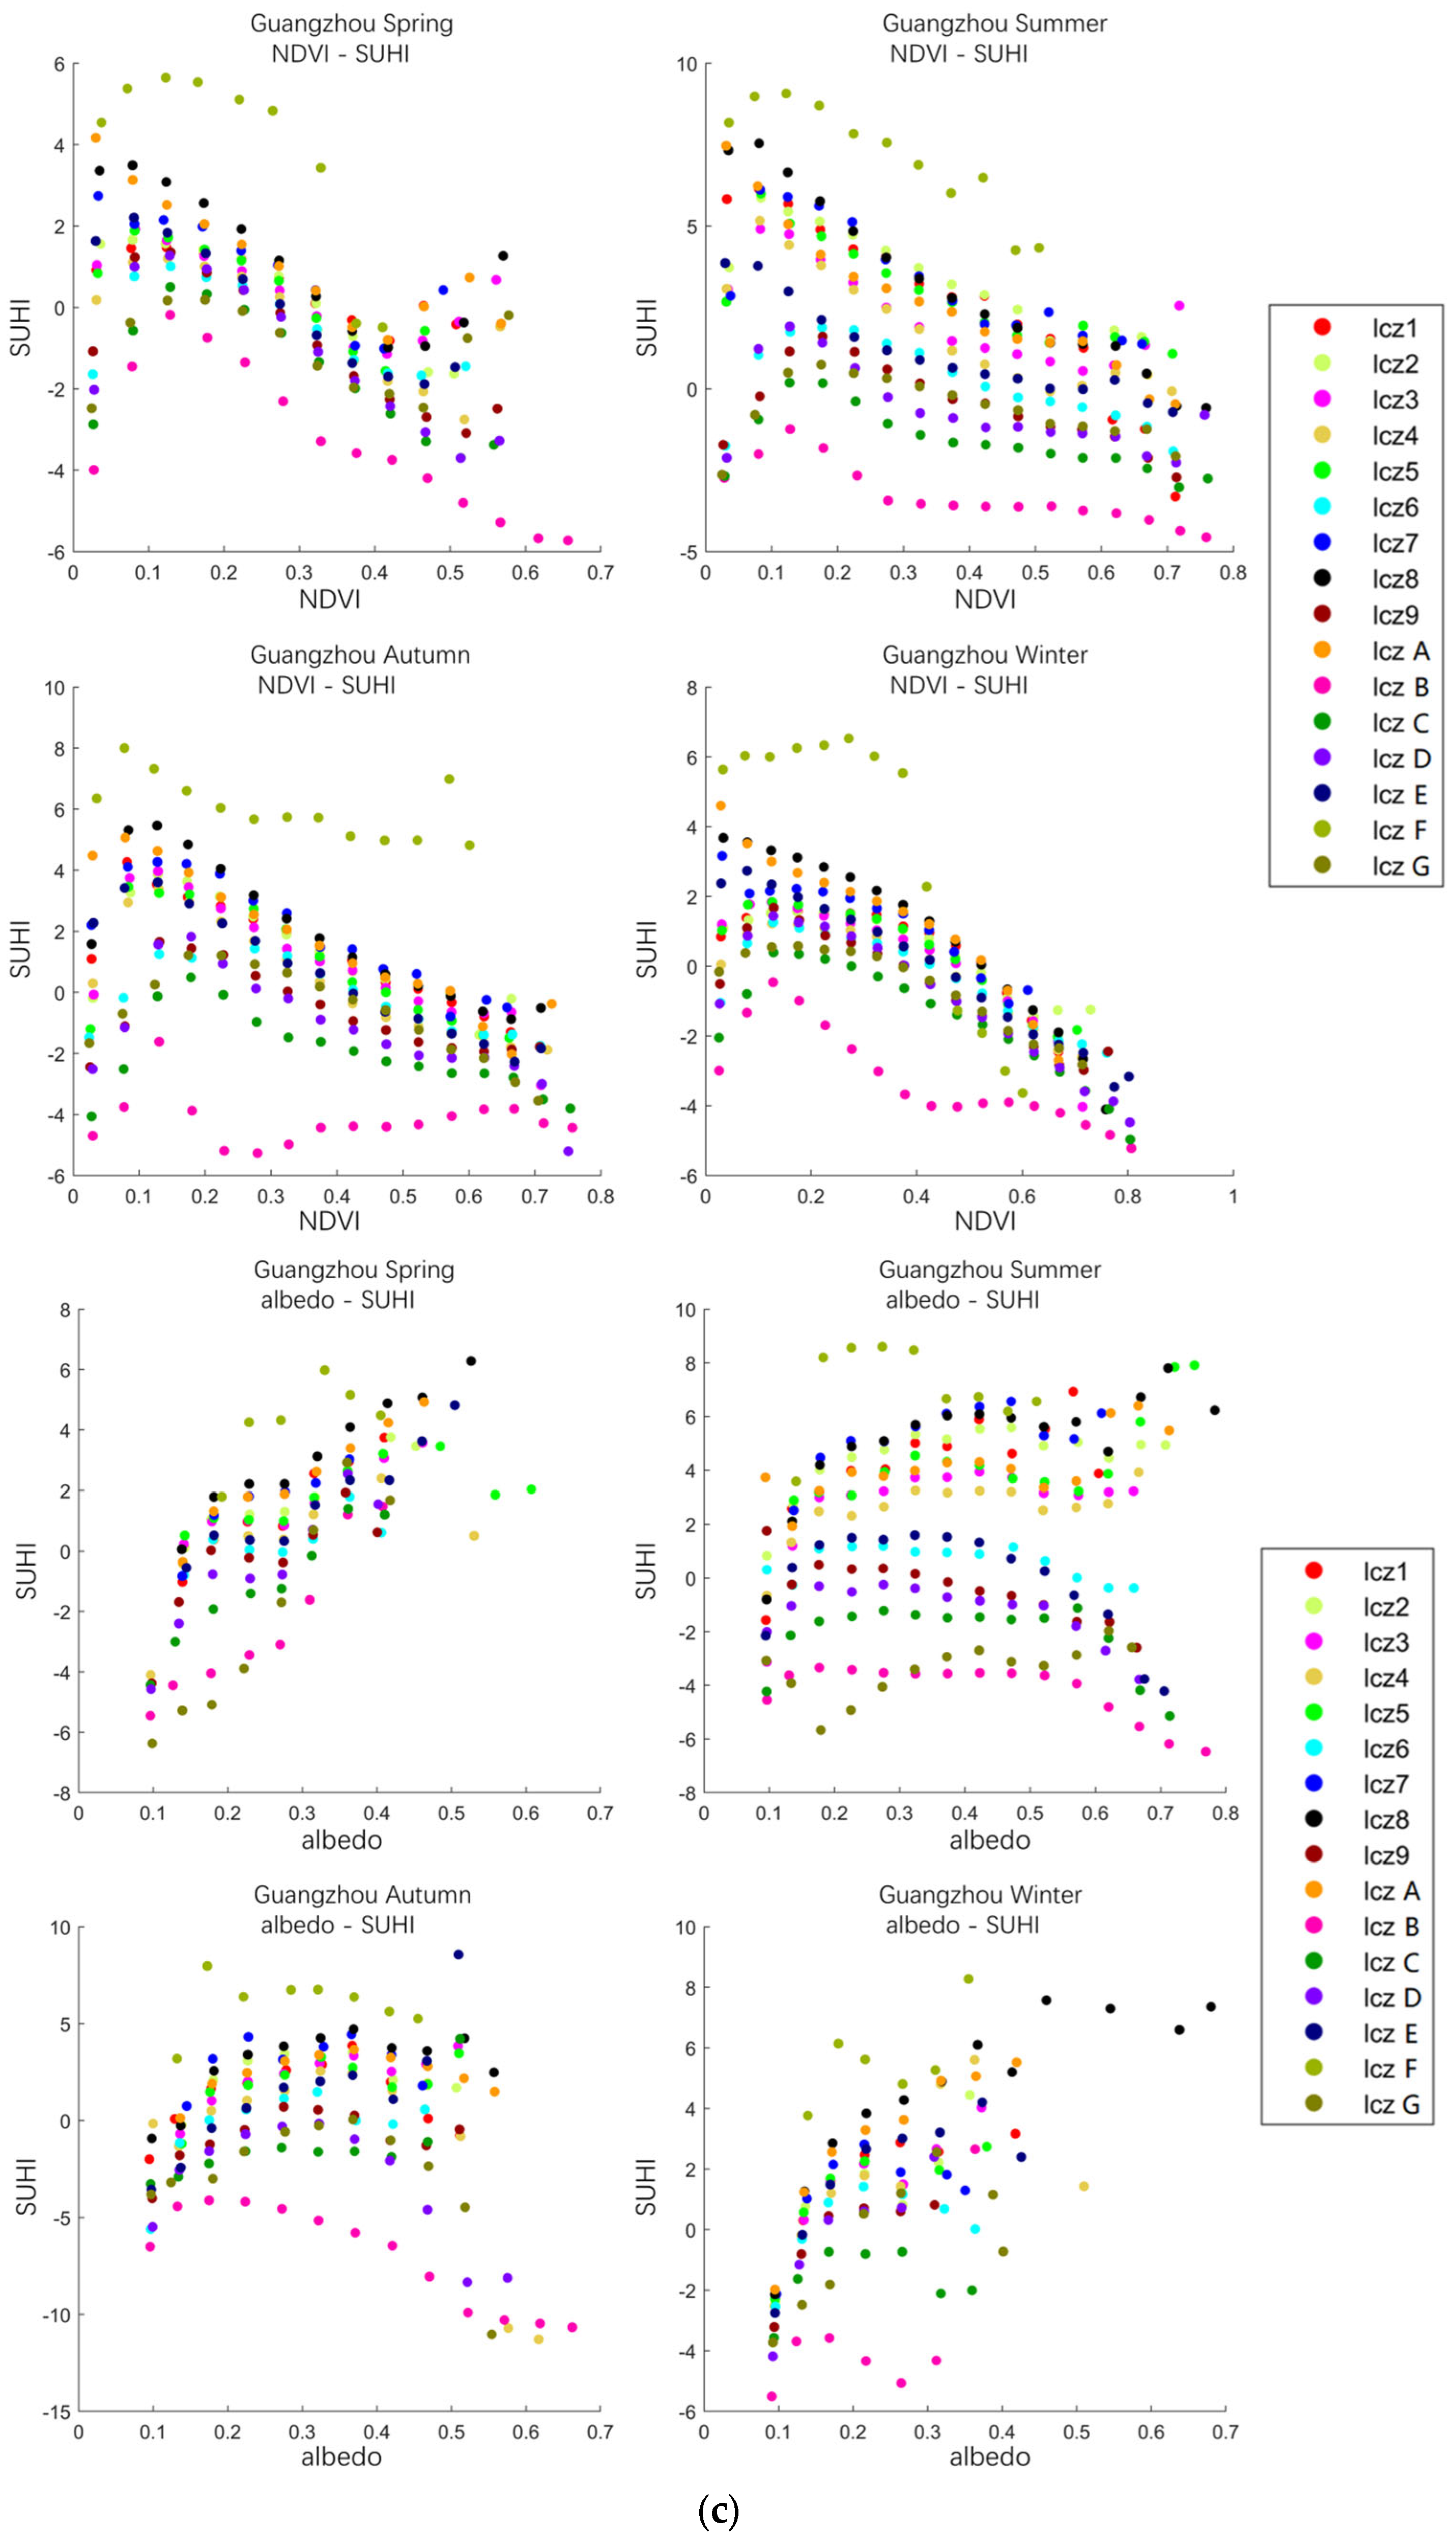
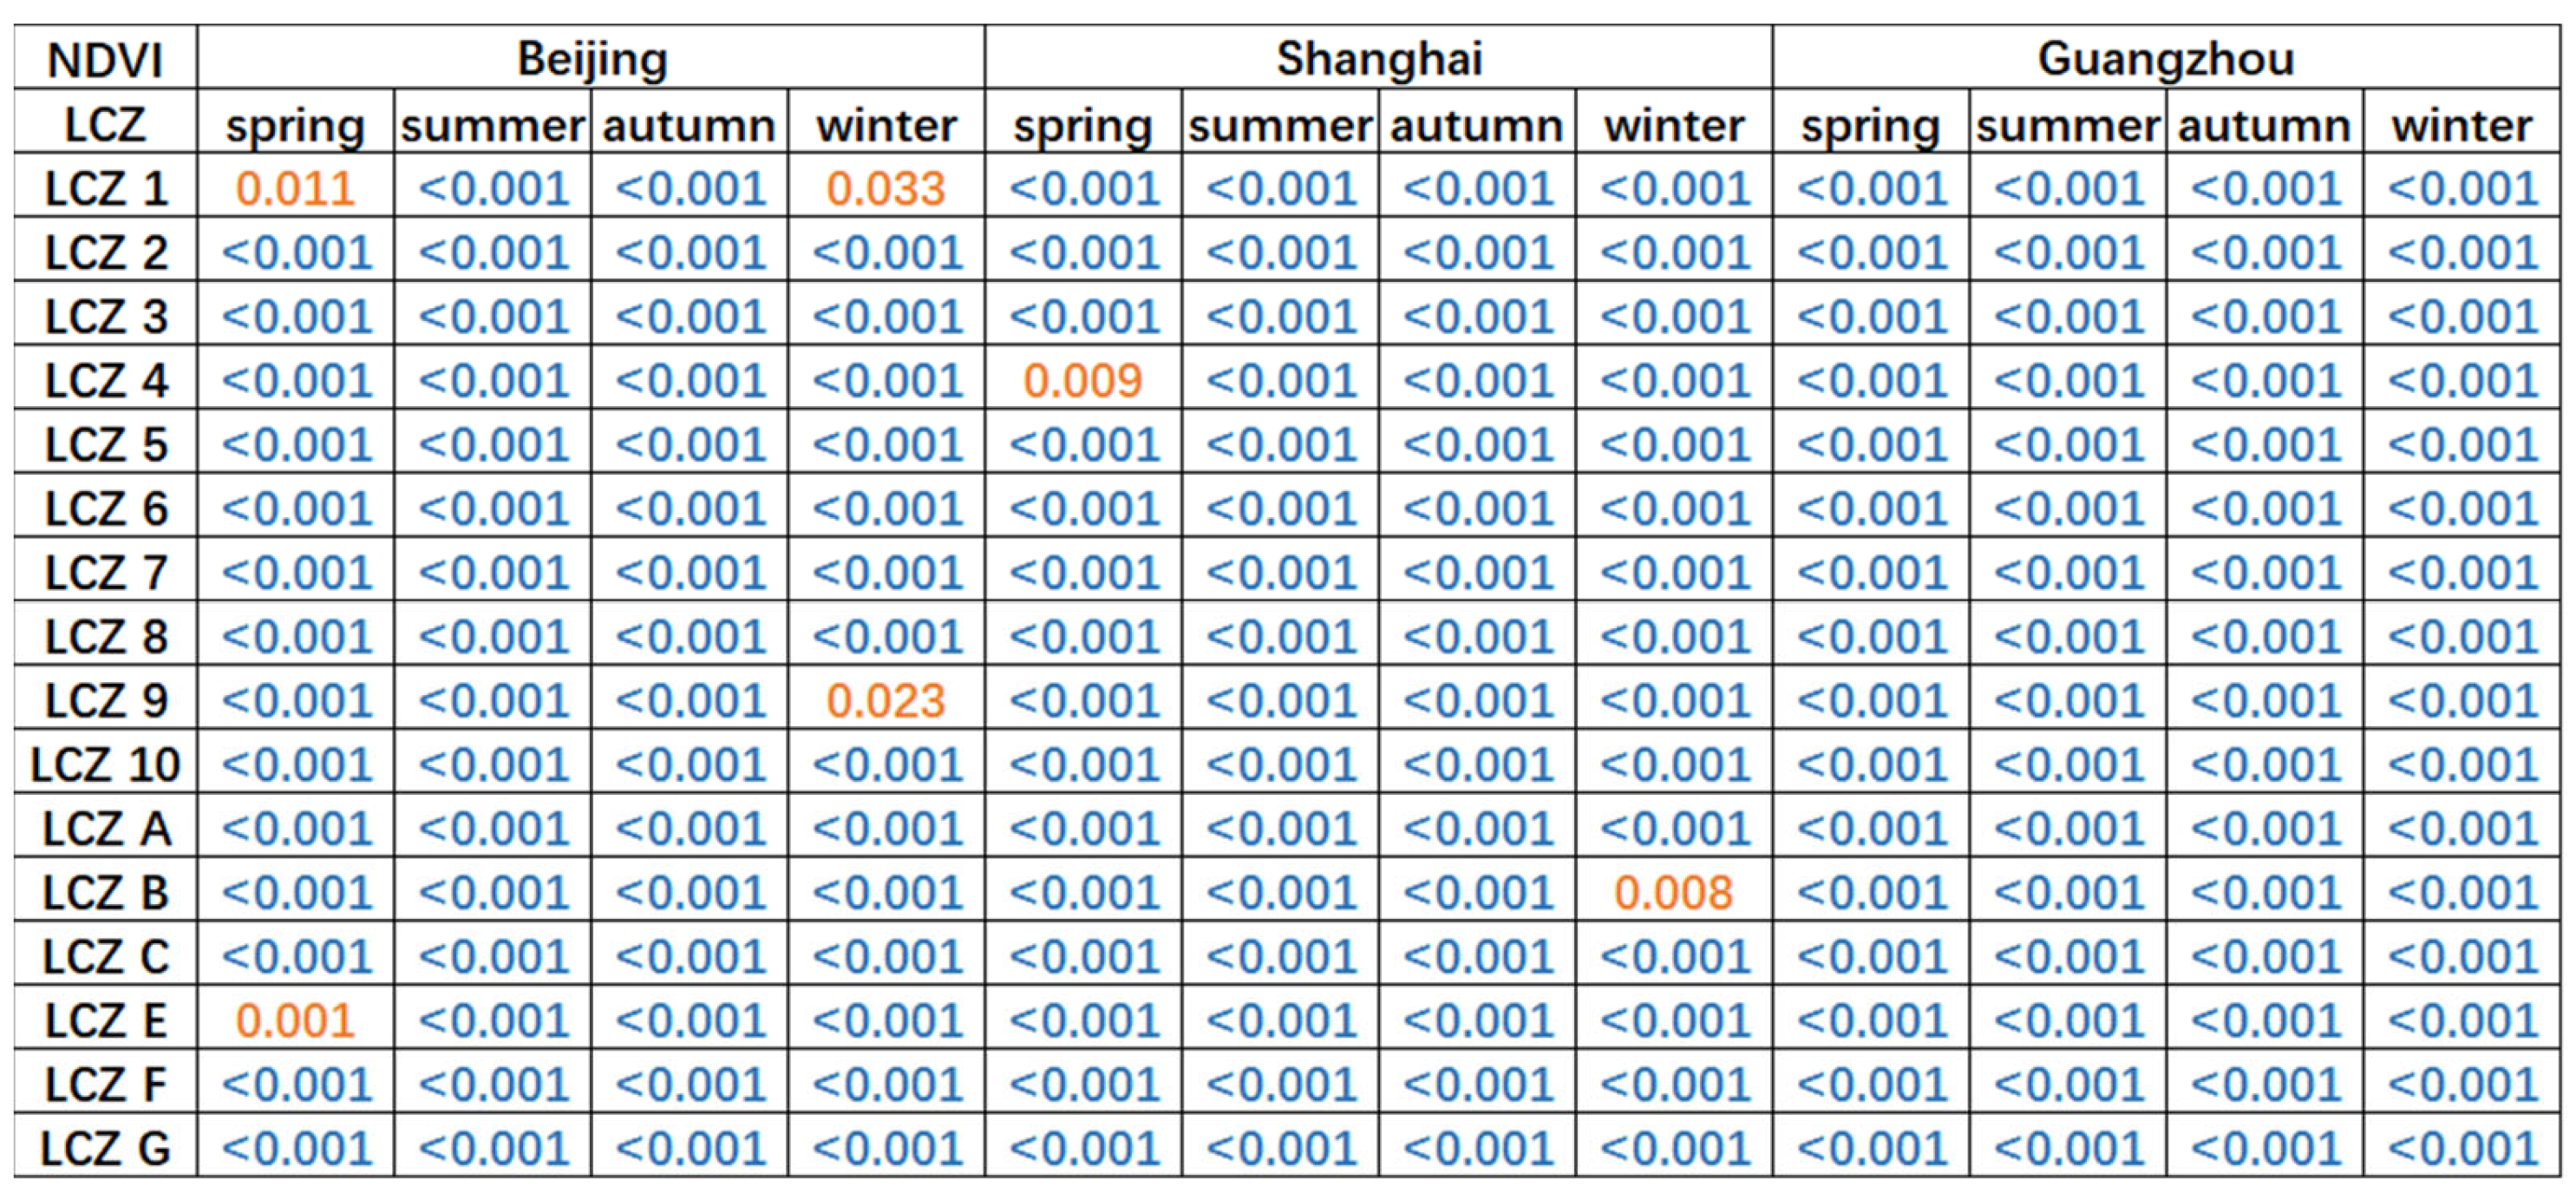
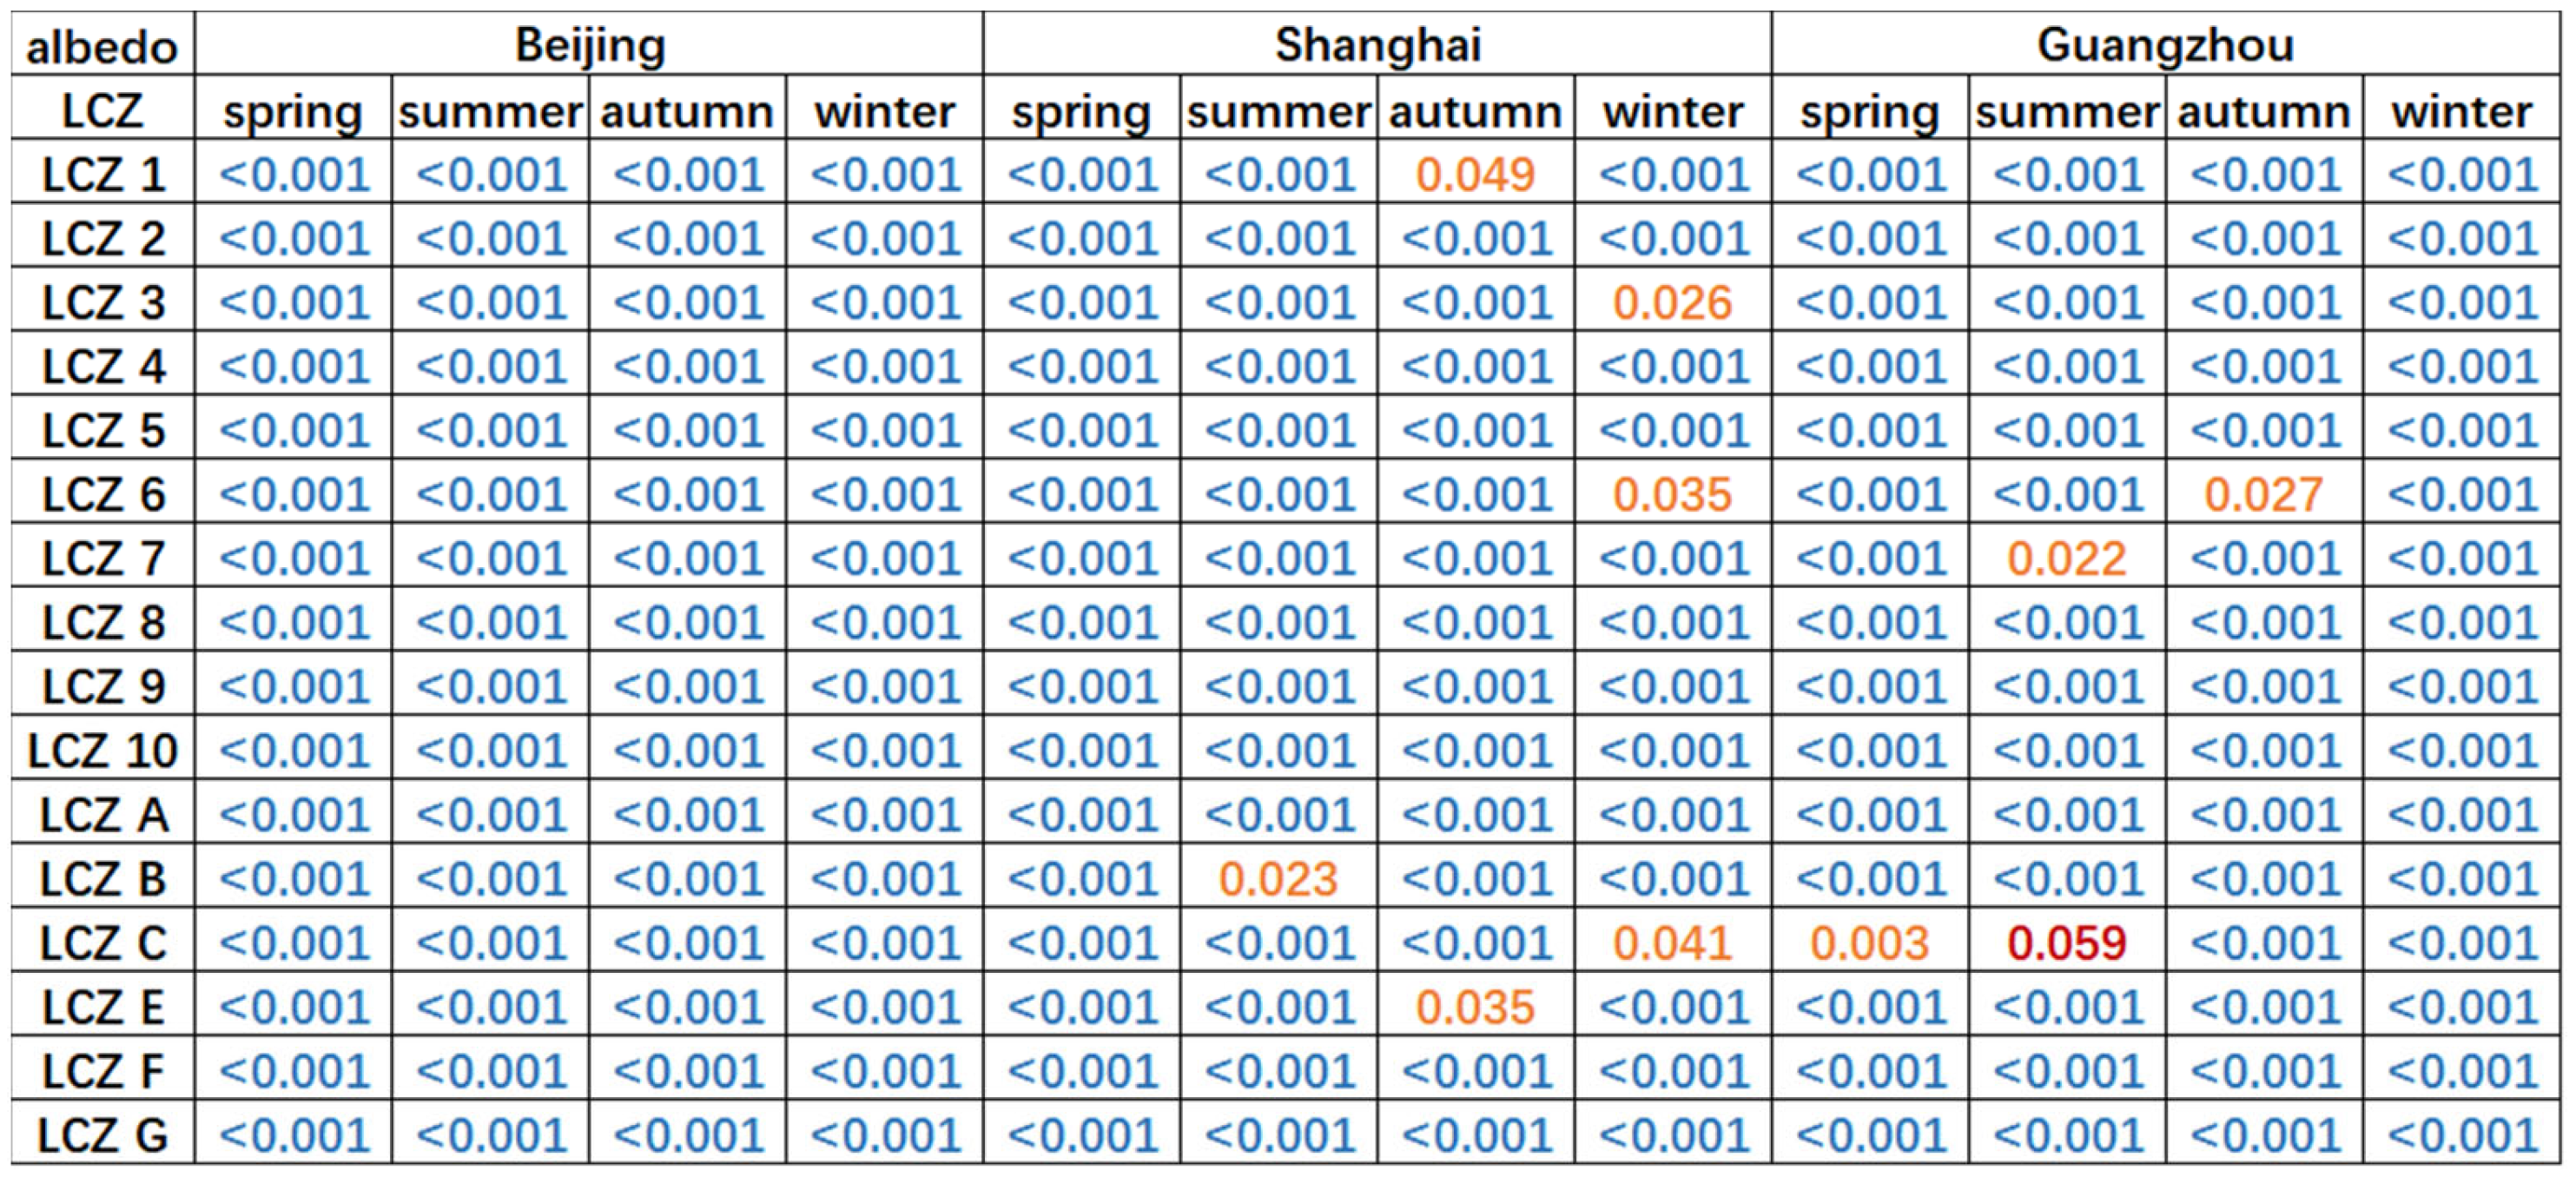
To analyze the seasonal differences in the effectiveness of the NDVI and albedo in reducing the LST and the related spatial variability, we estimated the single-factor linear regression coefficients and produced scatter plots of the SUHI versus NDVI and albedo, respectively. The linear regression coefficients show the overall response of the SUHI to the NDVI or albedo within each LCZ (Figure 6a,b) and the scatter plots show the trend of the SUHI versus NDVI or albedo within each LCZ (Figure 7a–c). We averaged the NDVI or albedo ranges into 20 equally bins, and each dot in these scatter plots represents the mean SUHI corresponding to the mean NDVI or mean albedo in this bin. The corresponding p-values are shown in Figure A4 and Figure A5. In addition to the SUHI versus albedo in summer in Guangzhou within LCZ C, all computed p-values were found to be less than 0.05 (significance level set at 0.05). This suggests that we have sufficient evidence to reject the null hypothesis and support the alternative hypothesis, indicating a statistically significant linear relationship between variables.
Consistent with the results presented in Section 3.2, the SUHI was negatively correlated with the NDVI in the vast majority of cases. The regression coefficients were greater than 0 in only 24 of the 192 LCZs (excluding LCZ D as a background value) for each season in each city (Figure 6a,b). The smallest and largest regression coefficients (smaller numbers indicate a greater cooling ability) of the NDVI on the SUHI occurred in Beijing LCZ 7 in spring and in LCZ A in autumn, with −32.07 and 4.21, respectively. The mean value of the positive regression coefficient was 1.26, while the mean value of the negative regression coefficient was −8.59. The regression coefficients of the SUHI and albedo were positive in 127 out of 192 LCZs. This indicated that urban surface materials were less effective in cooling the SUHI than vegetation overall. The smallest and largest regression coefficients of albedo on the SUHI occurred in LCZ A in Shanghai in autumn and LCZ G in Beijing in spring, with −39.63 and 64.98, respectively. The mean value of the positive regression coefficient was 14.88 and the mean value of the negative regression coefficient was −8.19. Half of the minimum values of the regression coefficients of the SUHI vs. NDVI occurred in LCZ F, which was the LCZ with the largest proportion of minimum values. The minimum values of the regression coefficients of SUHI vs. albedo occurred in multiple LCZs, with no significant pattern.
From the trend plots of the SUHI vs. NDVI for each LCZ, the relationship between the NDVI and SUHI showed first a positive and then a negative correlation. The threshold value of each LCZ shift varied, and most of them were concentrated between 0 and 0.2. This is due to the fact that lower NDVI values relate to lower photosynthesis and transpiration, and thus the reduced ability of vegetation to provide a cooling effect on the SUHI. There are also exceptions; for example, winter in Shanghai and autumn in Beijing show positive correlations of the SUHI with the NDVI after it exceeds a certain threshold. The trends of the SUHI vs. albedo for each LCZ varied considerably from city to city and from season to season. The regression coefficients were positive for the vast majority of LCZs in spring, and only LCZ 9, LCZ C, and LCZ E were negatively correlated in Beijing. The relationship between the SUHI and albedo in summer, autumn, and winter was as follows: first, when the albedo is at low values, it is positively correlated with the SUHI, and this low value of albedo varies with the LCZ; then, after the albedo reaches a sufficiently high value, the SUHI is negatively correlated with it. Albedo is susceptible to the building geometry and the shadows produced in urban areas. Therefore, at lower albedo values, the urban surface may be in shadow, which does not reflect the true surface properties, so its cooling effect on the SUHI is not ensured.
4. Discussion
In this study, we focused on assessing the cooling effect of the SUHI from a Local Climate Zone (LCZ) perspective, with a particular focus on the role of vegetation and albedo and taking into account seasonal differences. By assessing the cooling effects of vegetation and albedo on the SUHI from an LCZ perspective, the study provides a more detailed and nuanced understanding of the relationship between land cover and the local climate. The LCZ approach is important because it allows for a more accurate and precise analysis of the specific surface cover characteristics and thermal properties of different urban and suburban areas. Moreover, this study evaluated the strength of the cooling effects of vegetation and albedo in each season, which is important because the effects on the SUHI can vary depending on the time of year. By identifying the specific LCZ types that are most effective at reducing the SUHI intensity during each season, the study provides useful information for urban planners and policymakers to develop more effective strategies to mitigate the SUHI intensity in specific areas and at specific times of the year.
Previous studies have found that, at high albedo, reflective materials redirect more radiation, lowering surface temperatures and thus leading to lower air temperatures [17]. In spring, summer, and autumn, albedo is a dominant factor for the mitigation of the regional heat island (RHI) [46]. In studies using an urban climate model such as WRF, higher albedo values were found to result in a maximum reduction in the air temperature of nearly 2 °C during midday in summer for a slight increase in wind speed [47]. Our results on albedo are consistent with the basic results found by other scholars in season-specific studies, i.e., summer and autumn albedo produced the most significant cooling effect on the SUHI. We found that albedo can have a significant cooling effect on the SUHI in summer and autumn in Guangzhou and summer in Shanghai. The correlation coefficient of the SUHI versus albedo in summer in Guangzhou reached −0.55, which was the most significant among all the correlation coefficients of the SUHI versus albedo. The regression coefficient between the SUHI versus albedo in autumn in Shanghai could reach −39.64 in LCZ A, which was the most significant among all the regression coefficients of the SUHI versus albedo. It is noteworthy that the regression coefficient between the SUHI versus albedo in LCZ 5 (Open midrise) in Shanghai reached −21.55 in autumn, which was the lowest among all the built-up classes, proving that the cooling ability of albedo on the SUHI in this built-up region was fully manifested. However, in other cases, the albedo did not have a cooling effect on the SUHI, probably because of the increase in energy storage at the surface due to the complexity of the urban structure. The LST decreased slightly in areas with expanding vegetation, while it increased substantially in areas with decreasing vegetation [53]. The surface temperature has a negative relationship with the proportion of urban vegetation in an area. However, this trend is non-linear, with lower surface temperatures in the range of 70% to 80% of urban vegetation [10]. Our observations on the cooling effect of vegetation are also consistent with previous studies: the NDVI has a remarkable cooling effect on the SUHI for the vast majority of the year. The correlation coefficient of the SUHI versus NDVI in summer in Guangzhou reached −0.99, which was the most significant among all the correlation coefficients of the SUHI versus NDVI. The regression coefficient between the SUHI versus NDVI in autumn in Beijing could reach -32.07 in LCZ 7 (lightweight low-rise), which was the most significant among all the regression coefficients of the SUHI versus NDVI. This indicated that the NDVI in this built-up region is relatively effective in cooling the SUHI. In this study, only one counter-example was found, i.e., the cooling effect in Shanghai of each LCZ on the SUHI was significantly weakened after the NDVI value crossed 0.4 in winter. According to Pang (2022) and Alibakhshi (2020), albedo is negatively correlated with the NDVI, and vegetation in different seasons affects the albedo differently [30,54]. In our study, the albedo and NDVI in the three cities were not negatively correlated in all seasons. Both Beijing and Shanghai had three seasons each that fit the pattern, while the relationship between the albedo and NDVI in Guangzhou received the greatest seasonal impact. The unique contribution of this paper is its comprehensive assessment of the cooling effects of different factors, including vegetation cover and albedo, and its analysis of the variability of these effects over the course of the year. By examining the variability of the cooling effects throughout the year, this study provides a more nuanced understanding of the complex and dynamic relationships between land cover, the local climate, and SUHI effects. This information can be used to develop more effective strategies to mitigate SUHI effects in different LCZ types and at different times of the year. In this paper, we found that the NDVI performed best in cooling within the LCZ F, especially in summer and spring. Albedo can have a significant cooling effect in LCZ 4 and LCZ E during spring, and in LCZ A during autumn. The above results help us to understand the SUHI and how to mitigate its intensity.
The study has some limitations that should be taken into account. First, the calculation of albedo was based on Liang’s empirical formula (Equation (2)), and this may introduce some errors. In fact, most of the other scholars that we refer to also used this formula for their calculations. There are also methods to improve this: for example, [55] introduced additive and multiplicative terms such as radiance, reflectance, and the sun elevation angle in the calculation. Second, albedo is a critical factor in surface radiative warming and cooling in the northern latitudes, in large part due to the presence or absence of seasonal snow cover [56,57]. The study did not explore the mechanism of albedo affected by winter snow and ice, which could have an impact on the cooling of the SUHI. Third, the study did not explore the influence of different LCZ classification mapping methods on the results, which could have implications for the accuracy and reliability of the findings. Since the LCZ system is not always appropriate for particular urban situations seen throughout the world, several researchers have suggested that it be somewhat adjusted to adapt to the local context [58]. Fourth, the study did not explore the influence of different remote sensing data sources on the results, which could affect the precision and representativeness of the data used in the analysis. Finally, in some cases, albedo is positively correlated with the SUHI. The explanation of the observed relationship between surface temperature and albedo is two-fold. The first is the spatial resolution limitations of satellite remote sensing platforms. For a better solution, researchers can use very high-resolution (VHR) remote sensing images or UAV remote sensing images. However, it is undeniable that even with the most advanced spatial resolution, there is a gap between the calculated albedo and the ground measurement [43,59]. The second is the impact of vegetation on the relationship between the surface temperature and albedo. When the albedo is at a low value, higher albedo indicates a decrease in vegetation cover and/or in surface water content and therefore a decrease in the latent heat flux of vegetation, i.e., a larger fraction of net radiation absorbed at the surface must be dissipated as sensible heat flux, which requires a higher surface temperature at given boundary layer conditions. In other words, in the lower-albedo range, the decrease in latent heat flux related to increased albedo is dominant. This means that the decrease in net radiation due to the increase in albedo is not enough to offset the increase in sensible heat flux, so that the total energy to be dissipated at the surface is still rising, and therefore the LST rises [17,30]. It is only when the albedo rises to a level where the reduced net radiation and latent heat flux are comparable that the surface temperature slowly decreases with the albedo. These limitations suggest areas for future research to build on and refine the findings of this study. Further research could investigate the impact of winter snow and ice on albedo and its effects on SUHI cooling, explore the implications of different LCZ classification methods for SUHI research, and examine the impact of different remote sensing data sources on SUHI analysis. By addressing these limitations, future research can provide a more nuanced and accurate understanding of the SUHI and develop more effective strategies to mitigate their effects.
5. Conclusions
This article investigated two driving factors that influence the seasonal SUHI differently, namely the NDVI and albedo, using the LCZ classification method within three megacities in China as a case study. Pearson correlation analysis and single-factor linear regression were used to analyze the effectiveness of the NDVI and albedo in mitigating the SUHI. The approach overcomes the monitoring limitations of surface sensors and the sparsely distributed, fixed weather stations, and it highlights the variations in the SUHI and its impact factors within each LCZ during the four seasons of the year.
According to the results, the SUHI varies significantly between cities, and this variation is represented in the dominant LCZ classes and the function of cooling factors. The NDVI plays an overwhelming role in the cooling effect, and the SUHI is negatively correlated with it throughout the year, with the strength of benefits decreasing from south to north. The NDVI, after a specific value, always suppresses the development of the SUHI and most of this significant cooling effect occurs within LCZ F. Albedo in summer, autumn, and winter will only have a cooling effect on the SUHI if crossing an LCZ-specific threshold. This approach enables the comparison of various locations, the identification of vulnerable areas, the ability to improve the quality of urban climate and urban planning research, and the suggestion of potential mitigation measures.
Author Contributions
Conceptualization, Y.L. and J.Y.; methodology, Y.L.; validation, Y.L.; data curation, Q.S.; writing—original draft preparation, Y.L.; writing—review and editing, Y.L., J.Y., Y.X., M.M. and M.S.W.; visualization, Y.L.; supervision, Y.L. All authors have read and agreed to the published version of the manuscript.
Funding
This work was supported by Grants by National Natural Science Foundation of China (42271345), National College Students Innovation and Entrepreneurship Training Program (Grant No. s202211078187). M.S. Wong thanks the funding support from the General Research Fund (Grant Nos. 15603920 and 15609421), and the Collaborative Research Fund (Grant No. C5062-21GF) from the Research Grants Council, Hong Kong, China.
Data Availability Statement
The authors do not have permission to share data.
Conflicts of Interest
The authors declare no conflict of interest.
Appendix A
Figure A1.
p-values of seasonal Pearson correlation coefficients of SUHI with NDVI and albedo in Beijing.
Figure A1.
p-values of seasonal Pearson correlation coefficients of SUHI with NDVI and albedo in Beijing.

Figure A2.
p-values of seasonal Pearson correlation coefficients of SUHI with NDVI and albedo in Shanghai.
Figure A2.
p-values of seasonal Pearson correlation coefficients of SUHI with NDVI and albedo in Shanghai.

Figure A3.
p-values of seasonal Pearson correlation coefficients of SUHI with NDVI and albedo in Guangzhou.
Figure A3.
p-values of seasonal Pearson correlation coefficients of SUHI with NDVI and albedo in Guangzhou.

Figure A4.
p-values of regression coefficient of SUHI versus NDVI.

Figure A5.
p-values of regression coefficient of SUHI versus albedo.

References
- United Nations. World Population Prospects 2022: Summary of Results; United Nations: New York, NY, USA, 2022; p. UN DESA/POP/2022/TR/NO.3. [Google Scholar]
- Chapman, S.; Watson, J.E.M.; Salazar, A.; Thatcher, M.; McAlpine, C.A. The Impact of Urbanization and Climate Change on Urban Temperatures: A Systematic Review. Landsc. Ecol. 2017, 32, 1921–1935. [Google Scholar] [CrossRef]
- Oke, T.R. The Energetic Basis of the Urban Heat Island. Q. J. R. Meteorol. Soc. 1982, 108, 1–24. [Google Scholar] [CrossRef]
- Li, Y.; Schubert, S.; Kropp, J.P.; Rybski, D. On the Influence of Density and Morphology on the Urban Heat Island Intensity. Nat. Commun. 2020, 11, 2647. [Google Scholar] [CrossRef]
- Zhao, Z.; Sharifi, A.; Dong, X.; Shen, L.; He, B.-J. Spatial Variability and Temporal Heterogeneity of Surface Urban Heat Island Patterns and the Suitability of Local Climate Zones for Land Surface Temperature Characterization. Remote Sens. 2021, 13, 4338. [Google Scholar] [CrossRef]
- Arnfield, A.J. Two Decades of Urban Climate Research: A Review of Turbulence, Exchanges of Energy and Water, and the Urban Heat Island. Int. J. Climatol. 2003, 23, 1–26. [Google Scholar] [CrossRef]
- Oke, T.R. The Heat Island of the Urban Boundary Layer: Characteristics, Causes and Effects. In Wind Climate in Cities; Cermak, J.E., Davenport, A.G., Plate, E.J., Viegas, D.X., Eds.; Springer: Dordrecht, The Netherlands, 1995; pp. 81–107. ISBN 978-90-481-4485-3. [Google Scholar]
- Voogt, J.A.; Oke, T.R. Thermal Remote Sensing of Urban Climates. Remote Sens. Environ. 2003, 86, 370–384. [Google Scholar] [CrossRef]
- Schwarz, N.; Schlink, U.; Franck, U.; Großmann, K. Relationship of Land Surface and Air Temperatures and Its Implications for Quantifying Urban Heat Island Indicators—An Application for the City of Leipzig (Germany). Ecol. Indic. 2012, 18, 693–704. [Google Scholar] [CrossRef]
- Alavipanah, S.; Wegmann, M.; Qureshi, S.; Weng, Q.; Koellner, T. The Role of Vegetation in Mitigating Urban Land Surface Temperatures: A Case Study of Munich, Germany during the Warm Season. Sustainability 2015, 7, 4689–4706. [Google Scholar] [CrossRef]
- Gillner, S.; Vogt, J.; Tharang, A.; Dettmann, S.; Roloff, A. Role of Street Trees in Mitigating Effects of Heat and Drought at Highly Sealed Urban Sites. Landsc. Urban Plan. 2015, 143, 33–42. [Google Scholar] [CrossRef]
- Larsen, L. Urban Climate and Adaptation Strategies. Front. Ecol. Environ. 2015, 13, 486–492. [Google Scholar] [CrossRef]
- Weng, Q. Thermal Infrared Remote Sensing for Urban Climate and Environmental Studies: Methods, Applications, and Trends. ISPRS J. Photogramm. Remote Sens. 2009, 64, 335–344. [Google Scholar] [CrossRef]
- Gunawardena, K.R.; Wells, M.J.; Kershaw, T. Utilising Green and Bluespace to Mitigate Urban Heat Island Intensity. Sci. Total Environ. 2017, 584–585, 1040–1055. [Google Scholar] [CrossRef]
- Imhoff, M.L.; Zhang, P.; Wolfe, R.E.; Bounoua, L. Remote Sensing of the Urban Heat Island Effect across Biomes in the Continental USA. Remote Sens. Environ. 2010, 114, 504–513. [Google Scholar] [CrossRef]
- Jenerette, G.D.; Harlan, S.L.; Buyantuev, A.; Stefanov, W.L.; Declet-Barreto, J.; Ruddell, B.L.; Myint, S.W.; Kaplan, S.; Li, X. Micro-Scale Urban Surface Temperatures Are Related to Land-Cover Features and Residential Heat Related Health Impacts in Phoenix, AZ USA. Landsc. Ecol. 2016, 31, 745–760. [Google Scholar] [CrossRef]
- Yang, J.; Wang, Z.-H.; Kaloush, K.E. Environmental Impacts of Reflective Materials: Is High Albedo a ‘Silver Bullet’ for Mitigating Urban Heat Island? Renew. Sustain. Energy Rev. 2015, 47, 830–843. [Google Scholar] [CrossRef]
- Santamouris, M. Cooling the Cities—A Review of Reflective and Green Roof Mitigation Technologies to Fight Heat Island and Improve Comfort in Urban Environments. Sol. Energy 2014, 103, 682–703. [Google Scholar] [CrossRef]
- Akbari, H.; Pomerantz, M.; Taha, H. Cool Surfaces and Shade Trees to Reduce Energy Use and Improve Air Quality in Urban Areas. Sol. Energy 2001, 70, 295–310. [Google Scholar] [CrossRef]
- Yu, Z.; Xu, S.; Zhang, Y.; Jørgensen, G.; Vejre, H. Strong Contributions of Local Background Climate to the Cooling Effect of Urban Green Vegetation. Sci. Rep. 2018, 8, 6798. [Google Scholar] [CrossRef]
- Yan, M.; Chen, L.; Leng, S.; Sun, R. Effects of Local Background Climate on Urban Vegetation Cooling and Humidification: Variations and Thresholds. Urban For. Urban Green. 2023, 80, 127840. [Google Scholar] [CrossRef]
- Kuang, W.; Dou, Y.; Zhang, C.; Chi, W.; Liu, A.; Liu, Y.; Zhang, R.; Liu, J. Quantifying the Heat Flux Regulation of Metropolitan Land Use/Land Cover Components by Coupling Remote Sensing Modeling with in Situ Measurement: Quantifying the Heat Flux Regulation. J. Geophys. Res. Atmos. 2015, 120, 113–130. [Google Scholar] [CrossRef]
- Peng, J.; Jiang, H.; Liu, Q.; Green, S.M.; Quine, T.A.; Liu, H.; Qiu, S.; Liu, Y.; Meersmans, J. Human Activity vs. Climate Change: Distinguishing Dominant Drivers on LAI Dynamics in Karst Region of Southwest China. Sci. Total Environ. 2021, 769, 144297. [Google Scholar] [CrossRef]
- Wang, Z.; Schaaf, C.B.; Sun, Q.; Shuai, Y.; Román, M.O. Capturing Rapid Land Surface Dynamics with Collection V006 MODIS BRDF/NBAR/Albedo (MCD43) Products. Remote Sens. Environ. 2018, 207, 50–64. [Google Scholar] [CrossRef]
- Zhang, X.; Jiao, Z.; Zhao, C.; Qu, Y.; Liu, Q.; Zhang, H.; Tong, Y.; Wang, C.; Li, S.; Guo, J.; et al. Review of Land Surface Albedo: Variance Characteristics, Climate Effect and Management Strategy. Remote Sens. 2022, 14, 1382. [Google Scholar] [CrossRef]
- Yang, X.; Li, Y. The Impact of Building Density and Building Height Heterogeneity on Average Urban Albedo and Street Surface Temperature. Build. Environ. 2015, 90, 146–156. [Google Scholar] [CrossRef]
- Stewart, I.D.; Oke, T.R. Local Climate Zones for Urban Temperature Studies. Bull. Am. Meteorol. Soc. 2012, 93, 1879–1900. [Google Scholar] [CrossRef]
- Oke, T.R.; Mills, G.; Christen, A.; Voogt, J.A. Urban Climates; Cambridge University Press: Cambridge, UK, 2017. [Google Scholar]
- Bechtel, B.; Demuzere, M.; Mills, G.; Zhan, W.; Sismanidis, P.; Small, C.; Voogt, J. SUHI Analysis Using Local Climate Zones—A Comparison of 50 Cities. Urban Clim. 2019, 28, 100451. [Google Scholar] [CrossRef]
- Pang, G.; Chen, D.; Wang, X.; Lai, H.-W. Spatiotemporal Variations of Land Surface Albedo and Associated Influencing Factors on the Tibetan Plateau. Sci. Total Environ. 2022, 804, 150100. [Google Scholar] [CrossRef]
- Qu, Y.; Liang, S.; Liu, Q.; He, T.; Liu, S.; Li, X. Mapping Surface Broadband Albedo from Satellite Observations: A Review of Literatures on Algorithms and Products. Remote Sens. 2015, 7, 990–1020. [Google Scholar] [CrossRef]
- Gaubatz, P. Changing Beijing. Geogr. Rev. 1995, 85, 79. [Google Scholar] [CrossRef]
- Long, Y.; Gu, Y.; Han, H. Spatiotemporal Heterogeneity of Urban Planning Implementation Effectiveness: Evidence from Five Urban Master Plans of Beijing. Landsc. Urban Plan. 2012, 108, 103–111. [Google Scholar] [CrossRef]
- Wu, F. Planning for Growth: Urban and Regional Planning in China; Routledge: New York, NY, USA, 2015. [Google Scholar]
- Lee, O.F. Shanghai Modern: The Flowering of a New Urban Culture in China, 1930–1945; Harvard University Press: Cambridge, MA, USA, 1999. [Google Scholar]
- Yu, X.J.; Ng, C.N. Spatial and Temporal Dynamics of Urban Sprawl along Two Urban–Rural Transects: A Case Study of Guangzhou, China. Landsc. Urban Plan. 2007, 79, 96–109. [Google Scholar] [CrossRef]
- Cai, Z.; Demuzere, M.; Tang, Y.; Wan, Y. The Characteristic and Transformation of 3D Urban Morphology in Three Chinese Mega-Cities. Cities 2022, 131, 103988. [Google Scholar] [CrossRef]
- Zhu, X.X.; Qiu, C.; Hu, J.; Shi, Y.; Wang, Y.; Schmitt, M.; Taubenböck, H. The Urban Morphology on Our Planet—Global Perspectives from Space. Remote Sens. Environ. 2022, 269, 112794. [Google Scholar] [CrossRef] [PubMed]
- Zhu, X.X.; Hu, J.; Qiu, C.; Shi, Y.; Kang, J.; Mou, L.; Bagheri, H.; Häberle, M.; Hua, Y.; Huang, R.; et al. So2Sat LCZ42: A Benchmark Dataset for Global Local Climate Zones Classification. arXiv 2019, arXiv:1912.12171. [Google Scholar]
- Esch, T.; Marconcini, M.; Felbier, A.; Roth, A.; Heldens, W.; Huber, M.; Schwinger, M.; Taubenbock, H.; Muller, A.; Dech, S. Urban Footprint Processor—Fully Automated Processing Chain Generating Settlement Masks From Global Data of the TanDEM-X Mission. IEEE Geosci. Remote Sens. Lett. 2013, 10, 1617–1621. [Google Scholar] [CrossRef]
- Stewart, I.D.; Oke, T.R.; Krayenhoff, E.S. Evaluation of the ‘Local Climate Zone’ Scheme Using Temperature Observations and Model Simulations: Evaluation of The ‘Local Climate Zone’ Scheme. Int. J. Climatol. 2014, 34, 1062–1080. [Google Scholar] [CrossRef]
- Sailor, D.J. Simulated Urban Climate Response to Modifications in Surface Albedo and Vegetative Cover. J. Appl. Meteorol. 1995, 34, 1694–1704. [Google Scholar] [CrossRef]
- Liang, S. Narrowband to Broadband Conversions of Land Surface Albedo I Algorithms. Remote Sens. Environ. 2000, 76, 213–238. [Google Scholar] [CrossRef]
- Rouse, J.W.; Haas, R.H.; Schell, J.A.; Deering, D.W. Monitoring Vegetation Systems in the Great Plains with ERTS. NASA Spec. Publ. 1974, 351, 309. [Google Scholar]
- Saito, I.; Ishihara, O.; Katayama, T. Study of the Effect of Green Areas on the Thermal Environment in an Urban Area. Energy Build. 1990, 15, 493–498. [Google Scholar] [CrossRef]
- Xiang, Y.; Huang, C.; Huang, X.; Zhou, Z.; Wang, X. Seasonal Variations of the Dominant Factors for Spatial Heterogeneity and Time Inconsistency of Land Surface Temperature in an Urban Agglomeration of Central China. Sustain. Cities Soc. 2021, 75, 103285. [Google Scholar] [CrossRef]
- Jandaghian, Z.; Berardi, U. Analysis of the Cooling Effects of Higher Albedo Surfaces during Heat Waves Coupling the Weather Research and Forecasting Model with Building Energy Models. Energy Build. 2020, 207, 109627. [Google Scholar] [CrossRef]
- McPherson, G.; Simpson, J.R.; Peper, P.J.; Maco, S.E.; Xiao, Q. Municipal Forest Benefits and Costs in Five US Cities. J. For. 2005, 103, 411–416. [Google Scholar] [CrossRef]
- Dong-sheng, G.; Yu-juan, C. Status of Urban Vegetation in Guangzhou City. J. For. Res. 2003, 14, 249–252. [Google Scholar] [CrossRef]
- Qiu, T.; Song, C.; Li, J. Impacts of Urbanization on Vegetation Phenology over the Past Three Decades in Shanghai, China. Remote Sens. 2017, 9, 970. [Google Scholar] [CrossRef]
- Zou, Y.; Chen, W.; Li, S.; Wang, T.; Yu, L.; Xu, M.; Singh, R.P.; Liu, C.-Q. Spatio-Temporal Changes in Vegetation in the Last Two Decades (2001–2020) in the Beijing–Tianjin–Hebei Region. Remote Sens. 2022, 14, 3958. [Google Scholar] [CrossRef]
- Zhao, J.; Meili, N.; Zhao, X.; Fatichi, S. Urban Vegetation Cooling Potential during Heatwaves Depends on Background Climate. Environ. Res. Lett. 2023, 18, 014035. [Google Scholar] [CrossRef]
- Sun, R.; Chen, L. Effects of Green Space Dynamics on Urban Heat Islands: Mitigation and Diversification. Ecosyst. Serv. 2017, 23, 38–46. [Google Scholar] [CrossRef]
- Alibakhshi, S.; Naimi, B.; Hovi, A.; Crowther, T.W.; Rautiainen, M. Quantitative Analysis of the Links between Forest Structure and Land Surface Albedo on a Global Scale. Remote Sens. Environ. 2020, 246, 111854. [Google Scholar] [CrossRef]
- da Silva, B.B.; Braga, A.C.; Braga, C.C.; de Oliveira, L.M.M.; Montenegro, S.M.G.L.; Barbosa Junior, B. Procedures for Calculation of the Albedo with OLI-Landsat 8 Images: Application to the Brazilian Semi-Arid. Rev. Bras. Eng. Agríc. Ambient. 2016, 20, 3–8. [Google Scholar] [CrossRef]
- Betts, A.K.; Ball, J.H. Albedo over the Boreal Forest. J. Geophys. Res. 1997, 102, 28901–28909. [Google Scholar] [CrossRef]
- Stephens, G.L.; O’Brien, D.; Webster, P.J.; Pilewski, P.; Kato, S.; Li, J. The Albedo of Earth: The Albedo of Earth. Rev. Geophys. 2015, 53, 141–163. [Google Scholar] [CrossRef]
- Kotharkar, R.; Bagade, A.; Singh, P.R. A Systematic Approach for Urban Heat Island Mitigation Strategies in Critical Local Climate Zones of an Indian City. Urban Clim. 2020, 34, 100701. [Google Scholar] [CrossRef]
- Shuai, Y.; Tuerhanjiang, L.; Shao, C.; Gao, F.; Zhou, Y.; Xie, D.; Liu, T.; Liang, J.; Chu, N. Re-Understanding of Land Surface Albedo and Related Terms in Satellite-Based Retrievals. Big Earth Data 2020, 4, 45–67. [Google Scholar] [CrossRef]
Figure 1.
(a) Map of LCZ in Beijing. (b) Map of LCZ in Shanghai. (c) Map of LCZ in Guangzhou.


Figure 2.
Work-flow of labeling decision rule.

Figure 3.
Work-flow to evaluate the cooling effect of albedo and vegetation on SUHI.

Figure 4.
(a). Distribution of SUHI intensity (°C) across LCZ-s in Beijing. (b). Distribution of SUHI intensity (°C) across LCZ-s in Shanghai. (c). Distribution of SUHI intensity (°C) across LCZ-s in Guangzhou.
Figure 4.
(a). Distribution of SUHI intensity (°C) across LCZ-s in Beijing. (b). Distribution of SUHI intensity (°C) across LCZ-s in Shanghai. (c). Distribution of SUHI intensity (°C) across LCZ-s in Guangzhou.

Figure 5.
(a). Seasonal Pearson correlation coefficients of SUHI with NDVI and albedo in Beijing. (b). Seasonal Pearson correlation coefficients of SUHI with NDVI and albedo in Shanghai. (c). Seasonal Pearson correlation coefficients of SUHI with NDVI and albedo in Guangzhou.
Figure 5.
(a). Seasonal Pearson correlation coefficients of SUHI with NDVI and albedo in Beijing. (b). Seasonal Pearson correlation coefficients of SUHI with NDVI and albedo in Shanghai. (c). Seasonal Pearson correlation coefficients of SUHI with NDVI and albedo in Guangzhou.


Figure 6.
(a). Regression coefficient of SUHI versus NDVI. (b). Regression coefficient of SUHI versus albedo.
Figure 6.
(a). Regression coefficient of SUHI versus NDVI. (b). Regression coefficient of SUHI versus albedo.

Figure 7.
(a). Distribution of NDVI and albedo corresponding to SUHI within each LCZ for each season in Beijing. (b). Distribution of NDVI and albedo corresponding to SUHI within each LCZ for each season in Shanghai. (c). Distribution of NDVI and albedo corresponding to SUHI within each LCZ for each season in Guangzhou.


Table 1.
The LCZ classification scheme and its 17 standard classes.
| Built-Up Classes | Description | Natural Classes | Description |
|---|---|---|---|
 | Dense mix of tall buildings to tens of stories. Few or no trees. Land cover mostly paved. Concrete, steel, stone, and glass construction materials |  | Heavily wooded landscape of deciduous and/or evergreen trees. Land cover mostly pervious (low plants). Zone function is natural forest, tree cultivation, or urban park. |
 | Dense mix of midrise buildings (3–9 stories). Few or no trees. Land cover mostly paved. Stone, brick, tile, and concrete construction materials. |  | Lightly wooded landscape of deciduous and/or evergreen trees. Land cover mostly pervious (low plants). Zone function is natural forest, tree cultivation, or urban park. |
 | Dense mix of low-rise buildings (1–3 stories). Few or no trees. Land cover mostly paved. Stone, brick, tile, and concrete construction materials. |  | Open arrangement of bushes, shrubs, and short, woody trees. Land cover mostly pervious (bare soil or sand). Zone function is natural scrubland or agriculture. |
 | Open arrangement of tall buildings to tens of stories. Abundance of pervious land cover (low plants, scattered trees). Concrete, steel, stone, and glass construction materials. |  | Featureless landscape of grass or herbaceous plants/crops. Few or no trees. Zone function is natural grassland, agriculture, or urban park. |
 | Open arrangement of midrise buildings (3–9 stories). Abundance of pervious land cover (low plants, scattered trees). Concrete, steel, stone, and glass construction materials. |  | Featureless landscape of rock or paved cover. Few or no trees or plants. Zone function is natural desert (rock) or urban transportation. |
 | Open arrangement of low-rise buildings (1–3 stories). Abundance of pervious land cover (low plants, scattered trees). Wood, brick, stone, tile, and concrete construction materials. |  | Featureless landscape of grass or herbaceous plants/crops. Few or no trees. Zone function is natural grassland, agriculture, or urban park. |
 | Dense mix of single-story buildings. Few or no trees. Land cover mostly hard-packed. Lightweight construction materials (e.g., wood, thatch, corrugated metal). |  | Large, open water bodies such as sea sand lakes, or small bodies such as rivers, reservoirs, and lagoons. |
 | Open arrangement of large low-rise buildings (1–3 stories). Few or no trees. Land cover mostly paved. Steel, concrete, metal, and stone construction materials. | ||
 | Sparse arrangement of small or medium-sized buildings in a natural setting. Abundance of pervious landcover (low plants, scattered trees). | ||
 | Low-rise and midrise industrial structures (towers, tanks, stacks). Few or no trees. Land cover mostly paved or hard-packed. Metal, steel, and concrete construction materials. |
Table 2.
Description of the data.
| Date | Collection | Band |
|---|---|---|
| 1 November 2020–30 January 2021 (winter) | LANDSAT/LC08/C02/T1_L2 LANDSAT/LC08/C01/T1_8DAY_NDVI | SR_B1, SR_B3, SR_B4, SR_B5, SR_B7, ST_B10 NDVI |
| 1 February 2021–30 April 2021 (spring) | LANDSAT/LC08/C02/T1_L2 LANDSAT/LC08/C01/T1_8DAY_NDVI | SR_B1, SR_B3, SR_B4, SR_B5, SR_B7, ST_B10 NDVI |
| 1 May 2021–30 July 2021 (summer) | LANDSAT/LC08/C02/T1_L2 LANDSAT/LC08/C01/T1_8DAY_NDVI | SR_B1, SR_B3, SR_B4, SR_B5, SR_B7, ST_B10 NDVI |
| 1 August 2021–30 October 2021 (autumn) | LANDSAT/LC08/C02/T1_L2 LANDSAT/LC08/C01/T1_8DAY_NDVI | SR_B1, SR_B3, SR_B4, SR_B5, SR_B7, ST_B10 NDVI |
Disclaimer/Publisher’s Note: The statements, opinions and data contained in all publications are solely those of the individual author(s) and contributor(s) and not of MDPI and/or the editor(s). MDPI and/or the editor(s) disclaim responsibility for any injury to people or property resulting from any ideas, methods, instructions or products referred to in the content. |
© 2023 by the authors. Licensee MDPI, Basel, Switzerland. This article is an open access article distributed under the terms and conditions of the Creative Commons Attribution (CC BY) license (https://creativecommons.org/licenses/by/4.0/).
Share and Cite
MDPI and ACS Style
Luo, Y.; Yang, J.; Shi, Q.; Xu, Y.; Menenti, M.; Wong, M.S. Seasonal Cooling Effect of Vegetation and Albedo Applied to the LCZ Classification of Three Chinese Megacities. Remote Sens. 2023, 15, 5478. https://doi.org/10.3390/rs15235478
AMA Style
Luo Y, Yang J, Shi Q, Xu Y, Menenti M, Wong MS. Seasonal Cooling Effect of Vegetation and Albedo Applied to the LCZ Classification of Three Chinese Megacities. Remote Sensing. 2023; 15(23):5478. https://doi.org/10.3390/rs15235478
Chicago/Turabian StyleLuo, Yifan, Jinxin Yang, Qian Shi, Yong Xu, Massimo Menenti, and Man Sing Wong. 2023. "Seasonal Cooling Effect of Vegetation and Albedo Applied to the LCZ Classification of Three Chinese Megacities" Remote Sensing 15, no. 23: 5478. https://doi.org/10.3390/rs15235478
Note that from the first issue of 2016, this journal uses article numbers instead of page numbers. See further details here.