
MTU2-Net: Extracting Internal Solitary Waves from SAR Images


1
School of Mathematical Sciences, Inner Mongolia Normal University, Huhhot 010028, China
2
School of Mathematical Sciences, Inner Mongolia University, Huhhot 010021, China
3
School of Oceanography and Atmosphere, Ocean University of China, Qingdao 266100, China
4
School of Electronic Engineering, Xidian University, Xi’an 710071, China
5
Department of Mathematics, The Chinese University of Hong Kong, Satin, Hong Kong 999077, China
*
Author to whom correspondence should be addressed.
Remote Sens. 2023, 15(23), 5441; https://doi.org/10.3390/rs15235441
Submission received: 13 October 2023
/
Revised: 14 November 2023
/
Accepted: 17 November 2023
/
Published: 21 November 2023
(This article belongs to the Special Issue Computational Intelligence for Remote Sensing Image Analysis and Applications)
Abstract
:Internal Solitary Waves (ISWs) play a pivotal role in transporting energy and matter within the ocean and also pose substantial risks to ocean engineering, navigation, and underwater communication systems. Consequently, measures need to be adopted to alleviate their negative effects and minimize linked risks. An effective method entails extracting ISW positions from Synthetic Aperture Radar (SAR) data for precise trajectory prediction and efficient avoidance strategies. However, manual extraction of ISWs from SAR data is time-consuming and prone to inaccuracies. Hence, it is imperative to develop a high-precision, rapid, and automated ISW-extraction algorithm. In this paper, we introduce Middle Transformer U2-net (MTU2-net), an innovative model that integrates a distinctive loss function and Transformer to improve the accuracy of ISWs’ extraction. The novel loss function enhances the model’s capacity to extract bow waves, whereas the Transformer ensures coherence in ISW’s patterns. By conducting experiments involving 762 image scenes, incorporating ISWs, from the South China Sea, we established a standardized dataset. The Mean Intersection over Union (MIoU) achieved on this dataset was 71.57%, surpassing the performance of other compared methods. The experimental outcomes showcase the remarkable performance of our proposed model in precisely extracting bow wave attributes from SAR data.
1. Introduction
Internal Solitary Waves (ISWs) are captivating phenomena that manifest within stratified fluids, like the ocean. Unlike surface waves, which propagate along the air–water interface, internal solitary waves propagate within the water column, well beneath the surface. ISWs display diverse features contingent upon specific conditions. One prevalent type is recognized as the “mode-1” wave, usually characterized by a bell-shaped or humpbacked profile, featuring a steep leading edge and a more-gradual trailing section. These waves can span horizontally for tens to hundreds of kilometers and vertically for hundreds of meters to several kilometers. Wave speeds typically range from a few centimeters to several meters per second. The ISWs play a significant role not just in ocean circulation and mixing, but also pose a substantial threat to ocean engineering and submarines. Firstly, ISWs offer a multitude of advantages. These promote nutrient redistribution, enhancing biological productivity and increasing fishery resources, influencing sediment dynamics and sustaining submarine canyons and channels. Additionally, they offer invaluable insights into ocean dynamics and ecosystems through scientific research [1]. Secondly, ISWs present notable risks in oceanic environments [2], encompassing potential ecological disruptions, navigational challenges, implications for offshore engineering, and the potential hazards they introduce to coastal regions. In conclusion, precise extraction of ISWs from the ocean is imperative, whether for capitalizing on their advantages or alleviating their risks. Hence, this paper introduces an innovative deep learning approach for accurately extracting high-precision ISWs from SAR images.
With the continuous advancement of remote sensing technology, the wealth of satellite data has evolved into a valuable resource for observing ISWs in the ocean [3]. Currently, two primary methods are employed for this purpose: satellite optical remote sensing and Synthetic Aperture Radar (SAR). Each of these methods possesses distinct advantages and disadvantages. Satellite optical remote sensing functions passively, capturing sunlight reflected from the sea surface to acquire information about ISWs. This method offers high temporal resolution and extensive coverage, presenting significant advantages for continuous, large-scale ISW observation over extended periods. However, it is susceptible to weather conditions and heavily relies on clear skies, rendering it ineffective during cloudy intervals. In contrast, SAR, functioning as an active radar sensor, can penetrate clouds and enables long-range, high-resolution detection in all weather conditions. Nevertheless, SAR exhibits lower temporal resolution and a narrower swath width, potentially hindering comprehensive and sustained ISW observation. SAR detects ISWs by observing their influence on the flow field of the sea surface, resulting in variations in the backscattering intensity of SAR and the formation of clear patterns of light and dark stripes in SAR images. Several factors, including other ocean phenomena like ship wakes, oil slicks, mesoscale eddies, and inherent limitations of radar sensors, can interfere with the subsequent detection and processing of ISWs. Furthermore, the intricate texture of SAR oceanic images presents challenges in automatically detecting and extracting the features of ISWs.
Before the emergence of deep learning methods, researchers relied on traditional approaches like Fourier analysis and wavelet transform to extract ISWs. Nevertheless, it is crucial to highlight that these methods are heavily dependent on human-designed feature extractors, necessitating specialized expertise and involving an intricate procedure. Additionally, each technique is crafted to suit specific applications, which curtails their capacity for generalization and resilience.
In recent times, deep learning has garnered substantial attention and has made remarkable strides across various disciplines. More specifically, researchers have effectively utilized deep learning methodologies to identify ISWs in the ocean. Convolutions have arisen as the principal approach for feature extraction in these investigations, bearing a pivotal role in the procedure. The implementation of deep learning technology has substantially accelerated the advancement of ISW research in the ocean, primarily attributed to the exceptional feature extraction capabilities demonstrated by Convolutional Neural Networks (CNNs). These methods have been pivotal in transitioning from manually crafted features to autonomously acquired features, leading to enhanced performance and overall task efficiency. In the realm of ISW research, noteworthy contributions have been made through the utilization of CNN-based networks. For instance, Bao et al. [4] automated the detection of ISWs in the South China Sea utilizing a Faster R-CNN network, while Zheng et al. [5] employed a Mask R-CNN network to segment ISW bands. Nevertheless, it is imperative to acknowledge that the aforementioned studies rely on conventional CNN models, which possess constraints in learning global features. In contrast, our model functions as a pixel-level classifier, enabling precise extraction of ISWs through pixel classification. This innovative approach significantly enhances the accuracy of ISW detection when compared to traditional CNNs.
Extensive research and experimentation have demonstrated the significant advantages of UNet’s pixel-level classification feature in ISW extraction. Previous research has proficiently employed the UNet model for oceanic ISWs investigation. Ma et al. [6] introduced the pixel attention UNet model, yielding positive results in ISW extraction. Building on the foundational UNet framework, we introduce the Middle-Transformer U-net (MT-net) model. It was explicitly designed to obtain accurate ISW extraction from SAR images. Precise ISW extraction notably enhances prediction accuracy, enabling meticulous positioning and precise shape determination. However, within the context of SAR images, ISWs frequently exhibit dense distributions, posing challenges to the practical implementation of the extracted ISWs. Our proposed model revolves around accurately extracting the key ISW features present in SAR images. This approach streamlines the derivation of vital ISW parameters.
In our pursuit of enhancing the precision of ISWs’ extraction, we have integrated Transformer into our model’s structural framework. Transformer incorporates an exceptional attention mechanism, enabling our network to pinpoint the distinctive features of ISWs. The introduction of a local attention mechanism resulted in fewer artifacts and enhanced continuity in the extracted ISWs’ stripes. To this end, we drew inspiration from attention-based models within the realm of computer vision, such as the Visual Transformer (ViT) [7]. Numerous researchers have proposed improved models for various tasks, all based on the ViT architecture. These models encompass the “Tokens-To-Token Vision Transformer (T2T-ViT)” [8], “Pyramid Vision Transformer (PVT)” [9], “Conformer Vision Transformer (CvT)” [10], and “PiT Transform” [11]. Separately, there are also models such as “LeViT” [12] and “LAD Transformer” [13], which are specifically designed for Synthetic Aperture Radar (SAR) images. While these models modify the network structure, the scope and nature of these modifications exhibit significant variability. Some models, like CaiT [14], Diverse Patch [15], DeepViT [16], and Refiner [17], specifically address deep Transformer issues. Additionally, certain techniques focus on enhancing the attention mechanism within the Transformer through strategies like position encoding [18,19,20], MHSA [21], and MLP.
Recent developments in the field of Transformers show a strong trend towards embracing a locality paradigm [22,23,24,25]. This paradigm involves intentionally integrating local attention mechanisms into the framework. Supervised Transformers are currently exploring structural combinations [26,27] and scaling laws [28,29]. Additionally, self-supervised learning plays a significant role in ViT [30,31,32,33,34,35]. Our model further incorporates the self-supervised Transformer to enhance the continuity of extracted ISWs, allowing for a clear differentiation between bow waves (long and continuous ISWs in SAR) and coda waves (relatively short and discontinuous, typically appearing after the bow wave in SAR). We will elaborate on this advantage in detail in Section 4 of our experiments; please consult that section for further information.
Recent developments in deep learning technology have opened up new avenues for extracting features related to ISWs in SAR imagery [36]. While various ISW-detection methods, such as those by Wang et al. [37] and Bao et al. [4], have achieved region-level target detection, they lack detailed information regarding the precise location and shape of ISWs. In 2020, Zhang et al. [38] successfully utilized a modified UNet to extract ISWs from optical images. Similarly, in 2021, Zheng et al. [39] introduced a SegNet-based algorithm for segmenting ISWs’ stripes in SAR data. However, it is important to note that Zheng’s method focuses solely on a limited area within the overall SAR image, thus lacking segmentation results for the entire image. Building on these advancements, Ma et al. [6] proposed a two-stage oceanic ISW signature segmentation algorithm for SAR in 2023. Despite these advancements, the application of deep learning for ISW extraction faces several complex challenges. Notably, continuity issues in the extracted ISWs underscore the need to enhance coherence in the results. Additionally, the presence of coda waves introduces a significant challenge, contributing extraneous noise and disruptions to the extracted primary ISWs strips. To address these challenges and enhance the accuracy of ISW extraction, our approach incorporates Transformer into the model’s structural framework. Transformer’s attention mechanism enables the network to focus on distinctive ISW features, while a local attention mechanism reduces artifacts in the extracted ISW stripes, thus enhancing continuity. This novel approach, along with the integration of self-supervised learning, is designed to improve the precision of ISW extraction and address the unique challenges posed by SAR imagery. Further details on this methodology can be found in the Experimental Section 4.
To address these significant challenges, a carefully crafted bespoke dataset was created. This dataset was then employed to extensively train the proposed MT-net model, specifically designed to work with this specialized dataset. The MT-net model, distinguished by its symmetrical architectural design, incorporates a Transformer within its central segment. This integration is aimed at enhancing the continuity of the results it produces. Additionally, a novel weighted loss function was introduced. This function was specifically designed to counteract the influence of extraneous coda waves, ultimately improving the accuracy of the extracted primary ISWs. The significant contributions of this study encompass both the innovative model and the carefully assembled dataset.
Firstly, as the innovation in the model, we present an ISW stripe segmentation approach employing the MT-net architecture. This method enables the extraction of continuous primary ISW strips from SAR images without interruption. By substituting Residual units with Transformers and enhancing sensitivity to bow waves while filtering out unnecessary coda waves, the model enhances the continuity in the results.
Secondly, as the innovation in the data, the scarcity of publicly accessible ISW datasets necessitated the development of a proprietary dataset. This dataset encompasses 762 samples showcasing distinct ISW stripes. Employing Photoshop software, we performed meticulous one-to-one image–label annotations and, subsequently, partitioned the dataset into training and test subsets, consisting of 682 and 80 samples, respectively.
The structure of the paper is as follows: Section 2 introduces the proposed method. Section 3 encompasses the experimental facets, including the data sources, dataset description, experimental setup, and evaluation metrics. In Section 4, we analyze and discuss the experimental results obtained from our dataset and the enhancements made to the model. Lastly, Section 6 provides conclusions and outlines prospective avenues for future research.
2. Methods
In this section, we elucidate the network architecture of MT-net, meticulously crafted for the precise extraction of ISWs from SAR images.
2.1. Network Architecture
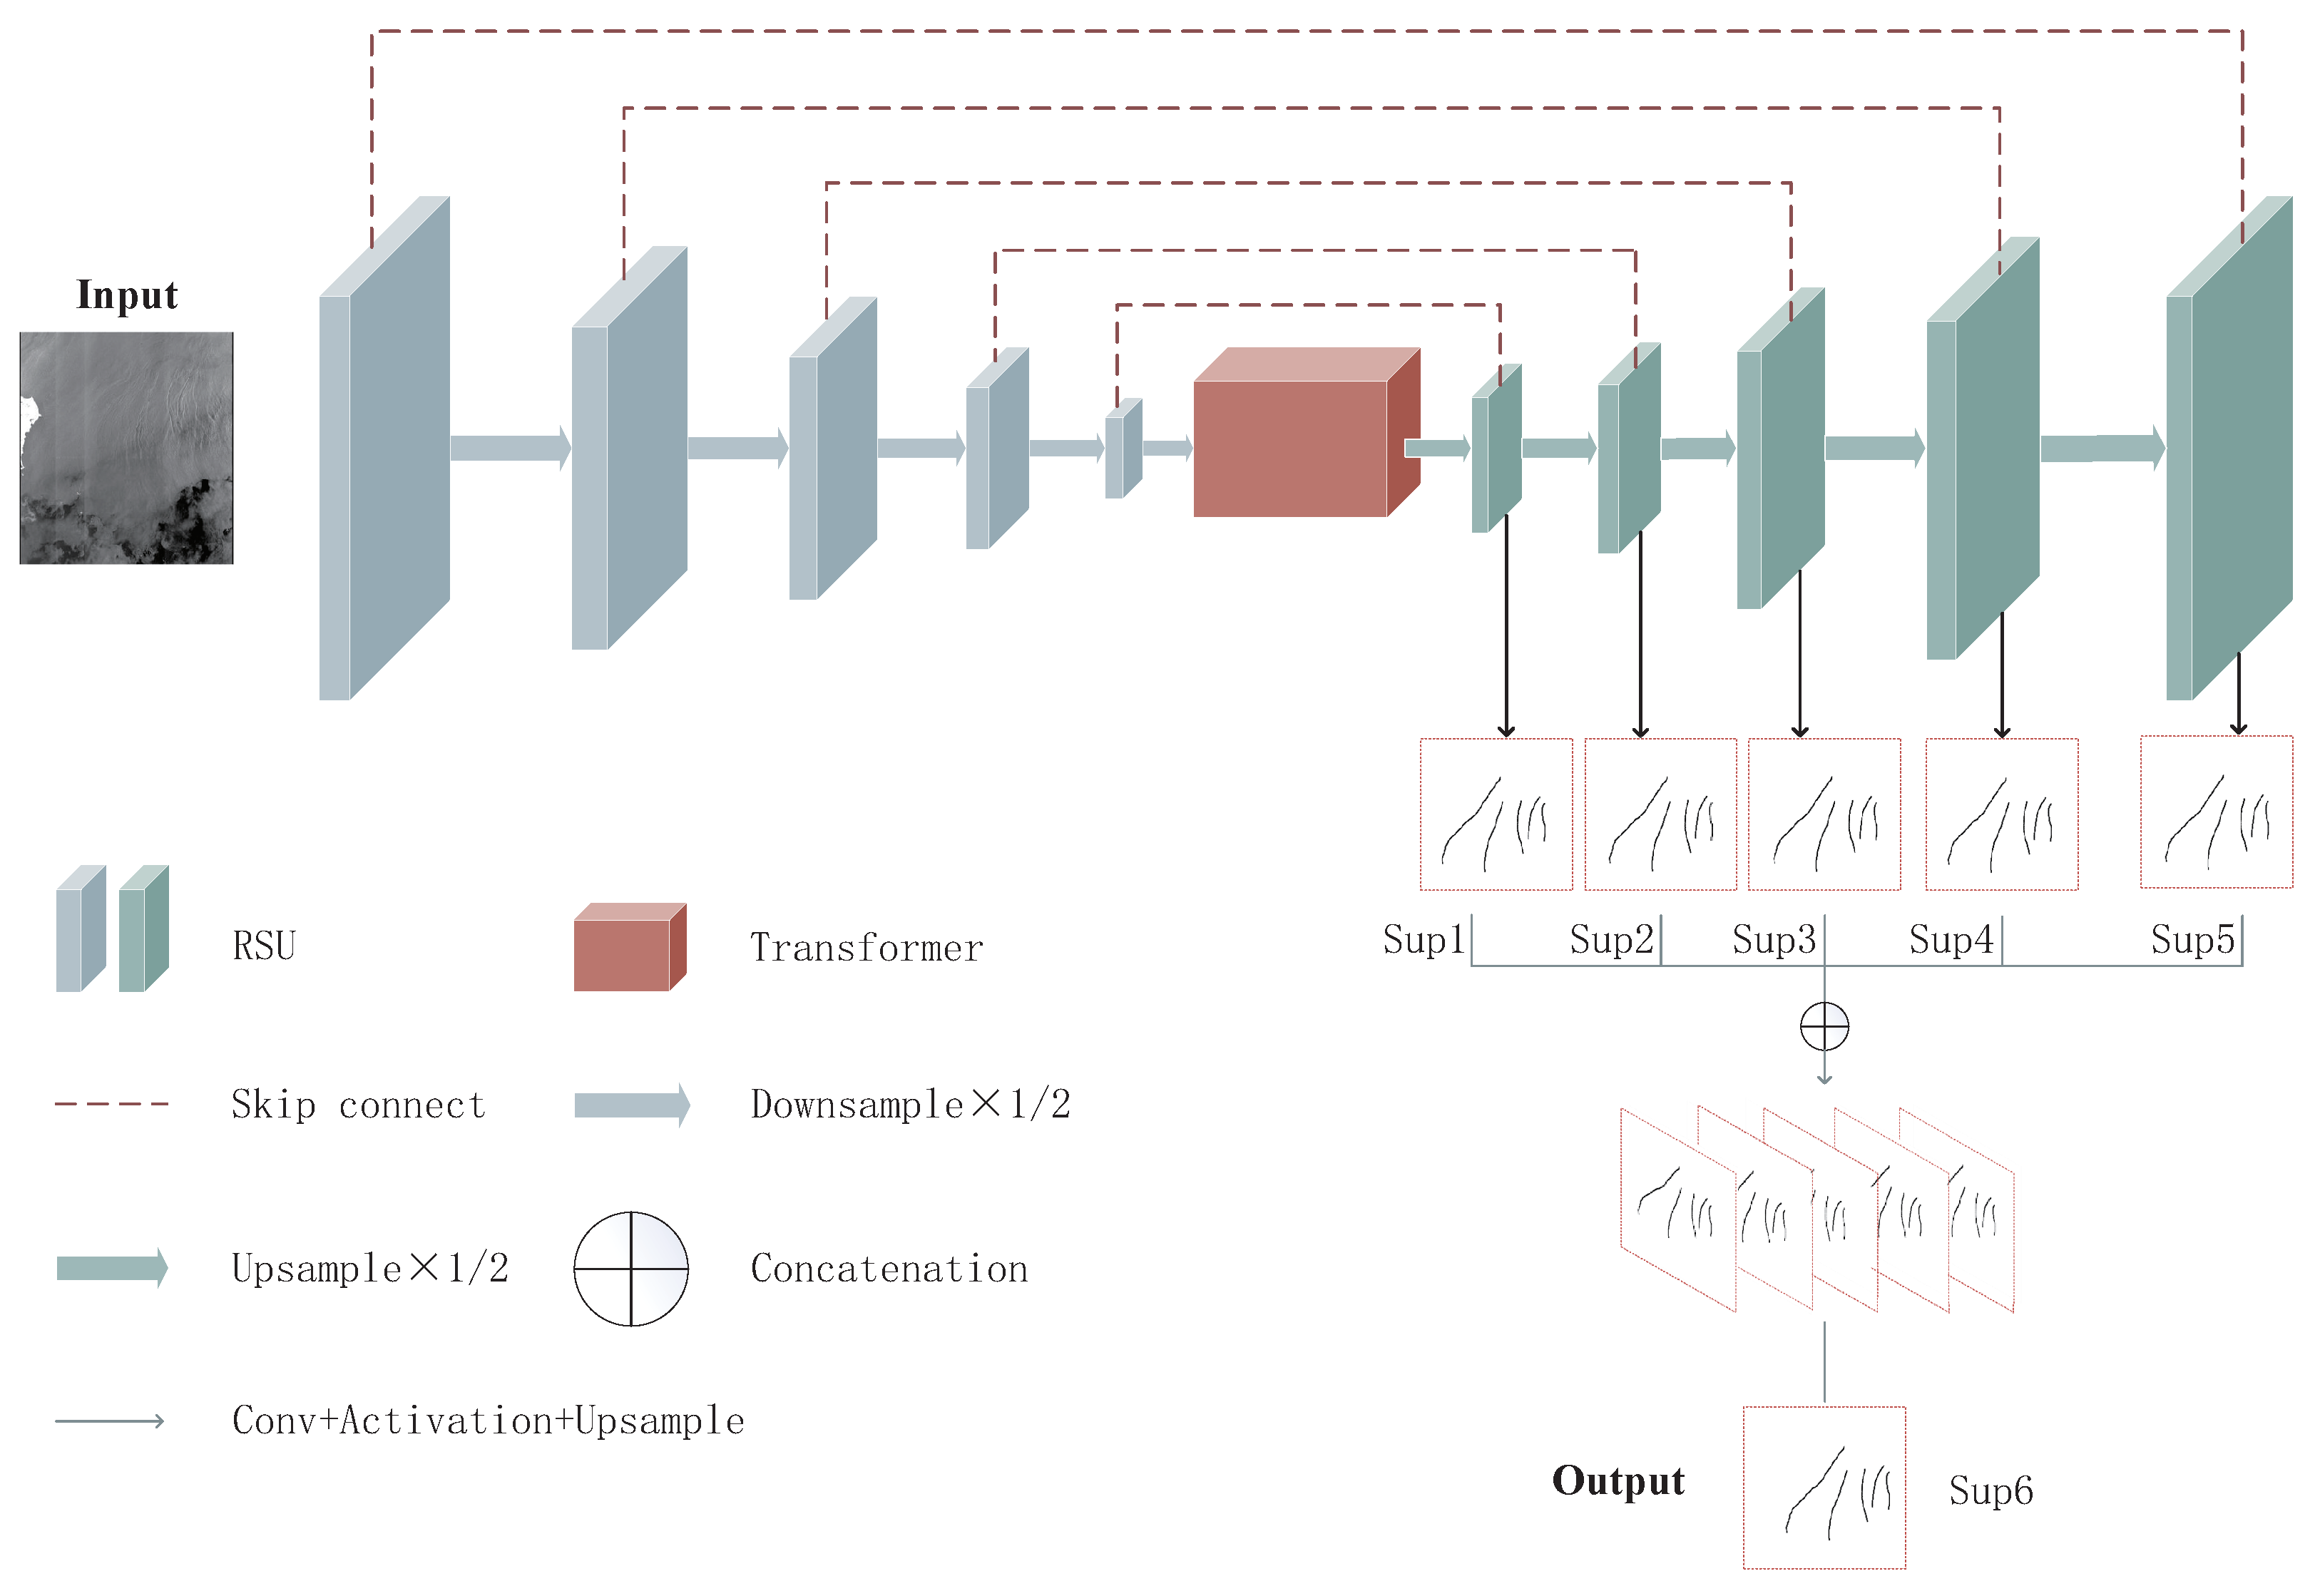
The MT-net model, as shown in Figure 1, was purposefully designed for precise ISW extraction from SAR images, boasting a specialized architecture. Following the Encoder–Transformer–Decoder paradigm, we meticulously explore the structure of each module in the upcoming sections, providing comprehensive insight into their components and arrangement. MT-net employs a two-level nested U-structure, comprising an outer layer with 11 stages. To enhance the extraction of multi-scale and multi-level features, the Residual U-block is incorporated into 10 of these stages. This architecture encompasses four essential components: (1) Encoder, (2) Decoder, (3) Transformer module, and (4) Feature Map Fusion module:
- (1)
- Encoder module:
The Encoder stage comprises five individual stages, each constructed using a Residual U-block (RSU), which is shown in Figure 2. In the initial four stages, RSUs with varying depths are employed to enhance the model’s receptive field and provide access to a broader range of local and global information. In the final stage, dilated convolutions are used instead of pooling operations to expand the receptive field and retain contextual information that might be lost during pooling. This design ensures a comprehensive integration of deep and context-preserving features within the MT-net architecture.
- (2)
- Decoder module:
The Decoder stage mirrors the structure of the Encoder stage, maintaining a parallel framework. In each iteration of the Decoder stage, a concatenation process is executed, merging the upsampled feature maps from the preceding stage with those originating from its symmetrical Encoder stage. This amalgamated set of feature maps subsequently serves as the input for the subsequent operations. This design ensures the effective integration of feature information and contributes to the overall flow of the MT-net architecture.
- (3)
- Transformer module:
Illustrated in Figure 3, the Transformer module adheres to the identical input–output pattern. The input comprises a one-dimensional sequence of embedding features , where L signifies the sequence length and C represents the size of the hidden channel. Accordingly, serialization of the input image is necessary, involving the transformation of into Z. Notably, the output requires conversion from a vector to a 2D format, accomplished through a basic upsampling technique. For further insights, please refer to Section 2.3.
- (4)
- Feature Map Fusion module:
As the final step, the Feature Map Fusion module employs a deep supervision strategy to generate a probability map. Generating five side outputs, the model subsequently upsamples them to align with the input image’s size and fuses them using concatenation operations.
2.2. Residual U-Blocks
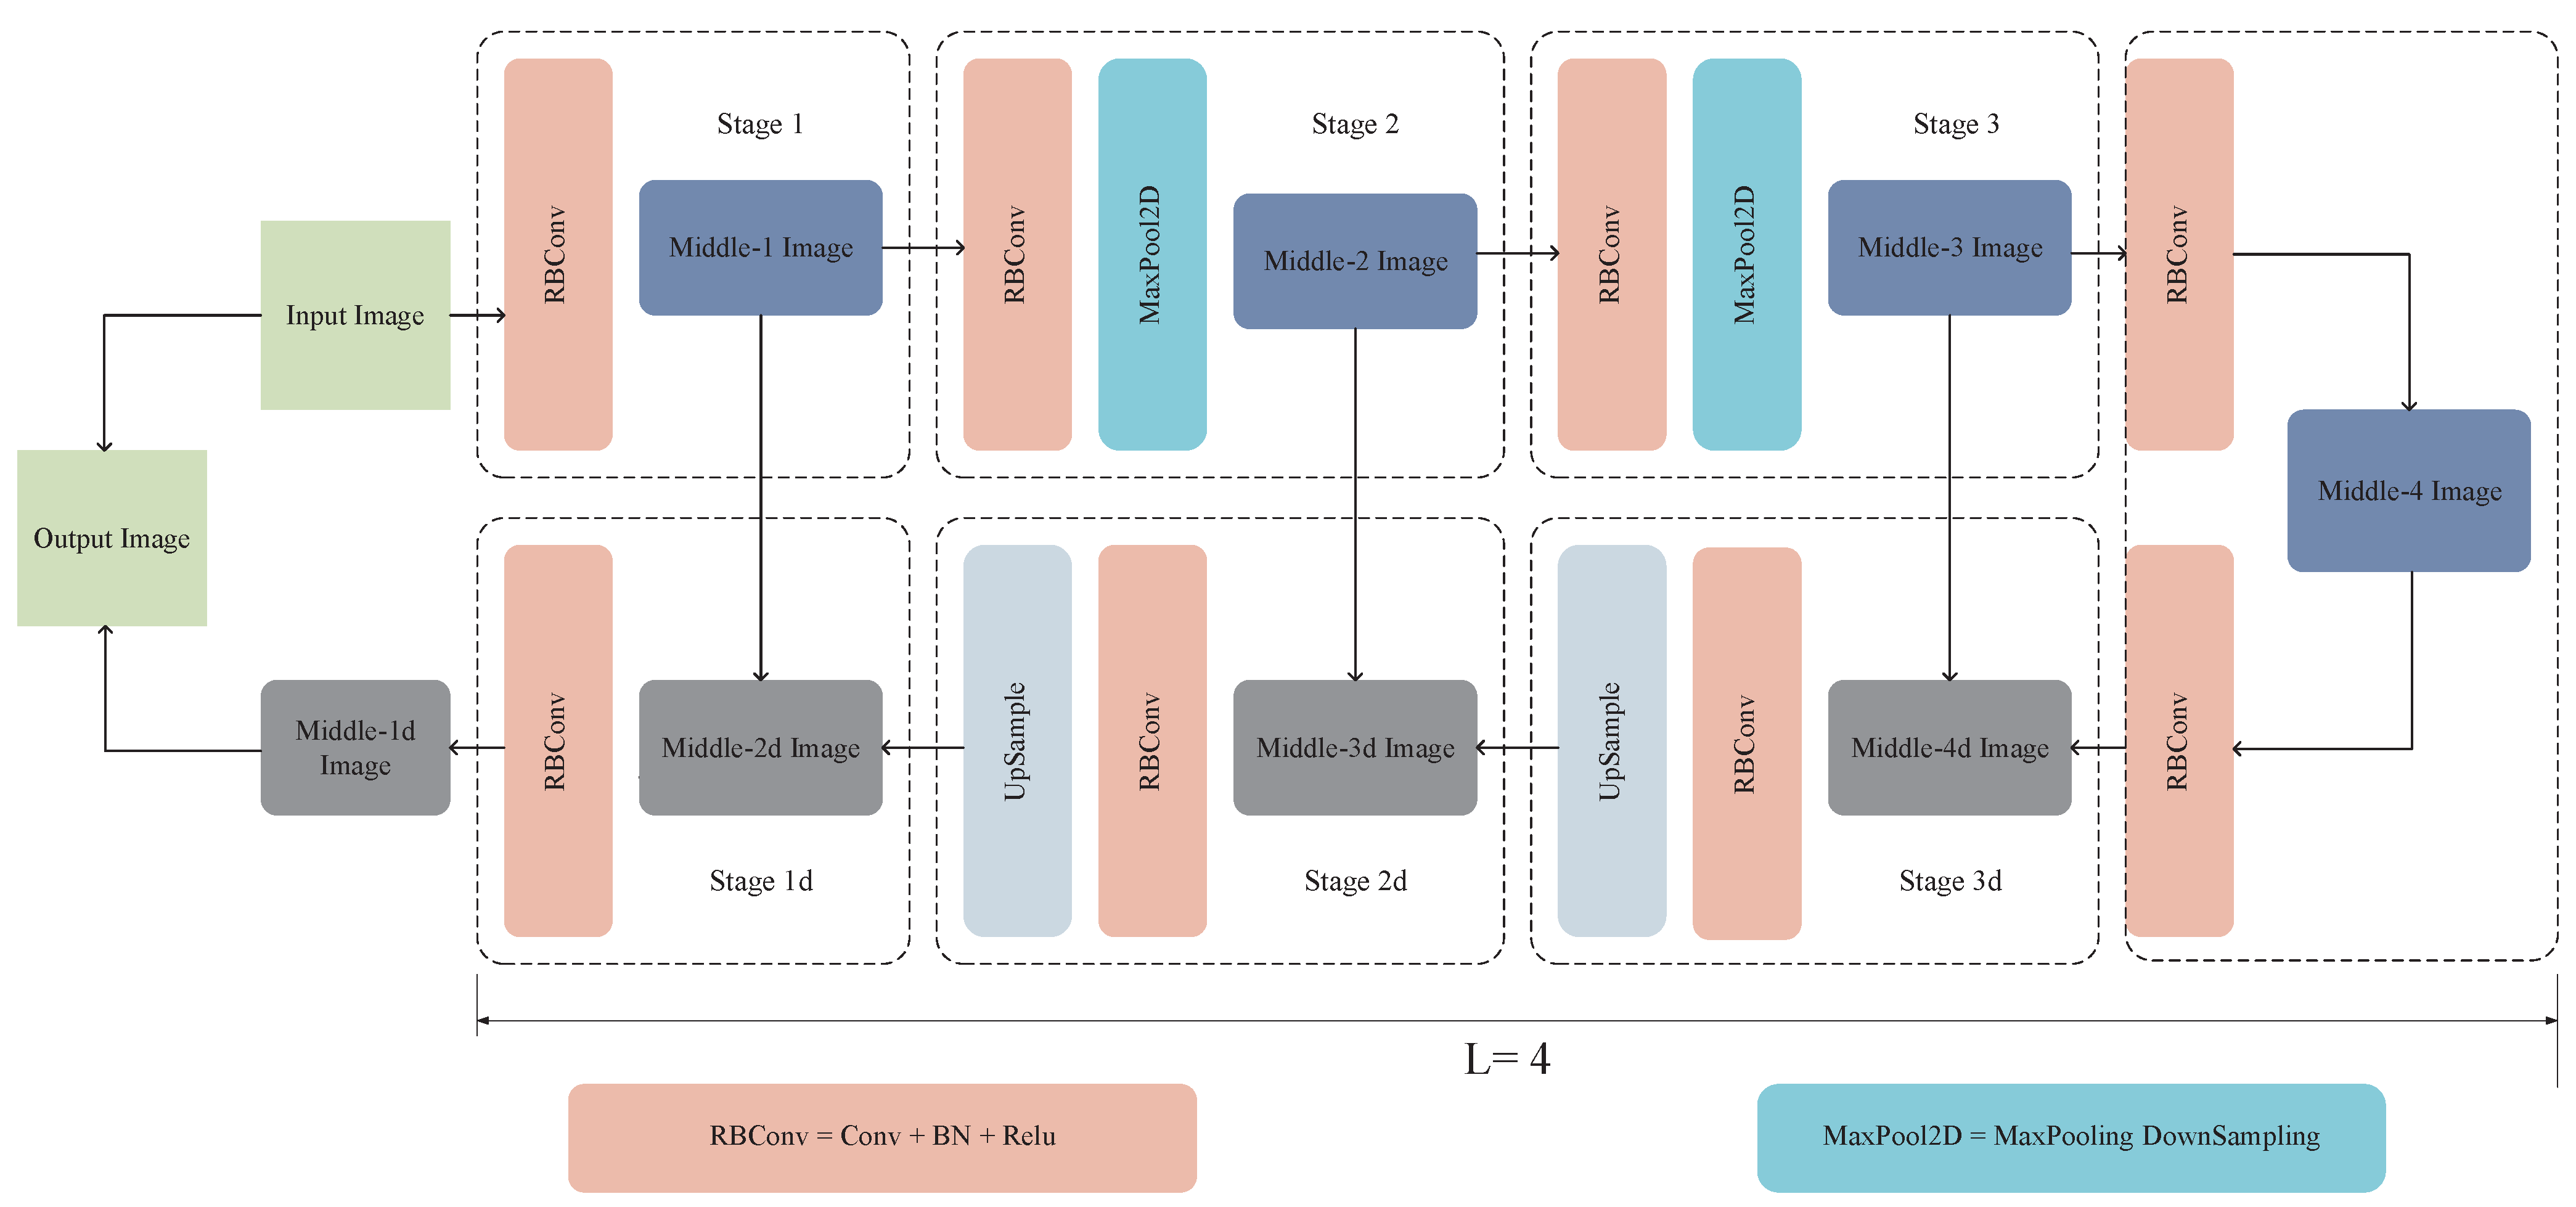
Differing from the preceding Plain Convolution block (PLN), Residual-like block (RES), Inception-like block (INC), and Dense-like block (DSE), the RSU serves as a Residual module within a U-shaped structure, designed to capture multi-scale features. Figure 2 illustrates the structure of RSU-L, where L denotes the number of Encoder layers. Here, Stage X (X = 1, 2, 3) and Stage Y (Y = 1d, 2d, 3d) correspond to the downsampling modules and upsampling modules, respectively, while Middle-Z Image (Z = 1, 2, 3, 4, 4d, 3d, 2d, 1d) signifies the images generated during the process.
Initially, the RSU-L block converts the input feature map into an intermediate map containing channels. Subsequently, a symmetrical Encoder–Decoder structure with a height of L is employed, where the intermediate feature map x functions as the input and acquires the ability to extract and encode contextual information across various scales. Elevating the value of L yields a deeper RSU, thus engendering a greater number of pooling operations, an expanded array of receptive fields, and a heightened quantity of both local and global information. The RSU integrates the concept of UNet, thereby fusing local and global information via Residual connections. This process effectively alleviates the loss of detail that can result from direct upsampling, thus safeguarding more-intricate features.
2.3. Middle-Transformer
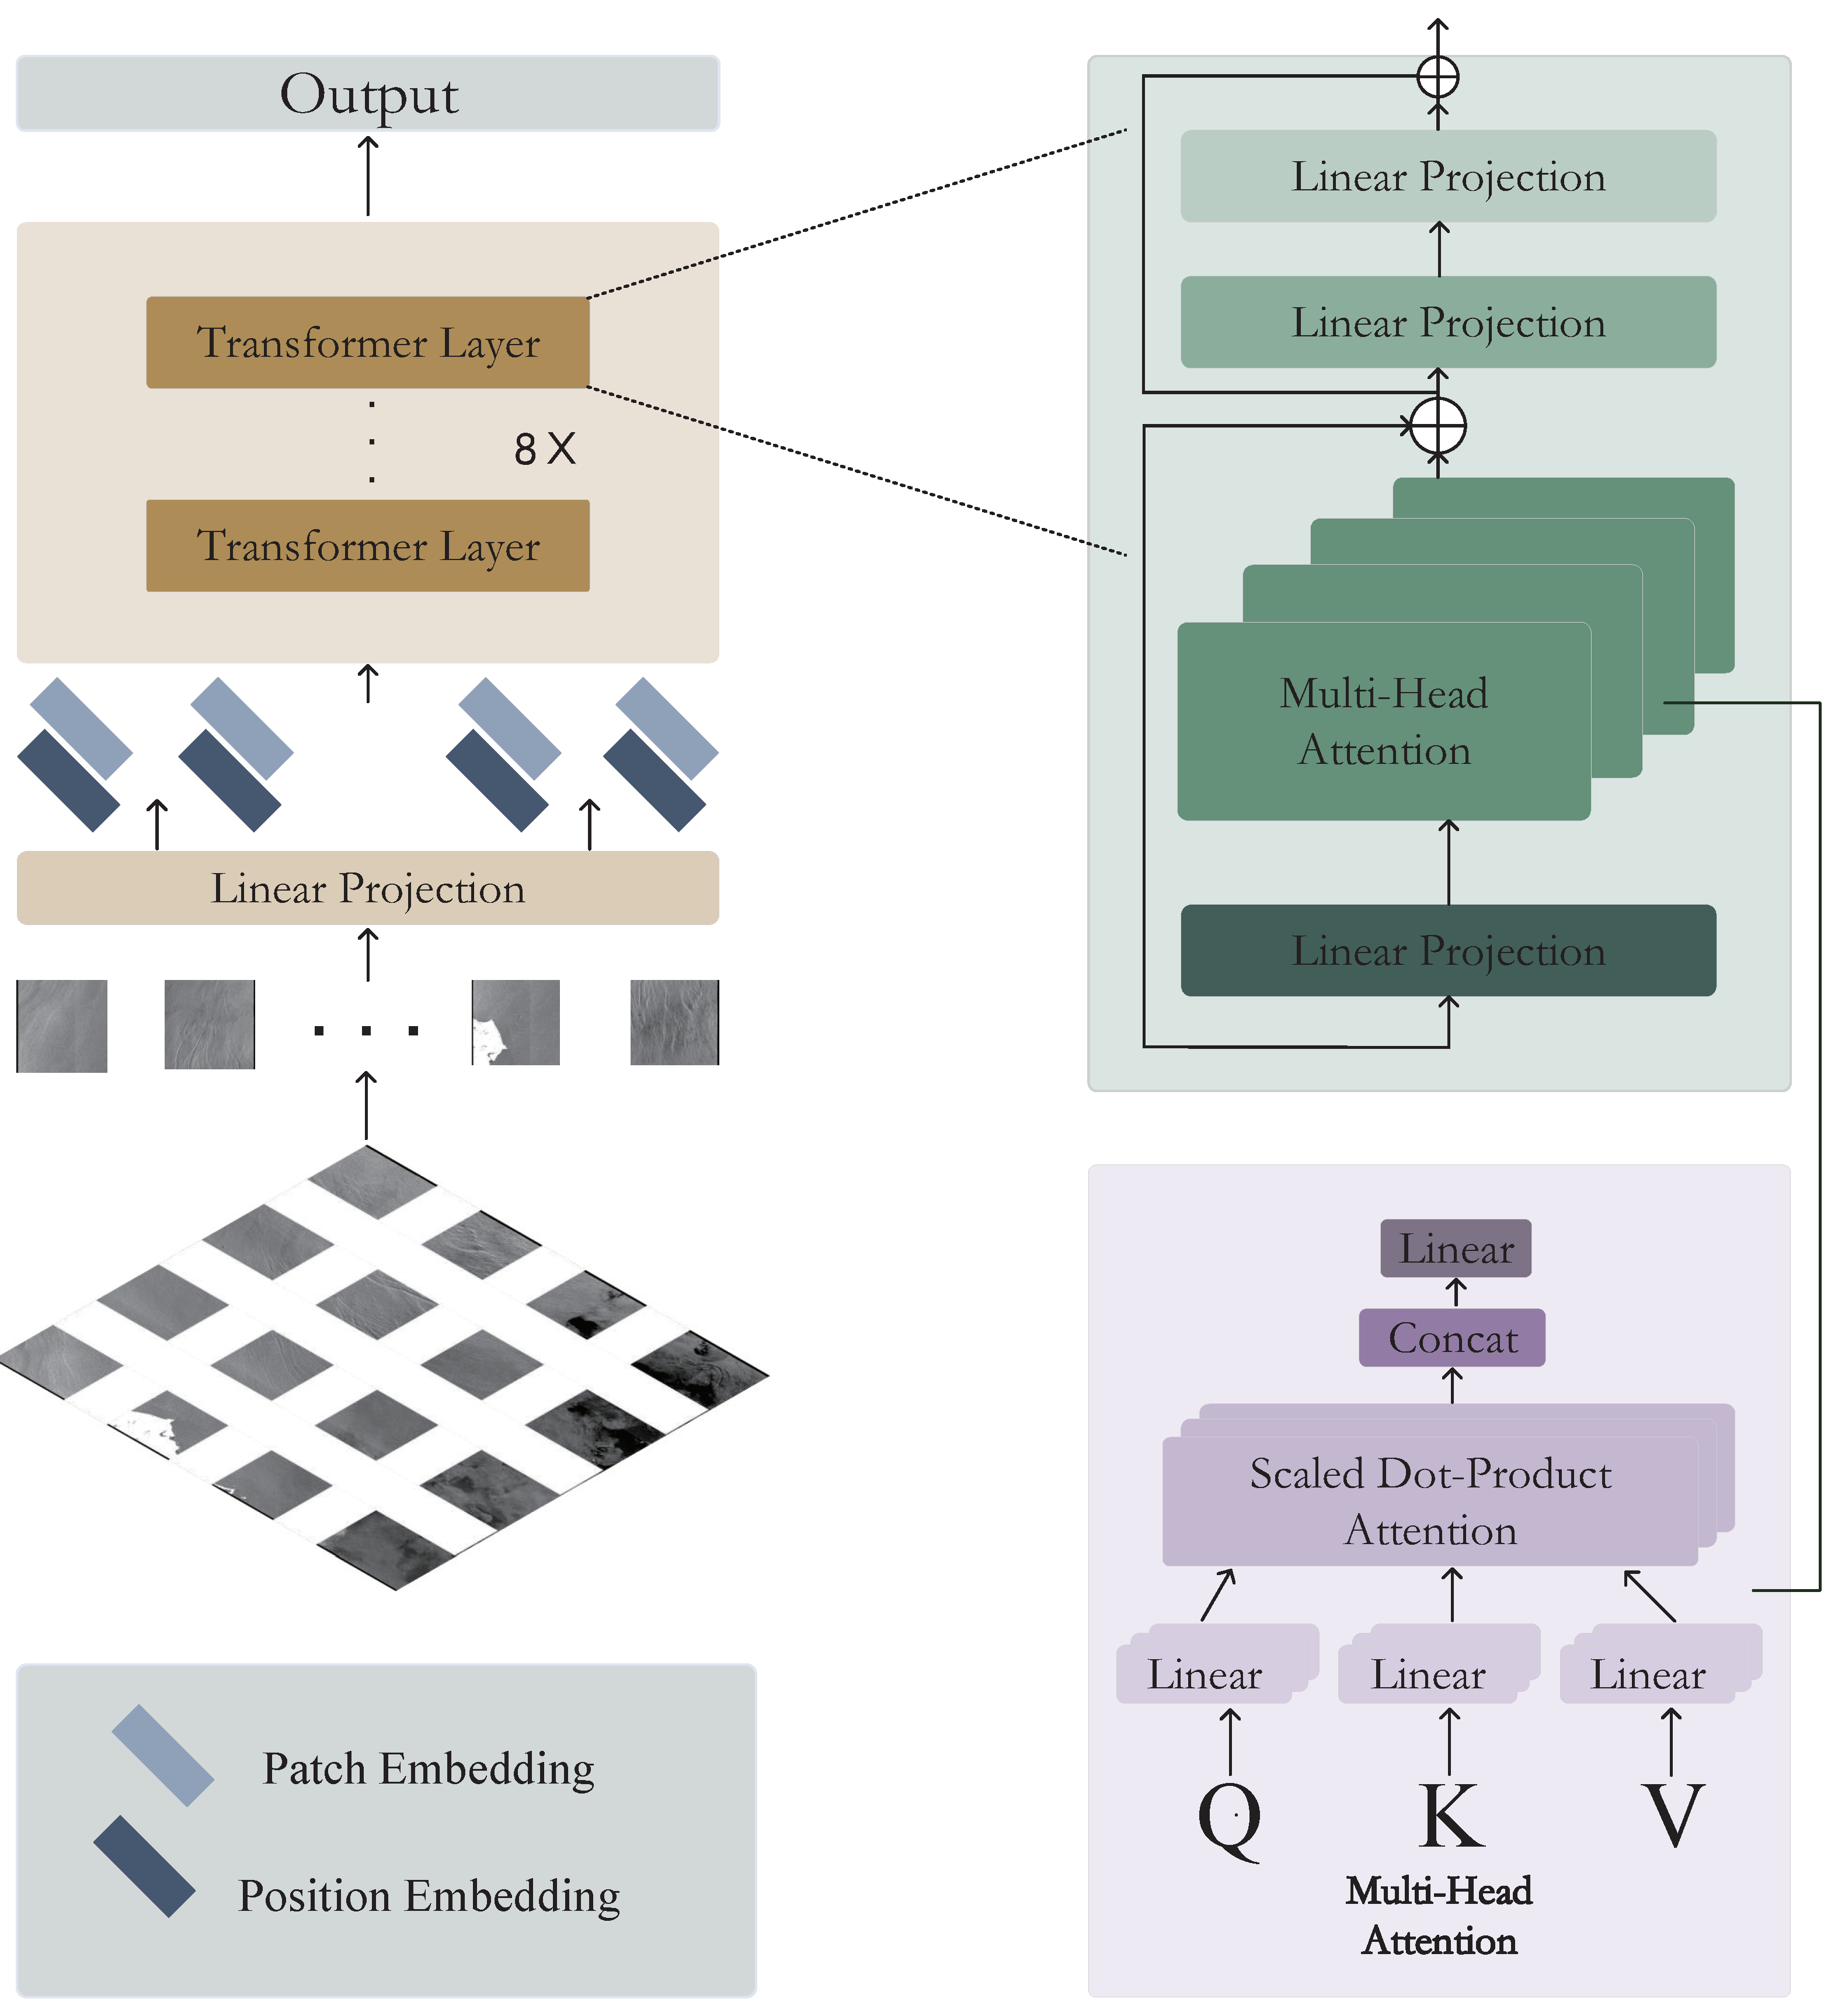
The Middle-Transformer functions as a local attention mechanism that enhances the ISWs’ continuity by effectively extracting global semantic information and minimizing resolution loss. The process unfolds in the subsequent steps. Initially, an image of dimensions is transformed into 256 patches, each measuring . This results in an input sequence length of for the Transformer. Subsequently, the patches are converted into vectors, represented as , and then, subjected to the Linear Projection function, producing the vector . This provides the input for the initial Transformer layer, expressed as , with symbolizing the patch embedding and denoting the position embedding, as depicted in Figure 3.
Every layer of the Transformer model includes three crucial elements: Multi-Head Attention, Layer Normalization, and Multi-Linear Project. Within the Multi-Head Attention layer, the Query (Q), Key (K), and Value (V) are calculated using the subsequent equations:
To derive the Self-Attention mechanism’s output, we utilize the subsequent formula:
In this context, the parameter signifies the vector’s dimensionality, aligning with the matrix’s column count. As a result, the Multi-Head Attention’s output is determined by the subsequent expression:
At this stage, we acquire the input for the Multi-Layer Perceptron (MLP), comprising the input, output, and hidden layers.
2.4. Loss
Our model generates five saliency probability maps as side outputs: Sup1, Sup2, Sup3, Sup4, and Sup5. These maps undergo concatenation, followed by a 1 × 1 convolutional layer and a sigmoid function. This process yields the ultimate saliency probability map, Sup6 (refer to Figure 1). To account for ISWs’ characteristics, we introduce a novel loss function that efficiently mitigates interference and aids in crest lines’ and wave packets’ extraction. The defined training loss is:
where (where M = 5, corresponding to Sup1, Sup2, Sup3, Sup4, and Sup5 in Figure 1) indicates the loss of the side output saliency map and (corresponding to Sup6 in Figure 1) signifies the loss of the final fusion output saliency map . Here, we assigned weights, and , to each loss term (in this experiment, we assigned equal weights of 1 to each loss term). Each loss term is a combination of the Binary Cross-Entropy (BCE) and the absolute Dice losses:
where and represent weighting coefficients. After empirical testing, we fixed and . The definition of is given by Equation (6):
where denotes the pixel coordinates and represents the image size. and stand for the pixel values of the ground truth and the predicted saliency probability map, respectively.
For capturing the primary ISWs, we introduced the Abs-Dice loss, enabling us to filter out insignificant information. The Abs-Dice loss is formulated in Equation (7):
In this context, stands for the network’s predicted values, and corresponds to the network’s target values, where 0 and 1 indicate distinct categories. We fixed the smoothing coefficient as .
ISWs in SAR images exhibit a non-uniform distribution. In regions with dense stripes, the presence of numerous discontinuous and incomplete coda waves leads to substantial interference in the extraction of ISWs, thereby limiting their practical applications. The novel loss function proposed in this study offers an effective solution to address these challenges. The merits of our loss function are comprehensively discussed in the Experimental Results Section (Section 4).
3. Experimental Section
We implemented our model using the PyTorch 1.12.1 machine learning library along with the CUDA toolkit 9.1.85. To evaluate the effectiveness of our model, we conducted experiments focused on ISW extraction and compared the outcomes with those of semantic segmentation models. This section offers a comprehensive overview of the data source, dataset, experimental setup, and evaluation criteria.
3.1. Data Source
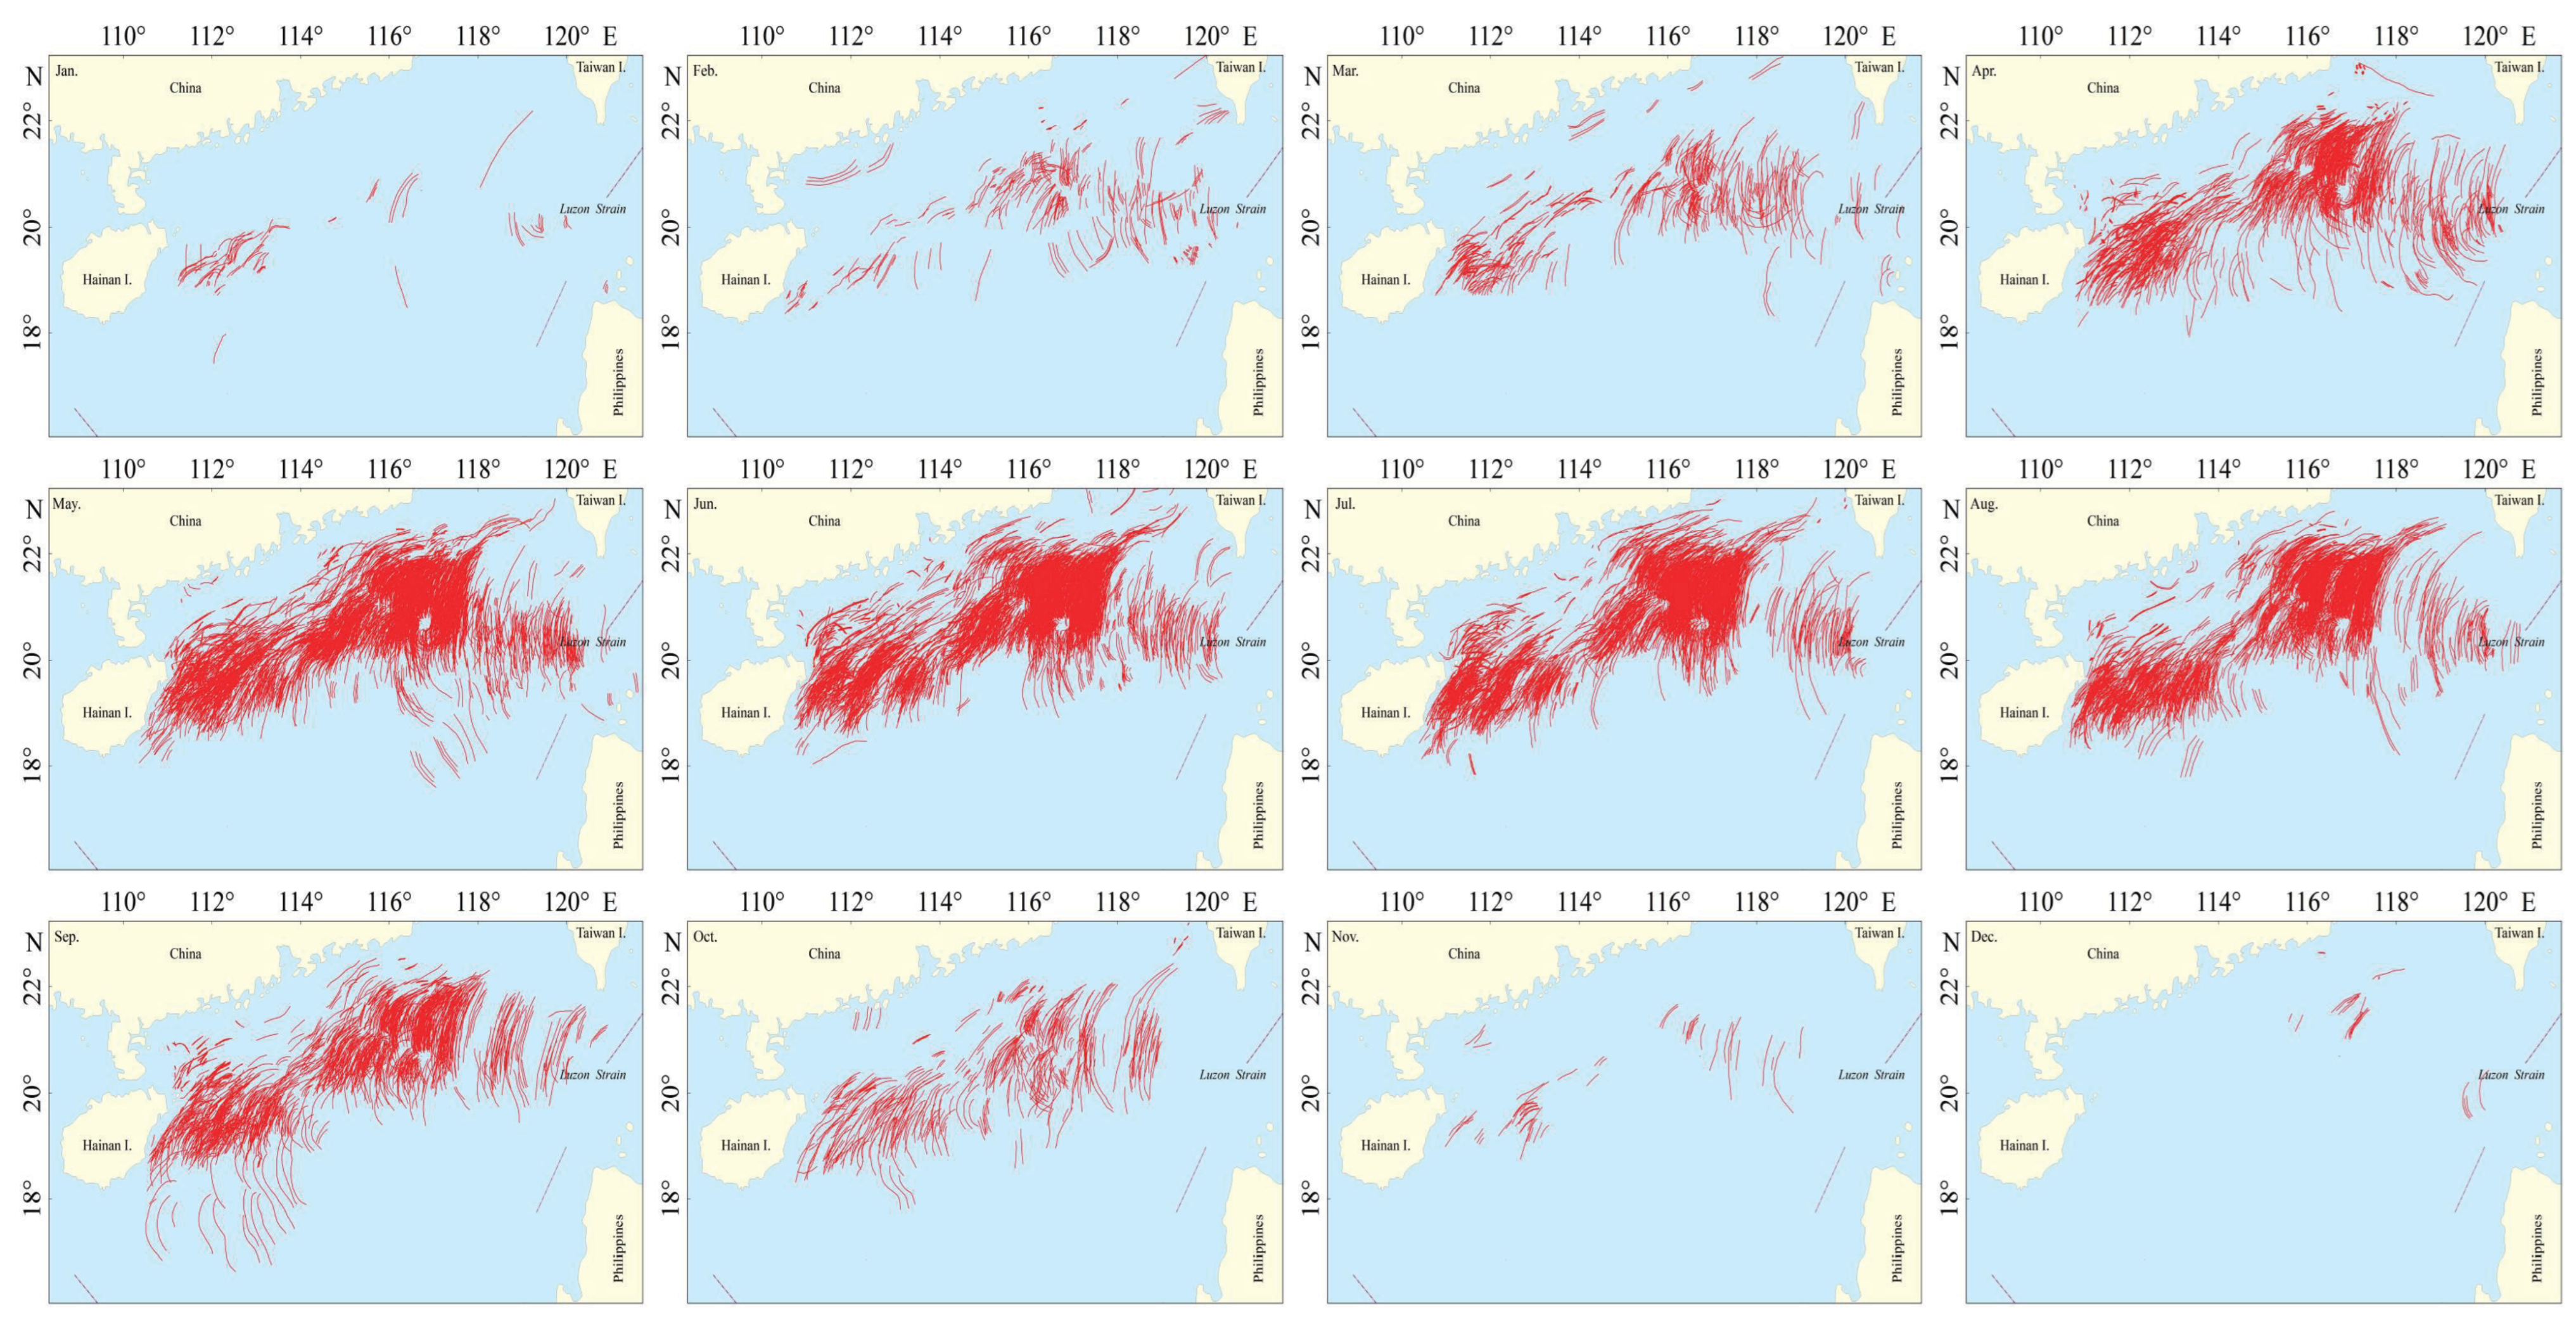
The South China Sea, located in the Western Pacific Ocean, witnesses the occurrence of ISWs throughout the entire year. As shown in Figure 4 [40], the ISWs occurring in the South China Sea showcase significant large-scale structures. Most ISWs in the northern part of the South China Sea propagate in a westward direction. The bow wave, which can extend up to 200 km with an amplitude of 100 m, is readily observable in SAR imagery. This characteristic led us to choose the South China Sea as our primary research area.
3.2. Dataset
In 2022, Tao M.and colleagues released an ISW dataset for object detection [41], but as of now, there is no publicly available ISW dataset specifically designed for semantic segmentation, Consequently, we needed to create our dataset independently. In this study, we collected a total of 762 ISW images captured by the Environmental Satellite Advanced Synthetic Aperture Radar (ENVISAT ASAR) from the South China Sea region acquired from 2003 to 2012. ENVISAT ASAR operated within the C-band at a wavelength of 5.6 cm and employed the Wide Swath Mode (WSM) with a spatial resolution of 150 m, utilizing VV/HH polarization. The swath width was approximately 400 km. We created our dataset by manually drawing isolated internal wave patterns using the Adobe Photoshop software 22.2.0 to generate the training labels required for our task. Therefore, our dataset differs in structure from the aforementioned dataset. In the initial experimental phase, we employed the Photoshop software to create one-to-one image–label annotations corresponding to the ground truth. While we resized and normalized the images during data augmentation, our experiments demonstrated that techniques like flipping and rotating, which often enhance dataset quality, did not notably enhance the ISW extraction in the South China Sea. This outcome can be attributed to the distinct origin and westward propagation of ISWs from the Luzon Strait, resulting in clear formation and propagation patterns. Flipping and rotating images would compromise the distinctive features of South China Sea ISWs. The dataset includes 762 samples, each featuring distinct and well-visible ISW stripes, meticulously selected from the original samples. Subsequently, we divided the dataset into a training subset (90%) and a test subset (10%) through random sampling, which included 682 and 80 samples, respectively.
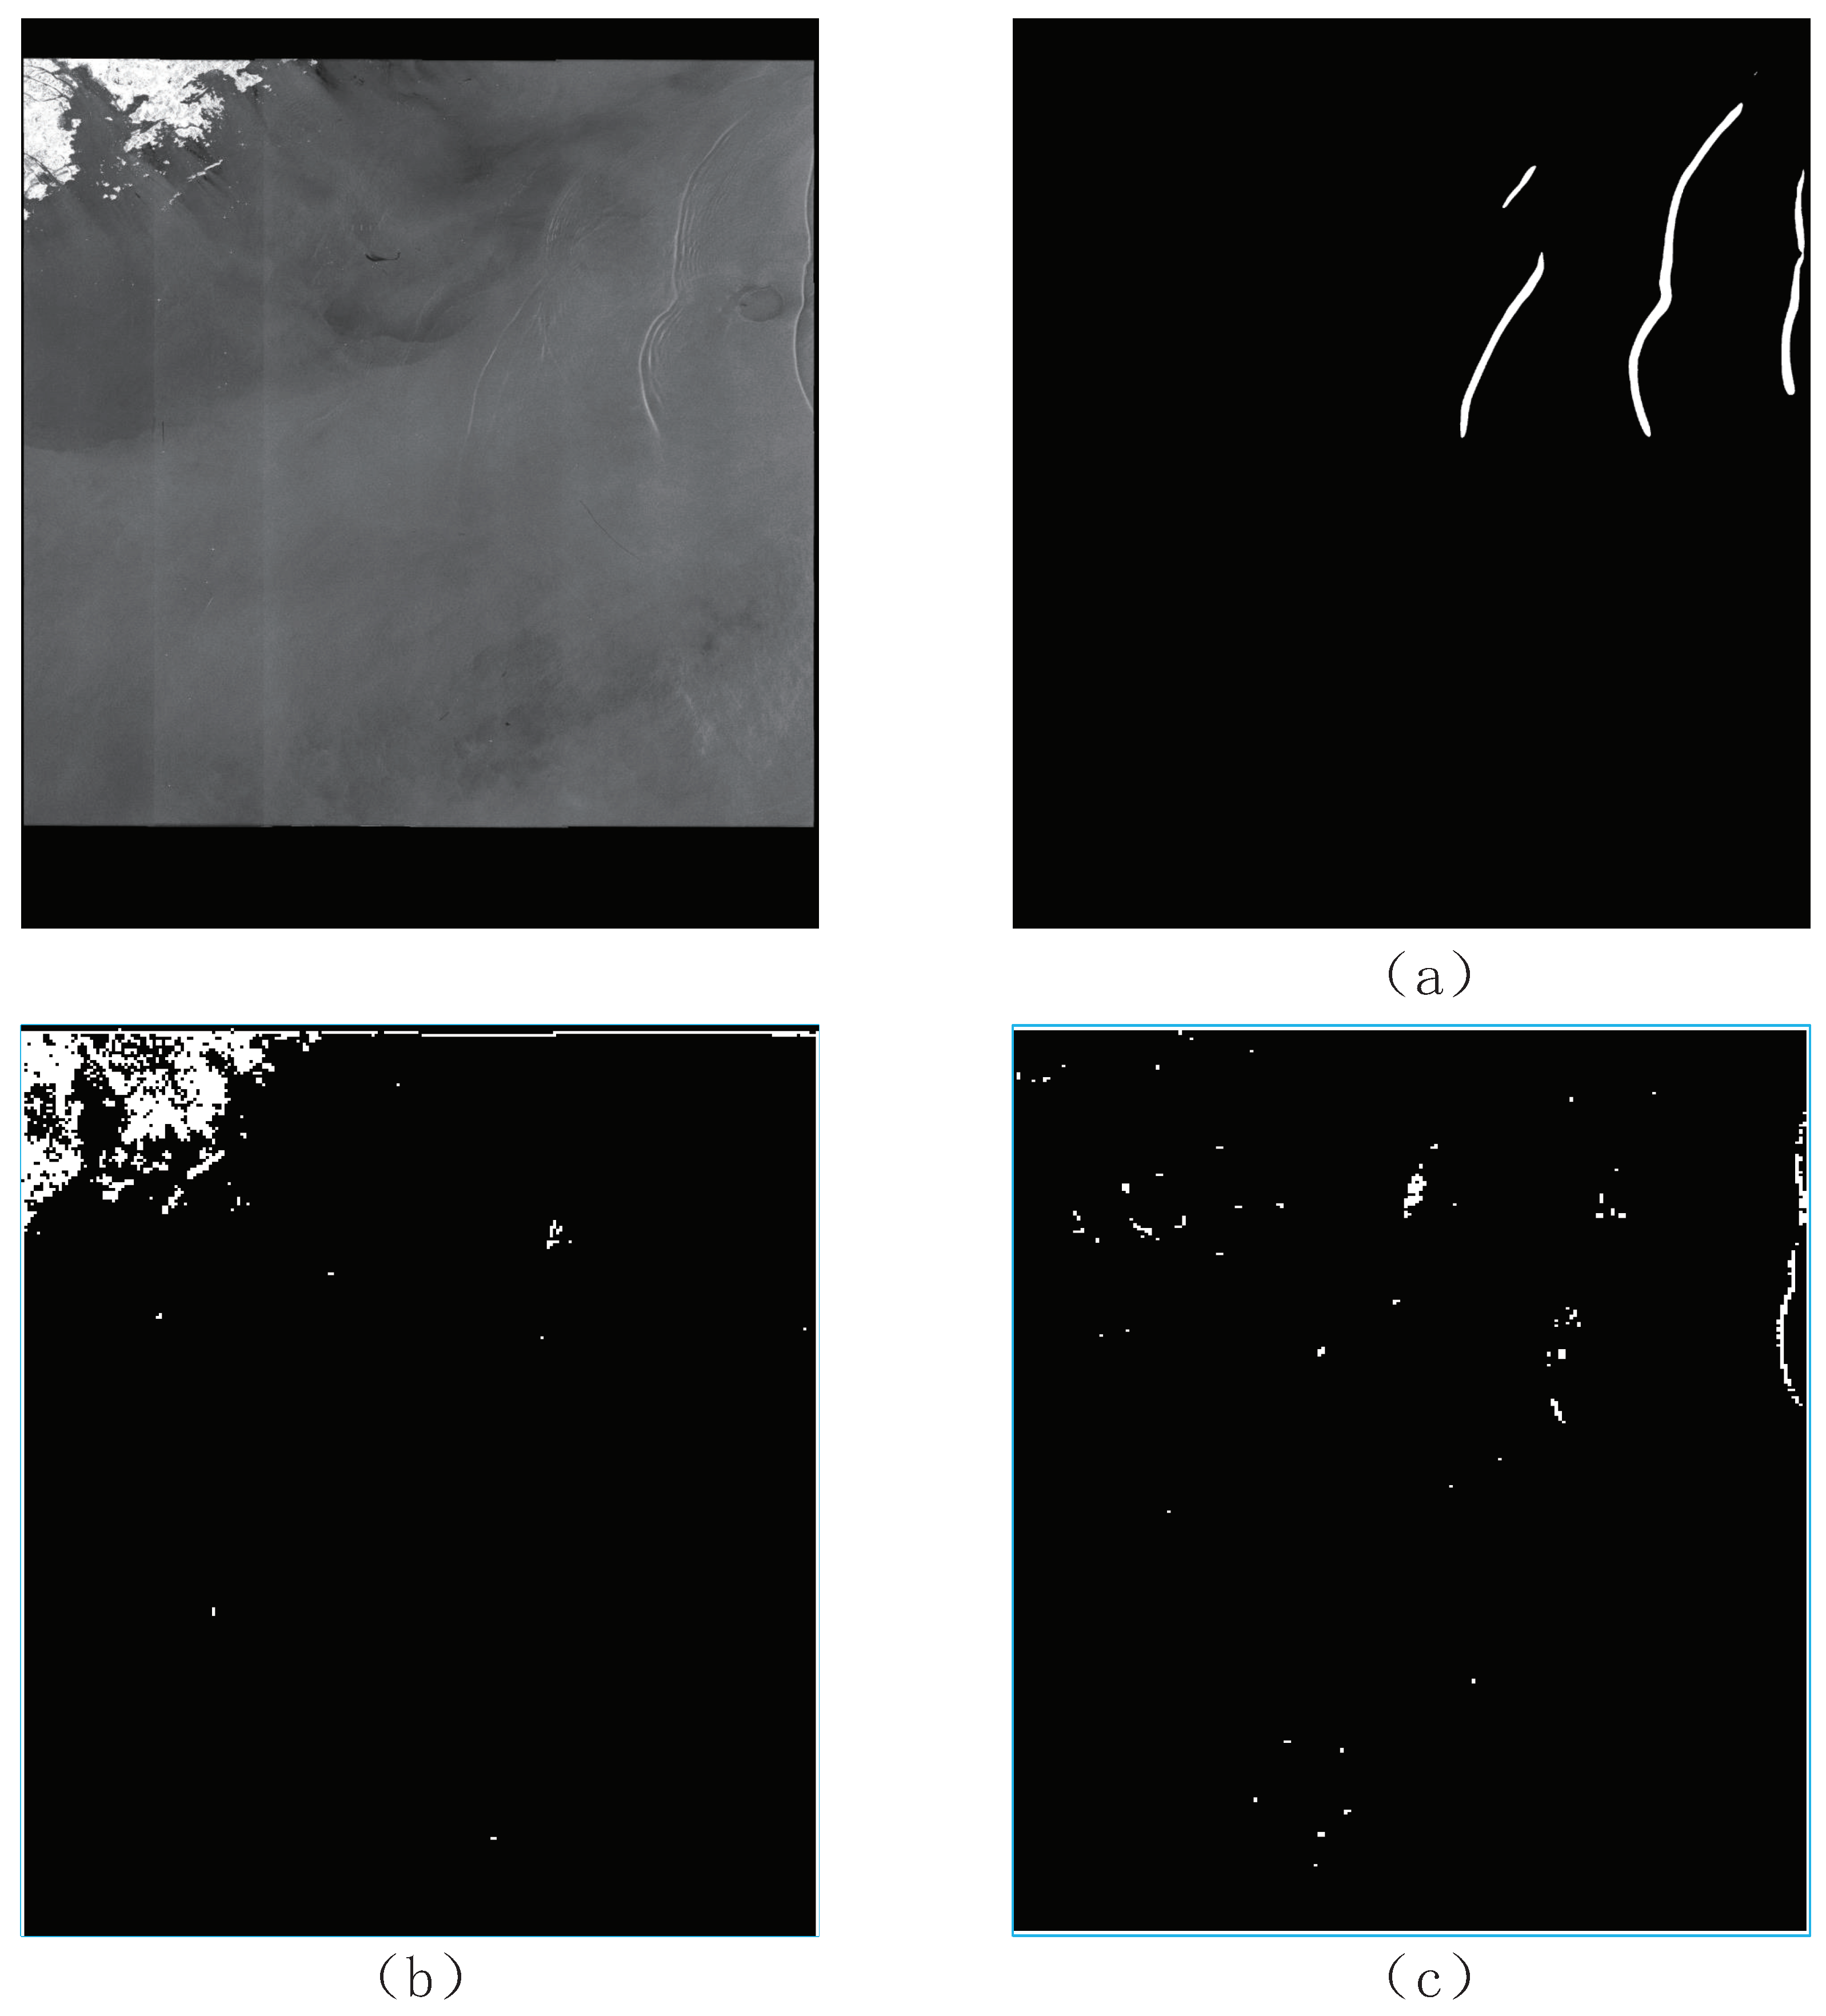
Traditional image-processing methods have exhibited comparatively limited success in extracting ISWs from this dataset. In contrast, the deep learning approach introduced in this paper yielded impressive outcomes in ISW extraction using a modest SAR dataset, underscoring the model’s exceptional capacity for generalization. As depicted in Figure 5, the deep learning model adeptly extracted ISWs from mixed SAR images containing both oceanic and terrestrial regions. Conversely, conventional methods like Canny not only delineate ISW curves, but also recognize land-based features like coastlines, rivers, and roads, as well as non-ISW curves on the sea surface.
3.3. Experimental Setup
Owing to the infrequent occurrence of ISWs, our dataset was comparatively small. Consequently, we introduced a model tailored for small datasets named MT-net, built upon the UNet architecture. In order to substantiate the efficacy of our model, we conducted comparisons with several alternative models. Given that the core of a semantic segmentation model revolves around pixel-level prediction, it is imperative to juxtapose our model with contemporary preeminent semantic segmentation approaches like Transfuse [42], Polyp-PVT [43], Swin-UNet [44], and -net [45].
The model was implemented and evaluated on a 64-bit Ubuntu 18.04.6 system, utilizing PyTorch and an NVIDIA A100 GPU. For optimization, the model employed the Adam optimizer with a learning rate of 0.001, a value of 0.9, and an epsilon set at . As previously mentioned, the model underwent training from scratch, abstaining from the utilization of pre-trained weights. Following each upsampling stage, the feature map was expanded to match the original image dimensions via bilinear interpolation, generating a collection of five side outputs. Ultimately, a convolution operation was implemented to generate the fusion outcomes. The loss computation was based on the labels of the six output results, encompassing Sup1, Sup2, Sup3, Sup4, Sup5, and Sup6, as detailed in Equation (4).
3.4. Evaluation Metrics
In order to comprehensively assess our model’s performance, we employed three widely recognized metrics in the field of semantic segmentation: the F1-score, Mean Accuracy (MACC), and Mean Intersection over Union (MIoU). The F1-score is a metric that quantifies the precision of binary classification models by simultaneously taking into account the accuracy and recall of the classification models (Equation (10)). Precision signifies the proportion of accurately identified “edge” pixels in relation to the ground truth (Equation (8)), while recall quantifies the number of “edge” pixels present in the ground truth that are correctly predicted (Equation (9)). MACC represents the average accuracy encompassing all classes (Equation (11)). The MIoU stands as a widely adopted measure in the domain of semantic segmentation. It computes the ratio of the intersection and union for each class, followed by an average calculation (Equation (12)).
True Positive (TP)signifies the count of pixels accurately identified as “edge”; False Negative (FN) indicates the number of pixels mistakenly not identified as “edge”; False Positive (FP) represents the quantity of “non-edge” pixels in the ground truth dataset erroneously labeled as “edge” by the model; True Negative (TN) reflects the number of pixels correctly identified as “non-edge”.
4. Experimental Results
4.1. Comparison with Traditional Methods
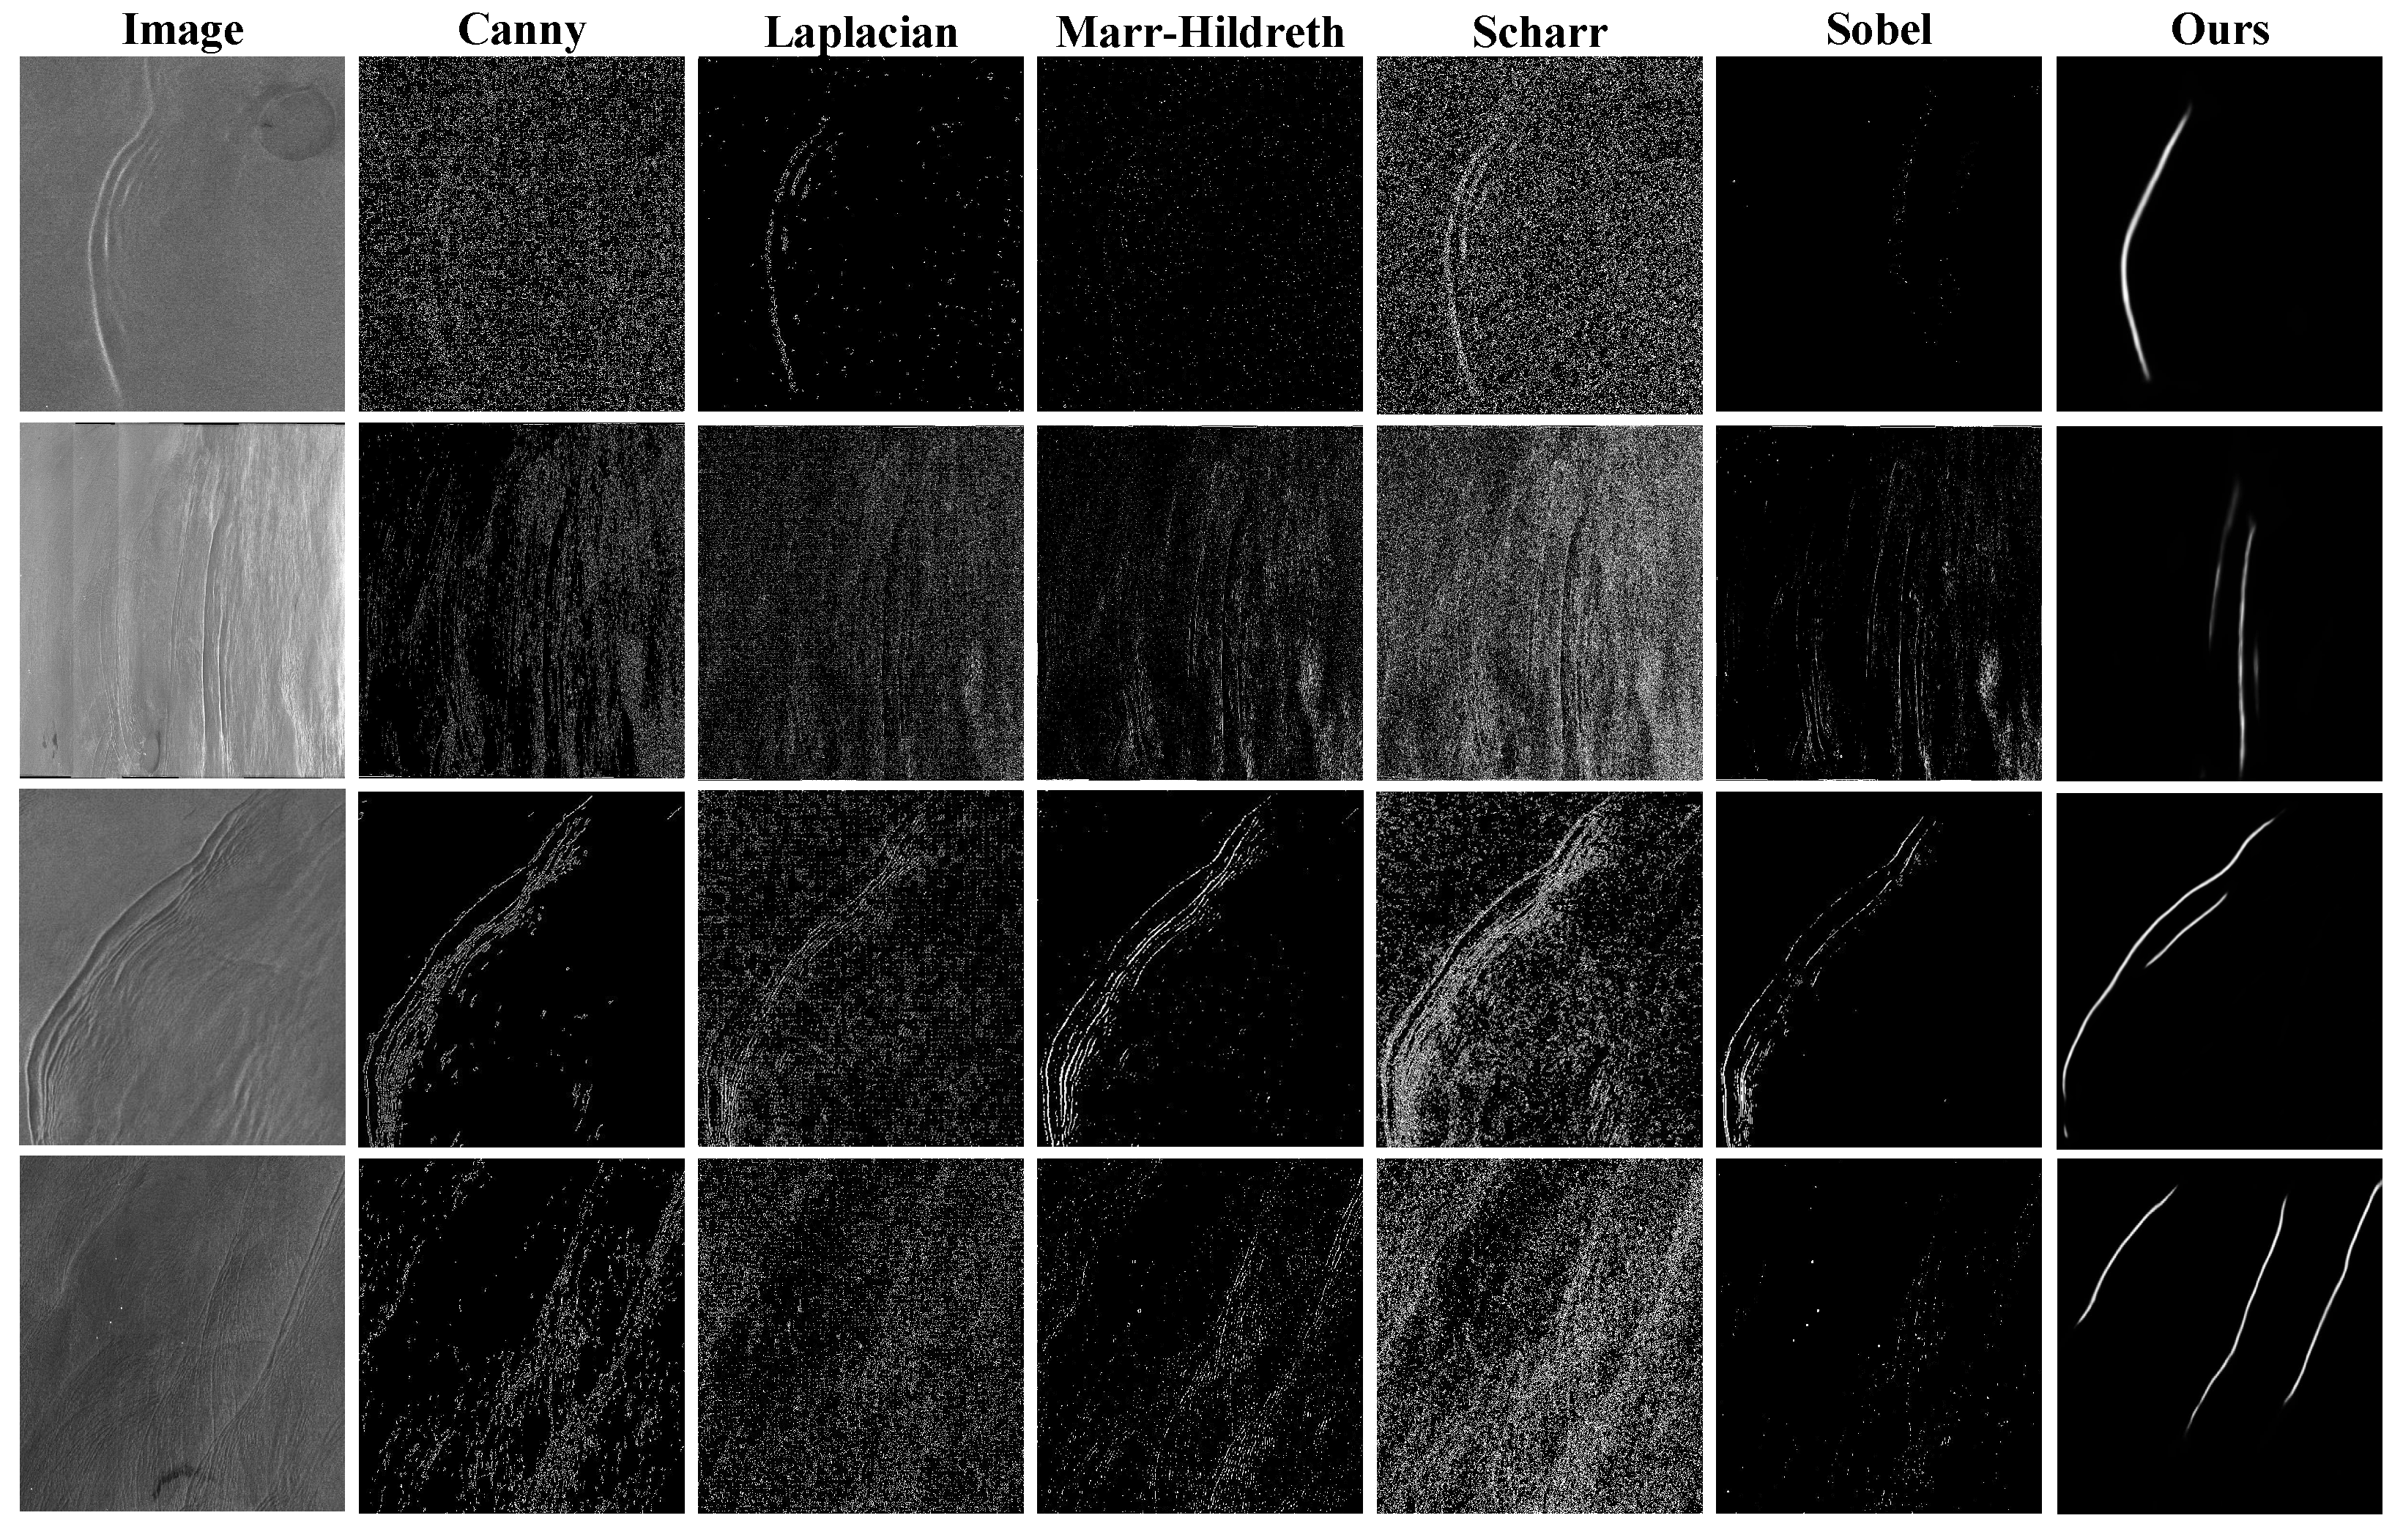
Prior to the advent of deep learning, the mainstream approach for extracting ISWs relied on traditional edge-detection algorithms and manual extraction. This paper presents the results of several traditional edge-detection algorithms, including Canny [46], Laplacian [47], Marr–Hildreth [48], Scharr, and Sobel [49], as shown in Figure 6. It was evident that these conventional algorithms could rapidly and relatively accurately extract ISWs when faced with relatively simple scenes, as seen in the first and third rows of the SAR images. However, their performance deteriorated when dealing with slightly more-complex scenes, as observed in the second and fourth rows of the SAR images. Moreover, most traditional edge-detection methods require manual threshold tuning, which consumes a significant amount of human effort and time, contradicting the goal of reducing the human and time costs pursued by this study. Consequently, we employed deep learning techniques, as described in the following section, to conduct our experiments.
4.2. Comparison with Methods of Deep Learning
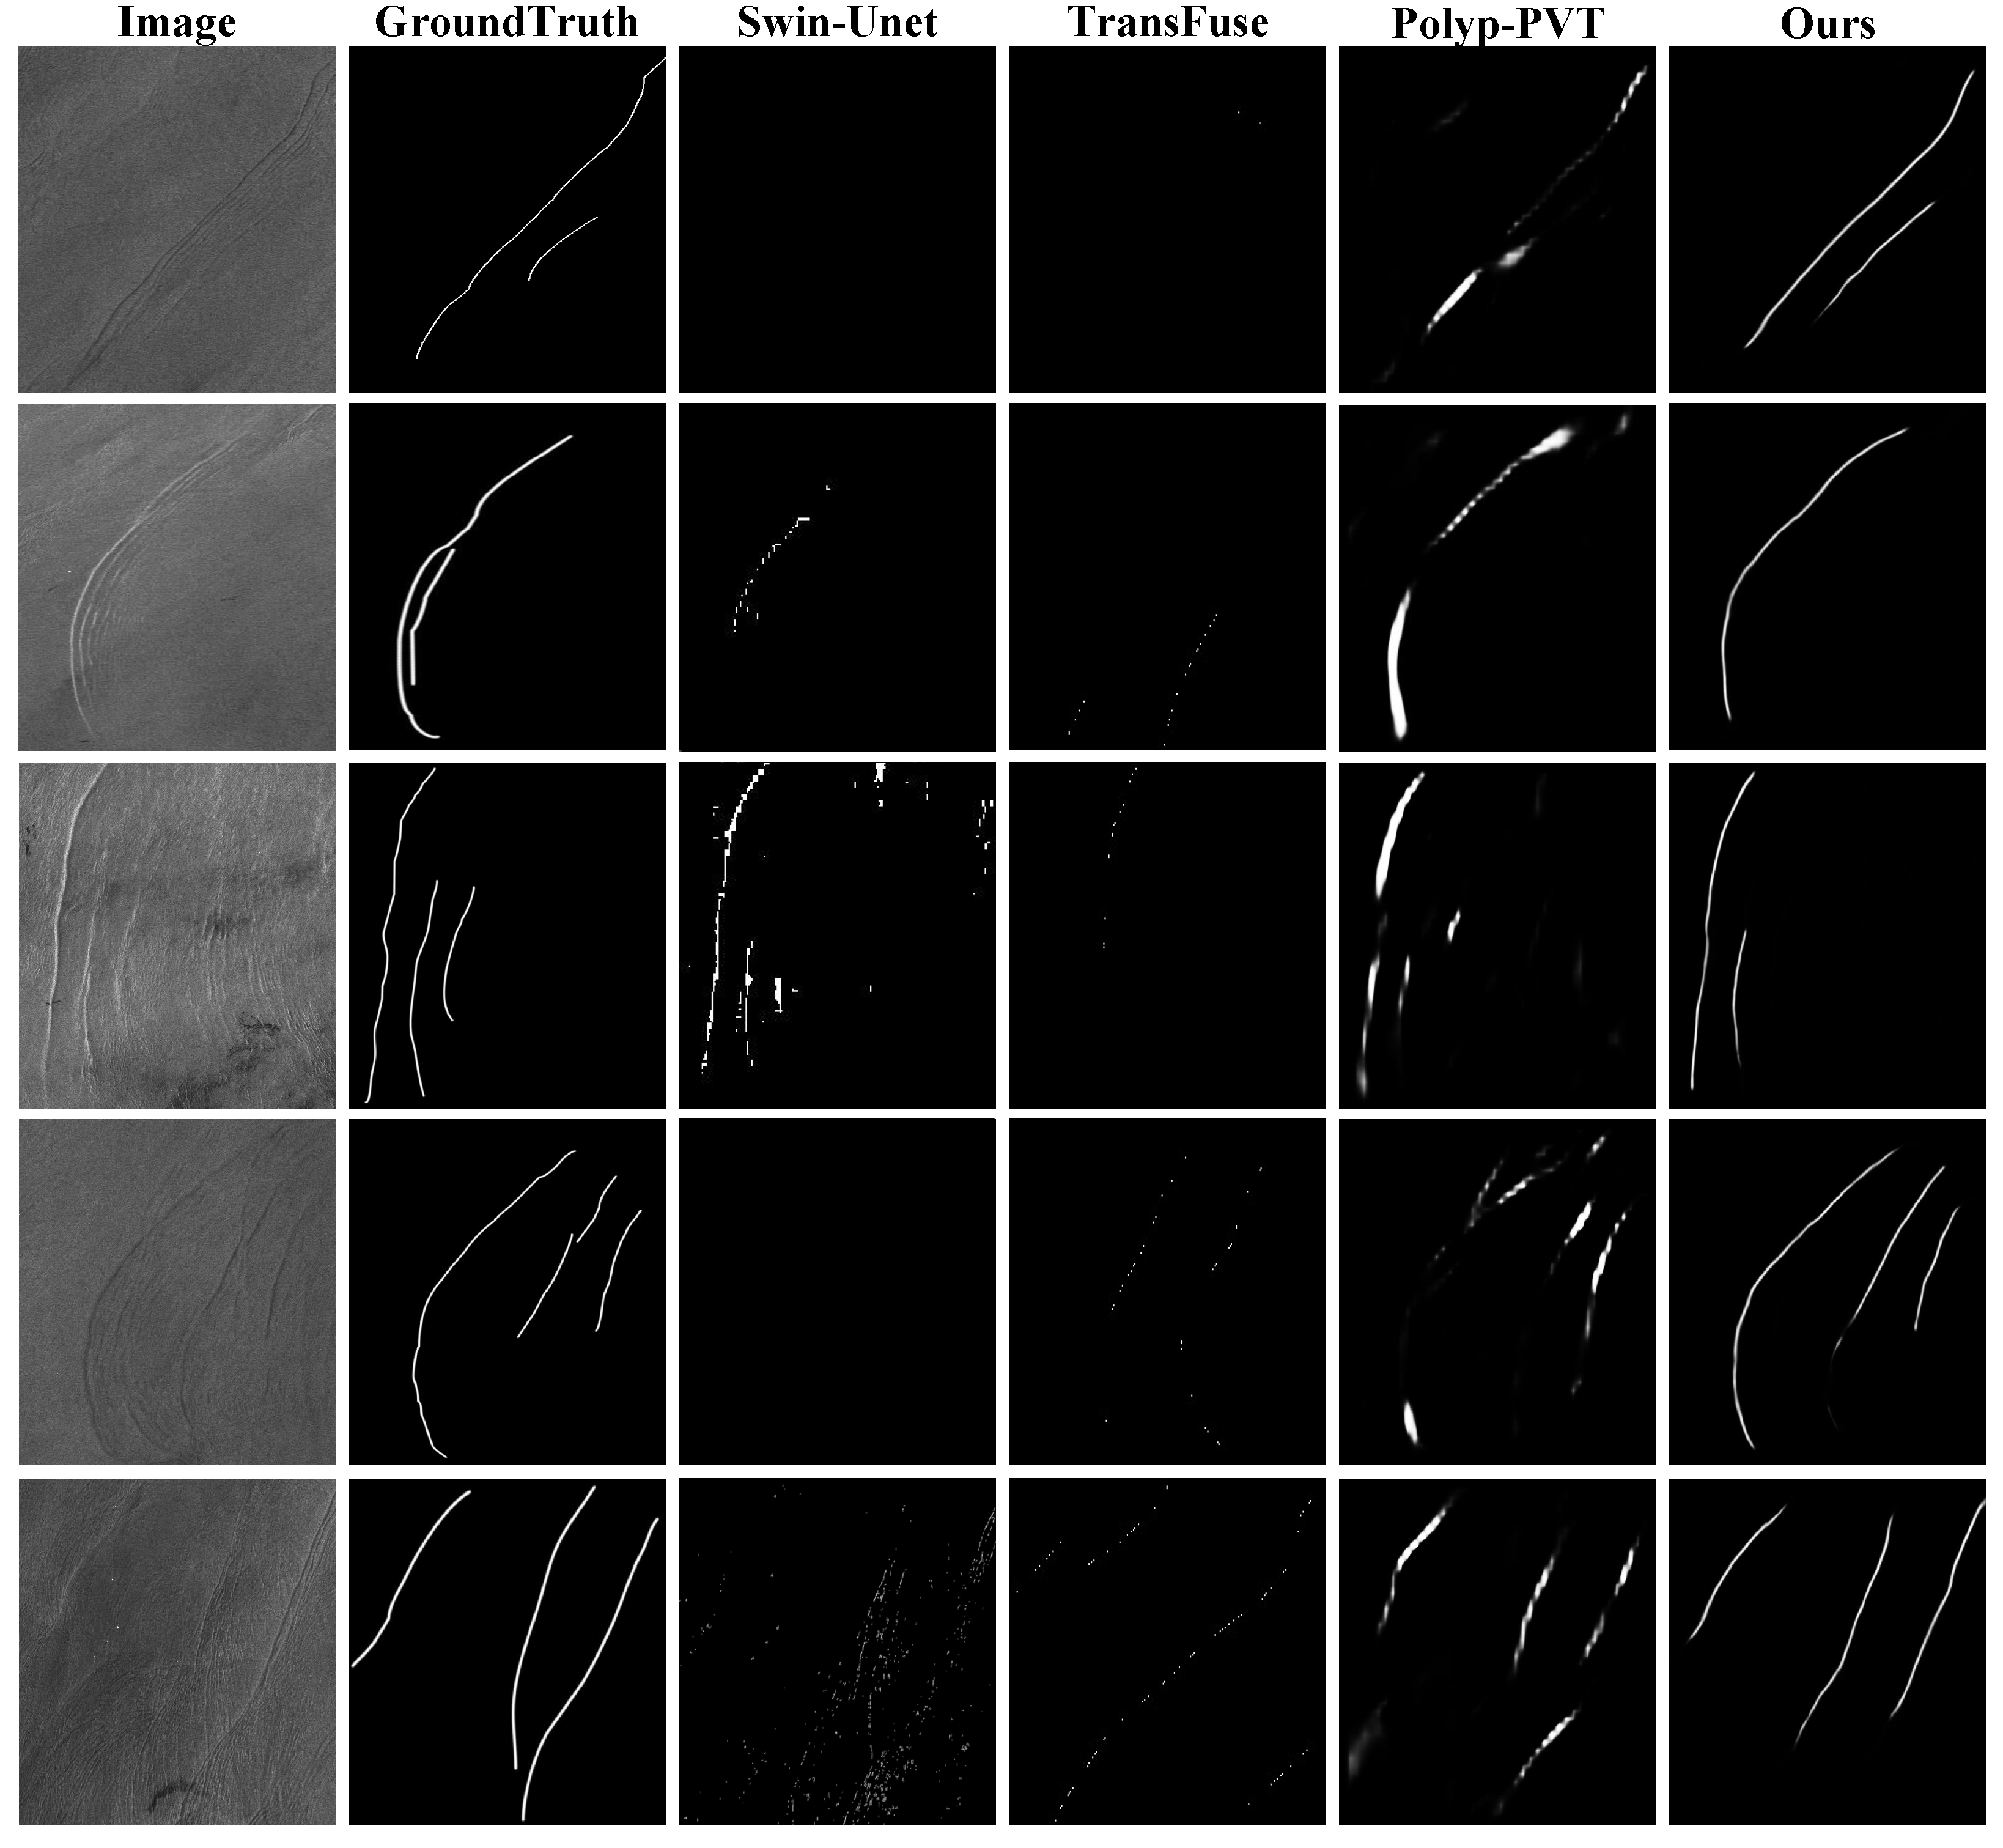
To assess our model’s performance, we trained three deep learning networks: Swin-UNet [44], Transfuse [42], and Polyp-PVT [43] by using the same dataset constructed in this study and conducted the comparative analysis. The experimental outcomes for our model, along with those of the other models, are displayed in Table 1. The table furnishes compelling evidence of our model’s modest enhancement of the F1-score compared to the other models. Moreover, it showcases a notably greater advantage in terms of MACC and the MIoU. In order to enhance the clarity of the experimental outcomes, we diligently curated a set of representative SAR image examples for testing. The comparative analysis of the semantic segmentation models revealed suboptimal outcomes, attributed to the absence of a mechanism capable of capturing the global feature distribution. As a consequence, there was a notable breakdown in sustaining the continuity of the ISWs. In response to these limitations, our model innovatively introduced a novel loss function and seamlessly integrated a Transformer The results of the numerical experiments are visually depicted in Figure 7.
We carefully selected a set of five representative ISWs for the test dataset, encompassing both bright and dark stripes, along with mode-2 ISWs, as detailed in [50]. The ground truth was established by manually identifying the bow waves present in the SAR images. The extraction capabilities of the methods of deep learning are demonstrated in Figure 7. Nevertheless, when faced with intricate scenarios, as illustrated in Figure 5, the traditional methods fell short in their ability to effectively extract the ISWs. Furthermore, Swin-UNet also struggled to perform well in the task of extracting ISWs. Similarly, Transfuse demonstrated insufficient continuity in extracting the ISWs, and it even struggled to capture complete ISWs. While Polyp-PVT could extract the expected ISWs partially, it was plagued by problems such as excessively wide stripes and discontinuities in the ISWs. In sharp contrast, our model, as presented in the final column, demonstrated outstanding performance in extracting the ISWs across diverse situations. Not only did it accurately extract the anticipated ISWs, but it also ensured their continuity. These convincing findings robustly underscore the efficacy of our proposed methodology.
4.3. Ablation Experiment
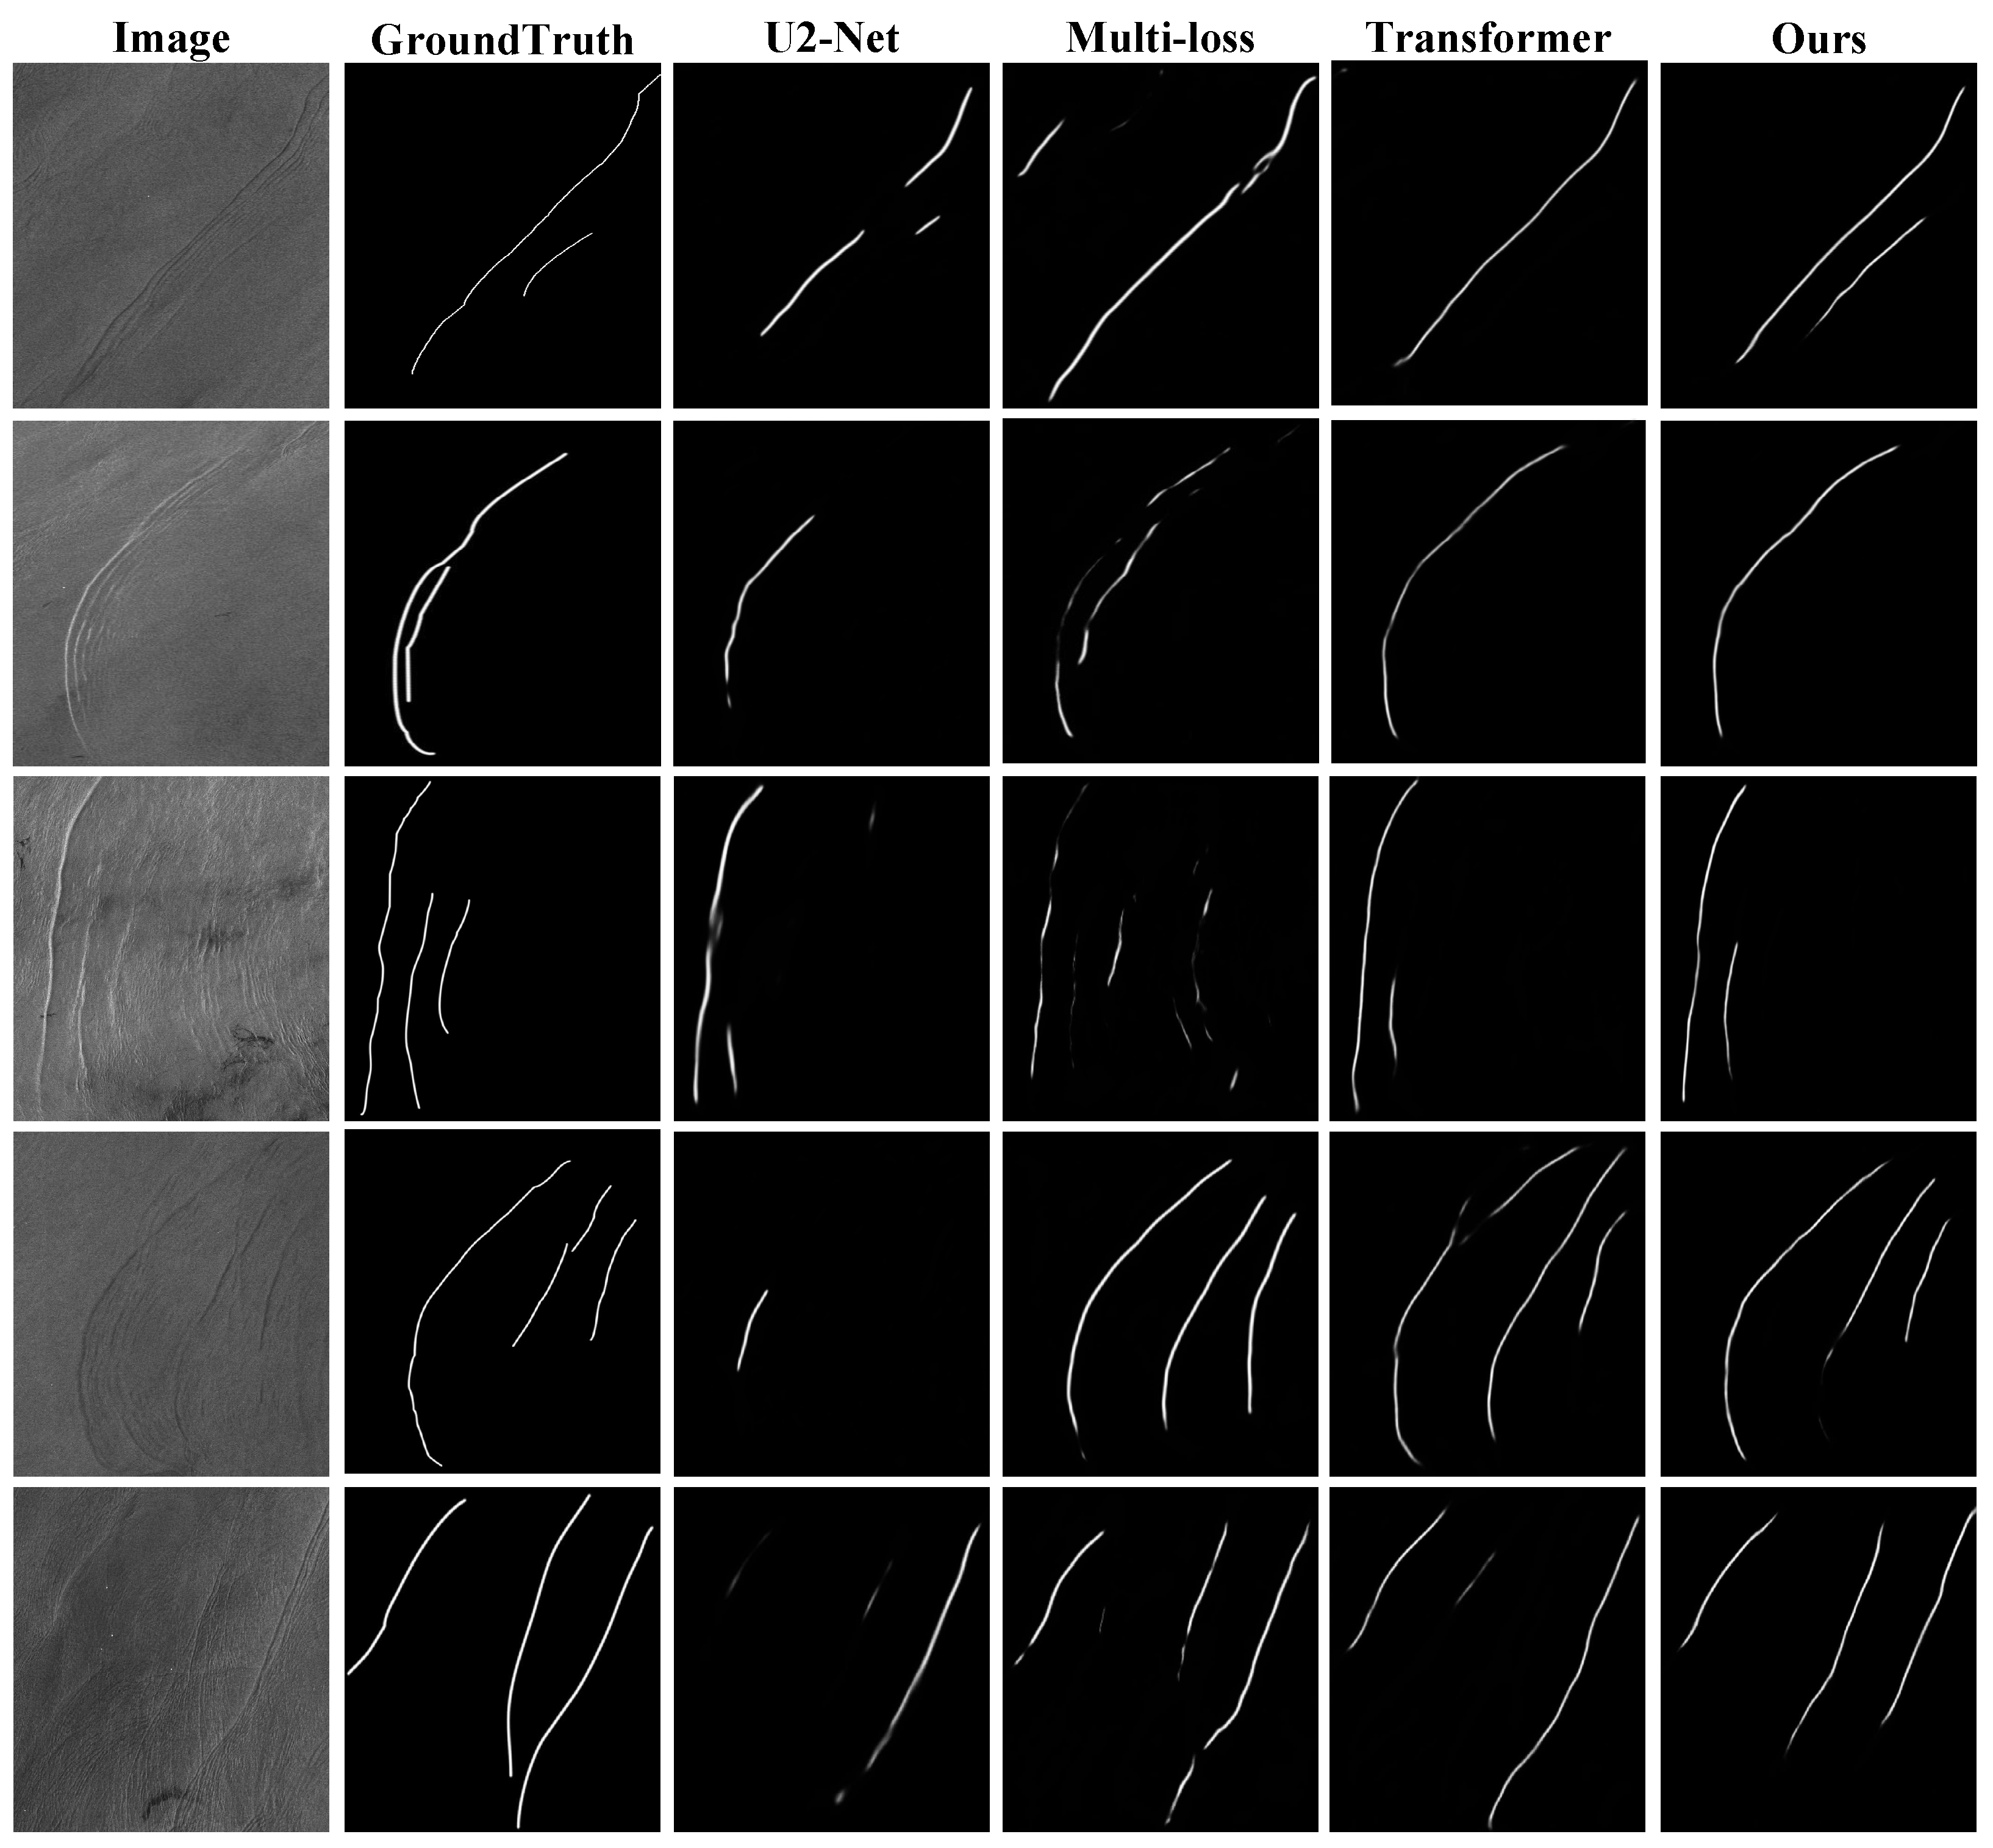
In the process of model modification, we conducted ablation experiments, with evaluation indicators, as depicted in Table 2. The experiments encompassed three models: the original -net model, the -net model augmented with the multi-loss function, the -net model with a Transformer, and our model featuring a Transformer and a novel loss function. The results shown in Figure 8 suggest that the original -net model demonstrated a certain degree of capability in extracting ISWs, albeit not comprehensively. However, the incorporation of the multi-loss function into -net led to enhanced results for the majority of the dataset. This enhancement can be ascribed to our loss function, which assigns priority to the predominant ISWs. The inclusion of the Transformer-based -net network demonstrated a commendable capability in the extraction of the ISWs. This can be attributed to the attention mechanism we incorporated, which differed somewhat from previous attention mechanisms. We fine-tuned the algorithms governing its attention and introduced certain small modules, enhancing its adaptability to our dataset. Ultimately, our model showcased superior capabilities in extraction and generalization when contrasted with the other two approaches.
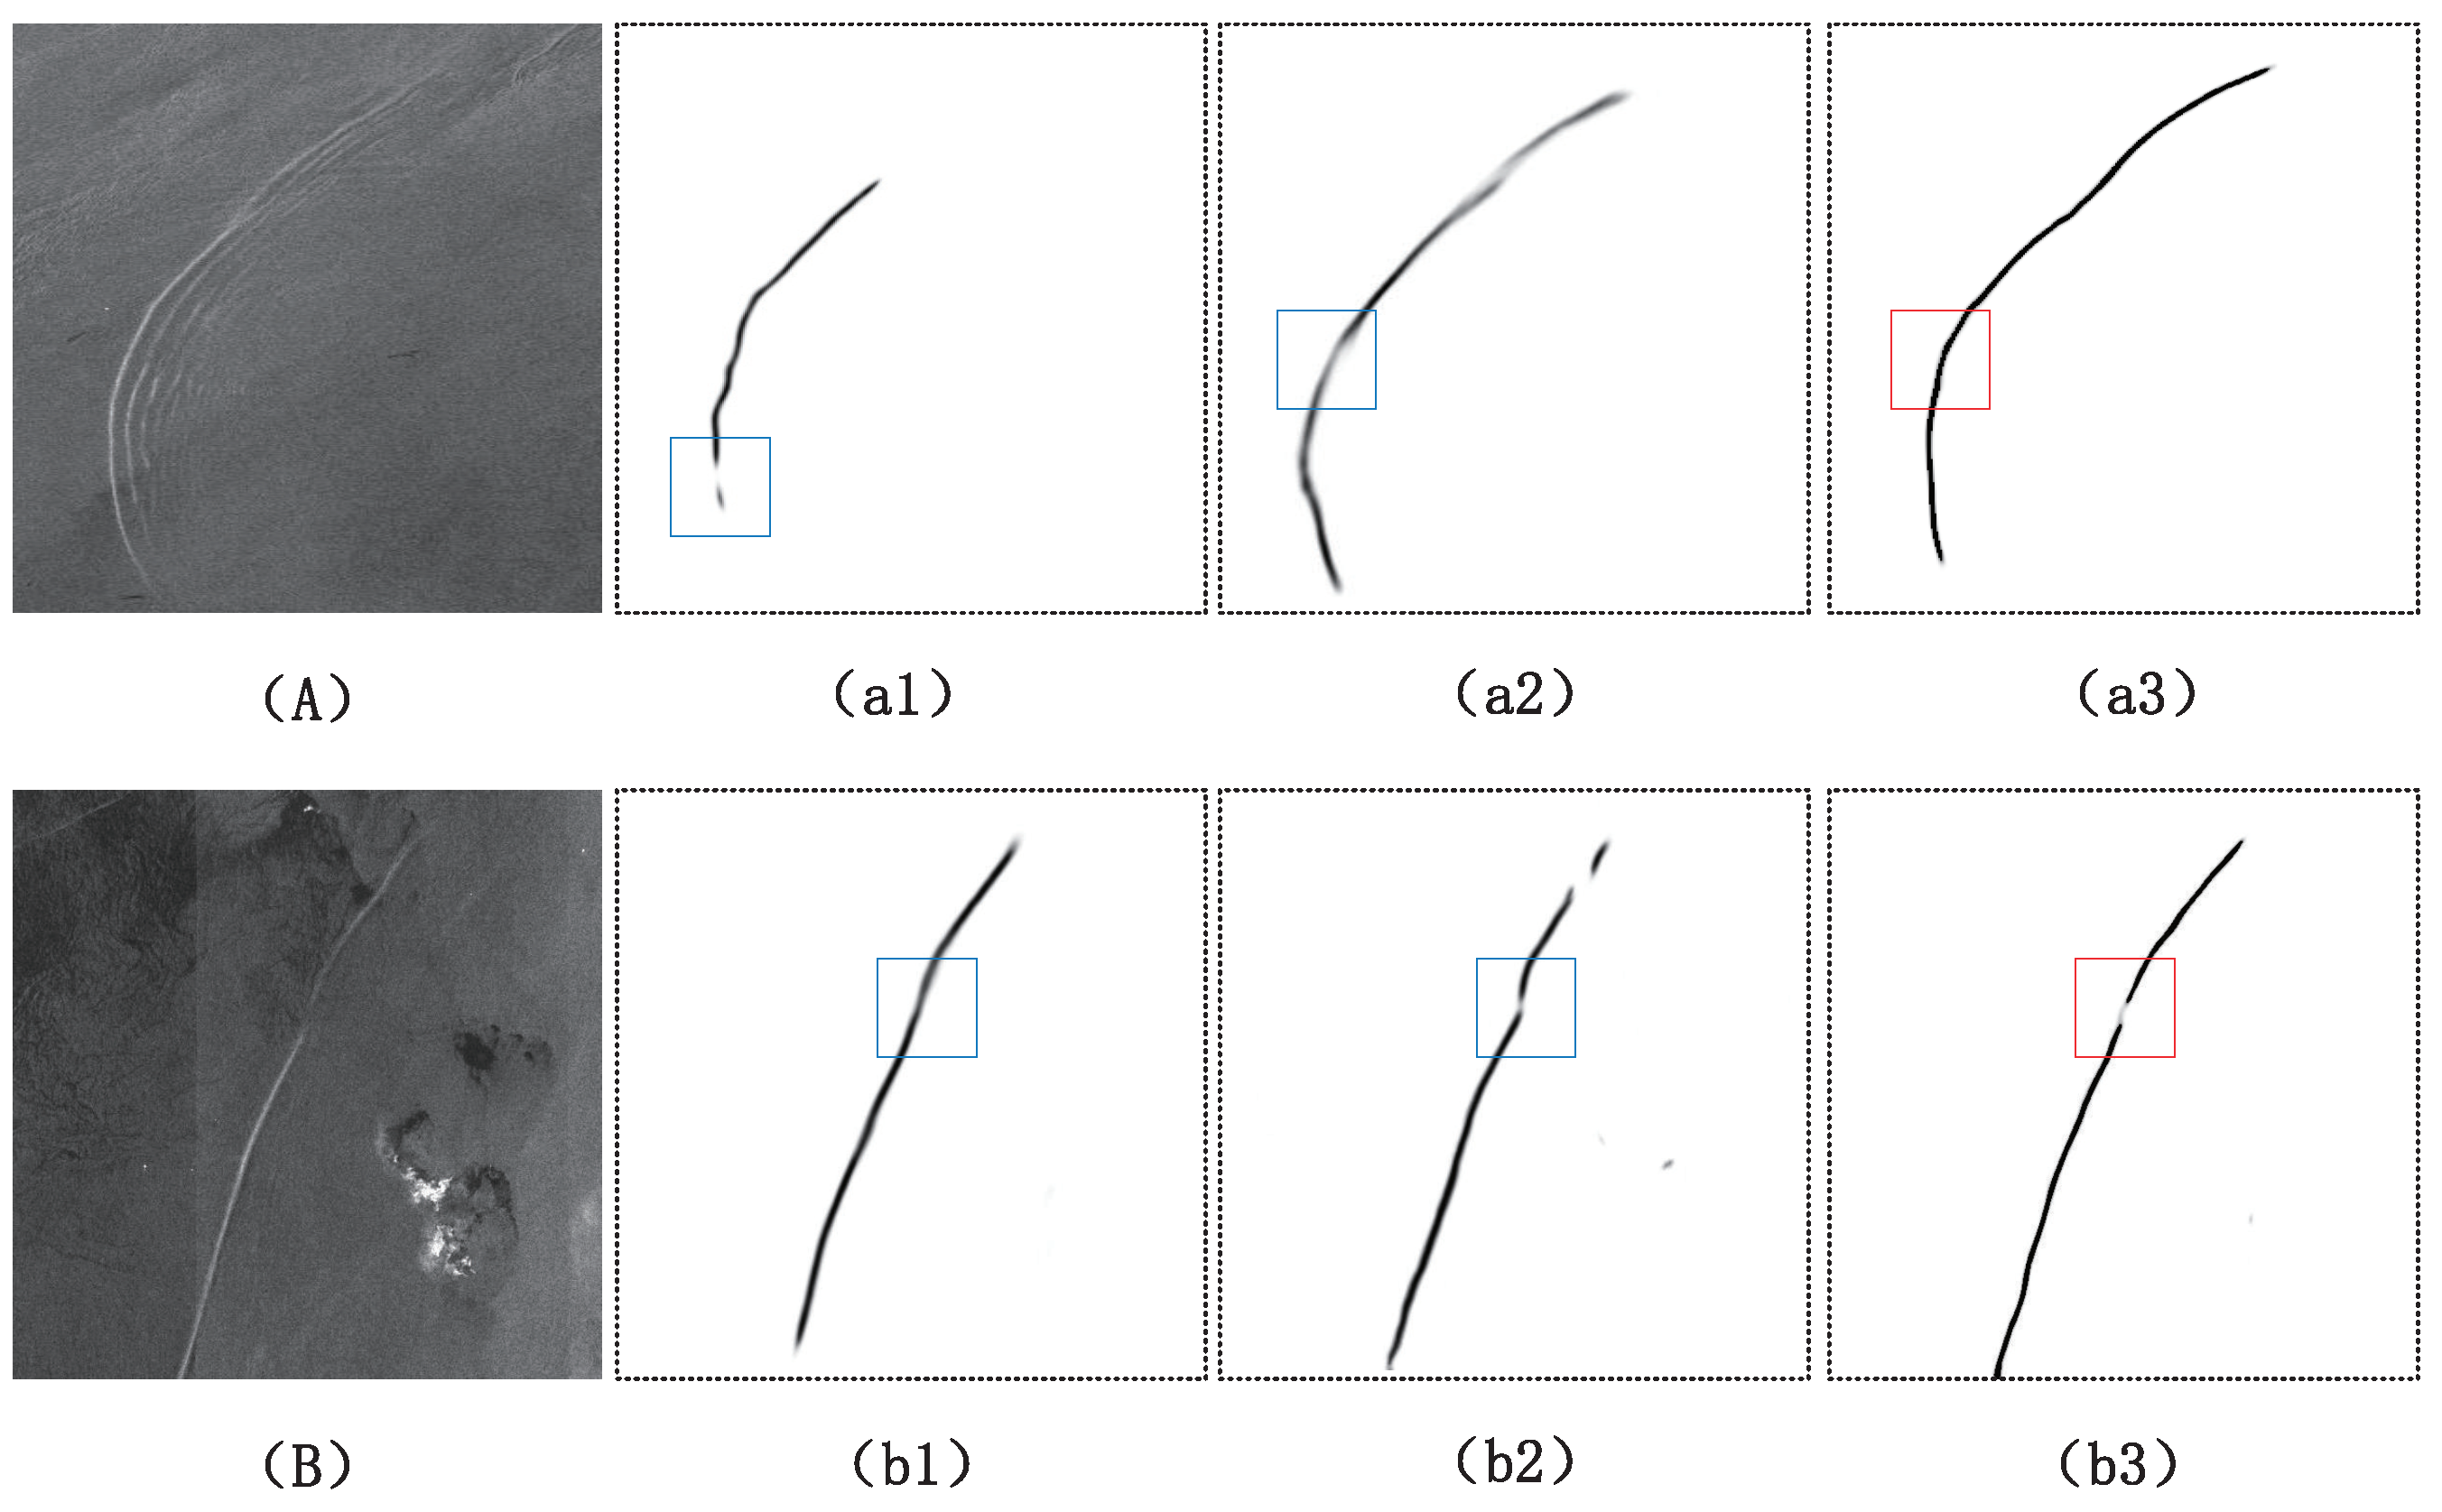
To evaluate the rationality and effectiveness of the recently incorporated functional modules in our model, we exhibit the detailed prediction results of the model incorporating different functional modules, as shown in Figure 9. Figure 9A illustrates continuous ISWs, while Figure 9B displays two distinct, non-connected ISWs. Figure 9(a1,b1) show the ISW extraction outcomes using the -net model. Figure 9(a2,b2) display the outcomes of the loss function for the respective modified models. Through our modified loss function, the coda wave was effectively ignored, leading to an enhanced integrity of the predicted ISWs. Figure 9(a3,b3) illustrate the incorporation of the Transformer following the preceding step. This integration enhanced the result continuity and facilitated the differentiation of two distinct ISWs within a single image.
4.4. Performance on Another Dataset
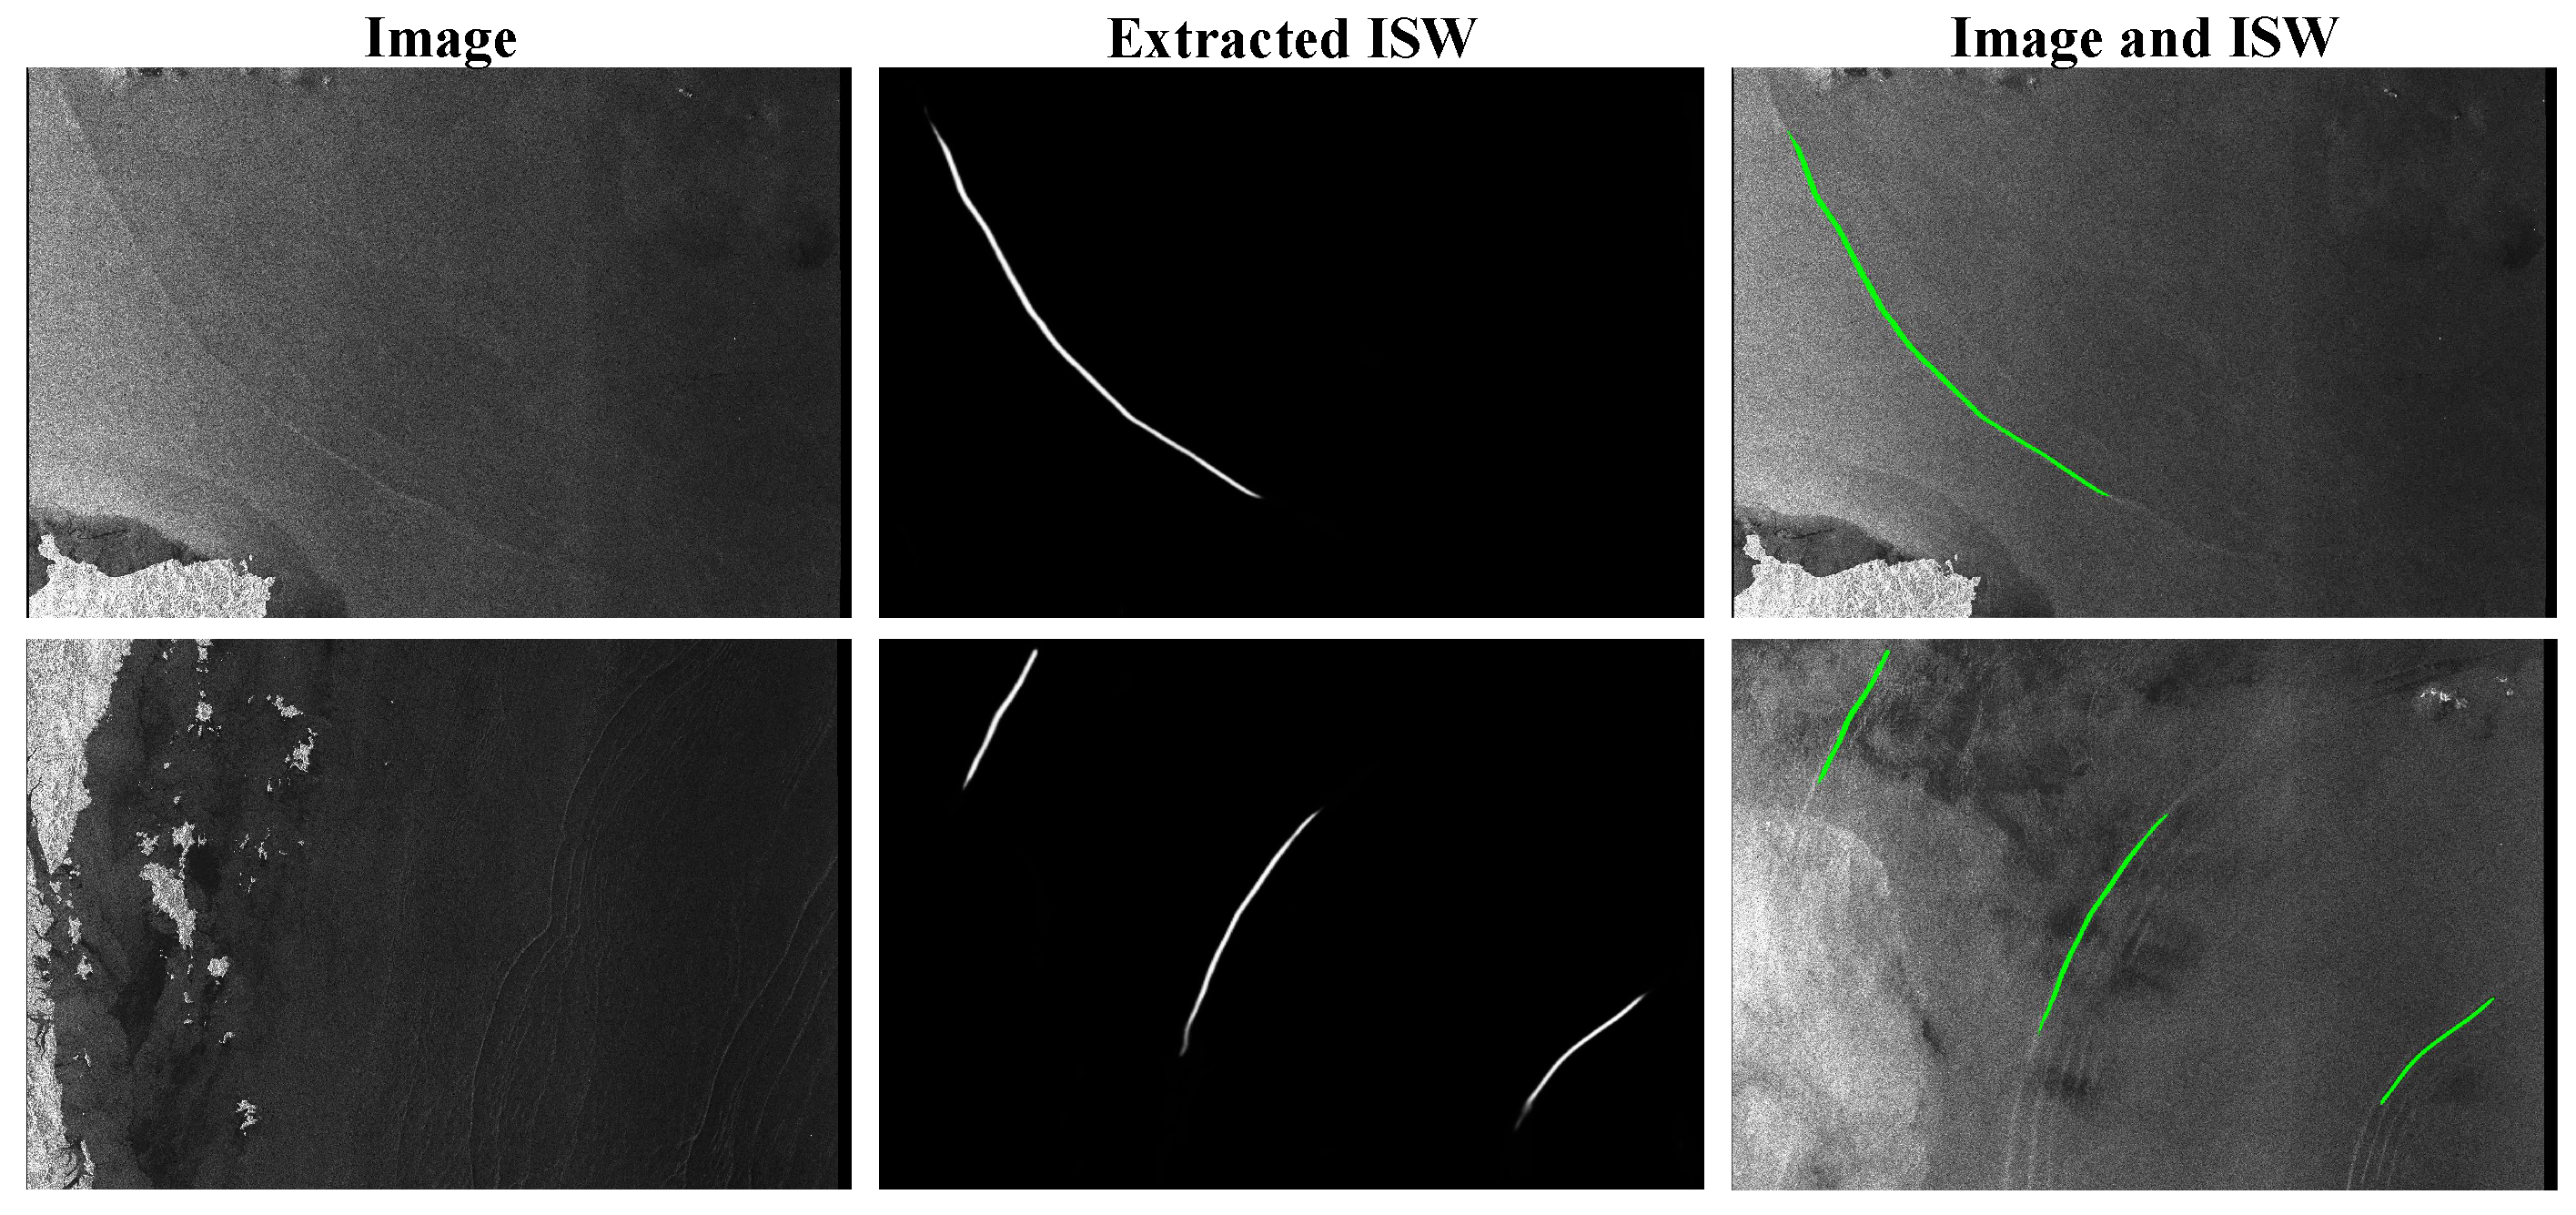
To verify the generalization and robustness of the model, we utilized the ISWs’ dataset for testing, as released by Tao M. and colleagues [41], which was not used during the training and testing of our model. The predicted results of our model are shown in Figure 10. The image in the first row was captured by Sentinel-1 in the Andaman Sea, starting at 23:19:33 on 31 August 2020, and ending at 23:19:58 on 31 August 2020. The specific coordinates of this scene are 6–8° N and 95–98° E. The image in the second row was collected by Sentinel-1 in the Sulu Sea and Celebes Sea, starting at 21:42:10 on 17 December 2020 and ending at 21:42:35 on 17 December 2020. The specific coordinates of this scene are 1–3° N and 119–121° E. “Image” is the original image to be detected; “Extracted ISW” is the result of model prediction; “Image and ISW” is when we placed the prediction result in the form of green lines on the image. The results indicated the effectiveness of our model across different satellites and maritime regions.
5. Discussion
Based on the above experimental results and analyses, it was shown that the proposed method can obtain more-accurately extracted ISWs of SAR images than other methods. As is well known, one of the key factors affecting the accuracy of image segmentation based on deep learning is the quantity of training samples. When there is an insufficient number of training samples, overfitting may pose a significant challenge. Owing to the restricted availability of training data solely from the South China Sea, the generalization prowess of our model was not exceptionally distinguished. Furthermore, we acknowledge the potential for enhancing the precision of the model discussed herein.
Furthermore, due to the uneven distribution of the dataset’s feature characteristics, the MT-net method achieved a higher segmentation accuracy. This study underscored the limitations of existing semantic segmentation methods and emphasized the significance of attention mechanisms in improving accuracy. The results demonstrated the capability of MT-net to extract ISWs in SAR images.
Additionally, Our approach provides researchers with a potential avenue for investigation, namely leveraging the structural characteristics of ISWs in the South China Sea to the design of a targeted attention mechanism for improved accuracy. Alternatively, the collection of additional data to build a more-extensive dataset may also enhance the accuracy.
In conclusion, the results of this study hold significant implications for the development of deep-learning-based methods for extracting ISWs. This research underscored the importance of ongoing investigation in this field to enhance accuracy and address challenges related to small-sample segmentation, imbalanced sample distribution, and overfitting.
6. Conclusions
Internal Solitary Waves (ISWs) can induce water mixing, thereby facilitating the transport of substances and heat. These waves exert a significant influence on various factors, encompassing phytoplankton and zooplankton populations, maritime navigation, submarines, and offshore structures, including oil drilling platforms. Whether assessing their advantageous effects or seeking to mitigate potential risks, the precise determination of internal wave positions is of paramount importance. Hence, the extraction of ISWs necessitates a high-precision model. This paper introduced an innovative method for the stripe segmentation of ISWs, utilizing the MT-net framework. The method integrates local attention mechanisms and a distinctive loss function, enabling precise focus on primary ISWs within the South China Sea, as observed through SAR imagery. To achieve this objective, a pivotal alteration was introduced to the MT-net architecture. Specifically, the original Residual unit in the center was replaced with a Middle-Transformer unit. This adaptation empowered the model to effectively prioritize the preservation of ISWs’ integrity. Furthermore, we employed a carefully designed loss function that combines the binary cross-entropy loss and Dice loss components. This enhancement augmented the model’s sensitivity to the bow wave, a pivotal characteristic of ISWs. Extensive experimentation unequivocally showcased that the proposed MT-net, incorporating these two modifications, adeptly extracted the primary ISWs signatures from our dataset.
Moving forward, our future endeavors entail harnessing the most-recent advancements in semantic segmentation techniques to amplify the precision and computational efficiency of our proposed model. Additionally, by utilizing the extracted internal wave crest lines, we aspire to construct scenario generators for internal wave remote sensing images, thus bolstering our capacity to predict internal wave propagation. Aligned with our dedication to advancement, we will persist in enhancing the marine internal wave remote sensing image dataset, thus progressively tackling the challenge posed by restricted data resources.
Author Contributions
Conceptualization, S.B., Q.J., X.C. and T.Z.; methodology, S.B., X.C. and Z.A.; software, S.B. and Z.A.; validation, S.B., Q.J. and Z.A.; formal analysis, S.B., X.C. and Q.J.; investigation, S.B., Q.J. and Z.A.; resources, S.B., X.C. and T.Z.; data curation, S.B., X.C. and Z.A.; writing—original draft preparation, S.B., Z.A. and Q.J.; writing—review and editing, S.B., Q.J., X.C., M.G. and T.Z.; visualization, Z.A.; supervision, S.B., M.G., X.C. and T.Z.; funding acquisition, S.B. All authors have read and agreed to the published version of the manuscript.
Funding
This research was funded by the National Natural Science Foundation of China (62161044, 11962025), the Science and Technology Project of Inner Mongolia (2021GG0140), the Natural Science Foundation of Inner Mongolia (2022ZD05, 2023MS06003), and the Key Laboratory of Infinite-dimensional Hamiltonian System and Its Algorithm Application (IMNU), the Ministry of Education (2023KFYB06).
Data Availability Statement
3rd Party Data Restrictions apply to the availability of these data. Data was obtained from [third party] and are available [from the authors] with the permission of [third party].
Acknowledgments
The authors would like to thank the developers in the TensorFlow community for their open-source deep learning projects. Special thanks are due to the reviewers and Editors for their valuable comments, which improved the manuscript.
Conflicts of Interest
The authors declare no conflict of interest.
Abbreviations
The following abbreviations are used in this manuscript:
| BCE | Binary Cross-Entropy |
| ENVISAT ASAR | Environmental Satellite Advanced Synthetic Aperture Radar |
| ISW | Internal Solitary Wave |
| MACC | Mean Accuracy |
| MIoU | Mean Intersection over Union |
| MTU-net | Middle-Transformer U-net |
| RSU | Residual U-block |
| RSU-L | Residual U-block, where L denotes the number of Encoder layers |
| SAR | Synthetic Aperture Radar |
| WSM | Wide Swath Mode |
References
- Reid, E.C.; DeCarlo, T.M.; Cohen, A.L.; Wong, G.T.; Lentz, S.J.; Safaie, A.; Hall, A.; Davis, K.A. Internal waves influence the thermal and nutrient environment on a shallow coral reef. Limnol. Oceanogr. 2019, 64, 1949–1965. [Google Scholar] [CrossRef]
- Fang, X.; Du, T. Fundamentals of Oceanic Internal Waves and Internal Waves in the China Seas; China Ocean University Press: Qingdao, China, 2005; pp. 1–3. [Google Scholar]
- Apel, J.R.; Proni, J.R.; Byrne, H.M.; Sellers, R.L. Near-simultaneous observations of intermittent internal waves on the continental shelf from ship and spacecraft. Geophys. Res. Lett. 1975, 2, 128–131. [Google Scholar] [CrossRef]
- Bao, S.; Meng, J.; Sun, L.; Liu, Y. Detection of ocean internal waves based on Faster R-CNN in SAR images. J. Oceanol. Limnol. 2020, 38, 55–63. [Google Scholar] [CrossRef]
- Zheng, Y.g.; Qi, K.t.; Zhang, H.s. Stripe segmentation of oceanic internal waves in synthetic aperture radar images based on Mask R-CNN. Geocarto Int. 2022, 37, 14480–14494. [Google Scholar] [CrossRef]
- Ma, Y.; Meng, J.; Sun, L.; Ren, P. Oceanic Internal Wave Signature Extraction in the Sulu Sea by a Pixel Attention U-Net: PAU-Net. IEEE Geosci. Remote Sens. Lett. 2023, 20, 3230086. [Google Scholar] [CrossRef]
- Dosovitskiy, A.; Beyer, L.; Kolesnikov, A.; Weissenborn, D.; Zhai, X.; Unterthiner, T.; Dehghani, M.; Minderer, M.; Heigold, G.; Gelly, S.; et al. An image is worth 16x16 words: Transformers for image recognition at scale. arXiv 2020, arXiv:2010.11929. [Google Scholar]
- Yuan, L.; Chen, Y.; Wang, T.; Yu, W.; Shi, Y.; Jiang, Z.H.; Tay, F.E.; Feng, J.; Yan, S. Tokens-to-token vit: Training vision Transformers from scratch on imagenet. In Proceedings of the IEEE/CVF International Conference on Computer Vision, Montreal, BC, Canada, 11–17 October 2021; pp. 558–567. [Google Scholar]
- Wang, W.; Xie, E.; Li, X.; Fan, D.P.; Song, K.; Liang, D.; Lu, T.; Luo, P.; Shao, L. Pyramid vision Transformer: A versatile backbone for dense prediction without convolutions. In Proceedings of the IEEE/CVF international Conference on Computer Vision, Montreal, BC, Canada, 11–17 October 2021; pp. 568–578. [Google Scholar]
- Wu, H.; Xiao, B.; Codella, N.; Liu, M.; Dai, X.; Yuan, L.; Zhang, L. Cvt: Introducing convolutions to vision Transformers. In Proceedings of the IEEE/CVF International Conference on Computer Vision, Montreal, BC, Canada, 11–17 October 2021; pp. 22–31. [Google Scholar]
- Heo, B.; Yun, S.; Han, D.; Chun, S.; Choe, J.; Oh, S.J. Rethinking spatial dimensions of vision Transformers. In Proceedings of the IEEE/CVF International Conference on Computer Vision, Montreal, BC, Canada, 11–17 October 2021; pp. 11936–11945. [Google Scholar]
- Chen, Y.; Gu, X.; Liu, Z.; Liang, J. A fast inference vision Transformer for automatic pavement image classification and its visual interpretation method. Remote Sens. 2022, 14, 1877. [Google Scholar] [CrossRef]
- Liu, X.; Wu, Y.; Hu, X.; Li, Z.; Li, M. A Novel Lightweight Attention-Discarding Transformer for High Resolution SAR Image Classification. IEEE Geosci. Remote Sens. Lett. 2023, 20, 4006405. [Google Scholar] [CrossRef]
- Touvron, H.; Cord, M.; Sablayrolles, A.; Synnaeve, G.; Jégou, H. Going deeper with image Transformers. In Proceedings of the IEEE/CVF International Conference on Computer Vision, Montreal, BC, Canada, 11–17 October 2021; pp. 32–42. [Google Scholar]
- Gong, C.; Wang, D.; Li, M.; Chandra, V.; Liu, Q. Vision Transformers with patch diversification. arXiv 2021, arXiv:2104.12753. [Google Scholar]
- Zhou, D.; Kang, B.; Jin, X.; Yang, L.; Lian, X.; Jiang, Z.; Hou, Q.; Feng, J. Deepvit: Towards deeper vision Transformer. arXiv 2021, arXiv:2103.11886. [Google Scholar]
- Zhou, D.; Shi, Y.; Kang, B.; Yu, W.; Jiang, Z.; Li, Y.; Jin, X.; Hou, Q.; Feng, J. Refiner: Refining Self-Attention for vision Transformers. arXiv 2021, arXiv:2106.03714. [Google Scholar]
- Chu, X.; Tian, Z.; Zhang, B.; Wang, X.; Wei, X.; Xia, H.; Shen, C. Conditional positional encodings for vision Transformers. arXiv 2021, arXiv:2102.10882. [Google Scholar]
- Wu, K.; Peng, H.; Chen, M.; Fu, J.; Chao, H. Rethinking and improving relative position encoding for vision Transformer. In Proceedings of the IEEE/CVF International Conference on Computer Vision, Montreal, BC, Canada, 11–17 October 2021; pp. 10033–10041. [Google Scholar]
- Islam, M.A.; Kowal, M.; Jia, S.; Derpanis, K.G.; Bruce, N.D. Position, padding and predictions: A deeper look at position information in cnns. arXiv 2021, arXiv:2101.12322. [Google Scholar]
- Cordonnier, J.B.; Loukas, A.; Jaggi, M. On the relationship between Self-Attention and convolutional layers. arXiv 2019, arXiv:1911.03584. [Google Scholar]
- Liu, Z.; Lin, Y.; Cao, Y.; Hu, H.; Wei, Y.; Zhang, Z.; Lin, S.; Guo, B. Swin Transformer: Hierarchical vision Transformer using shifted windows. In Proceedings of the IEEE/CVF International Conference on Computer Vision, Montreal, BC, Canada, 11–17 October 2021; pp. 10012–10022. [Google Scholar]
- Yuan, L.; Hou, Q.; Jiang, Z.; Feng, J.; Yan, S. Volo: Vision outlooker for visual recognition. IEEE Trans. Pattern Anal. Mach. Intell. 2022, 45, 6575–6586. [Google Scholar] [CrossRef]
- Han, K.; Xiao, A.; Wu, E.; Guo, J.; Xu, C.; Wang, Y. Transformer in Transformer. Adv. Neural Inf. Process. Syst. 2021, 34, 15908–15919. [Google Scholar]
- Chu, X.; Tian, Z.; Wang, Y.; Zhang, B.; Ren, H.; Wei, X.; Xia, H.; Shen, C. Twins: Revisiting the design of spatial attention in vision Transformers. Adv. Neural Inf. Process. Syst. 2021, 34, 9355–9366. [Google Scholar]
- Dai, Z.; Liu, H.; Le, Q.V.; Tan, M. Coatnet: Marrying convolution and attention for all data sizes. Adv. Neural Inf. Process. Syst. 2021, 34, 3965–3977. [Google Scholar]
- Xiao, T.; Singh, M.; Mintun, E.; Darrell, T.; Dollár, P.; Girshick, R. Early convolutions help Transformers see better. Adv. Neural Inf. Process. Syst. 2021, 34, 30392–30400. [Google Scholar]
- Zhai, X.; Kolesnikov, A.; Houlsby, N.; Beyer, L. Scaling vision Transformers. In Proceedings of the IEEE/CVF Conference on Computer Vision and Pattern Recognition, New Orleans, LA, USA, 18–24 June 2022; pp. 12104–12113. [Google Scholar]
- Riquelme, C.; Puigcerver, J.; Mustafa, B.; Neumann, M.; Jenatton, R.; Susano Pinto, A.; Keysers, D.; Houlsby, N. Scaling vision with sparse mixture of experts. Adv. Neural Inf. Process. Syst. 2021, 34, 8583–8595. [Google Scholar]
- Chen, M.; Radford, A.; Child, R.; Wu, J.; Jun, H.; Luan, D.; Sutskever, I. Generative pretraining from pixels. In Proceedings of the International Conference on Machine Learning, PMLR, Virtual, 13–18 July 2020; pp. 1691–1703. [Google Scholar]
- Li, Z.; Chen, Z.; Yang, F.; Li, W.; Zhu, Y.; Zhao, C.; Deng, R.; Wu, L.; Zhao, R.; Tang, M.; et al. Mst: Masked self-supervised Transformer for visual representation. Adv. Neural Inf. Process. Syst. 2021, 34, 13165–13176. [Google Scholar]
- Bao, H.; Dong, L.; Piao, S.; Wei, F. Beit: Bert pre-training of image Transformers. arXiv 2021, arXiv:2106.08254. [Google Scholar]
- Chen, X.; Xie, S.; He, K. An empirical study of training self-supervised vision Transformers. In Proceedings of the IEEE/CVF International Conference on Computer Vision, Montreal, BC, Canada, 11–17 October 2021; pp. 9640–9649. [Google Scholar]
- Caron, M.; Touvron, H.; Misra, I.; Jégou, H.; Mairal, J.; Bojanowski, P.; Joulin, A. Emerging properties in self-supervised vision Transformers. In Proceedings of the IEEE/CVF International Conference on Computer Vision, Montreal, BC, Canada, 11–17 October 2021; pp. 9650–9660. [Google Scholar]
- Xie, Z.; Lin, Y.; Yao, Z.; Zhang, Z.; Dai, Q.; Cao, Y.; Hu, H. Self-supervised learning with swin Transformers. arXiv 2021, arXiv:2105.04553. [Google Scholar]
- Li, X.; Liu, B.; Zheng, G.; Ren, Y.; Zhang, S.; Liu, Y.; Gao, L.; Liu, Y.; Zhang, B.; Wang, F. Deep-learning-based information mining from ocean remote-sensing imagery. Natl. Sci. Rev. 2020, 7, 1584–1605. [Google Scholar] [CrossRef]
- Wang, S.; Dong, Q.; Duan, L.; Sun, Y.; Jian, M.; Li, J.; Dong, J. A fast internal wave detection method based on PCANet for ocean monitoring. J. Intell. Syst. 2019, 28, 103–113. [Google Scholar] [CrossRef]
- Zhang, S.; Liu, B.; Li, X.; Xu, Q. Automatic extraction of internal wave signature from multiple satellite sensors based on deep convolutional neural networks. In Proceedings of the IGARSS 2020—IEEE International Geoscience and Remote Sensing Symposium, Waikoloa, HI, USA, 26 September–2 October 2020; pp. 5717–5720. [Google Scholar]
- Zheng, Y.g.; Zhang, H.s.; Qi, K.t.; Ding, L.y. Stripe segmentation of oceanic internal waves in SAR images based on SegNet. Geocarto Int. 2021, 37, 8568–8578. [Google Scholar] [CrossRef]
- Meng, J.; Sun, L.; Zhang, H.; Hu, B.; Hou, F.; Bao, S. Remote sensing survey and research on internal solitary waves in the South China Sea-Western Pacific-East Indian Ocean (SCS-WPAC-EIND). Acta Oceanol. Sin. 2022, 41, 154–170. [Google Scholar] [CrossRef]
- Tao, M.; Xu, C.; Guo, L.; Wang, X.; Xu, Y. An Internal Waves Data Set From Sentinel-1 Synthetic Aperture Radar Imagery and Preliminary Detection. Earth Space Sci. 2022, 9, e2022EA002528. [Google Scholar] [CrossRef]
- Zhang, Y.; Liu, H.; Hu, Q. Transfuse: Fusing Transformers and cnns for medical image segmentation. In Proceedings of the Medical Image Computing and Computer Assisted Intervention—MICCAI 2021: 24th International Conference, Strasbourg, France, 27 September–1 October 2021; Proceedings, Part I 24. Springer: Cham, Swizterland, 2021; pp. 14–24. [Google Scholar]
- Dong, B.; Wang, W.; Fan, D.P.; Li, J.; Fu, H.; Shao, L. Polyp-pvt: Polyp segmentation with pyramid vision Transformers. arXiv 2021, arXiv:2108.06932. [Google Scholar] [CrossRef]
- Cao, H.; Wang, Y.; Chen, J.; Jiang, D.; Zhang, X.; Tian, Q.; Wang, M. Swin-unet: UNet-like pure Transformer for medical image segmentation. In Proceedings of the European Conference on Computer Vision, Tel Aviv, Israel, 23–27 October 2022; Springer: Cham, Switzerland, 2022; pp. 205–218. [Google Scholar]
- Qin, X.; Zhang, Z.; Huang, C.; Dehghan, M.; Zaiane, O.R.; Jagersand, M. U2-Net: Going deeper with nested U-structure for salient object detection. Pattern Recognit. 2020, 106, 107404. [Google Scholar] [CrossRef]
- Canny, J. A computational approach to edge detection. IEEE Trans. Pattern Anal. Mach. Intell. 1986, 8, 679–698. [Google Scholar] [CrossRef]
- Mlsna, P.A.; Rodriguez, J.J. Gradient and Laplacian edge detection. In The Essential Guide to Image Processing; Elsevier: Amsterdam, The Netherlands, 2009; pp. 495–524. [Google Scholar]
- Smith, T., Jr.; Marks, W.; Lange, G.; Sheriff, W., Jr.; Neale, E. Edge detection in images using Marr-Hildreth filtering techniques. J. Neurosci. Methods 1988, 26, 75–81. [Google Scholar] [CrossRef]
- Gao, W.; Zhang, X.; Yang, L.; Liu, H. An improved Sobel edge detection. In Proceedings of the 2010 3rd International Conference on Computer Science and Information Technology, Chengdu, China, 9–11 July 2010; Volume 5, pp. 67–71. [Google Scholar]
- Carr, M.; Davies, P.; Hoebers, R. Experiments on the structure and stability of mode-2 internal solitary-like waves propagating on an offset pycnocline. Phys. Fluids 2015, 27, 046602. [Google Scholar] [CrossRef]
Figure 1.
Architecture of Middle Transformer U-net (MT-net). The network exhibits a symmetrical structure as a whole, with Residual U-blocks (RSU) as the fundamental unit. Each Decoder generates a side output, which is merged along the channel direction and, subsequently, processed through a convolutional layer to generate the fused output result.

Figure 2.
Residual U-blocks (L = 4).

Figure 3.
Middle-Transformer. It consists of two parts: image serialization and eight Transformer layers. After serializing the image sequence and obtaining the patch embedding and position embedding, they are fed into the Transformer layers for calculation, resulting in the output feature map.
Figure 3.
Middle-Transformer. It consists of two parts: image serialization and eight Transformer layers. After serializing the image sequence and obtaining the patch embedding and position embedding, they are fed into the Transformer layers for calculation, resulting in the output feature map.

Figure 4.
Monthly distribution of ISWs in the northern part of the South China Sea.

Figure 5.
The remote sensing map of the northern South China Sea, mostly consisting of oceanic plates and the results of ISW extraction with deep learning and Canny. (a) is the result of deep learning; (b) is the result of Canny; (c) is the result of Canny without the land plate.
Figure 5.
The remote sensing map of the northern South China Sea, mostly consisting of oceanic plates and the results of ISW extraction with deep learning and Canny. (a) is the result of deep learning; (b) is the result of Canny; (c) is the result of Canny without the land plate.

Figure 6.
Experimental comparison of different traditional methods.

Figure 7.
Experimental comparison of different semantic segmentation models.

Figure 8.
Experimental comparison figure during the process of improving the model.

Figure 9.
Comparative experiments using different functional modules. (A,B) are the original images. (a1,b1) are the predictions of the -net model augmented with multiple loss functions. (a2,b2) are the results of the -net model with the Transformer. (a3,b3) are the results of our model.
Figure 9.
Comparative experiments using different functional modules. (A,B) are the original images. (a1,b1) are the predictions of the -net model augmented with multiple loss functions. (a2,b2) are the results of the -net model with the Transformer. (a3,b3) are the results of our model.

Figure 10.
Model performance on other data.


Table 1.
The results of the experiment on our datasets with segmentation models.
| F1-Score | MACC | MIoU | |
|---|---|---|---|
| Swin-UNet | 53.32 | 62.33 | 55.93 |
| Transfuse | 51.64 | 51.91 | 49.15 |
| Polyp-PVT | 55.93 | 58.94 | 53.19 |
| -Net | 52.33 | 61.30 | 52.38 |
| Multi-loss -Net | 53.48 | 62.51 | 53.96 |
| Transformer -Net | 54.39 | 66.23 | 63.83 |
| Ours | 56.03 | 75.20 | 71.57 |
Table 2.
The recognition accuracy changes with the increase in modules in our dataset.
| Different Variants | ||||
|---|---|---|---|---|
| -Net | ✓ | ✓ | ✓ | ✓ |
| Multi-loss | ✓ | ✓ | ||
| Transformer | ✓ | ✓ | ||
| MIoU (%) | 52.38 | 53.96 | 63.83 | 71.57 |
Disclaimer/Publisher’s Note: The statements, opinions and data contained in all publications are solely those of the individual author(s) and contributor(s) and not of MDPI and/or the editor(s). MDPI and/or the editor(s) disclaim responsibility for any injury to people or property resulting from any ideas, methods, instructions or products referred to in the content. |
© 2023 by the authors. Licensee MDPI, Basel, Switzerland. This article is an open access article distributed under the terms and conditions of the Creative Commons Attribution (CC BY) license (https://creativecommons.org/licenses/by/4.0/).
Share and Cite
MDPI and ACS Style
Barintag, S.; An, Z.; Jin, Q.; Chen, X.; Gong, M.; Zeng, T. MTU2-Net: Extracting Internal Solitary Waves from SAR Images. Remote Sens. 2023, 15, 5441. https://doi.org/10.3390/rs15235441
AMA Style
Barintag S, An Z, Jin Q, Chen X, Gong M, Zeng T. MTU2-Net: Extracting Internal Solitary Waves from SAR Images. Remote Sensing. 2023; 15(23):5441. https://doi.org/10.3390/rs15235441
Chicago/Turabian StyleBarintag, Saheya, Zhijie An, Qiyu Jin, Xu Chen, Maoguo Gong, and Tieyong Zeng. 2023. "MTU2-Net: Extracting Internal Solitary Waves from SAR Images" Remote Sensing 15, no. 23: 5441. https://doi.org/10.3390/rs15235441
Note that from the first issue of 2016, this journal uses article numbers instead of page numbers. See further details here.