Article

Image Segmentation and Filtering of Anaerobic Lagoon Floating Cover in Digital Elevation Model and Orthomosaics Using Unsupervised k-Means Clustering for Scum Association Analysis

by
Benjamin Steven Vien
1,*,
Thomas Kuen
2,
Louis Raymond Francis Rose
3 and
Wing Kong Chiu
1
1
Department of Mechanical and Aerospace Engineering, Monash University, Wellington Rd, Clayton, VIC 3800, Australia
2
Melbourne Water Corporation, 990 La Trobe Street, Docklands, VIC 3008, Australia
3
Defence Science & Technology Group, Fishermans Bend, VIC 3207, Australia
*
Author to whom correspondence should be addressed.
Remote Sens. 2023, 15(22), 5357; https://doi.org/10.3390/rs15225357
Submission received: 5 October 2023 / Revised: 11 November 2023 / Accepted: 13 November 2023 / Published: 14 November 2023

Abstract

:
In various engineering applications, remote sensing images such as digital elevation models (DEMs) and orthomosaics provide a convenient means of generating 3D representations of physical assets, enabling the discovery of new insights and analyses. However, the presence of noise and artefacts, particularly unwanted natural features, poses significant challenges, and their removal requires the application of filtering techniques prior to conducting analysis. Unmanned aerial vehicle-based photogrammetry is used at Melbourne Water’s Western Treatment Plant as a cost-effective and efficient method of inspecting the floating covers on the anaerobic lagoons. The focus of interest is the elevation profile of the floating covers for these sewage-processing lagoons and its implications for sub-surface scum accumulation, which can compromise the structural integrity of the engineered assets. However, unwanted artefacts due to trapped rainwater, debris, dirt, and other irrelevant structures can significantly distort the elevation profile. In this study, a machine learning algorithm is utilised to group distinct features on the floating cover based on an image segmentation process. An unsupervised k-means clustering algorithm is employed, which operates on a stacked 4D array composed of the elevation of the DEM and the RGB channels of the associated orthomosaic. In the cluster validation process, seven cluster groups were considered optimal based on the Calinski–Harabasz criterion. Furthermore, by utilising the k-means method as a filtering technique, three clusters contain features related to the elevations associated with the floating cover membrane, collectively representing 84% of the asset, with each cluster contributing at least 19% of the asset. The artefact groups constitute less than 6% of the asset and exhibit significantly different features, colour characteristics, and statistical measurements from those of the membrane groups. The study found notable improvements using the k-means filtering method, including a 59.4% average reduction in outliers and a 36.3% decrease in standard deviation compared to raw data. Additionally, employing the proposed method in the scum hardness analysis improved correlation strength by 13.1%, removing approximately 16% of the artefacts in total assets, in contrast to a 3.6% improvement with the median filtering method. This improved imaging will lead to significant benefits when integrating imagery into deep learning models for structural health monitoring and asset performance.

Graphical Abstract

1. Introduction

The Western Treatment Plant (WTP) in Werribee, Victoria, Australia, is operated by Melbourne Water and plays a crucial role in providing sewage treatment services to over half of Melbourne’s population [1]. The anaerobic digestion of raw sewage takes place in treatment lagoons that are covered with high-density polyethylene (HDPE) sheets approximately 2 mm thick and 450 × 170 m in size, and produces methane-rich biogas that can be harvested for renewable energy generation [1]. However, a progressive accumulation of scum can occur underneath these floating covers, building up to large mounds known as scumbergs. The presence of scumbergs can compromise the structural integrity of the floating covers as well as obstruct the collection of biogas, thereby affecting renewable energy generation.
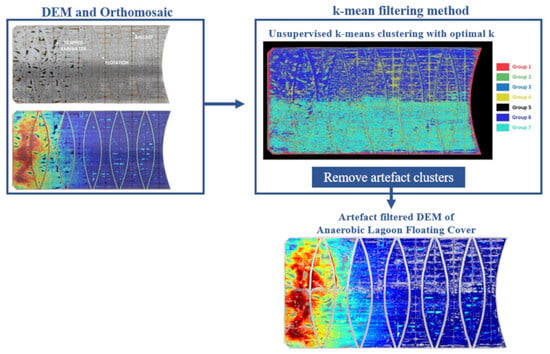
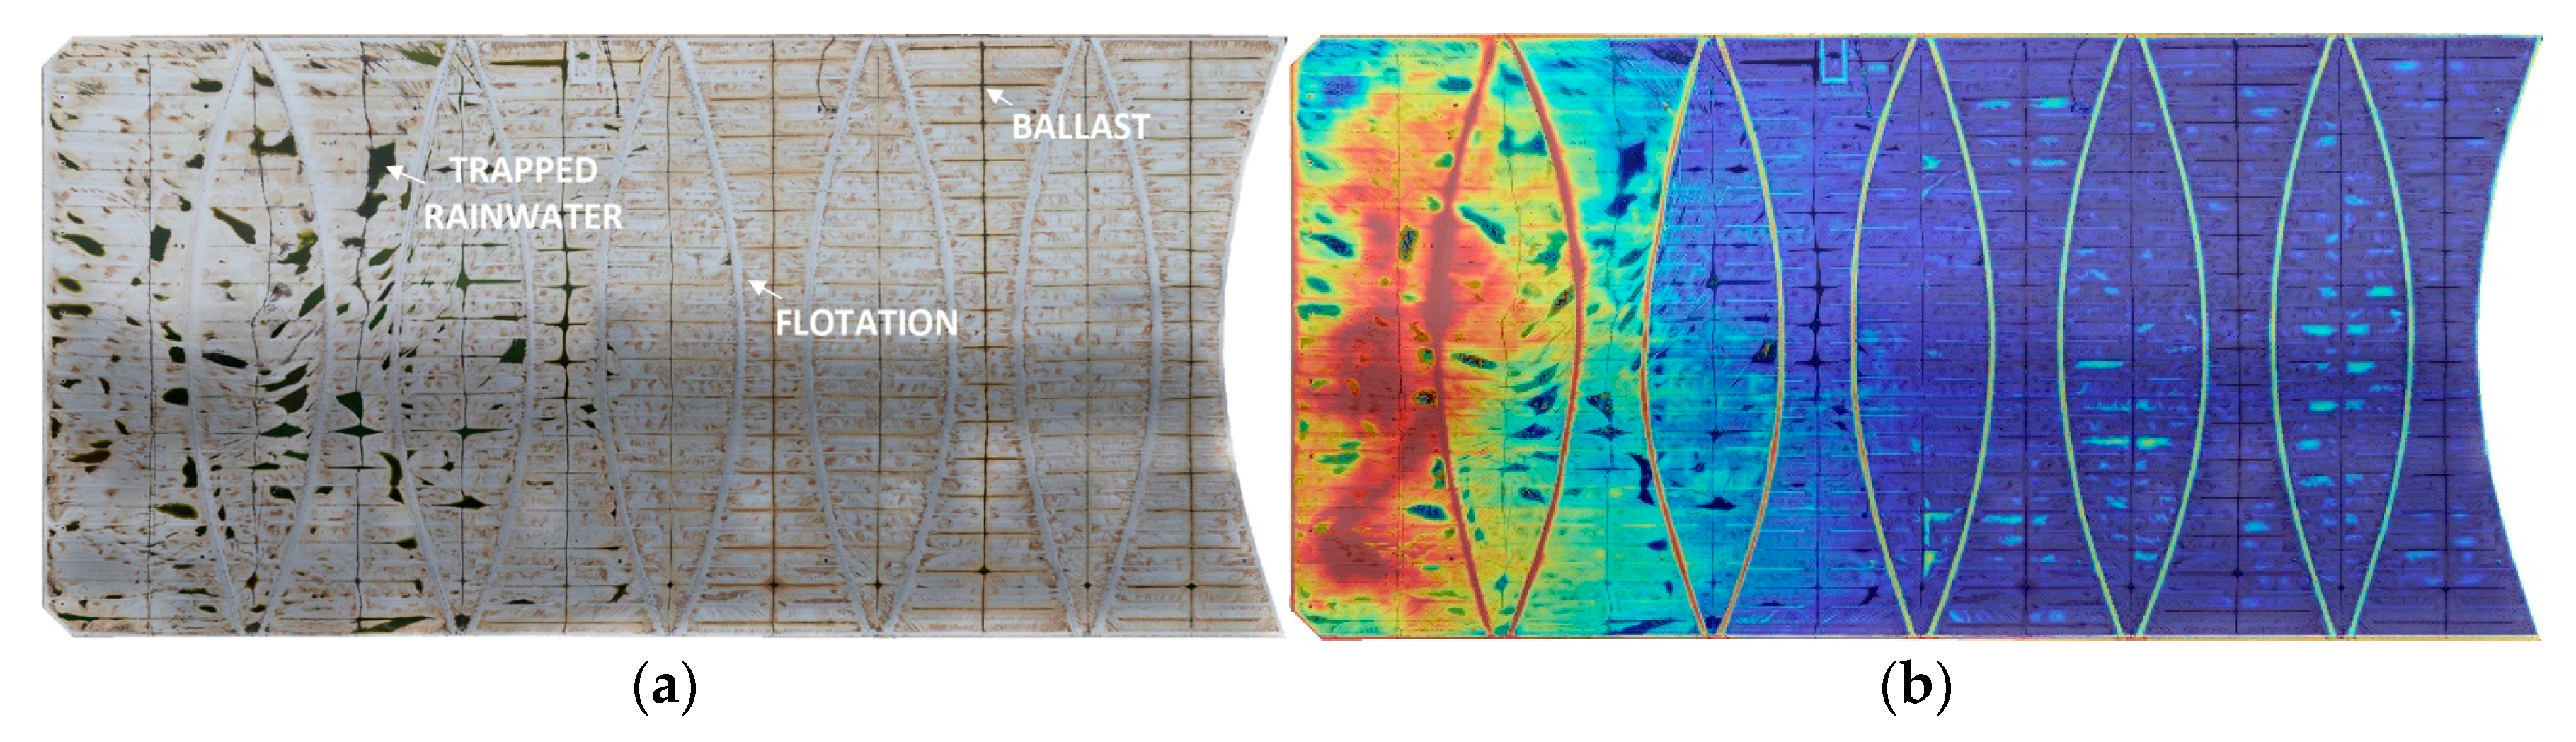
Recently, unmanned aerial vehicle (UAV)-based photogrammetry has been employed as an inherently safe, rapid inspection to regularly capture the elevation profile of the floating covers. Specifically, orthomosaics and digital elevation models (DEMs) of these covers are generated through this approach, enabling tracking of the elevation of the cover, and, hence, of the underlying scum [2,3,4], as depicted in Figure 1. In particular, this remote sensing imagery can provide the early detection of scum accumulation and offers the potential for developing more detailed diagnostic and prognostic models [5,6] for assessing the structural health of the floating covers using artificial intelligence, in line with the promise of the Industry 4.0 revolution.
To date, our research project has primarily focused on the development of non-contact techniques for safely gathering information regarding deformation and solid scum accumulation under the floating cover [2,3,7]. The DEMs, in particular, have been instrumental in providing the valuable spatial contexts of the floating cover, enhancing our understanding of scum behaviour and facilitating WTP asset management. In our previous work, Wong et al. [
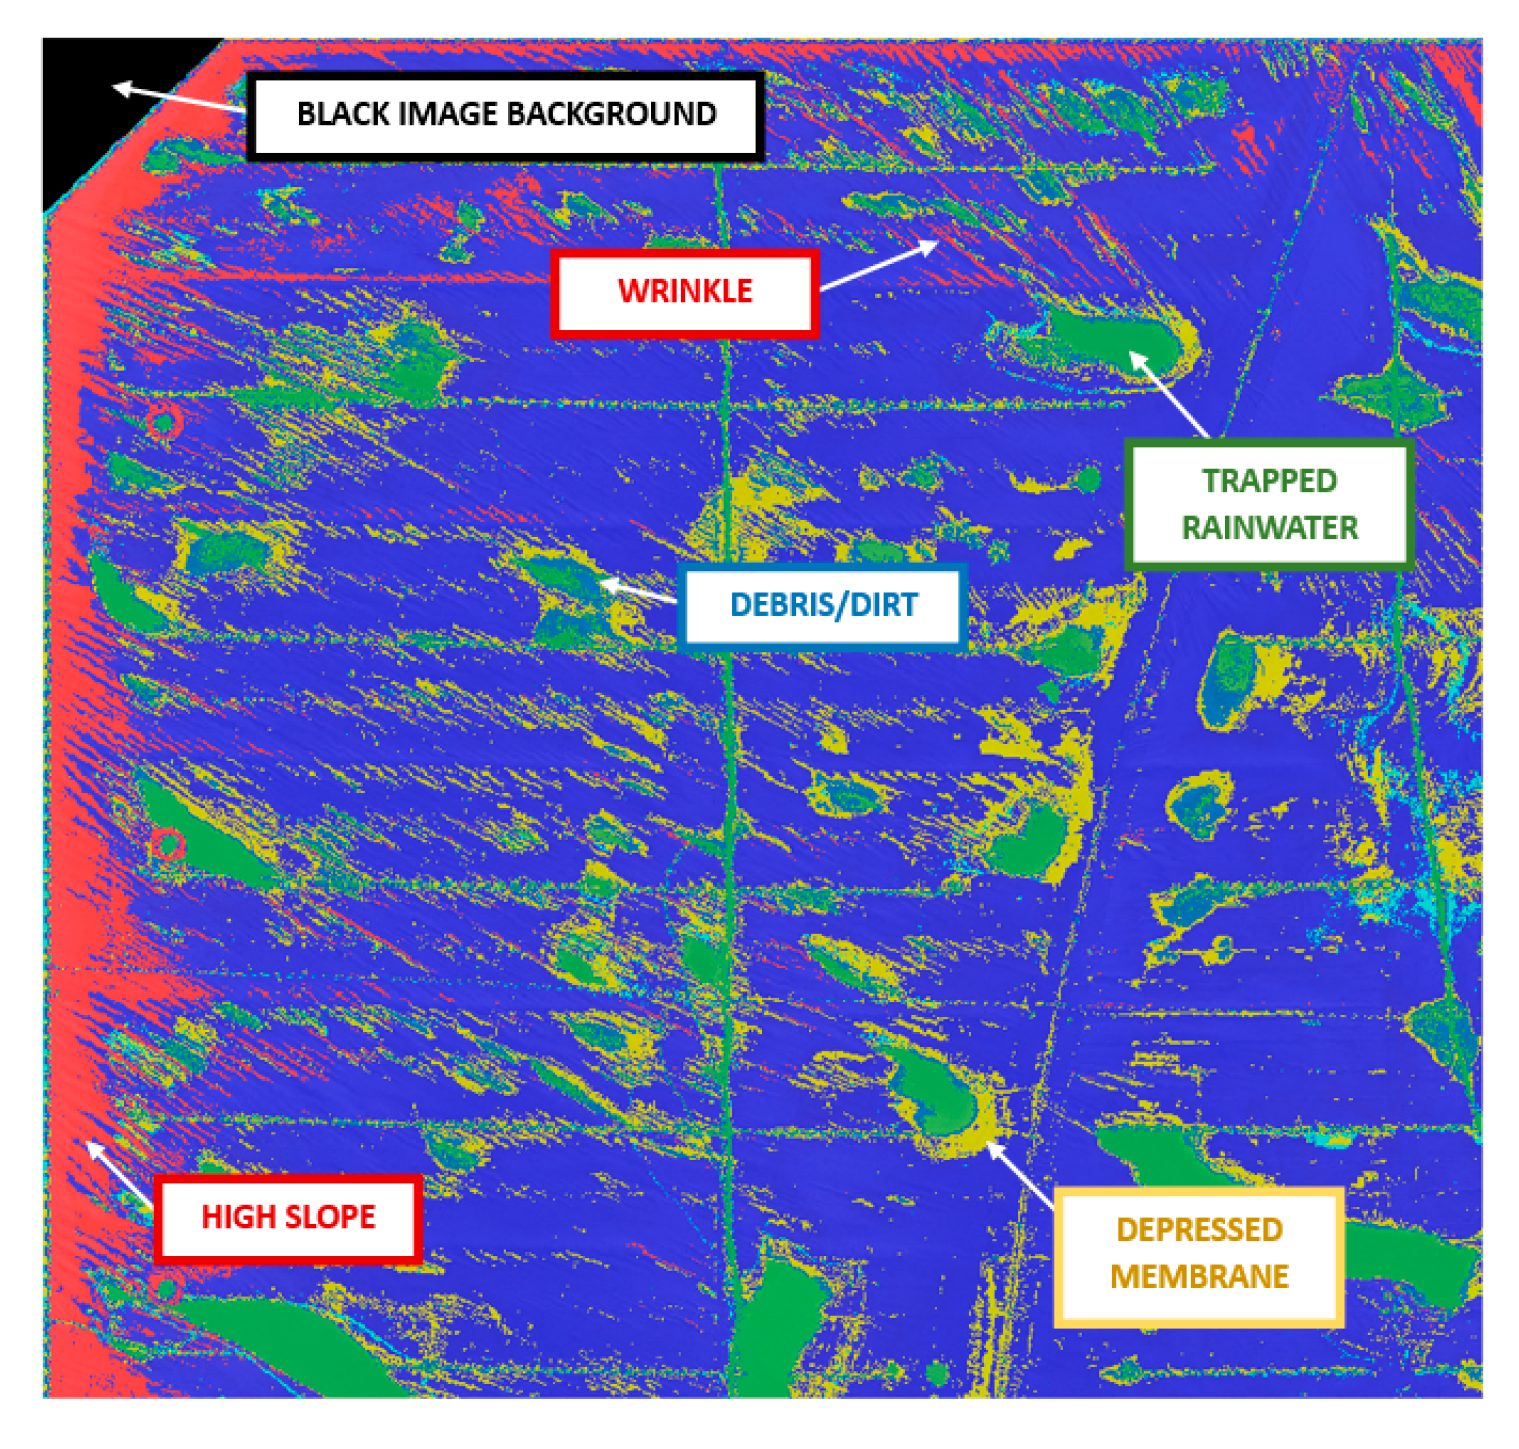
2] demonstrated the capability of an unsupervised machine learning technique in delineating boundaries between regions of different scum hardness levels by leveraging elevation data from the DEM. Additionally, the study reported that a linear model explains 77% of the variance in scum depths based on the cover elevation above water level. However, the extensive manual suppression of unwanted artefacts (e.g., flotation, ballast, and water features, see Figure 1) in the DEM was required, since these features were not associated with the actual floating cover elevation and could cause erroneous results. Therefore, there is a need for a robust method to remove artefacts in DEMs, allowing for a more rigorous assessment of the effects of scum on the floating covers.
Notwithstanding these acknowledged advantages of DEMs, it is important to recognise their susceptibility to errors, which manifest as noise in the elevation data. Furthermore, multiple preprocessing steps are very often necessary to isolate the feature of interest before conducting analysis [8,9]. In particular, filtering algorithms to autonomously remove unwanted features are advantageous, considering the labourious task of manually manipulating data, particularly for high-resolution images with detailed features. Several filter-based methods [8] have been implemented to remove artefacts and reduce errors associated with DEMs. Classical smoothing filter methods, such as the mean filter, present a trade-off between the degree of smoothing and the preservation of key features. The median filter, a widely-used simple non-linear filtering method used in various industries, exhibits robustness in reducing impulse-like noise by replacing each data point with the median value of the surrounding points within a specified window. Advanced spatial methods, using adaptive smoothing, multiple anisotropic filters [10] and filtering in the frequency space [11] have been shown to smooth 2D elevation profiles while preserving subtle details. Specifically, multiscale analysis methods analyse variations and complexities across multiple scales, providing a comprehensive understanding of the phenomena, as opposed to those operating at singular scalar measurements [12,13]. These approaches have been increasingly applied to DEMs to capture features at different scales, as well as remove noise. Hui et al. [12] introduced a simple technique using a linearly expanding window size and simple slope thresholds. Hani et al. [13] utilised the lift scheme, a variant of the wavelet transform, to evaluate terrain surface roughness. Gallant [9] demonstrated a multiscale adaptive smoothing approach to progressively increase the level of smoothing when noise is relatively larger. Booth et al. [14] achieved 97% classification accuracy rate in landslide mapping by using spectrum-based methods and filtering unwanted non-native features with the assumption that they exhibit higher spatial frequency. Considerable progress has been achieved in the active field of vegetation suppression within geospatial models, which includes colour-based and slope-based filtering techniques [15,16,17,18], with commercial software integrating proprietary algorithms specifically designed for vegetation filtering in ground terrain elevation [19]. However, in specialised applications, the necessity arises for employing highly specific processing strategies, including multiple stages of filtering [15,17,18,20,21]. These demands often require a substantial investment in developing filtering approaches tailored to unique application needs, and may not be suitable for other applications. Furthermore, the limitations associated with the implementation of advanced spatial techniques lie in their diminishing intuitiveness as the complexity of the filtering technique increases, along with the increasing number of adjustable parameters. Additionally, these techniques are predominantly limited to showing one (i.e., spatial) content of the data, and do not consider multiple data attributes, thus restricting their scalability when presented with new information. Nevertheless, removing natural features (e.g., vegetation and trapped rainwater), man-made objects, and unwanted artefacts that do not correspond to the terrain of interest is known to be problematic and challenging [8,22,23].
In the past decade, there has been a significant interest in incorporating machine learning techniques into DEM and imagery data for classification and feature segmentation applications [7,24,25,26,27,28]. A key advantage of machine learning techniques is their ability to learn the characteristics of features automatically from the data, eliminating the need for explicit feature definitions used in classical methods for classification purposes. Henriques et al. [25] segmented intertidal habitats for ecological research using DEM and satellite imagery in a supervised ensemble learning random decision forests algorithm. In Su’s work [26], semi-arid vegetation mapping was conducted using remote sensing data, including mean elevation via DEM and nadir and off-nadir reflectance measurements, through support vector machine learning, achieving a classification accuracy of approximately 80%. Gebrehiwot et al. [27] utilised a pre-trained convolutional neural network by applying transfer learning for flood extent mapping, in classifying water, building, and non-relevant features. Their neural network was fine-tuned using a smaller training population of manually annotated UAV imagery data, resulting in an overall accuracy of 97%. While supervised learning models, especially deep learning models, have the capability to produce highly accurate results, the main challenges in their development include the need for very large datasets and labelled data. These limitations require substantial time and labour investments, which can render their practical implementation less feasible. Yet, studies have employed unsupervised learning methods, i.e., clustering methods, to address the common challenges of insufficient labelled imagery data [29,30,31]. A notable advantage of clustering algorithms is their capability to rapidly identify and enable the visual examination of groups associated with features of interest within the clustering results without prior knowledge of the data or labelled data to train the model. Cinat et al. [30] demonstrated the application of an unsupervised clustering algorithm on imagery data for isolating canopy vegetation for crop management. More recently, an unsupervised deep learning method using a convolutional autoencoder network trained on multispectral imagery and DEM has been used to extract abstract, high-level features from the embedding layer for landslide detection [31]. Evidently, the emerging research trend in utilising machine learning algorithms is attributed to their performance in effectively filtering noise and artefacts, while offering more capabilities such as flexibility and scalability compared to conventional methods.
In today’s data-centric landscape, there is a strong emphasis on developing efficient and user-friendly data processing techniques for various industry applications. Melbourne Water is actively pursuing innovative methods that consider both DEMs and orthomosaics, aiming to seamlessly integrate future imagery for further refinement. Currently, conventional filtering methods, such as median filters, are employed for DEM processing on anaerobic lagoons due to their straightforward, rapid, and cost-effective approach, which is sufficient for their specific applications [4]. However, advanced filtering methods, known for their superior accuracy, often introduce increased complexity. As a result, they can be less intuitive for non-specialists to interpret and implement, and may not scale effectively with additional data characteristics, making them not suitable for this specific industrial application. As such, machine learning approaches, particularly unsupervised learning methods, emerge as highly promising alternatives that align with Melbourne Water’s resources and needs, with the potential to enhance the existing practices.
This paper proposes a novel approach that utilises an unsupervised k-means clustering machine learning algorithm by incorporating DEMs and their associated orthomosaics for filtering features on the floating cover of the anaerobic lagoon. This approach enables the visual identification of features within each cluster, followed by filtering to retain clusters containing features related to the membrane cover. The investigation first examines the learned clusters and then demonstrates the filtering approach in a localised region of interest, comparing it with current filtering methods used in practice. Furthermore, the correlations between scum hardness and unfiltered and filtered DEM elevations are investigated. The preceding results highlight the significance of this approach in achieving a more accurate and precise analysis of the scum hardness and elevation of the floating cover. Furthermore, this preliminary work represents a significant step forward in the pursuit of real-time structural health monitoring for anaerobic lagoons at WTP.

2. Materials and Methods

2.1. UAV–Photogrammetry

Elevation maps of WTP floating covers were obtained via UAV–photogrammetry using a Hex Rotor UAV DJIM600 Pro, equipped with a 15 mm lens Zenmuse X5 camera, and employing a single flight path mode set in Pix4Dcapture [32]. The scan was conducted at a height of 50 m above the floating cover, and was georeferenced using 6 ground control points, with the entire scanning process lasting approximately 30 minutes. To ensure comprehensive coverage, the capture configuration was set to achieve 80% image overlap in both forward and side directions.
Post-processing of these images was performed using Agisoft Metashape Professional, version 1.5, which enables users to customise the alignment quality, generate dense clouds, create meshes, and generate DEMs and orthomosaics [19]. For the purpose of alignment, all metadata, including GPS location and camera settings, were imported into Agisoft Metashape Professional, version 1.5. During the post-processing stage, all settings were configured to their maximum values when working with the images acquired from the scan. A total of 655 aerial images were captured in January 2019 and underwent processing to construct the raw DEM and orthomosaic, achieving a spatial resolution of 1.14 cm per pixel. The raw DEM and orthomosaic underwent a transformation process to align them with a reference point, such that the elevation is relative to the water level, and were subsequently rescaled into a lower resolution of 2 cm per pixel for analysis.

2.2. Scum Hardness

On-site scum hardness surveys of WTP floating covers are regularly carried out by field personnel. These surveys were conducted through cover walk inspections, wherein personnel walked on the floating cover to qualitatively assess the hardness of the scum underneath. The scum hardness levels were categorised as follows, in descending order of hardness: hard (H), medium-hard (MH), medium (M), medium-soft (MS), soft (S), fluffy (F), water–fluffy (WF) and water (W). For the present study, the closest available completed survey conducted in January 2018 was considered for analysis. The scum hardness survey was digitised by manually annotating polygon shapes with the orthomosaic as a reference, as shown in Figure 2.

2.3. Unsupervised k-Means Clustering Method for Image Segmentation and Filtering

2.3.1. k-Means Clustering Method

Clustering analysis is a widely-used unsupervised machine learning technique that aims to discover inherent groups or patterns within a dataset where the data points do not have any predefined categories [33]. The goal of clustering algorithms is to partition data into clusters based on their similarity, and the resulting clusters represent subsets of data points that share common characteristics. Several clustering algorithms have been proposed for the classification and segmentation of imagery relating to this field of work [29,30,31]. However, in high-dimensional spaces and datasets with diverse data types, clustering algorithms can be slower and more computationally intensive, and struggle to identify meaningful groups. k-means clustering is the most popular choice to group data into a predefined number of k clusters due to its efficiency, ease of implementation [33], and suitability for this particular study. This algorithm involves the random selection of initial centroids for each cluster, followed by the assignment of each data point to its nearest centroid. The centroids are then updated iteratively by computing the mean of the assigned data points until convergence is achieved. The objective of the cost function is to minimise the sum of squared Euclidean distances between the data points and the centroid of their corresponding cluster. However, the traditional execution of the k-means method to achieve convergence is computationally expensive and can struggles with scalability when applied to large and high-dimensional data. Furthermore, it is sensitive to the initialisation of the centroid, leading to potentially suboptimal clusters. An improved k -means algorithm with a centroid initialisation technique, commonly known as k -means++ clustering analysis [34], aimed to address these shortcomings. Unlike the random initialisation in traditional k-means, k-means++ distributes the initial centroid more uniformly across the dataset, resulting in a more reliable clustering outcome, as well as faster convergence. From here on, the paper now refers to k-means++ as k-means for simplicity.

2.3.2. Image Segmentation Using k-Means

In this work, the analysis used Statistics and Machine Learning Toolbox in MATLAB R2022b. For the image segmentation process using k-means, the proposed dataset involves stacking the DEM and orthomosaic image, resulting in a 4D array that comprises features such as red, green, and blue (RGB) channels with values ranging from 0 to 255, along with elevation displacement. The algorithm configuration was defined by setting a maximum of 10,000 iterations, along with 5 multiple runs (replicates) utilising different initialisations of centroids. The solution was determined by selecting the replicate with the lowest cost function value.
Generally, as k increases, the segmentation becomes more refined, capturing smaller and more intricate features, as seen in Figure 3. However, it should be noted that excessively large values of k can lead to overfitting the data, resulting in poor generalisation performance and increased computational complexity. Therefore, it is crucial to determine the optimal number of clusters to ensure meaningful and interpretable clusters. Cluster validation was performed by using the Calinski–Harabasz (CH) Criterion to identify the optimal value k o p t and ensure robustness of the clusters [35]. This criterion assesses the trade-off between minimising within-cluster variance and maximising between-cluster variance, ensuring a balance between clustering results. By examining the CH index across different values of k, ranging from 0 to 12, the value of k o p t was selected as the one that yielded the highest CH index. The maximum k value was arbitrarily selected to ensure that the highest CH is achieved well before reaching the maximum k range and for discussion beyond k o p t . After obtaining the clustering outputs for k o p t , a 2D image segmentation map is generated, with each pixel assigned an integer value ranging from 1 to k o p t corresponding to its cluster groups. Thereby, the features within each cluster can be visually identified on the image segmentation map, enabling subsequent analysis of the groups. Additionally, the centroid and standard deviation of each variable for each cluster can be extracted, calculated, and reported for further analysis.

2.3.3. Cluster Groups of k-Means Image Segmentation with Optimal k

Based on the CH index, the optimal number of clusters was k o p t = 7 , as seen in Figure 4a), with the resulting image segmentation based on k-means is shown in Figure 4b). After determining the optimal number of clusters using the k-means clustering algorithm, the natural and man-made features within each cluster were identified through visual inspection, as illustrated in Figure 4 and Figure 5, and their associated centroid of variables is presented in Table 1. The black image background was identified as Group 5, characterised by low RGB channel values, resembling the colour black, and significantly low elevation. As this cluster was unrelated to the asset, it was removed by setting its value to null (NaN), and was thereby ignored in the further analysis. The remaining clusters were then specifically analysed based on the image of the asset and not the entire image.
The membrane cover was segmented into two groups, namely Groups 6 and 7, which represented the upper and lower halves of the floating cover asset, respectively, as seen in Figure 4. In Group 7, the colour scheme was relatively darker, primarily due to cloud shadows. During data acquisition using UAV–photogrammetry, photos were captured progressively over approximately 30 minutes, and on some occasions, cloud transit resulted in overcast shadows, causing certain sections of the cover to appear darker. This darkness corresponded to approximately 9.7% decrease in luminance compared to Group 6. Additionally, the elevation in Group 6 (upper half) was slightly higher than that in Group 7 (lower half), indicating a relatively higher average elevation in the upper half of the floating cover.
Moreover, clusters (Groups 1–3) were found to be associated with intricate features of the membrane cover, comprising approximately 5–6% of the asset. These groups exhibited larger standard deviations in colour characteristics, ranging from 12.0 to 17.2, which is approximately twice that of the membrane cover groups (Groups 6 and 7). Group 1, characterised by the high elevation, exhibited membrane features with high slope elevations and crests of wrinkles near the boundary of the floating cover. Group 2 exhibited a distinct dark colour scheme, representing the water features, and had a relatively lower centroid elevation compared to groups representing the membrane cover. However, the significant elevation noise in this group, indicated by the relatively large standard deviations that are approximately 30% larger than those of the membrane cover groups, suggested that water features contributed significantly to the observed noise. Group 3 consisted of features characterised by distinctive brown colours such as debris, dirt, and dried water marks, with a similar elevation to Group 2. Additionally, small man-made structures such as ballast and portholes were also clustered within this group. Group 4 possessed depressed membrane features, including in the vicinity of shallow water features and wrinkle troughs, as indicated by its low centroid elevation. This cluster had similar RGB values to Groups 6 and 7, and accounted for almost 20% of the asset.

2.3.4. k-Mean Filtering Method: Filtering Unwanted Artefacts on the Asset

In the previous section, the k-means clustering method was demonstrated as a technique for image segmentation to categorise features of the anaerobic lagoon into distinct groups. With the learned group segments using k-means clustering, this method enables the visual identification of features within each cluster, followed by the exclusion of the unwanted clusters and the retention of elevation points assigned to the specific clusters consisting of features specifically relating to the matter of interest. Furthermore, the filtering of feature groups is further facilitated by analysing their quantitative characteristics i.e., data portion, as well as their elevation and RGB characteristics. Primarily, the similarities of these characteristics for each group are assessed to determine their exclusion. Thus, this proposed procedure enables the removal of unwanted features that could interfere with the analysis of specific features of interest, resulting in a more precise analysis. From here on, this procedure is referred to as the “k-means filtering” method for ease of reference, and, as such, data (elevation) filtered using this method are referred to as “k-means filtered data”.
In this particular study, the k-means filtering method is performed to exclude artefacts that are not associated with the floating cover membrane, with the goal of analysing the elevation associated with the floating cover. Thereby, only groups relating to the asset (all groups except for Group 5) are considered in this analysis from here on. The rationale for retaining and removing the feature groups is as follows:
  • Retained feature groups: Groups 4, 6, and 7 mainly consisting of features related to the membrane cover, exhibit similar RGB characteristics with an average relative difference of 32.9 for colour intensities relative to those of Group 6, as seen in Table 1. Collectively, these groups account for 84% of the asset, with each of these groups significantly contributing between 19% and 38% of the asset. Thereby, these groups are classified as representative of the membrane cover.
  • Unwanted feature groups: Conversely, the remaining groups with data points constituting less than 6% of the total data points of the asset were interpreted as artefacts. These groups exhibited features, RGB characteristics, and statistical measurements different from those of the membrane groups, as discussed in the previous section. Therefore, they were deemed irrelevant and subsequently removed from the analysis.
Subsequently, the image segmentation map can be adapted to create a pixel-wise mask map, which is applied to the raw DEM. This process yields a filtered DEM where only the relevant features are retained, while the rest are masked. For this study, the retained feature groups are combined by assigning them a value of 1, whereas artefact groups are assigned a null value (NaN), thereby resulting in a filtered DEM with a more accurate representation of the elevations related to the floating cover.
In the context of this study, it is noteworthy that flotations, as indicated in Figure 6, are a prominent feature of the asset, and are anticipated to significantly influence the analysis of scum association. Notably, the k-means clustering algorithm did not facilitate the identification of these flotations, which remained unfiltered through the proposed filtered method. To address this, a binary mask map was created and employed on the filtered DEMs to manually remove the flotations. The process involved the manual tracing and interpolation of the flotations using a cubic spline method in the in-plane directions to generate uniform discretised lines on a binary mask map. Subsequently, these lines were dilated using a morphological dilation with a disk-shaped structuring element of 1 m radius, ensuring sufficient suppression of the corresponding data points, as seen in Figure 6.
The k-means filtered DEM, shown in Figure 6, is compared in the following sections of the results to the existing methods for elevation readings and scum hardness analysis. In order to maintain consistency throughout the comparative study, the flotation suppression mask was applied to the raw data and data after the application of filtering methods.
To benchmark the proposed method, the current filtering methods used were applied, including 2D median, mean, and Gaussian filters. Generally, classical filtering methods operate by computing each pixel value in the output array with the prescribed function, which, in the case of the median filter, corresponds to the median value within the pixel’s neighbourhood in the input array. This was accomplished by systematically moving a fixed-size window across the input array, centring it on each pixel in turn. At each window position, the filter takes into account the pixel values within the neighbourhood and executes the prescribed function, computing the centre pixel of the window in the output array, accordingly. For a Gaussian filter, the prescribed function replaces the centre pixel with a weighted average determined by a Gaussian function, with the peak value at the centre pixel of the window. This entire process is subsequentially repeated for all pixels in the input array. For comparison, the median filter was employed with window sizes 3, 7, and 15, the mean filter was employed with window sizes 7 and 15, and the Gaussian filter was employed using window sizes 9 and 21, along with corresponding 2- and 5-pixel standard deviations, respectively. These classical filtering methods were applied solely to the elevation of the DEM, differing from the proposed k-means filtering method, which disregards unwanted clusters. The comparison of these methods is intended to provide further insight and contribute to the advancement of analysing methods in the industry. Additionally, the results were evaluated against a laser-surveyed elevation measurement obtained using the IMEX i77R rotating red beam laser.
The elevations of a 2 m by 2 m localised region of interest, which primarily contained a porthole and trapped rainwater, were considered to demonstrate the effectiveness of the k-mean filtering method compared to the existing methods. Furthermore, the raw elevation distributions for different scum hardness levels were analysed and compared with those obtained using the median filter with a window size of 15 and the k-means filtering method. Statistical measurements were evaluated for these comparisons. Outliers in the elevation distributions were defined as values more than 1.5 times the interquartile range above the upper quartile or below the lower quartile. Additionally, Spearman’s correlation test was conducted to evaluate the coefficient of correlation strengths between scum hardness and elevation. The analysis compared the raw elevation data, median filtered data, and k-means filtered data. The ordinal categorical data representing the scum hardness (“W” to “H”) were assigned ranks corresponding to the numerical values 1 to 8, respectively.

3. Results

3.1. Elevation Distributions of a Localised Region of Interest Using Various Filtering Methods

The following results demonstrate the effectiveness of the k-means filtering method and its comparison with existing methods in a 2 m by 2 m localised region of interest. In this section, the clustered groups are identified via the k-means clustering algorithm, followed by a statistical comparison of different filtering methods and their accuracy relative to laser survey measurements.
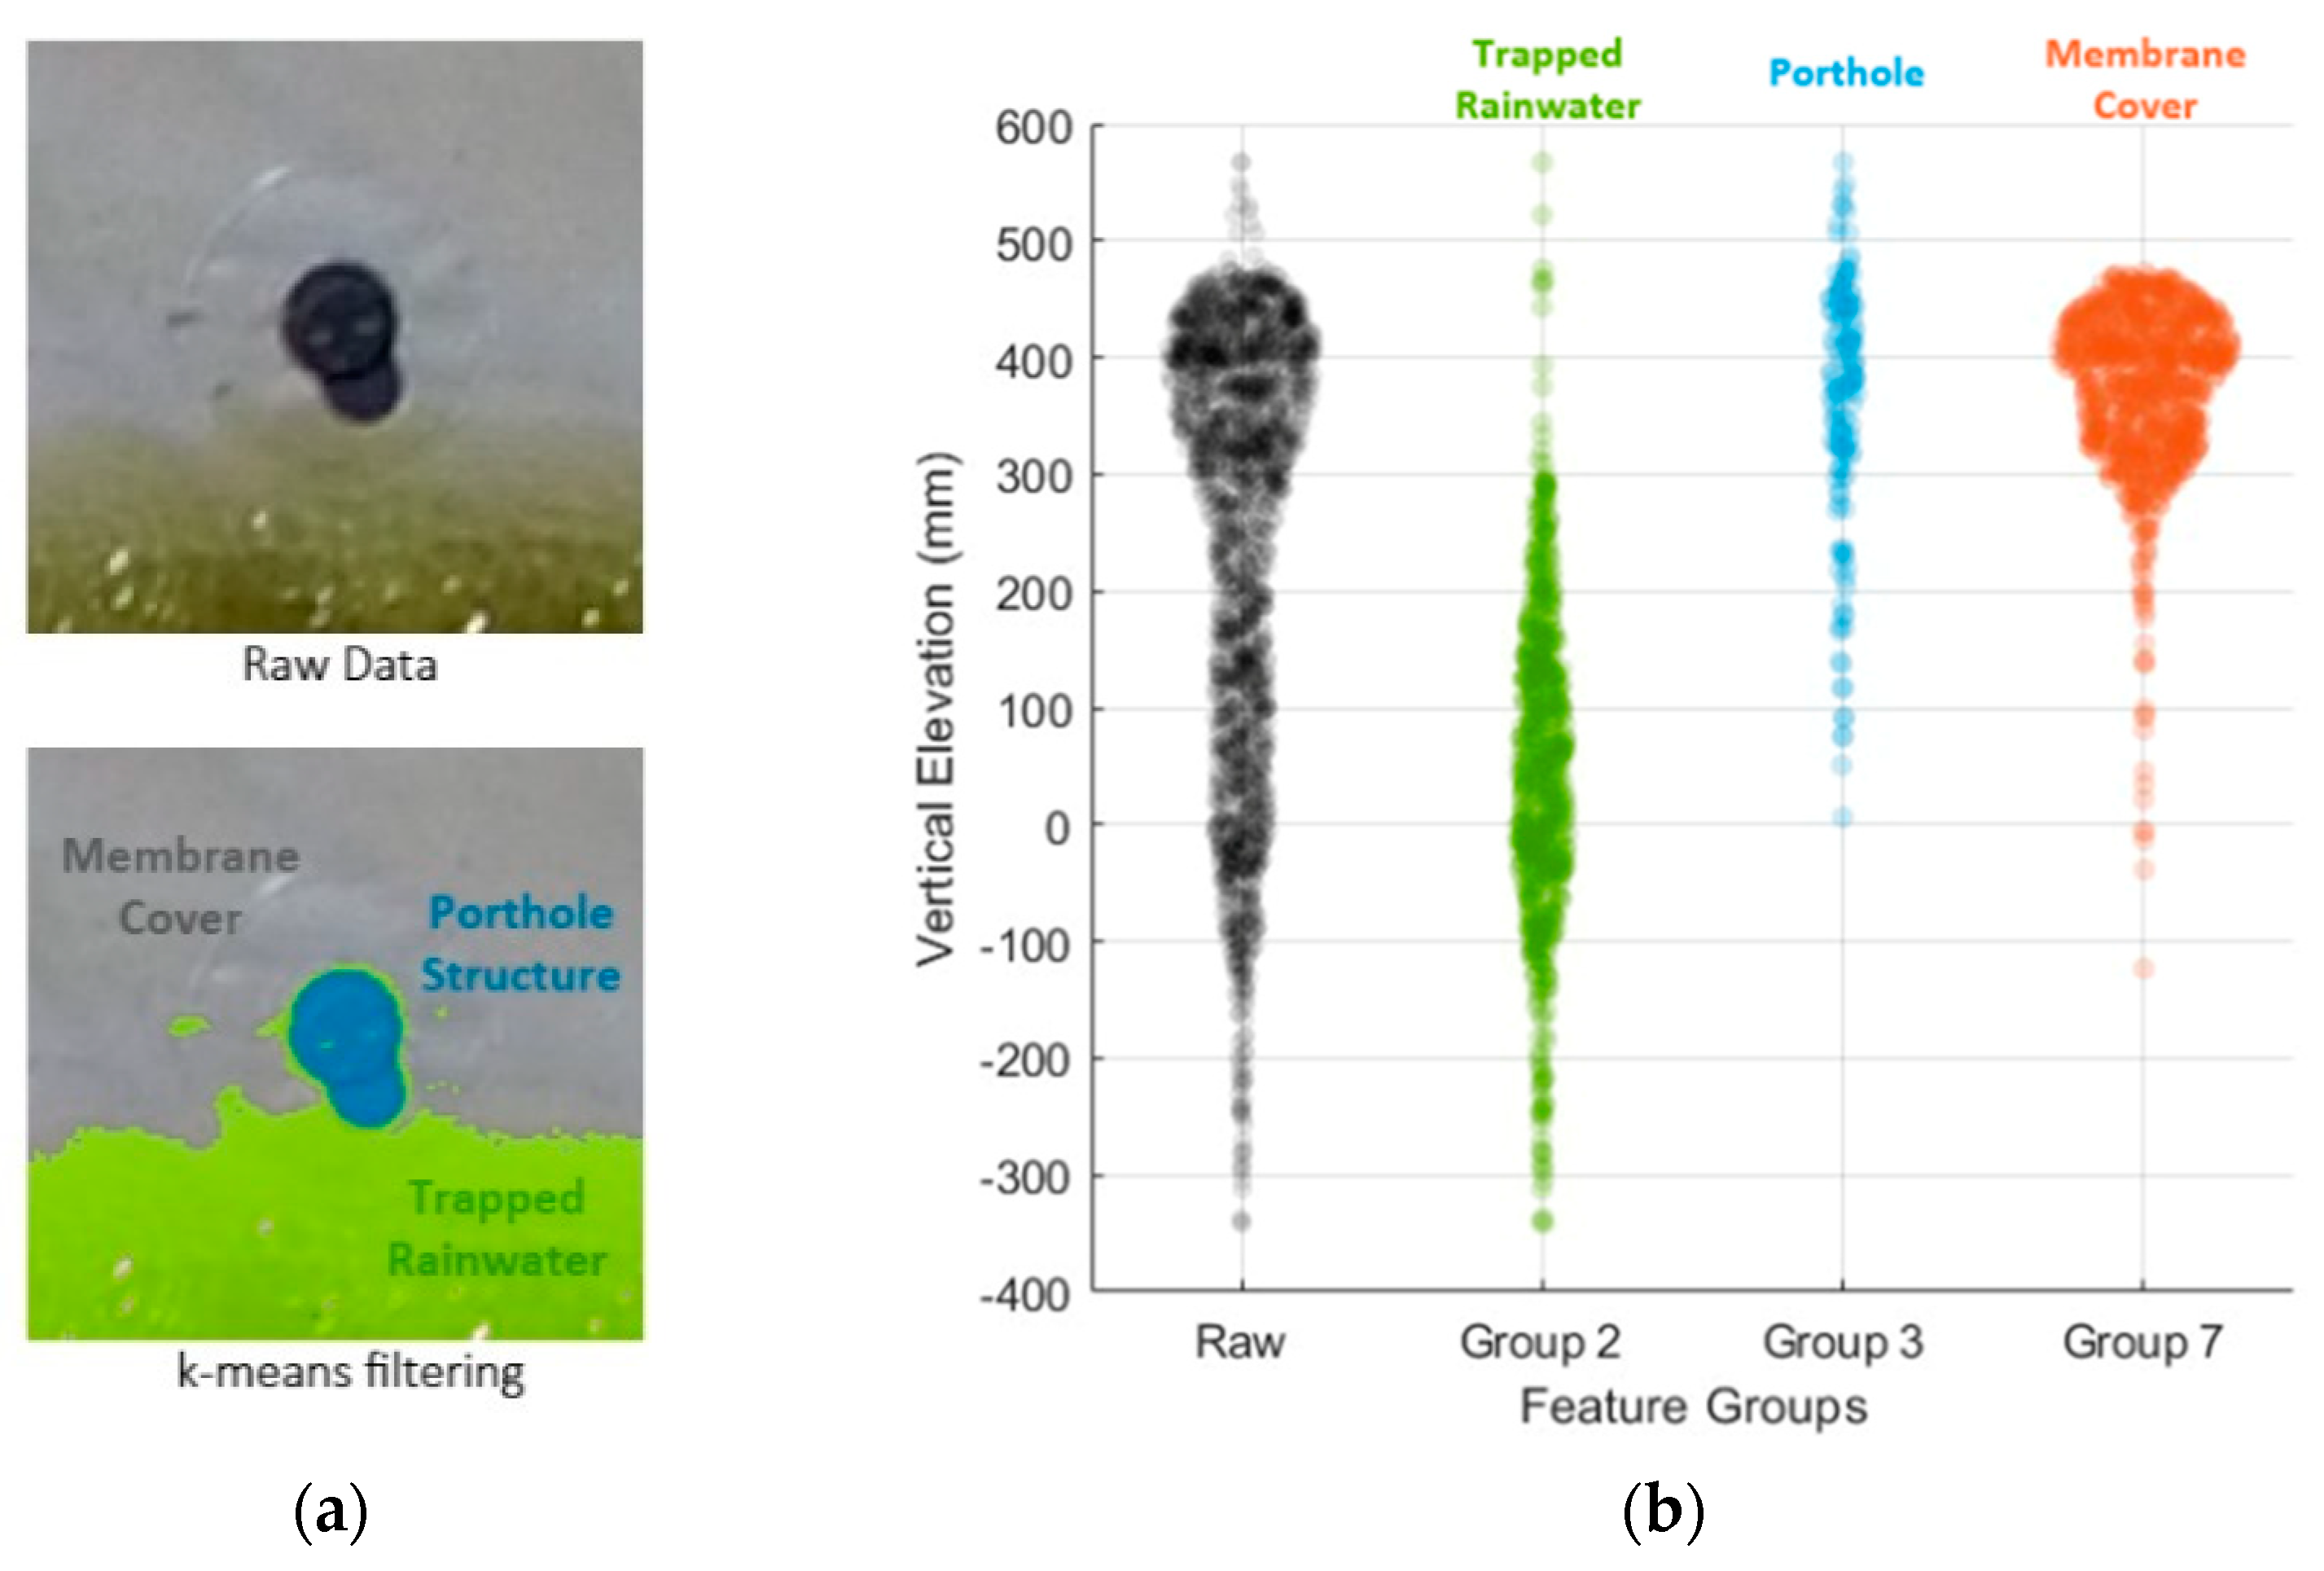
Within the localised region, the k-means clustering algorithm identified three distinct clusters: Groups 2, 7 and 3, as illustrated in Figure 7. Upon visual inspection, Group 2 predominantly represents the trapped rainwater body on the floating cover, while Group 7 corresponds to the floating membrane cover. Group 3 encompasses the porthole structure and its shadow. As indicated in Table 2, Group 2 exhibits a large standard deviation of 137.8 mm with a mean value of 46.4 mm, indicating significant variation in elevations and noise within this group. Although Group 3 exhibited mean and median values similar to Group 7, its relatively larger standard deviation was mainly due to the presence of the porthole structure’s shadow. It was evident that the features in Groups 2 and 3 consisted of relatively larger noise and did not represent the membrane cover. As a result, through the k-means filtering method, these features were subsequently filtered (refer to Section 2.3.3), and, hence, only Group 7 was retained.
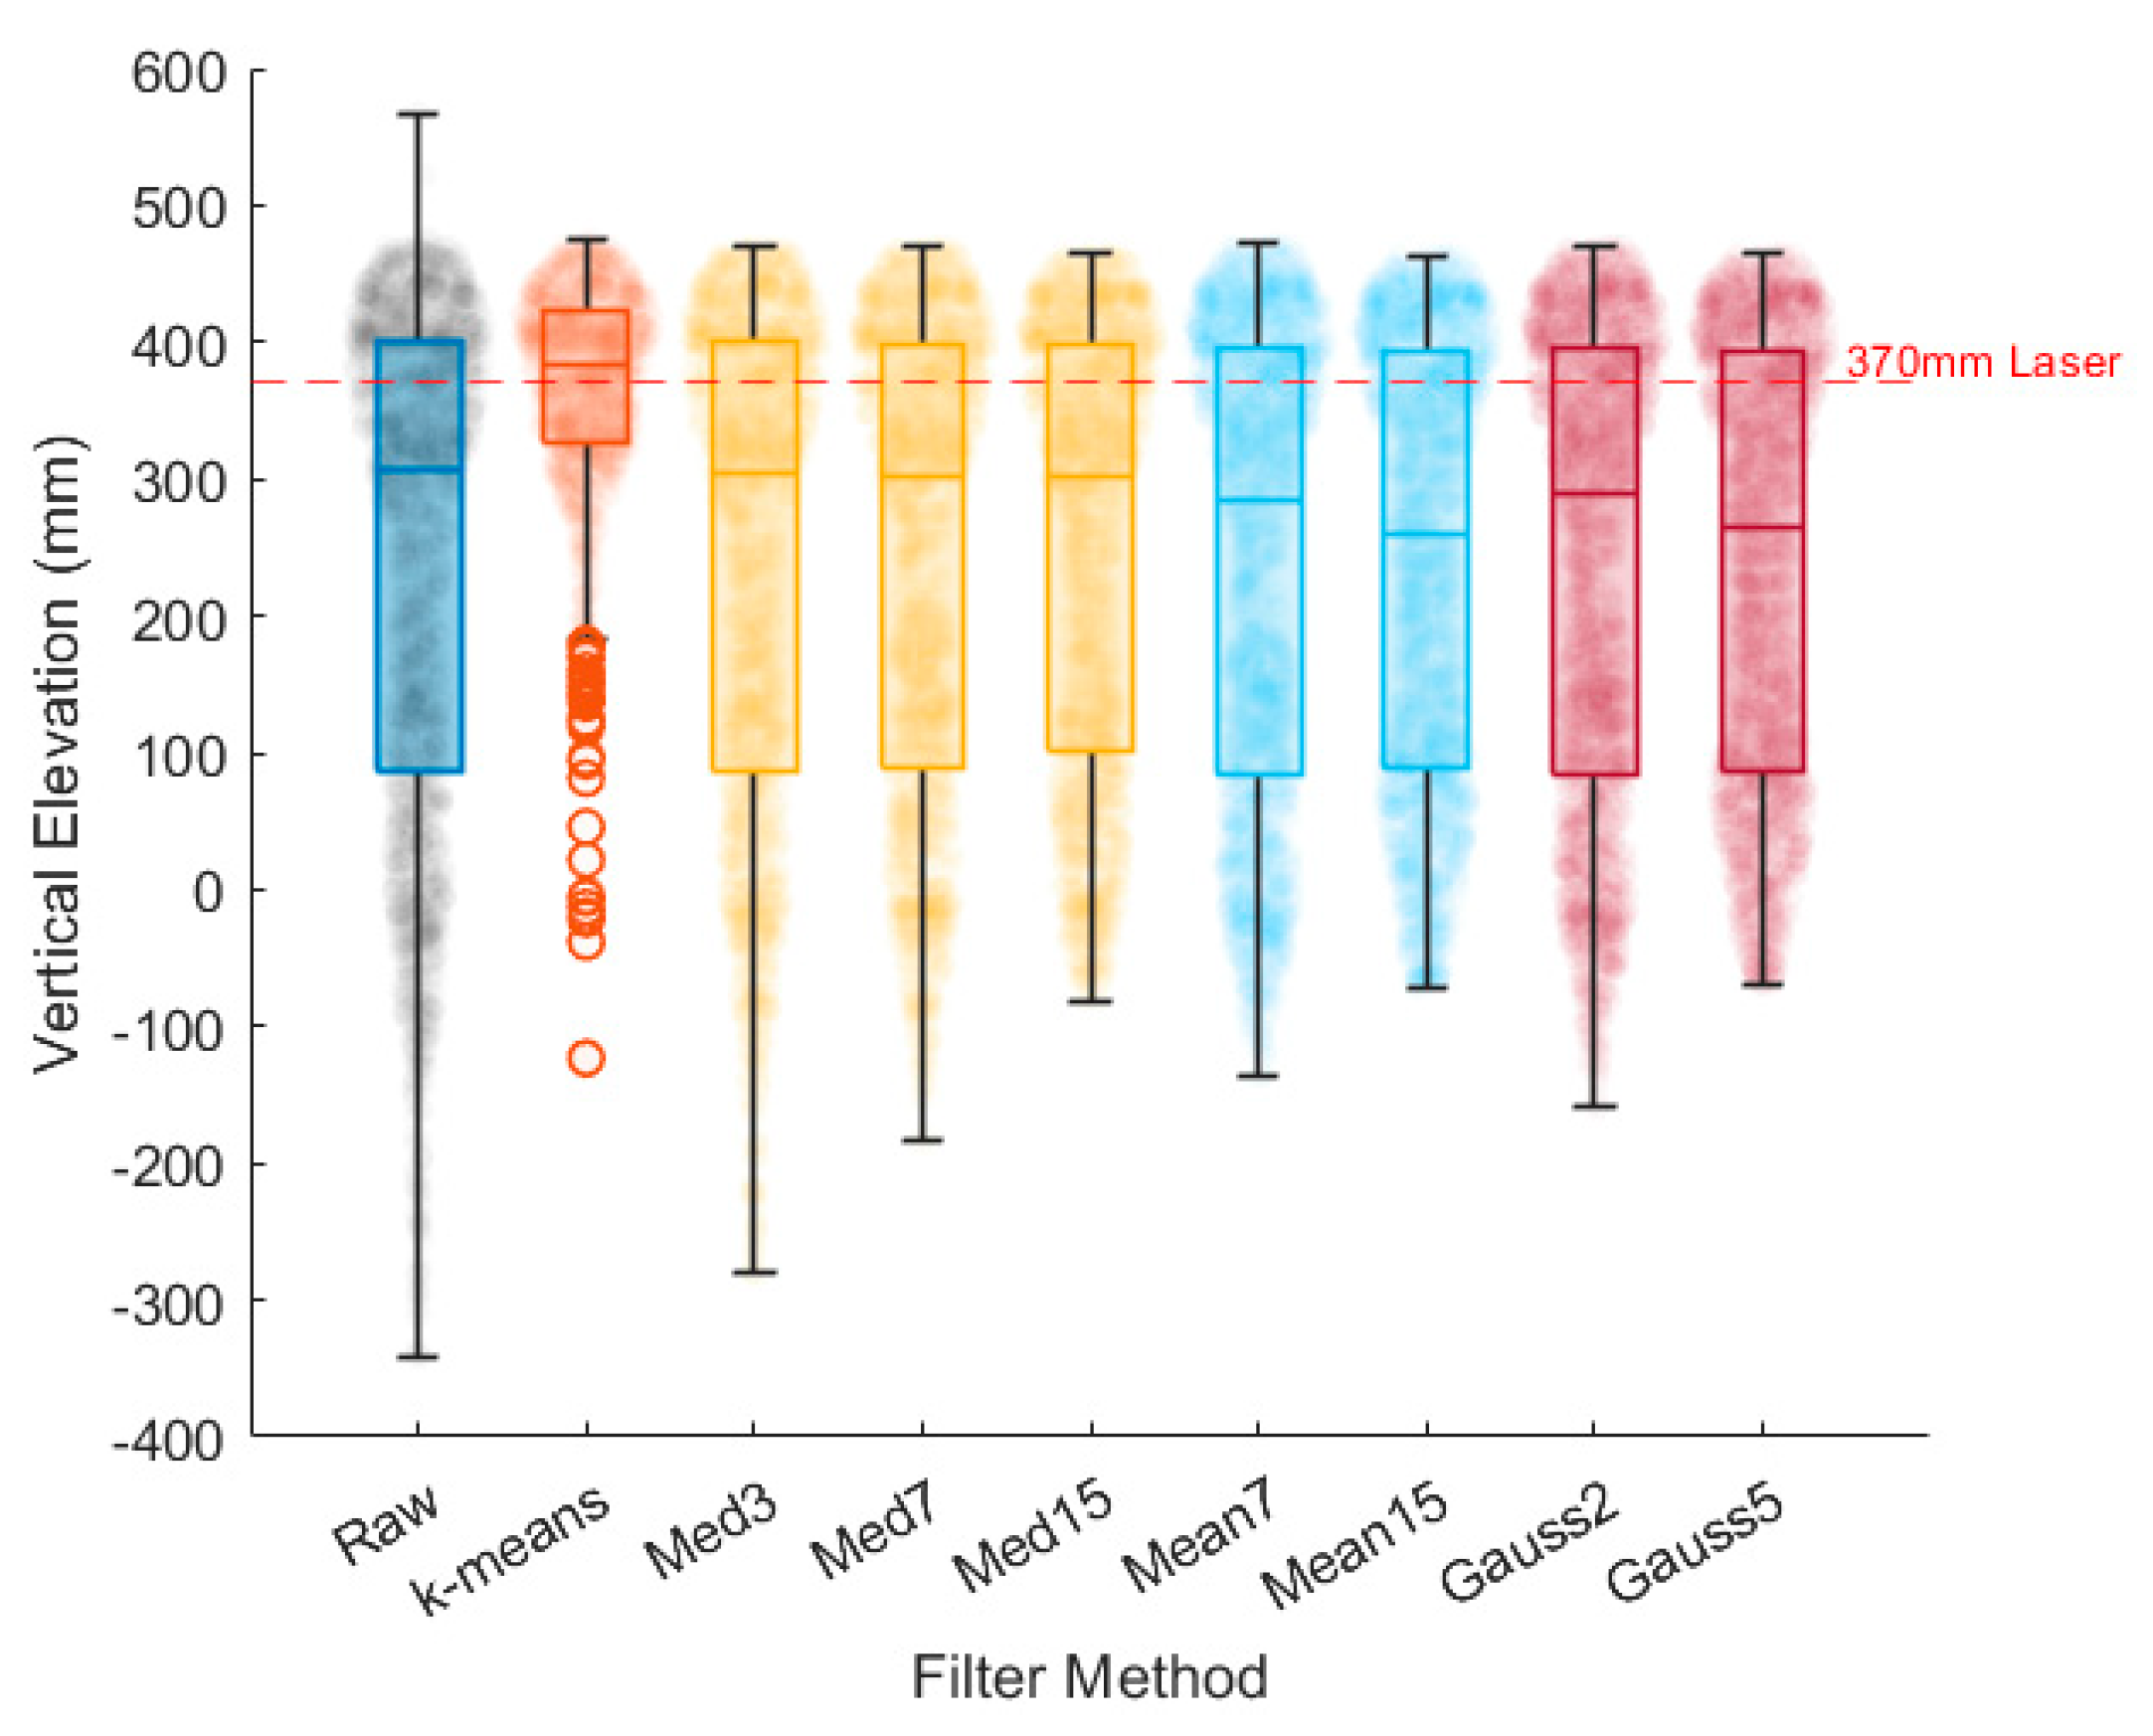
The comparisons of the different filtering methods on the elevation distributions of the localised region are shown in Figure 8. Referring to Table 3, the median filters resulted insignificant changes in their median values (with a maximum difference of 1.3%) compared to the median value of the raw data. In contrast, both mean and Gaussian filters exhibited reductions in the median values (ranging from 5.6% to 15.2%). This decrease is attributed to their smoothing nature, which tends to blur or not preserve edges and finer details, particularly at larger window sizes. While it is evident that all methods can remove impulse-like noises, classical methods do not specifically filter out unwanted natural and man-made features, as their function is to smooth the entire surface elevation of the image.
Significant differences in statistical measurements were observed when the k-means filtering method was applied compared to the raw data and classical filtering methods. Specifically, there was a 54.2% increase in mean and a 24.5% increase in median relative to those of the raw data, whereas the classical filtering methods showed a relative decrease in mean of up to 5.0% and a relative decrease in median value of up to 15.2% relative to those of the raw data. Furthermore, the standard deviation of the k-means filtered elevations exhibited a significant reduction of 57.2% relative to those of the raw data, while classical filtering methods showed relative reductions in standard deviation ranging from 2.2% to 14.1% relative to those of the raw data. Notably, the majority of the elevations obtained through the k-means filtering method demonstrated a close correspondence with the laser survey measurement of 370 mm, particularly in mean and median values, with relative percentage errors of 1.0% and 3.8%, respectively.

3.2. Correlation between Scum Hardness and Floating Cover Elevation

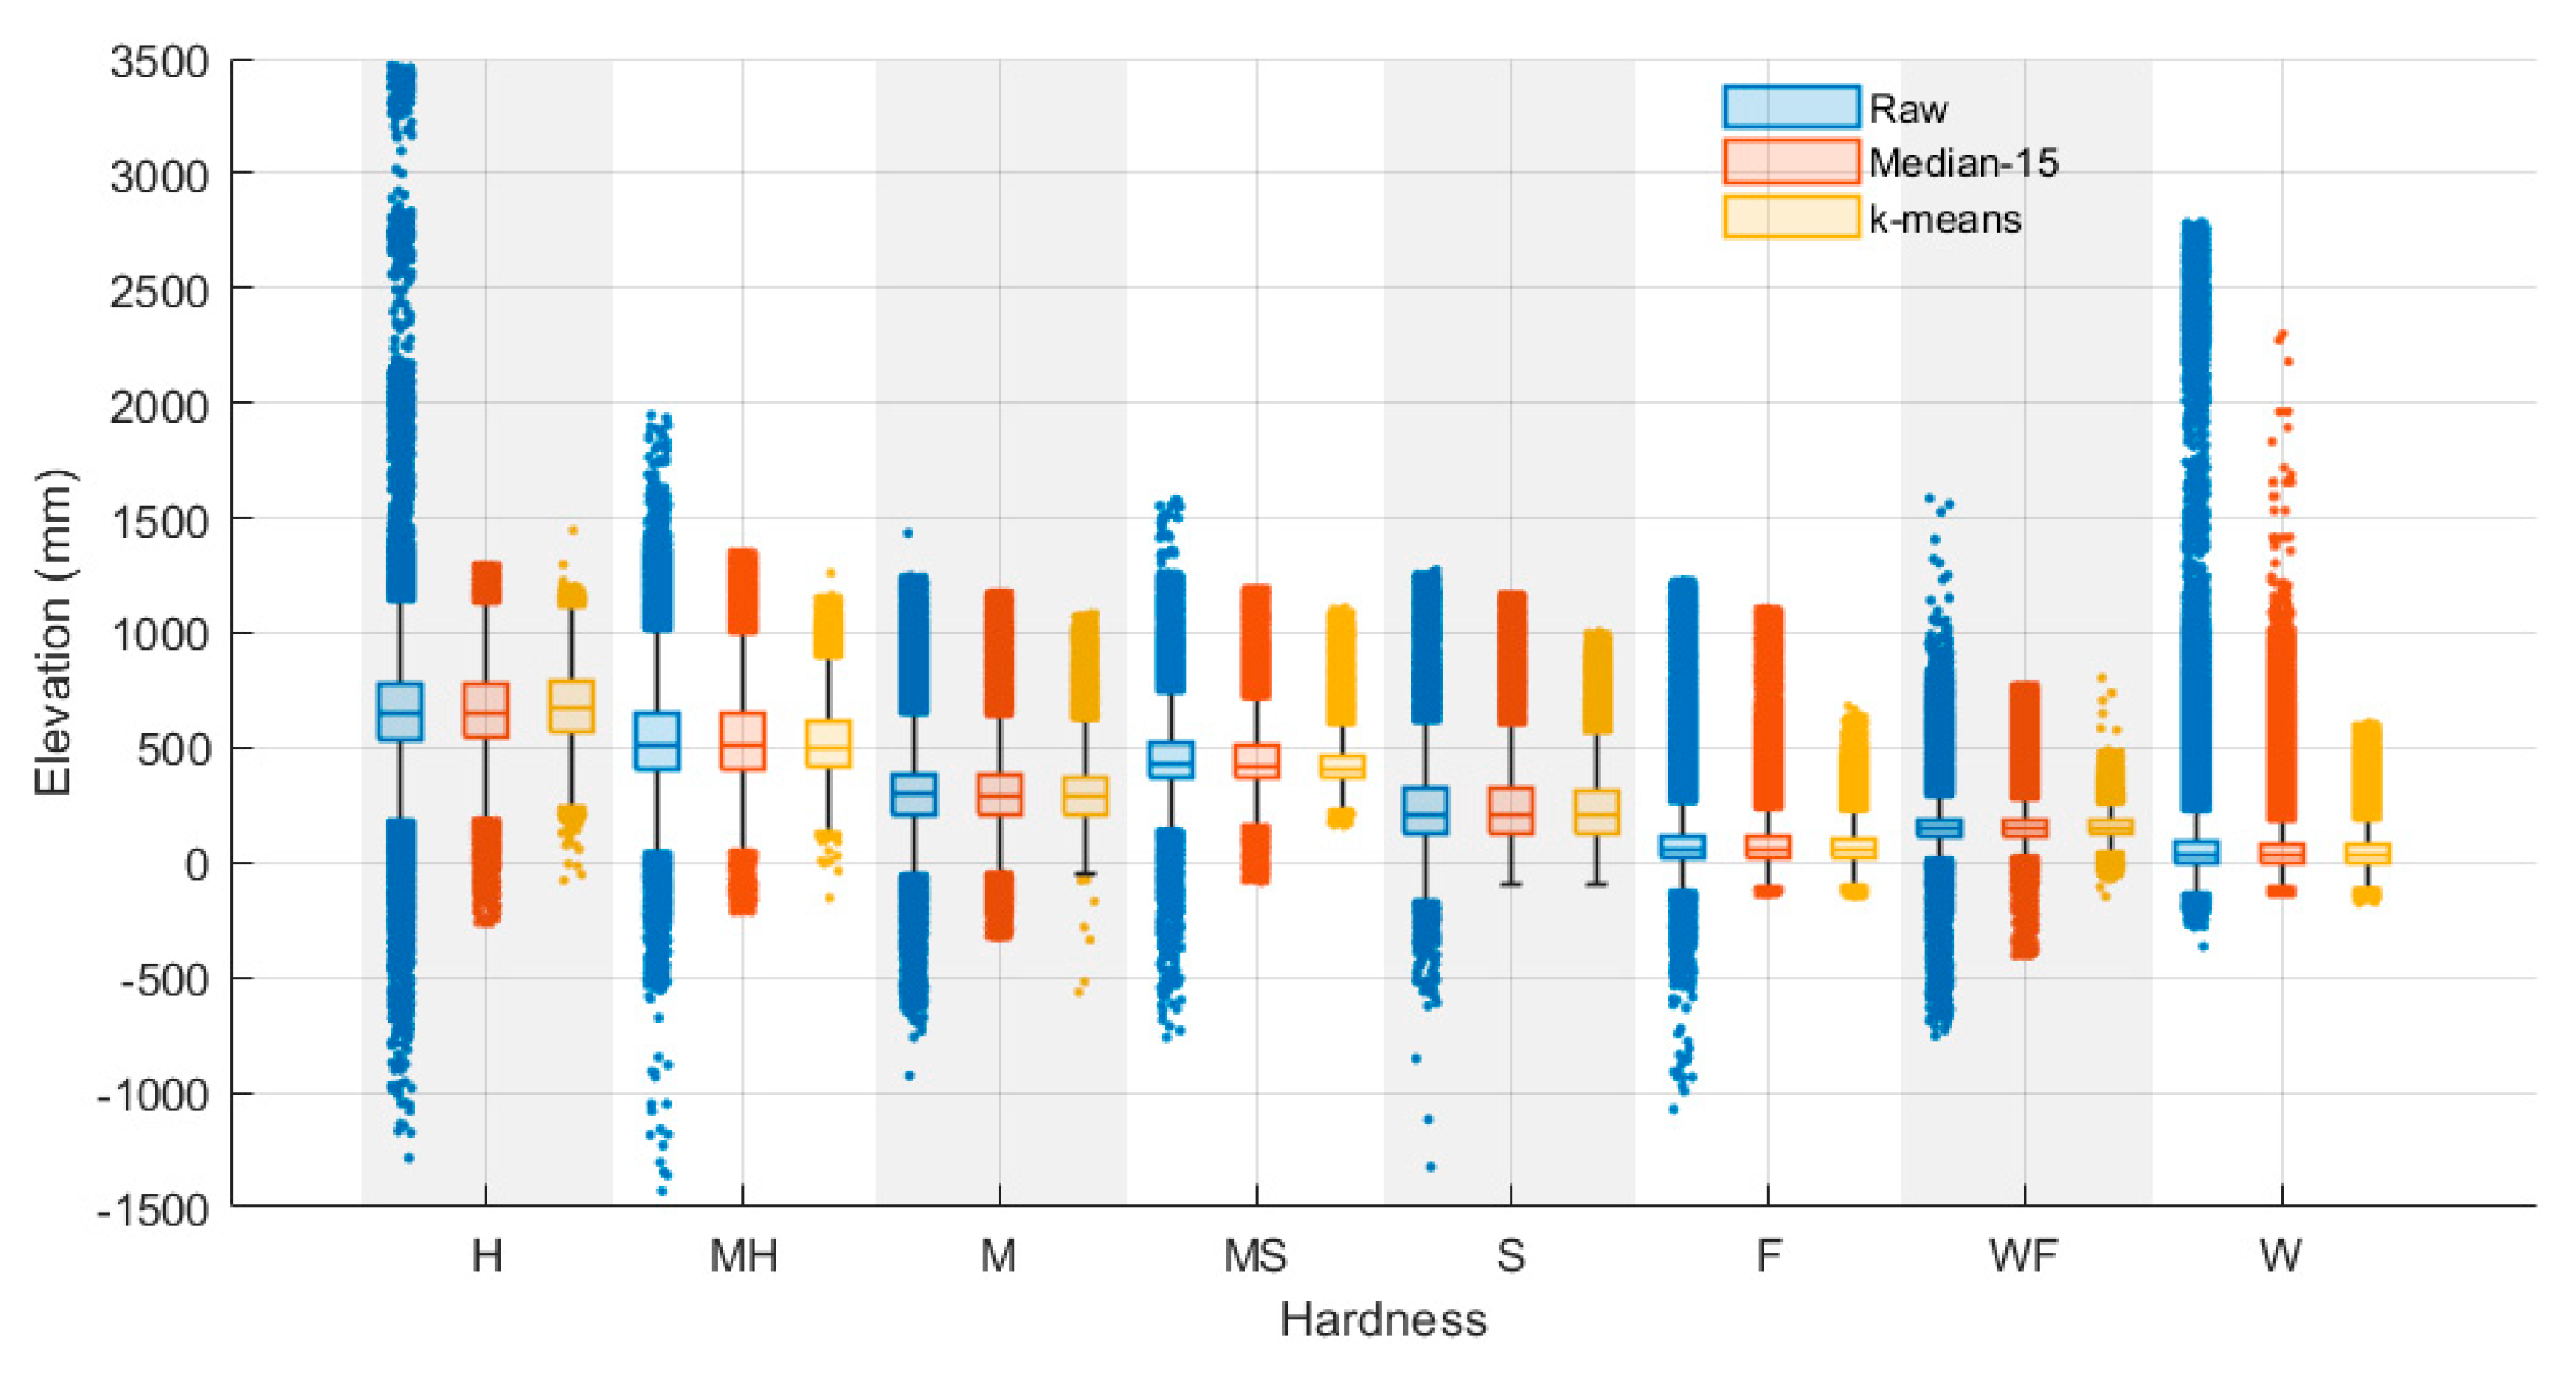
In this section, the correlations between scum hardness and floating elevation, considering both raw and filtered elevation data, are presented. The elevation distributions for each scum hardness level before and after applying median and k-means filtering methods are shown in Figure 9. As indicated in Table 4, the k-means filtering method resulted in an average reduction of 32.9% in the filtered data for each scum hardness, while the median filter showed a negligible reduction of less than 1.7% due to the presence of null (NaN) data due to the filtering process. There were no significant differences, with a maximum difference of 2%, in the relative proportion of data in scum hardness levels between the filtered data and the raw data. This suggests that the removal of artefacts through the filter methods did not significantly impact the proportion of each scum hardness relative to the raw data. Therefore, it is considered appropriate to compare the scum hardness distributions between the filtered data and the raw data since the relative proportions remain relatively consistent.
There were 3% to 8% differences in the mean values of soft to hard scum hardness levels between the k-means filtered data and the raw data, as indicated in Table 4. However, fluffy and water scum hardness levels exhibited larger mean differences, at 24.1% and 39.4% relative to the raw data, respectively. In comparison to the median filter, the majority of the mean differences were less than 0.6%, except for fluffy and water scum hardness levels, which showed 4.4% and 17.7% mean differences relative to the raw data, respectively.
The k-means filtered data showed a significant average reduction of 59.4% in the proportion of outliers compared to the outliers of raw data. Particularly, the hard and medium scum hardness levels exhibited substantial reductions of 80.2% and 85.4% in the proportion of outliers relative to those of raw data, respectively. This reduction was attributed to the removal of large water bodies, which were predominantly present in these regions. In contrast, when considering the median filtered data, the most substantial reductions in the proportion of outliers were observed in the hard, medium, and fluffy scum hardness, with reductions of 37.4%, 14.9%, and 7.0%, respectively, relative to those of raw data. Conversely, the remaining scum hardness levels exhibited relative reductions of less than 3.5%. The k-means filtered data also showed an average reduction of 36.3% in standard deviation relative to the standard deviation of raw data, with significant relative standard deviation reductions of 62.5% and 46.7% observed in the water–fluffy and fluffy scum hardness levels, respectively. These reductions were attributed to the removal of ballast, the water surrounding the ballast, and debris/dirt, which were prevalent in these regions. For the median filter, the majority of scum hardness levels showed outlier reductions of less than 7.4% relative to those of raw data, except for the water scum hardness, which exhibited a significant relative outlier reduction of 19.7%. Similar to the previous findings, it was observed that the median filter is efficient in removing impulse noises from raw data. However, the k-means filtering method exhibits notable effectiveness in its ability to filter unwanted features, including those that contain significant noises, resulting in reduced variance and fewer outliers in elevation distributions.
Furthermore, Spearman’s correlation analysis revealed strong and highly significant correlation coefficients between scum hardness and elevation for the raw data, median filtered data, and k-means filtered data, with values of 0.719, 0.746, and 0.813, respectively. These coefficients indicated a monotonic relationship between scum hardness and elevation. Notably, the coefficient of correlation strength was lower in the raw data due to the presence of noise and artefacts. However, the k-means filtered data showed a significant improvement of 13.1% in correlation strength compared to a 3.6% improvement with the median filtered data.

4. Discussion

The preceding findings underscore the capability of this method to attain a more precise assessment of scum hardness and the elevation of the floating cover. The research objective was to employ inspection parameters, such as DEMs and orthomosaics, to make informed decisions that ensure the cover maintains its structural integrity. The findings reveal clear associations between scum hardness and elevation, and support the advantages of effectively filtering unwanted features. Both filters demonstrated their capacity to mitigate irrelevant data points, thereby improving data quality for uncovering the association with scum hardness. This is demonstrated by the significant increase in correlation strength achieved through the use of the k-means filtering method to remove artefacts, which constitute approximately 16% of the total asset. Particularly in studies where unwanted natural features can have a significant influence on the results, the k-means filtering method offers a convenient way to identify these features for removal. The analysis suggests that the consistency of scums influences the height of the floating cover, which may have implications for the asset’s structural integrity. This highlights the necessity for the further understanding and management of scum to maintain the asset effectively.
The preceding findings highlight the advantages of the k-means filtering method, which utilises machine learning techniques to efficiently group features based on their parameter similarity without relying on pre-existing knowledge of the data. This capability facilitates the rapid identification of clusters associated with the features of interest through visual inspection. It eliminates the need for conventional methods that require defining functions or dependencies, especially those related to spatial characteristics, as commonly seen in most smoothing filters. In this particular study, a substantial proportion of the image is dedicated to the elevation of the floating cover, with only small portions of the image occupied by the unwanted features. This allows a simple thresholding approach to remove clusters with lower proportions of the image. Furthermore, the effectiveness of the k-means filtering method in reducing noise and artefacts was exemplified by the significant reduction in outliers and standard deviation compared to classical filtering methods. In particular, water features have been observed to be the primary artefacts where impulse-like noises are concentrated. It should be noted that the classical methods take into account the entire elevations, including those of the water surface. This does not accurately represent cover, and, therefore, the removal of water features is deemed crucial in this study.
The present work only included the image processing step of transforming the DEM and orthomosaic to a global reference point. Further applications of morphology and digital image processing techniques, such as contrast correction adjustment, can enhance the quality of the image before performing k-means filtering. Nonetheless, the k-means filtering method has demonstrated its robustness in effectively identifying distinct groups associated with the membrane covers with different luminance characteristics (Groups 6 and 7), as well as unrelated image backgrounds (Group 5), without the need for extensive preprocessing procedures. Group 5 was immediately excluded from the analysis due to the primary objective of demonstrating the filtering of features specific to the asset. In the case of extending the filtering process to the entire image, this approach would consequently identify Group 5 as an undesirable feature as well.
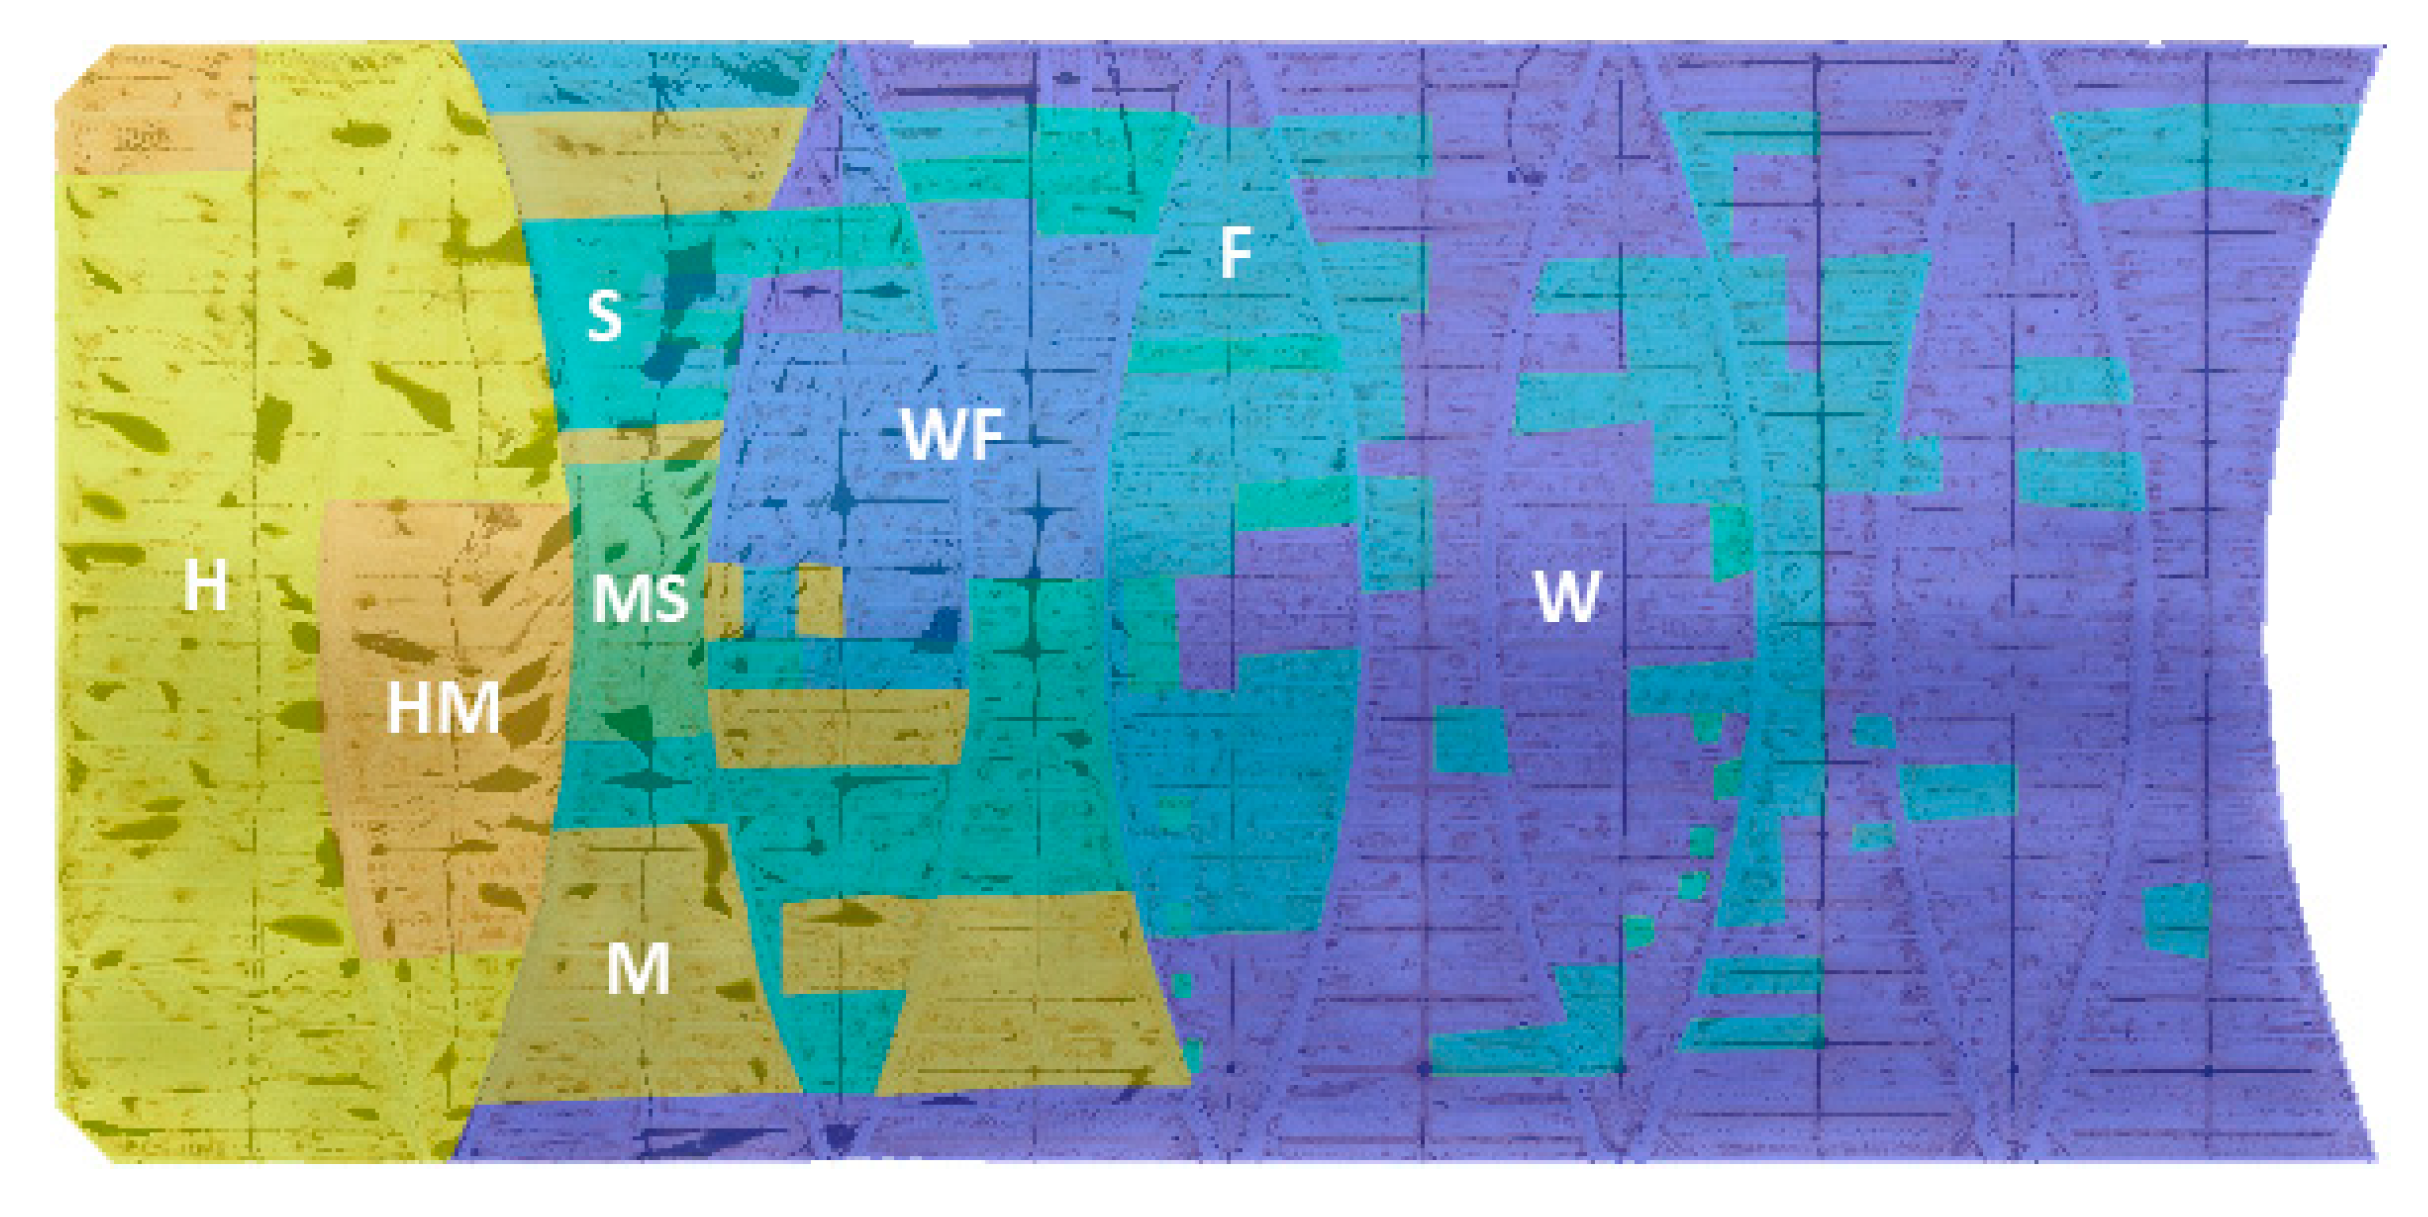
It is important to acknowledge that errors may arise from variations in the scum hardness survey, considering the time lapse of approximately a year between the survey and DEM data. However, given the gradual increase in scum hardness over a long period of time, it is reasonable to assume that the data are sufficiently reliable for the purpose of this study. Additionally, there were substantial differences in sample sizes among the scum hardness levels, with water scum hardness comprising more than 37% of the image data, while medium-soft scum hardness accounts for less than 1.5%, as seen in Table 4 and Figure 2. The considerably smaller sample size of medium-soft scum hardness may result in underrepresentation and potentially unreliable estimates of statistical measurements. Nevertheless, the inclusion of simultaneous surveys with the DEMs would be beneficial in mitigating errors arising from temporal variation and providing additional data samples to strengthen the validity of the results obtained from the analysis.
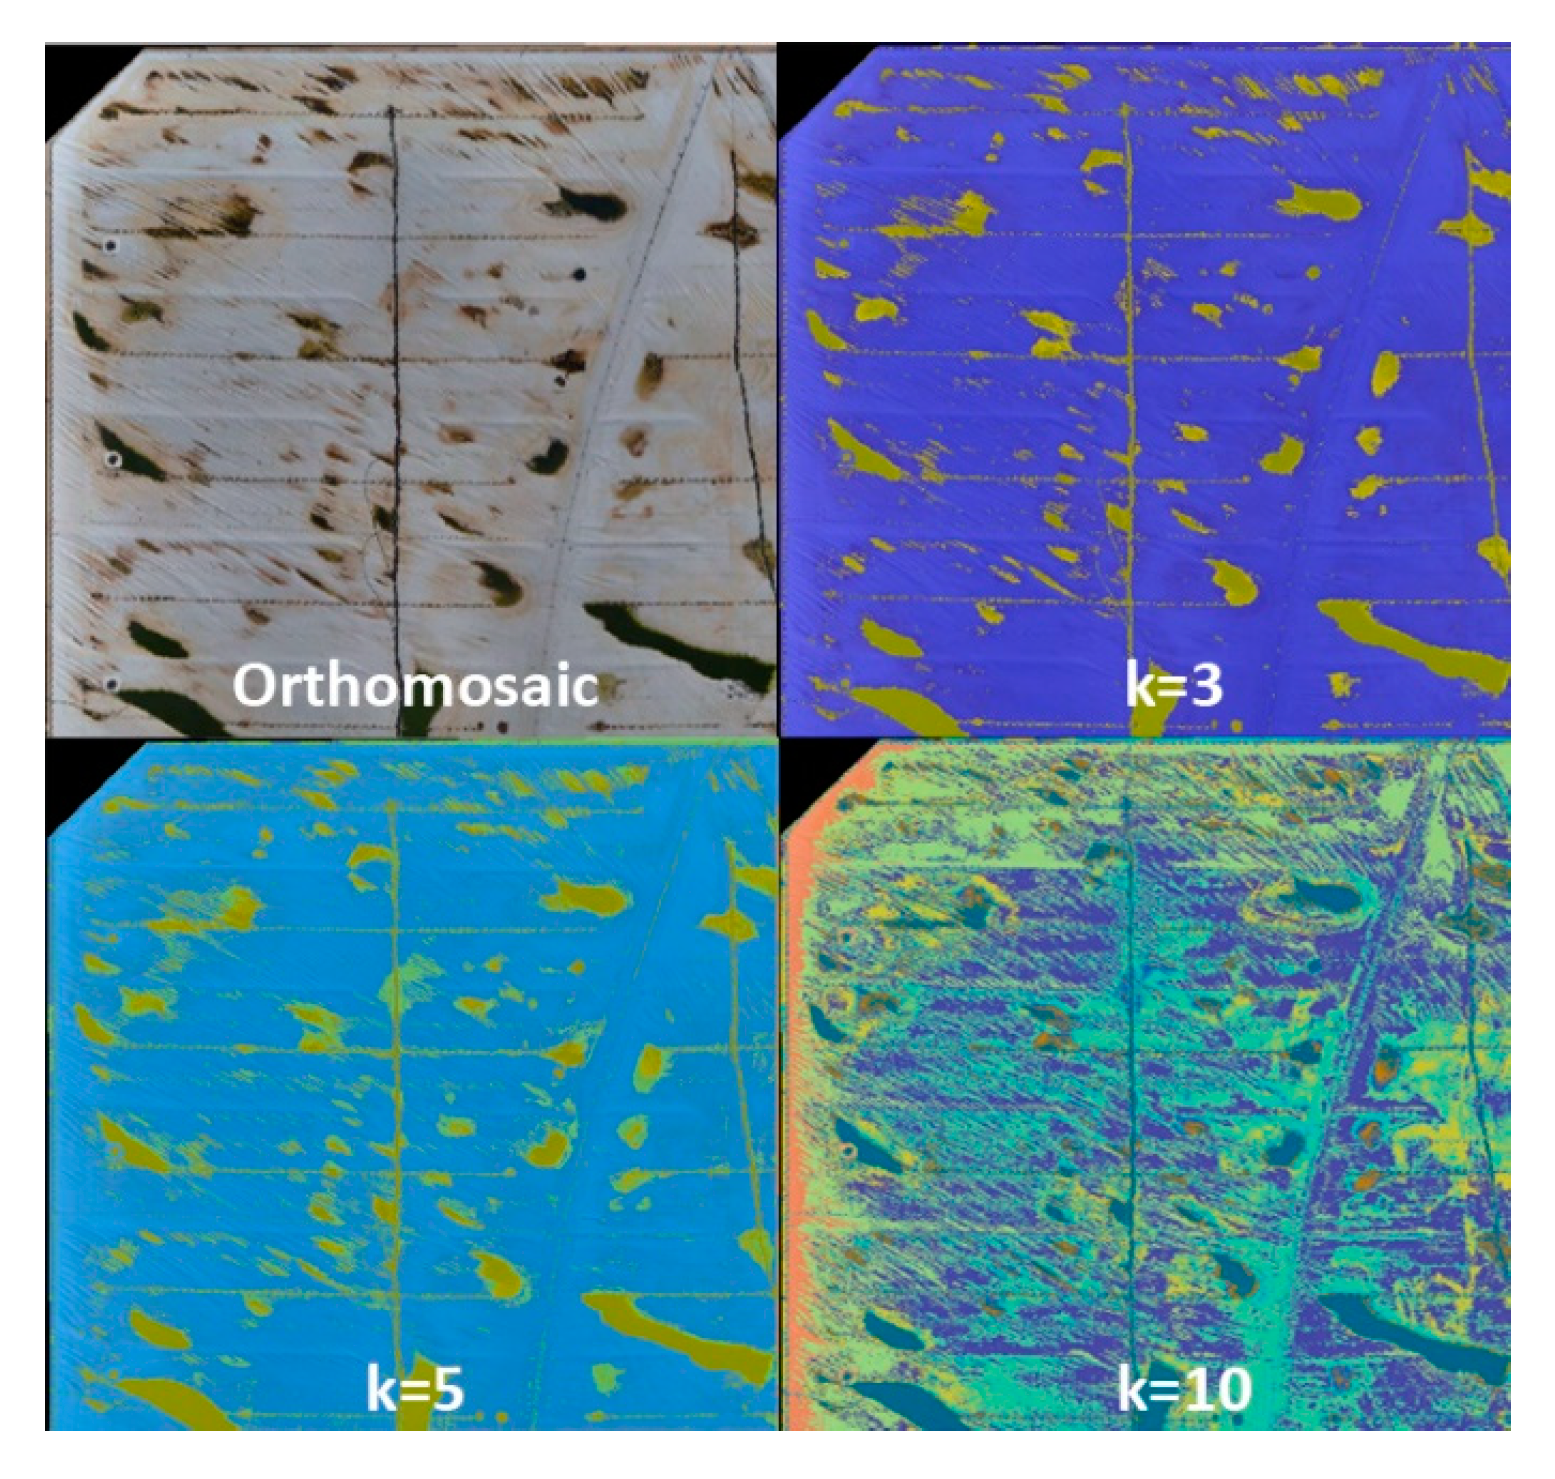
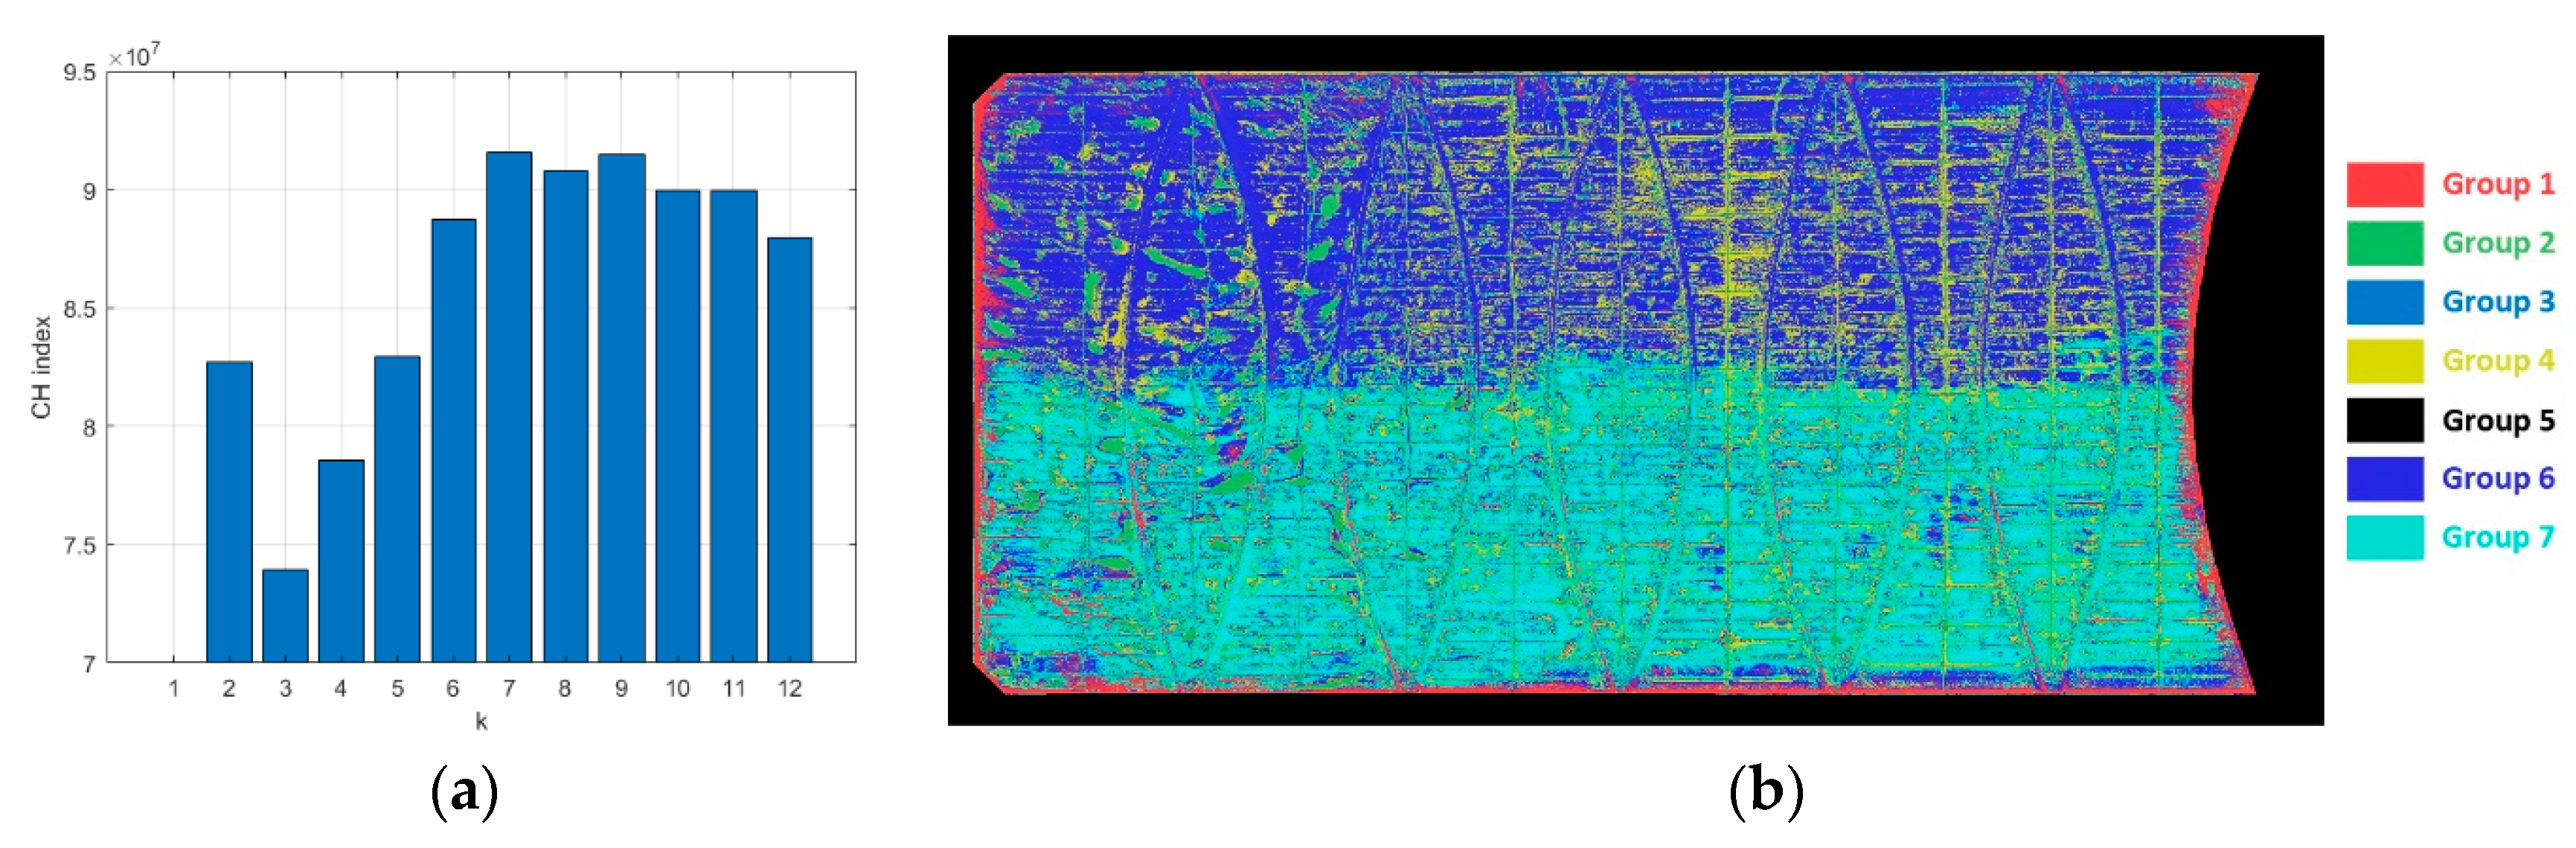
The filtering process relies on the clustering capability of k-means to effectively group the features of interest. In this study, we employed the CH criterion for clustering validation to quantitatively assess the quality of the clustering results. The advantage of the CH criterion lies in its capability to account for both the separation between clusters and the cohesion within the clusters, thereby providing an overall assessment of clustering quality, where a higher CH index indicates a more well-defined and compact clustering outcome. As the CH criterion considers variance ratios, it is more robust in scenarios where clusters exhibit complex geometry compared to other alternatives such as the elbow method and silhouette plot. Upon applying this criterion, the k o p t = 7 clusters exhibited visually identifiable features, making them suitable for filtering purposes. In contrast, clusters with a lower CH index, falling below k o p t , did not capture less prevalent and complex features (e.g., dirt), while those exceeding k o p t yielded less meaningful groups that were challenging to interpret, as illustrated in Figure 3. Therefore, a non-optimal number of clusters (lower CH index) would render the k-means filtering method less robust and practical, as the key advantages of this method lie in its ability to cluster interpretable features for filtering. Further evaluation to analyse the quality of the clusters individually and globally can also be carried out through the integration of multiple cluster validation methods; however, this is beyond the scope of this work.
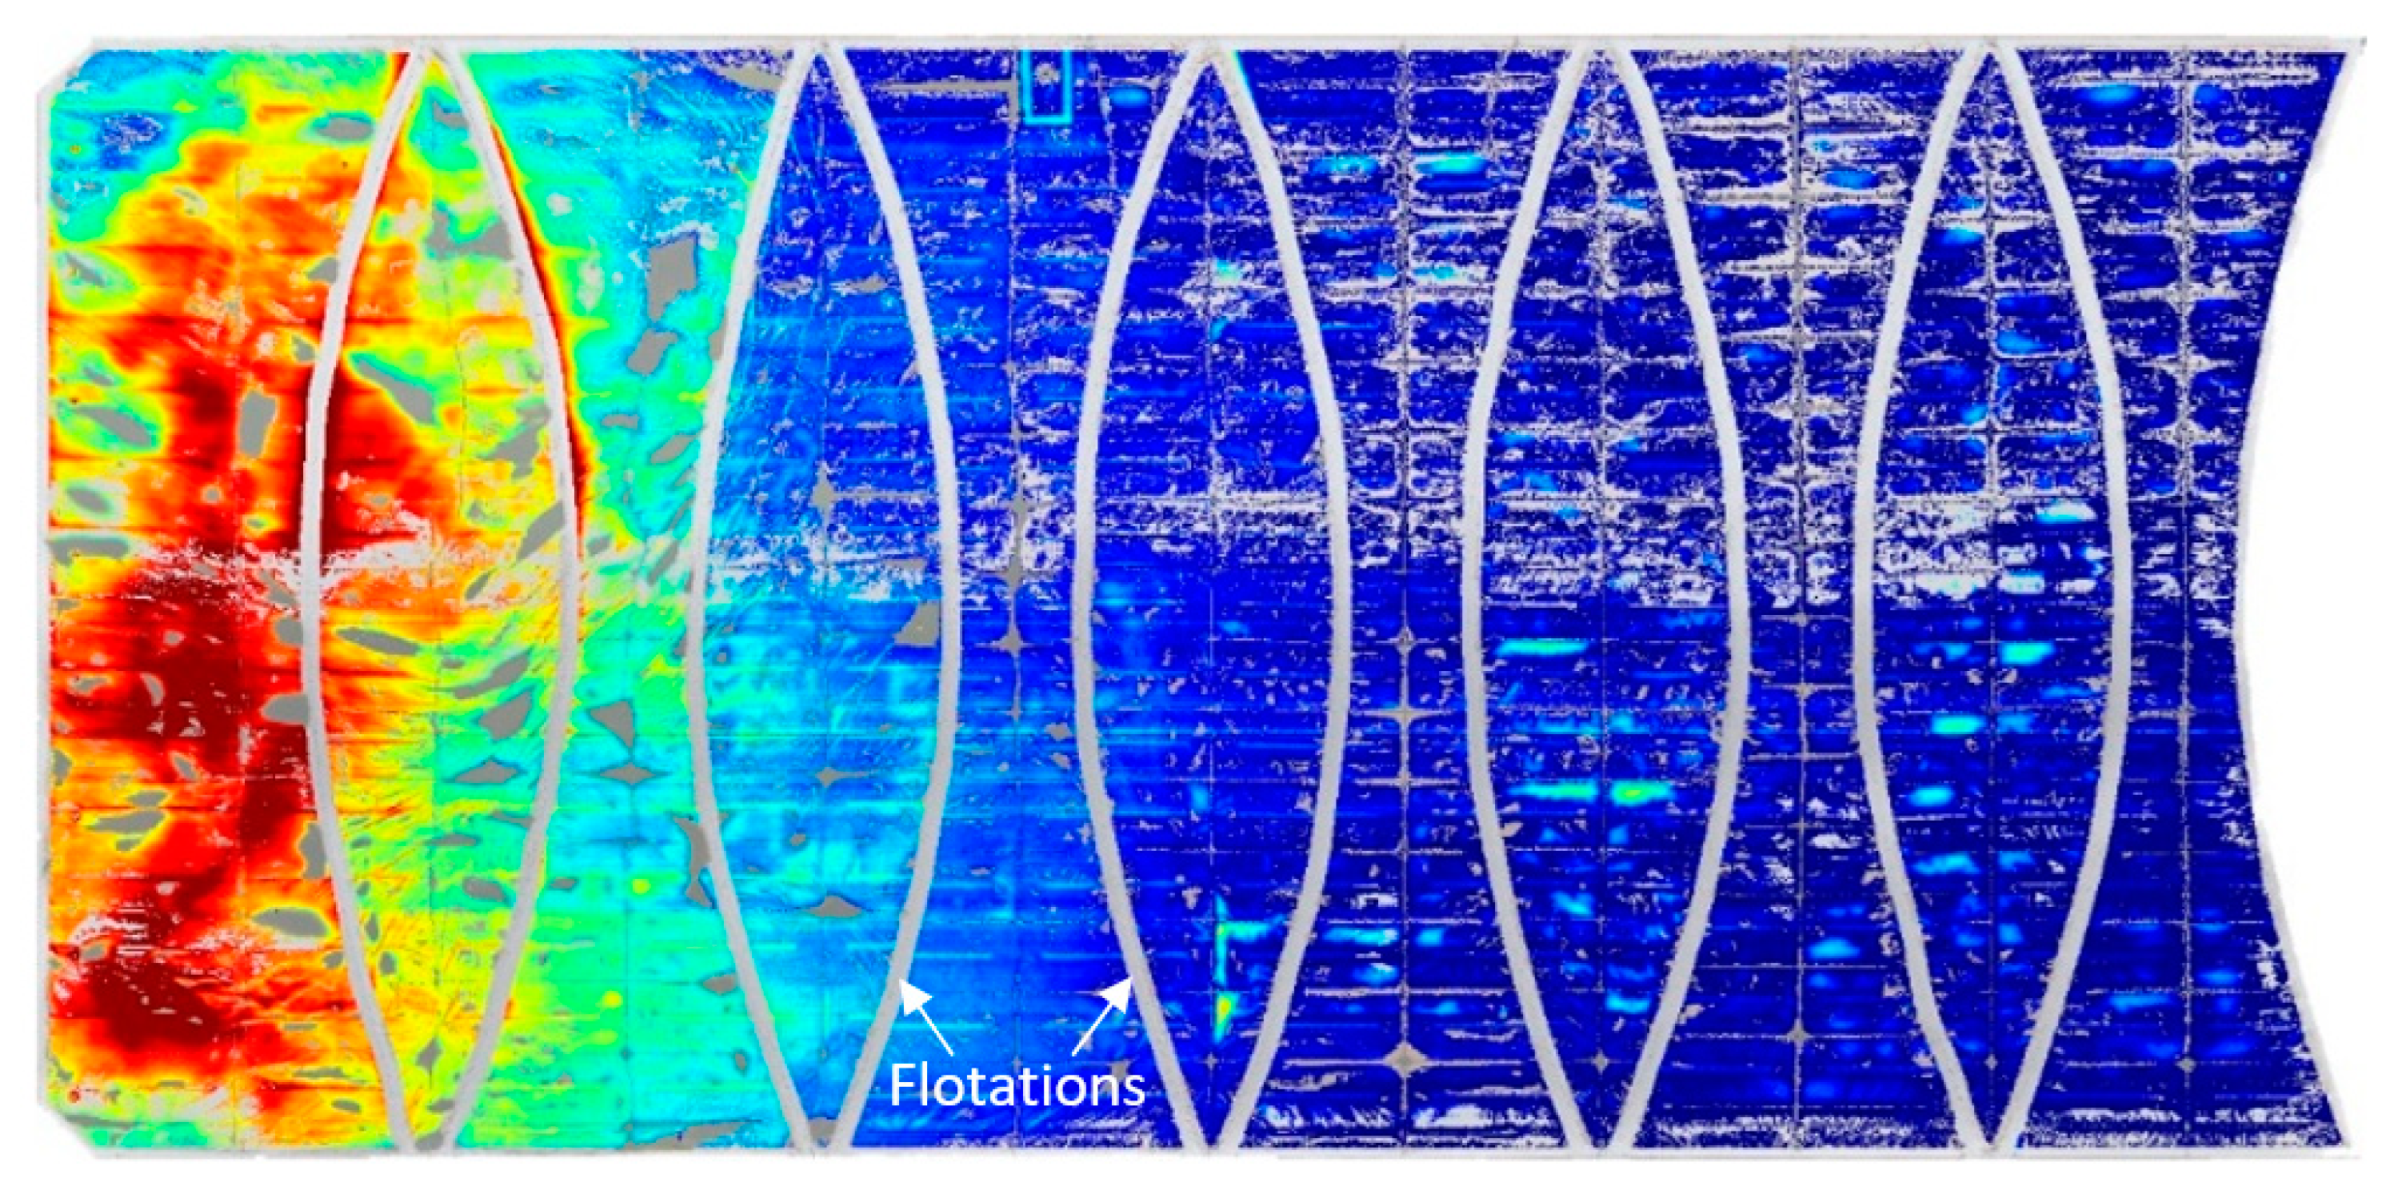
Furthermore, certain features (e.g., flotation) were not distinctly separated into groups. This is attributed to overlapping patterns among data points related to the feature, which makes achieving distinct separation difficult. To address this limitation and enhance the filtering process, the integration of supplementary information, such as thermal imagery, can provide valuable insights, enabling the better distinction and grouping of desired features that may not be apparent from elevation and colour variables alone. While clustering was effective for the prevalent feature of interest in this study, further consideration is needed for less prevalent and more intricate features.
This comparative analysis, as well as the proposed k-means filtering method, are designed for the specific application of anaerobic lagoon covers, and may not be universally applicable. While the capabilities of the proposed method have been demonstrated, determining its suitability for other applications may require further investigation, modification, and refinement. Furthermore, it should be noted that the k-means and the conventional methods are not mutually exclusive, and they operate on different principles and applications. Hence, a direct comparison of their capabilities to filter noise and unwanted artifacts is rather difficult. Nevertheless, for this specific study application, the intention is to showcase a machine learning approach and its additional capabilities as opposed to the currently existing methods in practice.
Another aspect of this research involves employing data-driven learning algorithms to predict biogas performance using historical operational data from the WTP [5,6]. Furthermore, incorporating filtered DEMs and orthomosaics are highly beneficial in enhancing these machine learning models. The outcomes of this work also lay the groundwork for future machine learning endeavours, enabling models to incorporate the spatial characteristics of the asset and effectively account for elevation variations.
In future work, efforts will be directed towards enhancing the data quality and incorporating additional information to further improve the filtering process. Moreover, the focus will be on developing a deep learning model for asset performance and monitoring, leveraging the advancements in machine learning techniques.

5. Conclusions

In this study, an unsupervised machine learning method was demonstrated to effectively identify features from DEM and orthomosaic images of anaerobic lagoon floating covers, allowing the subsequent filtering of unwanted artefacts unrelated to the elevation of the floating cover. The k-means filtering method was proposed with the purpose of enabling the visual identification and removal of unwanted features, facilitating subsequent analysis of the scum hardness association. The proposed method was compared to existing filtering methods applied to DEMs of anaerobic lagoons in the industry. First, the k-means clustering algorithm was applied, utilising the elevation of the DEM and the three colour channels of the orthomosaic image. The findings highlighted significant improvements when employing the k-means filtering method, including a substantial average reduction of 59.4% in the proportion of outliers and a decrease of 36.3% in standard deviation compared to the raw data. These reductions were specifically attributed to the elimination of unwanted natural features and man-made objects such as trapped rainwater, debris, and ballast, which cannot be effectively identified by the classical filtering methods. Furthermore, the coefficient of correlation strength exhibited an approximate 13.1% improvement with the use of k-means filtered data, while a 3.6% improvement was observed with a median filter using a window size of 15. The k-means filtering method is more intuitive, simpler, and more user-friendly alternative compared to employing advanced classical filtering methods that require the pre-definitions of artefacts characteristics and parameters. Additionally, the proposed approach has the capacity to integrate additional data information, making it suitable for industries seeking to leverage new data sources. Future considerations encompass the processing of remote aerial imagery to develop artificial-intelligence-enabled models for autonomously regulating asset performance and ensuring structural integrity, thus transforming the assets at WTP into smart structures.

Author Contributions

Conceptualization, B.S.V., T.K., L.R.F.R. and W.K.C.; methodology, B.S.V. and W.K.C.; software, B.S.V.; validation, B.S.V., T.K., L.R.F.R. and W.K.C.; formal analysis, B.S.V.; investigation, B.S.V.; resources, T.K. and W.K.C.; data curation, B.S.V.; writing—original draft preparation, B.S.V. and W.K.C.; writing—review and editing, B.S.V., T.K., L.R.F.R. and W.K.C.; visualization, B.S.V. and W.K.C.; supervision, L.R.F.R., T.K. and W.K.C.; project administration, T.K. and W.K.C.; funding acquisition, L.R.F.R., T.K. and W.K.C. All authors have read and agreed to the published version of the manuscript.

Funding

This research was funded by Melbourne Water Corporation and Australian Research Council Linkage Project (Grant No. ARC LP210200765).

Data Availability Statement

Data are contained within the article.

Acknowledgments

The financial support provided by the Australian Research Council (Linkage Project) and Melbourne Water Corporation is gratefully acknowledged. The contributions from Melbourne Water are also gratefully acknowledged.

Conflicts of Interest

The authors declare no conflict of interest.

References

  1. Melbourne Water. Western Treatment Plant Virtual Tour. 2020. Available online: https://www.melbournewater.com.au/water-data-and-education/learning-resources/water-and-sewage-treatment-plants/western-treatment-0 (accessed on 30 September 2020).
  2. Wong, L.; Vien, B.S.; Ma, Y.; Kuen, T.; Courtney, F.; Kodikara, J.; Rose, F.; Chiu, W.K. Development of Scum Geometrical Monitoring Beneath Floating Covers Aided by UAV Photogrammetry. Struct. Health Monit. 2021, 18, 71. [Google Scholar]
  3. Wong, L.; Vien, B.S.; Kuen, T.; Bui, D.N.; Kodikara, J.; Chiu, W.K. Non-Contact In-Plane Movement Estimation of Floating Covers Using Finite Element Formulation on Field-Scale DEM. Remote Sens. 2022, 14, 4761. [Google Scholar] [CrossRef]
  4. Wong, L.; Vien, B.S.; Ma, Y.; Kuen, T.; Courtney, F.; Kodikara, J.; Chiu, W.K. Remote Monitoring of Floating Covers Using UAV Photogrammetry. Remote Sens. 2020, 12, 1118. [Google Scholar] [CrossRef]
  5. Vien, B.S.; Wong, L.; Kuen, T.; Rose, L.F.; Chiu, W.K. A Machine Learning Approach for Anaerobic Reactor Performance Prediction Using Long Short-Term Memory Recurrent Neural Network. Struct. Health Monit. 2021, 18, 61. [Google Scholar]
  6. Vien, B.S.; Wong, L.; Kuen, T.; Rose, L.R.F.; Chiu, W.K. Probabilistic prediction of anaerobic reactor performance using Bayesian long short-term memory artificial recurrent Neural Network Model. In International Workshop on Structural Health Monitoring (IWSHM) 2021: Enabling Next-Generation SHM for Cyber-Physical Systems; DEStech Publications, Inc.: Lancaster, PA, USA, 2021. [Google Scholar]
  7. Ma, Y. Development of Quasi-Active Thermography on Large Scale Geomembrane Structures; Monash University: Melbourne, Australia, 2021. [Google Scholar]
  8. Reuter, H.I.; Hengl, T.; Gessler, P.; Soille, P. Chapter 4 Preparation of DEMs for Geomorphometric Analysis. In Developments in Soil Science; Hengl, T., Reuter, H.I., Eds.; Elsevier: Amsterdam, The Netherlands, 2009; pp. 87–120. [Google Scholar]
  9. Gallant, J. Adaptive smoothing for noisy DEMs. Geomorphometry 2011, 2011, 7–9. [Google Scholar]
  10. Selige, T.; Böhner, J.; Ringeler, A. Processing of SRTM X-SAR data to correct interferometric elevation models for land surface process applications. FREE AND OPEN GIS–SAGA-GIS 2006, 115, 11. [Google Scholar]
  11. Pelletier, J.D. A robust, two-parameter method for the extraction of drainage networks from high-resolution digital elevation models (DEMs): Evaluation using synthetic and real-world DEMs. Water Resour. Res. 2013, 49, 75–89. [Google Scholar] [CrossRef]
  12. Hui, Z.; Hu, Y.; Yevenyo, Y.Z.; Yu, X. An Improved Morphological Algorithm for Filtering Airborne LiDAR Point Cloud Based on Multi-Level Kriging Interpolation. Remote Sens. 2016, 8, 35. [Google Scholar] [CrossRef]
  13. Hani, A.F.M.; Sathyamoorthy, D.; Asirvadam, V.S. A method for computation of surface roughness of digital elevation model terrains via multiscale analysis. Comput. Geosci. 2011, 37, 177–192. [Google Scholar] [CrossRef]
  14. Booth, A.M.; Roering, J.J.; Perron, J.T. Automated landslide mapping using spectral analysis and high-resolution topographic data: Puget Sound lowlands, Washington, and Portland Hills, Oregon. Geomorphology 2009, 109, 132–147. [Google Scholar] [CrossRef]
  15. Anders, N.; Valente, J.; Masselink, R.; Keesstra, S. Comparing Filtering Techniques for Removing Vegetation from UAV-Based Photogrammetric Point Clouds. Drones 2019, 3, 61. [Google Scholar] [CrossRef]
  16. Cabrera-Ariza, A.M.; Lara-Gómez, M.A.; Santelices-Moya, R.E.; de Larriva, J.-E.M.; Mesas-Carrascosa, F.-J. Individualization of Pinus radiata Canopy from 3D UAV Dense Point Clouds Using Color Vegetation Indices. Sensors 2022, 22, 1331. [Google Scholar] [CrossRef] [PubMed]
  17. Fan, J.; Dai, W.; Wang, B.; Li, J.; Yao, J.; Chen, K. UAV-Based Terrain Modeling in Low-Vegetation Areas: A Framework Based on Multiscale Elevation Variation Coefficients. Remote Sens. 2023, 15, 3569. [Google Scholar] [CrossRef]
  18. Mohamad, N.; Ahmad, A.; Khanan, M.F.A.; Din, A.H.M. Surface Elevation Changes Estimation Underneath Mangrove Canopy Using SNERL Filtering Algorithm and DoD Technique on UAV-Derived DSM Data. ISPRS Int. J. Geo-Inf. 2022, 11, 32. [Google Scholar] [CrossRef]
  19. Agisoft LLC. Agisoft Metashape User Manual, Professional Edition, Version 1.5.; Agisoft LLC: St. Petersburg, Russia, 2019; Available online: https://www.agisoft.com/pdf/metashape-pro_1_5_en.pdf (accessed on 2 June 2018).
  20. Chen, S.; Johnson, F.; Drummond, C.; Glamore, W. A new method to improve the accuracy of remotely sensed data for wetland water balance estimates. J. Hydrol. Reg. Stud. 2020, 29, 100689. [Google Scholar] [CrossRef]
  21. Chen, C.; Chang, B.; Li, Y.; Shi, B. Filtering airborne LiDAR point clouds based on a scale-irrelevant and terrain-adaptive approach. Measurement 2021, 171, 108756. [Google Scholar] [CrossRef]
  22. Ibrahim, M.; Al-Mashaqbah, A.; Koch, B.; Datta, P. An evaluation of available digital elevation models (DEMs) for geomorphological feature analysis. Environ. Earth Sci. 2020, 79, 336. [Google Scholar] [CrossRef]
  23. Zhou, A.; Chen, Y.; Wilson, J.P.; Su, H.; Xiong, Z.; Cheng, Q. An Enhanced Double-Filter Deep Residual Neural Network for Generating Super Resolution DEMs. Remote Sens. 2021, 13, 3089. [Google Scholar] [CrossRef]
  24. Belgiu, M.; Drăguţ, L. Random forest in remote sensing: A review of applications and future directions. ISPRS J. Photogramm. Remote Sens. 2016, 114, 24–31. [Google Scholar] [CrossRef]
  25. Henriques, M.; Catry, T.; Belo, J.R.; Piersma, T.; Pontes, S.; Granadeiro, J.P. Combining Multispectral and Radar Imagery with Machine Learning Techniques to Map Intertidal Habitats for Migratory Shorebirds. Remote Sens. 2022, 14, 3260. [Google Scholar] [CrossRef]
  26. Su, L. Optimizing support vector machine learning for semi-arid vegetation mapping by using clustering analysis. ISPRS J. Photogramm. Remote Sens. 2009, 64, 407–413. [Google Scholar] [CrossRef]
  27. Gebrehiwot, A.; Hashemi-Beni, L.; Thompson, G.; Kordjamshidi, P.; Langan, T.E. Deep Convolutional Neural Network for Flood Extent Mapping Using Unmanned Aerial Vehicles Data. Sensors 2019, 19, 1486. [Google Scholar] [CrossRef]
  28. Gebrehiwot, A.; Hashemi-Beni, L. Three-Dimensional Inundation Mapping Using UAV Image Segmentation and Digital Surface Model. ISPRS Int. J. Geo-Inf. 2021, 10, 144. [Google Scholar] [CrossRef]
  29. Abbas, A.W.; Minallh, N.; Ahmad, N.; Abid, S.A.R.; Khan, M.A.A. k-Means and ISODATA Clustering Algorithms for Landcover Classification Using Remote Sensing. Sindh Univ. Res. J. SURJ (Sci. Ser.) 2016, 48, 315–318. [Google Scholar]
  30. Cinat, P.; Di Gennaro, S.F.; Berton, A.; Matese, A. Comparison of Unsupervised Algorithms for Vineyard Canopy Segmentation from UAV Multispectral Images. Remote Sens. 2019, 11, 1023. [Google Scholar] [CrossRef]
  31. Shahabi, H.; Rahimzad, M.; Piralilou, S.T.; Ghorbanzadeh, O.; Homayouni, S.; Blaschke, T.; Lim, S.; Ghamisi, P. Unsupervised Deep Learning for Landslide Detection from Multispectral Sentinel-2 Imagery. Remote Sens. 2021, 13, 4698. [Google Scholar] [CrossRef]
  32. PIX4D, S. PIX4Dcapture. 2019. Available online: https://www.pix4d.com/product/pix4dcapture (accessed on 10 December 2019).
  33. Jain, A.K.; Dubes, R.C. Algorithms for Clustering Data; Prentice-Hall, Inc.: Hoboken, NJ, USA, 1988. [Google Scholar]
  34. Arthur, D.; Vassilvitskii, S. k-means++: The advantages of careful seeding. In Proceedings of the Eighteenth Annual ACM-SIAM Symposium on Discrete Algorithms; Society for Industrial and Applied Mathematics: New Orleans, LA, USA, 2007; pp. 1027–1035. [Google Scholar]
  35. Caliński, T.; Harabasz, J. A dendrite method for cluster analysis. Commun. Stat. Theory Methods 1974, 3, 1–27. [Google Scholar] [CrossRef]
Figure 1. (a) Orthomosaic image and (b) with DEM overlayed on WTP 55E anaerobic floating cover.
Remotesensing 15 05357 g001
Figure 2. Qualitative cover walk scum hardness survey of anaerobic lagoon.
Remotesensing 15 05357 g002
Figure 3. k-means image segmentations overlayed on orthomosaic with different k values of 3, 5, and 10.
Remotesensing 15 05357 g003
Figure 4. (a) CH index and (b) k-means image segmentation of full image with k o p t clustering.
Remotesensing 15 05357 g004
Figure 5. A portion of the image with k o p t clustering showing labelled observed features.
Remotesensing 15 05357 g005
Figure 6. DEM with artefact removed using the k-means filtering method and manual suppression of flotations using binary mask.
Remotesensing 15 05357 g006
Figure 7. (a) Highlighted artefacts via the k-means filtering method and (b) elevation distributions of each cluster group within the localised region of porthole.
Remotesensing 15 05357 g007
Figure 8. Distributions of elevation within the localised region of porthole using different filtering methods.
Remotesensing 15 05357 g008
Figure 9. Elevation distributions of different scum hardnesses with raw, median filtered, and k-means filtered data.
Remotesensing 15 05357 g009
Table 1. Centroid and standard deviation and proportion of each variable for k o p t groups.
GroupFeature
Observations
Centroid ± σ of RedCentroid ± σ GreenCentroid ± σ BlueCentroid ± σ Elevation (mm)Portion of ImagePortion of Asset Only
1High slope and edge-like/wrinkle features179.1 ± 14.4180.1 ± 14.0183.0 ± 15.3452.4 ± 377.14%5%
2Water features, i.e., trapped rainwater and water streaks45.2 ± 17.140.8 ± 12.930.7 ± 13.5202.8 ± 482.74%5%
3Debris and dirt, i.e., dried water marks; small man-made structures, i.e., portholes and ballast 99.8 ± 15.088.5 ± 12.076.2 ± 17.2194.1 ± 362.65%6%
4Depressed features on the membrane, i.e., trough of wrinkles, shallow water features127.2 ± 10.4120.1 ± 7.7113.8 ± 11.1164.8 ± 370.515%19%
5Image background−3.0 ± 1.12.5 ± 1.11.3 ± 0.9−9.71 ± 60.619%-
6Membrane cover—Section Upper151.3 ± 7.6152.4 ± 6.2156.0 ± 8.2261.1 ± 357.722%27%
7Membrane cover—Section Lower138.2 ± 7.3137.3 ± 5.3137.6 ± 8.3238.8 ± 372.031%38%
Table 2. Clusters within the localised region of the porthole using k-means filtering method.
ClusterPrimary Feature ObservedMean
Elevation (mm)
Median
Elevation (mm)
Standard Deviation (mm)
Group 2Trapped rainwater46.442.2137.8
Group 3Porthole structure355.7377.3115.6
Group 7Membrane cover366.4384.280.1
Table 3. Statistical measurements of different filtering methods on localised region of porthole.
Filtering MethodMean
Elevation (mm)
Median
Elevation (mm)
Standard Deviation (mm)
Raw237.6306.3187.1
k-means filtering366.4384.280.1
Median (size 3)237.3304.5183.0
Median (size 7)241.3302.4172.1
Median (size 15)249.4302.3161.4
Mean (size 5)236.8284.4171.4
Mean (size 7)237.5259.7161.5
Gauss (2σ)236.9289.0172.4
Gauss (5σ)237.8263.9160.8
Table 4. Statistics of elevations on different scum hardness levels for raw, median filtered, and k-means filtered data.
HardnessMean
(mm)
Standard Deviation
(mm)
% Relative Proportion of Data% Proportion of Outlier% Filtered Data Relative to Raw Data
RawMedian- 15k-meansRawMedian-15k-meansRawMedian- 15k-meansRawMedian- 15k-meansMedian-15k-means
H664.2661.1683.5184.3170.7152.215.9%15.9%17.5%0.8%0.5%0.2%98.6%70.7%
MH533.5531.2515.2204196.1150.45.2%5.2%5.1%2.7%2.3%1.3%99.1%65.1%
M318.6317.6296.4170.1165.4115.67.4%7.5%8.9%4.9%5.0%0.7%100.0%77.9%
MS466.5464.5432.6173.1162.6106.21.5%1.5%1.3%9.3%9.6%5.7%100.0%62.3%
S250.8249.9227.1186.3182.5133.18.2%8.3%8.8%5.3%5.4%1.9%100.0%72.1%
F99.895.675.7138.513085.116.7%16.8%16.0%10.1%10.9%6.4%99.6%63.9%
WF178.7177.6154.2128.2121.348.15.2%5.3%4.6%10.2%9.9%2.7%100.0%59.0%
W83.771.150.7162.7130.686.839.8%39.5%37.7%11.2%11.2%6.2%98.3%65.5%
Disclaimer/Publisher’s Note: The statements, opinions and data contained in all publications are solely those of the individual author(s) and contributor(s) and not of MDPI and/or the editor(s). MDPI and/or the editor(s) disclaim responsibility for any injury to people or property resulting from any ideas, methods, instructions or products referred to in the content.

