Article

Using Multisource High-Resolution Remote Sensing Data (2 m) with a Habitat–Tide–Semantic Segmentation Approach for Mangrove Mapping

1
State Key Laboratory of Remote Sensing Science, Faculty of Geographical Sciences, Beijing Normal University, Beijing 100875, China
2
Beijing Key Laboratory for Remote Sensing of Environment and Digital Cities, Faculty of Geographical Science, Beijing Normal University, Beijing 100875, China
3
Key Laboratory of Environmental Change and Resource Use in Beibu Gulf (Ministry of Education), School of Geography and Planning, Nanning Normal University, Nanning 530001, China
*
Author to whom correspondence should be addressed.
Remote Sens. 2023, 15(22), 5271; https://doi.org/10.3390/rs15225271
Submission received: 15 September 2023 / Revised: 21 October 2023 / Accepted: 1 November 2023 / Published: 7 November 2023
(This article belongs to the Special Issue Remote Sensing in Mangroves III)

Abstract

:
Mangrove wetlands are hotspots of global biodiversity and blue carbon reserves in coastal wetlands, with unique ecological functions and significant socioeconomic value. Annual fine-scale monitoring of mangroves is crucial for evaluating national conservation programs and implementing sustainable mangrove management strategies. However, annual fine-scale mapping of mangroves over large areas using remote sensing remains a challenge due to spectral similarities with coastal vegetation, tidal periodic fluctuations, and the need for consistent and dependable samples across different years. In previous research, there has been a lack of strategies that simultaneously consider spatial, temporal, and methodological aspects of mangrove extraction. Therefore, based on an approach that considers mangrove habitat, tides, and a semantic segmentation approach, we propose a method for fine-scale mangrove mapping suitable for long time-series data. This is an optimized hybrid model that integrates spatial, temporal, and methodological considerations. The model uses five sensors (GF-1, GF-2, GF-6, ZY-301, ZY-302) to combine deep learning U-Net models with mangrove habitat information and algorithms during low-tide periods. This method produces a mangrove map with a spatial resolution of 2 m. We applied this algorithm to three typical mangrove regions in the Beibu Gulf of Guangxi Province. The results showed the following: (1) The model scored above 0.9 in terms of its F1-score in all three study areas at the time of training, with an average accuracy of 92.54% for mangrove extraction. (2) The average overall accuracy (OA) for the extraction of mangrove distribution in three typical areas in the Beibu Gulf was 93.29%. When comparing the validation of different regions and years, the overall OA accuracy exceeded 89.84% and the Kappa coefficient exceeded 0.74. (3) The model results are reliable for extracting sparse and slow-growing young mangroves and narrow mangrove belts along roadsides. In some areas where tidal flooding occurs, the existing dataset underestimates mangrove extraction to a certain extent. The fine-scale mangrove extraction method provides a foundation for the implementation of fine-scale management of mangrove ecosystems, support for species diversity conservation, blue carbon recovery, and sustainable development goals related to coastal development.

Graphical Abstract

1. Introduction

Mangroves are mainly distributed in tropical and subtropical regions between 32°N and 38°S around the world, and they play important roles in coastal environmental protection [1,2], water purification [3,4], carbon sequestration [5,6,7], biodiversity conservation [8,9], and other ecological functions [4,10,11]. Due to human activities and climate change, the mangrove ecosystem is one of the most fragile ecosystems on Earth and has unique habitat conditions. Over the past 50 years, global mangrove coverage has decreased by approximately 20–35% [12]. In China, mangroves have experienced a gradual increase recently after an initial decrease, but the current stock is still only approximately 40% of that in 2000 [13]. The severe degradation of mangroves has attracted the attention of the Chinese government. Through the efforts of various sectors in China, mangroves have slowly begun to recover since 2015 [14]. Reliable, high-precision, and regular monitoring of mangroves is crucial for formulating and implementing sustainable mangrove management strategies.
Remote sensing plays a unique role in monitoring inaccessible coastal ecosystems [11]. With the development of satellite remote sensing and intelligent classification algorithms, significant progress has been made in the extraction and monitoring of mangrove wetland areas [15,16,17,18]. In recent years, high-resolution GF and ZY series satellites have been widely used for mangrove monitoring tasks [14,19]. With characteristics such as high image resolution and short revisit intervals, these satellites have great potential for detailed and effective mangrove monitoring.
To date, based on existing remote sensing datasets, researchers have conducted a large amount of mangrove monitoring work on local to global scales. Using Landsat datasets with a spatial resolution of 30 m, researchers used machine learning methods such as random forests to create a global mangrove map with a resolution of 30 m from 2000 to 2016 to capture human and natural impacts on mangroves [12]. They have also generated long-term (1973–2015) dynamics of Chinese mangroves using image thresholding methods and analyzed the effectiveness of Chinese mangrove protection measures [13]. This research strategy takes into account temporal optimization by identifying the low-tide periods for mangroves using corresponding ecological indices. This method is more suitable for global-scale mapping of mangroves at a 30 m resolution. However, such methods have a higher demand for samples and still pose challenges for fine-scale annual monitoring of long-term mangrove changes. Using Sentinel and Landsat datasets with spatial resolutions ranging from 10 m to 30 m, researchers evaluated the applicability of different indicators and selected the interannual changes of EVI and NDVI indices in mangroves time-series analysis [20]. And Theil–Sen median trend analysis and the Mann–Kendall test were used to explore the spatiotemporal variation trends in mangroves in the Qinglan Harbor Nature Reserve in Hainan, China from 1987 to 2020 [20]. Researchers generated mangrove maps of China using the Otsu method for six time periods from 1973 to 2015, and analyzed national- and local-scale changes in mangroves over a 42-year period [13]. Studies based on UAV (unmanned aerial vehicle) data, hyperspectral data, and multispectral data have also used methods such as XGBoost (extreme gradient boosting) for mangrove extraction at a small spatial scale [21,22], SVMs (support vector machines) for mangrove species classification [23,24,25], CNN (convolutional neural networks) to overcome manual leaf sample identification during image recognition process for mangrove extraction and species classification [26]. This research strategy considers spatial optimization by combining deep learning with mangrove habitat information to identify potential growth areas of mangroves and then extract mangroves based on this information. This approach helps avoid confusion between mangroves and other terrestrial vegetation due to spectral similarity. However, this research strategy often overlooks the uncertainty of tides, leading to underestimation of extracted mangroves compared with the actual extent of the mangroves. Additionally, these methods require high-quality samples and are still not suitable for long-term mangrove monitoring. These studies indicate that Landsat 30 m spatial resolution and Sentinel 10 m spatial resolution images are mainly used for large-scale mangrove monitoring, but there is a gap in large-scale fine spatial resolution monitoring (2 m) for long time series. Since the policy for protecting mangroves was established, the fluctuation in mangrove areas has increased. In this situation, high spatial resolution and dense time-series mangrove monitoring pose even more rigorous challenges in evaluating national protection plans.
Machine learning algorithms are the most widely used methods for extracting mangroves. For example, machine learning algorithms rely on rich and unbiased training samples from which they can learn to obtain accurate mappings [27]. In addition, machine learning algorithms require setting the weights of features to balance prior probabilities and fitting quality [28,29,30]. CNNs achieve high scores in automatic classification tasks, but the results of traditional CNNs for mangrove extraction rely on stable sample quality [31]. Researchers have utilized attention mechanisms and CNNs to extract mangroves in the Dongzhai Port National Nature Reserve in Hainan, China, further improving mangrove extraction accuracy [32]. However, obtaining stable, long-term mangrove samples remains a challenge. Semantic segmentation models like U-Net provide an opportunity for full-sample mapping, requiring only one year of stable samples for training; the model results can be applied to other years [33]. The U-Net deep learning semantic segmentation model network can reduce the dependence on sample points and achieve good classification results (OA = 81%) based on Landsat images [34]. In addition, some improved U-Net models have demonstrated excellent performance in mangrove extraction [35,36]. Semantic segmentation models have shown excellent performance in binary extraction tasks and have been repeatedly proven to be more suitable for fine-scale, long-term mangrove extraction. However, mangrove extraction tasks still present challenges, such as errors caused by spectral similarity confusion leading to an overestimation of mangrove area, and errors resulting from tidal uncertainty leading to an underestimation of mangrove area. Similarly, an independent study in China showed that farmlands, inland shrublands, bushes, and aquatic plants have very similar spectral characteristics to mangroves, and thus misclassifications are common [37]. This indicates that obtaining stable samples for mangrove extraction tasks is highly challenging.
Fine-scale annual monitoring of mangroves still presents three major challenges: (1) Spectral similarity: Mangroves share a high spectral similarity with coastal vegetation. Relying solely on spectral data often results in the misclassification of a significant amount of other vegetation as mangroves. (2) Tidal influence: The appearance of mangroves in imagery is greatly influenced by tidal conditions. Existing extraction strategies struggle to obtain accurate mangrove boundaries due to these tidal fluctuations. (3) Sample availability: Current mangrove extraction strategies require a substantial number of reliable samples. Obtaining reliable samples from noncurrent years is challenging, making it difficult to monitor long-term changes in mangroves.
The aim is to solve these challenges. The objective of this research is to develop and evaluate hybrid U-Net deep learning models for mapping mangroves from multisource high-resolution data. This research includes the following aspects: (1) developing a hybrid U-Net model based on a habitat–tide-semantic segmentation approach; (2) extracting the maximum extent of annual mangrove data using multisource high-resolution imagery; (3) qualitatively and quantitatively evaluating the model results through visual interpretation and validation by multiple experts; and (4) comparing the model results with existing mangrove datasets.
The rest of this paper is organized as follows: Section 2 provides detailed information about the study area, data sources, and auxiliary data. Section 3 describes the hybrid U-Net deep learning model for mapping mangroves from multisource high-resolution data. Section 4 provides an evaluation of the performance of the hybrid U-Net model. Section 5 provides a discussion of the advantages and limitations of the hybrid U-Net model and emphasizes the advantages of multisource high score data in mangrove extraction. Finally, the major findings of this research are presented in Section 6.

2. Study Areas and Data Sources

2.1. Study Areas

The study areas are located in three typical regions of Guangxi Province in southern China (Figure 1): (1) Zhenzhu Har bor–Fangcheng Harbor in Guangxi (ZZW); (2) Dafeng River in Guangxi (DFJ); and (3) Tieshan Harbor in Guangxi (TSG). The study areas have two national nature reserves (Guangxi Beilun Estuary National Nature Reserve and Guangxi Shankou Mangrove Ecological and National Nature Reserve) and one autonomous region nature reserve (Guangxi Maowei Sea-Dafeng River Mangrove Forest Autonomous Region Nature Reserve). ZZW belongs to the Guangxi Beilun Estuary National Nature Reserve, which is the largest and most typical bay-type mangrove in China. The mangroves of DFJ have the typical characteristics of estuary-type mangroves. The major species of mangroves include Aegiceras corniculatum, Kandelia obovata, Avicennia Marina, Acanthus ilicifolius L., and Sonneratia apetala [38]. The predominant species in the mangrove communities of TSG, which span the low, mid-, and high intertidal zones, include Avicennia Marina, Aegiceras corniculatum, Kandelia obovata, Rhizophora stylosa Griff, and Bruguiera gymnorrhiza (Linn.) Savigny [39]. The mangrove data presented in Figure 1 are openly available at [Science Data Bank (ScienceDB)] at [doi:10.11922/sciencedb.00449], reference number [40].

2.2. Data Preprocessing

This study used five types of multispectral satellites, namely GF-1, GF-2, GF-6, ZY3-01, and ZY3-02. The main parameters are shown in Table 1.
For the preprocessing of the images, the preprocessing workflows for GF-1, GF-2, GF-6, ZY3-01, and ZY3-02 were generally the same. The processes included (1) orthorectification of the panchromatic and multispectral images, (2) radiometric calibration, (3) atmospheric correction, (4) image fusion and pansharpening, and (5) data cropping and subset extraction. First, all of the images were orthorectified to the World Geodetic System 1984 (WGS 84) reference system, with a root mean square geometric error of less than one pixel. The changes in solar angle and Earth–sun distance was normalized by converting the digital values to top-of-atmosphere reflectance for each image. Then, the radiometric calibration tool of ENVI5.3 and the FLAASH atmospheric correction tool were used to process the multispectral images. The calibration coefficients and atmospheric correction parameters were obtained from the ENVI5.3 lookup table (GMTED2010). Finally, the pansharpening algorithm [41] was used to fuse the orthorectified panchromatic and multispectral images. Pansharpening is a radiation transformation that combines high-resolution panchromatic images (or raster bands) with lower-resolution multiband raster datasets. Combining the high spatial resolution information of panchromatic imagery with the low spatial resolution information of multispectral imagery allows us to obtain fused images with both high spatial and spectral resolution. The data fusion resolution was the same as the panchromatic band spatial resolution. The fused images were resampled to a spatial resolution of 2 m (m for meters). The processed images were then divided into separate image sets by year for subsequent mangrove extraction. In this study, the five types of high-resolution satellite images with a cloud cover of less than 15% in the Beibu Gulf from 2015 to 2021 were selected [42]. A total of 226 images were selected for the extraction of the mangrove forests in the Beibu Gulf.

2.3. Auxiliary Data

2.3.1. Potential Growth Areas of Mangroves

Using information about the mangrove habitat, mangroves are classified into a specific ecological niche, which eliminates most areas where mangroves are not found [23]. In this study, potential mangrove habitats were determined based on common mangrove habitat characteristics. First, a 20 km buffer zone was set along the Beibu Gulf coastline. Second, Guangxi has 12 species of true mangroves, with the tallest being smooth cordgrass (Sonneratia apetala), which can grow up to 20 m high [43]. The areas where the DSM (Digital Surface Model) value was less than 20 m were extracted from the buffer zone to obtain the mangrove habitat. The DSM data were downloaded from http://www.eorc.jaxa.jp/ALOS/en/aw3d30/data/index.html, accessed on 21 March 2023.

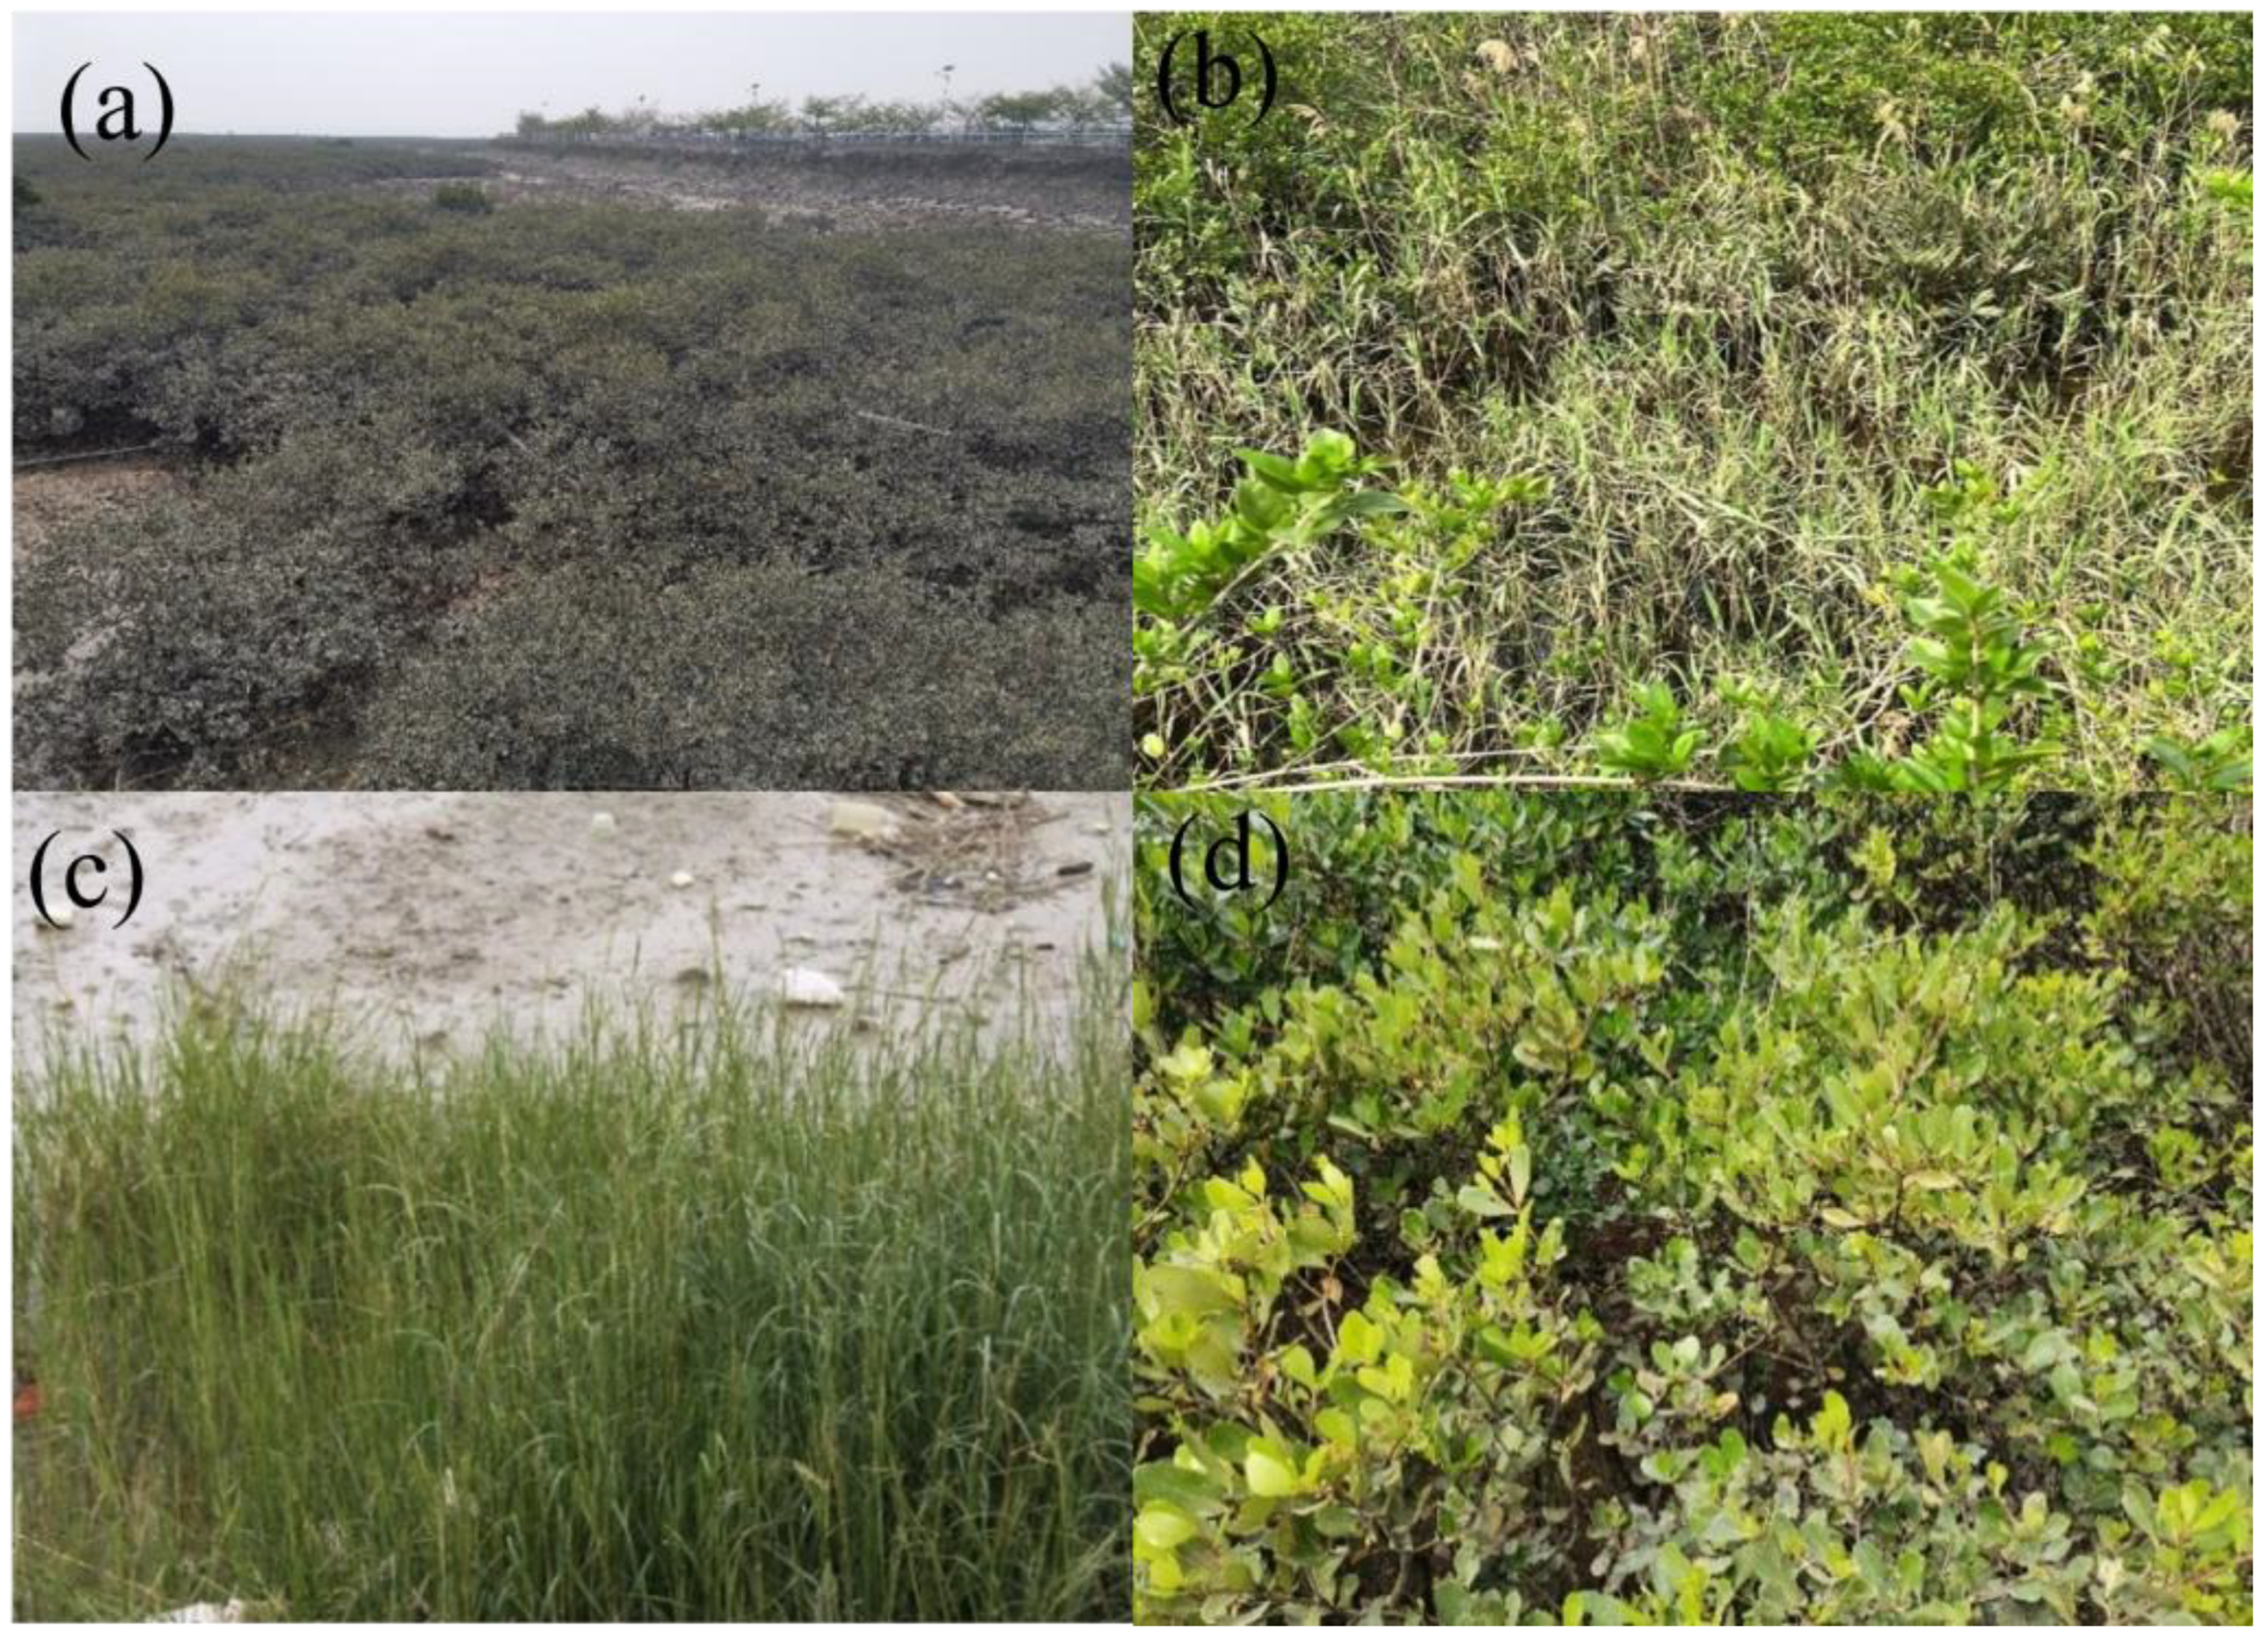
2.3.2. Reference Data Collection

The sample dataset of this study was mainly used to evaluate the effectiveness of the proposed method for mangrove extraction. The sample discrimination was based on visual interpretation of Google Earth high-resolution imagery and field investigations. The sample dataset consisted of three parts: (1) For the first part, ArcGIS 10.8 was used to generate random points in the mangrove and its adjacent areas. These points were determined to be mangroves by multiple geographers and mangrove experts. Each sampling point’s category attribute was manually determined based on high-resolution imagery from Google Earth, and uncertain sampling points were removed. (2) The second part came from the area of change in the mangrove patches, primarily focusing on areas where differences existed between existing datasets for the same year. These areas were initially assessed by an expert system and ultimately visually interpreted using high-resolution imagery from Google Earth. (3) The third part of the sample points comes from the 2015 field investigation results. The number and sources of the sampling points in each region are shown in Table 2.

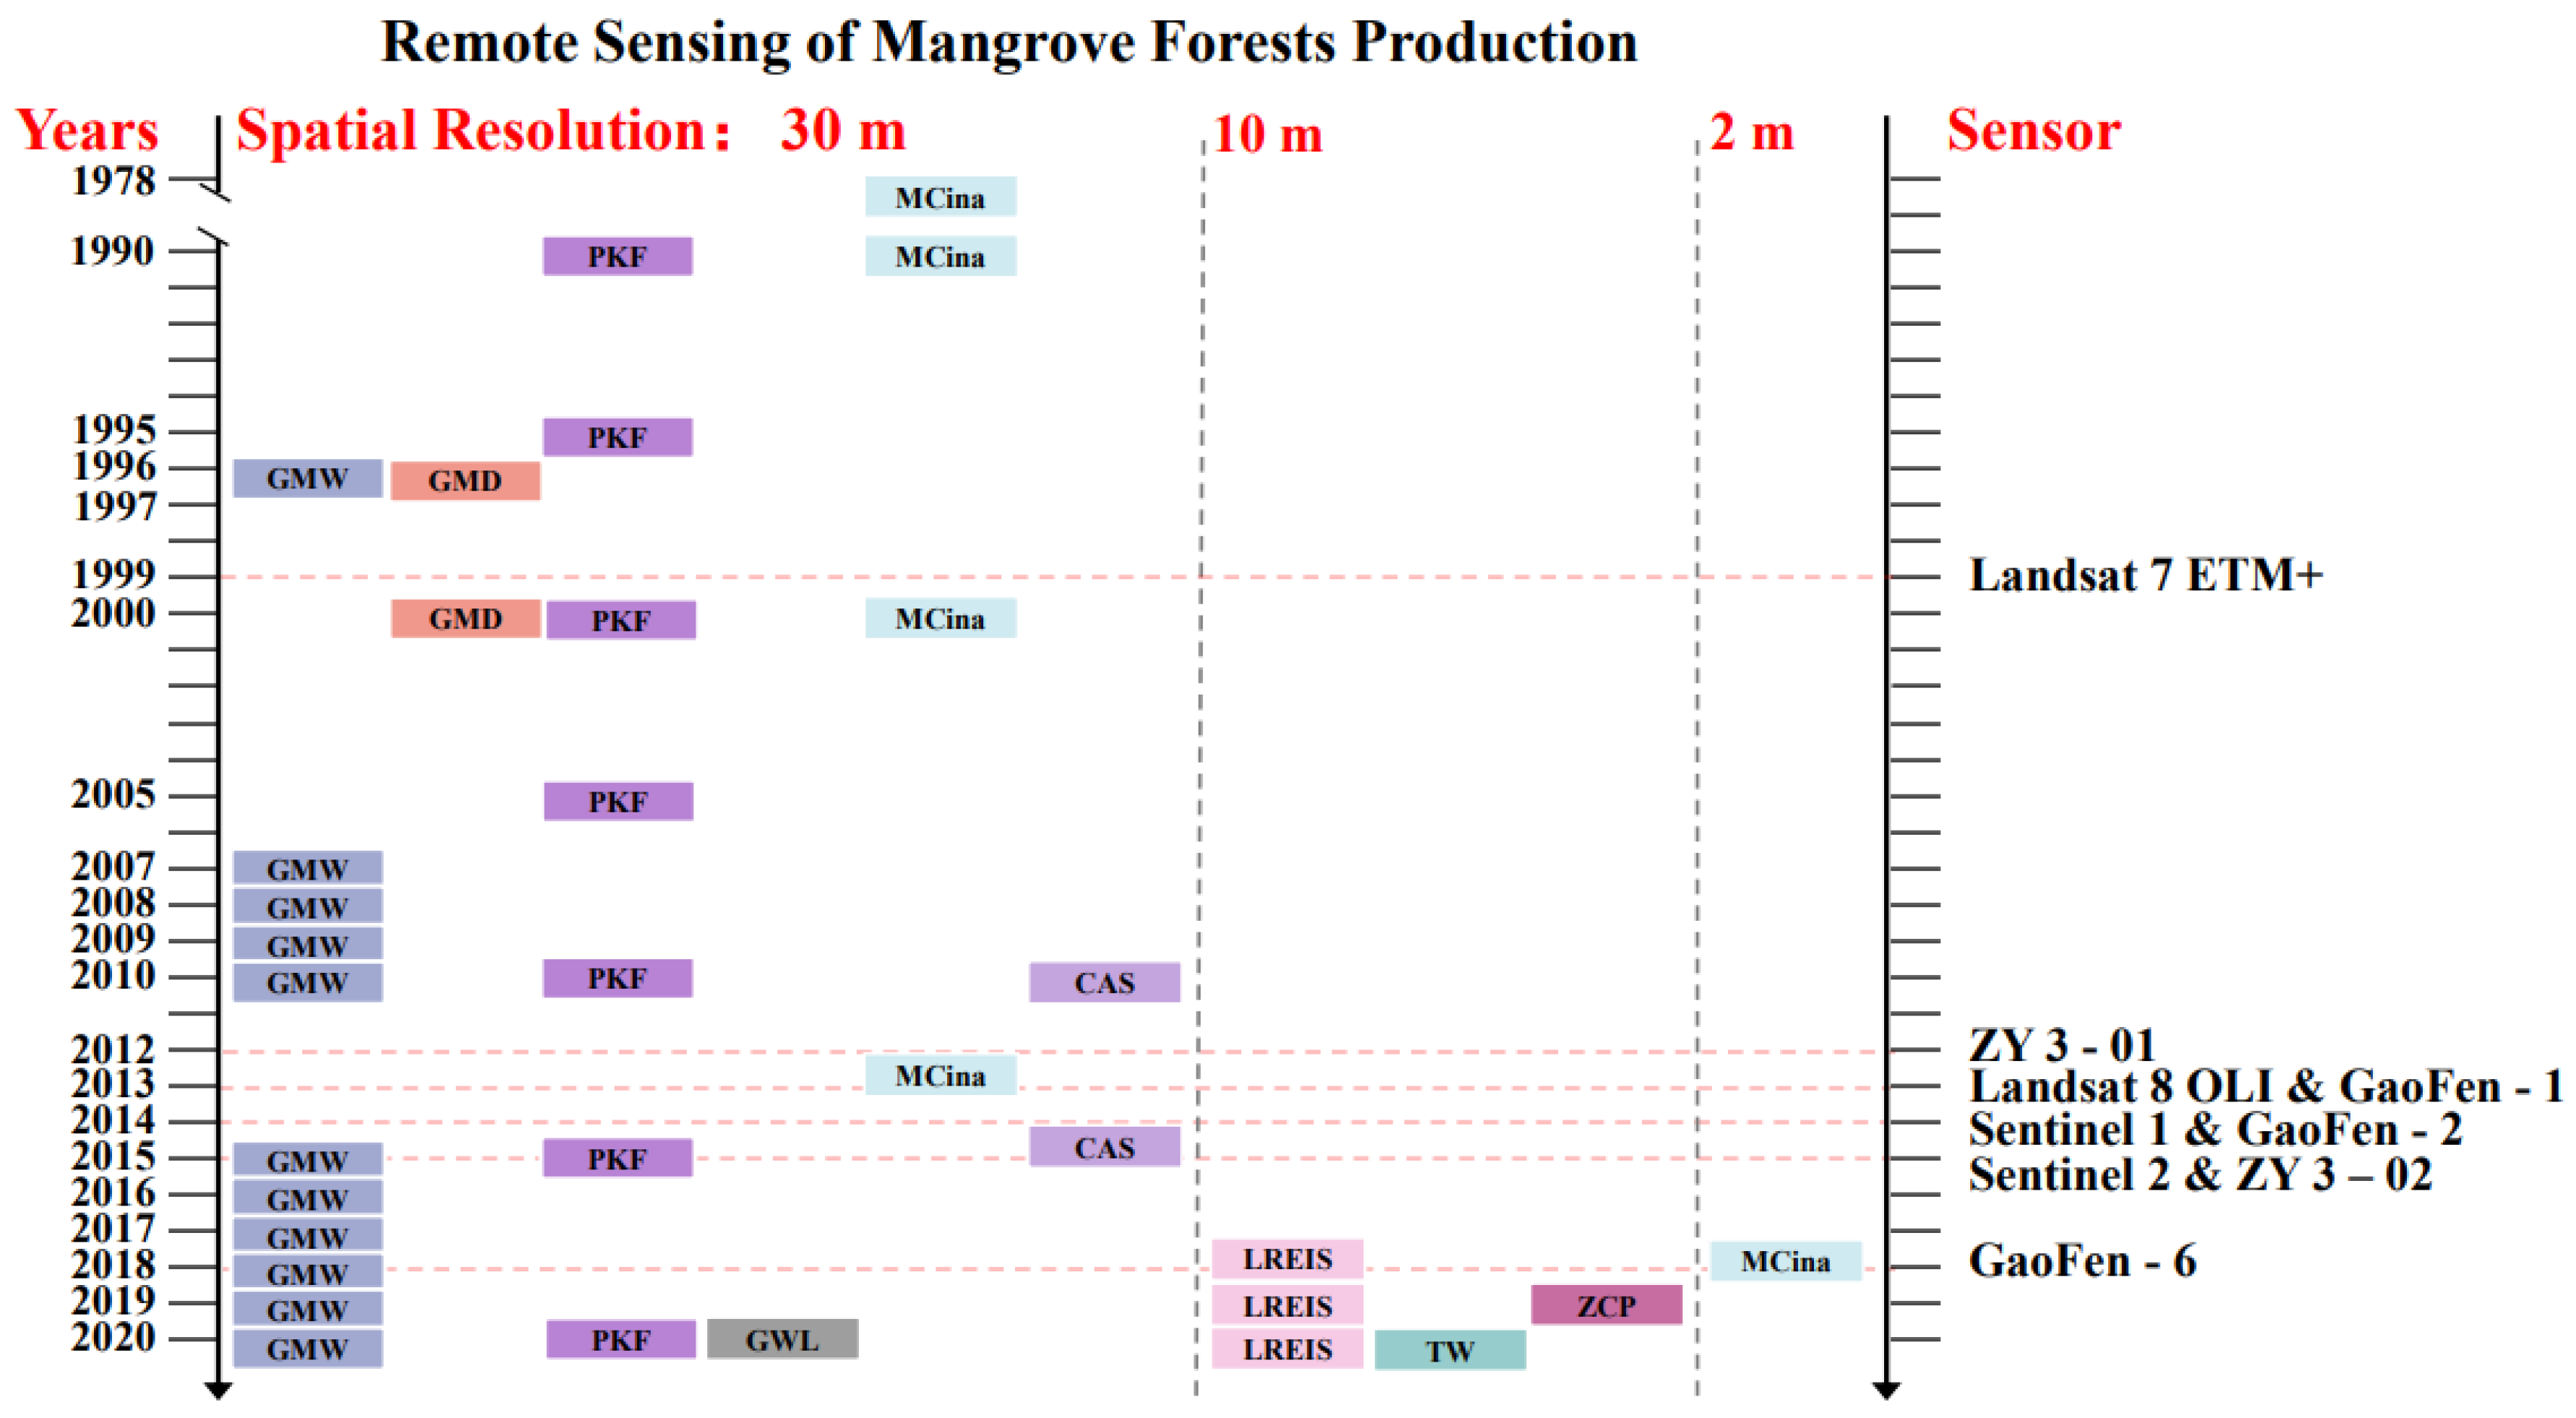
2.3.3. Existing Data Productions

In this study, we compared our research model’s results with five publicly available mangrove datasets. To ensure the reliability of data comparison, we only selected the baseline years of these datasets for comparison. These five datasets consist of one set at 2 m resolution (XCina, 2018) [23], two sets at 10 m resolution (TW, LREIS) [44,45] (2019, 2020), and two sets at 30 m resolution (GMW, CAS) (2015, 2018, 2019, 2020). The 10 m resolution products were mainly extracted based on Sentinel images, and then underwent field investigations and postprocessing, with an accuracy of over 90%. The 30 m resolution products were mainly extracted based on Landsat images, and after postprocessing, the results were published. The most representative products are the GMW data, which have formed annual time-series data since 2015 [15].

3. Hybrid U-Net for Extracting Mangrove Forests and Evaluation Criteria

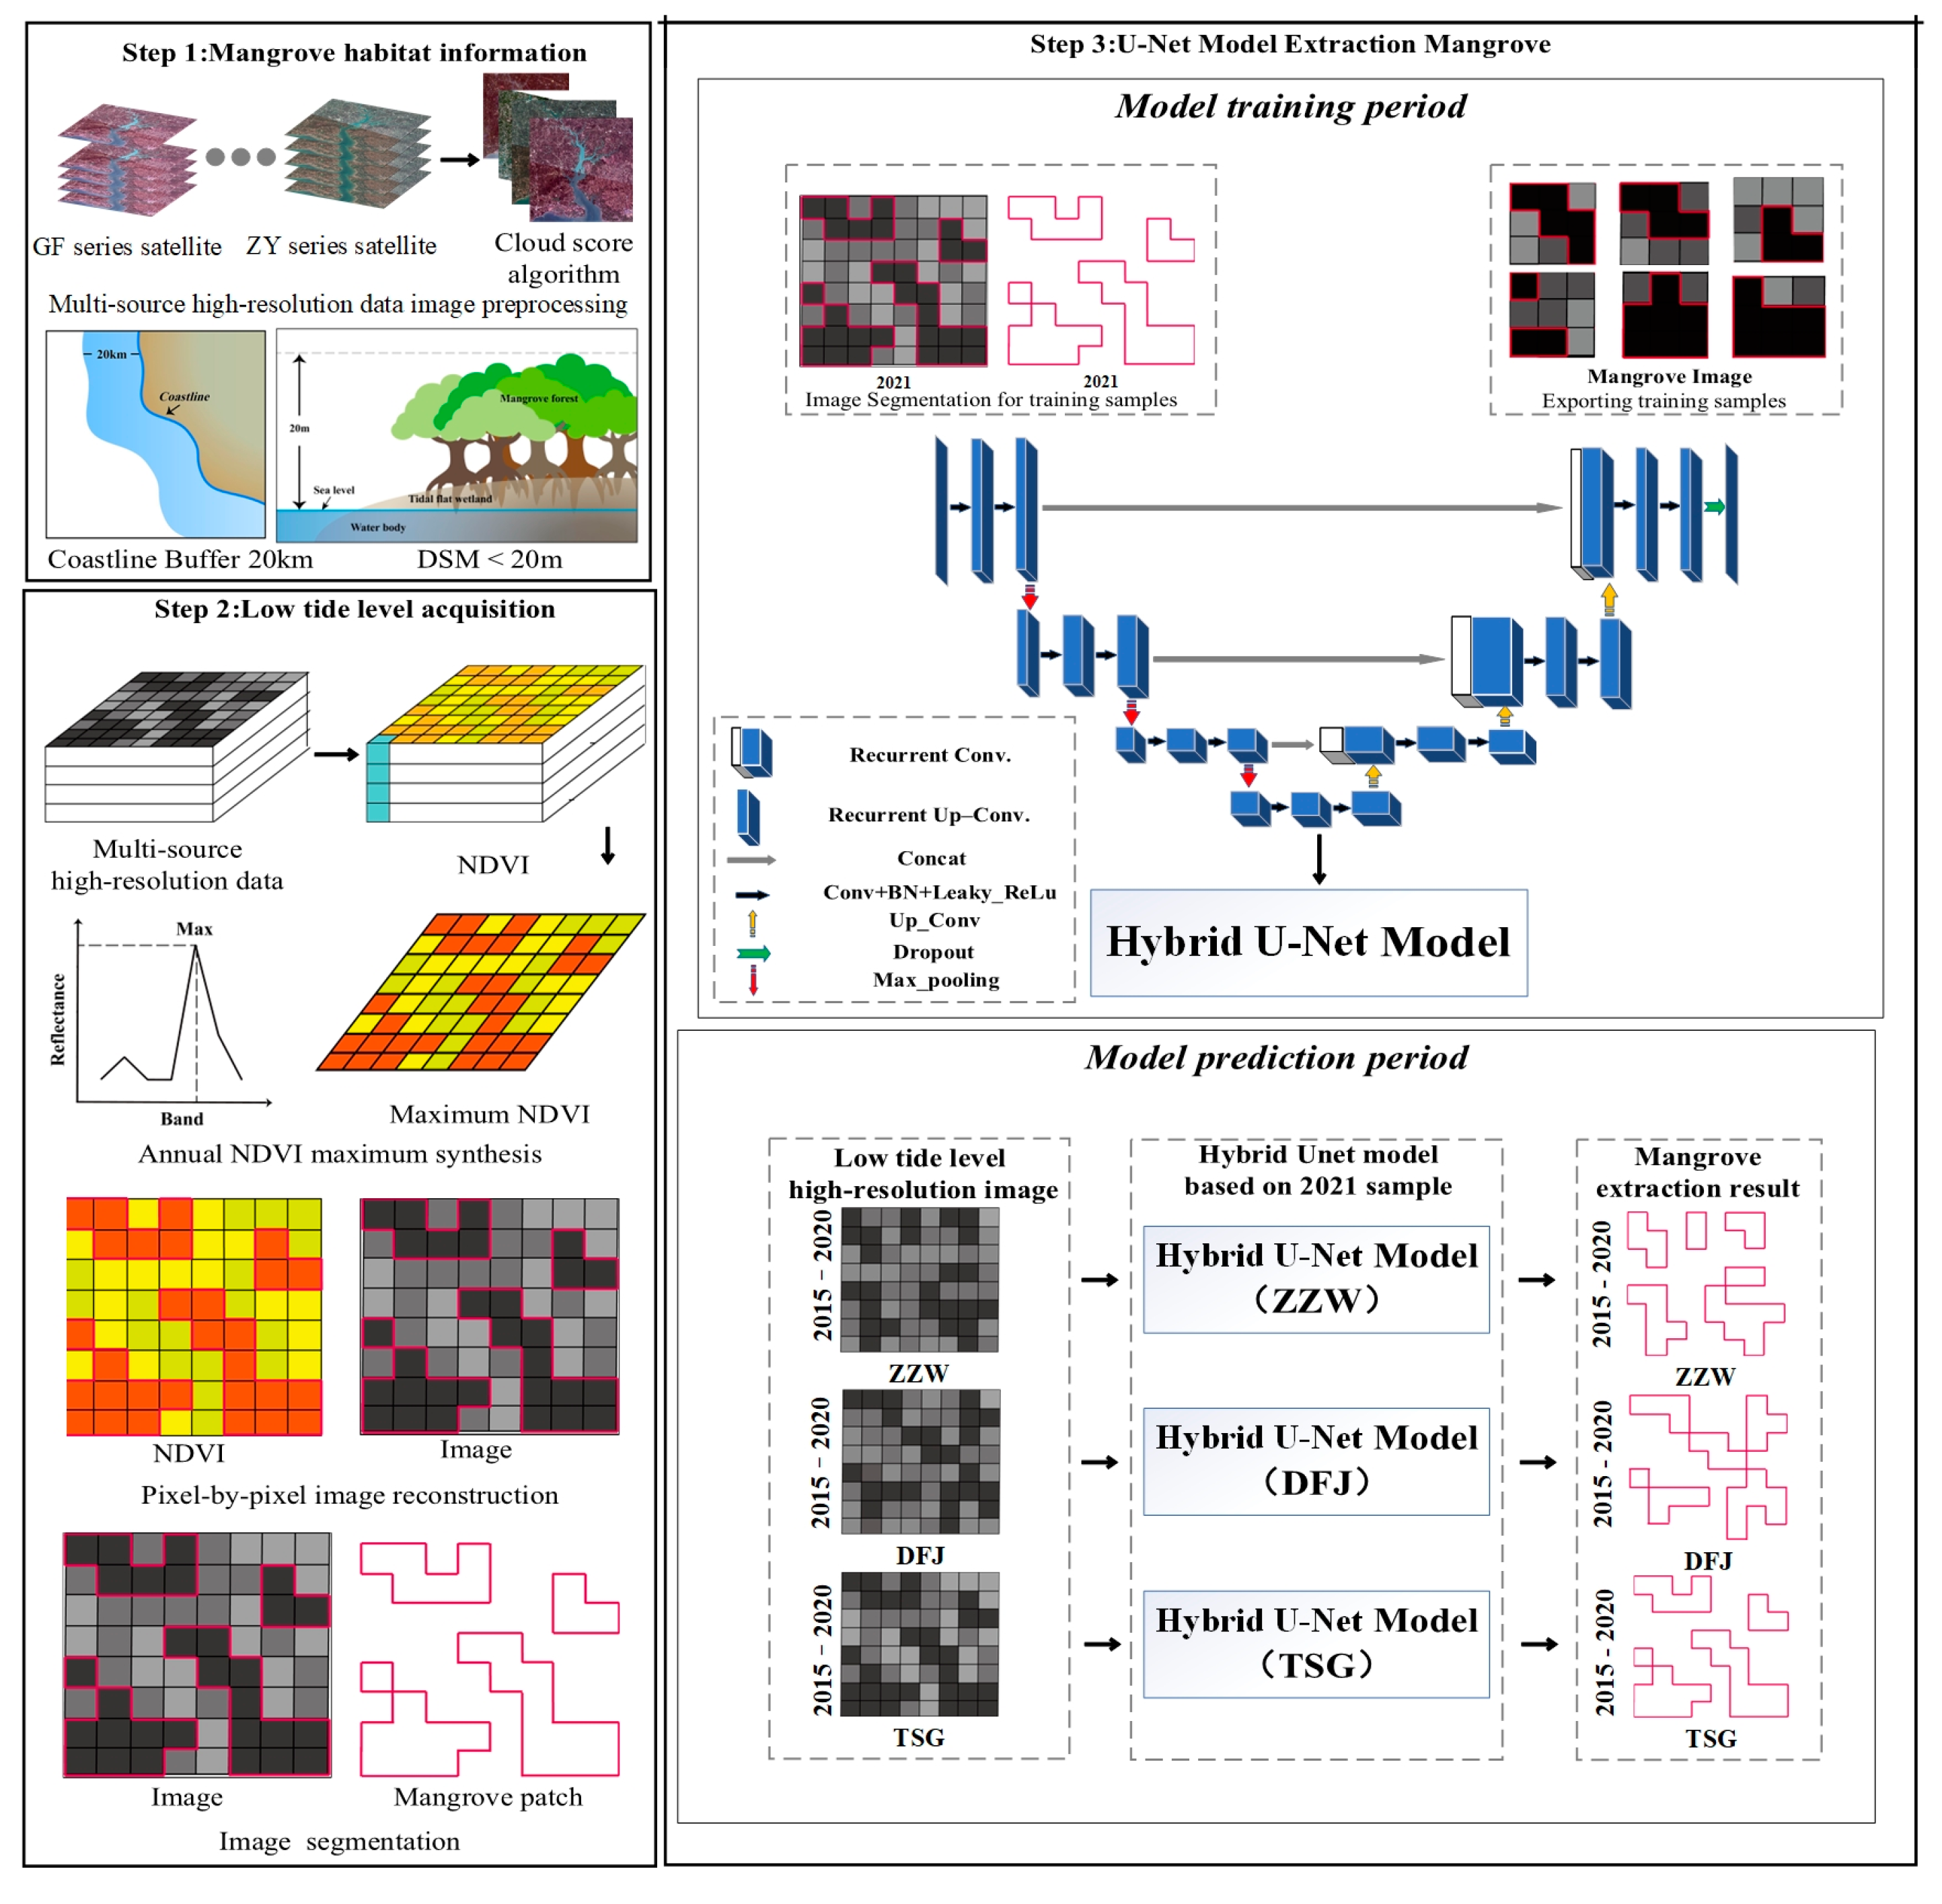
3.1. Overview of the Mangrove Extraction Process

The overview of the workflow for mangrove extraction and evaluation is outlined in Figure 2 and mainly consists of four parts: (1) image preprocessing, (2) mangrove maximum growth area assessment, (3) U-Net mangrove extraction, and (4) accuracy assessment. Image preprocessing: the satellite images were preprocessed to obtain a high-resolution multisource image set with a spatial resolution of 2 m (m for meters) for 2015–2021. Mangrove maximum growth area assessment: Based on the habitat characteristics and NDVI, we acquired cloud-free images during the low-tide period for mangroves, representing the maximum growth area of mangroves. Extracting the maximum mangrove growth area, which is used for U-Net mangrove extraction, is crucial for the “full mapping” of the semantic segmentation model. U-Net mangrove extraction: Accurate determination of the maximum mangrove growth area contributes to achieving a “full mapping” relationship between stable samples (2021) and the spatial scale of remote sensing images. On this basis, image detection and segmentation were performed on the annual cloud-free mangrove images. Multiple-source image segmentation results were extracted using a blended U-Net model, which was used to derive mangrove maps for multiple years (2015–2020). Accuracy assessment: the accuracy of the mangrove maps was verified based on validation sample sites and field survey results, and quantitative and qualitative analyses were performed via comparing multi-person visual interpretations with existing data.

3.2. Principle of the U-Net Model

The U-Net model is the most widely used model in semantic segmentation projects and has also been extensively applied to remote sensing image classification [46]. The input image first passes through the encoder to generate downsampling feature maps. Then, the decoder part implements upsampling of the feature maps to make them the same size as the original image. U-Net is composed of stackable highway units, allowing deeper networks to be trained using a limited number of samples [34]. To address the problem of gradient degradation caused by excessively deep neural networks in deep learning tasks, this study used ResNet-34 as the kernel function to train the deep learning model to enhance the model’s feature representation capability [47,48]. To optimize the update of network parameters, the Adam optimizer [49] was used. The specific equation, Equation (1), is as follows:
θ t = θ t 1 α * m ^ / ( v ^ t + ε )
In Equation (1), t represents the number of training iterations, α is the learning rate, m is the exponential moving average of the gradient, and v is the exponential moving average of the squared gradient. ε is usually a constant value of 1 × 10⁻⁸.
The model loss was calculated during training using the average cross-entropy loss function, as shown in Equation (2):
l o s s = 1 n i = 1 n y i l o g a i + ( 1 y i ) l o g ( 1 a i )
where n represents the batch size and y i and a i are the predicted value and true value of the i -th sample in each batch, respectively. The U-Net network model has better spatial accuracy due to adding skip connections between the encoder and decoder layers.

3.3. Hybrid U-Net Based on the Habitat–Tide Semantic Segmentation Approach

Based on mangrove habitat characteristics and the collected low-tide data, a hybrid strategy combining the U-Net model was proposed for mangrove extraction based on the habitat data method. The hybrid U-Net model consists of three steps: (1) mangrove habitat information, (2) low tide level acquisition, and (3) U-Net model mangrove extraction (Figure 3).
The habitat extraction module identifies the potential growth areas of mangroves. The low-tide data collection module extracts the maximum mangrove extent based on the current data. The U-Net module for mangrove extraction constructs the relationship between the maximum mangrove extent and multisource high-resolution remote sensing imagery to build a mangrove extraction model. This model can be used for mangrove extraction in other years within the same area. In the U-Net module for mangrove extraction, the encoder and decoder parts are the same as those of the standard U-Net model. However, the classifier part is enhanced via integrating the habitat information module and the low-tide data collection module, improving the accuracy of the extraction process.
  • Step 1: Mangrove habitat information
According to the content in Section 2.3.1, mangroves grow on intertidal flats and the buffer zone is designed as 20 km from the coastline. Areas with a digital surface model (DSM) value less than 20 m are considered potential growth areas to reduce interference from other coastal vegetation.
This step involves using the unique habitat of mangroves to identify potential mangrove habitat areas and avoid interference from shoreline vegetation in the inversion results. This is an optimization in terms of the model’s spatial aspects. The inputs for this step include GF series and ZY series remote sensing images, DSM (digital surface model) data, and coastline data. The output is the extent of the mangrove habitat.
  • Step 2: Low tide level acquisition
The minimum water level in the study area was based on the lowest tidal period of the year [50]. For the normalized difference vegetation index (NDVI), the NDVI values of non-water pixels (vegetation and tidal flats) are higher than those of water pixels, as vegetation absorbs more strongly in the green band. Maximum value compositing of the NDVI for the preprocessed 2 m resolution images from 2021 can be used to extract the minimum water surface [51]. This composite image not only enhances the difference between vegetation and water but also removes the periodic flooding effect of seawater on the mangrove forest, effectively separating the mangrove forest from the water. In this study, 51 images were ultimately used to track the low-tide period (GF-1: 13; GF-2: 17; GF-6: 4; ZY3-01: 5; ZY3-02: 12). We list the relevant information for the remote sensing data in the Supplementary Materials.
This step involves using NDVIs and multisource high-resolution data to determine the low-tide moments for mangroves, obtaining the maximum mangrove area. Based on this, multilevel interpretation is carried out, and the interpretation results serve as inputs to the U-Net model for training, achieving a “full mapping” with remote sensing imagery. The training results can then be applied to mangrove extraction for other years. This is an optimization in terms of the model’s temporal aspects. The inputs for the second part include NDVIs constructed from GF series and ZY series remote sensing images. The output is the maximum extent of the mangrove areas.
  • Step 3: U-Net model mangrove extraction
First, multilevel interactive verification of the maximum range of mangrove areas (2021).Then, each detected mangrove patch was adjusted to obtain the best mangrove patch samples. Finally, the mangrove patch samples were trained to obtain a mangrove extraction model. The cloud-free low-tide images from other years (2015–2020) were used as inputs to the mangrove extraction model to obtain the mangrove map for the corresponding year.
This study was compiled using the Python language based on the TensorFlow deep learning framework. The hardware configuration of the operating platform includes a Lenovo Ren-7000 i7-12700 (F)/NVIDIA Quadro RTX3070Ti 16G GPU. The slice size was set to 256 × 256 pixels, the batch size was set to 32, the kernel function was ResNet-34, and the other parameters were set to the default values of ResNet-34.

3.4. Accuracy Assessment

We evaluated the classification accuracy of the proposed hybrid U-Net model using three metrics: Kappa coefficient, overall accuracy (OA), and F1-scores [52]. The kappa coefficient, OA, and F1-scores are all based on confusion matrix calculations, which provide the number of correctly classified and misclassified samples [53]. Specifically, the Kappa coefficient is often used to measure the consistency of test results and the effectiveness of classification, while OA is the ratio of correctly classified categories to the total number of categories [34]. The F1-score reflects the overall comprehensive index, independent of the number of categories; it is a means of coordinating precision and recall. Precision is defined as the ratio of true positive (TP) predictions to sample predictions of the same type of land cover. It refers to the proportion of mangrove and non-mangrove types in the model results that is the same as in the validation point results. Recall is defined as the ratio of target type samples to total type samples. It refers to the proportion of model results defined as mangroves and the validation points (wild survey results and visual interpretation results) that are classified as mangroves [50].
O A = i = 1 2 a i i N
K a p p a = O A i = 1 2 a i + * a + i N 2 1 O A , a i + = i a i j , a + i = j a i j
p r e c i s i o n = T P T P + F P ,   r e c a l l = T P T P + F N
F 1 s c o r e s = 2 × ( p r e c i s i o n × r e c a l l ) p r e c i s i o n + r e c a l l
In Equations (3) and (4), a i i represents the number of samples correctly predicted as type i , a i j represents the number of samples of type i predicted as type j , and N is the total number of samples. In Equation (5), F N represents the number of samples for which the classification model predicts mangrove forests but the ground truth shows non-mangrove forests.

3.5. Multilevel Interactive Verification

In this study, the multilevel interactive verification was divided into four parts: preliminary interpretation, comparison of interpretation results, issue resolution and correction, and final review and confirmation. Preliminary interpretation: We engaged multiple experts in geographic information or experts in mangrove studies. Based on their respective professional knowledge and experience, they independently interpreted and identified mangroves in the same remote sensing image, generating interpretation logs. These interpretation logs include the basis for decisions, data sources, and key findings. Comparison of interpretation results: Interpretation results from multiple individuals were compared to identify stable mangrove areas and areas with discrepancies. Issue resolution and correction: Referring to the existing dataset, identify areas with differences in mangrove interpretation to determine whether they are mangroves. For areas that still could not be definitively determined, in-depth analysis of the imagery, additional data searches, or reference to ground validation data were conducted, and the final determination was made by local mangrove experts. Final review and confirmation: The stable mangrove areas obtained from the preliminary interpretation were overlaid with areas where there were discrepancies as determined by experts. The final visual interpretation results were ultimately confirmed.

4. Results

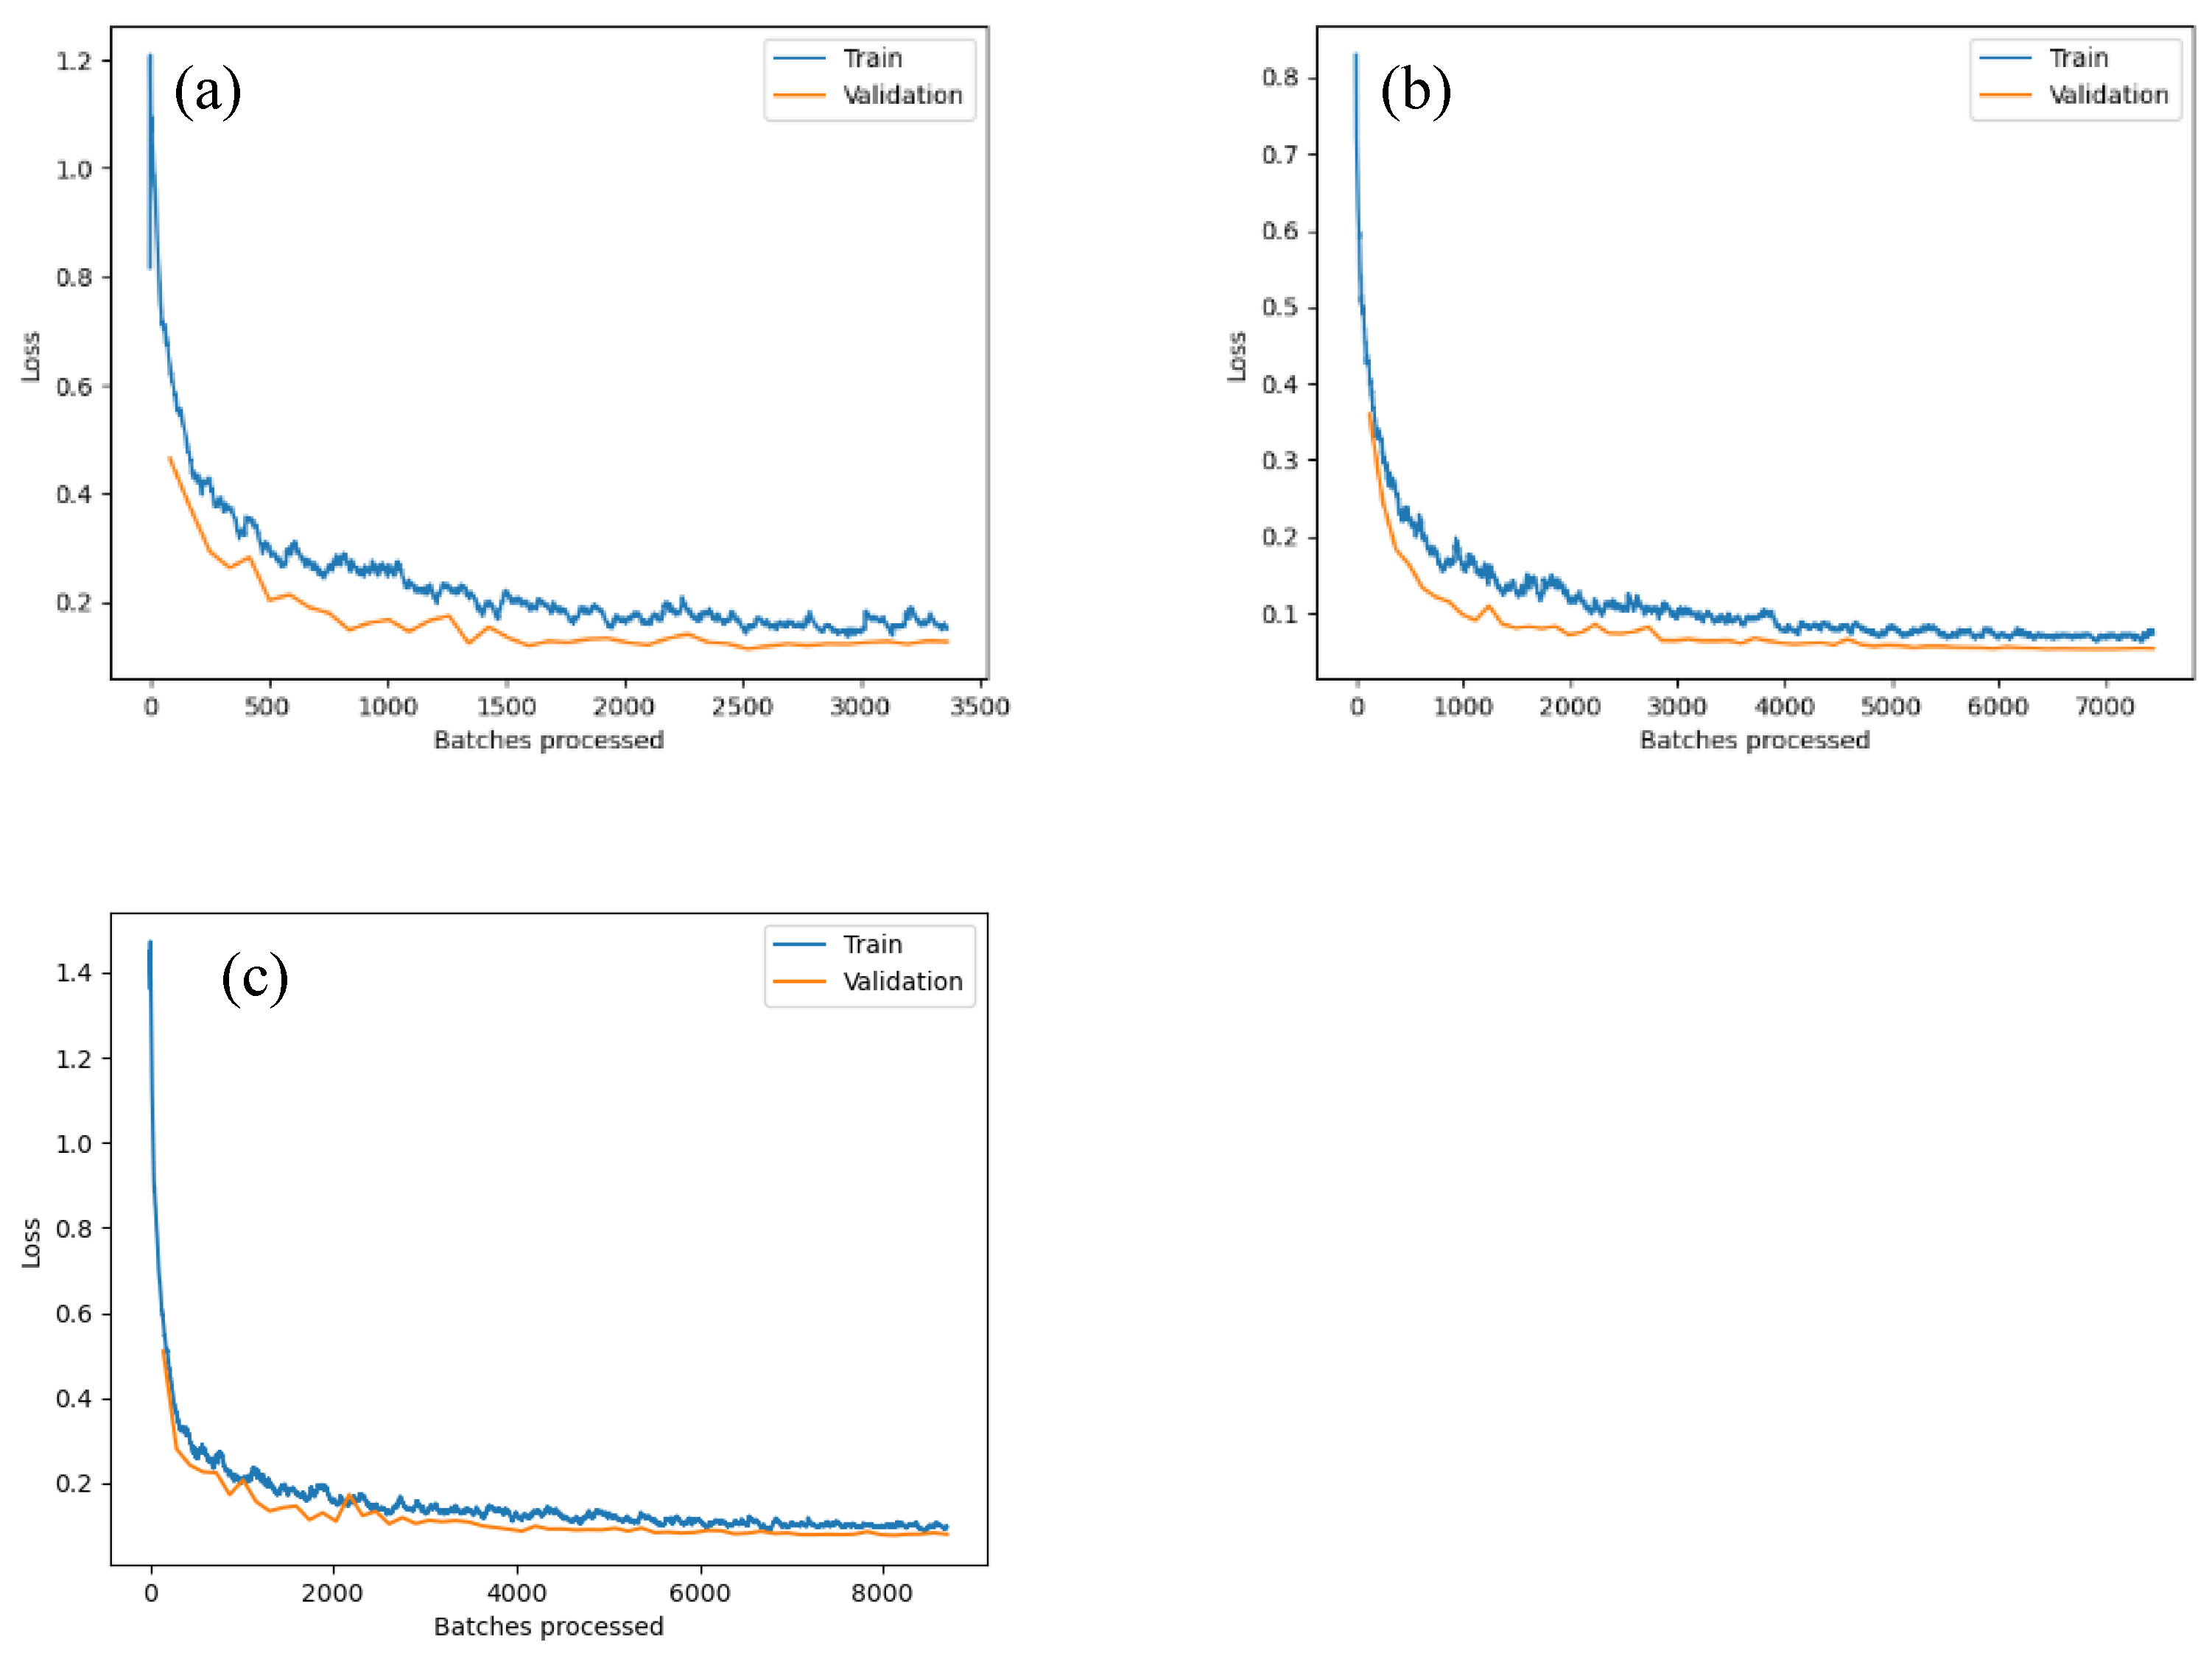
4.1. Performance Evaluation of the Hybrid U-Net Model during the Training Period

The training results (2021 samples) based on the hybrid U-Net model in three typical mangrove areas in the Beibu Gulf are shown in Figure 4. During the training period, the output of the hybrid U-Net’s divided into two categories: mangrove and non-mangrove. The application effect of the U-Net deep learning model was evaluated using classic evaluation metrics such as accuracy, recall, and F1-score in the three study areas. As seen in Table 3, the F1-scores of the three areas were all above 0.9, indicating that the hybrid U-Net model theoretically performed well in precision and recall. Precision is an indicator from the perspective of model prediction, and there was an average mangrove prediction precision of 92.54% in the three areas. Recall is an indicator from the perspective of real results, and there was an average mangrove prediction recall of 91.51% in the three areas. Overall, the model performs similarly in the three areas, with slightly better results in TSG than in ZZW and DFJ. The lowest F1-score for non-mangrove areas during training in the three regions was 0.97. This demonstrates that very few mangrove patches were misinterpreted as non-mangrove patches. This further indicates that the boundaries of mangrove patches used for model training are quite accurate.
The hybrid U-Net model effectively inverted the mangroves in the three areas. The training accuracy–verification curve of the hybrid U-Net is shown in Figure 4. The training accuracy curve was used to measure the performance of the model, and the loss curve was used to further optimize the model. After approximately 7000 iterations in the three typical areas, the model reached a convergence state, at which point the model weights were determined. After model convergence, the loss of three regions is around 0.05.
To avoid overfitting, the early stopping strategy was employed during the model training process [54]. This strategy involves monitoring the training progress and automatically stopping the training when the model has reached a point of convergence and the training loss on the training dataset no longer decreases significantly. This allows the model to be saved with the optimal parameter settings without continuing training until after the specified number of epochs.

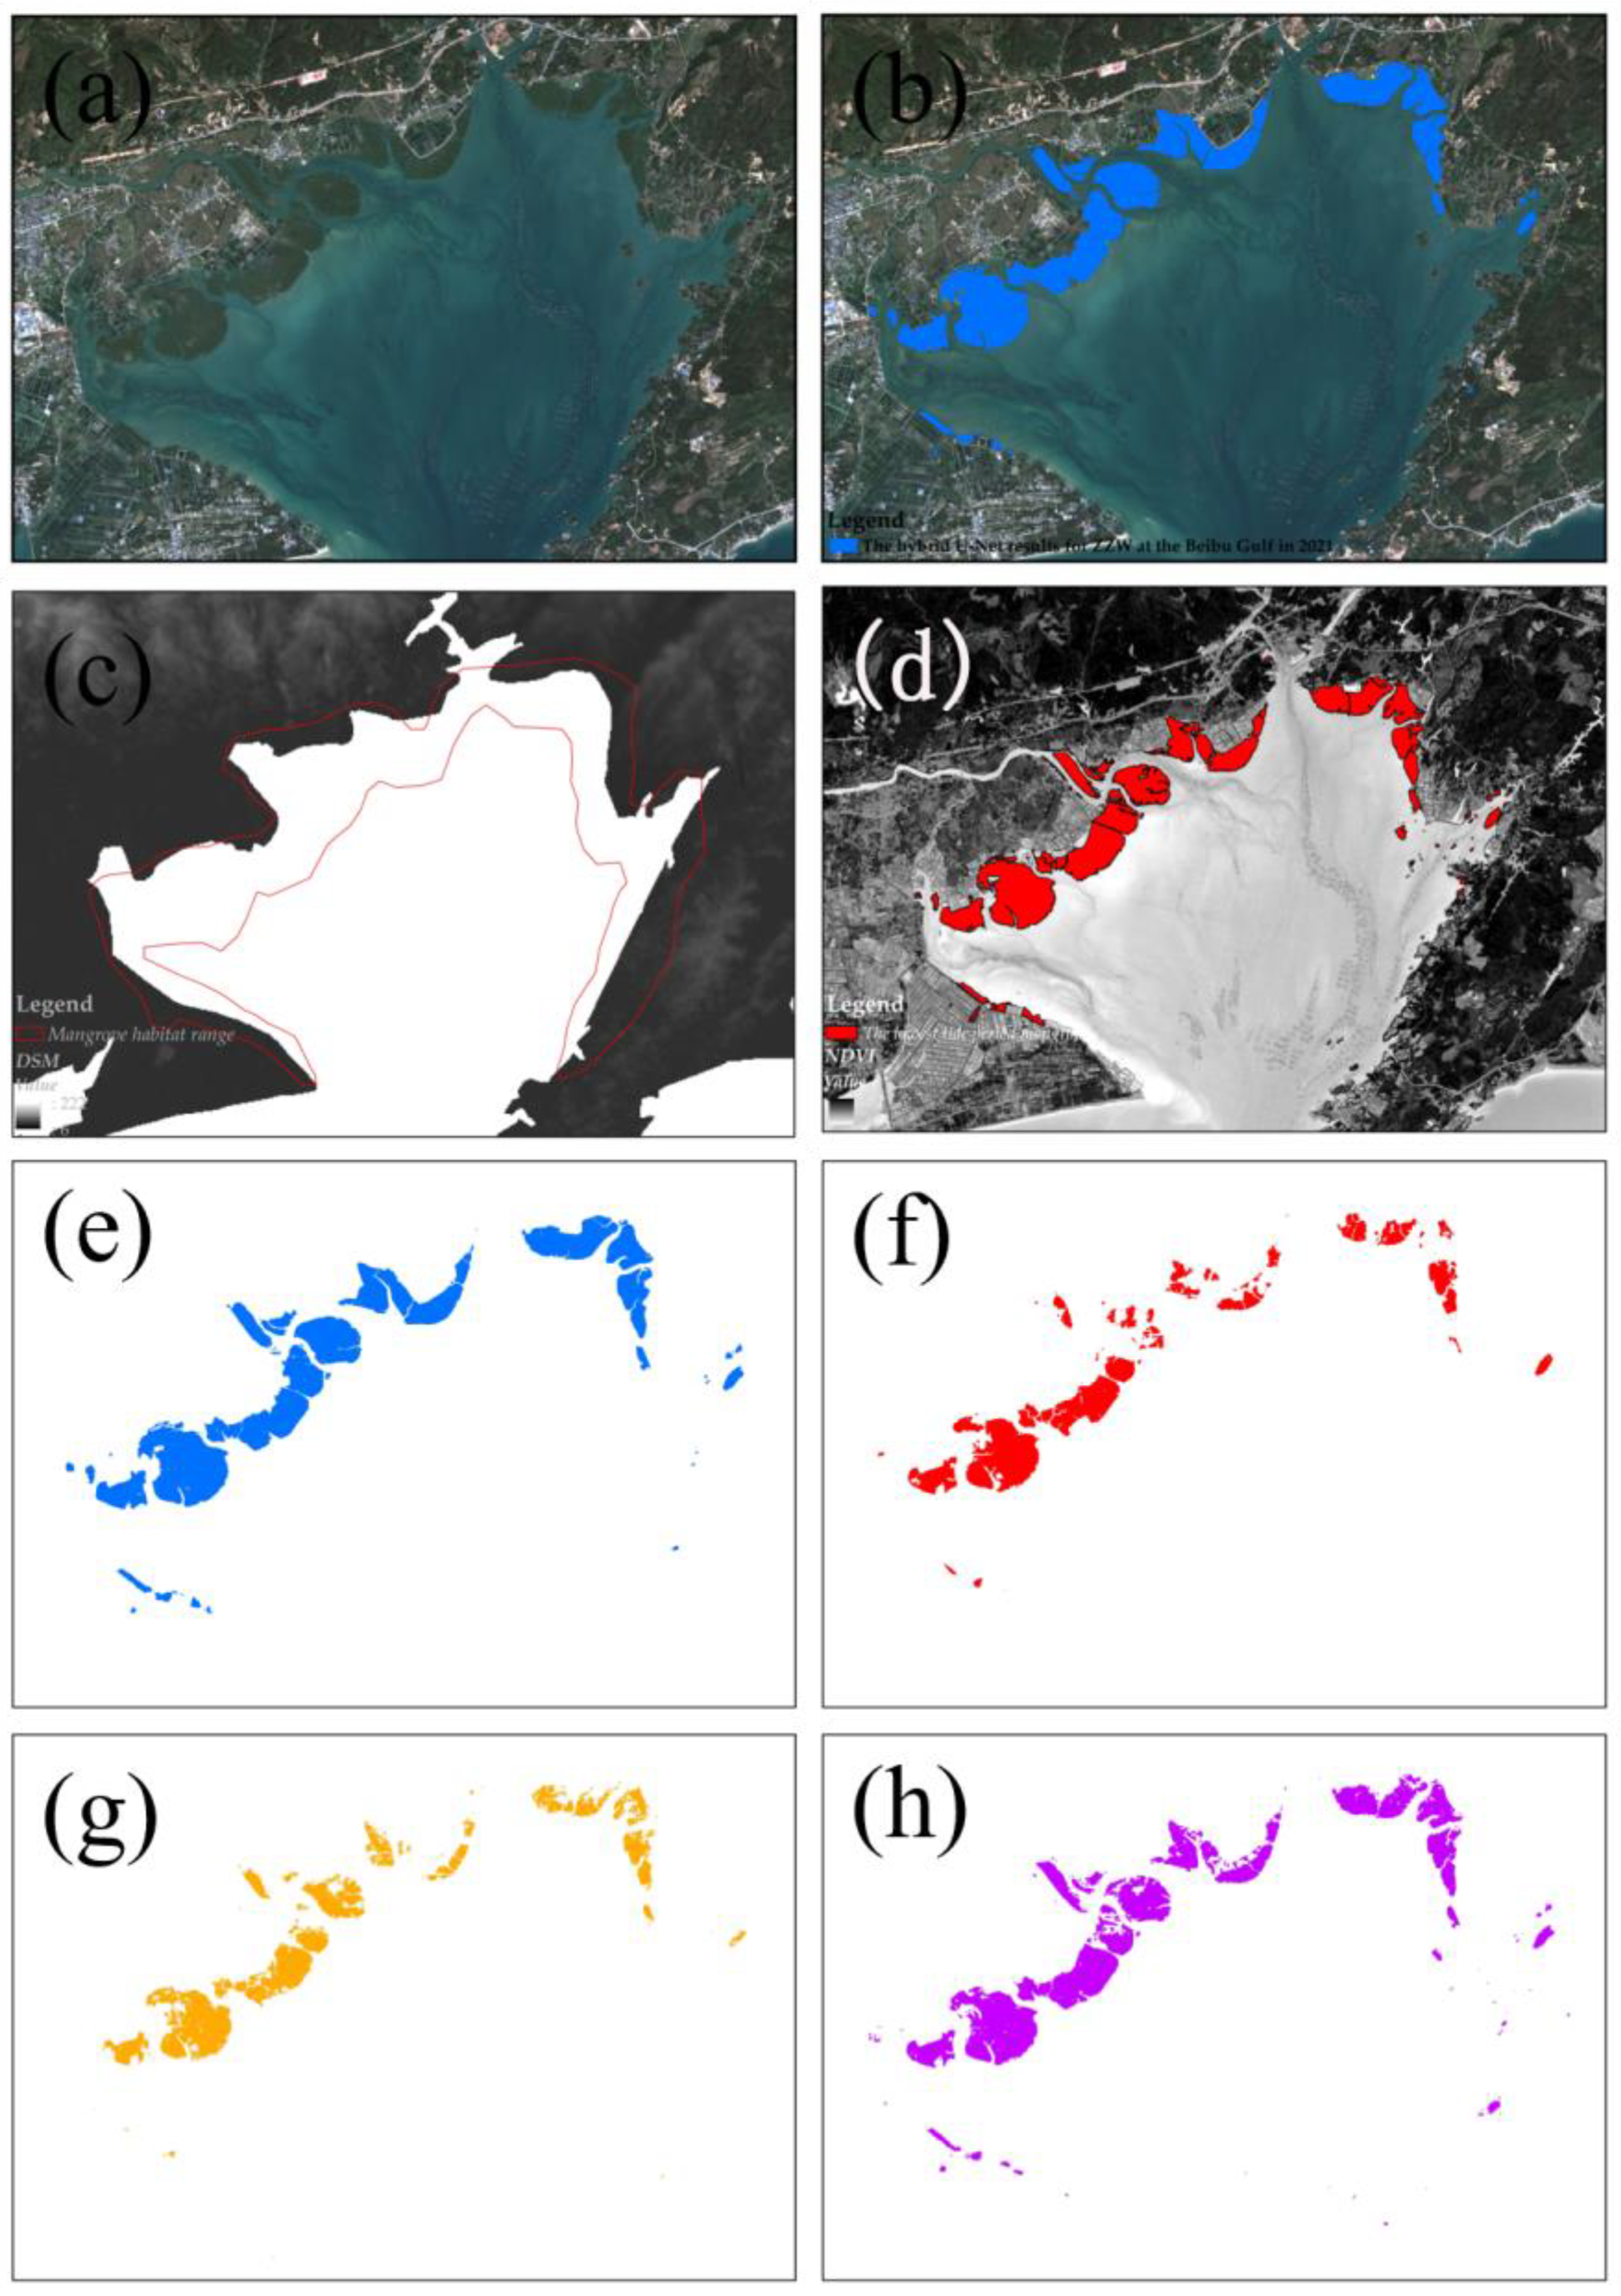
4.2. Evaluation of the Hybrid U-Net Model’s Mangrove Extraction Accuracy

The extraction results of the hybrid U-Net model can be seen in Figure 5 and Table 4 (the extraction results for DFJ and TSG are shown in the Supplementary Materials (Figures S1 and S2)). The PA, UA, OA, and Kappa coefficients were selected as indicators to validate the accuracy of the hybrid U-Net model in extracting the mangroves. The average OA value of the mangrove distribution extraction in the typical area of the Beibu Gulf was 93.29%. When comparing the validation results of the different regions and different years (Table 4), the overall OA accuracy exceeded 89.84%, and the Kappa coefficient exceeded 0.74. The lowest OA was 93.31% (kappa = 0.8) in the DFJ area, and the lowest OA was 91.68% (kappa = 0.82) in the TSG area. The best extraction accuracy of the mangroves in the DFJ area was in 2015 (OA = 96.58%, Kappa = 0.87), and the lowest accuracy was in the ZZW area in 2020 (OA = 89.84%, Kappa = 0.77). Compared with the results for DFJ, the extraction accuracy for ZZW and TSG in the four years averaged 94.74%. With the hybrid U-Net model, there were very few errors in mangrove extraction (Figure 5), resulting in high PA values for all the mangrove categories (DFJ reached a maximum value of 96.64% in 2015). The PA and UA values of the mangroves in the three typical areas were both greater than 90.11%.

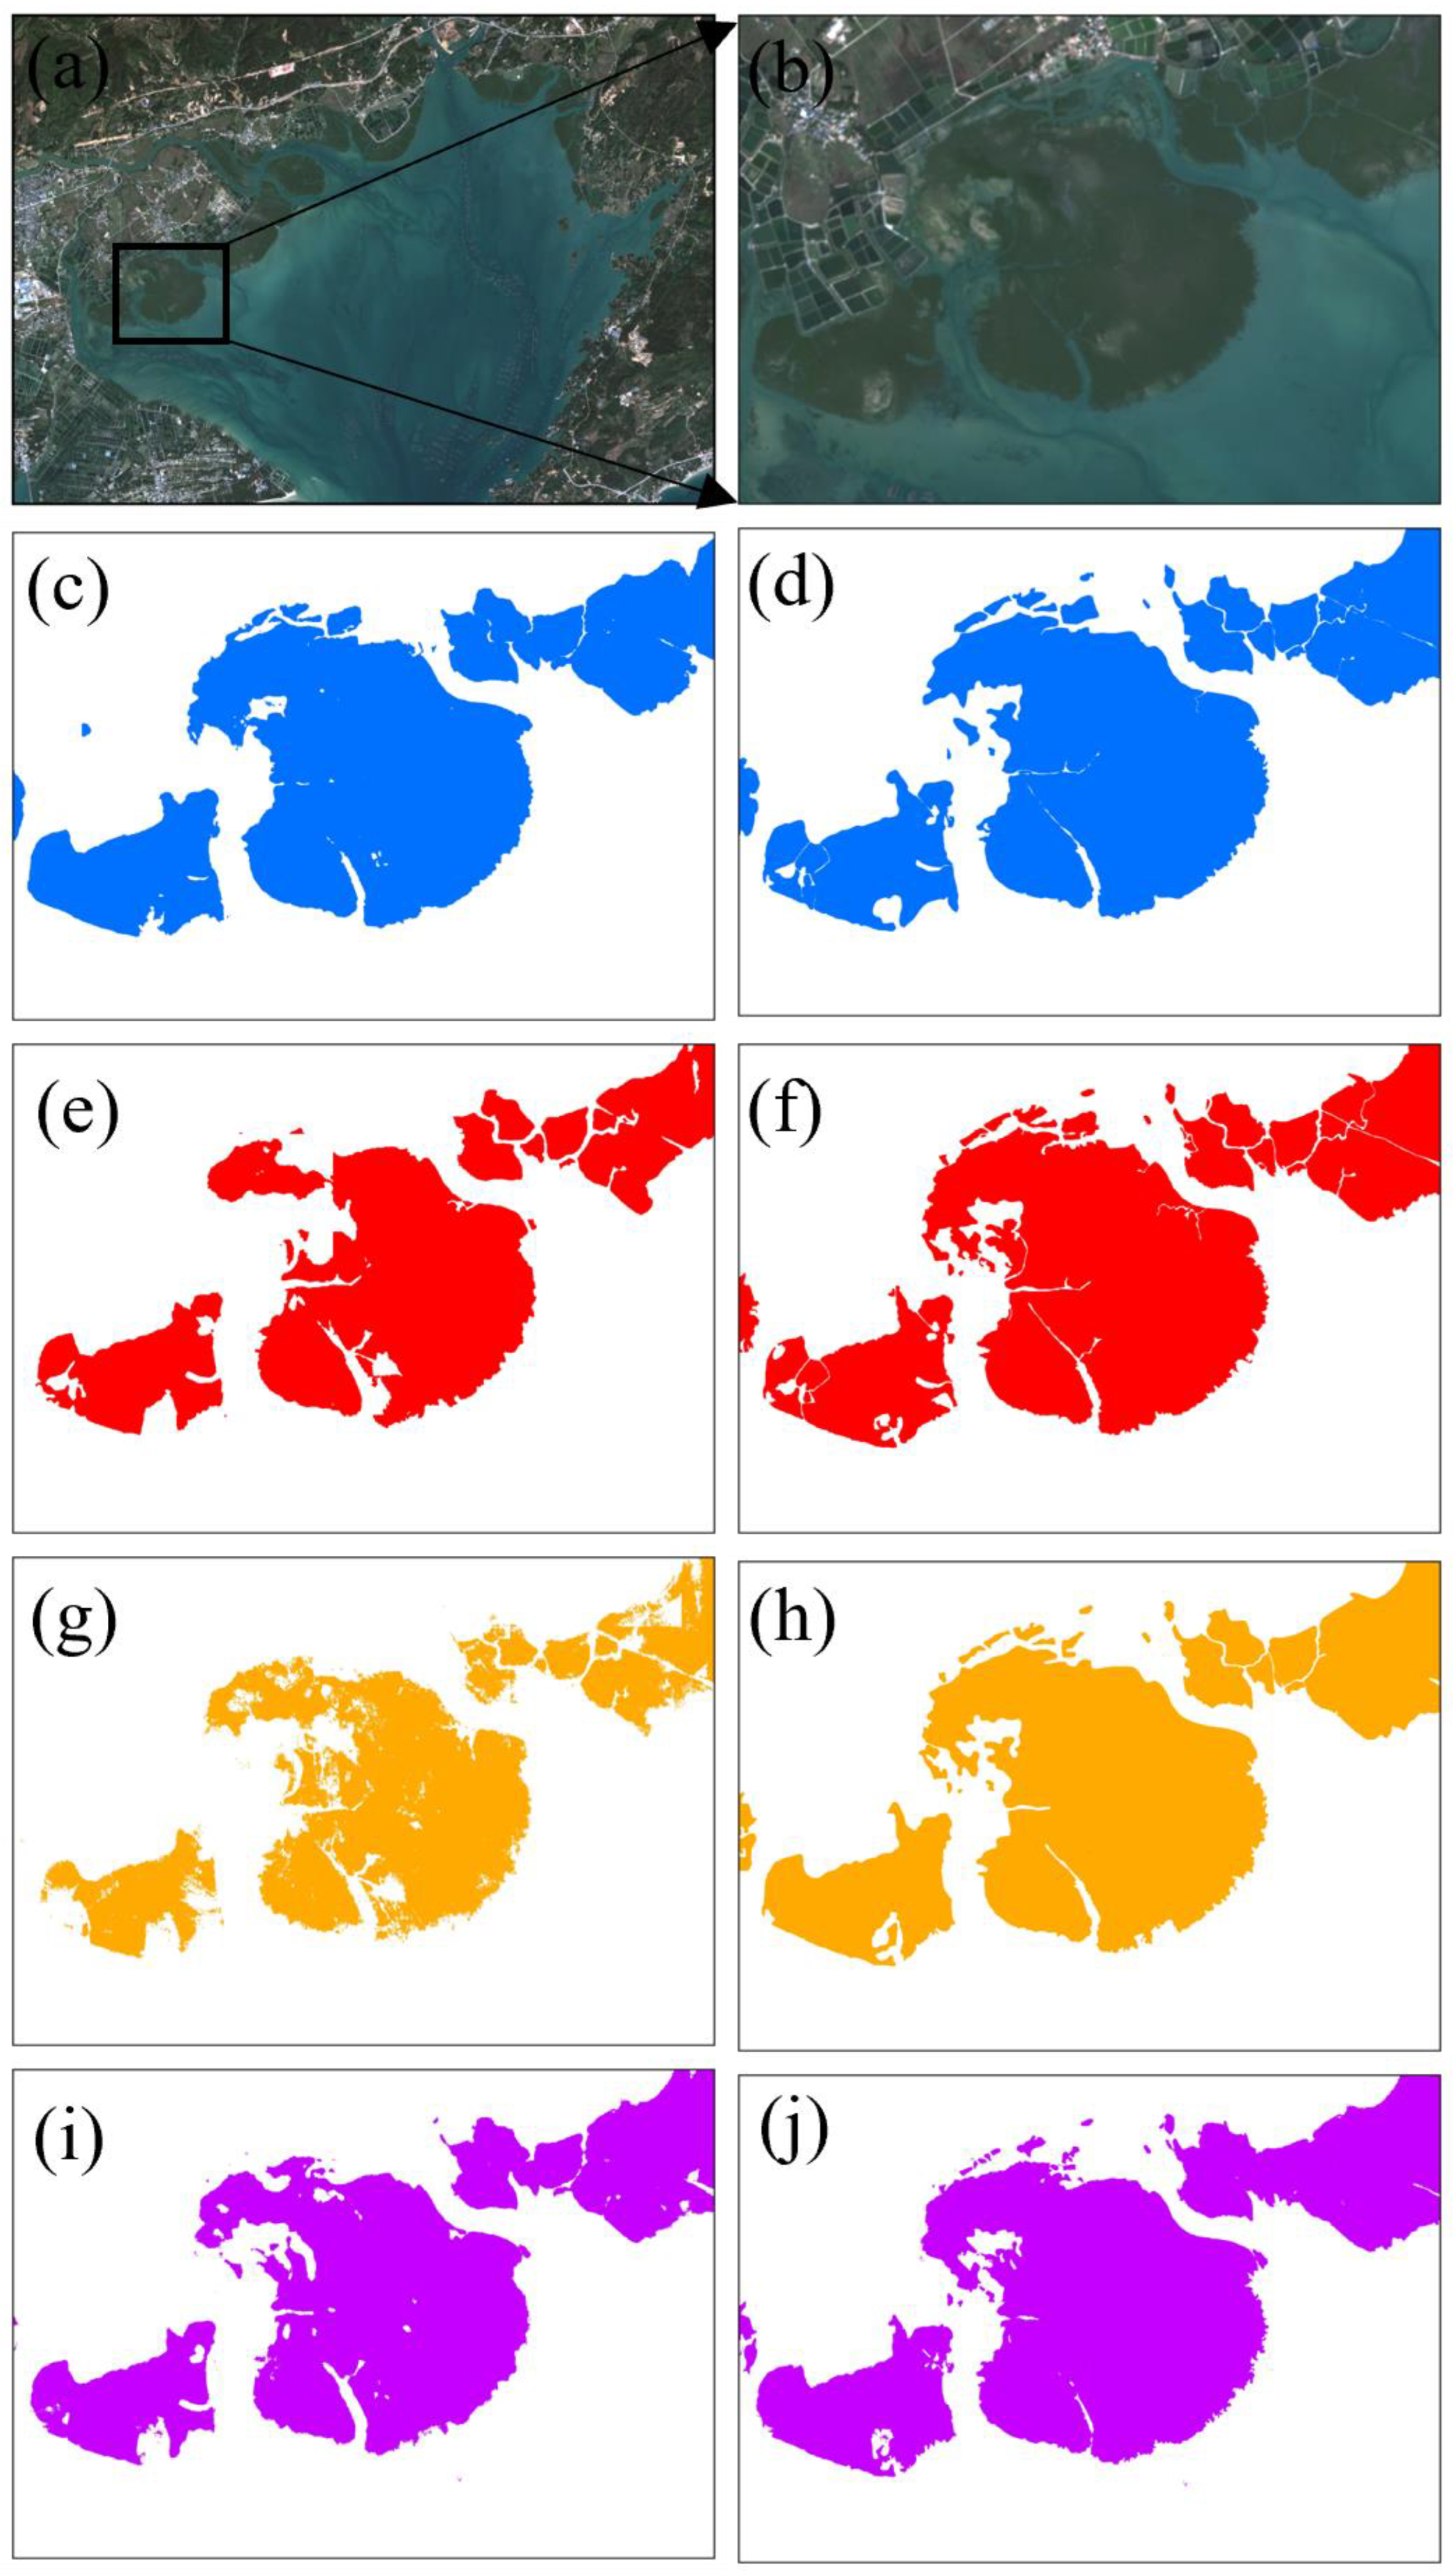
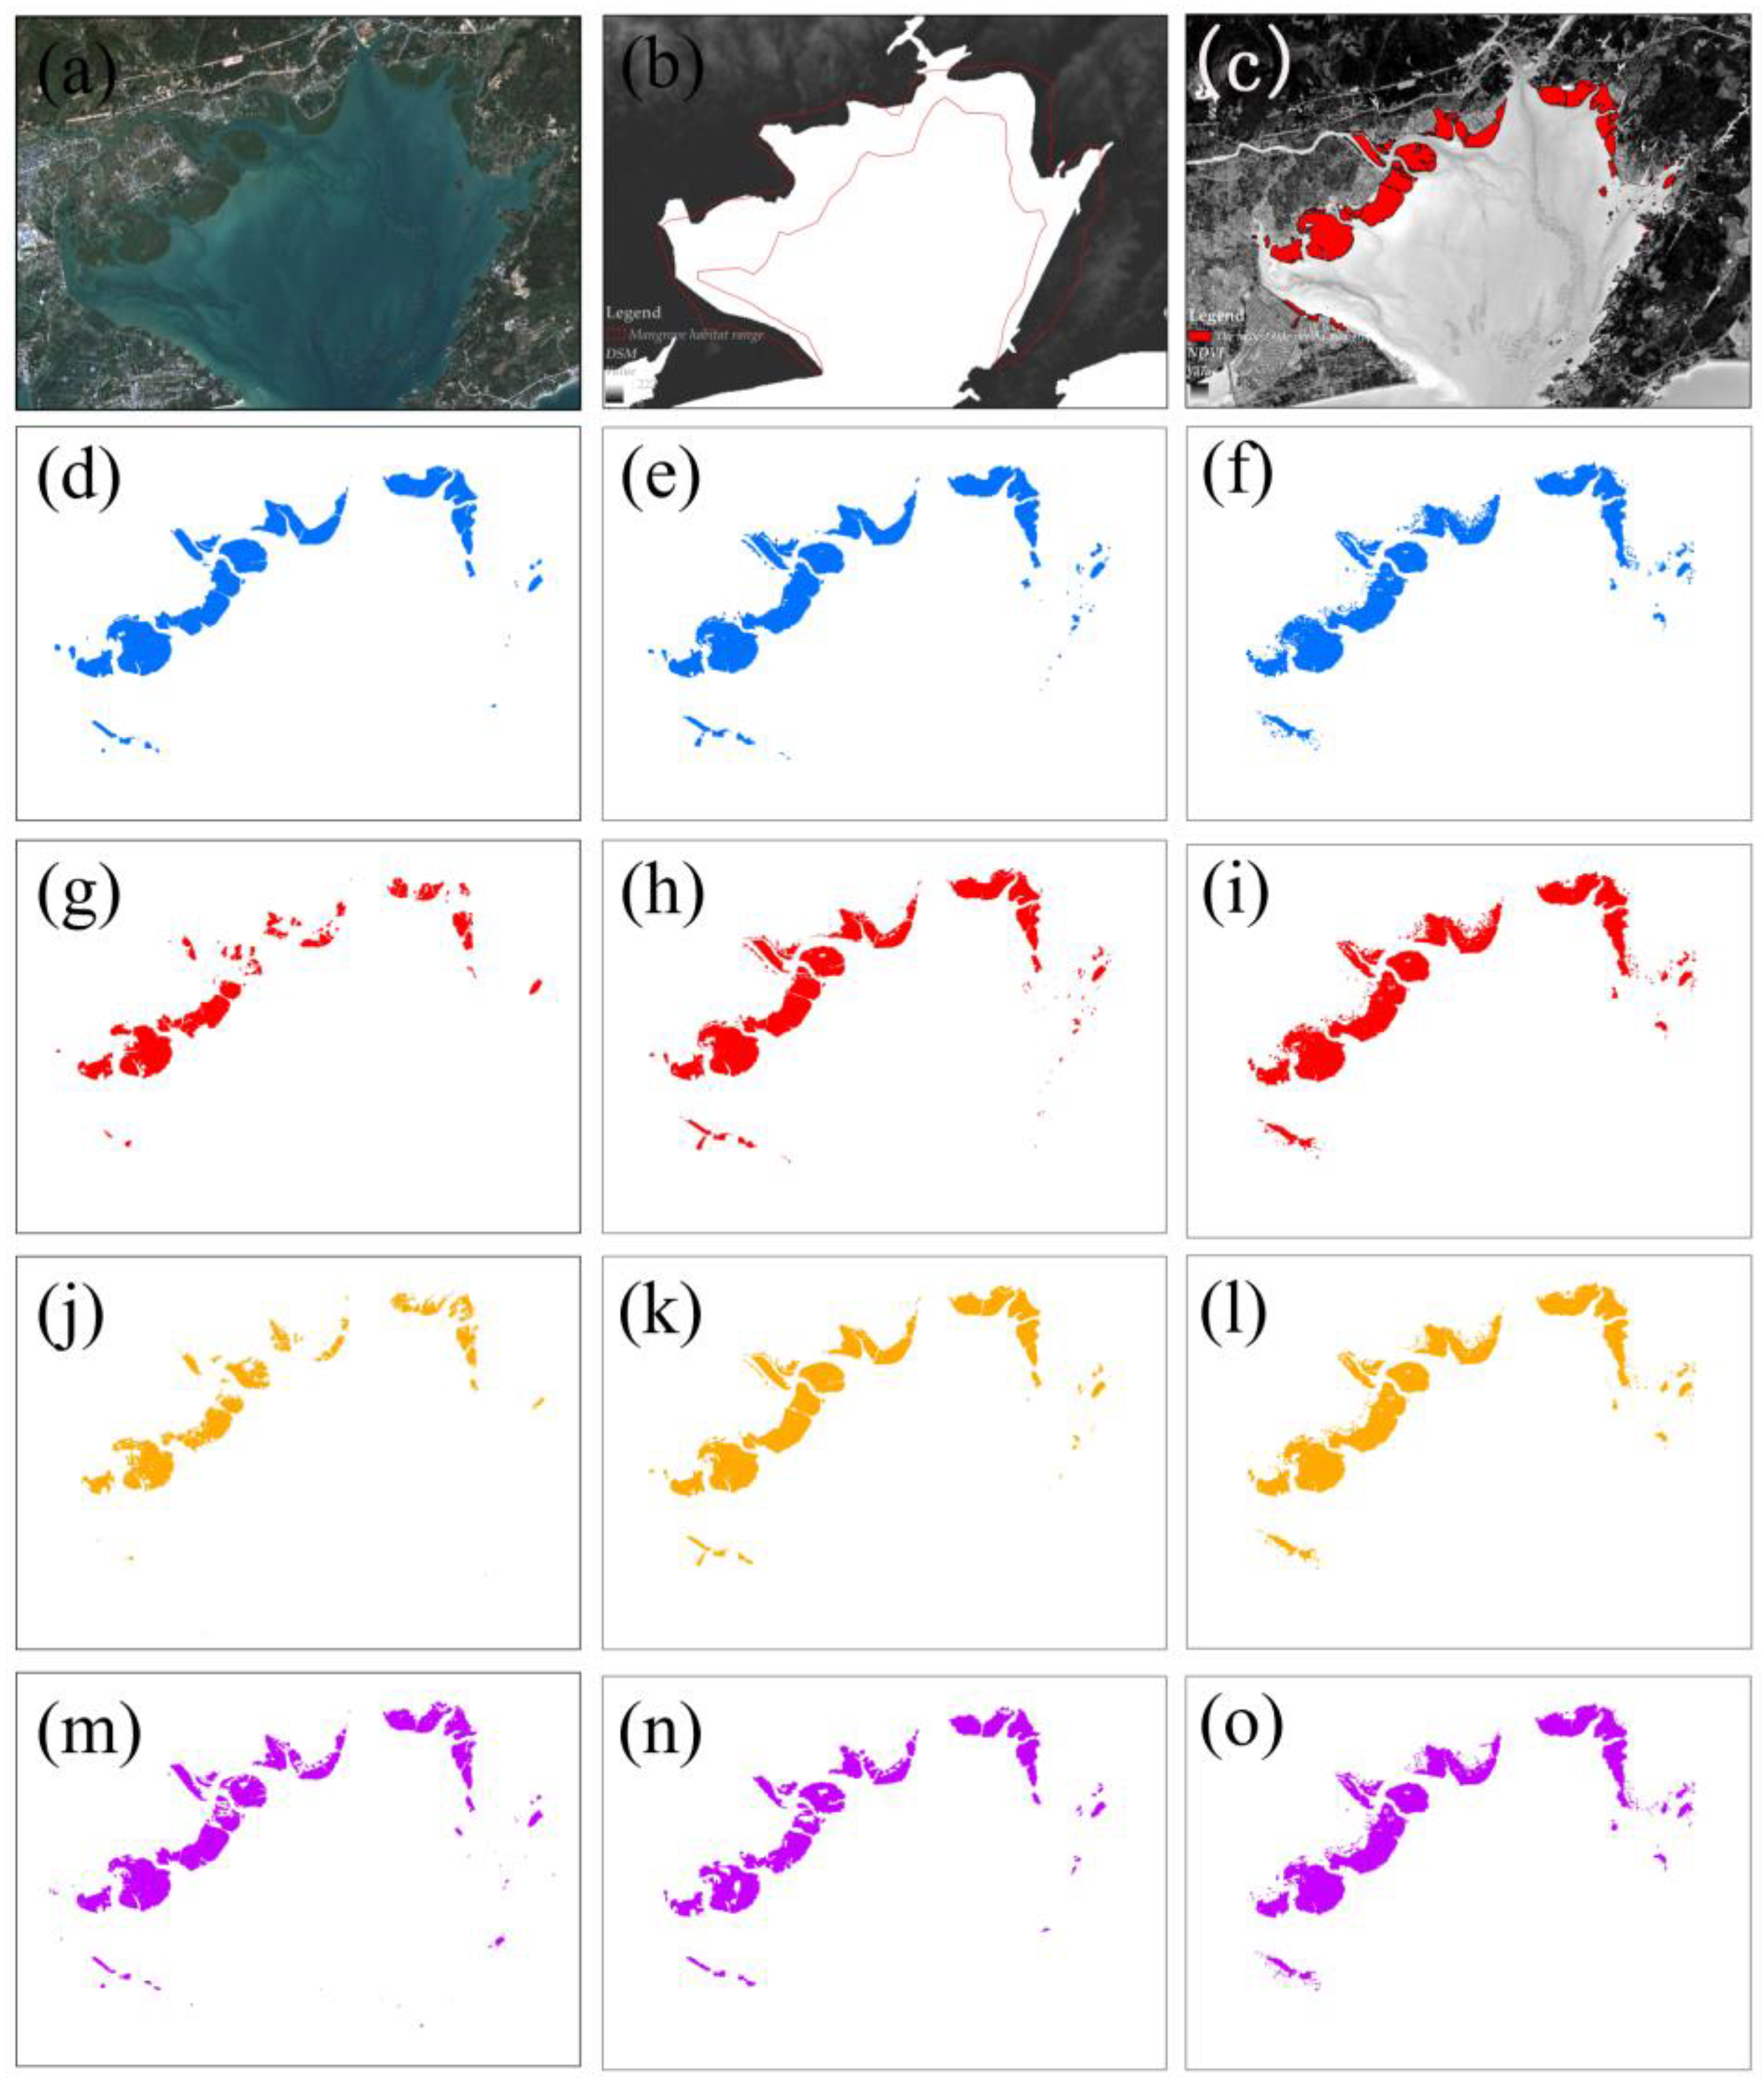
4.3. Multilevel Interactive Verification of Mangrove Extraction

To further validate and confirm the reliability of the mangrove extraction results, this study employed a multilevel interactive interpretation approach on remote sensing imagery to extract mangrove information. The extracted results were then compared with the findings of this study. In the context of multilevel interactive verification of mangrove extraction, multiple experts collaborated to review and validate the extracted mangrove maps (Figure 6). (A comparison of the results of hybrid U-Net extraction of mangroves with multi-person interactive validation for DFJ and TSG is shown in the Supplementary Materials (Figures S3 and S4)). The key steps involved in this interactive verification process included data sharing, a collaboration platform, comparative analysis, discussion and consensus, expert guidance, and iterative refinement. The verification process was carried out independently to ensure unbiased results.

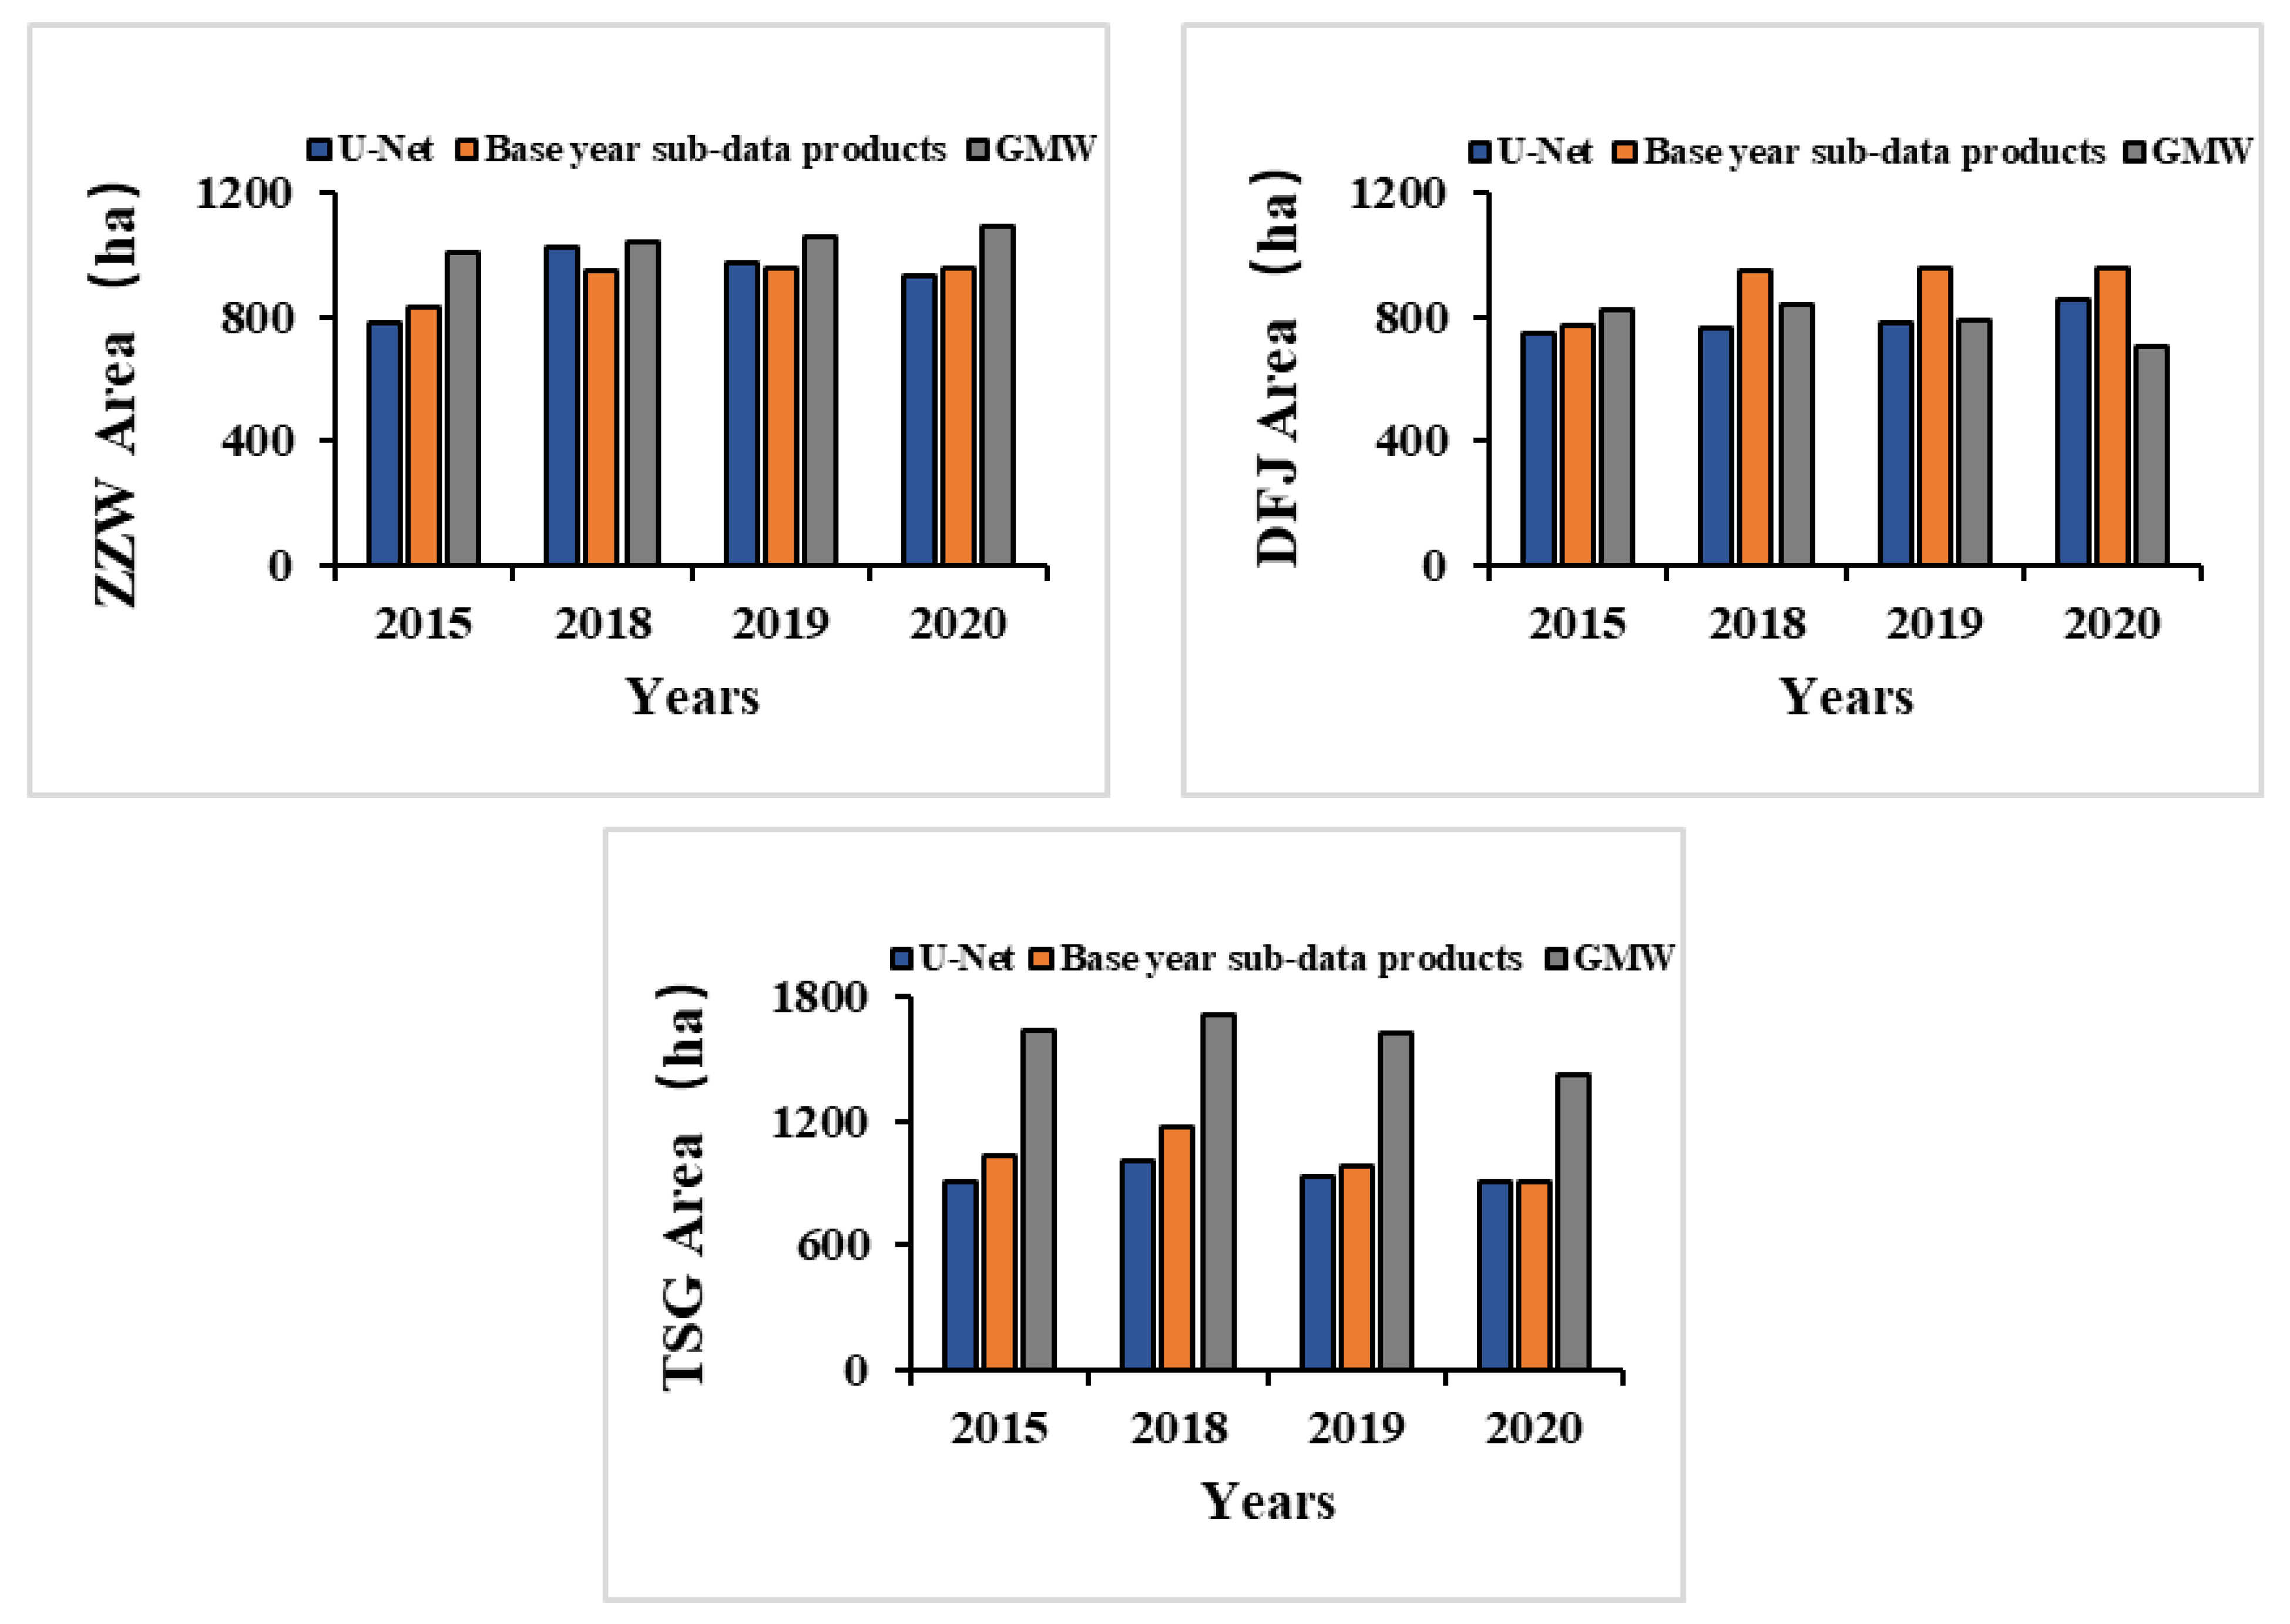
4.4. Evaluation of the Hybrid U-Net Model with Existing Data Products

We compared the model results with the baseline years of the existing dataset separately (Figure 7 and Figure 8). Overall, the results of this study were more consistent with the 2/10 m resolution dataset, and in some areas, the results of this study were more reliable compared with the existing dataset, especially in the extraction of sparse and low-growth young forests and narrow mangrove belts along embankments (Figure 7 and Figure 8). (The hybrid U-Net mangrove extraction results compared with existing data products for DFJ and TSG are shown in the Supplementary Materials (Figures S5 and S6)). In our Supplementary Materials, more details on the comparison are provided (Figure S7).
The 10/30 m data product did not provide sufficient detailed spatial information. Factors such as the spatial resolution of remote sensing images, tidal inundation, and information extraction strategies can affect the accuracy of mangrove extraction. Previous studies have shown that the area error measured with remote sensing images increases gradually with improvements in spatial resolution [55]. Therefore, for narrow and fragmented mangrove areas, the extraction effect of medium-to-low-resolution remote sensing images is poor.
According to the base year sub-data products, the average area values of mangroves in ZZW, DFJ, and TSG were 927.36 ha, 787.55 ha, and 941.58 ha, respectively (Figure 7 and Figure 8 and Table S1). Among them, ZZW and TSG showed a trend of first increasing and then decreasing in mangrove area at the four time points, while the mangrove area in DFJ showed a continuous increasing trend. From 2015 to 2020, the overall mangrove area in ZZW increased by 147.79 ha (18.9%), and that in DFJ increased by 104.66 ha (13.94%), while the mangrove area in TSG remained almost unchanged.
A comparison with 10/30 m data products in this study revealed significant differences in the changes in mangrove area in TSG and ZZW for 30 m data products. The large discrepancy of 693.96 ha in TSG from 2018 (30 m reference) may be because China has many small mangrove patches, as well as narrow mangroves along levees, which were not captured by the 30 m resolution product due to the lack of fine-scale information and different pixel sizes. In contrast, this study’s results exhibit better performance in terms of extracting more detailed mangrove patches. In addition, differences in some areas may be due to different methods used for image acquisition and mangrove mapping in different years. From the time series of different mangrove datasets in Table S1, it can be seen that China’s mangrove area has remained stable since 2015, with fluctuations in some regions, which is consistent with the results of [13]. The results of this study were generated using 2 m high-resolution images, with smooth edges of patches and complete structures of small patches. In contrast, the mangrove patches in the other five datasets showed serious saw-toothed edge effects and insufficient accuracy for small patches.
The results of this study are closer to the 10 m product in terms of mangrove area. Considering the pixel scale effect, the 2 m resolution result should be smaller than the 10 m resolution, which is consistent with the results of this study. For the Pearl River Estuary, where there are mainly large independent mangroves, the differences between the three products were not significant. For TSG and DFJ, there are narrow mangrove belts along the embankments and large independent mangroves. From a spatial perspective, the 10/30 m data have significant omissions for such mangroves. Considering the influence of the scale effect, although the overall changes in the mangrove area for DFJ among the three datasets are not significant, the 2/10 m results are much better than the 30 m result in terms of spatial information. For DFJ, the inversion of the western mangroves using 10/30 m data is disastrous, while the 2 m data can clearly show the spatial distribution of the western mangroves in DFJ.

5. Discussion

5.1. Stability of the Hybrid U-Net Network Performance

This article proposes an integrated spatial, temporal, and methodological (hybrid U-Net model) optimization for mangrove extraction. In this study, the spatial resolution of the mangroves extracted is 2 m, allowing for the capture of finer mangrove patches, especially small and narrow ones. Mangroves are primarily found near estuaries, and small and narrow mangrove patches are quite common. This study enhances the quality of training samples based on mangrove habitat and tidal information, utilizing a semantic segmentation model like U-Net that requires only one year of samples to map mangroves for multiple years. Compared with other machine learning methods that require repeated acquisition of stable samples, this approach enables rapid detection of mangrove changes.
The output of the hybrid U-Net network model has only two categories, mangrove and non-mangrove, making it a binary classification model. Compared with other models, this approach takes into account the potential growth areas of mangroves and the impact of tides on mangrove extraction, and combines the advantages of semantic segmentation models (reducing dependence on samples). This method is more suitable for large-scale mangrove extraction tasks [56]. Additionally, the combination of GF and ZY series satellite sensors compensates for the shortcomings of individual satellite image information, ensuring high-resolution mapping at a 2 m spatial resolution.
The Hybrid U-Net network model has three unique advantages in fine-scale mangrove mapping: (1) It excludes non-vegetation cover before mangrove extraction, avoiding the impact of non-vegetation on sparse mangroves and saving post-processing work; (2) It utilizes vegetation indices to determine the low tide moments, ensuring the accuracy of extracting the maximum extent of mangroves; (3) The Hybrid U-Net model requires only one year of samples for training and the training model can be applied to infer mangroves for other years within the same area. This reduces the traditional deep learning models’ reliance on samples.

5.2. Advantages of High-Resolution Data Extraction for Mangrove Mapping

Currently, most of the published mangrove distribution datasets use medium-resolution satellite data with a spatial resolution of 30 m or synthetic aperture radar data at the L-band with a resolution of 25 m (Figure 9). In these medium-resolution images, the vegetation texture and spatial details are missing, leading to limitations in accurately identifying mangrove forests. In addition, small and irregularly shaped mangrove areas are difficult to accurately identify and extract.
This study uses satellite remote sensing images with a resolution of 2 m from GF and ZY series sensors for mangrove mapping. The finer spatial resolution allows for the delineation of small and scattered mangrove patches and narrow strips along the coastline. This is particularly important for mangrove mapping in China. There are numerous small and narrow patches of mangroves in China. Young plants that were newly planted but not forested were not included in existing dataset [23]. The use of high-spatial-resolution remote sensing images enables the extraction of more detailed mangrove distributions at a finer spatial scale and allows for rapid detection of subtle changes in the information. A detailed understanding of the distribution of and changes in these mangroves is of great significance for allowing local management authorities to carry out mangrove ecological protection and restoration and to coordinate coastal economic development with ecological protection.

5.3. The Limitations of the Hybrid U-Net Network Model

In general, remote sensing-based surveys of mangrove forests only include areas with a tree crown density of 20% or more [23]. Seedlings and mangrove forests with an area of less than 4 m2 are currently unable to be extracted due to the limitations in sensor accuracy, which may result in an underestimation of model results compared with actual conditions.
There are other types of vegetation growing on the tidal flats where mangrove forests grow along the coast of the Beibu Gulf in Guangxi, China. These vegetation types are easily confused with mangrove forests in image interpretation. The most common types of vegetation are Spartina alterniflora and reeds (Figure 10) [51]. Many studies have provided evidence that Spartina alterniflora can entirely supplant mangrove forests within a short span of 1 to 5 years [60]. The latest research indicates that the invasion of Spartina alterniflora threatens the survival and reproduction of mangroves, as Spartina alterniflora inhibits the growth and expansion of mangroves [20,61]. There is spectral confusion between Spartina alterniflora and mangroves, which may lead to an overestimation of mangrove areas by the hybrid U-Net [62]. In future research, it will be possible to improve the accuracy of mangrove mapping further by overlaying thematic maps of misclassified species.

6. Conclusions

This paper presents a spatial–temporal method optimization approach (hybrid U-Net) based on mangrove habitats, low tide, and semantic segmentation models to address challenges in satellite remote sensing of mangrove wetlands, including spectral similarity confusion, tidal uncertainty, and difficulties in obtaining stable samples. The paper demonstrates the advantages of combining tidal water levels and mangrove habitat information in mangrove extraction and mapping.
The hybrid U-Net model overcomes the dependency of traditional machine learning algorithms on large sample datasets. The use of mangrove habitats and low-tide periods helps reduce the interference of surrounding vegetation in the extraction of the mangroves. This method was applied to extract mangroves in three typical areas of the Beibu Gulf in 2015, 2018, 2019, and 2020. This method is less sample-dependent and more accurate and is more suitable for the rapid detection of subtle changes in large-scale mangroves. The results of the hybrid U-Net model were reliable for extracting sparse, slow-growing young mangroves and narrow mangrove strips along roadsides.
Future research will focus on using one or a set of indicators or rules to approximate classification results, attempting to reduce the impact of spectral uncertainty on model accuracy under different climatic conditions. This high-precision mangrove extraction method will provide an important basis for refined calculations and assessments of mangrove ecosystem changes, mangrove species classification, marine ecosystem management, blue carbon restoration, and biodiversity protection in the future.

Supplementary Materials

The following supporting information can be downloaded at https://www.mdpi.com/article/10.3390/rs15225271/s1. (Figure S1. The Hybrid U-Net result of DFJ at the Beibu Gulf. (a, b) The satellite image of mangrove area in 2021, (c) Mangrove habitat information, (d) Low tide level acquisition, (e) The Hybrid U-Net result in 2020, (f) The Hybrid U-Net result in 2019, (g) The Hybrid U-Net result in 2018, (h) The Hybrid U-Net result in 2015, Figure S2. The Hybrid U-Net result of TSG at the Beibu Gulf. (a, b) The satellite image of mangrove area in 2021, (c) Mangrove habitat information, (d) Low tide level acquisition, (e) The Hybrid U-Net result in 2020, (f) The Hybrid U-Net result in 2019, (g) The Hybrid U-Net result in 2018, (h) The Hybrid U-Net result in 2015. Figure S3: Comparison of the results of hybrid U-Net extraction of mangroves with multi-person interactive validation at DFJ: (a, b) The satellite image of mangrove area at DFJ in 2021 October, (c, e, g, I) The Hybrid U-Net result in 2020, 2019, 2018, 2015. (d, f, h, j) Multiplayer interactive validation in 2020, 2019, 2018, 2015. Figure S4. Comparison of the results of hybrid U-Net extraction of mangroves with multi-person interactive validation at TSG: (a, b) The satellite image of mangrove area at TSG in 2021 February, (c, e, g, I) The Hybrid U-Net result in 2020, 2019, 2018, 2015. (d, f, h, j) Multiplayer interactive validation in 2020, 2019, 2018, 2015. Figure S5. Hybrid U-Net extract mangrove results compare with existing data products. (a) The satellite image of mangrove area at DFJ, (b) Mangrove habitat information, (c) Low tide level acquisition, (d, g, j, m) The Hybrid U-Net result in 2020, 2019, 2018, 2015, (f, I, l, o) The Global Mangrove Watch (GMW) in 2020, 2019, 2018, 2015, (e) LREIS in 2020, (h) TW in 2019, (k) MCina in 2018, (n) CAS in 2015. Figure S6. Hybrid U-Net extract mangrove results compare with existing data products. (a) The satellite image of mangrove area at TSG, (b) Mangrove habitat information, (c) Low tide level acquisition, (d, g, j, m) The Hybrid U-Net result in 2020, 2019, 2018, 2015, (f, I, l, o) The Global Mangrove Watch (GMW) in 2020, 2019, 2018, 2015, (e) LREIS in 2020, (h) TW in 2019, (k) MCina in 2018, (n) CAS in 2015. Figure S7. Hybrid U-Net extract mangrove results compare with existing data products. (TSG details). (a) The GF-1 satellite image(2m) of mangrove area at TSG, (b) The GF-1 satellite image(2m) of mangrove area at TSG (details), (c) The Sentinal-2 satellite image(10m) of mangrove area at TSG (details), (d) The Landsat 8 OLI satellite image(30m) of mangrove area at TSG (details), (e, h, k, n) The Hybrid U-Net result in 2020, 2019, 2018, 2015, (g, j, m, p), The Global Mangrove Watch (GMW) in 2020, 2019, 2018, 2015, (f) LREIS in 2020, (i) TW in 2019, (l) MCina in 2018, (o) CAS in 2015. Table S1. Areal changes (ha) of mangrove forest with hybrid U-Net in the ZZW, DFJ, and TSG area for the 2015, 2018, 2019, 2020 with the base year sub-data products.)

Author Contributions

Z.S.: conceptualization, methodology, software, investigation, formal analysis, writing—original draft. W.J.: Conceptualization, funding acquisition, resources, data curation, investigation, writing—review and editing, supervision. Z.L.: funding acquisition, supervision. S.Z.: resources, investigation. Z.Z.: visualization, supervision. J.S.: validation, supervision. Z.X.: writing—review and editing. All authors have read and agreed to the published version of the manuscript.

Funding

This work was supported by the National Natural Science Foundation of China under grant no. U21A2022, grant no. 42101369, and grant no. 2023GXNSFBA026278. We also appreciate the anonymous reviewers for their comments and suggestions, which helped to improve the quality of this manuscript.

Data Availability Statement

The data presented in this study are available on request from the corresponding author. The mangrove datasets can be downloaded at https://zenodo.org/record/8041161, accessed on 26 October 2022.

Conflicts of Interest

The authors declare no conflict of interest.

References

  1. Morris, R.L.; Fest, B.; Stokes, D.; Jenkins, C.; Swearer, S.E. The coastal protection and blue carbon benefits of hybrid mangrove living shorelines. J. Environ. Manag. 2023, 331, 117310. [Google Scholar] [CrossRef] [PubMed]
  2. Shahbudin, S.; Zuhairi, A.; Kamaruzzaman, B.Y. Impact of coastal development on mangrove cover in Kilim river, Langkawi Island, Malaysia. J. For. Res. 2011, 23, 185–190. [Google Scholar] [CrossRef]
  3. Zhou, H.Z.; Wang, J.F.; Jiang, H.M.; Cai, Z.X.; Tang, G.H.; Ding, S.; Liu, S.T.; Xu, Z.M. Distribution fractions and potential ecological risk assessment of heavy metals in mangrove sediments of the Greater Bay Area. Environ. Sci. Pollut. Res. 2023, 30, 45859–45871. [Google Scholar] [CrossRef] [PubMed]
  4. Giri, C.; Long, J.; Abbas, S.; Murali, R.M.; Qamer, F.M.; Pengra, B.; Thau, D. Distribution and dynamics of mangrove forests of South Asia. J. Environ. Manag. 2015, 148, 101–111. [Google Scholar] [CrossRef]
  5. Uddin, M.M.; Aziz, A.A.; Lovelock, C.E. Importance of mangrove plantations for climate change mitigation in Bangladesh. Glob. Chang. Biol. 2023, 29, 3331–3346. [Google Scholar] [CrossRef]
  6. Pham, T.D.; Xia, J.; Ha, N.T.; Bui, D.T.; Le, N.N.; Tekeuchi, W. A Review of Remote Sensing Approaches for Monitoring Blue Carbon Ecosystems: Mangroves, Seagrasses and Salt Marshes during 2010–2018. Sensors 2019, 19, 1933. [Google Scholar] [CrossRef]
  7. Tang, W.; Zheng, M.; Zhao, X.; Shi, J.; Yang, J.; Trettin, C. Big Geospatial Data Analytics for Global Mangrove Biomass and Carbon Estimation. Sustainability 2018, 10, 472. [Google Scholar] [CrossRef]
  8. Come, J.; Peer, N.; Nhamussua, J.L.; Miranda, N.A.; Macamo, C.C.; Cabral, A.S.; Madivadua, H.; Zacarias, D.; Narciso, J.; Snow, B. A socio-ecological survey in Inhambane Bay mangrove ecosystems: Biodiversity, livelihoods, and conservation. Ocean Coast. Manag. 2023, 244, 106813. [Google Scholar] [CrossRef]
  9. Rull, V. Rise and fall of Caribbean mangroves. Sci. Total Environ. 2023, 885, 163851. [Google Scholar] [CrossRef]
  10. Malik, A.; Fensholt, R.; Mertz, O. Mangrove exploitation effects on biodiversity and ecosystem services. Biodivers. Conserv. 2015, 24, 3543–3557. [Google Scholar] [CrossRef]
  11. Wang, L.; Jia, M.; Yin, D.; Tian, J. A review of remote sensing for mangrove forests: 1956–2018. Remote Sens. Environ. 2019, 231, 111223. [Google Scholar] [CrossRef]
  12. Goldberg, L.; Lagomasino, D.; Thomas, N.; Fatoyinbo, T. Global declines in human-driven mangrove loss. Glob. Chang. Biol. 2020, 26, 5844–5855. [Google Scholar] [CrossRef] [PubMed]
  13. Jia, M.; Wang, Z.; Zhang, Y.; Mao, D.; Wang, C. Monitoring loss and recovery of mangrove forests during 42 years: The achievements of mangrove conservation in China. Int. J. Appl. Earth Obs. Geoinf. 2018, 73, 535–545. [Google Scholar] [CrossRef]
  14. Su, J.; Friess, D.A.; Gasparatos, A. A meta-analysis of the ecological and economic outcomes of mangrove restoration. Nat. Commun. 2021, 12, 5050. [Google Scholar] [CrossRef] [PubMed]
  15. Bunting, P.; Rosenqvist, A.; Hilarides, L.; Lucas, R.M.; Thomas, N. Global Mangrove Watch: Updated 2010 Mangrove Forest Extent (v2.5). Remote Sens. 2022, 14, 1034. [Google Scholar] [CrossRef]
  16. Lymburner, L.; Bunting, P.; Lucas, R.; Scarth, P.; Alam, I.; Phillips, C.; Ticehurst, C.; Held, A. Mapping the multi-decadal mangrove dynamics of the Australian coastline. Remote Sens. Environ. 2020, 238, 111185. [Google Scholar] [CrossRef]
  17. Fu, B.L.; Liang, Y.Y.; Lao, Z.A.; Sun, X.D.; Li, S.Z.; He, H.C.; Sun, W.W.; Fan, D.L. Quantifying scattering characteristics of mangrove species from Optuna-based optimal machine learning classification using multi-scale feature selection and SAR image time series. Int. J. Appl. Earth Obs. Geoinf. 2023, 122, 103446. [Google Scholar] [CrossRef]
  18. Zhao, C.; Qin, C.-Z. 10-m-resolution mangrove maps of China derived from multi-source and multi-temporal satellite observations. ISPRS J. Photogramm. Remote Sens. 2020, 169, 389–405. [Google Scholar] [CrossRef]
  19. Xia, Q.; Qin, C.Z.; Li, H.; Huang, C.; Su, F.Z.; Jia, M.M. Evaluation of submerged mangrove recognition index using multi-tidal remote sensing data. Ecol. Indic. 2020, 113, 106196. [Google Scholar] [CrossRef]
  20. Zhu, B.; Liao, J.; Shen, G. Combining time series and land cover data for analyzing spatio-temporal changes in mangrove forests: A case study of Qinglangang Nature Reserve, Hainan, China. Ecol. Indic. 2021, 131, 108135. [Google Scholar] [CrossRef]
  21. Cao, J.; Liu, K.; Zhuo, L.; Liu, L.; Zhu, Y.; Peng, L. Combining UAV-based hyperspectral and LiDAR data for mangrove species classification using the rotation forest algorithm. Int. J. Appl. Earth Obs. Geoinf. 2021, 102, 102414. [Google Scholar] [CrossRef]
  22. Zhao, D.M.; Zhen, J.N.; Zhang, Y.H.; Miao, J.; Shen, Z.; Jiang, X.P.; Wang, J.J.; Jiang, J.C.; Tang, Y.Z.; Wu, G.F. Mapping mangrove leaf area index (LAI) by combining remote sensing images with PROSAIL-D and XGBoost methods. Remote Sens. Ecol. Conserv. 2023, 9, 370–389. [Google Scholar] [CrossRef]
  23. Zhang, T.; Hu, S.; He, Y.; You, S.; Yang, X.; Gan, Y.; Liu, A. A Fine-Scale Mangrove Map of China Derived from 2-Meter Resolution Satellite Observations and Field Data. ISPRS Int. J. Geo-Inf. 2021, 10, 92. [Google Scholar] [CrossRef]
  24. Su, X.; Geng, J.; Ma, X.; Wang, H.; Wang, X. Mangrove species classification based on multiple vegetation index extraction and joint sparse representation. Mar. Environ. Sci. 2017, 36, 114–120. [Google Scholar]
  25. Zhen, J.; Liao, J.; Shen, G. Remote Sensing Monitoring and Analysis on the Dynamics of Mangrove Forests in Qinglan Habor of Hainan Province since 1987. Wetl. Sci. 2019, 17, 44–51. [Google Scholar]
  26. Mondal, P.; Liu, X.; Fatoyinbo, T.E.; Lagomasino, D. Evaluating Combinations of Sentinel-2 Data and Machine-Learning Algorithms for Mangrove Mapping in West Africa. Remote Sens. 2019, 11, 2928. [Google Scholar] [CrossRef]
  27. Sheykhmousa, M.; Mahdianpari, M.; Ghanbari, H.; Mohammadimanesh, F.; Ghamisi, P.; Homayouni, S. Support Vector Machine Versus Random Forest for Remote Sensing Image Classification: A Meta-Analysis and Systematic Review. IEEE J. Sel. Top. Appl. Earth Obs. Remote Sens. 2020, 13, 6308–6325. [Google Scholar] [CrossRef]
  28. Belgiu, M.; Dragut, L. Random forest in remote sensing: A review of applications and future directions. ISPRS J. Photogramm. Remote Sens. 2016, 114, 24–31. [Google Scholar] [CrossRef]
  29. Tsai, Y.L.S. Monitoring 23-year of shoreline changes of the Zengwun Estuary in Southern Taiwan using time-series Landsat data and edge detection techniques. Sci. Total Environ. 2022, 839, 156310. [Google Scholar] [CrossRef]
  30. Iovan, C.; Kulbicki, M.; Mermet, E. Deep convolutional neural network for mangrove mapping. In Proceedings of the IEEE International Geoscience and Remote Sensing Symposium (IGARSS), Waikoloa, HI, USA, 26 September–2 October 2020; pp. 1969–1972. [Google Scholar]
  31. Guo, M.Q.; Yu, Z.Y.; Xu, Y.Y.; Huang, Y.; Li, C.F. ME-Net: A Deep Convolutional Neural Network for Extracting Mangrove Using Sentinel-2A Data. Remote Sens. 2021, 13, 1292. [Google Scholar] [CrossRef]
  32. Kalinaki, K.; Malik, O.A.; Lai, D.T.C. FCD-AttResU-Net: An improved forest change detection in Sentinel-2 satellite images using attention residual U-Net. Int. J. Appl. Earth Obs. Geoinf. 2023, 122, 103453. [Google Scholar] [CrossRef]
  33. Guo, Y.; Liao, J.; Shen, G. Mapping Large-Scale Mangroves along the Maritime Silk Road from 1990 to 2015 Using a Novel Deep Learning Model and Landsat Data. Remote Sens. 2021, 13, 245. [Google Scholar] [CrossRef]
  34. Cao, K.L.; Zhang, X.L. An Improved Res-UNet Model for Tree Species Classification Using Airborne High-Resolution Images. Remote Sens. 2020, 12, 1128. [Google Scholar] [CrossRef]
  35. Dong, Y.; Yu, K.; Hu, W. GC-UNet: An Improved UNet Model for Mangrove Segmentation Using Landsat8. In Proceedings of the 2021 3rd International Conference on Big Data Engineering, New York, NY, USA, 29–31 May 2021. [Google Scholar]
  36. Hu, L.; Li, W.; Xu, B. Monitoring mangrove forest change in China from 1990 to 2015 using Landsat-derived spectral-temporal variability metrics. Int. J. Appl. Earth Obs. Geoinf. 2018, 73, 88–98. [Google Scholar] [CrossRef]
  37. Li, L.; Liu, W.a. Dynamic changes of mangrove wetland landscape pattern in Lianzhou gulf of Guangxi and its causes. J. For. Environ. 2018, 38, 171–177. [Google Scholar]
  38. Tian, Q.J.; Li, S.S. Mangrove Recognition and Extraction Using Multispectral Remote Sensing Data in Beibu Gulf. In Proceedings of the Conference on Multispectral, Hyperspectral, and Ultraspectral Remote Sensing Technology, Techniques and Applications VII, Honolulu, HI, USA, 24–26 September 2018. [Google Scholar]
  39. Tao, Z.; Shucheng, Y.; Xiaomei, Y.; Shanshan, H. Mangroves Map of China 2018 (MC2018) Derived from 2-Meter Resolution Satellite Observations and Field Data; Science Data Bank: Beijing, China, 2020. [Google Scholar] [CrossRef]
  40. Zhang, Y.; Mishra, R.K. A review and comparison of commercially available pan-sharpening techniques for high resolution satellite image fusion. In Proceedings of the IEEE International Geoscience and Remote Sensing Symposium (IGARSS), Munich, Germany, 22–27 July 2012; pp. 182–185. [Google Scholar]
  41. You, N.; Dong, J.; Huang, J.; Du, G.; Zhang, G.; He, Y.; Yang, T.; Di, Y.; Xiao, X. The 10-m crop type maps in Northeast China during 2017–2019. Sci. Data 2021, 8, 41. [Google Scholar] [CrossRef] [PubMed]
  42. Liao, B.; Zhang, Q. Area, Distribution and Species Composition of Mangroves in China. Wetl. Sci. 2014, 12, 435–440. [Google Scholar]
  43. Zhang, Z.; Xu, N.; Li, Y.; Li, Y. Sub-continental-scale mapping of tidal wetland composition for East Asia: A novel algorithm integrating satellite tide-level and phenological features. Remote Sens. Environ. 2022, 269, 112799. [Google Scholar] [CrossRef]
  44. Zhao, C.; Qin, C.-Z.; Teng, J. Mapping large-area tidal flats without the dependence on tidal elevations: A case study of Southern China. ISPRS J. Photogramm. Remote Sens. 2020, 159, 256–270. [Google Scholar] [CrossRef]
  45. Wang, L.; Li, R.; Zhang, C.; Fang, S.; Duan, C.; Meng, X.; Atkinson, P.M. UNetFormer: A UNet-like transformer for efficient semantic segmentation of remote sensing urban scene imagery. ISPRS J. Photogramm. Remote Sens. 2022, 190, 196–214. [Google Scholar] [CrossRef]
  46. Chaurasia, A.; Culurciello, E. LinkNet: Exploiting Encoder Representations for Efficient Semantic Segmentation. In Proceedings of the IEEE Visual Communications and Image Processing (VCIP), St. Petersburg, FL, USA, 10–13 December 2017. [Google Scholar]
  47. He, K.; Zhang, X.; Ren, S.; Sun, J. Deep Residual Learning for Image Recognition. In Proceedings of the 2016 IEEE Conference on Computer Vision and Pattern Recognition (CVPR), Seattle, WA, USA, 27–30 June 2016; pp. 770–778. [Google Scholar]
  48. Kingma, D.; Ba, J. Adam: A Method for Stochastic Optimization. arXiv 2014, arXiv:1412.6980. [Google Scholar]
  49. Jia, M.; Wang, Z.; Mao, D.; Ren, C.; Wang, C.; Wang, Y. Rapid, robust, and automated mapping of tidal flats in China using time series Sentinel-2 images and Google Earth Engine. Remote Sens. Environ. 2021, 255, 112285. [Google Scholar] [CrossRef]
  50. Zhang, R.; Jia, M.; Wang, Z.; Zhou, Y.; Mao, D.; Ren, C.; Zhao, C.; Liu, X. Tracking annual dynamics of mangrove forests in mangrove National Nature Reserves of China based on time series Sentinel-2 imagery during 2016–2020. Int. J. Appl. Earth Obs. Geoinf. 2022, 112, 102918. [Google Scholar] [CrossRef]
  51. Foody, G.M. Explaining the unsuitability of the kappa coefficient in the assessment and comparison of the accuracy of thematic maps obtained by image classification. Remote Sens. Environ. 2020, 239, 111630. [Google Scholar] [CrossRef]
  52. Foody, G.M. Status of land cover classification accuracy assessment. Remote Sens. Environ. 2002, 80, 185–201. [Google Scholar] [CrossRef]
  53. Tao, C.X.; Meng, Y.Z.; Li, J.J.; Yang, B.B.; Hu, F.M.; Li, Y.X.; Cui, C.L.; Zhang, W. MSNet: Multispectral semantic segmentation network for remote sensing images. Giscience Remote Sens. 2022, 59, 1177–1198. [Google Scholar] [CrossRef]
  54. Maurya, K.; Mahajan, S.; Chaube, N. Remote sensing techniques: Mapping and monitoring of mangrove ecosystem—A review. Complex Intell. Syst. 2021, 7, 2797–2818. [Google Scholar] [CrossRef]
  55. Zhao, C.; Qin, C.-Z. Identifying large-area mangrove distribution based on remote sensing: A binary classification approach considering subclasses of non-mangroves. Int. J. Appl. Earth Obs. Geoinf. 2022, 108, 102750. [Google Scholar] [CrossRef]
  56. Giri, C.; Ochieng, E.; Tieszen, L.L.; Zhu, Z.; Singh, A.; Loveland, T.; Masek, J.; Duke, N. Status and distribution of mangrove forests of the world using earth observation satellite data. Glob. Ecol. Biogeogr. 2011, 20, 154–159. [Google Scholar] [CrossRef]
  57. Peng, K.F.; Jiang, W.G.; Hou, P.; Wu, Z.F.; Ling, Z.Y.; Wang, X.Y.; Niu, Z.G.; Mao, D.H. Continental-scale wetland mapping: A novel algorithm for detailed wetland types classification based on time series Sentinel-1/2 images. Ecol. Indic. 2023, 148, 110113. [Google Scholar] [CrossRef]
  58. Zhang, X.; Liu, L.Y.; Zhao, T.T.; Chen, X.D.; Lin, S.R.; Wang, J.Q.; Mi, J.; Liu, W.D. GWL_FCS30: A global 30 m wetland map with a fine classificationsystem using multi-sourced and time-series remote sensing imagery in 2020. Earth Syst. Sci. Data 2023, 15, 265–293. [Google Scholar] [CrossRef]
  59. Gao, G.F.; Li, P.F.; Zhong, J.X.; Shen, Z.J.; Chen, J.; Li, Y.T.; Isabwe, A.; Zhu, X.Y.; Ding, Q.S.; Zhang, S.; et al. Spartina alterniflora invasion alters soil bacterial communities and enhances soil N2O emissions by stimulating soil denitrification in mangrove wetland. Sci. Total Environ. 2019, 653, 231–240. [Google Scholar] [CrossRef] [PubMed]
  60. Liu, M.Y.; Li, H.Y.; Li, L.; Man, W.D.; Jia, M.M.; Wang, Z.M.; Lu, C.Y. Monitoring the Invasion of Spartina alterniflora Using Multi-source High-resolution Imagery in the Zhangjiang Estuary, China. Remote Sens. 2017, 9, 539. [Google Scholar] [CrossRef]
  61. Zheng, J.Y.; Wei, H.Y.; Chen, R.D.; Liu, J.M.; Wang, L.K.; Gu, W. Invasive Trends of Spartina alterniflora in the Southeastern Coast of China and Potential Distributional Impacts on Mangrove Forests. Plants 2023, 12, 1923. [Google Scholar] [CrossRef] [PubMed]
  62. Zheng, X.J.; Javed, Z.; Liu, B.; Zhong, S.; Cheng, Z.; Rehman, A.; Du, D.L.; Li, J. Impact of Spartina alterniflora Invasion in Coastal Wetlands of China: Boon or Bane? Biology 2023, 12, 1057. [Google Scholar] [CrossRef]
Figure 1. Locations of study areas: (a) the Guangxi Beibu Gulf, (b) Zhenzhu Har-bor–Fangcheng Harbor in Guangxi (ZZW), (c) Dafeng River in Guangxi (DFJ), (d) Tieshan Harbor in Guangxi (TSG).
Remotesensing 15 05271 g001
Figure 2. Overview of the workflow for the production of 2 m spatial resolution mangrove datasets.
Remotesensing 15 05271 g002
Figure 3. Hybrid U-Net model mangrove extraction process.
Remotesensing 15 05271 g003
Figure 4. U-Net loss curves based on 2021 samples: (a) loss curve at ZZW, (b) loss curve at DFJ, (c) loss curve at TSG.
Remotesensing 15 05271 g004
Figure 5. The hybrid U-Net results for ZZW at the Beibu Gulf. (a,b) The satellite image of mangrove area in 2021, (c) mangrove habitat information results, (d) low tide level acquisition results, (e) the hybrid U-Net results for 2020, (f) the hybrid U-Net results for 2019, (g) the hybrid U-Net results for 2018, (h) the hybrid U-Net results for 2015.
Remotesensing 15 05271 g005
Figure 6. Comparison of the results of hybrid U-Net extraction of mangroves with multi-person interactive validation for ZZW: (a,b) The satellite image of mangrove area at ZZW in 2021 October. (c,e,g,i) The hybrid U-Net results for 2020, 2019, 2018, 2015. (d,f,h,j) multilevel interactive validation for 2020, 2019, 2018, 2015.
Remotesensing 15 05271 g006
Figure 7. Hybrid U-Net mangrove extraction results compared with existing data products. (a) The satellite image of mangrove area at ZZW, (b) mangrove habitat information results, (c) low tide level acquisition results, (d,g,j,m) the hybrid U-Net results in 2020, 2019, 2018, 2015, (f,i,l,o) the Global Mangrove Watch (GMW) in 2020, 2019, 2018, 2015, (e) LREIS in 2020, (h) TW in 2019, (k) MCina in 2018, (n) CAS in 2015.
Remotesensing 15 05271 g007
Figure 8. The hybrid U-Net results for mangrove area changes in the ZZW, DFJ, and TSG areas for 2015, 2018, 2019, 2020 with the base year sub-data products.
Remotesensing 15 05271 g008
Figure 9. Time-series distribution of existing mangrove data products (30 m spatial resolution mangrove dataset: the Global Mangrove Watch (GMW [15]), Global Mangrove Distribution (GMD [57]), PKF [58], GWL_FCS30 (GWL [59]), (MCina [40] (1978, 1990, 2000, 2013)), (CAS [13]); 10 m spatial resolution mangrove dataset: Mangrove China_LASAC (LREIS [23]), Tidal Wetlands in East Asia (TW [44]), ZCP [18,40]; 2 m spatial resolution mangrove dataset: (XCina [40] (2018))).
Remotesensing 15 05271 g009
Figure 10. Field investigation: mangrove (a,d), Spartina alterniflora (b), reed (c).
Remotesensing 15 05271 g010
Table 1. Parameters of multispectral data used in this study (m for meters).
Satellite/SensorGF-1GF-2GF-6ZY3-01ZY3-02
Study areaZZW, DFJ, TSGZZW, DFJ, TSGZZW, DFJ, TSGTSGZZW, DFJ, TSG
Data collection time15 January 201529 February 201623 November 201924 August 201518 December 2018
2 December 202115 August 20204 December 20214 December 20159 November 2021
Number of images101799433
Number of bands55588
Multispectral band
resolution/m
83.285.85.8
Pansharpened band
resolution/m
20.822.12.1
After image fusion resolution /m20.822.12.1
Table 2. Number of sample points in each area and their sources. (Note: GER stands for Google Earth high-resolution image interpretation of random points; GEC stands for Google Earth high-resolution image interpretation of area change over two consecutive years; and FSs stands for field surveys).
Study AreasYearsNumber of Sample Points (Statistics/Validation)Source
MangroveNon-MangroveTotal
GERGECFSsGERGECFSs
ZZW201541250/10672/640GER + GEC
201843414/83100/631GER + GEC
201935537/6741/500GER + GEC
202037259/8783/601GER + GEC
DFJ2015398188518993/706GER + GEC + FSs
2018332186/984/620GER + GEC
2019361188/8932/670GER + GEC
2020424156/10115/696GER + GEC
TSG201546811349880/691GER + GEC + FSs
20183426/9754/499GER + GEC
201934114/74136/565GER + GEC
202037515/10171/562GER + GEC
Table 3. Accuracy evaluation of hybrid U-Net model for various types (mangrove, non-mangrove).
Study AreaGround TruthPrecisionRecallF1-Score
ZZWMangrove89.51%90.04%0.90
Non-Mangrove97.12%96.95%0.97
DFJMangrove93.78%89.99%0.92
Non-Mangrove98.63%99.18%0.99
TSGMangrove94.34%94.49%0.94
Non-Mangrove98.62%98.58%0.99
Table 4. The Hybrid U-Net results and the producer’s accuracy (PA), user’s accuracy (UA), overall accuracy (OA), and Kappa coefficients (Kappa) of three typical mangrove forest areas in the Beibu Gulf. (1) ZZW; (2) DFJ; (3) TSG.
Study AreasYearsGround TruthPAUAOAKappa
ZZW2015Mangrove93.90%98.93%94.81%0.88
Non-Mangrove97.27%85.58%
2018Mangrove94.12%95.52%92.79%0.83
Non-Mangrove89.71%86.73%
2019Mangrove90.11%96.79%89.93%0.74
Non-Mangrove89.27%71.52%
2020Mangrove91.31%94.10%89.84%0.77
Non-Mangrove86.29%80.57%
DFJ2015Mangrove96.64%99.34%96.58%0.87
Non-Mangrove96.23%82.93%
2018Mangrove94.18%99.23%94.51%0.82
Non-Mangrove96.23%76.12%
2019Mangrove93.58%97.86%93.31%0.80
Non-Mangrove90.98%77.07%
2020Mangrove95.24%98.14%94.57%0.82
Non-Mangrove91.34%80%
TSG2015Mangrove91.44%99.03%92.88%0.83
Non-Mangrove97.27%78.76%
2018Mangrove92.80%99.71%94.69%0.88
Non-Mangrove99.34%84.83%
2019Mangrove93.67%96.47%93.85%0.87
Non-Mangrove94.17%89.74%
2020Mangrove90.49%97.50%91.68%0.82
Non-Mangrove94.51%80.75%
Disclaimer/Publisher’s Note: The statements, opinions and data contained in all publications are solely those of the individual author(s) and contributor(s) and not of MDPI and/or the editor(s). MDPI and/or the editor(s) disclaim responsibility for any injury to people or property resulting from any ideas, methods, instructions or products referred to in the content.

