
Crowd-Driven Deep Learning Tracks Amazon Deforestation

 ,
,
Abstract
:1. Introduction
2. Materials and Methods
2.1. Satellite Data
2.2. Crowdsourcing Application
2.3. Crowdsourcing Campaign
2.4. Image Labeling
2.5. Crowd Agreement with Experts
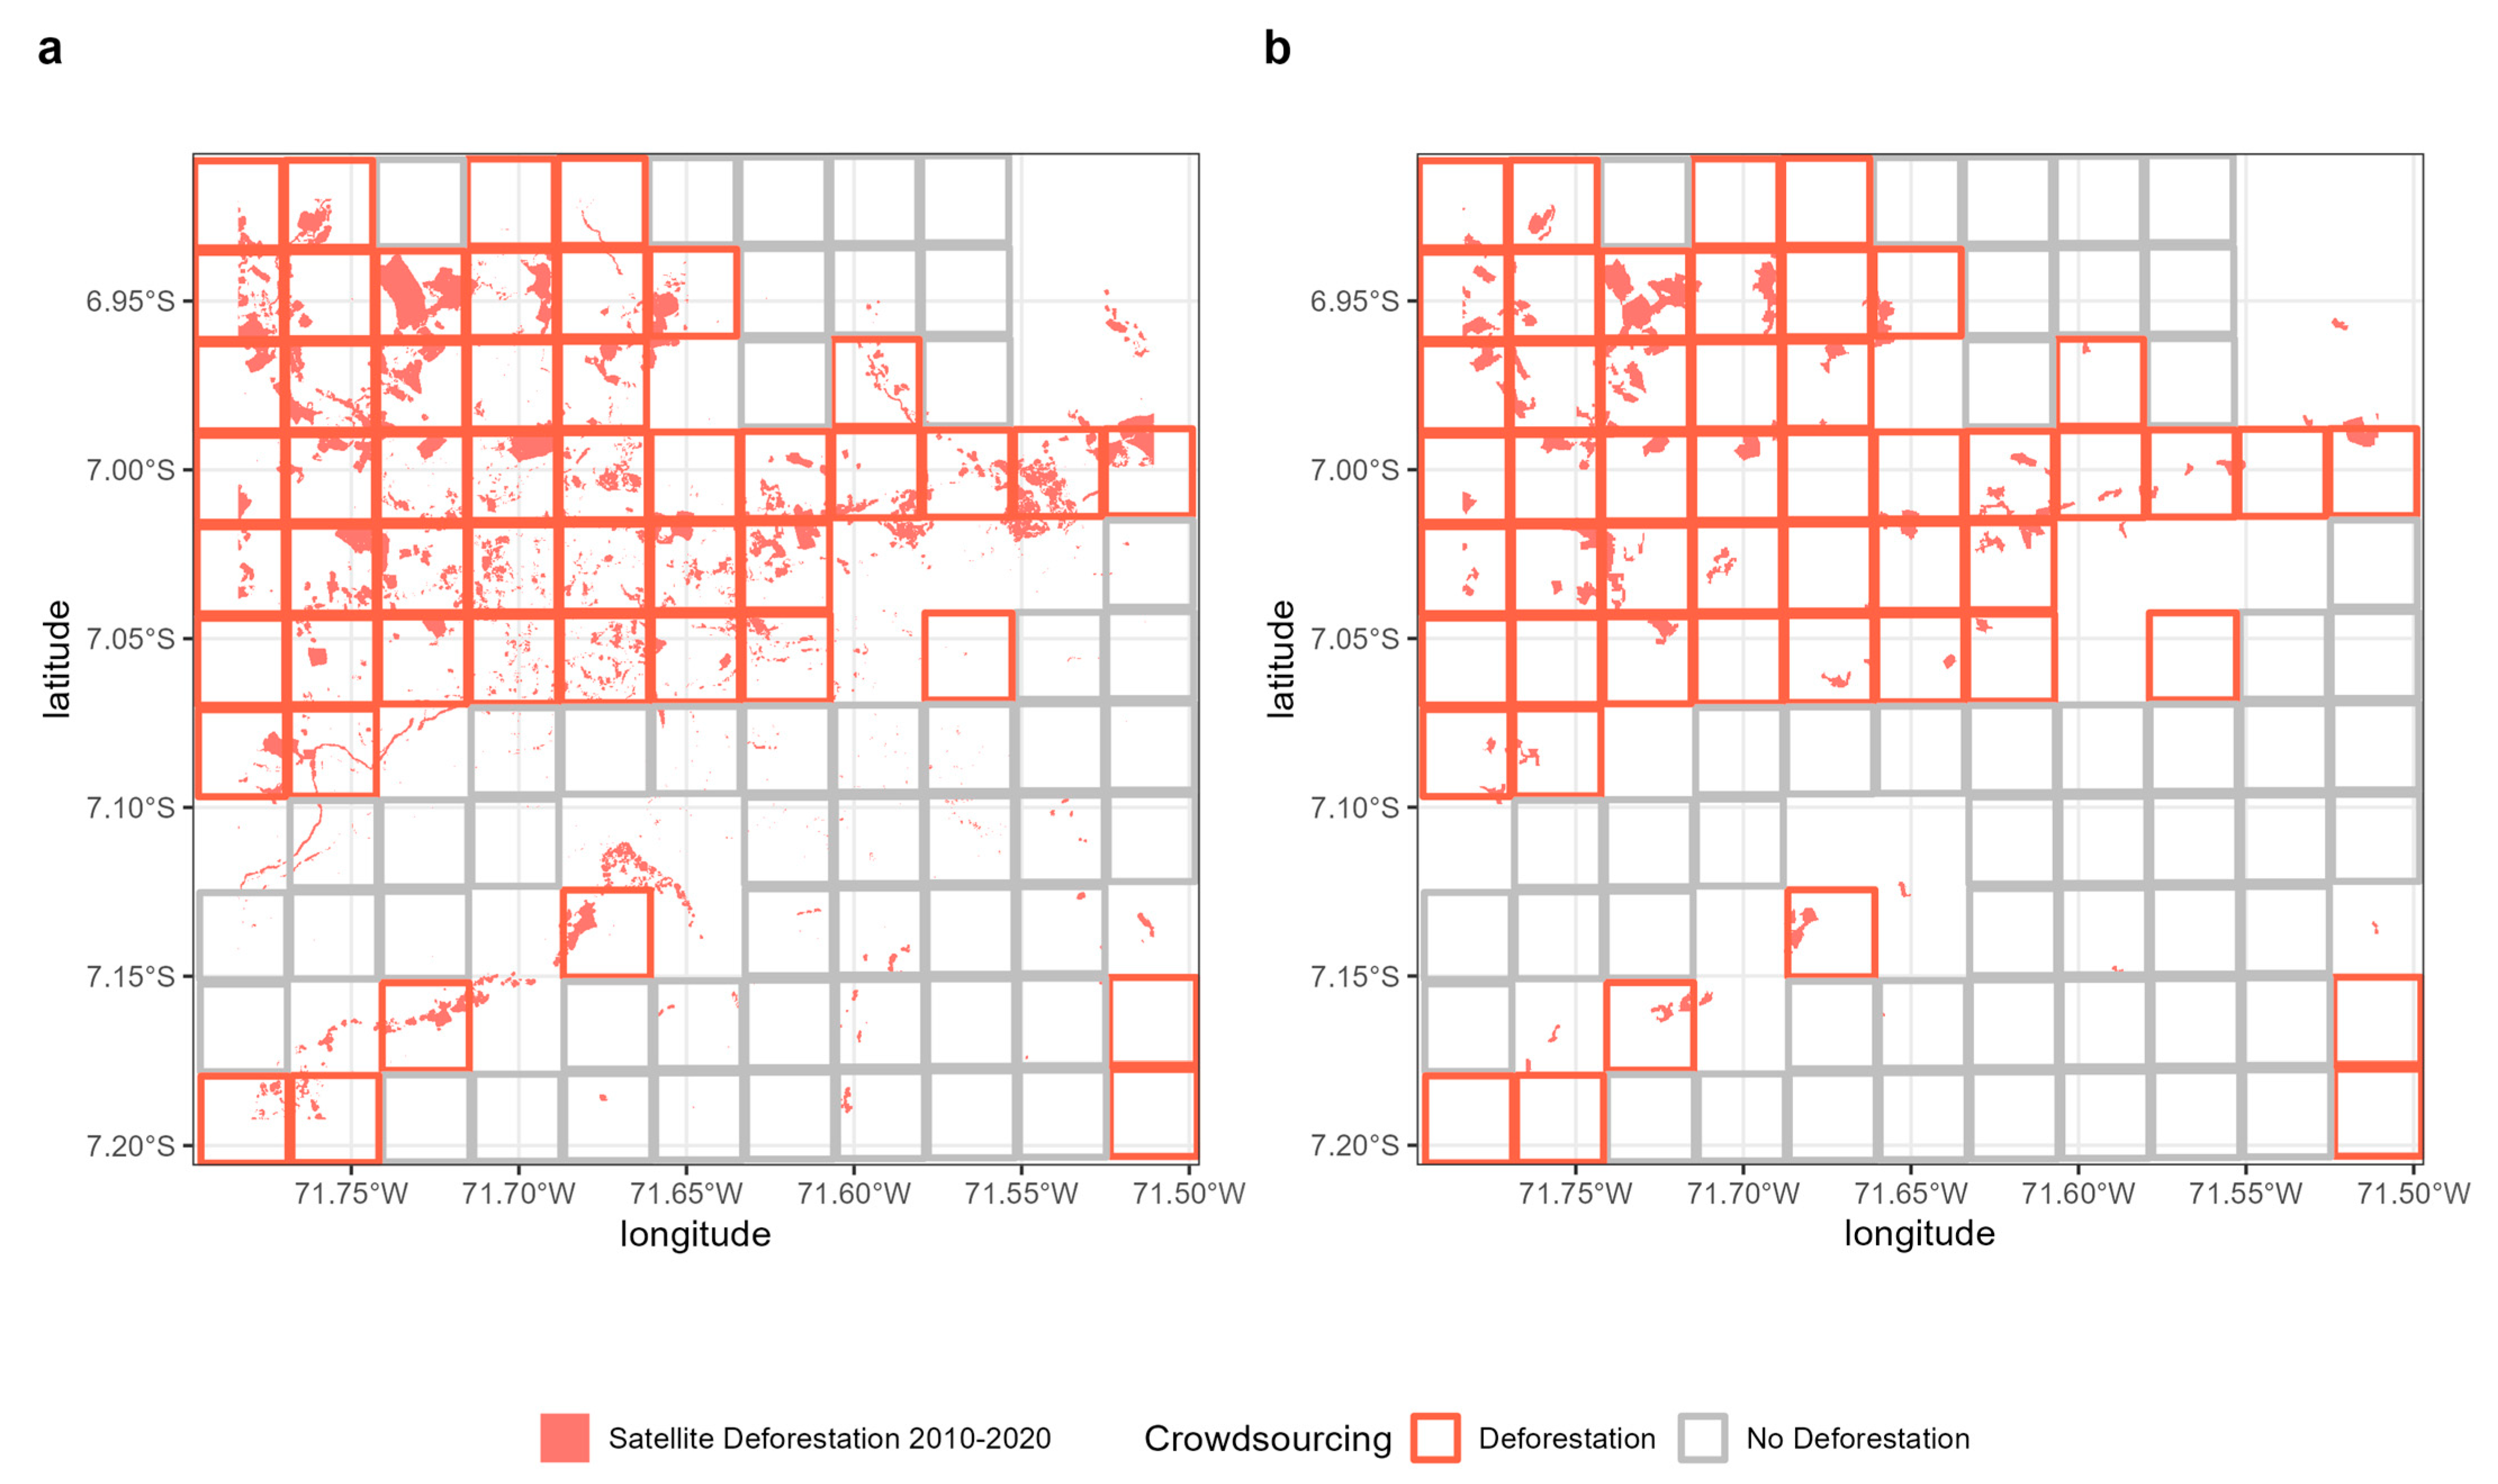
2.6. Deforestation Data for Validation
2.7. Deep Learning
3. Results
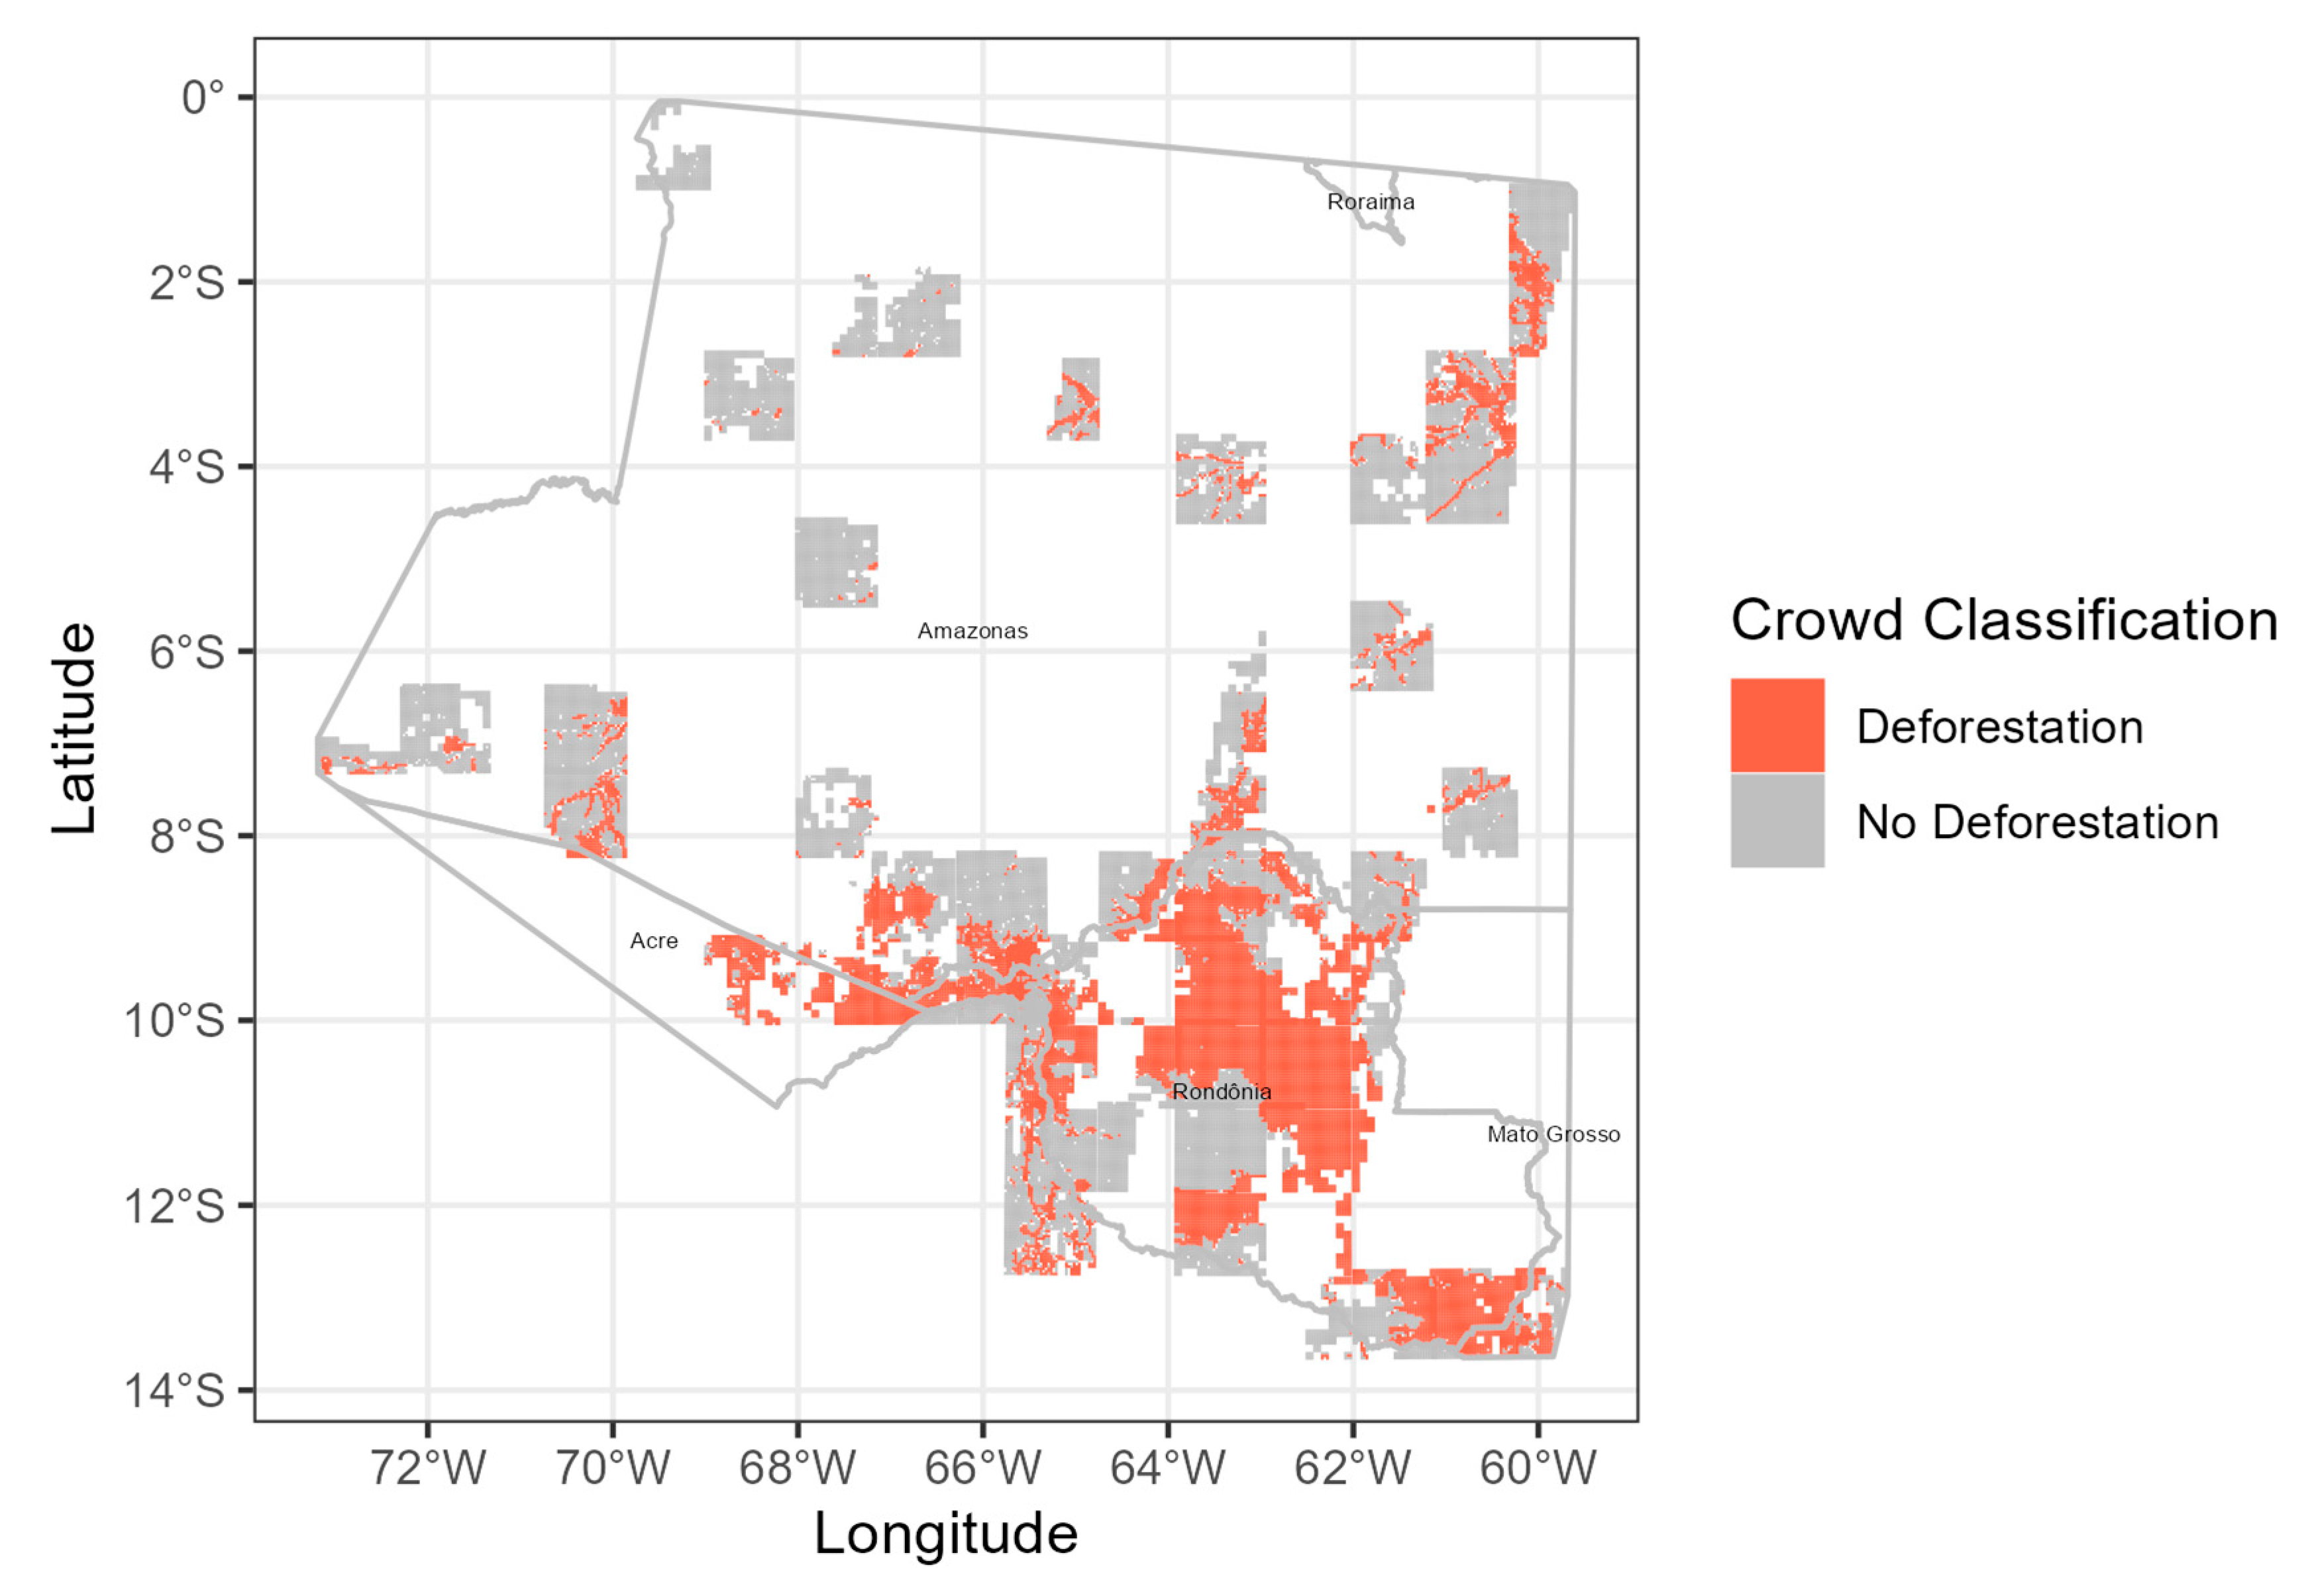
3.1. Validation of the Crowd
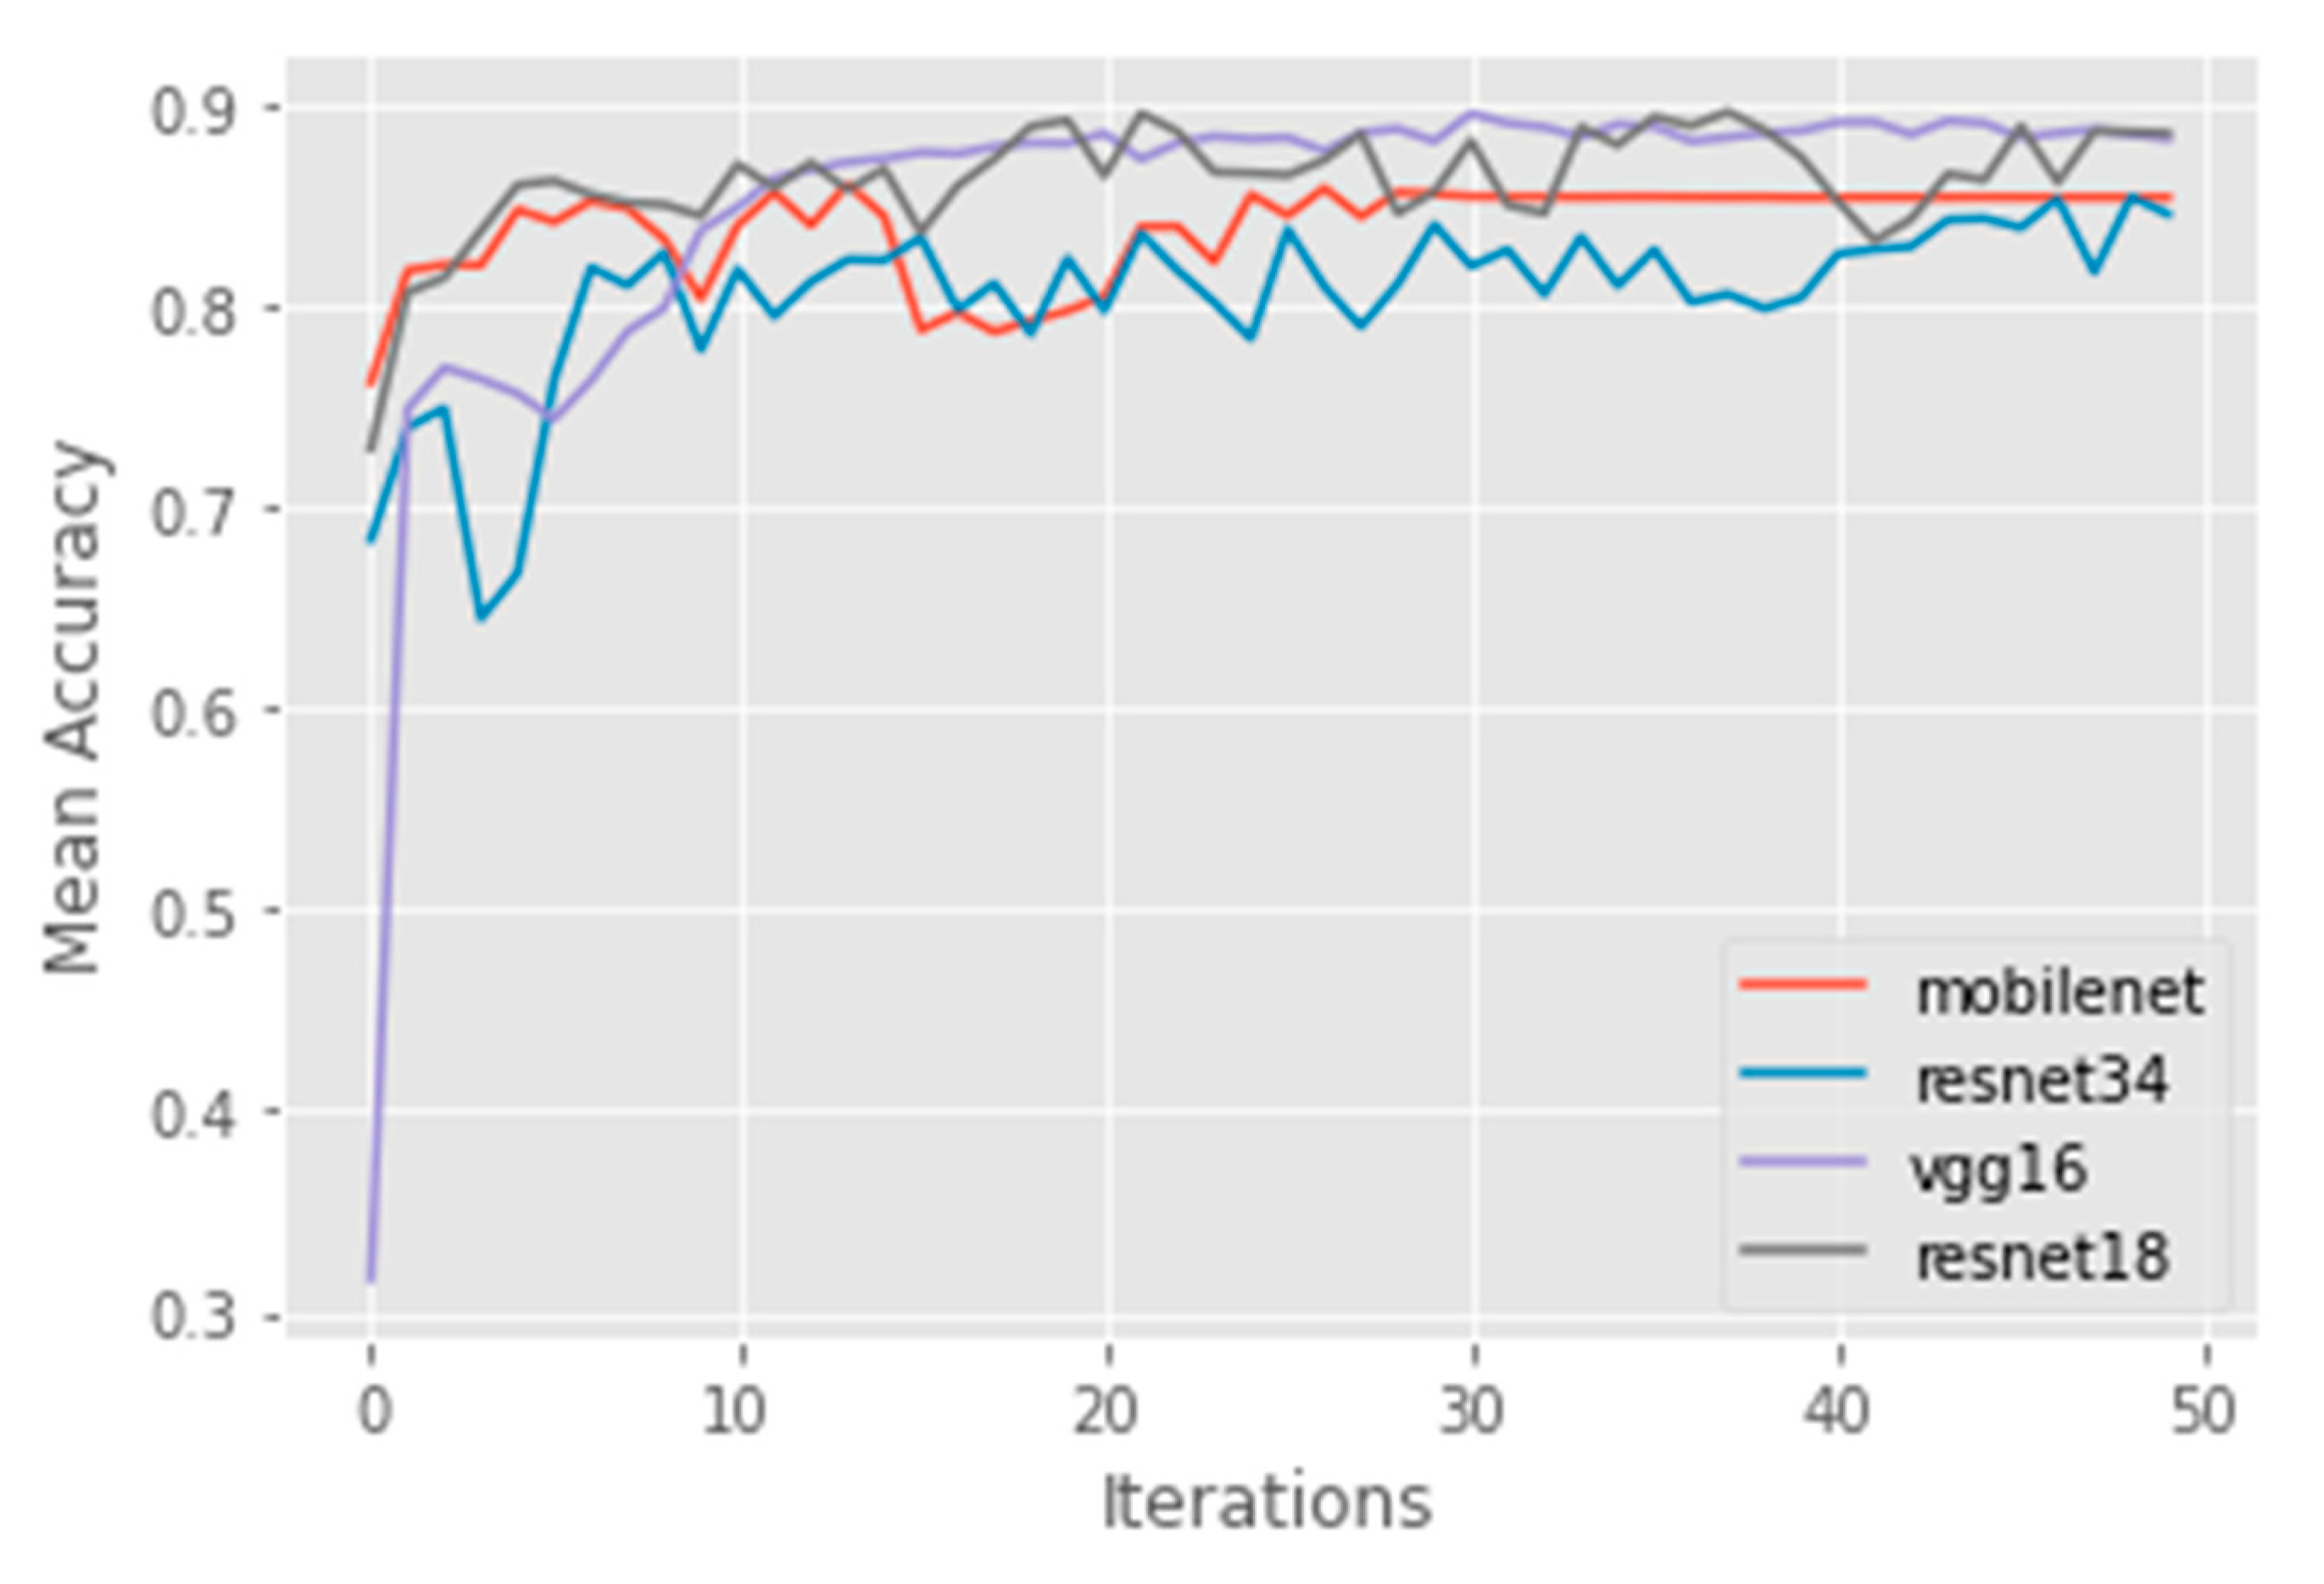
3.2. Deep Learning
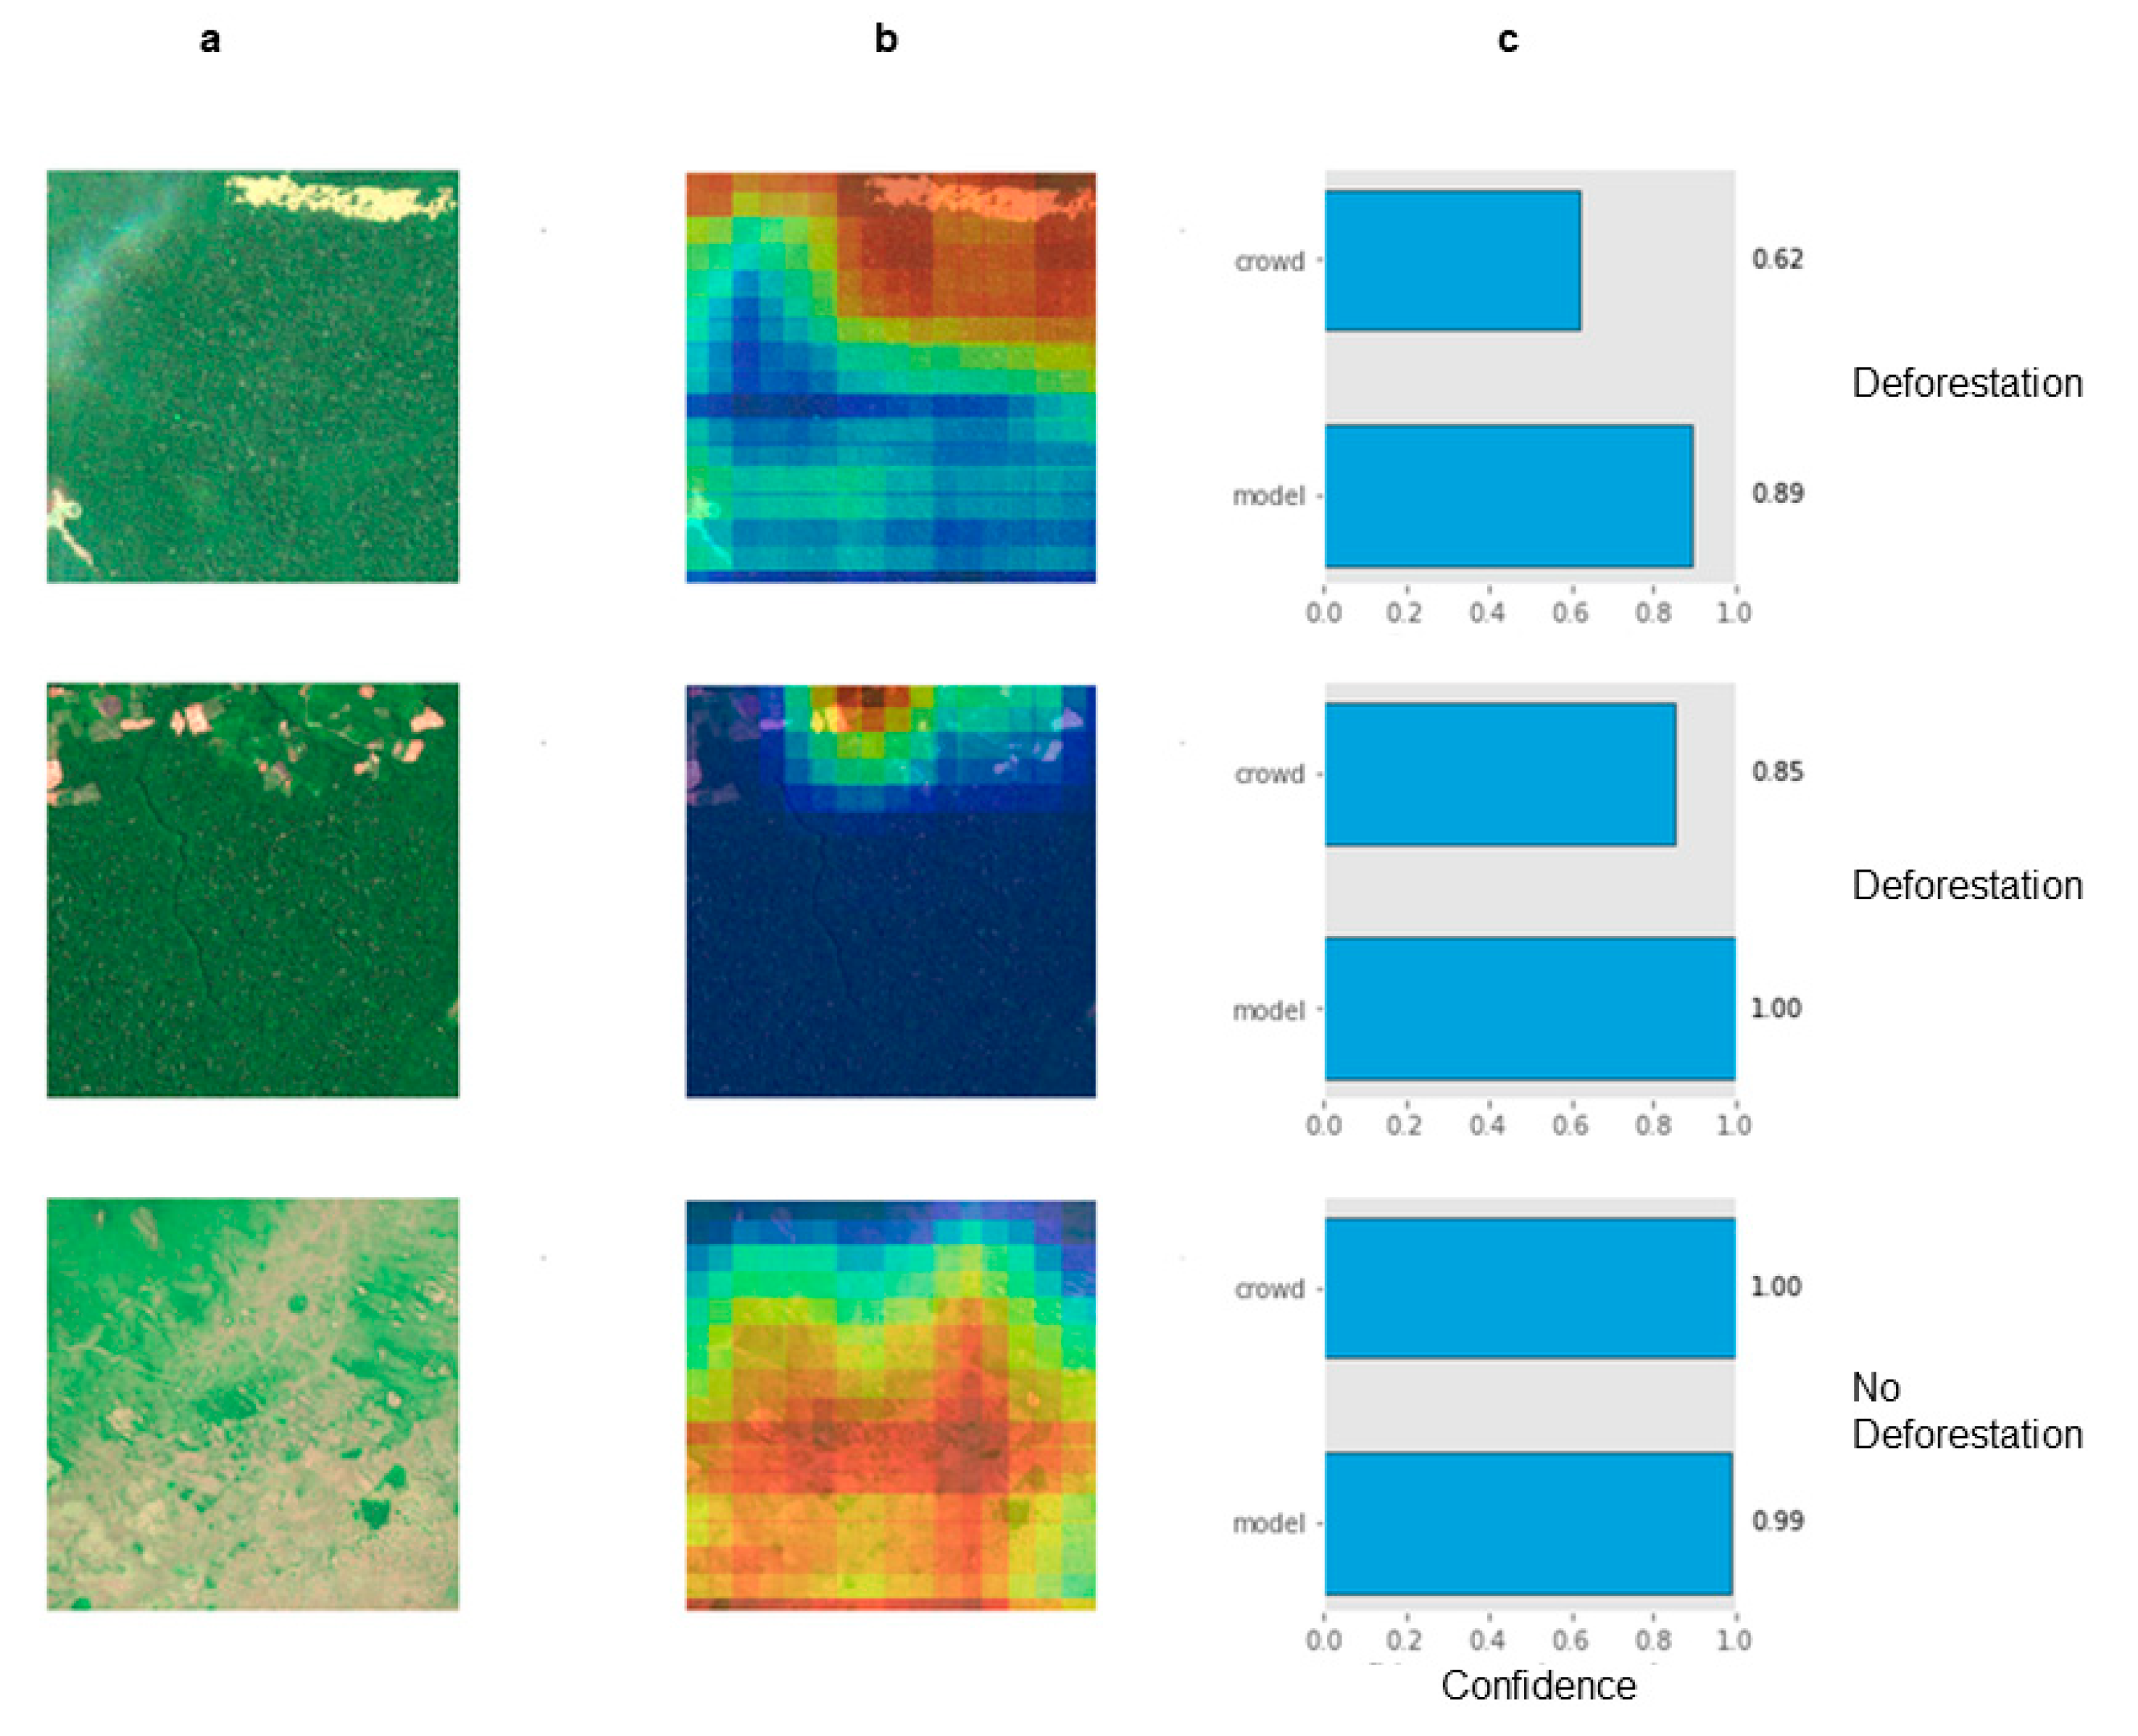
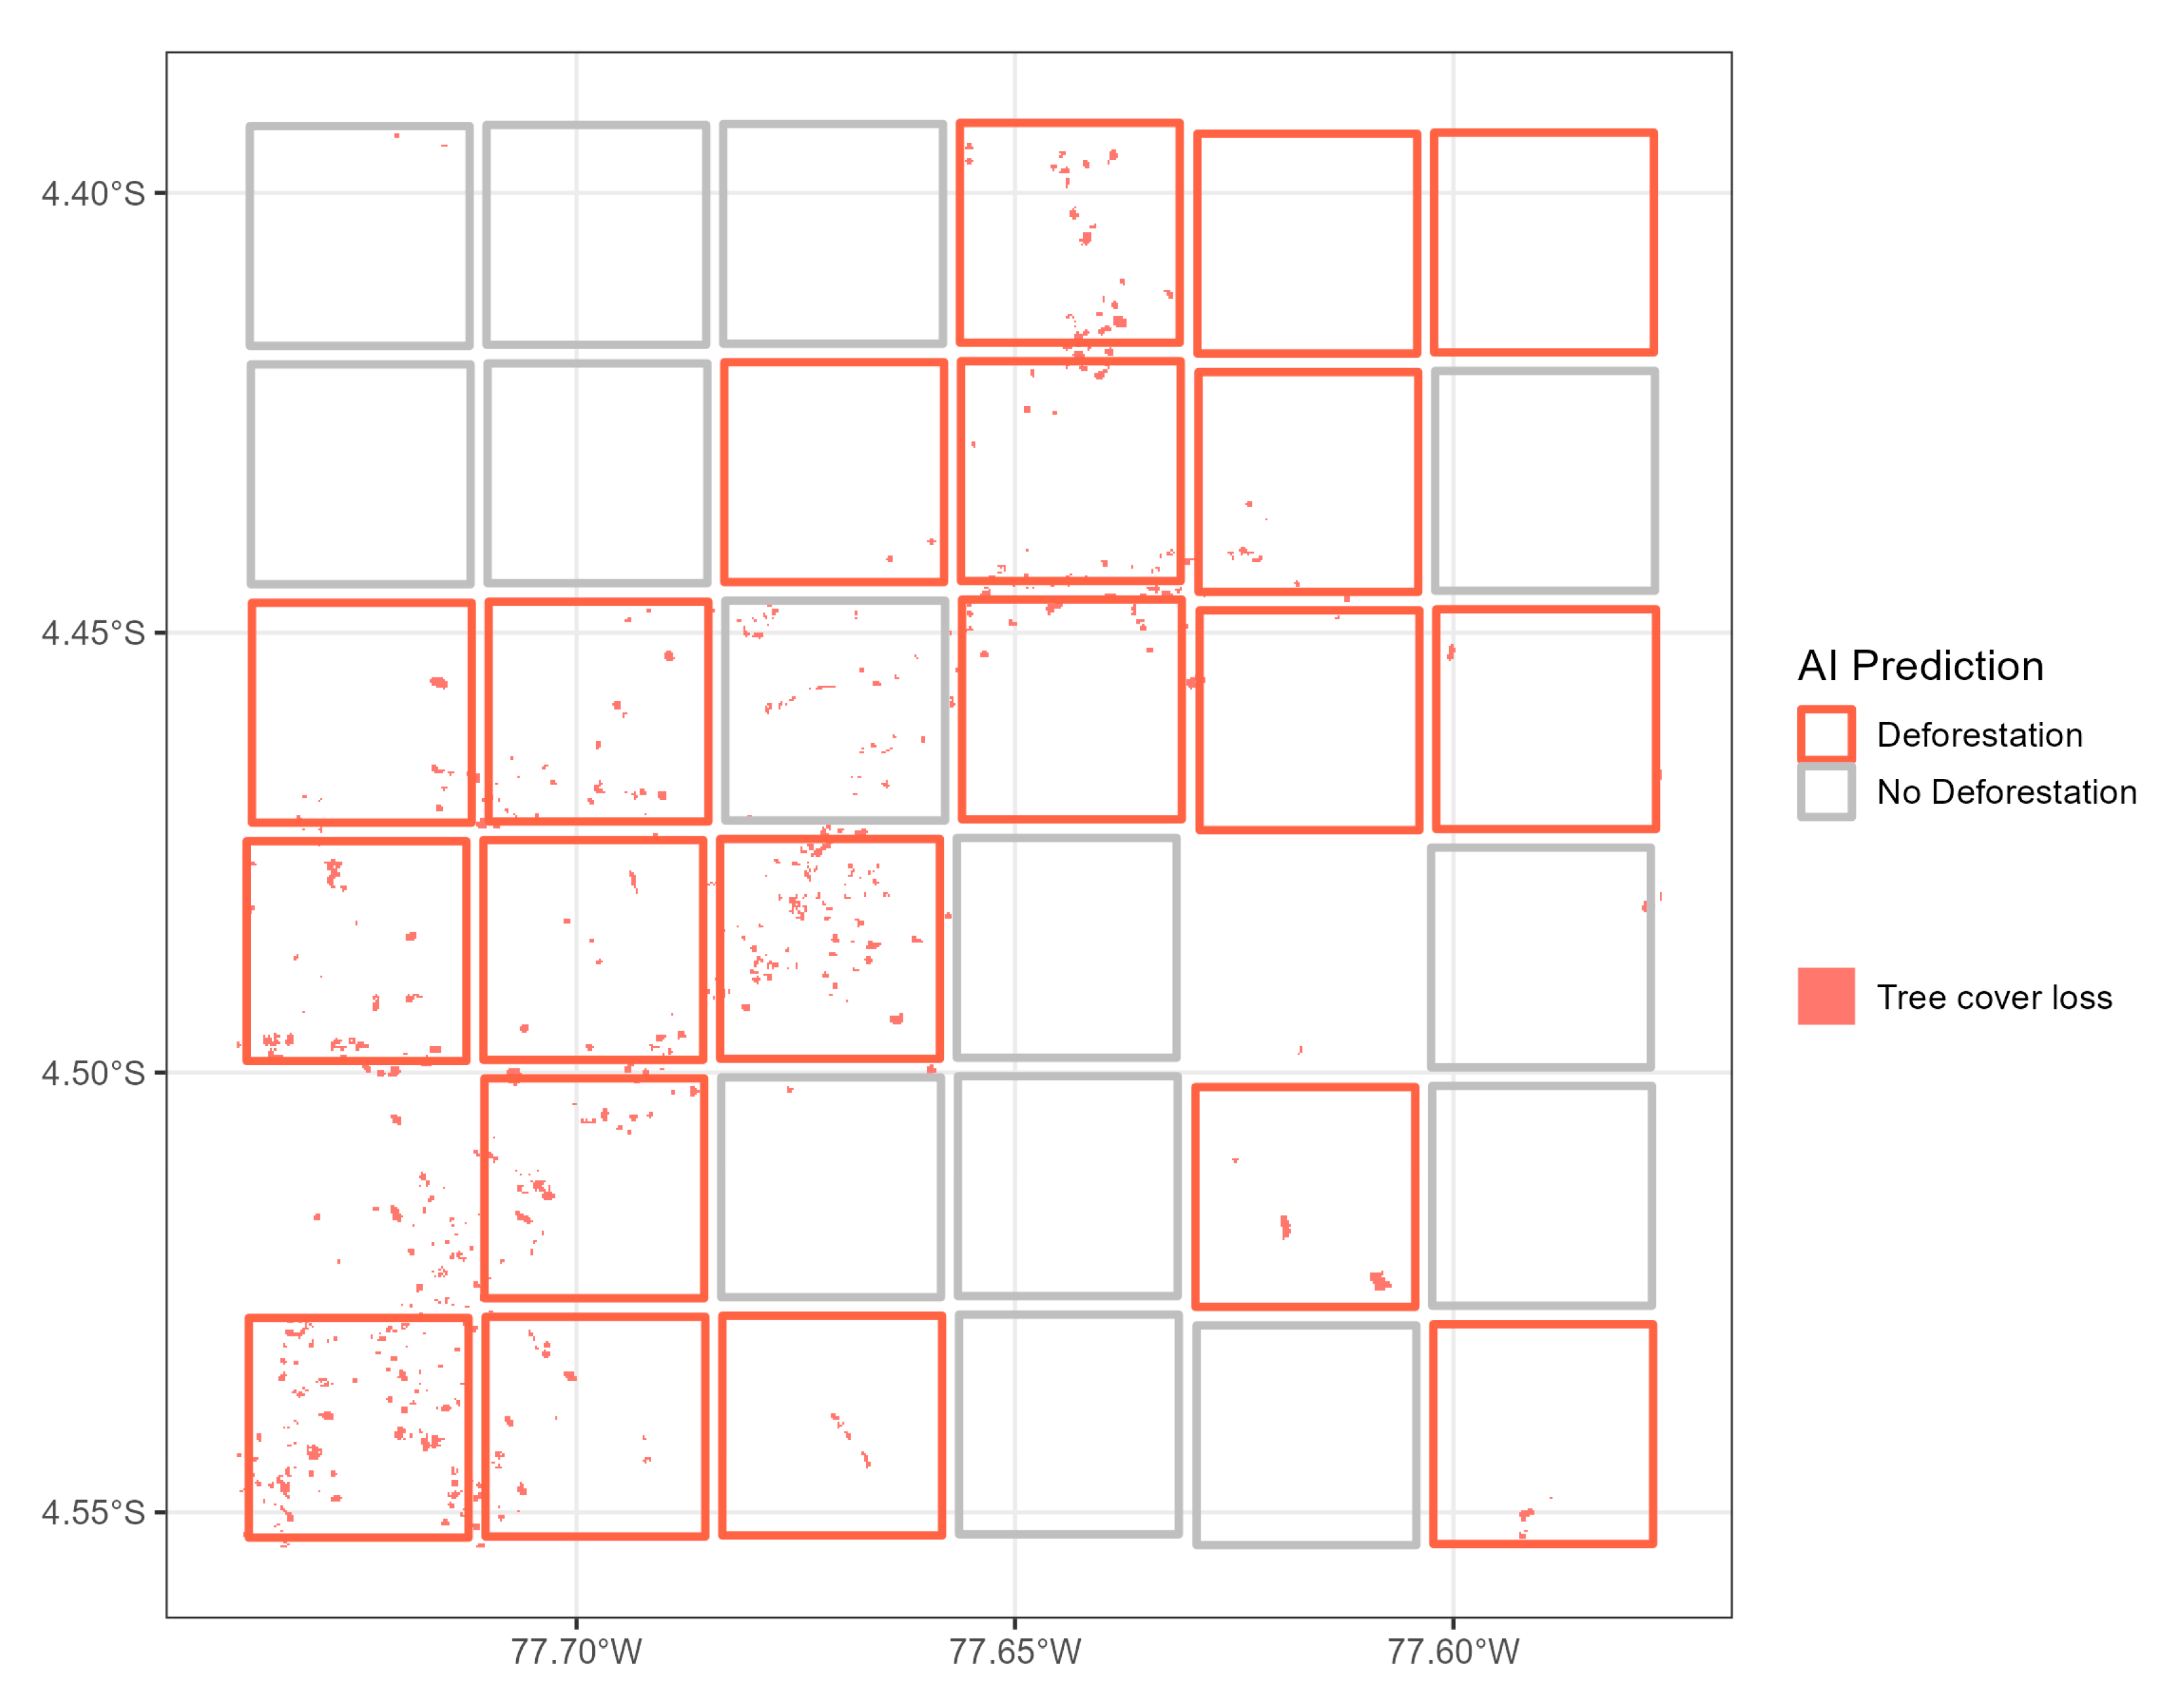
3.3. AI Validation
4. Discussion
5. Conclusions
Supplementary Materials
Author Contributions
Funding
Data Availability Statement
Acknowledgments
Conflicts of Interest
References
- Giulietti, A.M.; Harley, R.M.; De Queiroz, L.P.; Wanderley, M.D.G.L.; Van Den Berg, C. Biodiversity and Conservation of Plants in Brazil. Conserv. Biol. 2005, 19, 632–639. [Google Scholar] [CrossRef]
- Mackey, B.; DellaSala, D.A.; Kormos, C.; Lindenmayer, D.; Kumpel, N.; Zimmerman, B.; Hugh, S.; Young, V.; Foley, S.; Arsenis, K.; et al. Policy Options for the World’s Primary Forests in Multilateral Environmental Agreements. Conserv. Lett. 2015, 8, 139–147. [Google Scholar] [CrossRef]
- Matricardi, E.A.T.; Skole, D.L.; Costa, O.B.; Pedlowski, M.A.; Samek, J.H.; Miguel, E.P. Long-Term Forest Degradation Surpasses Deforestation in the Brazilian Amazon. Science 2020, 369, 1378. [Google Scholar] [CrossRef]
- Feng, Y.; Zeng, Z.; Searchinger, T.D.; Ziegler, A.D.; Wu, J.; Wang, D.; He, X.; Elsen, P.R.; Ciais, P.; Xu, R.; et al. Doubling of Annual Forest Carbon Loss over the Tropics during the Early Twenty-First Century. Nat. Sustain. 2022, 5, 444–451. [Google Scholar] [CrossRef]
- Foley, J.A.; De Fries, R.; Asner, G.P.; Barford, C.; Bonan, G.; Carpenter, S.R.; Chapin, F.S.; Coe, M.T.; Daily, G.C.; Gibbs, H.K.; et al. Global Consequences of Land Use. Science 2005, 309, 570. [Google Scholar] [CrossRef] [PubMed]
- Watson, J.E.M.; Evans, T.; Venter, O.; Williams, B.; Tulloch, A.; Stewart, C.; Thompson, I.; Ray, J.C.; Murray, K.; Salazar, A.; et al. The Exceptional Value of Intact Forest Ecosystems. Nat. Ecol. Evol. 2018, 2, 599–610. [Google Scholar] [CrossRef]
- Nepstad, D.; Soares-Filho, B.S.; Merry, F.; Lima, A.; Moutinho, P.; Carter, J.; Bowman, M.; Cattaneo, A.; Rodrigues, H.; Schwartzman, S.; et al. The End of Deforestation in the Brazilian Amazon. Science 2009, 326, 1350. [Google Scholar] [CrossRef]
- Silva Junior, C.H.L.; Pessôa, A.C.M.; Carvalho, N.S.; Reis, J.B.C.; Anderson, L.O.; Aragão, L.E.O.C. The Brazilian Amazon Deforestation Rate in 2020 Is the Greatest of the Decade. Nat. Ecol. Evol. 2020, 5, 144–145. [Google Scholar] [CrossRef]
- Barlow, J.; Berenguer, E.; Carmenta, R.; França, F. Clarifying Amazonia’s Burning Crisis. Glob. Chang. Biol. 2020, 26, 319–321. [Google Scholar] [CrossRef]
- FG Assis, L.F.; Ferreira, K.R.; Vinhas, L.; Maurano, L.; Almeida, C.; Carvalho, A.; Rodrigues, J.; Maciel, A.; Camargo, C. TerraBrasilis: A Spatial Data Analytics Infrastructure for Large-Scale Thematic Mapping. ISPRS Int. J. Geo-Inf. 2019, 8, 513. [Google Scholar] [CrossRef]
- Hansen, M.C.; Krylov, A.; Tyukavina, A.; Potapov, P.V.; Turubanova, S.; Zutta, B.; Ifo, S.; Margono, B.; Stolle, F.; Moore, R. Humid Tropical Forest Disturbance Alerts Using Landsat Data. Environ. Res. Lett. 2016, 11, 034008. [Google Scholar] [CrossRef]
- Pickens, A.H.; Hansen, M.C.; Adusei, B.; Potapov, P. Sentinel-2 Forest Loss Alert. Global Land Analysis and Discovery (GLAD), University of Maryland. 2020. Available online: www.globalforestwatch.org (accessed on 19 September 2023).
- Hansen, M.C.; Potapov, P.V.; Moore, R.; Hancher, M.; Turubanova, S.A.; Tyukavina, A.; Thau, D.; Stehman, S.V.; Goetz, S.J.; Loveland, T.R.; et al. High-Resolution Global Maps of 21st-Century Forest Cover Change. Science 2013, 342, 850–853. [Google Scholar] [CrossRef]
- Reiche, J.; Mullissa, A.; Slagter, B.; Gou, Y.; Tsendbazar, N.-E.; Odongo-Braun, C.; Vollrath, A.; Weisse, M.J.; Stolle, F.; Pickens, A.; et al. Forest Disturbance Alerts for the Congo Basin Using Sentinel-1. Environ. Res. Lett. 2021, 16, 024005. [Google Scholar] [CrossRef]
- Moffette, F.; Alix-Garcia, J.; Shea, K.; Pickens, A.H. The Impact of Near-Real-Time Deforestation Alerts across the Tropics. Nat. Clim. Chang. 2021, 11, 172–178. [Google Scholar] [CrossRef]
- Jeff Howe Wired Magazine. 2006. Available online: http://www.wired.com/wired/archive/14.06/crowds.html (accessed on 15 October 2023).
- Lintott, C.J.; Schawinski, K.; Slosar, A.; Land, K.; Bamford, S.; Thomas, D.; Raddick, M.J.; Nichol, R.C.; Szalay, A.; Andreescu, D.; et al. Galaxy Zoo: Morphologies Derived from Visual Inspection of Galaxies from the Sloan Digital Sky Survey. Mon. Not. R. Astron. Soc. 2008, 389, 1179–1189. [Google Scholar] [CrossRef]
- See, L.; Fritz, S.; Perger, C.; Schill, C.; McCallum, I.; Schepaschenko, D.; Duerauer, M.; Sturn, T.; Karner, M.; Kraxner, F.; et al. Harnessing the Power of Volunteers, the Internet and Google Earth to Collect and Validate Global Spatial Information Using Geo-Wiki. Technol. Forecast. Soc. Chang. 2015, 98, 324–335. [Google Scholar] [CrossRef]
- McMillan, R. This Guy Beat Google’s Super-Smart AI—But It Wasn’t Easy; WIRED. 2015. Available online: https://www.wired.com/2015/01/karpathy/ (accessed on 15 October 2023).
- See, L.; Comber, A.; Salk, C.; Fritz, S.; van der Velde, M.; Perger, C.; Schill, C.; McCallum, I.; Kraxner, F.; Obersteiner, M. Comparing the Quality of Crowdsourced Data Contributed by Expert and Non-Experts. PLoS ONE 2013, 8, e69958. [Google Scholar] [CrossRef] [PubMed]
- Hill, S.; Ready-Campbell, N. Expert Stock Picker: The Wisdom of (Experts in) Crowds. Int. J. Electron. Commer. 2011, 15, 73–102. [Google Scholar] [CrossRef]
- Jordan, R.C.; Ballard, H.L.; Phillips, T.B. Key Issues and New Approaches for Evaluating Citizen-Science Learning Outcomes. Front. Ecol. Environ. 2012, 10, 307–309. [Google Scholar] [CrossRef]
- Walker, D.W.; Smigaj, M.; Tani, M. The Benefits and Negative Impacts of Citizen Science Applications to Water as Experienced by Participants and Communities. Wiley Interdiscip. Rev. Water 2021, 8, e1488. [Google Scholar] [CrossRef]
- Krichen, M. Convolutional Neural Networks: A Survey. Computers 2023, 12, 151. [Google Scholar] [CrossRef]
- Russakovsky, O.; Deng, J.; Su, H.; Krause, J.; Satheesh, S.; Ma, S.; Huang, Z.; Karpathy, A.; Khosla, A.; Bernstein, M.; et al. ImageNet Large Scale Visual Recognition Challenge. Int. J. Comput. Vis. 2015, 115, 211–252. [Google Scholar] [CrossRef]
- Krizhevsky, A. Learning Multiple Layers of Features from Tiny Images; Technical Report TR-2009; University of Toronto: Toronto, ON, USA, 2009. [Google Scholar]
- Kaggle Planet: Understanding the Amazon from Space. Available online: https://kaggle.com/c/planet-understanding-the-amazon-from-space (accessed on 12 August 2021).
- ESA. Sentinel-2 User Handbook. European Space Agency, European Commission. 2015. Available online: https://sentinel.esa.int/documents/247904/685211/sentinel-2_user_handbook (accessed on 15 October 2023).
- Ranghetti, L.; Boschetti, M.; Nutini, F.; Busetto, L. “Sen2r”: An R Toolbox for Automatically Downloading and Preprocessing Sentinel-2 Satellite Data. Comput. Geosci. 2020, 139, 104473. [Google Scholar] [CrossRef]
- McHugh, M.L. Interrater Reliability: The Kappa Statistic. Biochem. Med. 2012, 22, 276–282. [Google Scholar] [CrossRef]
- Simonyan, K.; Zisserman, A. Very Deep Convolutional Networks for Large-Scale Image Recognition. arXiv 2014, arXiv:1409.1556. [Google Scholar]
- He, K.; Zhang, X.; Ren, S.; Sun, J. Deep Residual Learning for Image Recognition. In Proceedings of the IEEE Conference on Computer Vision and Pattern Recognition, Boston, MA, USA, 7–12 June 2015. [Google Scholar]
- Sandler, M.; Howard, A.; Zhu, M.; Zhmoginov, A.; Chen, L.-C. MobileNetV2: Inverted Residuals and Linear Bottlenecks. arXiv 2019, arXiv:1801.04381. [Google Scholar]
- Rumelhart, D.E.; Hinton, G.E.; Williams, R.J. Learning Representations by Back-Propagating Errors. Nature 1986, 323, 533–536. [Google Scholar] [CrossRef]
- Zeiler, M.D.; Fergus, R. Visualizing and Understanding Convolutional Networks. In Proceedings of the Computer Vision—ECCV 2014: 13th European Conference, Zurich, Switzerland, 6–12 September 2014. [Google Scholar]
- Huang, S.; Tang, L.; Hupy, J.P.; Wang, Y.; Shao, G. A Commentary Review on the Use of Normalized Difference Vegetation Index (NDVI) in the Era of Popular Remote Sensing. J. For. Res. 2021, 32, 1–6. [Google Scholar] [CrossRef]
- Chicco, D. Siamese Neural Networks: An Overview. In Artificial Neural Networks; Cartwright, H., Ed.; Springer US: New York, NY, USA, 2021; pp. 73–94. ISBN 978-1-07-160826-5. [Google Scholar]
- Ayush, K.; Uzkent, B.; Meng, C.; Tanmay, K.; Burke, M.; Lobell, D.; Ermon, S. Geography-Aware Self-Supervised Learning. arXiv 2020, arXiv:2011.09980. [Google Scholar]
- Ren, P.; Xiao, Y.; Chang, X.; Huang, P.-Y.; Li, Z.; Chen, X.; Wang, X. A Survey of Deep Active Learning. ACM Comput. Surv. 2020, 54, 1–40. [Google Scholar] [CrossRef]
- Salk, C.; Moltchanova, E.; See, L.; Sturn, T.; McCallum, I.; Fritz, S. How Many People Need to Classify the Same Image? A Method for Optimizing Volunteer Contributions in Binary Geographical Classifications. PLoS ONE 2022, 17, e0267114. [Google Scholar] [CrossRef] [PubMed]
- Slagter, B.; Reiche, J.; Marcos, D.; Mullissa, A.; Lossou, E.; Peña-Claros, M.; Herold, M. Monitoring Direct Drivers of Small-Scale Tropical Forest Disturbance in near Real-Time with Sentinel-1 and -2 Data. Remote Sens. Environ. 2023, 295, 113655. [Google Scholar] [CrossRef]
- Bullock, E.L.; Healey, S.P.; Yang, Z.; Houborg, R.; Gorelick, N.; Tang, X.; Andrianirina, C. Timeliness in Forest Change Monitoring: A New Assessment Framework Demonstrated Using Sentinel-1 and a Continuous Change Detection Algorithm. Remote Sens. Environ. 2022, 276, 113043. [Google Scholar] [CrossRef]
- Laso Bayas, J.C.; See, L.; Georgieva, I.; Schepaschenko, D.; Danylo, O.; Dürauer, M.; Bartl, H.; Hofhansl, F.; Zadorozhniuk, R.; Burianchuk, M.; et al. Drivers of Tropical Forest Loss between 2008 and 2019. Sci. Data 2022, 9, 146. [Google Scholar] [CrossRef] [PubMed]


| Metric | Statistic |
|---|---|
| Number of countries participating | 96 countries |
| Total area classified Number of satellite images classified | 389,988 km2 43,108 |
| Average No. of classifications per user | 49 |
| Number of users who classified images | 5521 |
Disclaimer/Publisher’s Note: The statements, opinions and data contained in all publications are solely those of the individual author(s) and contributor(s) and not of MDPI and/or the editor(s). MDPI and/or the editor(s) disclaim responsibility for any injury to people or property resulting from any ideas, methods, instructions or products referred to in the content. |
© 2023 by the authors. Licensee MDPI, Basel, Switzerland. This article is an open access article distributed under the terms and conditions of the Creative Commons Attribution (CC BY) license (https://creativecommons.org/licenses/by/4.0/).
Share and Cite
McCallum, I.; Walker, J.; Fritz, S.; Grau, M.; Hannan, C.; Hsieh, I.-S.; Lape, D.; Mahone, J.; McLester, C.; Mellgren, S.; et al. Crowd-Driven Deep Learning Tracks Amazon Deforestation. Remote Sens. 2023, 15, 5204. https://doi.org/10.3390/rs15215204
McCallum I, Walker J, Fritz S, Grau M, Hannan C, Hsieh I-S, Lape D, Mahone J, McLester C, Mellgren S, et al. Crowd-Driven Deep Learning Tracks Amazon Deforestation. Remote Sensing. 2023; 15(21):5204. https://doi.org/10.3390/rs15215204
Chicago/Turabian StyleMcCallum, Ian, Jon Walker, Steffen Fritz, Markus Grau, Cassie Hannan, I-Sah Hsieh, Deanna Lape, Jen Mahone, Caroline McLester, Steve Mellgren, and et al. 2023. "Crowd-Driven Deep Learning Tracks Amazon Deforestation" Remote Sensing 15, no. 21: 5204. https://doi.org/10.3390/rs15215204