
Solar Potential Analysis of Bus Shelters in Urban Environments: A Study Case in Ávila (Spain)
by
 , , and
María Sánchez-Aparicio
1,2,* ,
,
Enrique González-González
1,
Jose Antonio Martín-Jiménez
1 and
Susana Lagüela
1
1
Departamento de Ingeniería Cartográfica y del Terreno, Escuela Politécnica Superior de Ávila, Universidad de Salamanca, Calle Hornos Caleros 50, 05003 Ávila, Spain
2
Departamento de Ingeniería Topográfica y Cartografía, Escuela Técnica Superior de Ingenieros en Topografía, Geodesia y Cartografía, Universidad Politécnica de Madrid, Calle Mercator 2, 28031 Madrid, Spain
*
Author to whom correspondence should be addressed.
Remote Sens. 2023, 15(21), 5189; https://doi.org/10.3390/rs15215189
Submission received: 23 August 2023
/
Revised: 13 October 2023
/
Accepted: 26 October 2023
/
Published: 31 October 2023
(This article belongs to the Special Issue Geo-Information and Integration for Smart and Friendly Cities)
Abstract
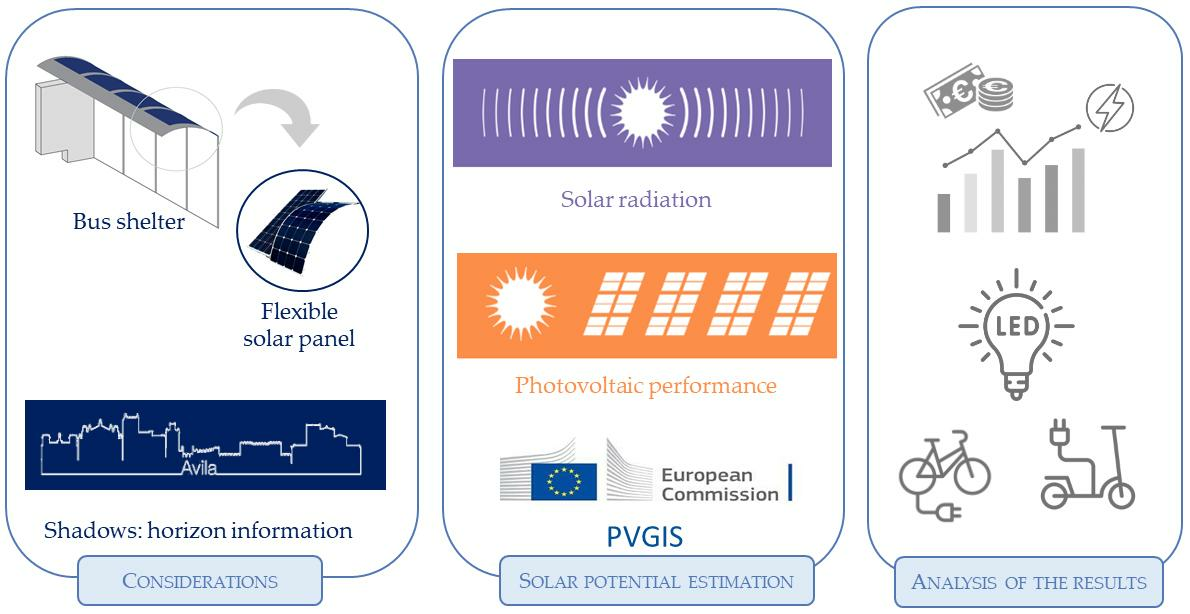
:The presence of shadows is one of the main disadvantages of photovoltaic solar panel installations in urban environments. This article analyses their effect on solar installations performed on urban elements where the use of solar energy can be considered novel: bus shelters. For this purpose, the PVGIS tool is used in combination with a new methodology for the extraction of the shadow horizon profile from LiDAR point clouds. The results show a 29.90% and 37% reduction of calculated solar radiation using horizon profiles derived from LiDAR point clouds of 0.5 pts/m2 and 1 pt/m2, respectively, versus no horizon profile. By taking shading into account, thanks to this study it is possible to make a more realistic prediction of the use of the electrical energy generated by the sun to cover urban energy consumption in bus shelters. Results show that the energy surplus produced overall allows these elements to be converted into charging points for light electric vehicles, allowing up to 35 units per day/bus shelter to be charged. The use of bus shelters as a place to generate clean energy through solar energy and charge light vehicles makes it possible to move towards sustainable and environmentally friendly cities.

1. Introduction
Energy transition is a structural change into which society is putting a lot of effort. IRENA’s World Energy Transitions Outlook positions electrification and efficiency as key transition drivers, enabled by renewable energy, clean hydrogen, and sustainable biomass [1]. The exponential increase in the number of people living in urban areas means that the main point of consumption is on the territory of cities [2]. As a result, cities set the perfect stage for the energy transition. Although the use of clean hydrogen in recent years has grown extremely fast [3], it is still far from catching up with the most exploited renewable energy sources: solar energy and wind energy. According to the renewable Global Energy Capacity Statistics 2023 of IRENA [4], in 2022 the solar energy capacity was 1,053,115 MW and the wind energy capacity was 898,824 MW. Specifically, within solar energy, 1,046,614 MW correspond to solar photovoltaic, while only 6501 MW correspond to concentrated solar power. The variety of PV power generation systems, the efficiency and the market [5], together with the investment trends [6], make solar energy the perfect solution for cities to achieve their energy goals [7].
For this reason, many authors have focused their efforts on the analysis of solar potential in cities around the world [8,9,10,11] through the development of novel methodologies [12,13] and tools to carry out accurate analyses [14,15]. Most solar potential studies make use of either web or desktop tools based on solar radiation databases. Geographic Information System (GIS) such as ArcGIS Pro and QGIS, together with PVGIS tool, are most often used. Sing [16] estimates the rooftop solar PV potential of cities using the methodology applied to thirteen Indian cities, each having a population of more than two million and a total population of 79 million. The total technical rooftop PV potential of these thirteen cities is found to be around 17.8 GWp. Ren et al. [17] developed a novel 3D-geographic information system and a deep learning integrated approach for high-accuracy building rooftop solar energy potential characterization of high-density cities.
Roofs are the main location in cities for the installation of solar panels for several reasons, including simplicity of installation, low shading, proximity to energy consumption points and large surface areas [18]. In addition to roofs, other elements, such as walls or windows, can also be used to collect solar energy in buildings [19]. Building façades are one of the most commonly used [20]. However, there are other less-known and less-used alternatives for energy harvesting in urban environments. Fakour et al. [21] evaluated the solar photovoltaic carport canopy with electric vehicle charging. Solar PV trees allow for the generation of clean energy with artificial solar architectures that look like natural trees [22]. Roads are an important structural element in the city that also enable the integration of PV technology [23]. Urban furniture with integrated solar panels is another underused alternative for urban integration, as [24,25] demonstrated in the case of bus shelters. In both studies, the electrical energy generated by conventional photovoltaic modules is used to satisfy the already known consumptions of this type of urban elements: small environmental sensors, small information screens, USB charging points for small devices and lighting. However, their analysis does not consider the installation of novel technology, such as flexible panels, and the energy use does not include light urban transport (charging of e-bikes).
Although knowing the value of solar radiation is mandatory to calculate solar potential, taking shadows into account in the estimation allows for the optimization of the calculation. Cities are places where the presence of shadows on the urban furniture is usual, mainly due to the presence of buildings. There is a wide variety of tools that calculate the estimation of shadow hours such as Sketchup [26], Rhinoceros [27] and Autodesk Revit [28]. These programs require a 3D model of the element and its surrounding areas to allow the users to accurately estimate and visualize shadows through time. It is a powerful option when users search for an advanced visualization of a building [29]. For estimating shadows on a large scale, the use of GIS tools or web tools is more efficient [30]. All of them are fed with information from remote sensing [31,32,33]. An example of these tools is PVGIS [34], which is based on Digital Terrain Models (DTM) with low resolution. The previously mentioned studies for the estimation of solar potential in bus shelters make use of GIS tools in combination with DSM, using data with resolutions of 5 m in Turin [24] and 1 m in Lisbon [25], considering only the month with the lowest solar radiation (December). This time limit in the computation does not allow for the planning of urban services such as e-bike rental services and their integration in the urban transport infrastructure with the bus shelters as recharging points. The use of a suitable resolution allows for optimization of the results and the computational cost. Sánchez-Aparicio et al. [35] show the importance of geospatial data resolution in estimating large-scale solar potential. Some authors have worked on the automation of the calculation of the horizon profiles using geospatial data. Viana-Fons et al. [30] have developed a methodology based on Light Detection and Ranging (LiDAR) data and cadastral information. Vega-Garita et al. [36] propose a method using images from a smartphone to obtain an accurate horizon profile for shading analysis. Methodologies for the study of entire cities involve a huge computational cost of data acquisition and processing and do not have such an impact on the shading results, as will be seen in the following sections.
Based on the above, and taking as a case study the city of Avila, as one of the cities in Spain with the highest number of solar hours, the objectives of this research paper are:
- Development and validation of a methodology to automatically obtain horizontal profiles from LiDAR point clouds with low computational cost and a high-resolution DSM (20 cm).
- Evaluation of the effect of shadows on the calculation of the solar radiation reaching bus shelters through their consideration or disregard by using a horizon profile obtained from LiDAR point clouds using the PVGIS web tool.
- Analysis of the influence of point cloud resolution on horizon profile in the solar potential estimation.
- Assessment of the year-round solar potential of bus shelters in the whole city through the installation of a complex photovoltaic alternative: flexible solar panels.
- Analysis of bus shelters as charging points for light electric vehicles to improve mobility in cities using electric energy generated with flexible solar panels.
Following the introduction explaining the importance of this study to the scientific community, Section 2 describes the case study on which the research is focused and explains in detail the methodology used. Using this methodology, Section 3 shows the main results obtained. Based on these results, Section 4 discusses them. Finally, the conclusions of this research are presented.
2. Materials and Methods
2.1. Case Study: Photovoltaic Bus Shelters in the City of Ávila (Spain)
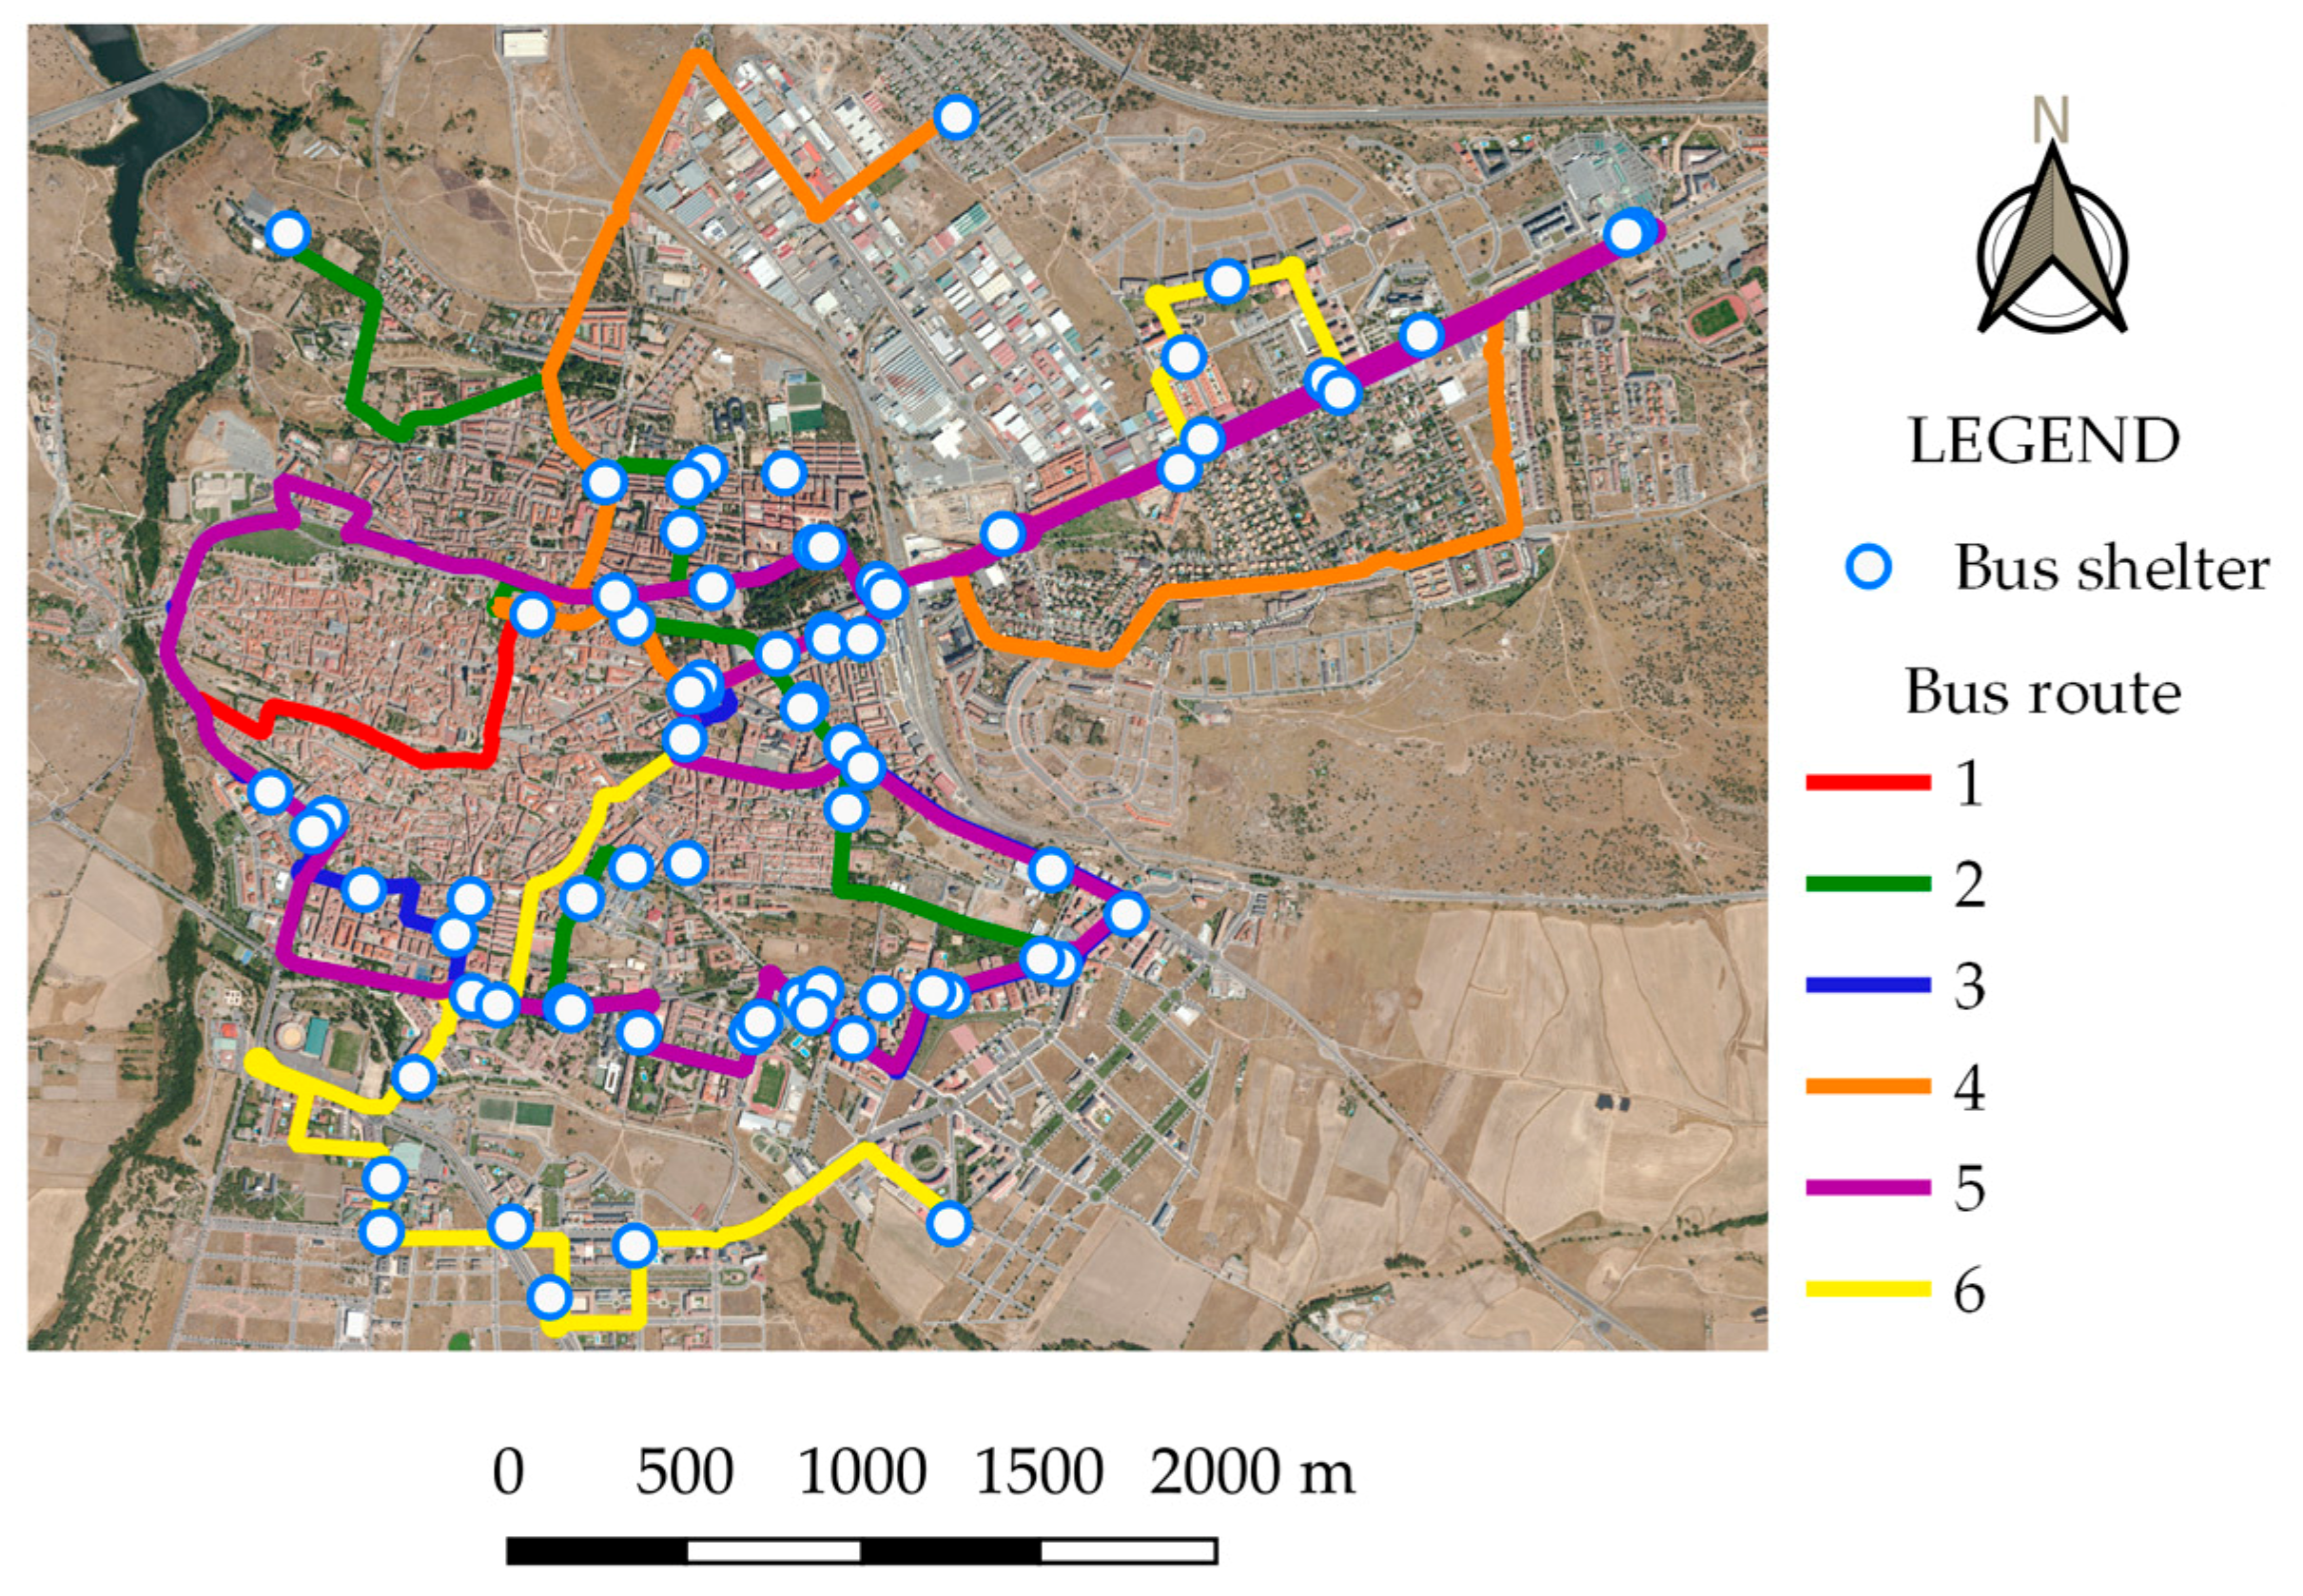
The city of Ávila, located in Spain, is one of the European cities with the highest radiation intensity, with an average monthly value between 1583.50 and 1715.80 kJ/m2 [37]. With an area of approximately 230 km2, it is a city whose main means of urban transport is the bus. Currently, the urban transport network consists of a total of six urban bus lines with 74 bus shelters (Figure 1).
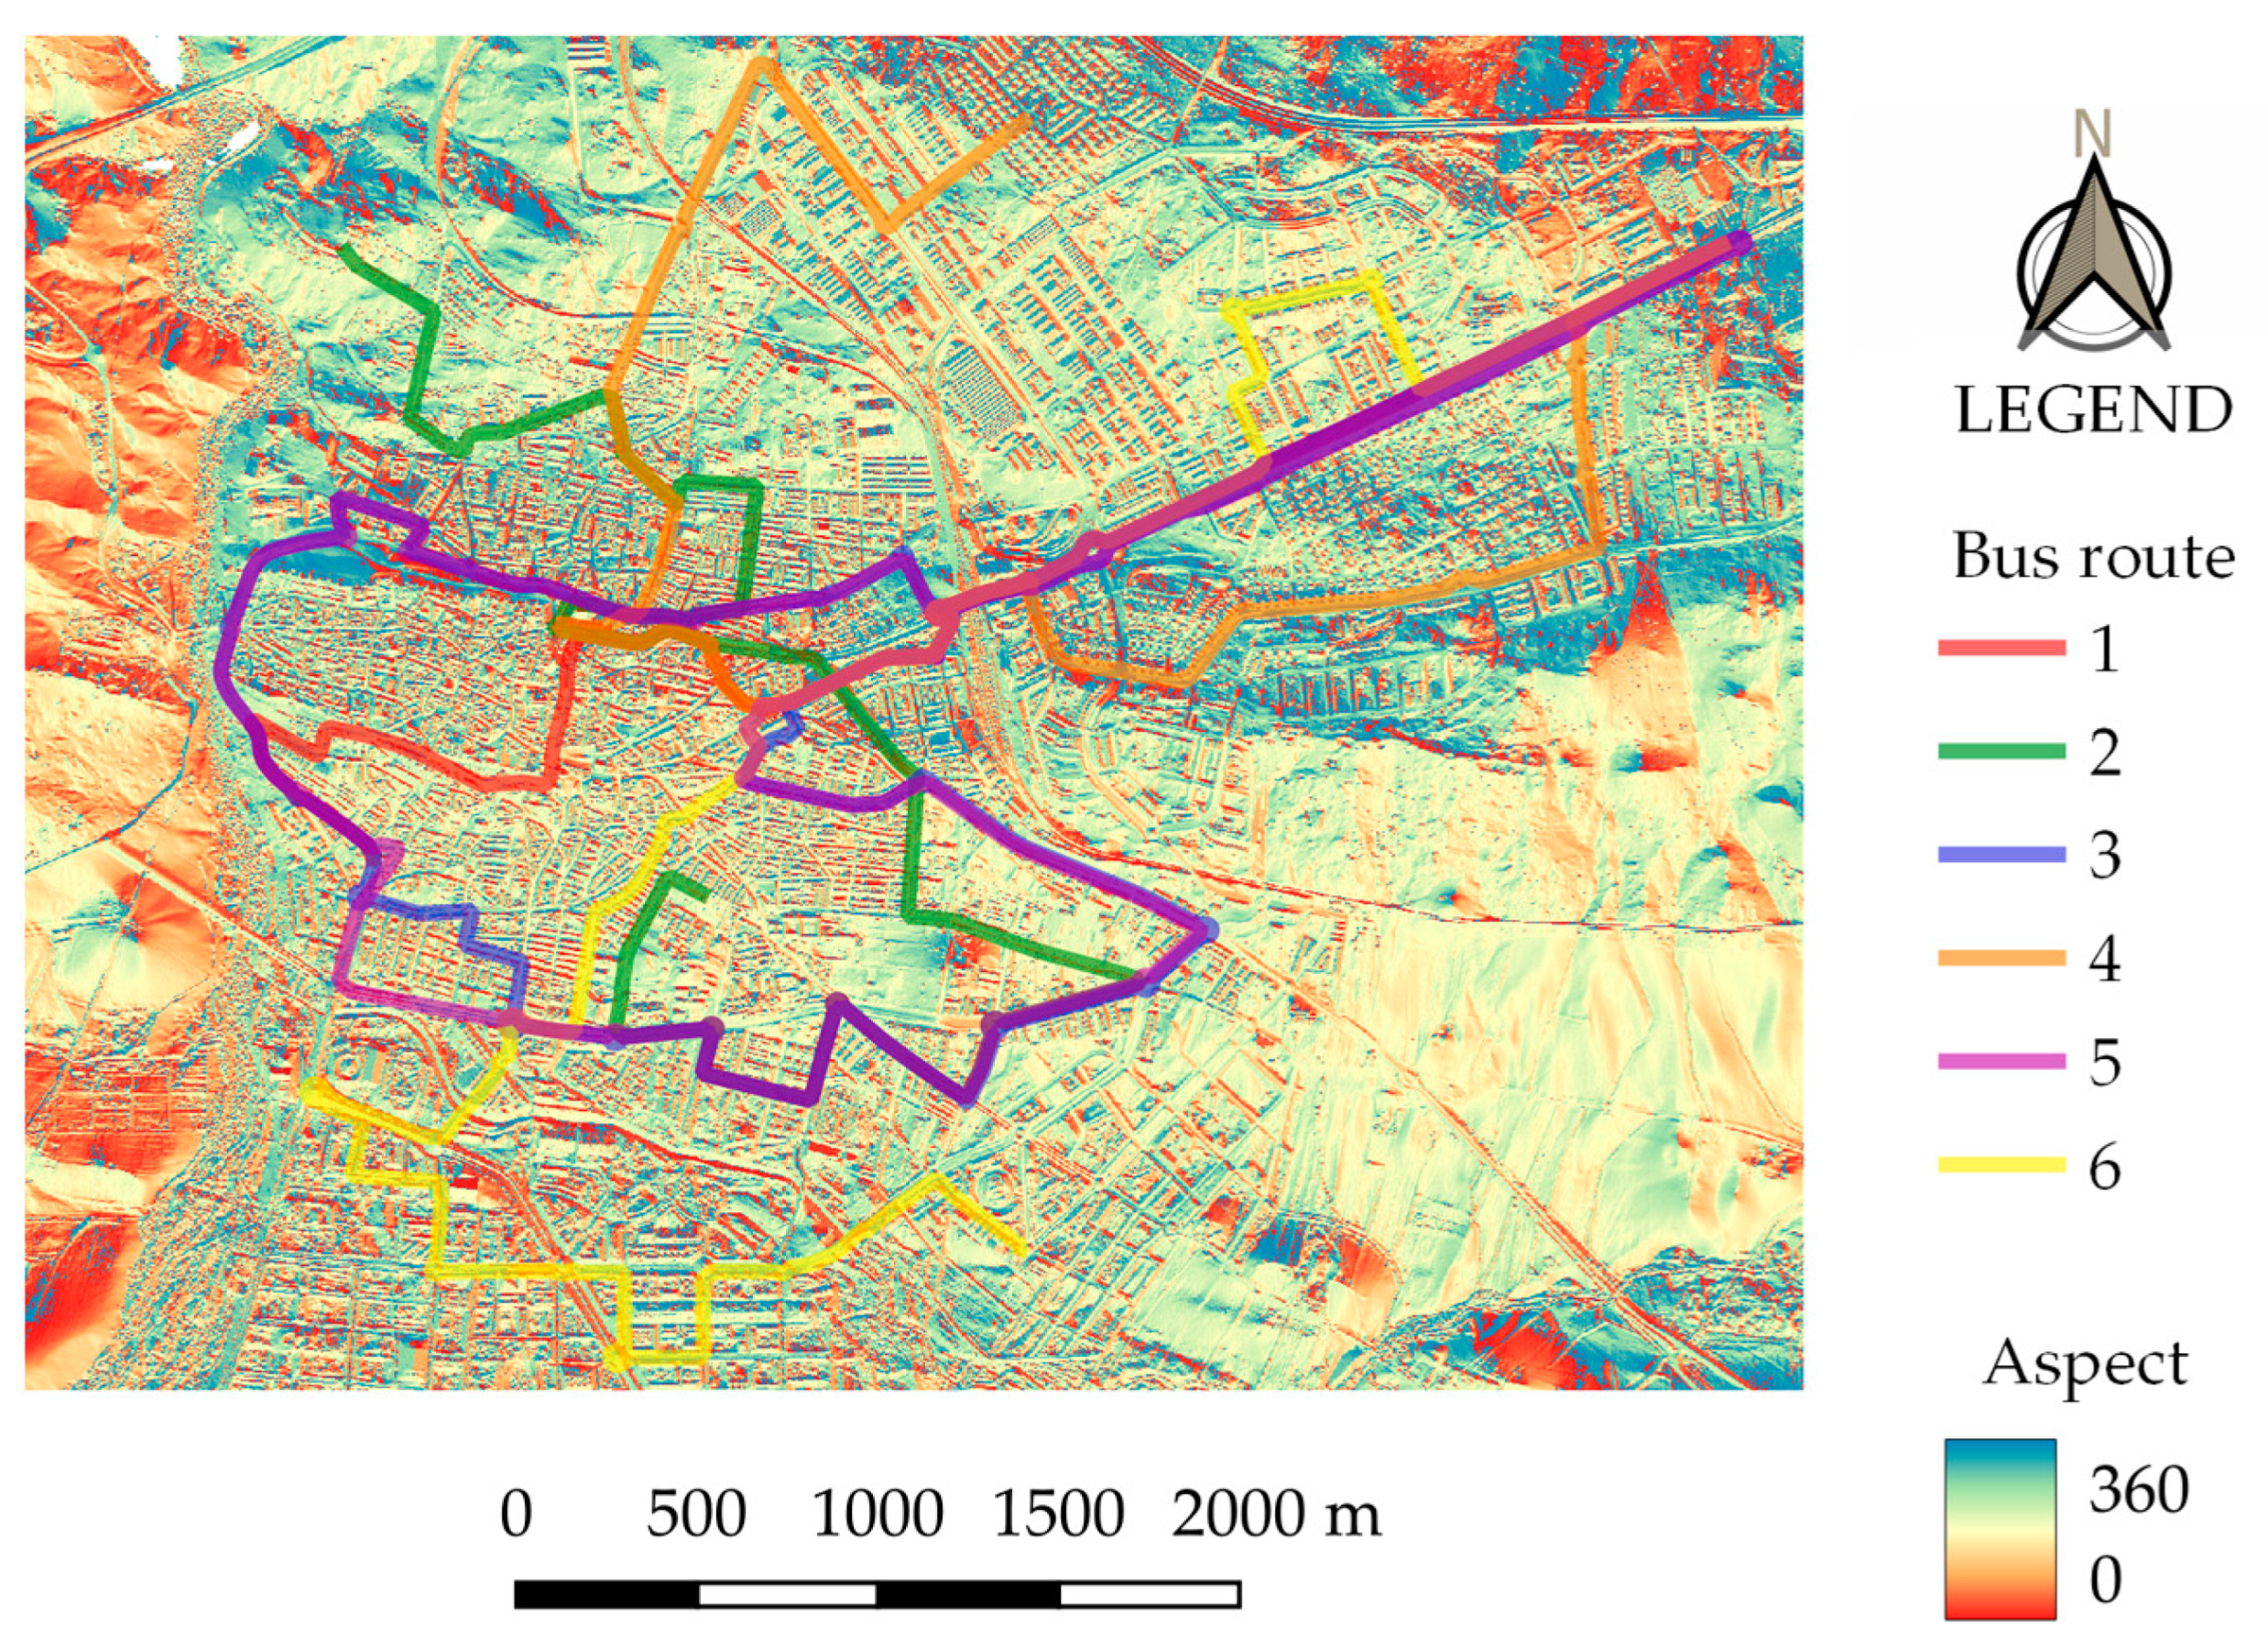
According to the orientation of the roof: North, South, East and West, Table 1 summarizes the number of bus shelters in the whole city (Figure 2).
Focusing on the presence of obstacles that can generate shadows that reduce solar radiation and therefore their solar potential, 55 of the 74 bus shelters do have objects in their surroundings that can generate shadows. Expressed in percentages, 26% of the bus shelters in the city have no obstacles in their surroundings (Table 2).
In general, there are two main elements near the shelters that can generate shade: trees and buildings. Of the 55 shelters, 30 have buildings in their immediate surroundings, while 25 have trees.
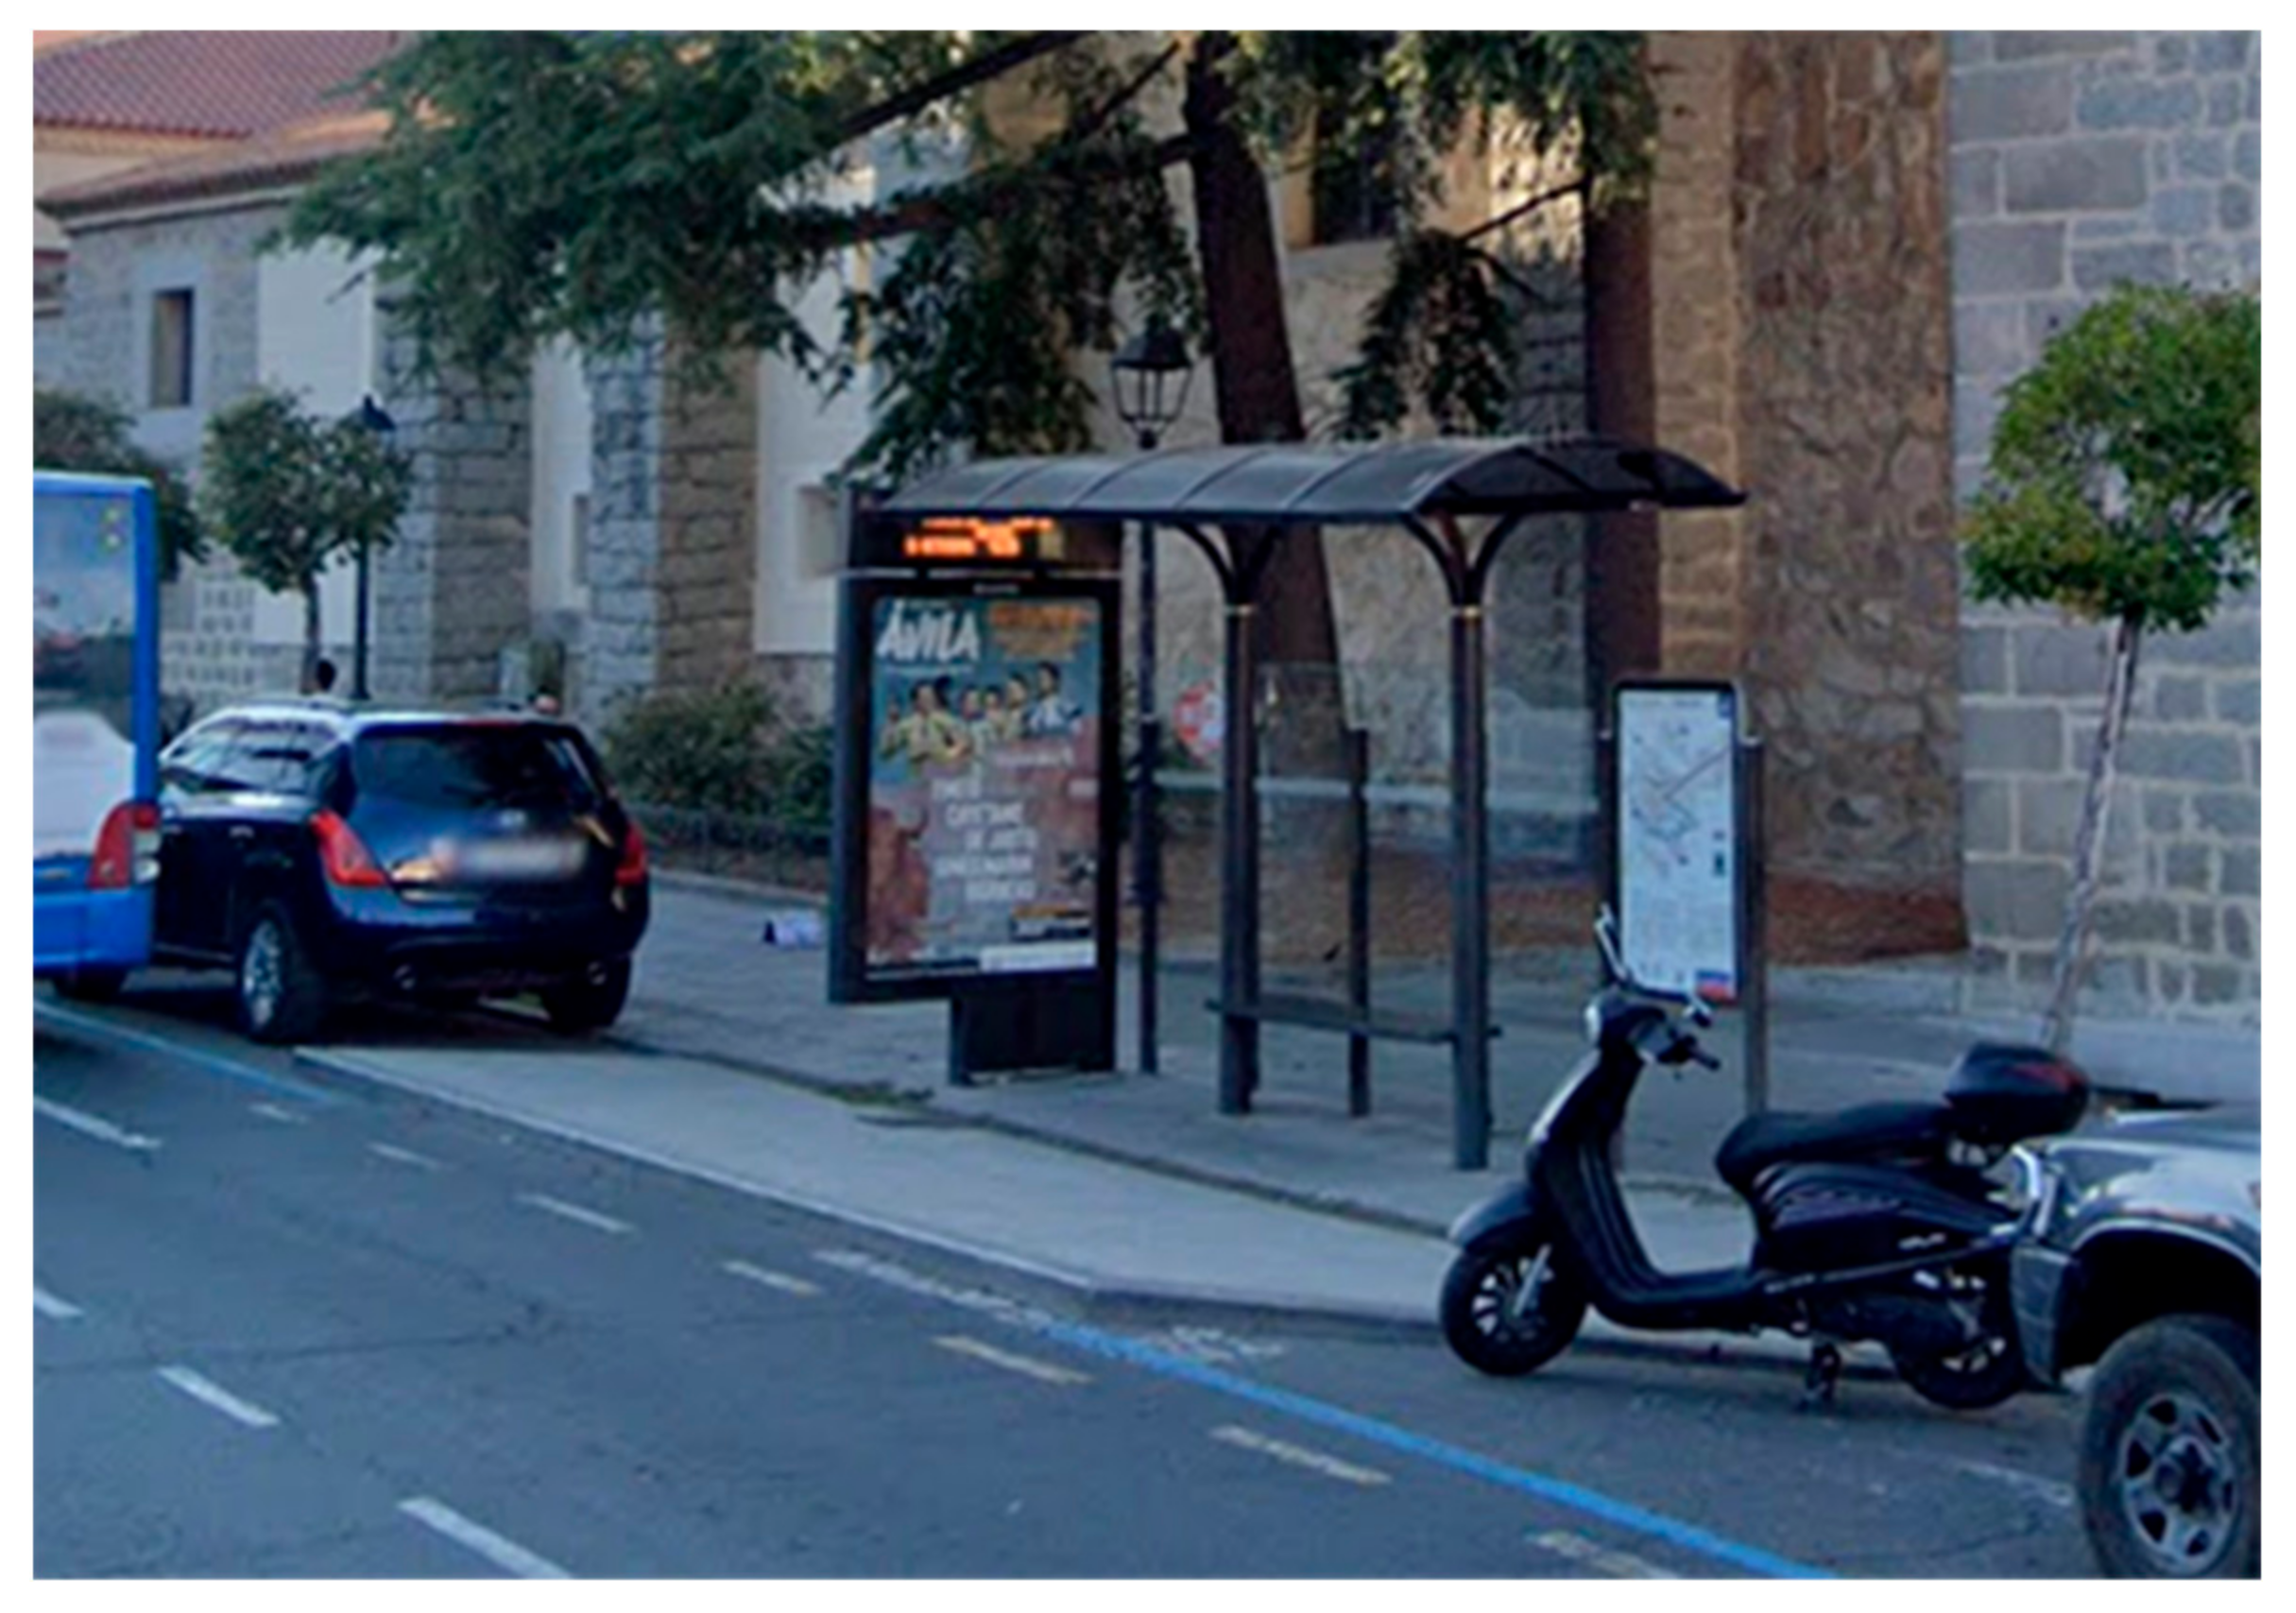
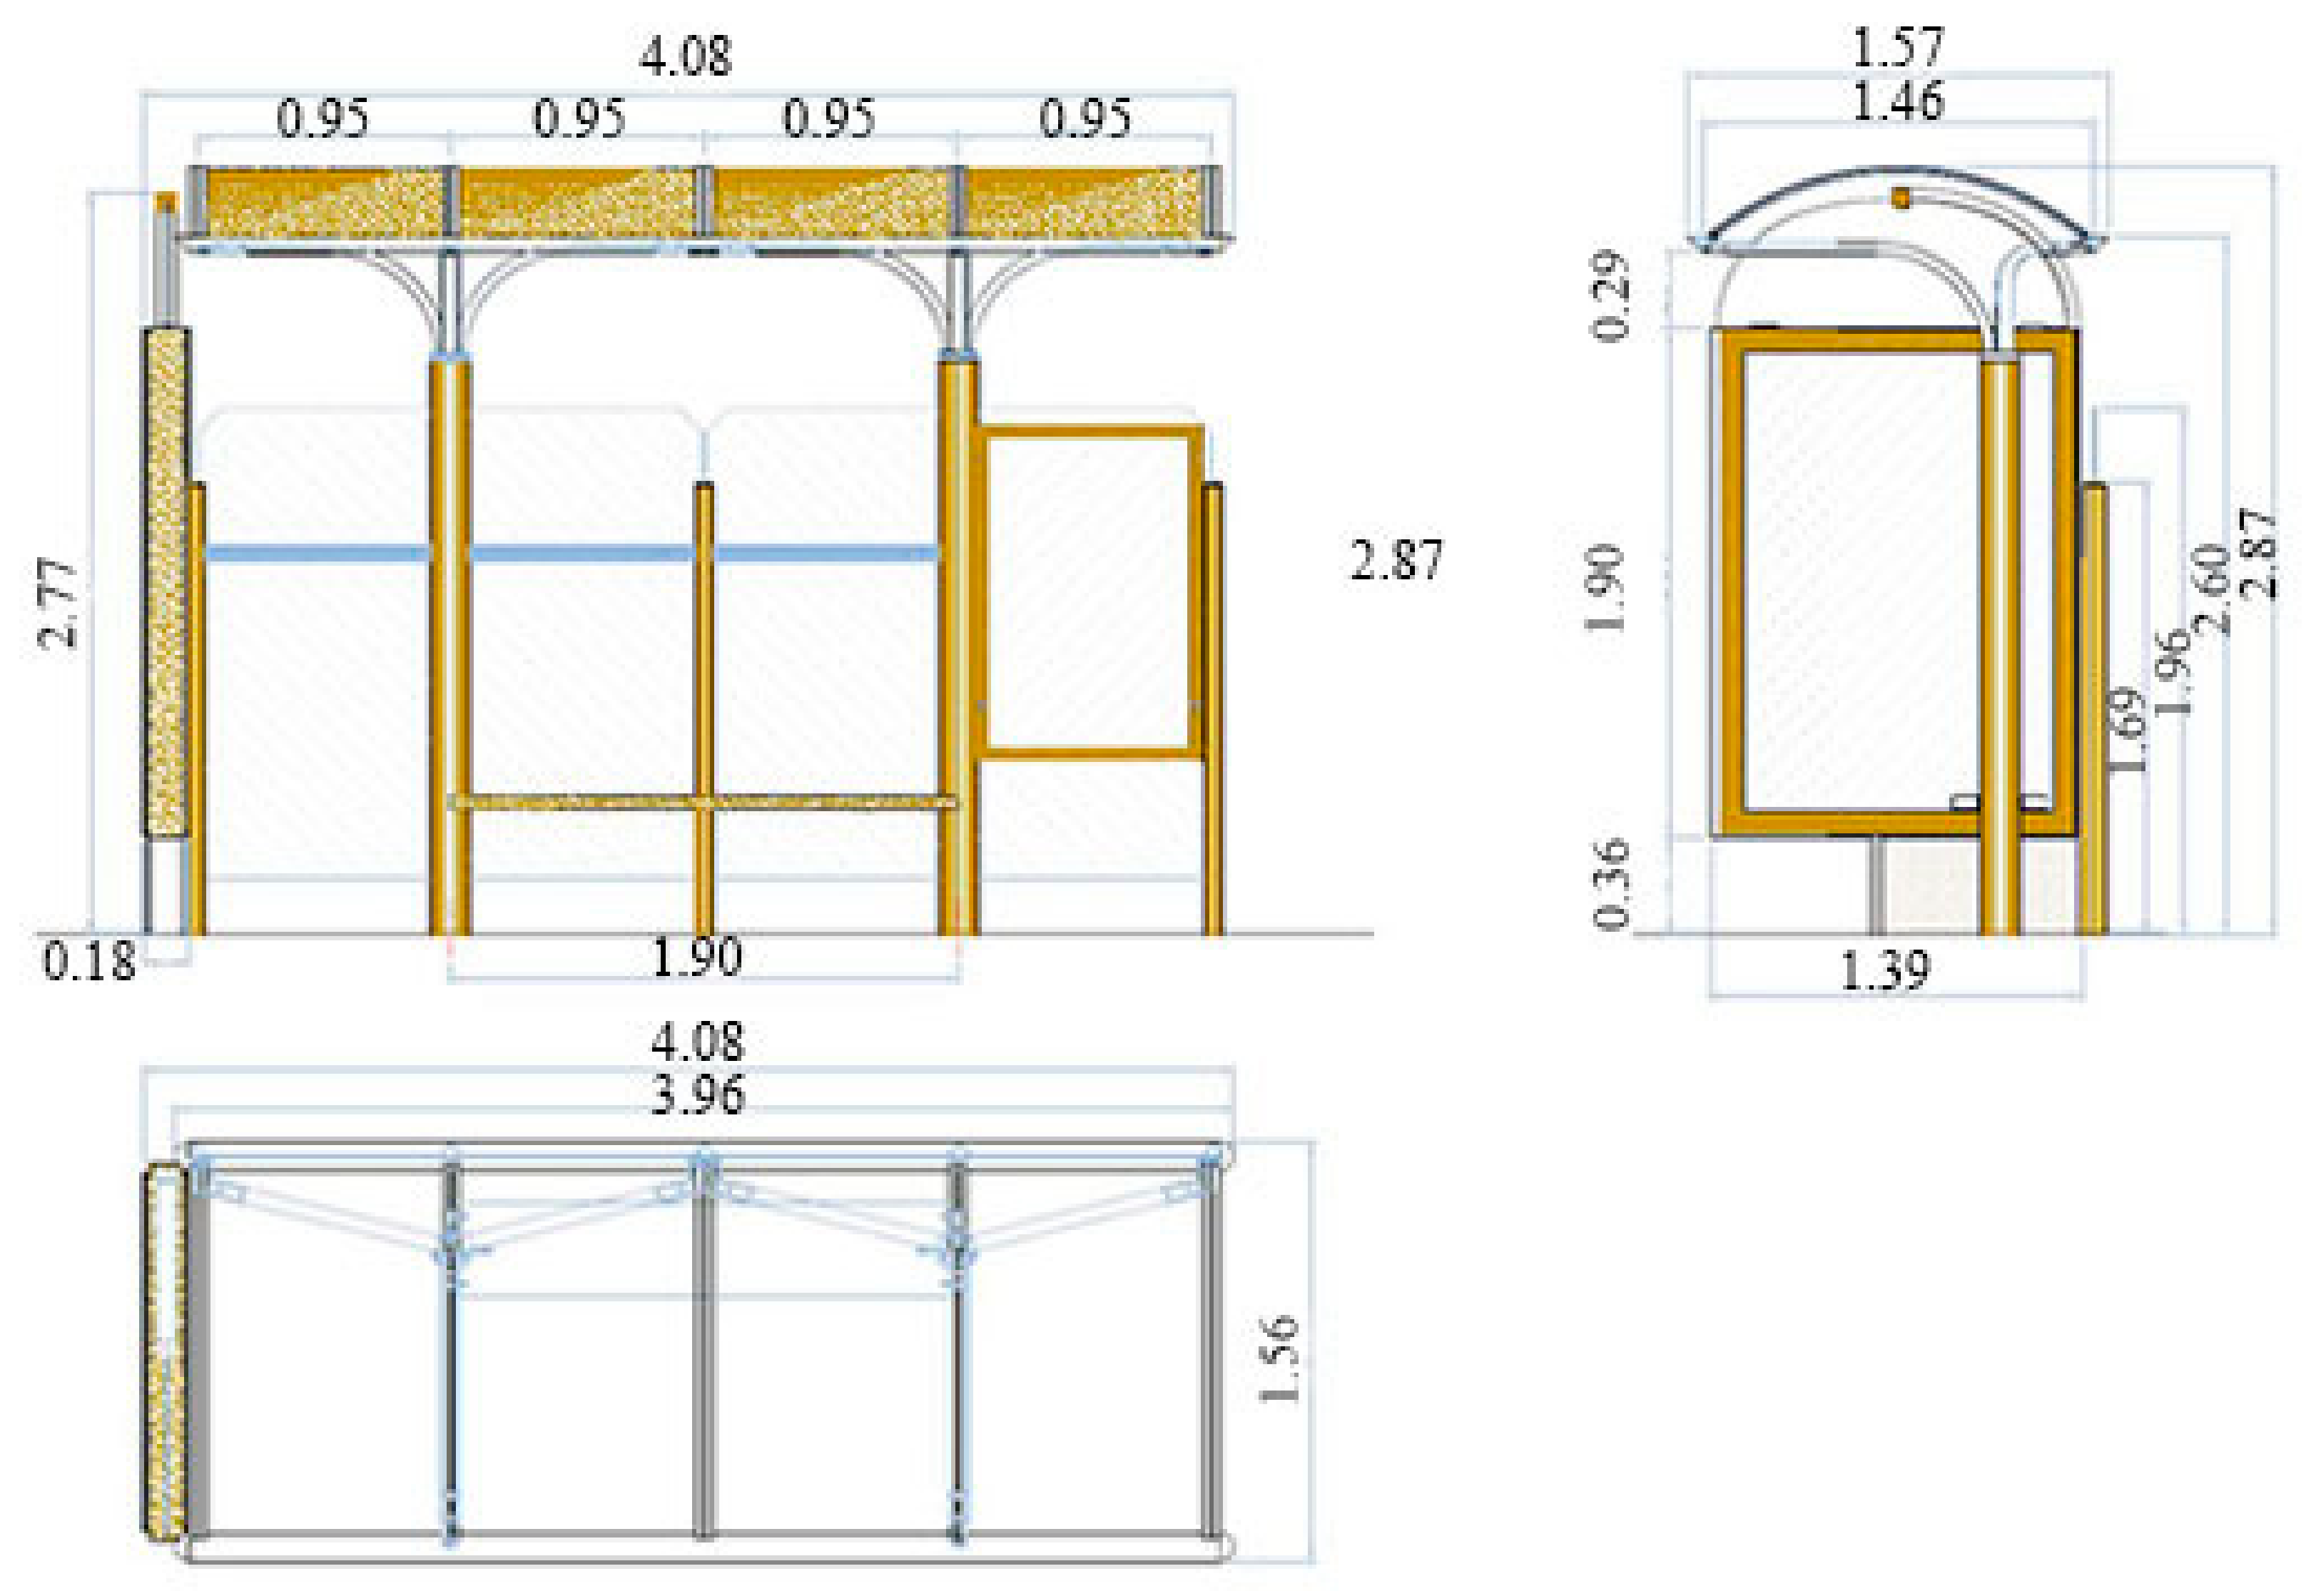
The current model of bus shelters installed has a curved roof which is currently not used for clean energy generation (Figure 3 and Figure 4).
In relation to the solar use of this type of structure, there are mainly two alternatives: (i) the use of conventional panels or (ii) the use of flexible panels.
Conventional solar panels are installed on surfaces with a constant slope (such as the rooftop of a building) either coplanar or with an auxiliary structure that allows the adjustment of orientation and slope. In the case of a rooftop without constant slope, such as the curved rooftops in the bus shelters of Ávila, the installation of this type of solar panel is only possible using auxiliary structures. Although this option allows a high degree of solar production, it generates an important visual impact caused by the lack of environmental integration. In addition, it requires the use of anchorages to join the solar panel to the rooftop using an auxiliary structure that can affect the bus shelter from a structural point of view.
Flexible panels are an alternative offered by the solar industry for structures with curved geometries. This type of panel adapts to any geometry. As a result, without the need of any type of auxiliary anchoring, a high degree of integration in the structure and with the architecture is achieved. An adhesive is used to fix this technology to the rooftop avoiding perforations that could affect the bus shelter from a structural point of view.
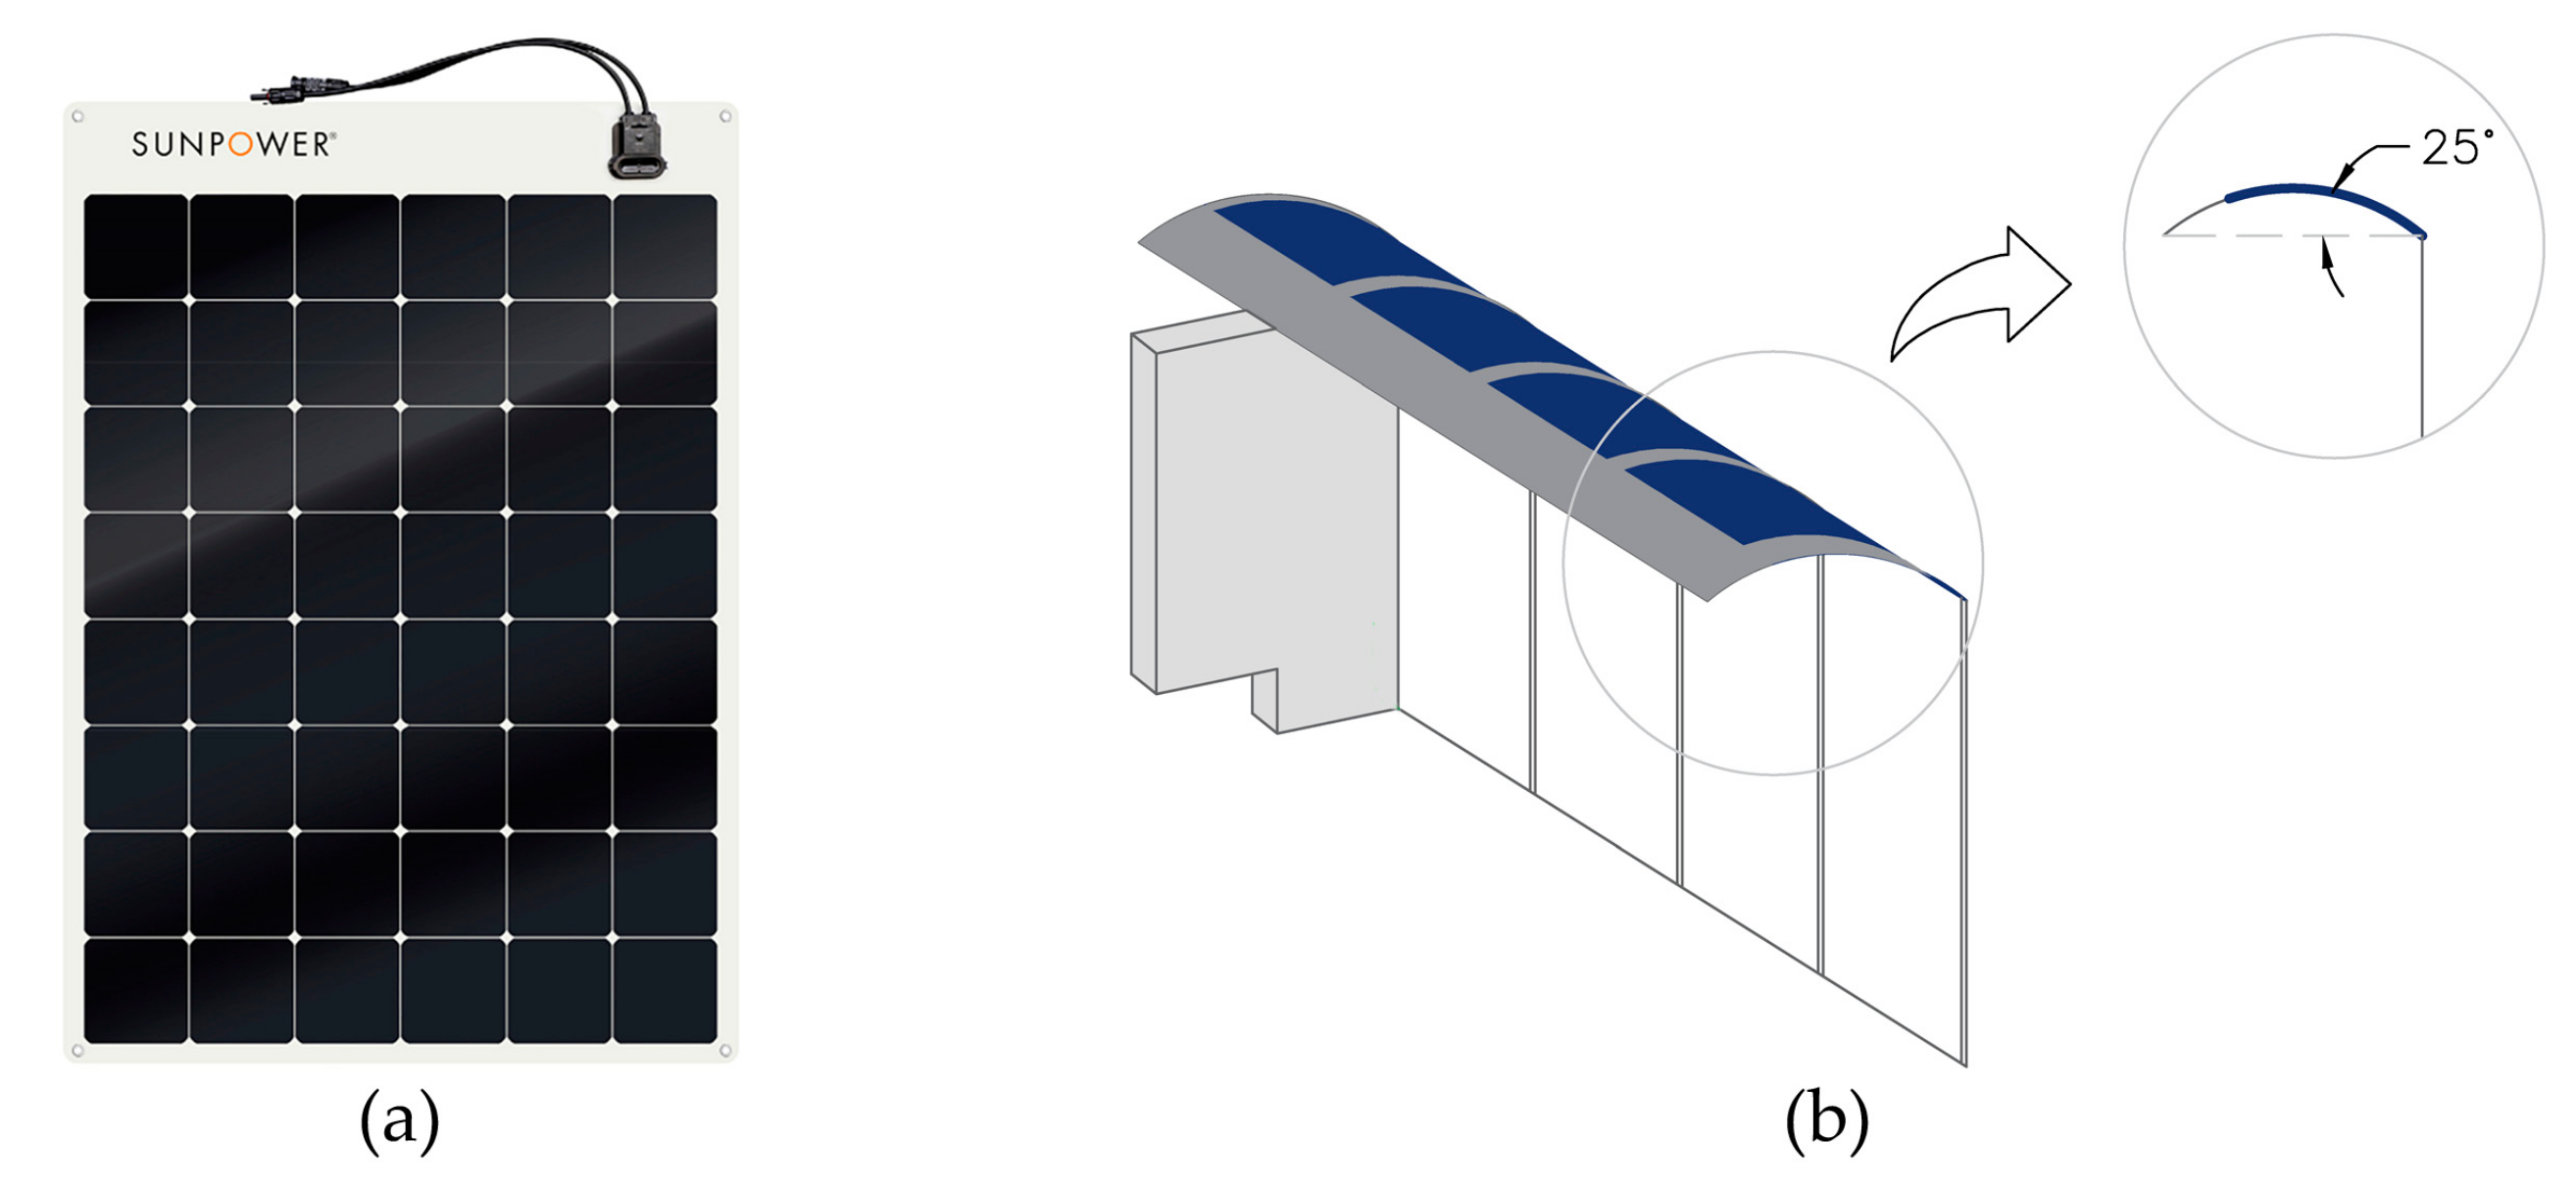
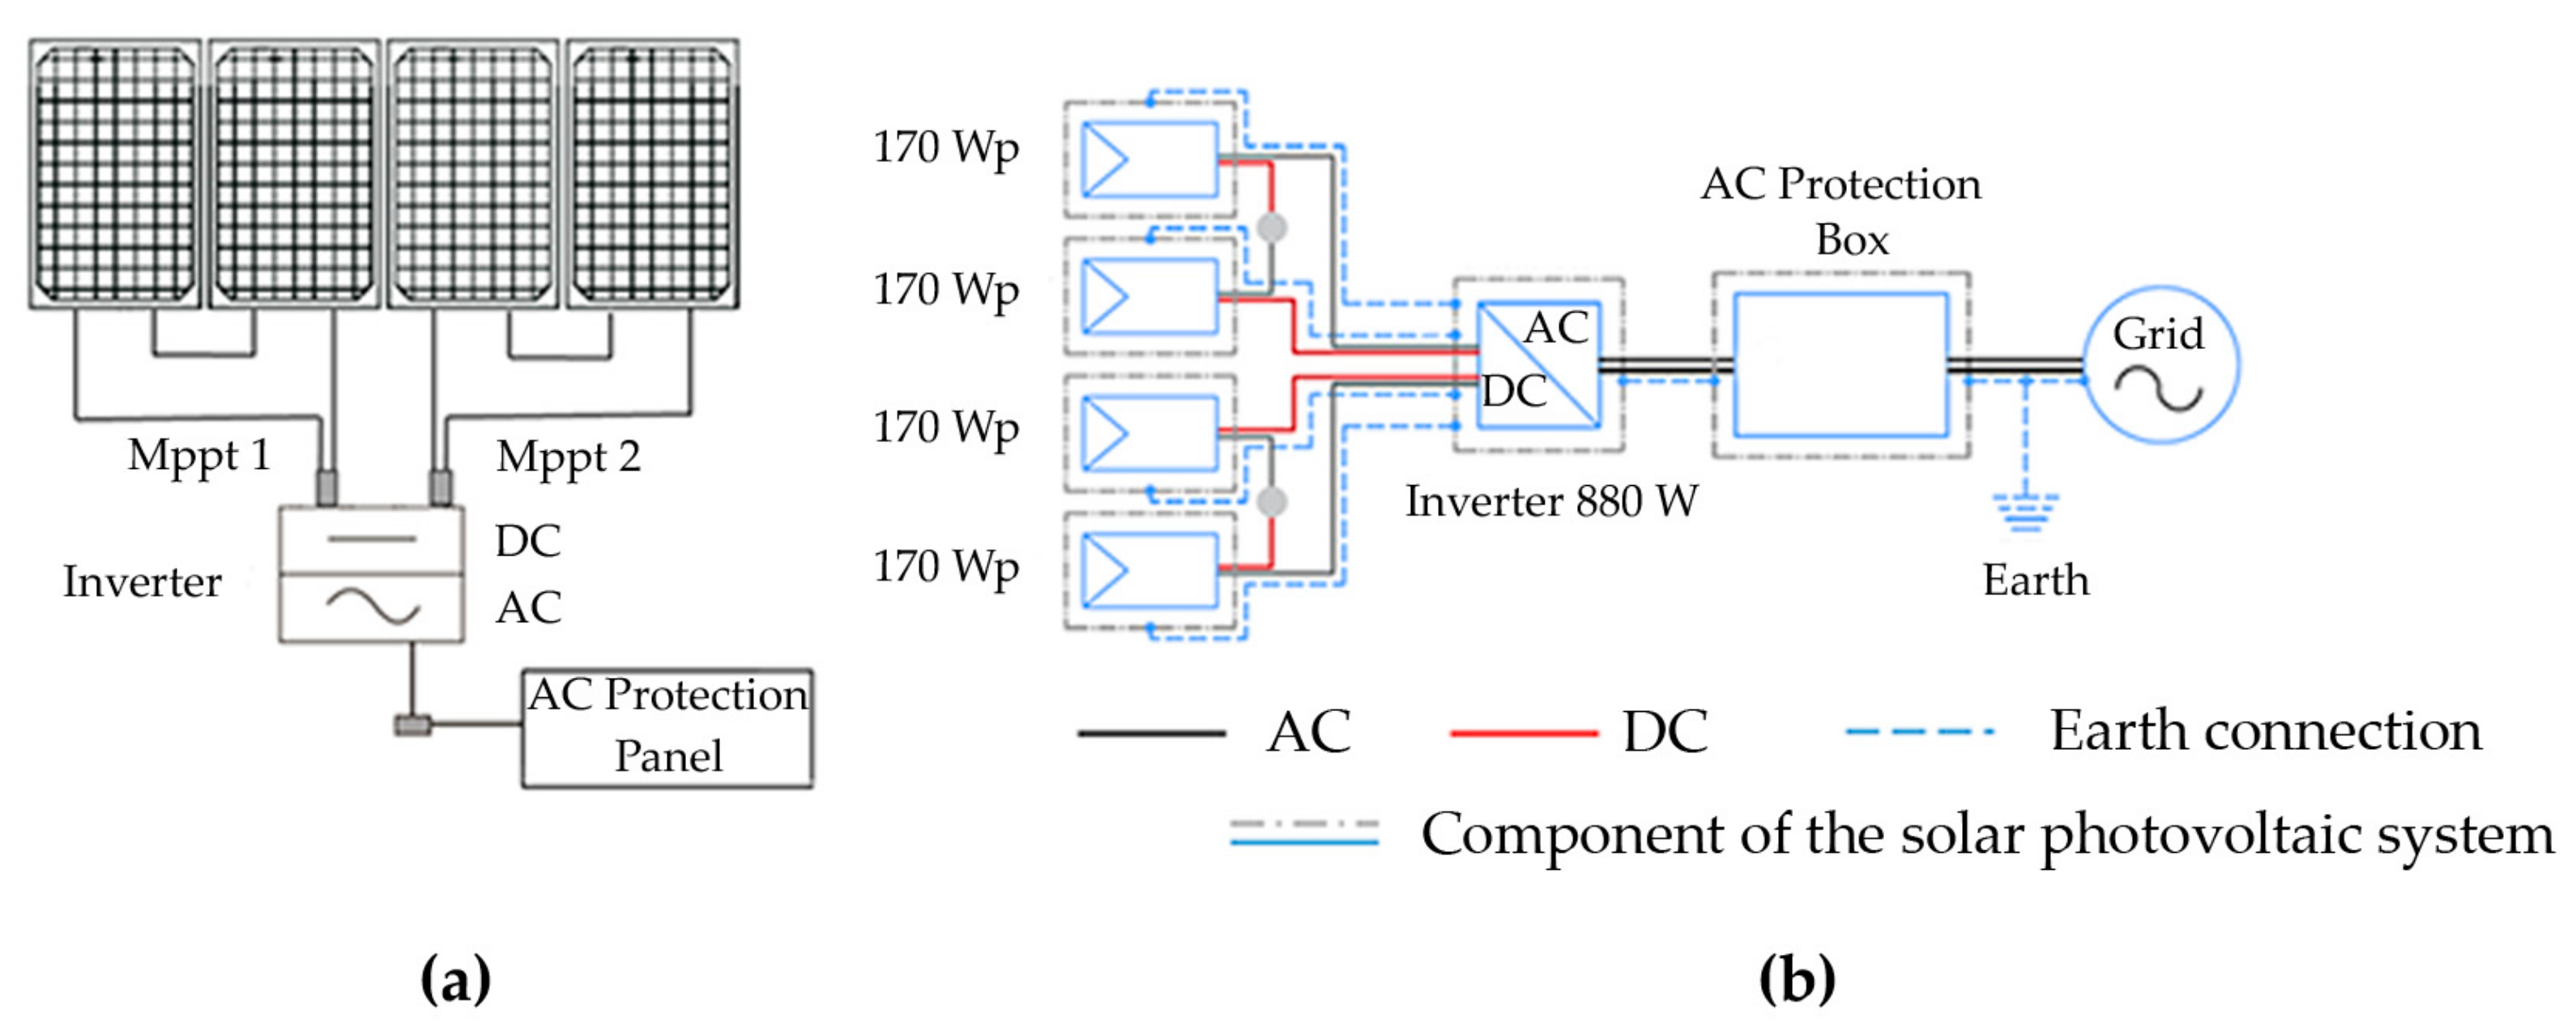
Based on all the above, the use of these structures for solar exploitation in an integrated way with the architecture involves the installation of flexible solar panels on the rooftop of the existing bus shelters. According to their geometry, it is possible to install 4 SunPower flexible panels with a maximum power of 170 W and 1153 × 810 × 20 mm [38] where the average slope is 25 degrees (Figure 5 and Figure 6). The use of two maximum power point trackers (mppt) allows to achieve better efficiency of the installation in the presence of shadows.
2.2. Methodology for Solar Potential and Shadow Estimation
2.2.1. Solar Potential
The PVGIS web tool was used for the estimation of solar radiation and potential in bus shelters. This universal web tool has a simple interface that includes shadows in the estimation, allowing the user to incorporate a horizon profile for more accurate results.
For the research presented in this article, the input parameters for the computation of solar radiation in each bus shelter were:
- Solar radiation database PVGIS-SARAH2 is used as a source of solar radiation data because it presents a current temporal range of years 2005–2020. This is a database produced by the Satellite Application Facility on Climate Monitoring (CMSAF). It covers Europe, Africa, most of Asia and parts of South America;
- PV technology: crystalline silicon is the technology chosen because it is the most used to estimate the losses due to temperature and irradiance effects;
- Installed peak PV power [kWh]: since the flexible solar panel used has an output of 170 Wh and 4 panels are to be installed, the maximum installed photovoltaic power expressed takes the value of 0.680 kWp;
- System losses [%]: the estimated system losses are all the losses in the system that cause the power actually delivered to the electricity grid to be lower than the power produced by the PV modules. There are several causes for this loss, such as losses in cables, power inverters, and dirt (sometimes snow) on the modules. In general, it is considered that the losses of the system are between 10 and 20% for the estimation of solar production, so in this case, the average value (14%) has been considered as the value;
- Mounting position: for fixed (non-tracking) systems, the way the modules are mounted will have an influence on the temperature of the module, affecting their efficiency. Experiments have shown that if the movement of air behind the modules is restricted, the modules can increase their temperature up to 15 °C at 1000 W/m2 of sunlight. In the application, there are two possibilities: free-standing, meaning that the modules are mounted on a rack with air flowing freely behind the modules; and building-integrated, which means that the modules are completely built into the structure of the wall or roof of a building with no air movement behind the modules. In this case, the building-integrated option is chosen because of its lesser structural impact on the bus shelter;
- Slope: although the tool allows estimating the slope of the solar panels in an optimal way, an angle of 25° has been considered due to the average slope of the roof;
- Azimuth: this parameter is different for each bus shelter. It takes the value according to the orientation of the bus shelters and PVGIS criteria: north (180°), south (0), east (−90°) and west (90°).
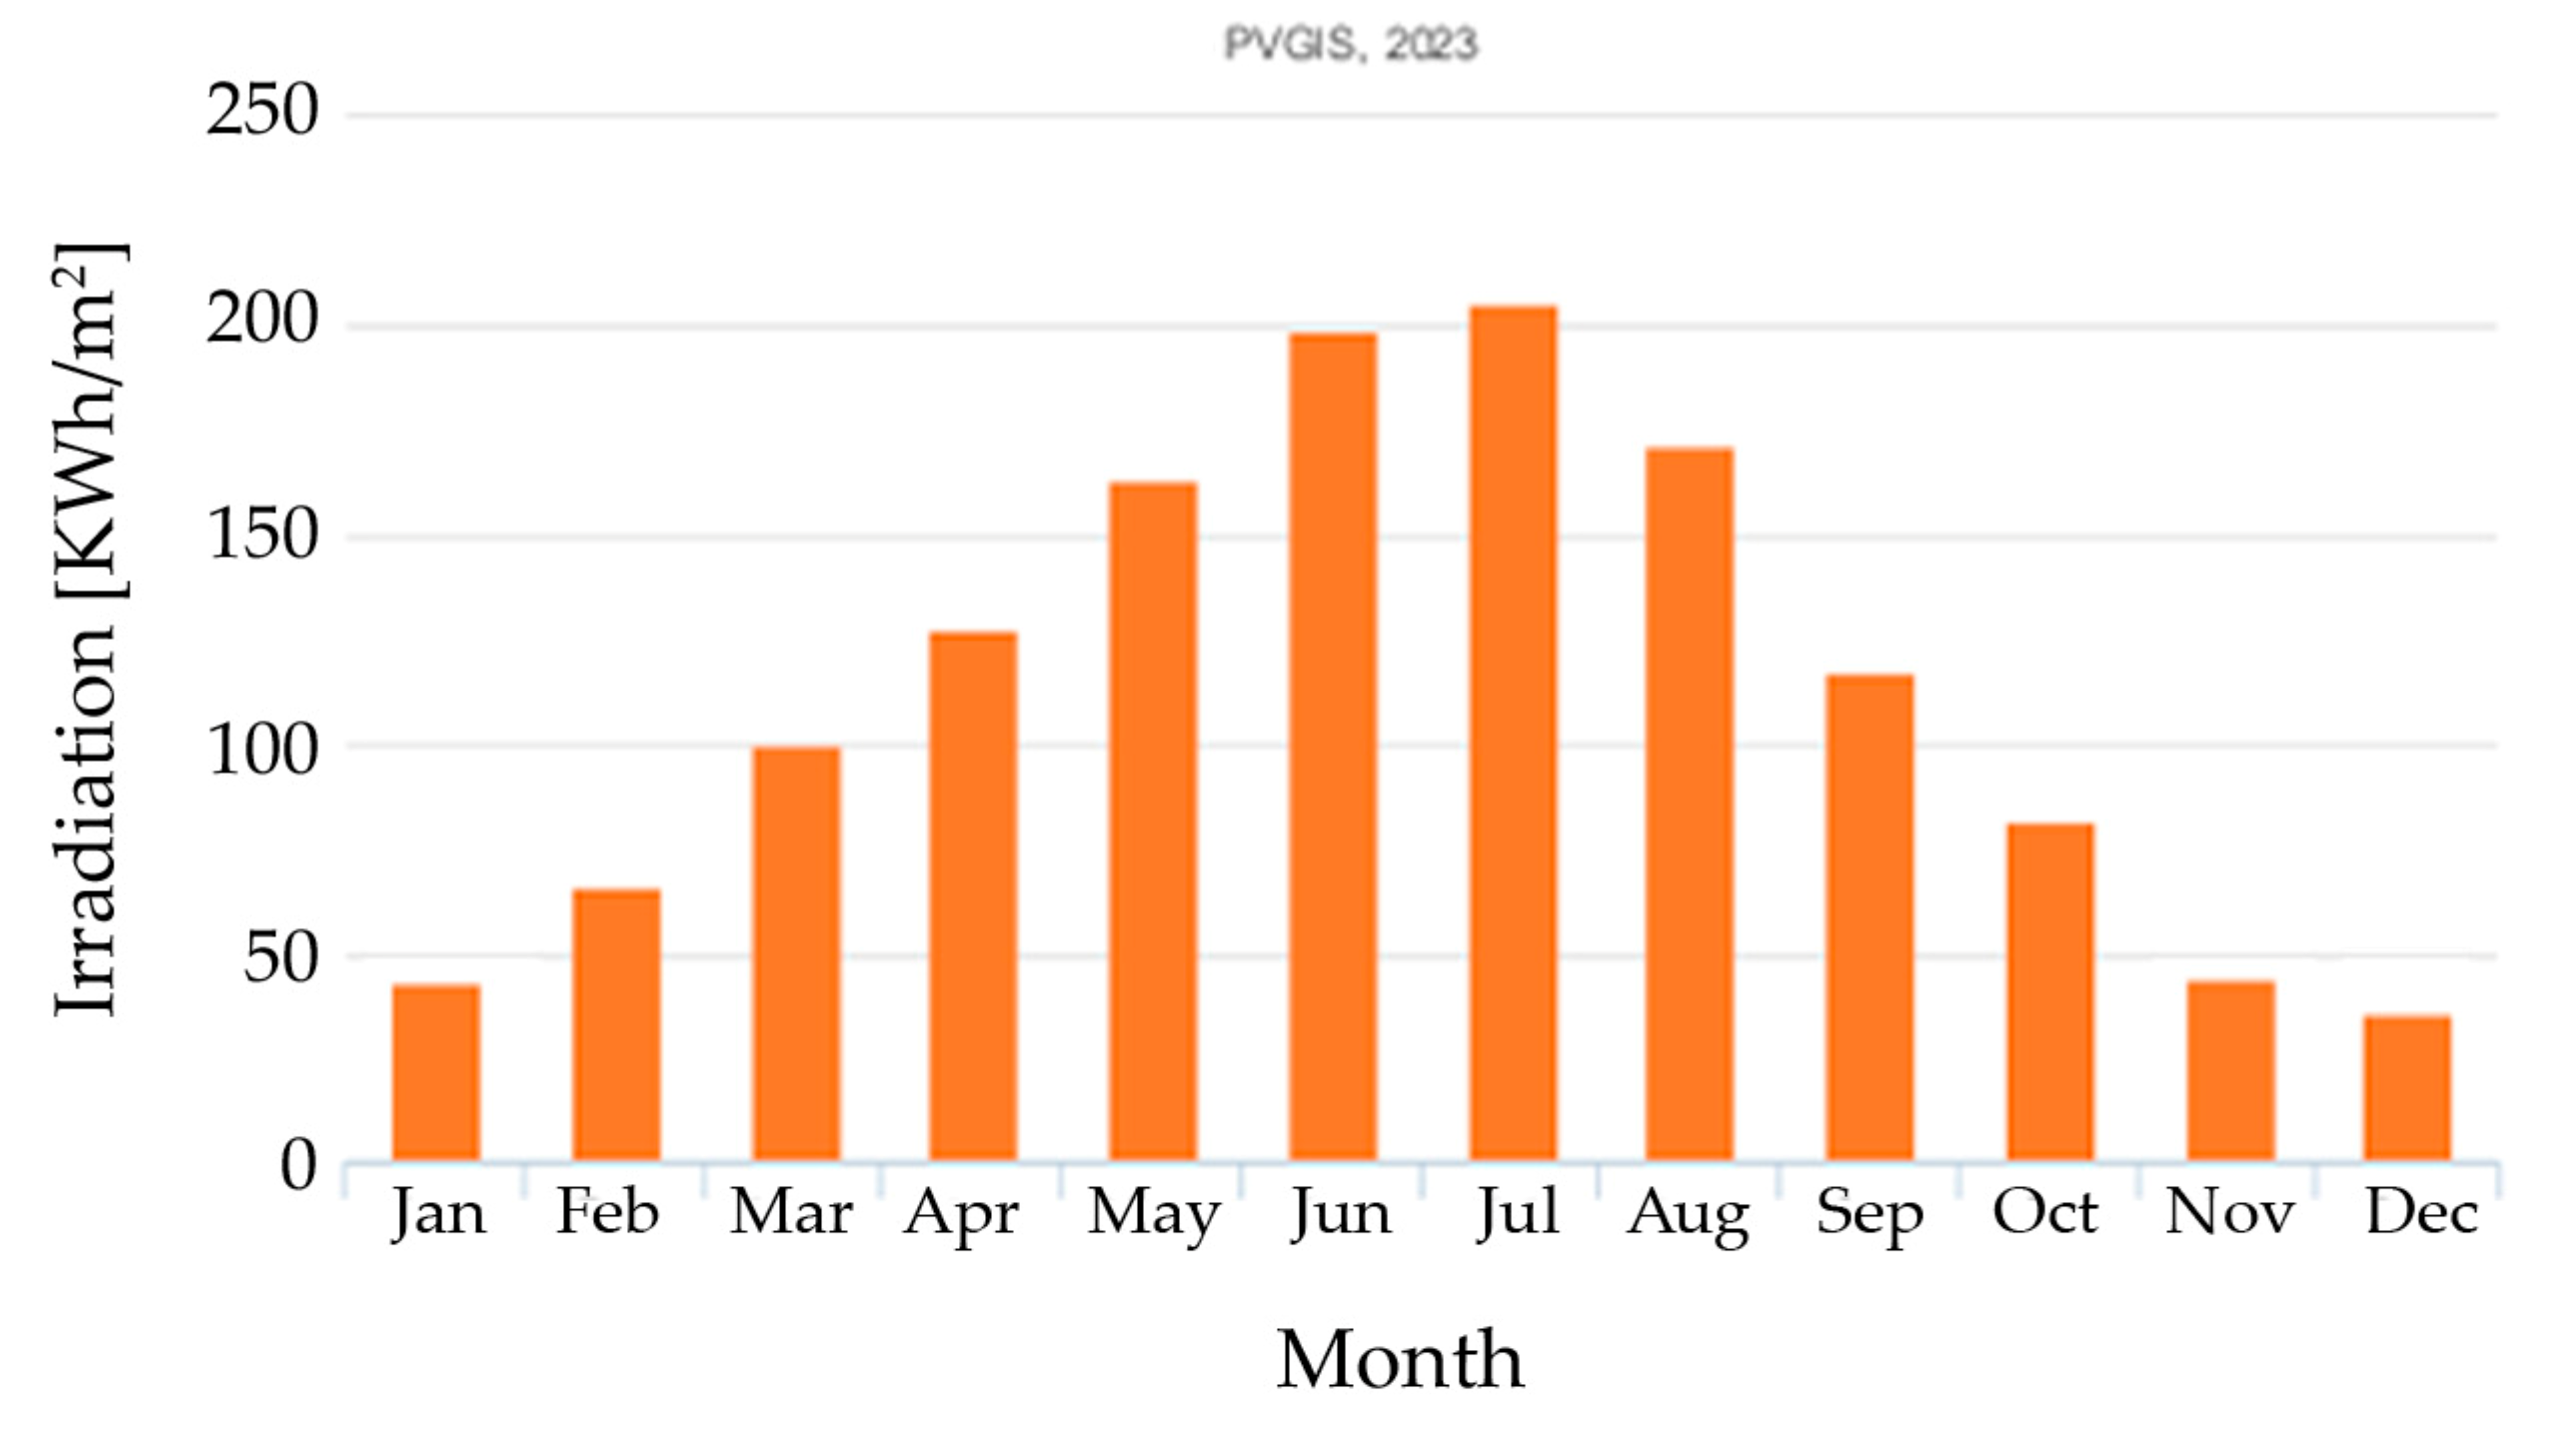
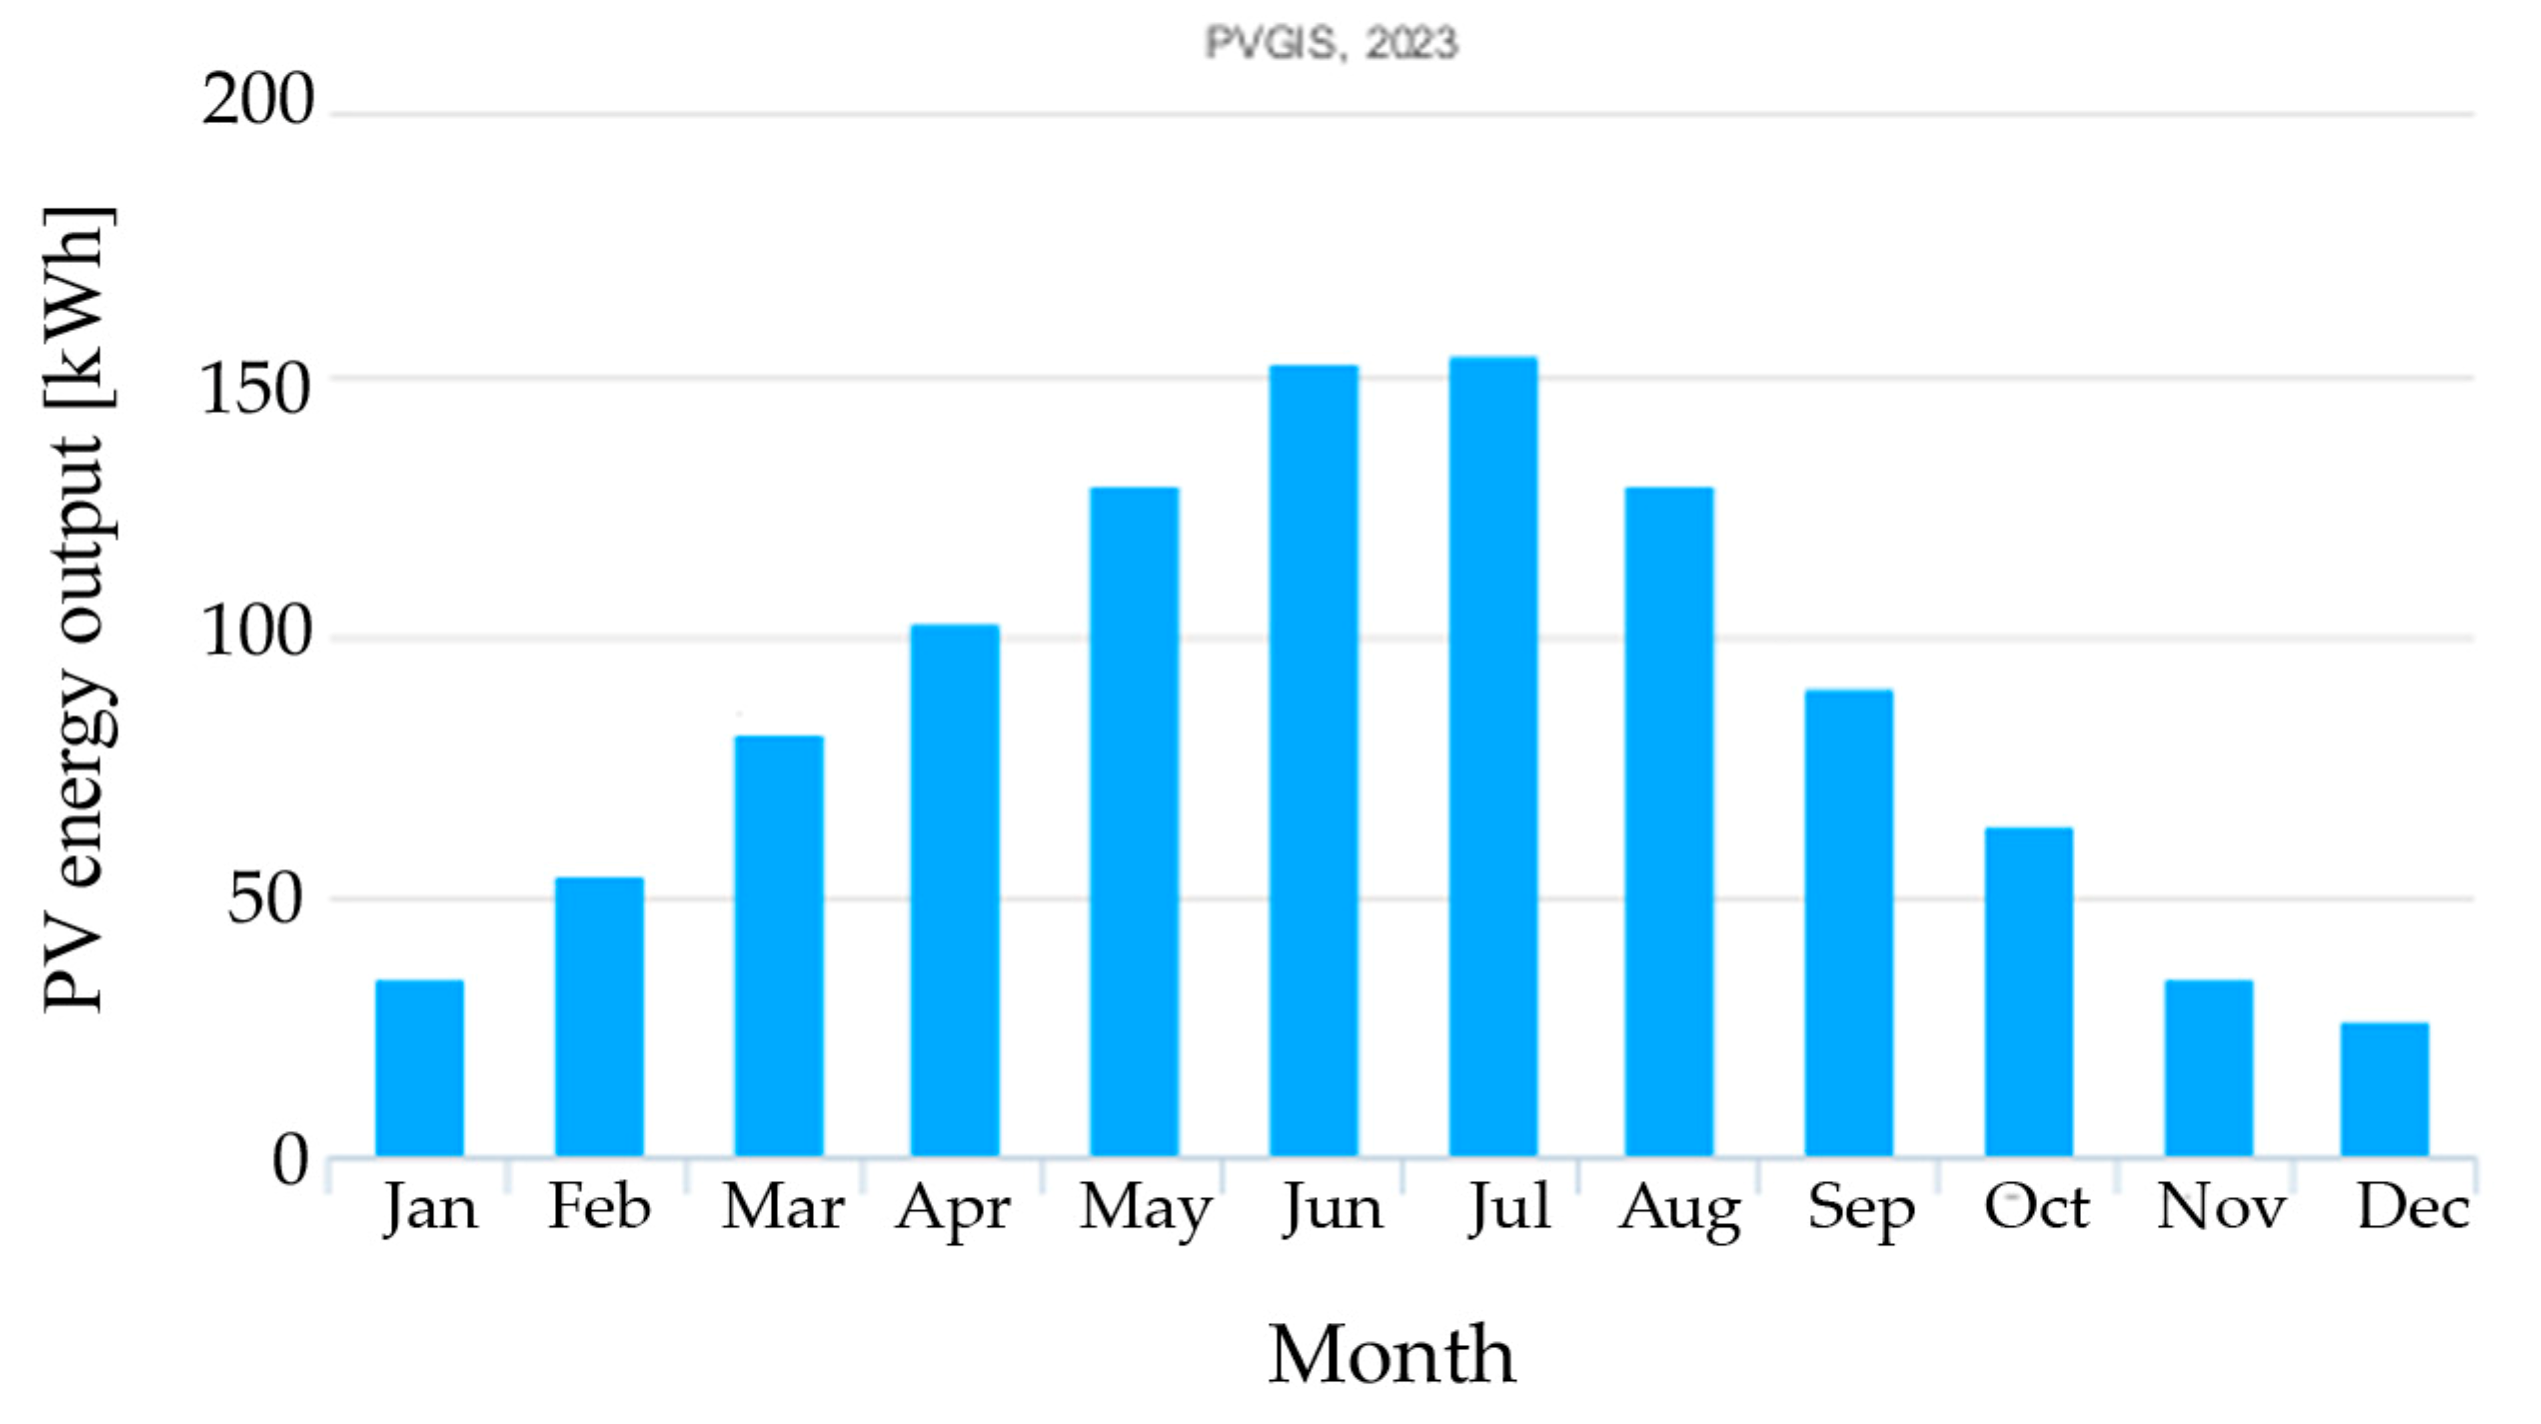
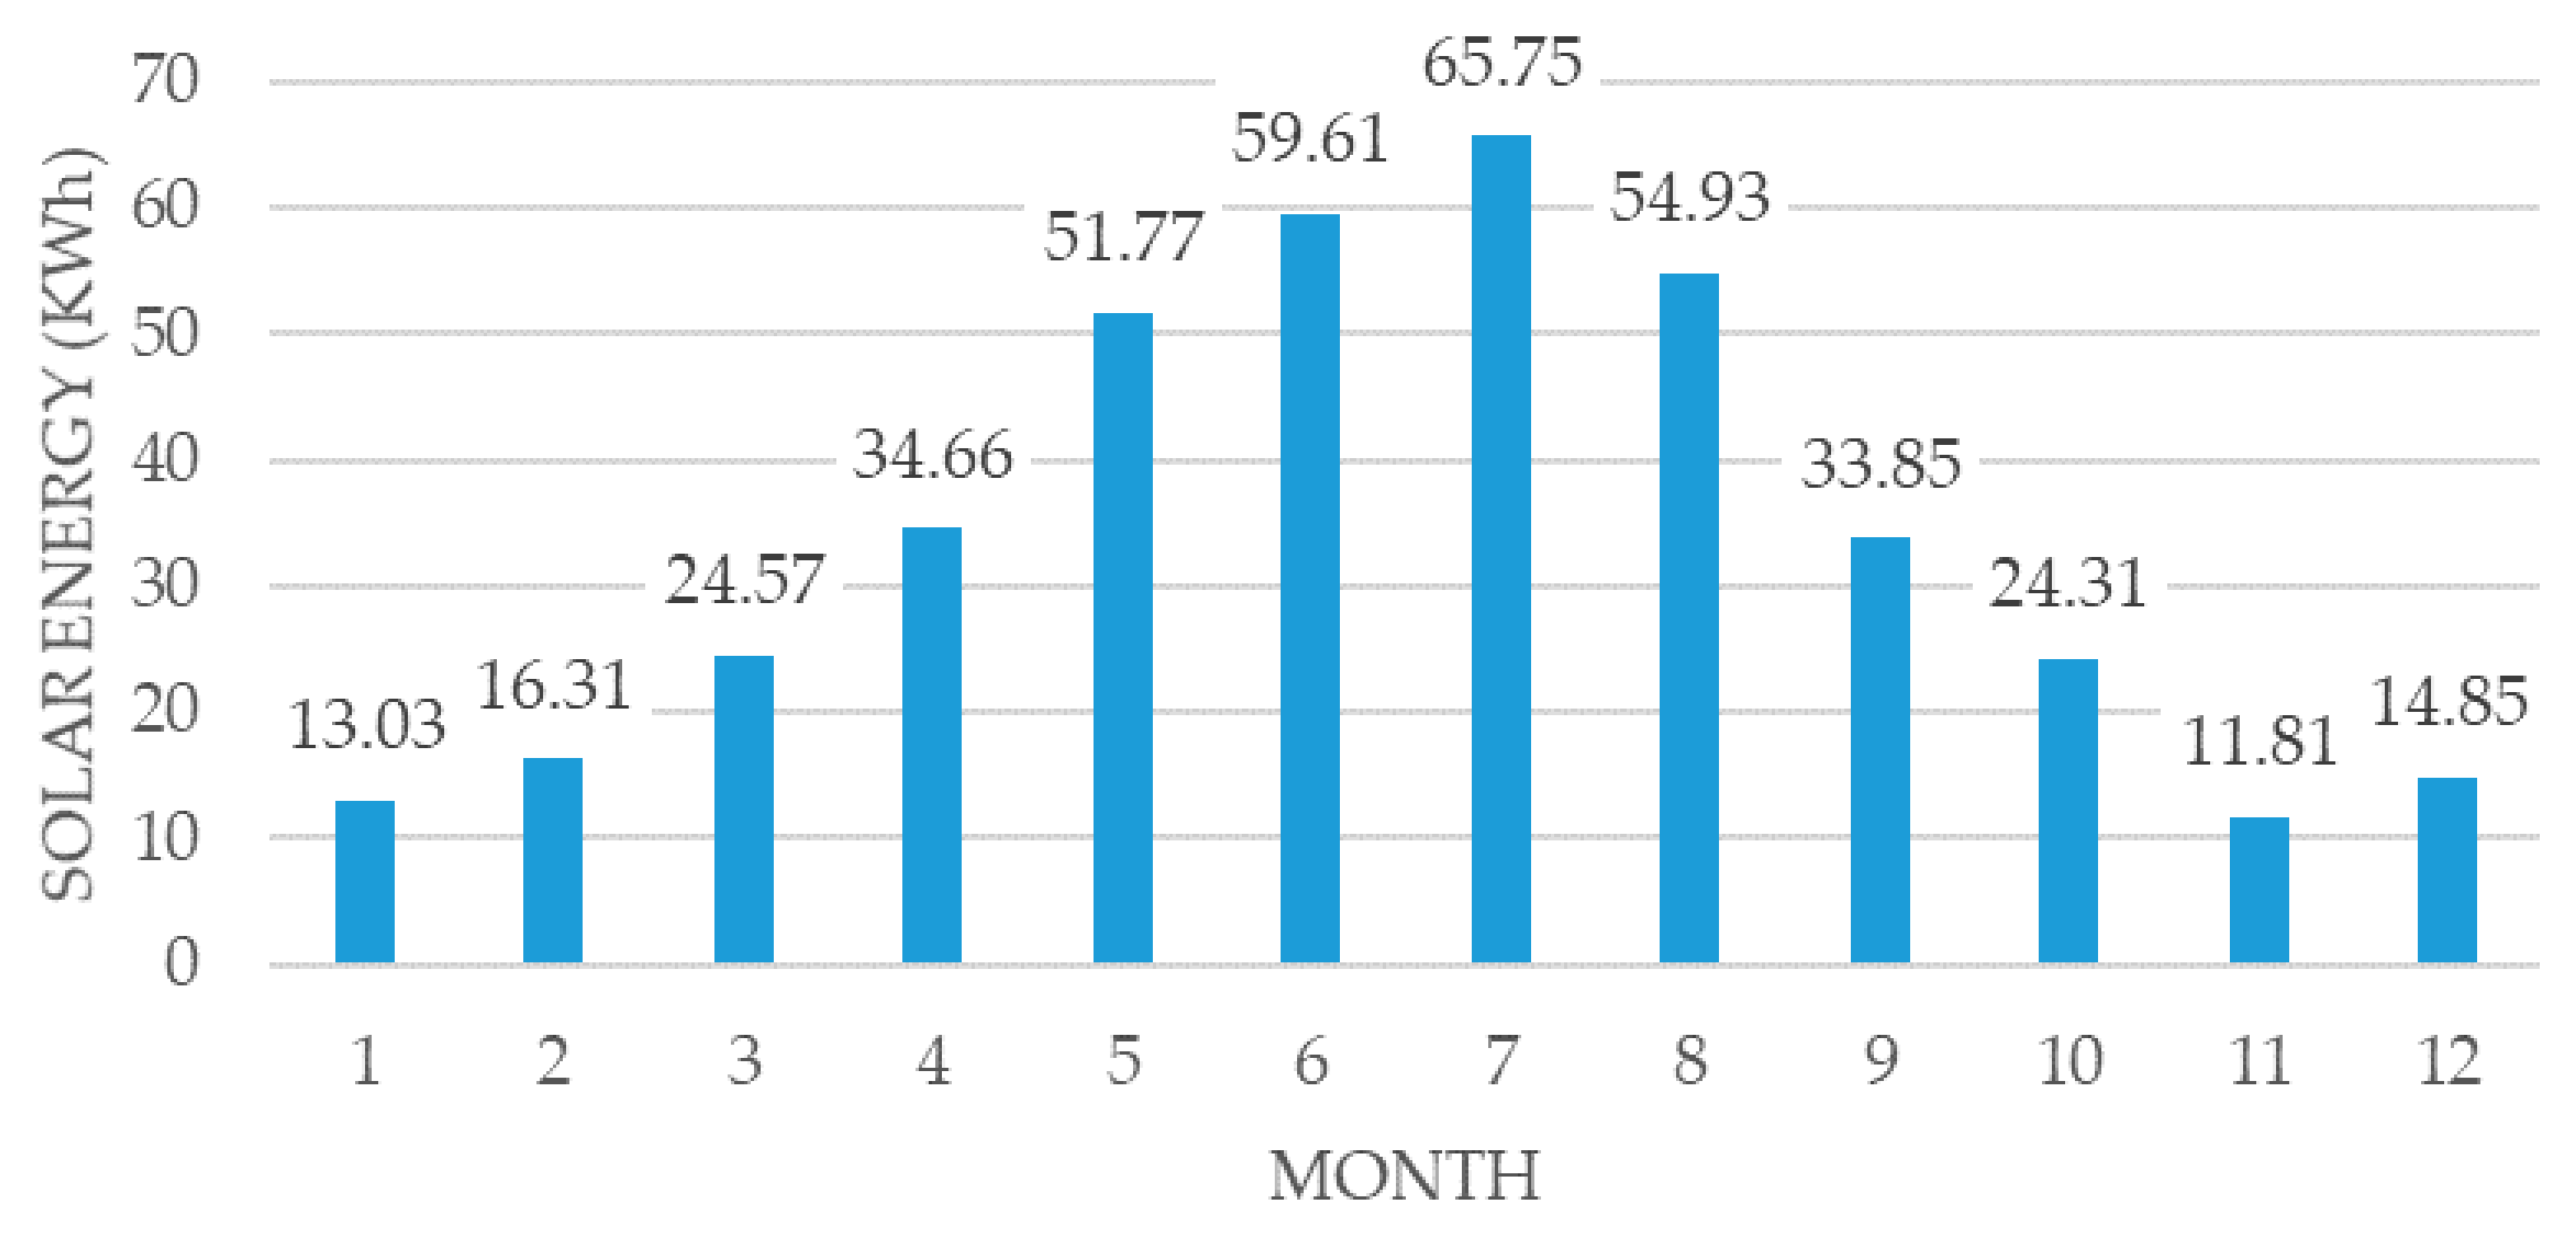
Based on the indicated parameters, the PVGIS tool provides all input and output data (irradiation and energy production) in different ways: (i) csv format; (ii) json format (iii); web format. This last option allows the direct visualization through dynamic graphs and tables that show the estimated average amount of irradiation (Figure 7) and the average amount of production (Figure 8) expected for each month based on the input data.
2.2.2. Horizon Height
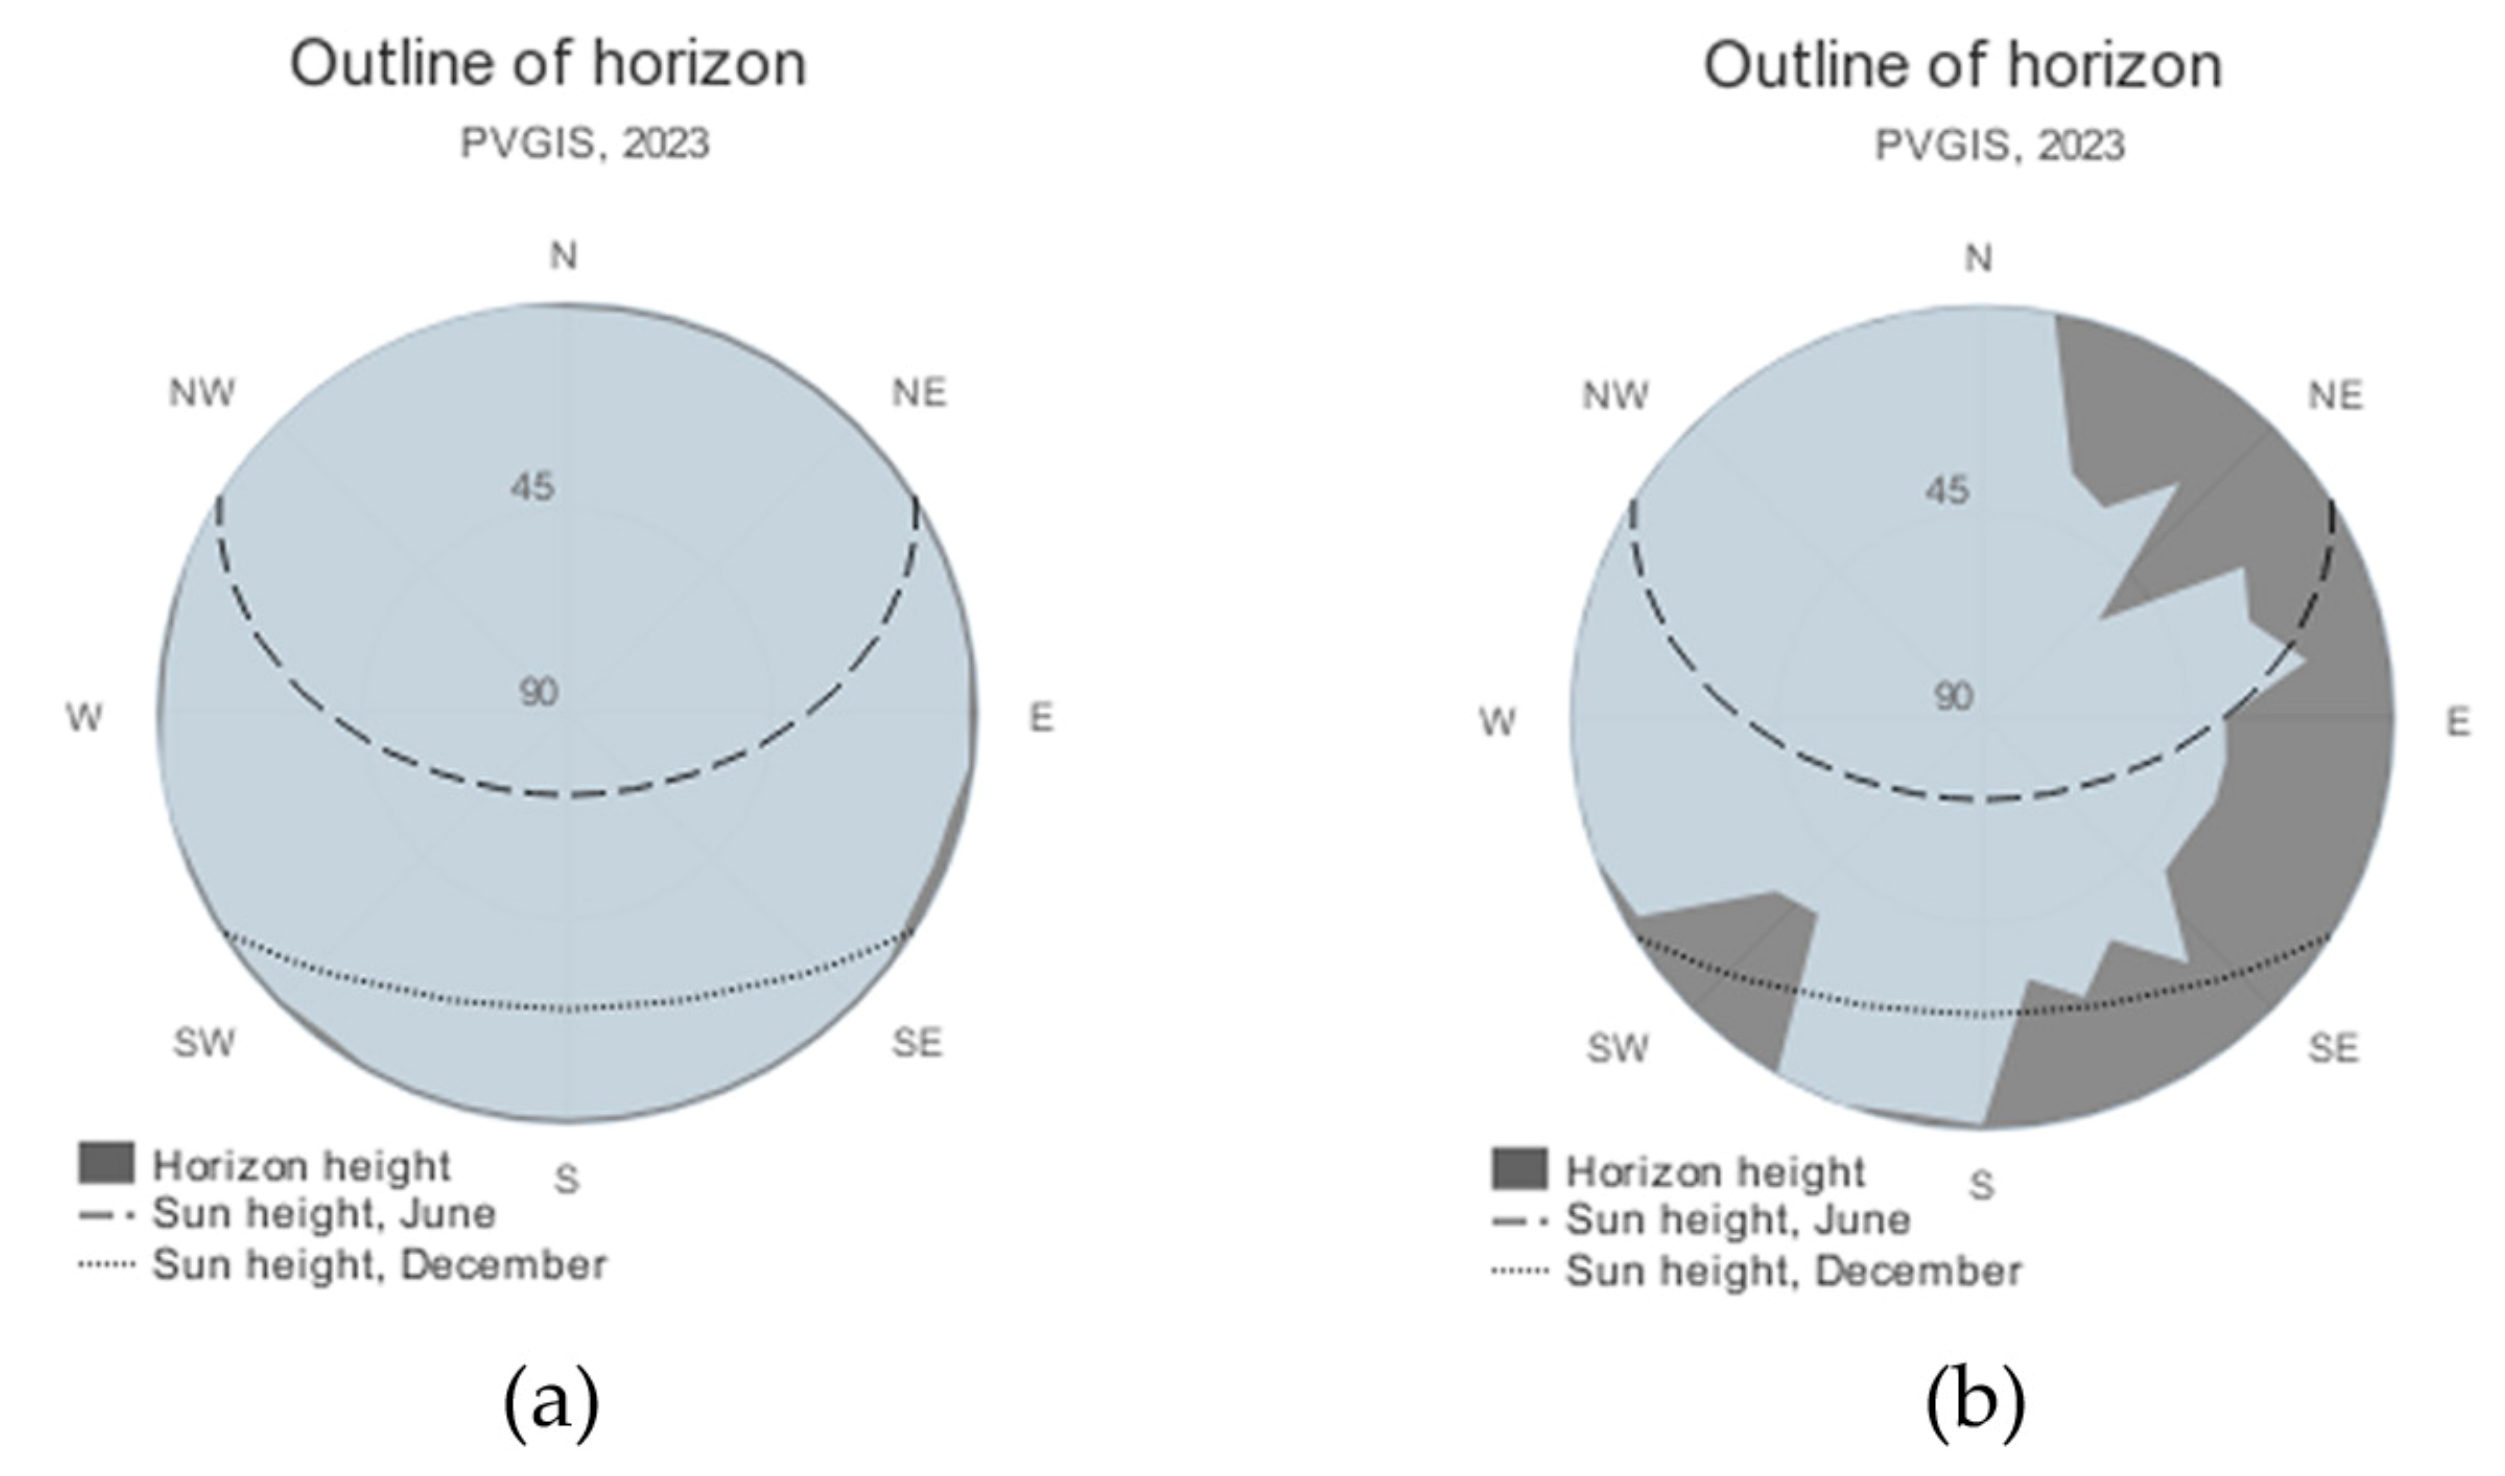
The presence of shadows is one of the main disadvantages of a PV installation in cities in general, and in urban furniture in particular. The PVGIS tool allows the shading of the installation to be included in the calculation. By default, PVGIS includes terrain shadows in the estimation of the solar potential, calculated from a database of horizon height around any chosen point. In this way, the calculation of the PV performance can take into account the effects of mountains and hills casting shadows onto the PV system (Figure 9a). The resolution of the horizon information is 3 arc seconds (around 90 m), so small objects such as houses, or trees are not included. However, the user has the possibility to upload their own information about the horizon height in order to improve the energy results (Figure 9b). For this, uploading a horizon file is necessary, either in the form of a text file (.txt) or a spreadsheet as comma-separated values (.csv). This file must include the horizon height in degrees around the point of interest from the north (0°) growing clockwise. The values are assumed to represent horizon heights at equal angular distances around the horizon.
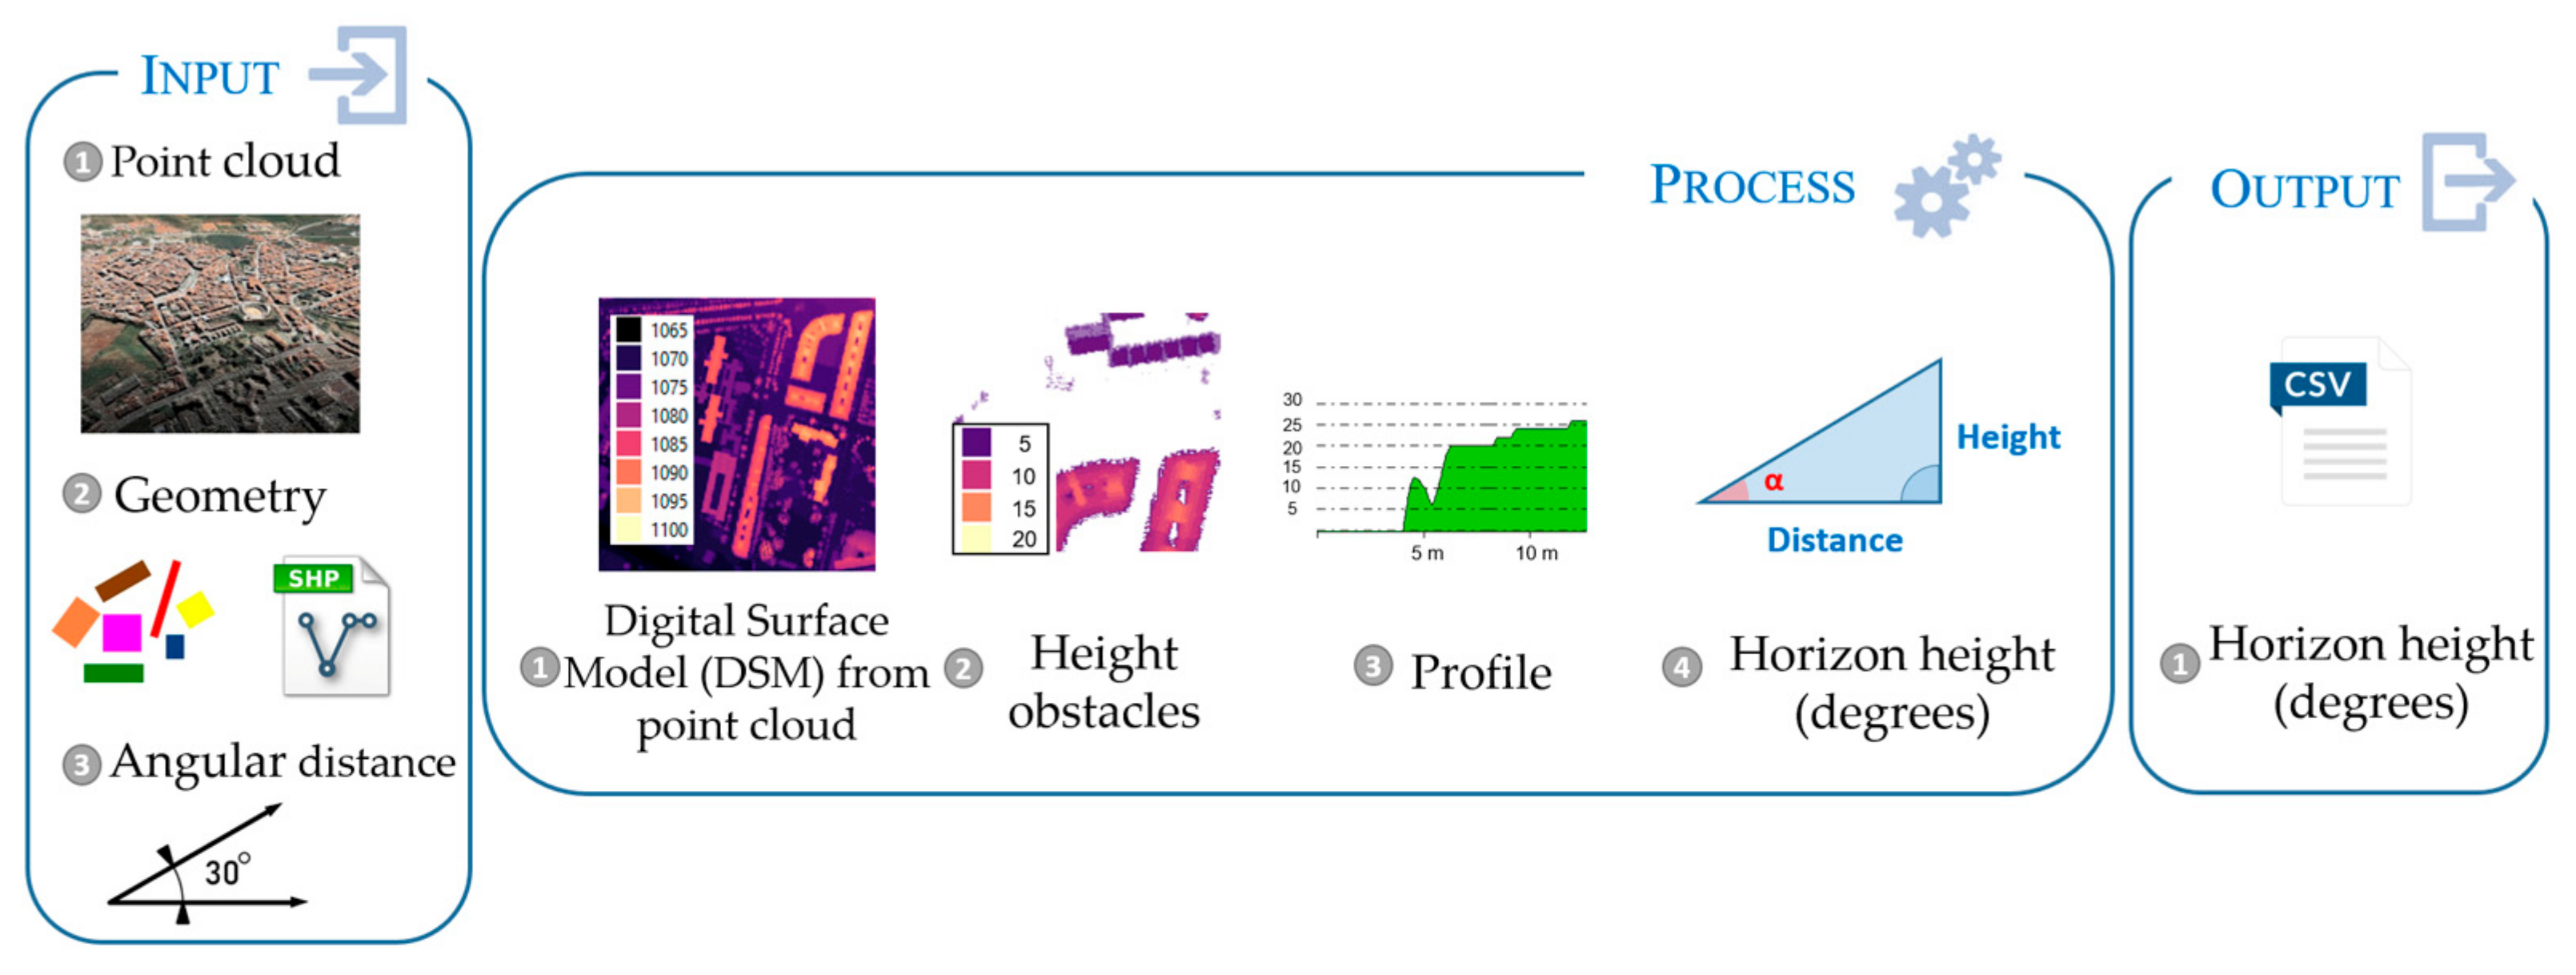
With the aim of obtaining a precise estimation of the shadows on bus shelters, including the real obstacles within a city such as buildings and other types of constructions, or trees, a methodology has been developed to automatically obtain the horizon height at a given point. The output of the methodology developed is a file with the horizon height in csv format (Figure 10).
The methodology, developed under the Matlab programming language, requires three input data:
- Point cloud: LiDAR point clouds are a geospatial data source made up of millions of points which position in space is known (X, Y, Z) resulting from data collection with a laser scanner. In Spain, the National Geographic Institute offers free and updated LiDAR information for the entire country through the PNOA program (National Program for Aerial Orthoimagery), in .laz format with different characteristics depending on the year of flight capture [39]. Specifically, two point clouds were used for this study, with different point densities. Table 3 summarizes the main characteristics of the point clouds.
- Geometry: The position (x, y, z) of the bus shelter and its dimensions is another essential piece of information to evaluate and identify the obstacles that can generate shadows. These data must be in a polygon shapefile, which attributes contain the dimensions of the installation as well as its height;
- Angular distance: The precision of the outline of horizon is not only based on the precision of the height value but also on the number of values that make it. As it is possible to know the value of the height of any point from the point cloud, it is mandatory to know at what angular distance this data is wanted. As an angular value, to obtain the horizon profiles, an increase of 10° has been considered.
From these input data, the process followed to obtain the horizon height has four steps:
- Digital Surface Model (DSM) from point cloud: A LiDAR point cloud is characterized by being a geospatial product with discrete values. The first step is to obtain a continuous product (regularly distributed height data) that contains the elevation value (DSM) with a spatial resolution of 20 cm;
- Height of obstacles: based on the height at which the installation is located (which is included in the methodology in the form of a shapefile representing the bus shelter under study), a new file (geotiff format) is generated with the difference in height between the installation and all those surrounding areas with a higher height value. Those zones with a height lower than or equal to the installation take the value of 0;
- Profile: taking the centroid of the bus shelter (in the shapefile element) as the starting point in combination with the height of the previously obtained obstacles, the elevation profile is extracted separated by the indicated angular distance (10°);
- Horizon height (degrees): From the elevation profile obtained for each direction, the closest obstacle is evaluated, extracting the value of the height and the distance at which it is located. With these data and applying the trigonometric definition of the tangent, the angular value corresponding to the height of the horizon is obtained.
As a result of the above process, a csv file is created per bus shelter with a total of 36 values expressed in degrees storing the horizon height values starting from North in a clockwise direction.
3. Results
Using the PVGIS tool, the solar irradiance reaching the shaded bus shelters was calculated in four different cases: (i) without including a horizon profile (ii) including the horizon profile generated by PVGIS (iii) including the horizon profile obtained by the methodology described above using a LiDAR point cloud with a density of 0.5 pts/m2 (iv) including the horizon profile obtained by the methodology described above using a LiDAR point cloud with a density of 1 pt/m2. Table 4, Table 5, Table 6 and Table 7 show the average annual irradiation value received together with the standard deviation value for each of the four options evaluated according to the main orientation of the bus shelter.
The main application of solar radiation reaching the earth’s surface in cities, taking into account the presence of shadows, is the generation of electricity in a clean and sustainable way. In order to determine the influence of shading from an energy point of view, a detailed analysis of the monthly average of bus shelters in the city is carried out by simulating the installation of flexible panels on the existing structures using horizon profiles. Although the use of flexible panels is not the option that generates the most electricity, it is the most economical option and the one that best integrates with the urban environment in the current bus shelter model.
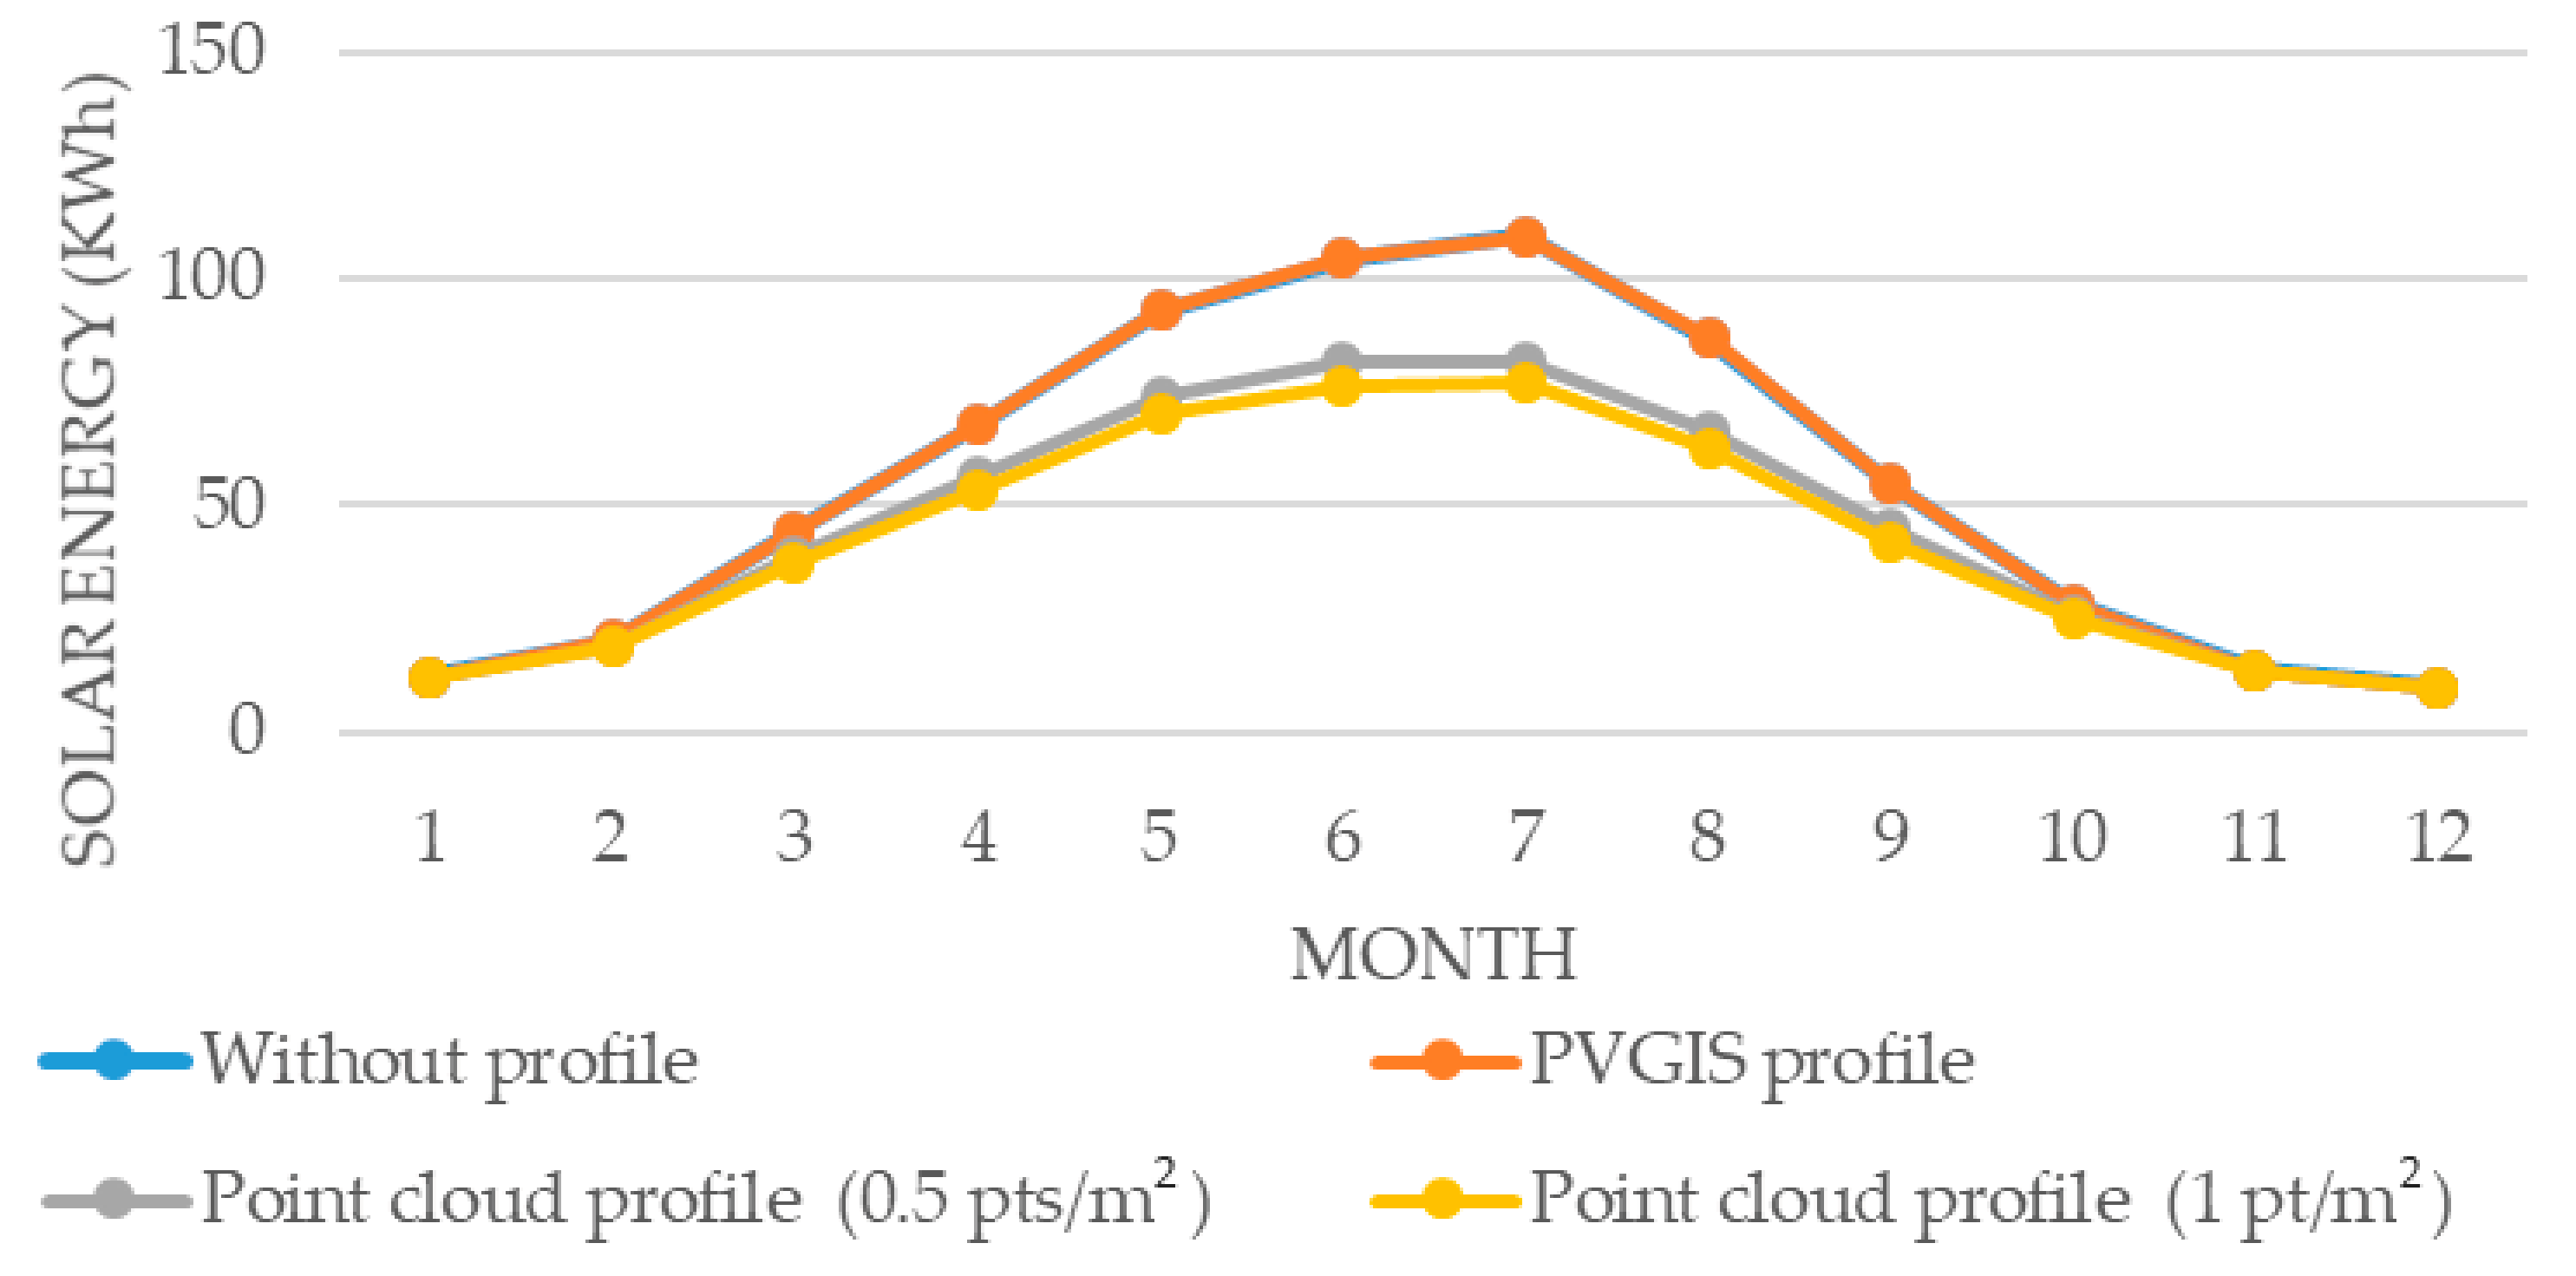
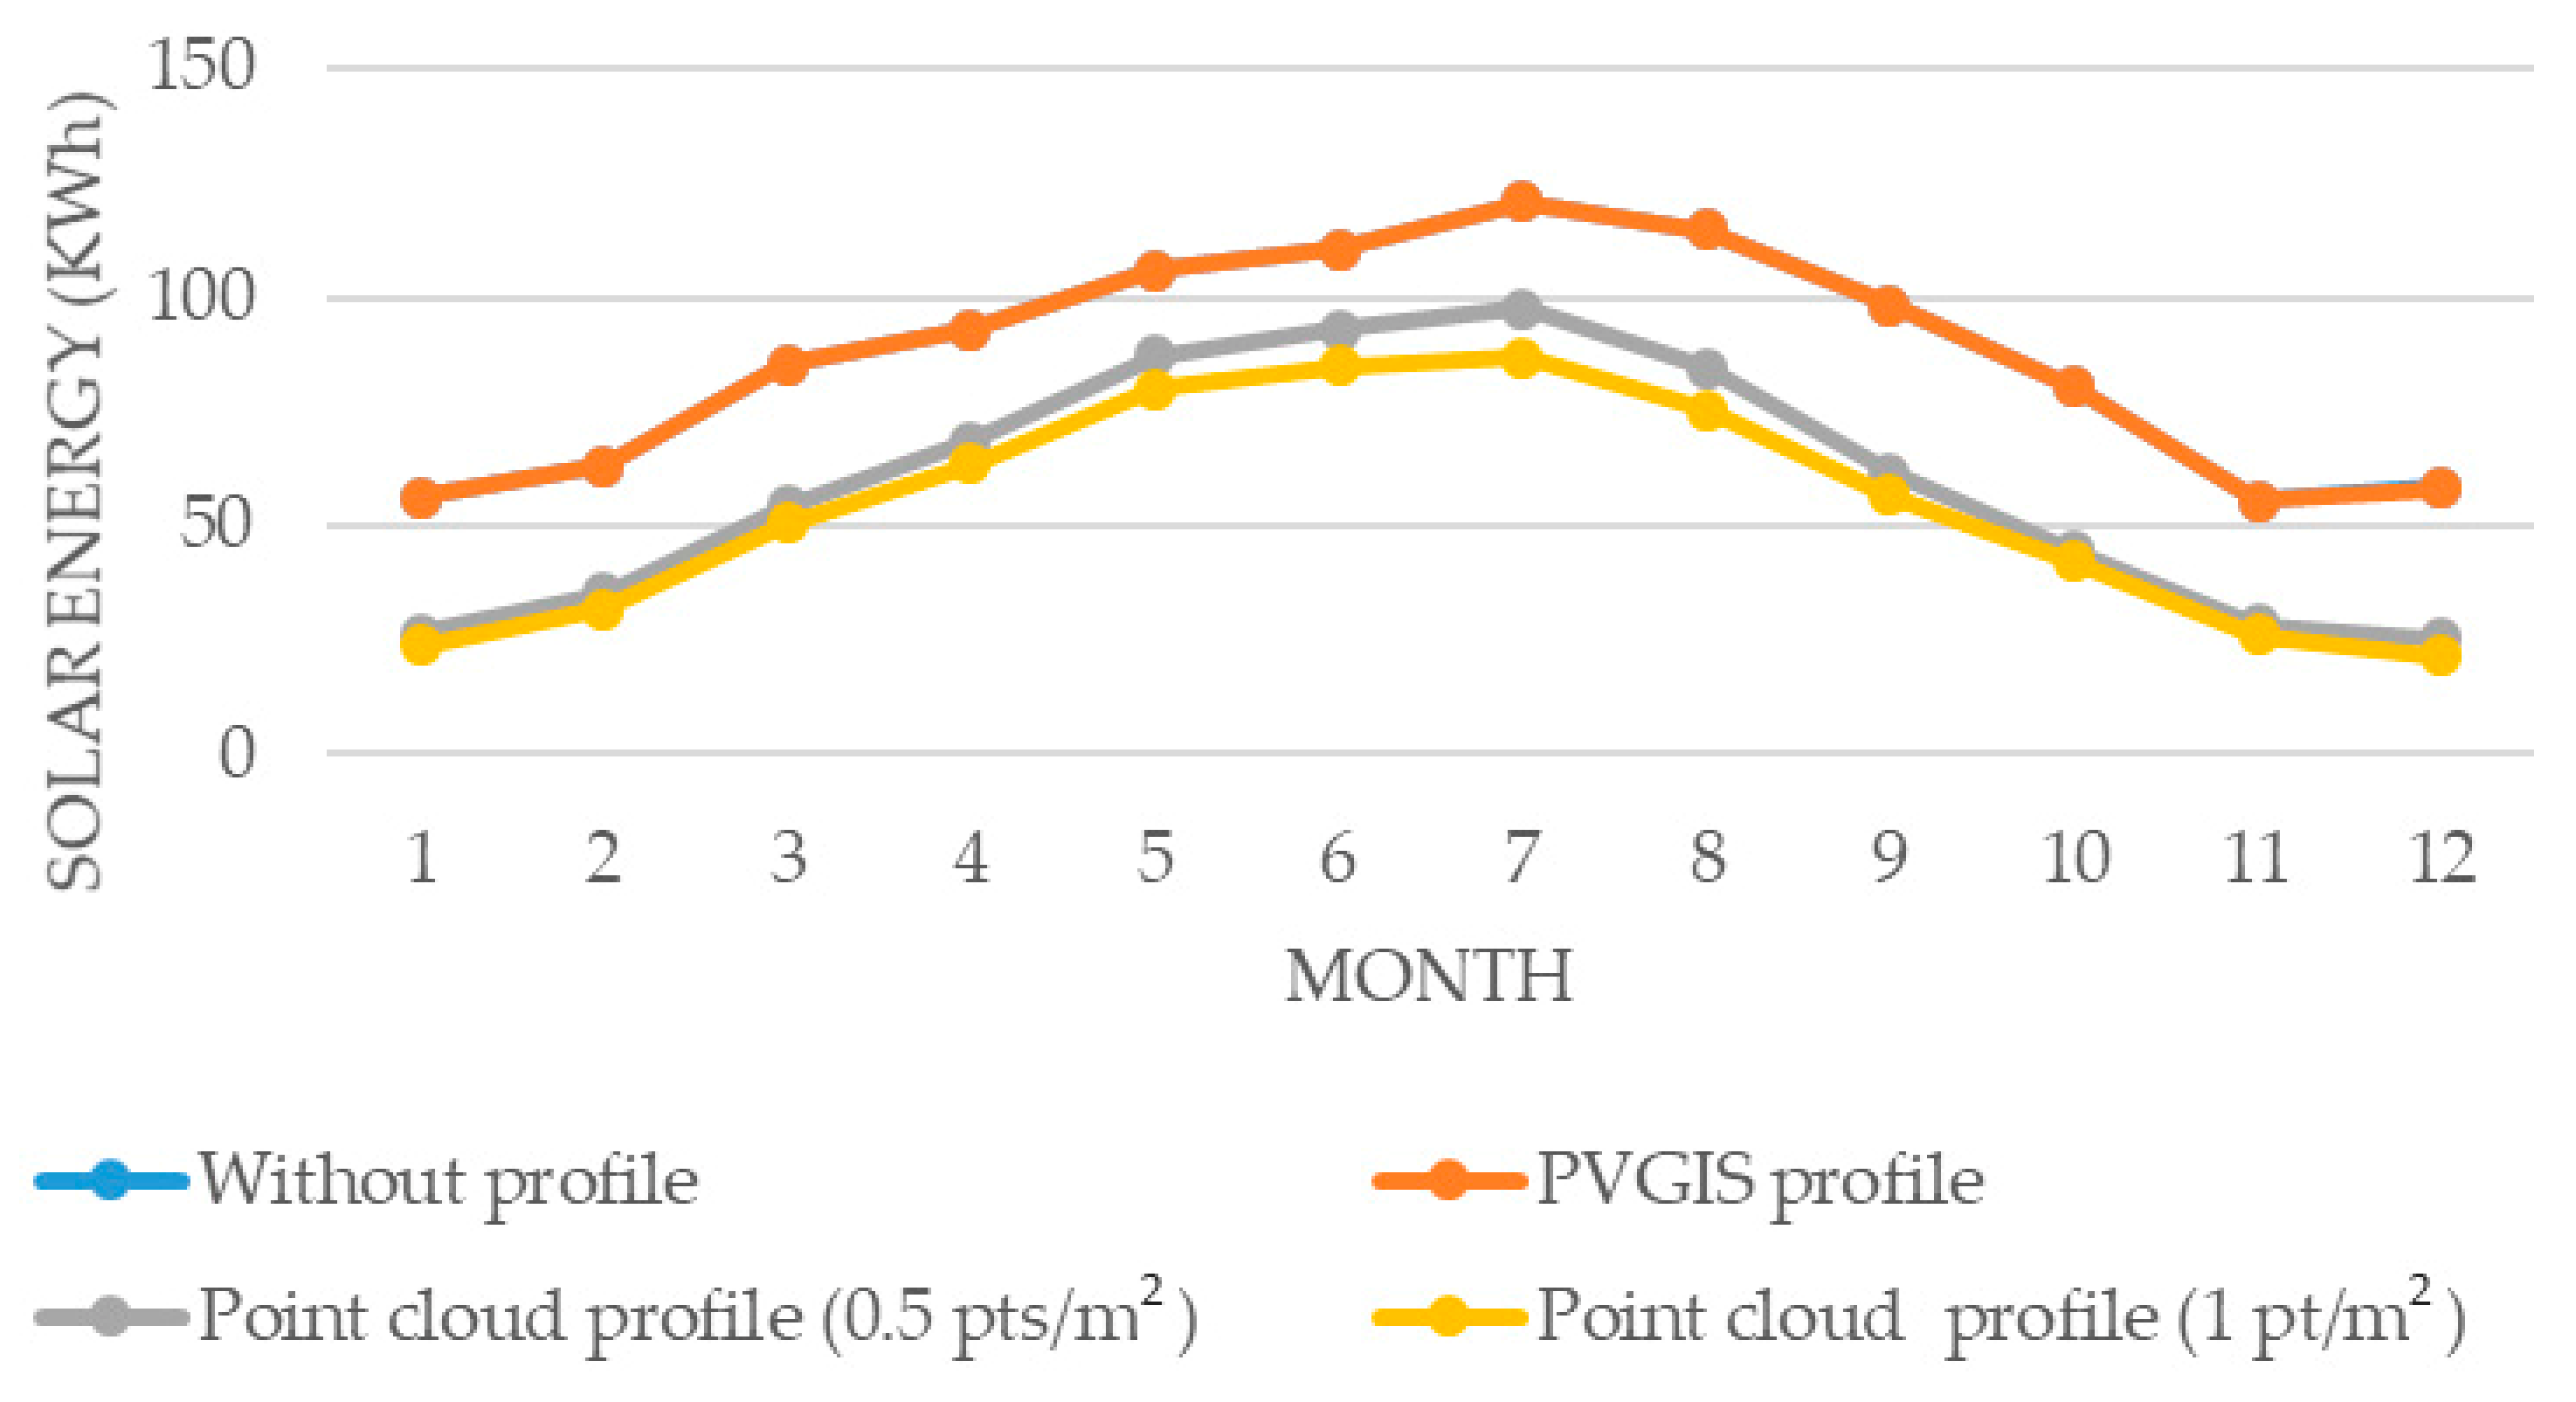
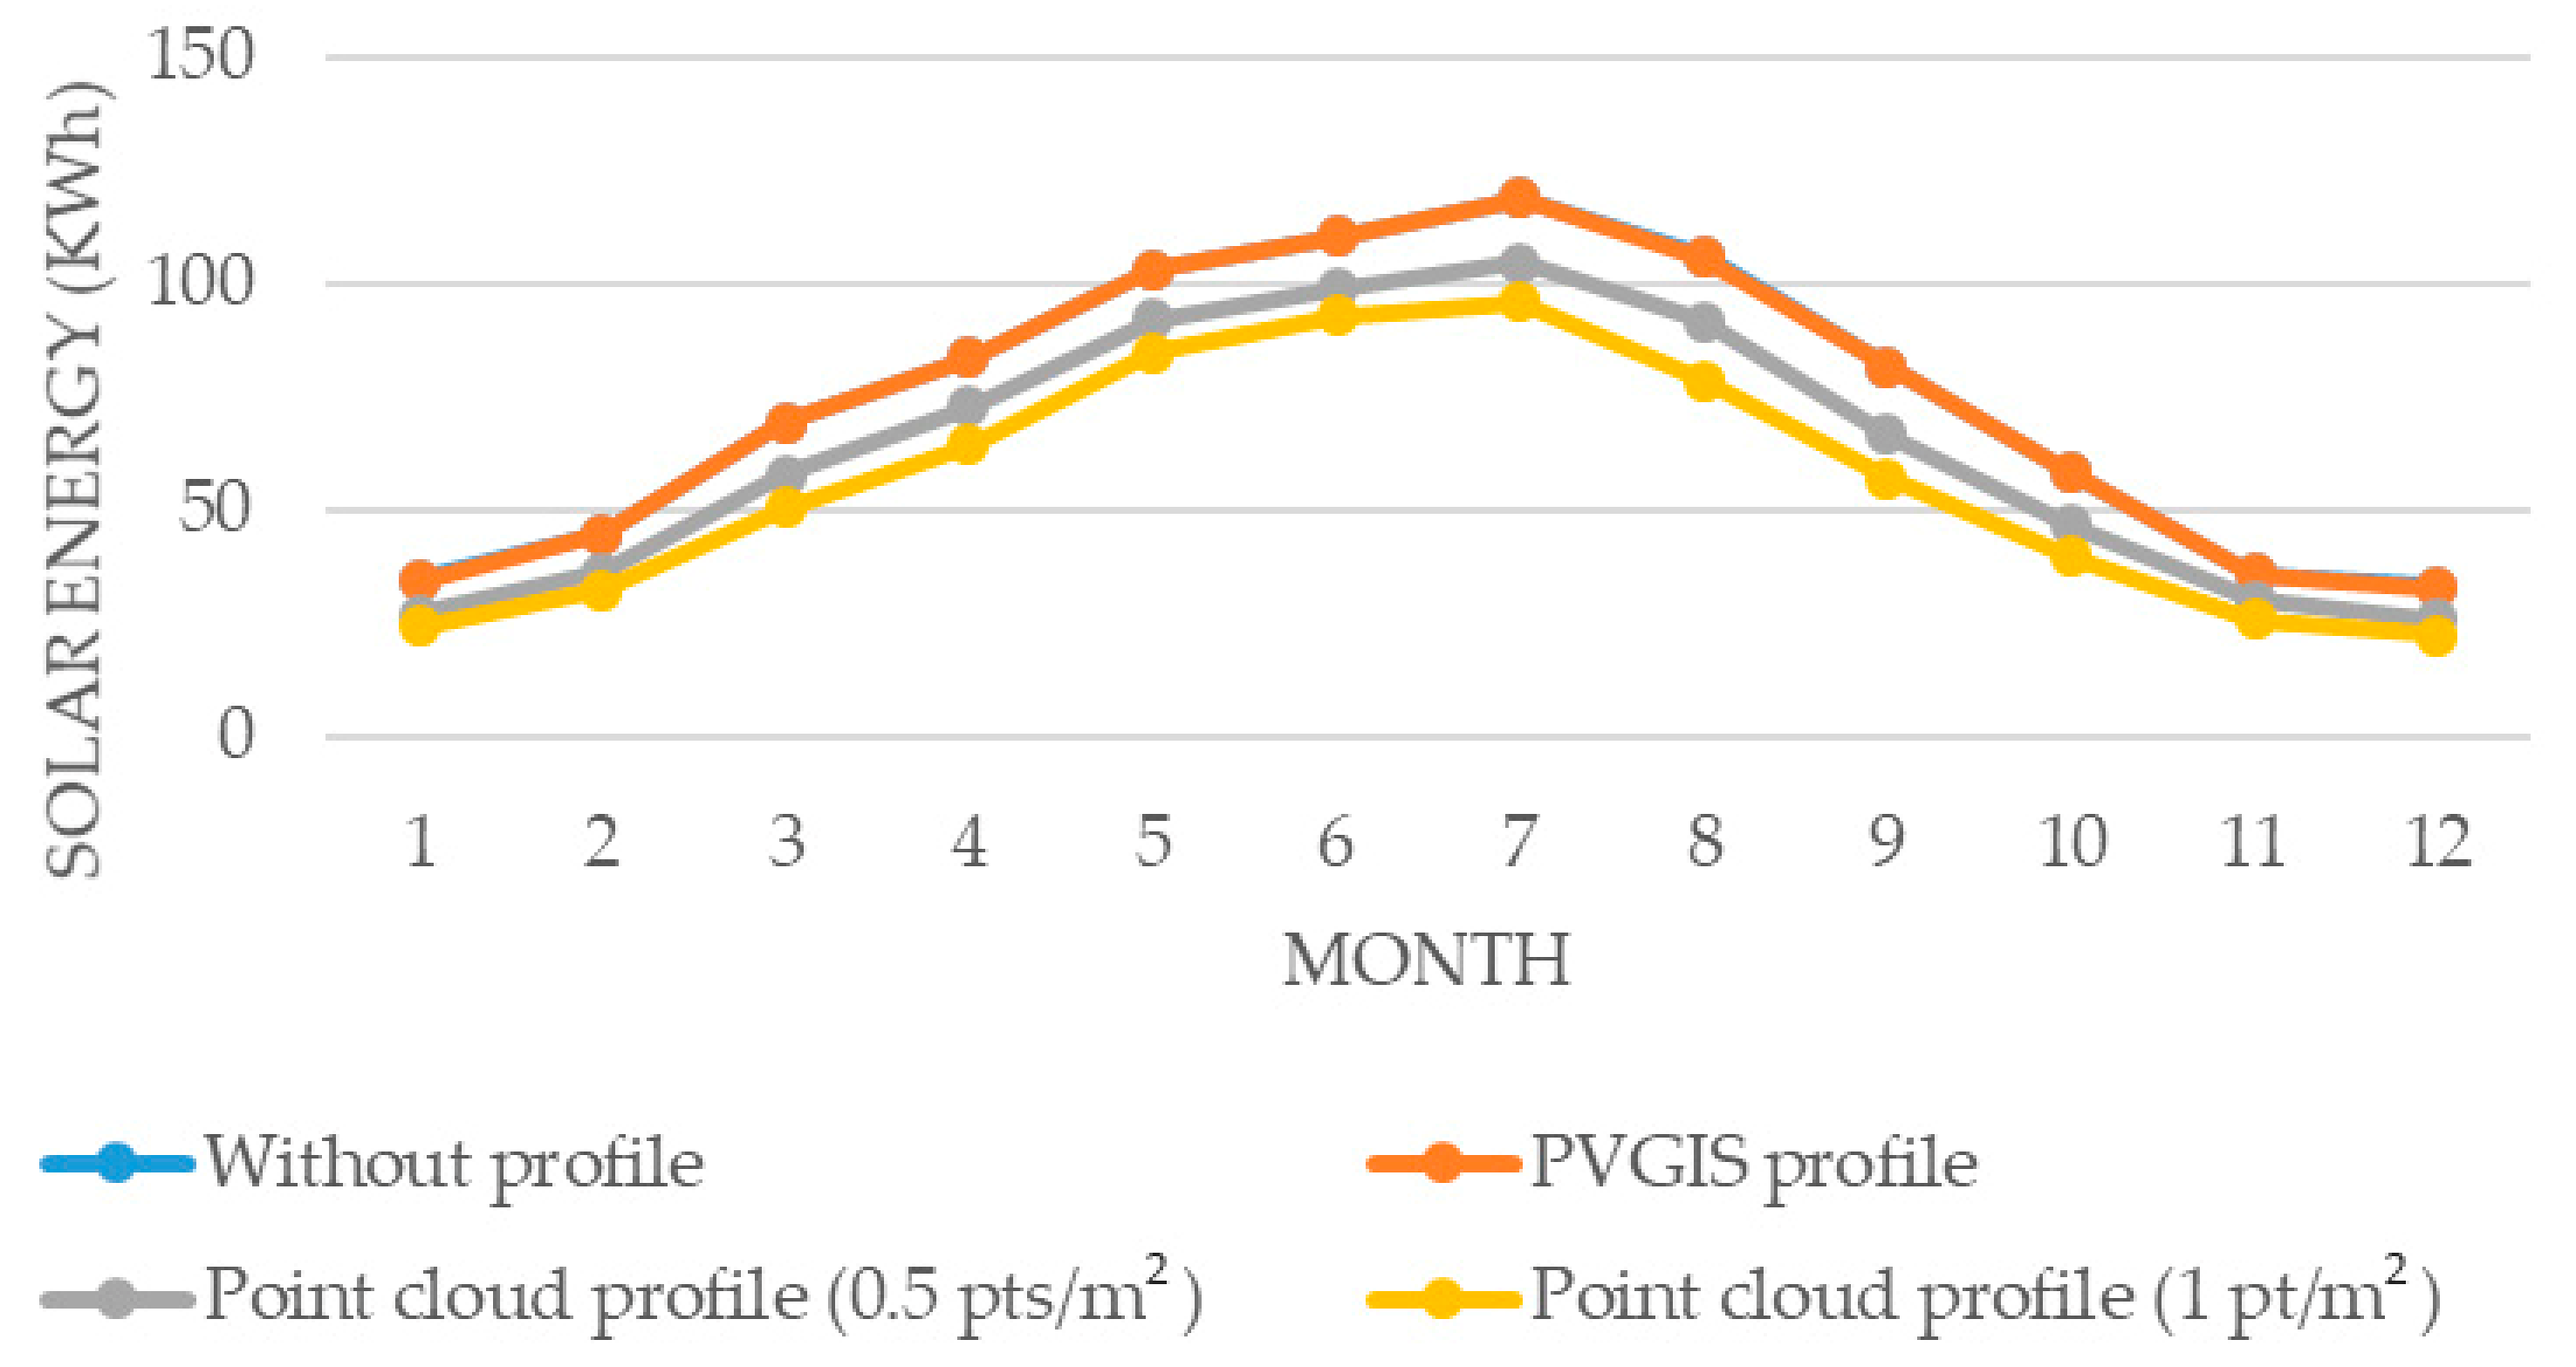
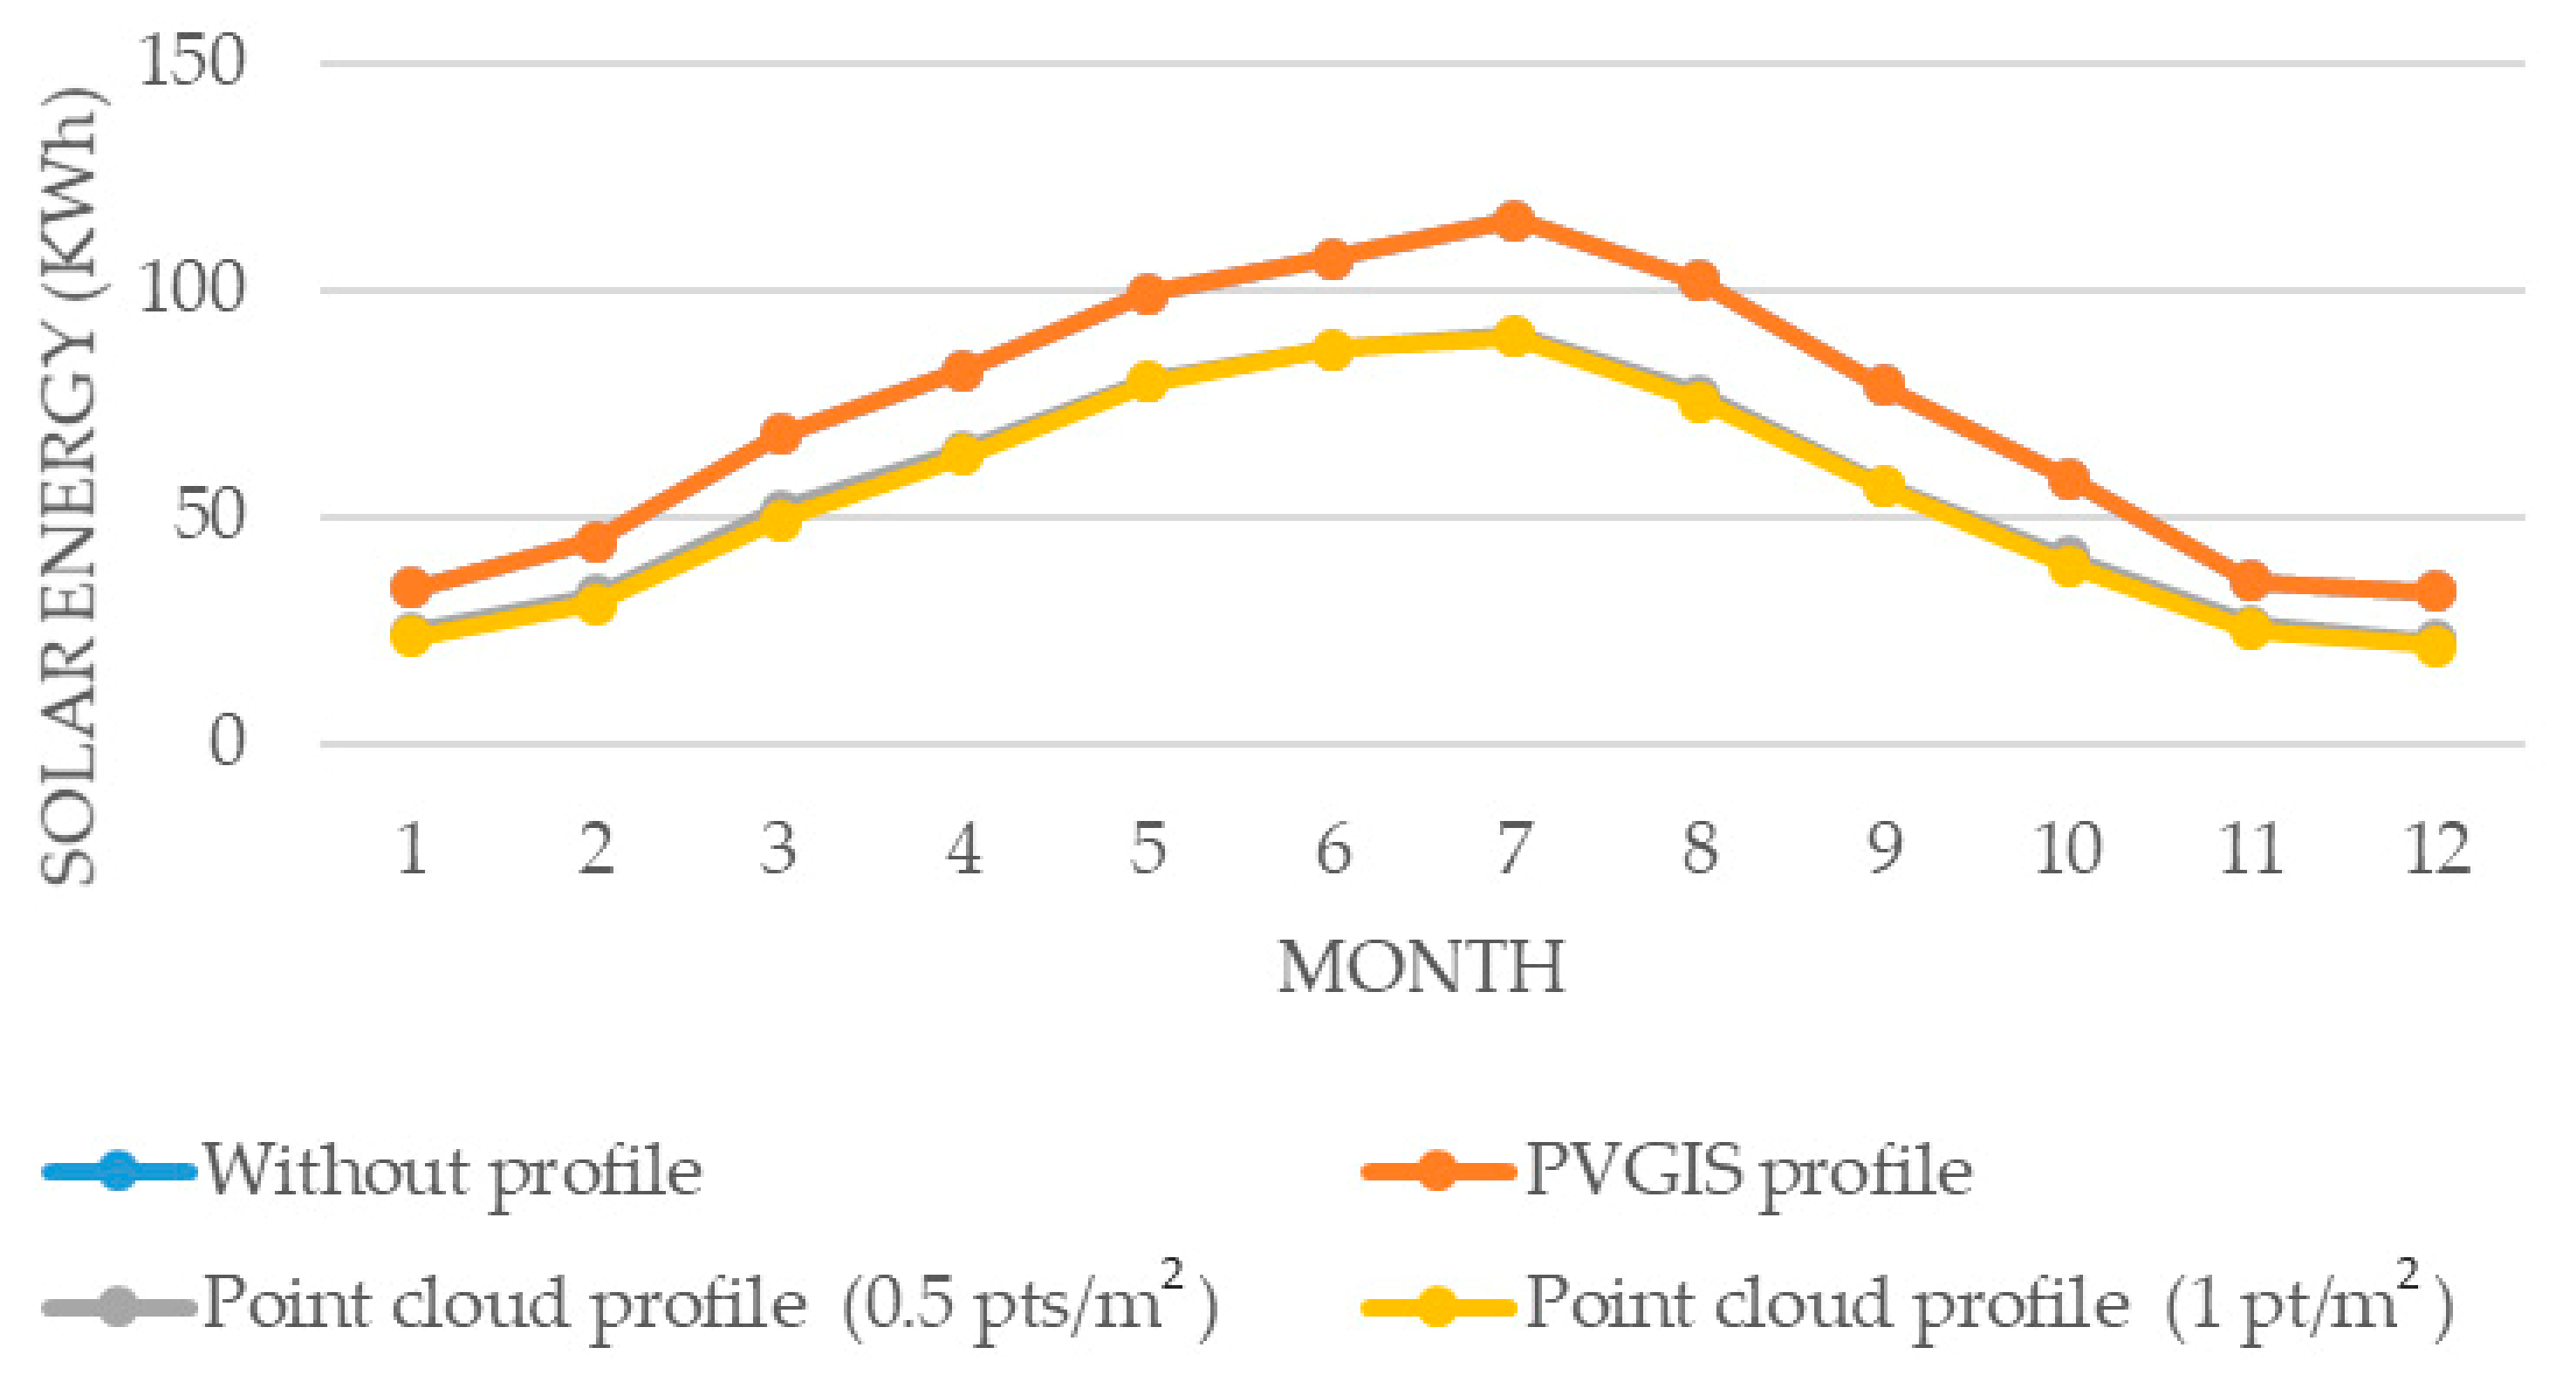
Depending on the main orientation of the bus shelters, the following figures (Figure 11, Figure 12, Figure 13 and Figure 14) show the evolution of the average monthly electrical energy generated in those bus shelters that have obstacles in their vicinity. As can be seen, the almost non-existent difference between not including a horizon profile and including the horizon profile generated by PVGIS means that the solar electricity generated is practically the same.
4. Discussion
As expected, the estimation of the annual irradiance value received by the bus shelters is reduced by including horizon profiles with a certain degree of detail, such as those resulting from the methodology presented using LiDAR point clouds. The highest values of annual irradiance (without considering the use of the horizon profile) are found in those bus shelters oriented to the south (1934.15 kWh/m2), while those oriented to the north receive the lowest annual irradiance (1242.45 kWh/m2). The difference is not so notable between the east and west orientations, where the average annual irradiation value is close to 1600 KWh/m2.
Due to the variability of the average annual irradiance for each option evaluated, in order to be able to analyze these results in a simpler way, the difference in solar irradiance reaching the surface for each orientation is estimated when horizon profiles (PVGIS profile, point cloud profile with a density of 0.5 pts/m2, and point cloud profile with a density of 1 pt/m2) are used versus not including them in the calculation. The results show that the PVGIS geometric model is not very accurate and the inclusion of the PVGIS profiles has little effect on the calculation (less than 1% effect on the calculated solar radiation), while the calculation of the radiation with the profiles of independent acquisitions provides values with a larger effect, reducing the calculated radiation by about 20–25%. As can be seen in Table 8 and Table 9, the most significant difference between the use and non-use of profiles in solar radiation estimation is produced in south-facing bus shelters.
In order to further understand the effect of solar irradiance reduction through the incorporation of horizon profiles, an in-depth study is carried out. Given that the main elements that can generate shadows in cities are buildings and trees, the behavior of these elements is analyzed when estimating irradiance using the different horizon profiles evaluated. The results of this analysis show that buildings and trees have different behavior when a horizon profile is included. Table 10 shows the average results of the mean difference in solar radiation estimation for each bus shelter using each of the horizon profiles discussed in the article versus using no horizon profile at all. The difference the two LiDAR point clouds used is also shown. These results indicate the importance of using a dense point cloud when estimating irradiance if the effect of shadows is to be included in the calculation.
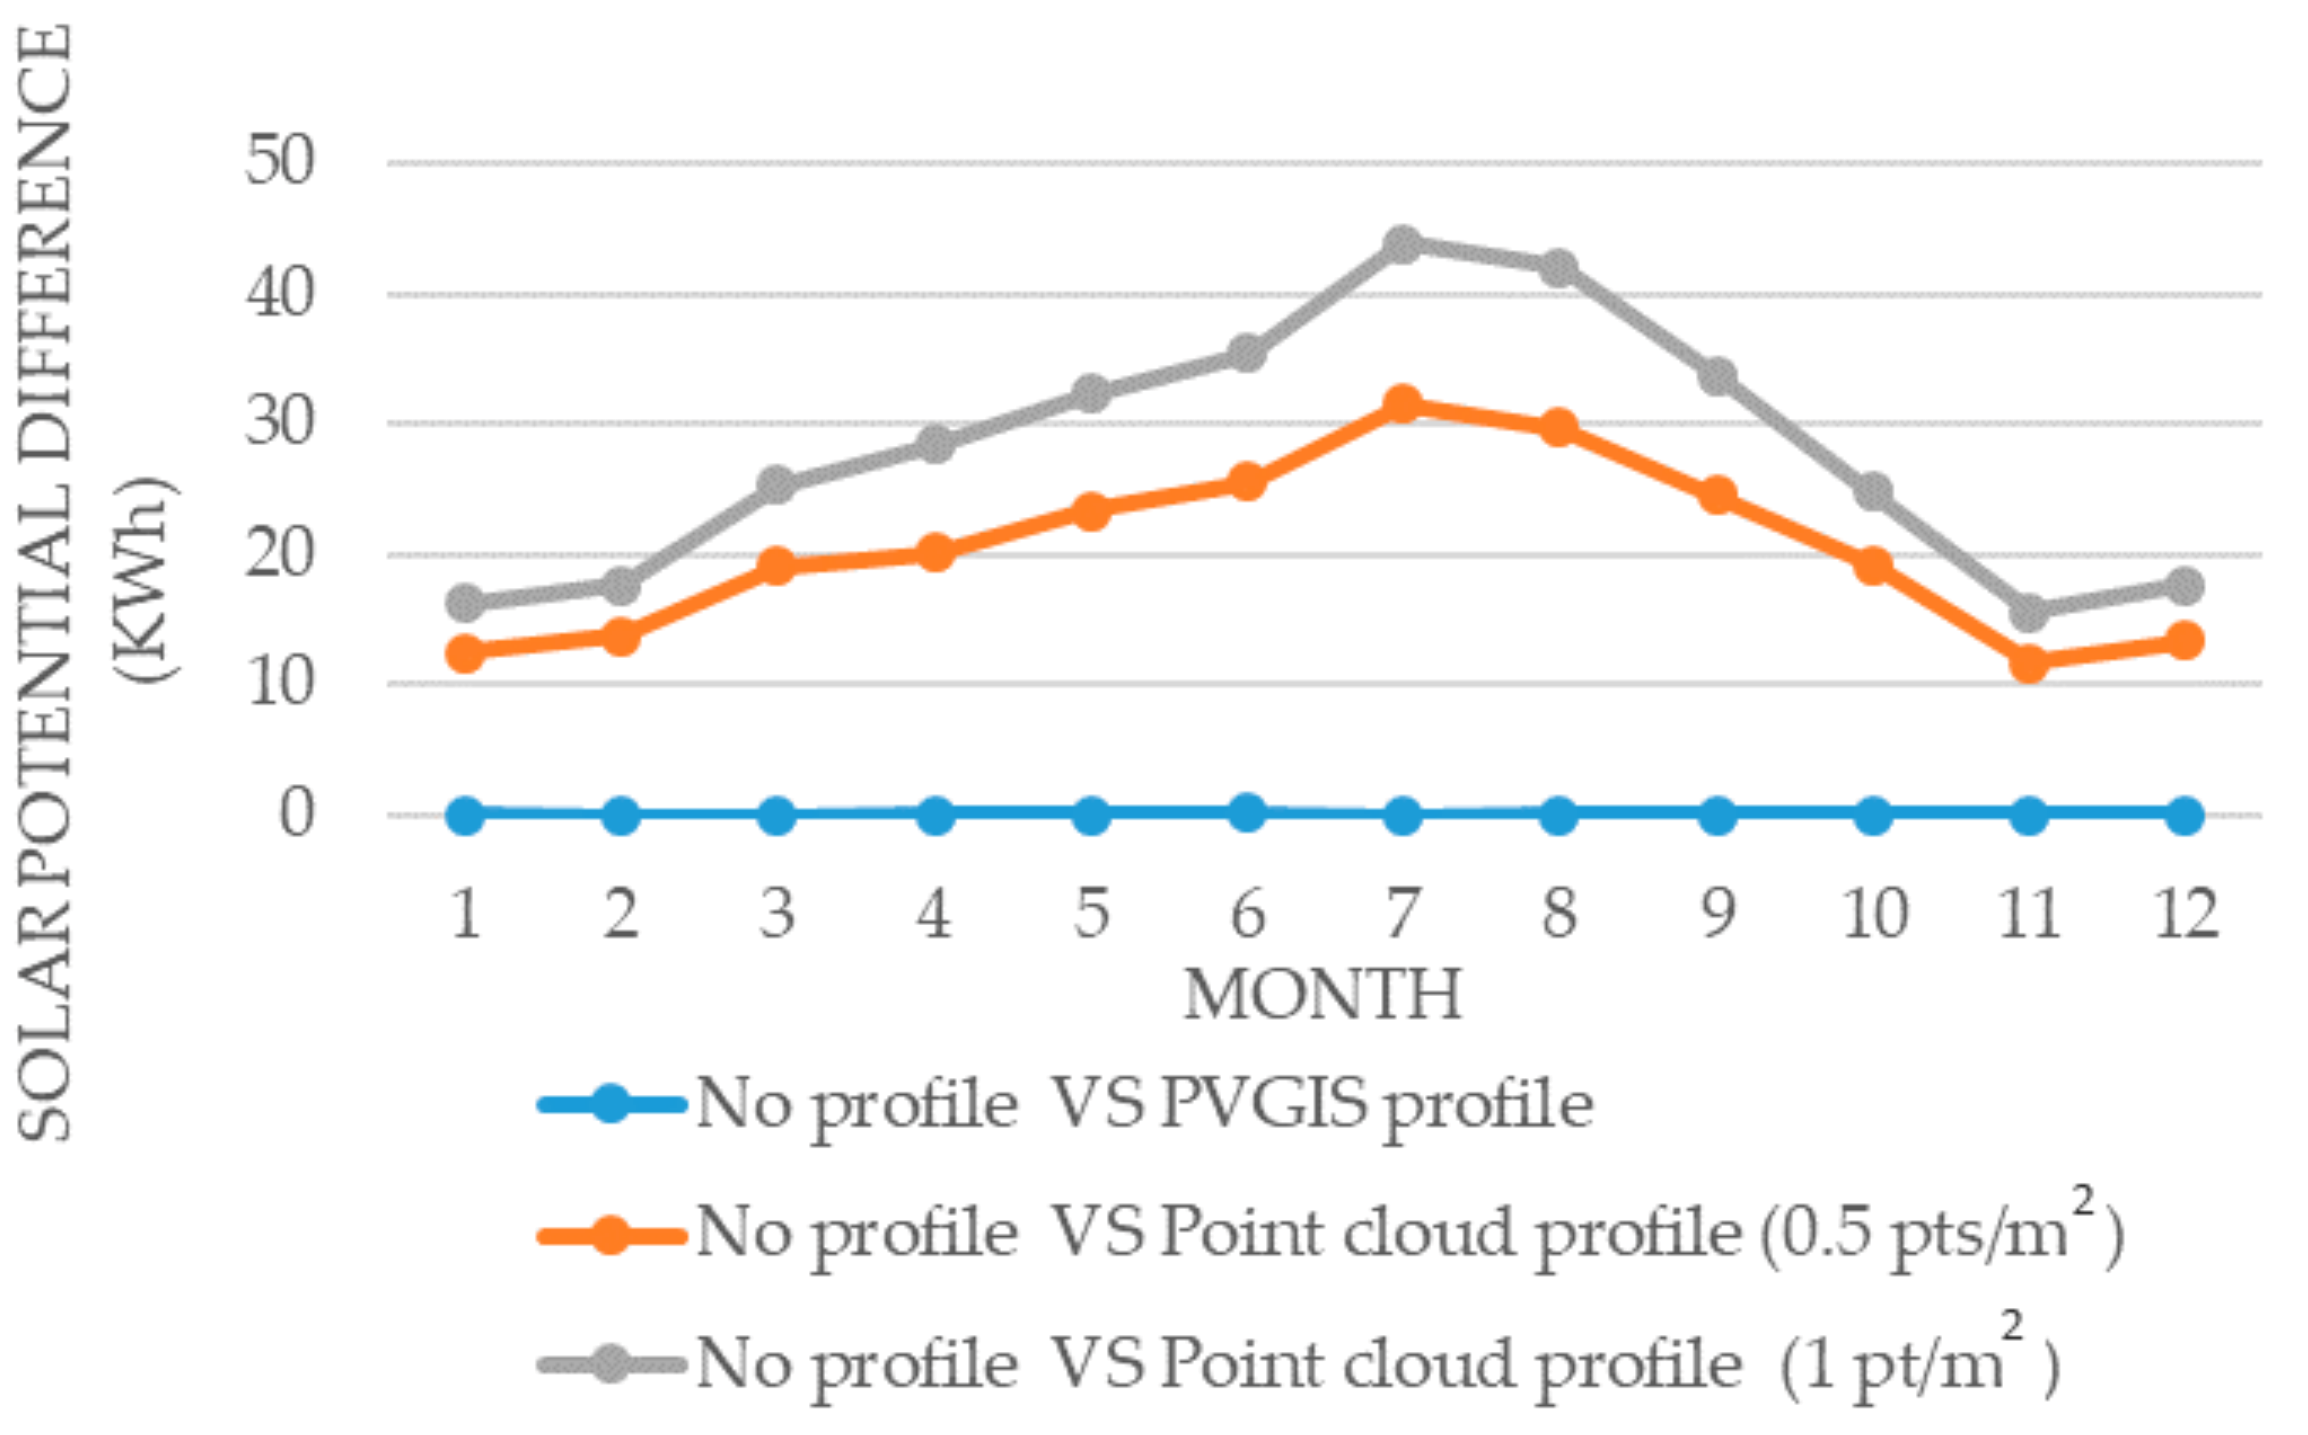
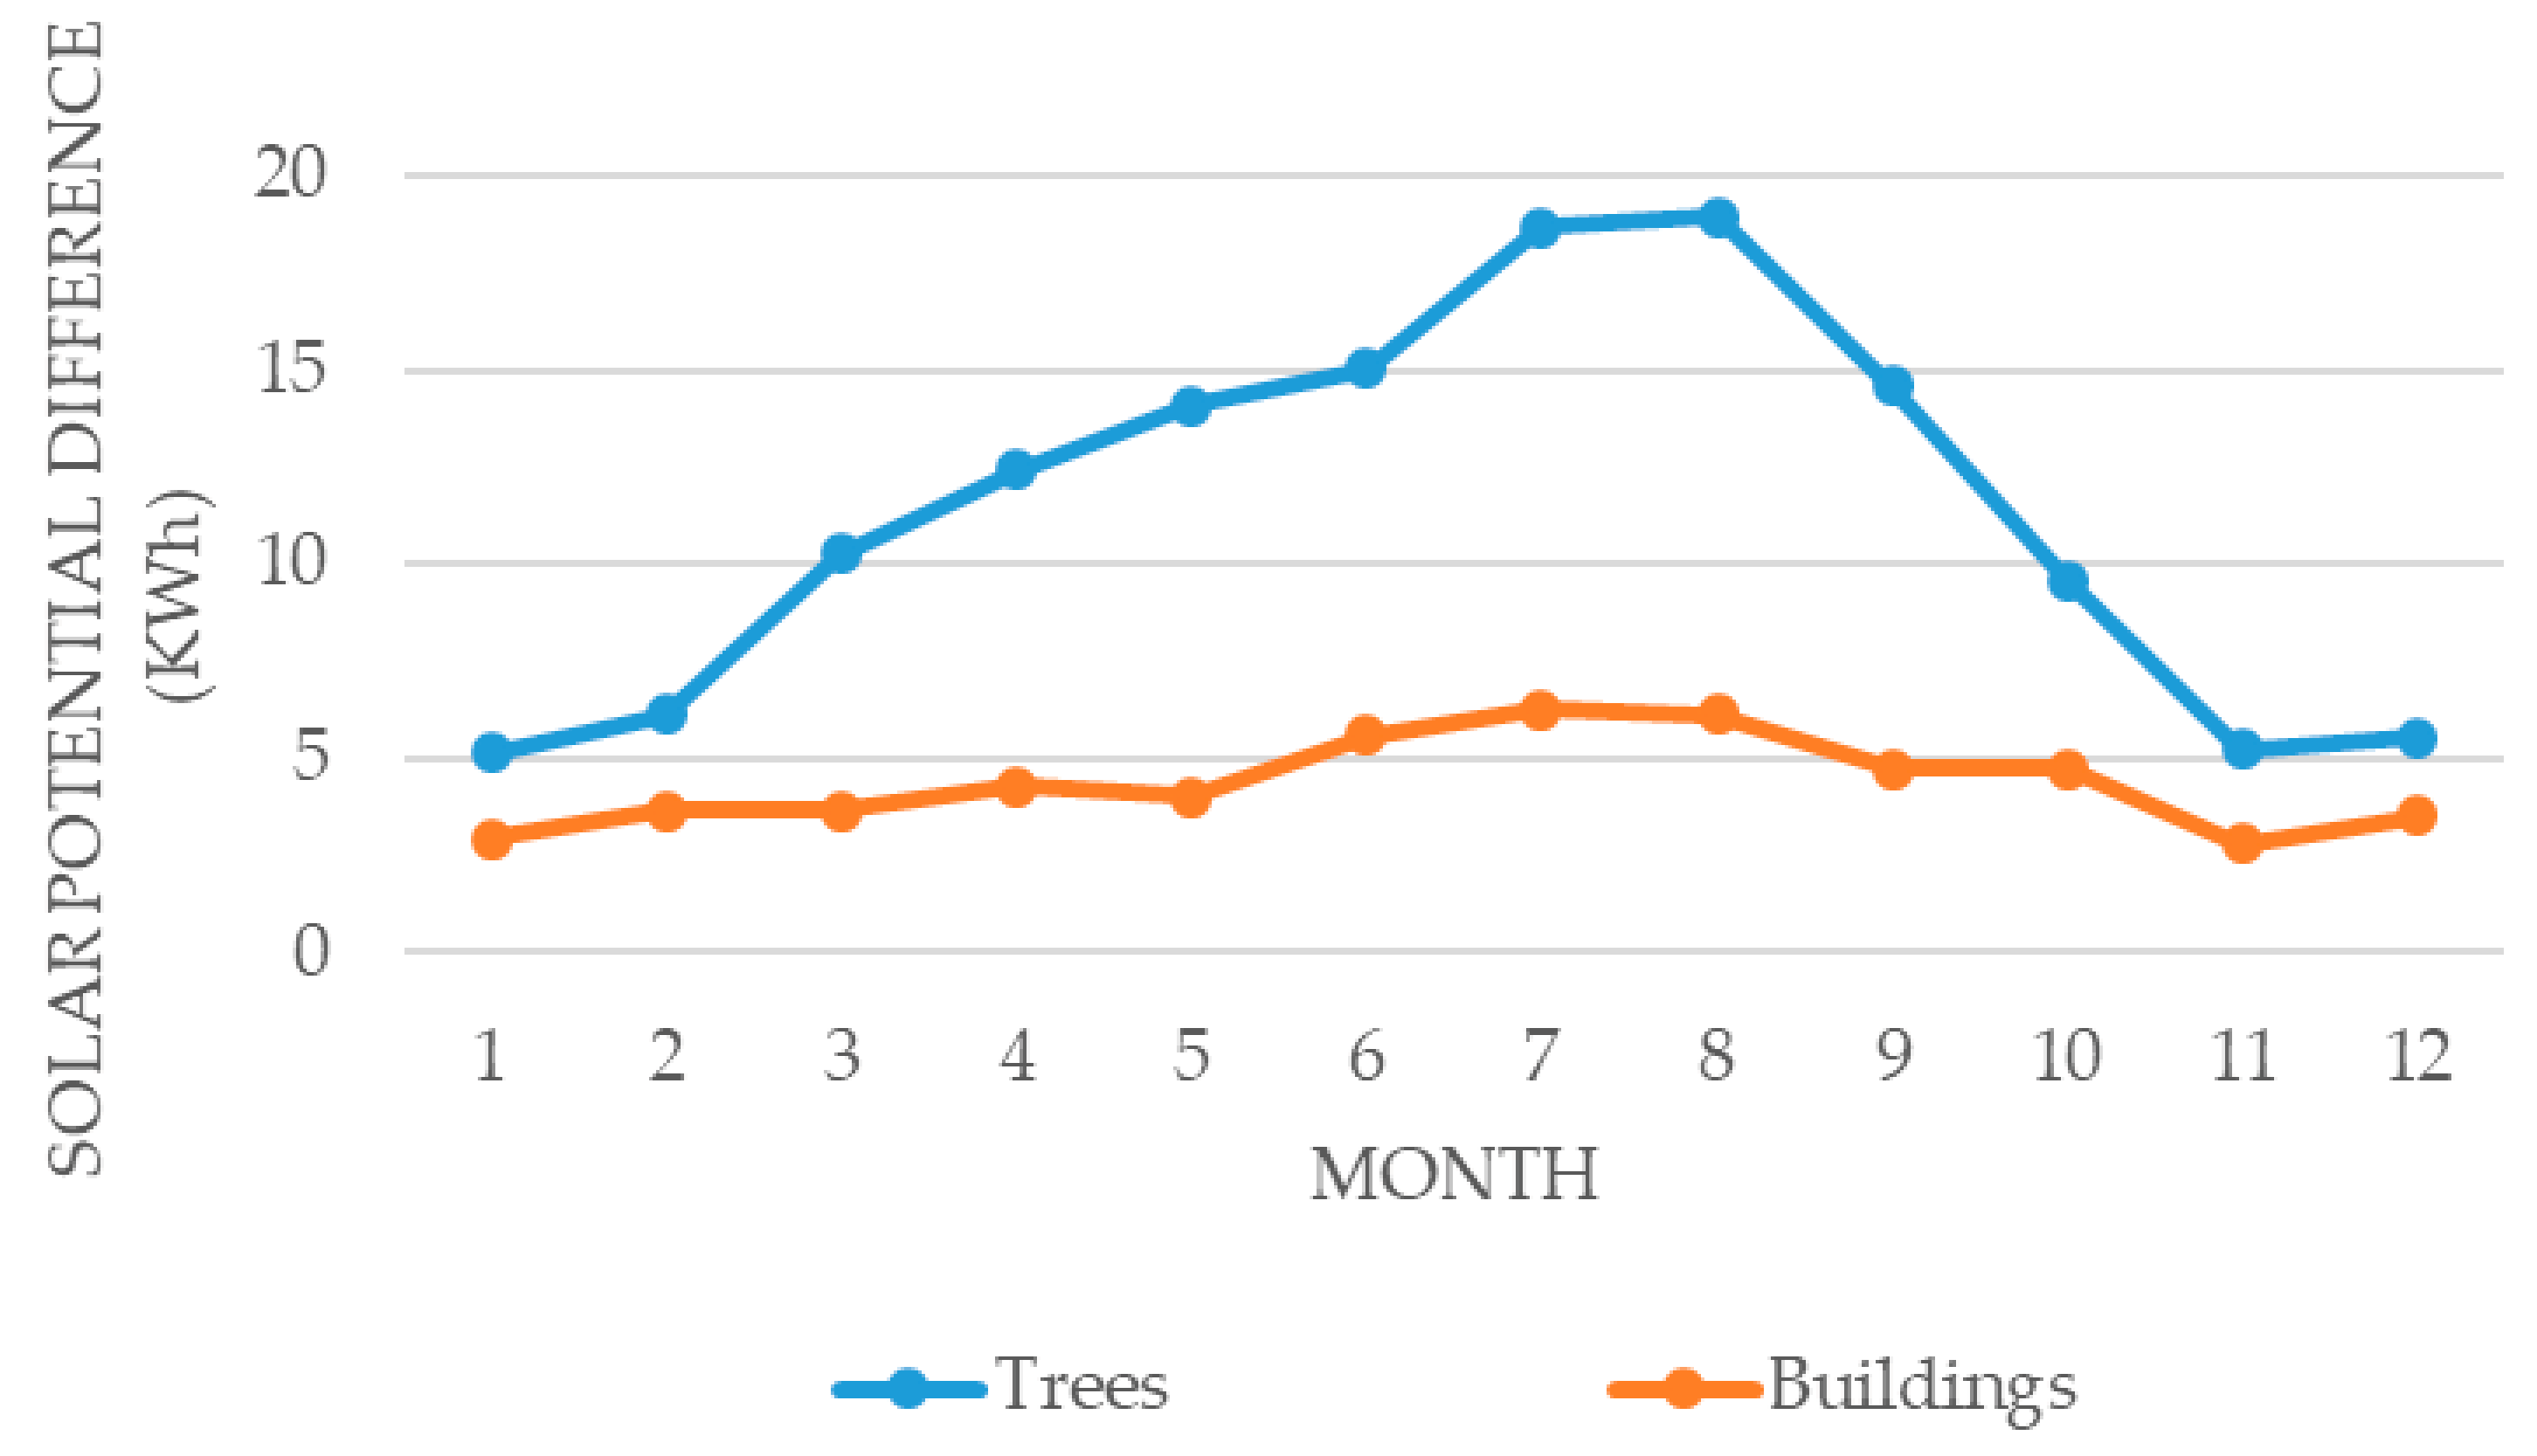
Regarding solar electricity, the following images (Figure 15 and Figure 16) show graphically the effect of the difference in the use of the horizon profiles when shadows are produced by trees and by buildings. The results corroborate that the difference is more accentuated in the case of trees, reaching a maximum in July (44 kWh). In the case of buildings, the difference is more constant throughout the year, with the differences between the use of LiDAR point cloud derived profiles being considerably reduced.
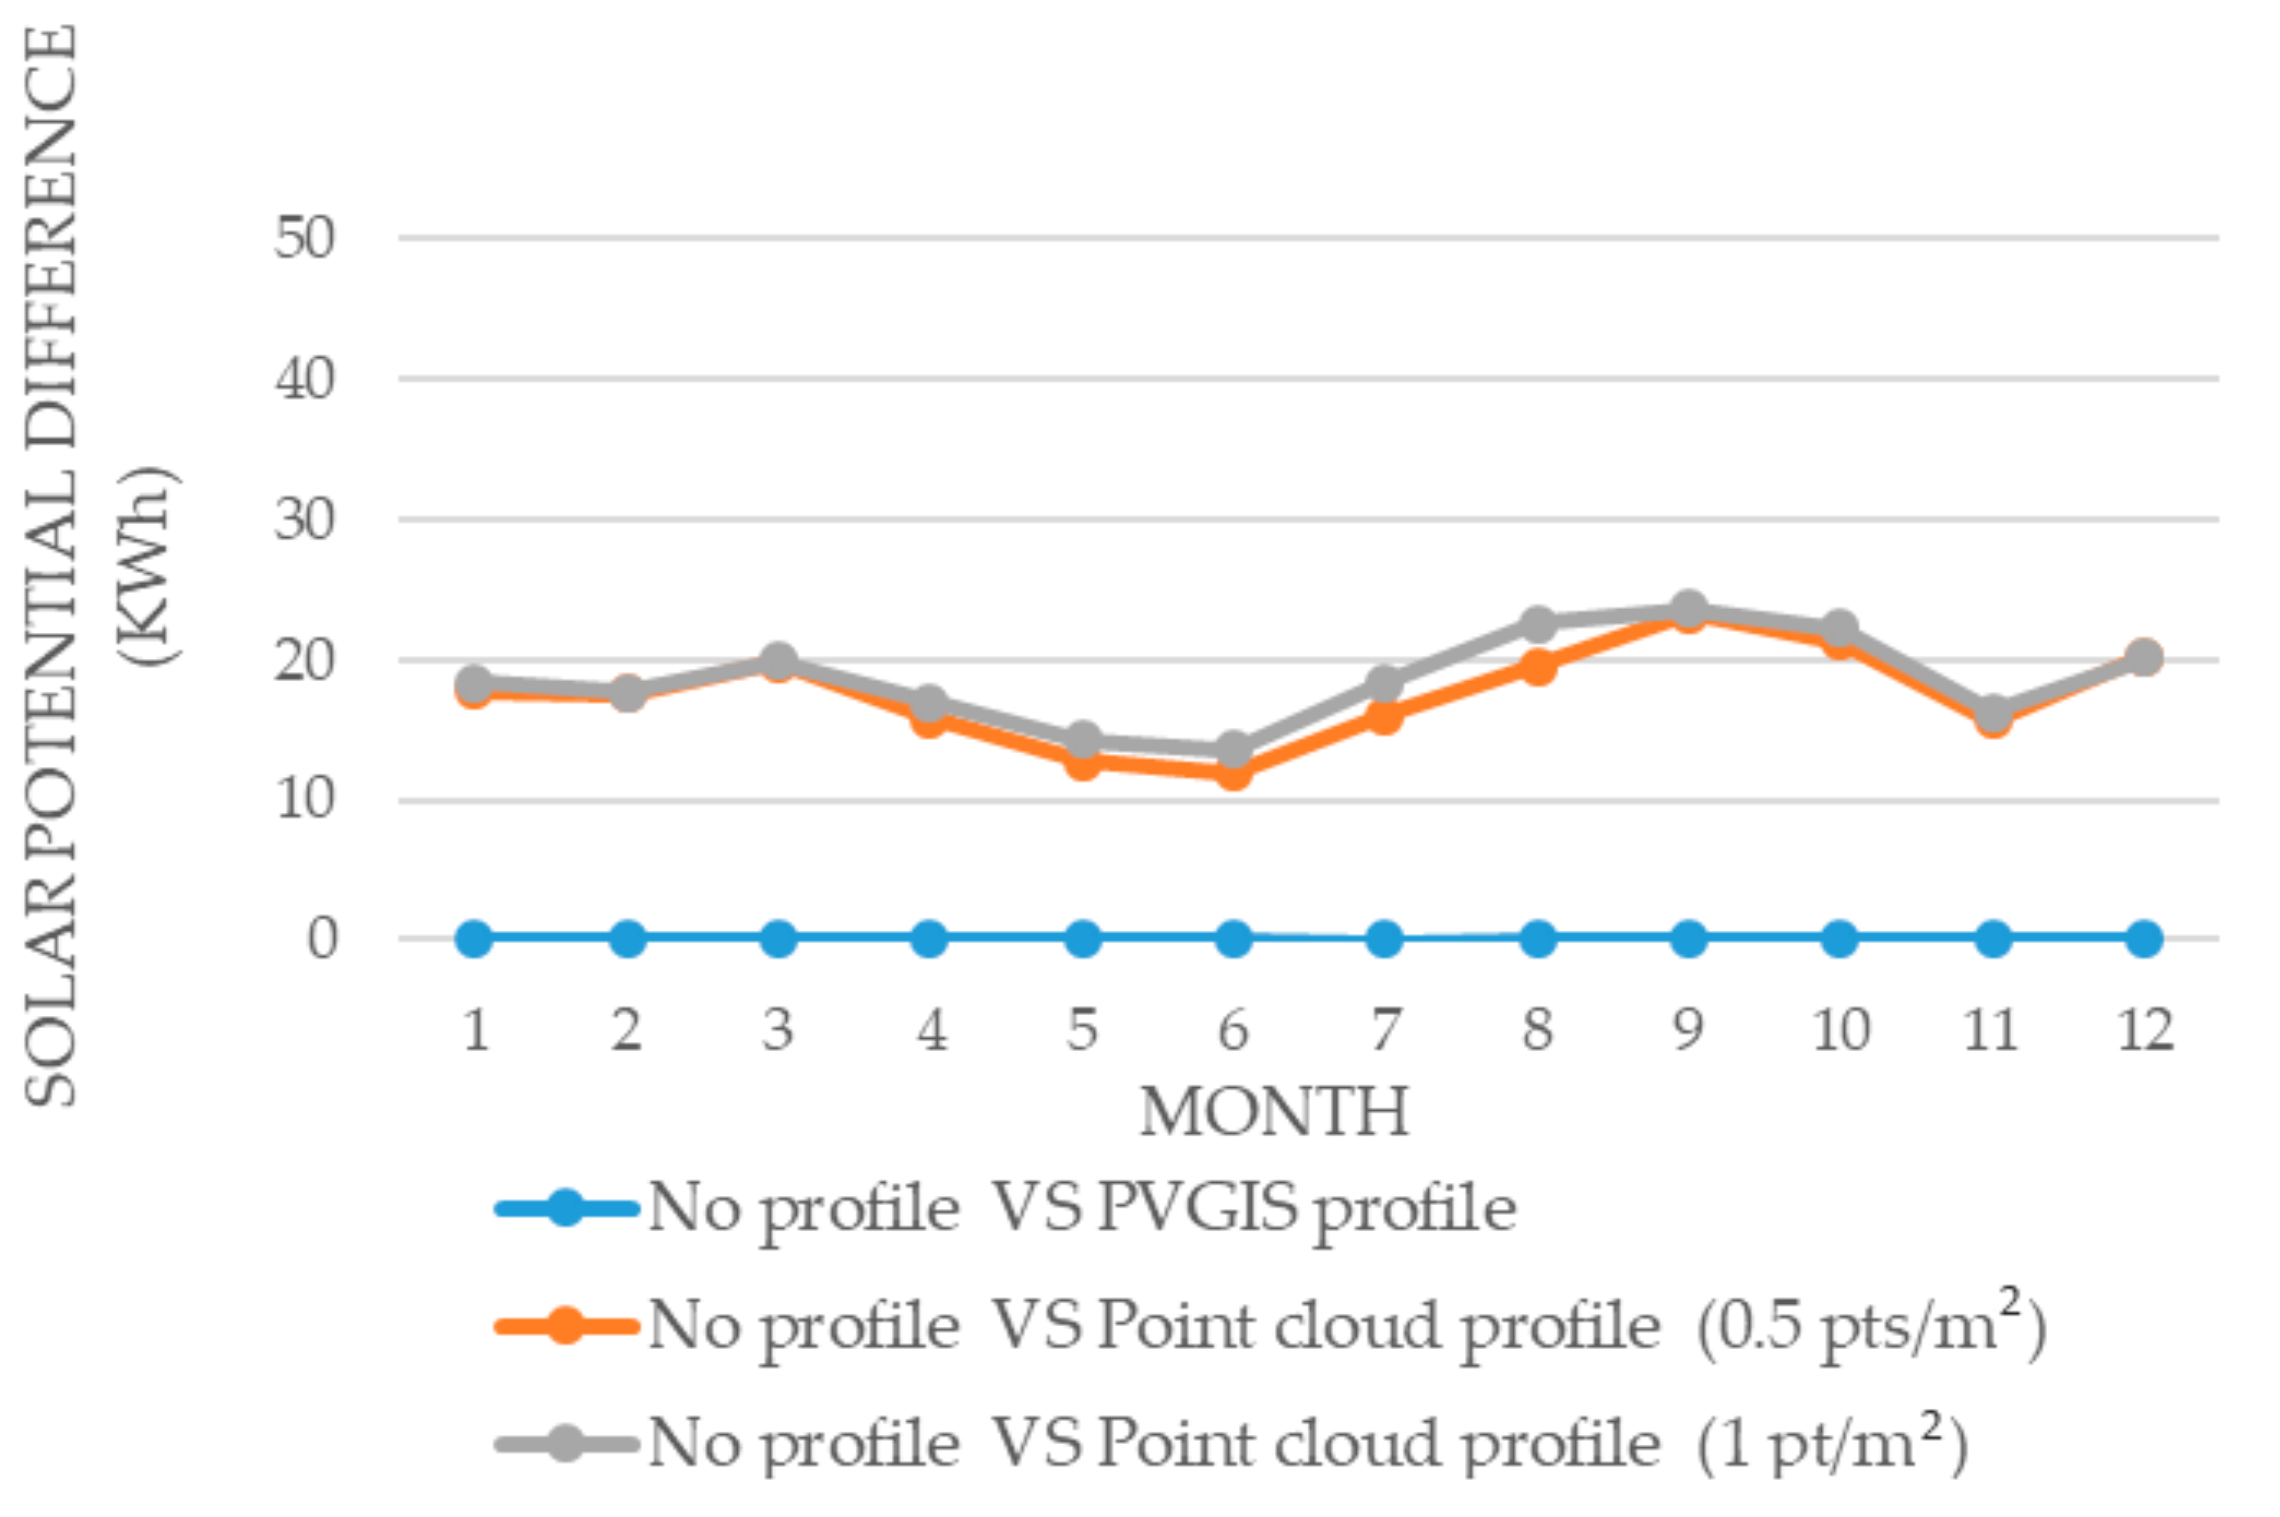
As can be seen, the main difference in the estimation of solar energy is produced by using the profile obtained from the point cloud versus not using any horizon profile. The following graph (Figure 17) shows in more detail the difference between both products on a monthly basis in the presence of trees and buildings.
Generally, bus shelters include several sources of energy consumption, such as information systems for users like a Light Emitting Diode (LED) screen with waiting times for the next buses and route maps of the different bus lines, schedules and frequencies; as well as advertisement for users of the shelters and for pedestrians. In addition, bus shelters can also serve as points of urban public lighting, including interior lights for night users and pedestrians or the illumination of the integrated advertising panels.
An example of the basic energy consumption of such structures in cities could be seen in Table 11. The computation of consumption includes lighting, as well as basic transport information by means of an LED panel. The value of the total daily energy consumption is 1032 Wh/day which expressed in annual terms would be 376 kW/year.
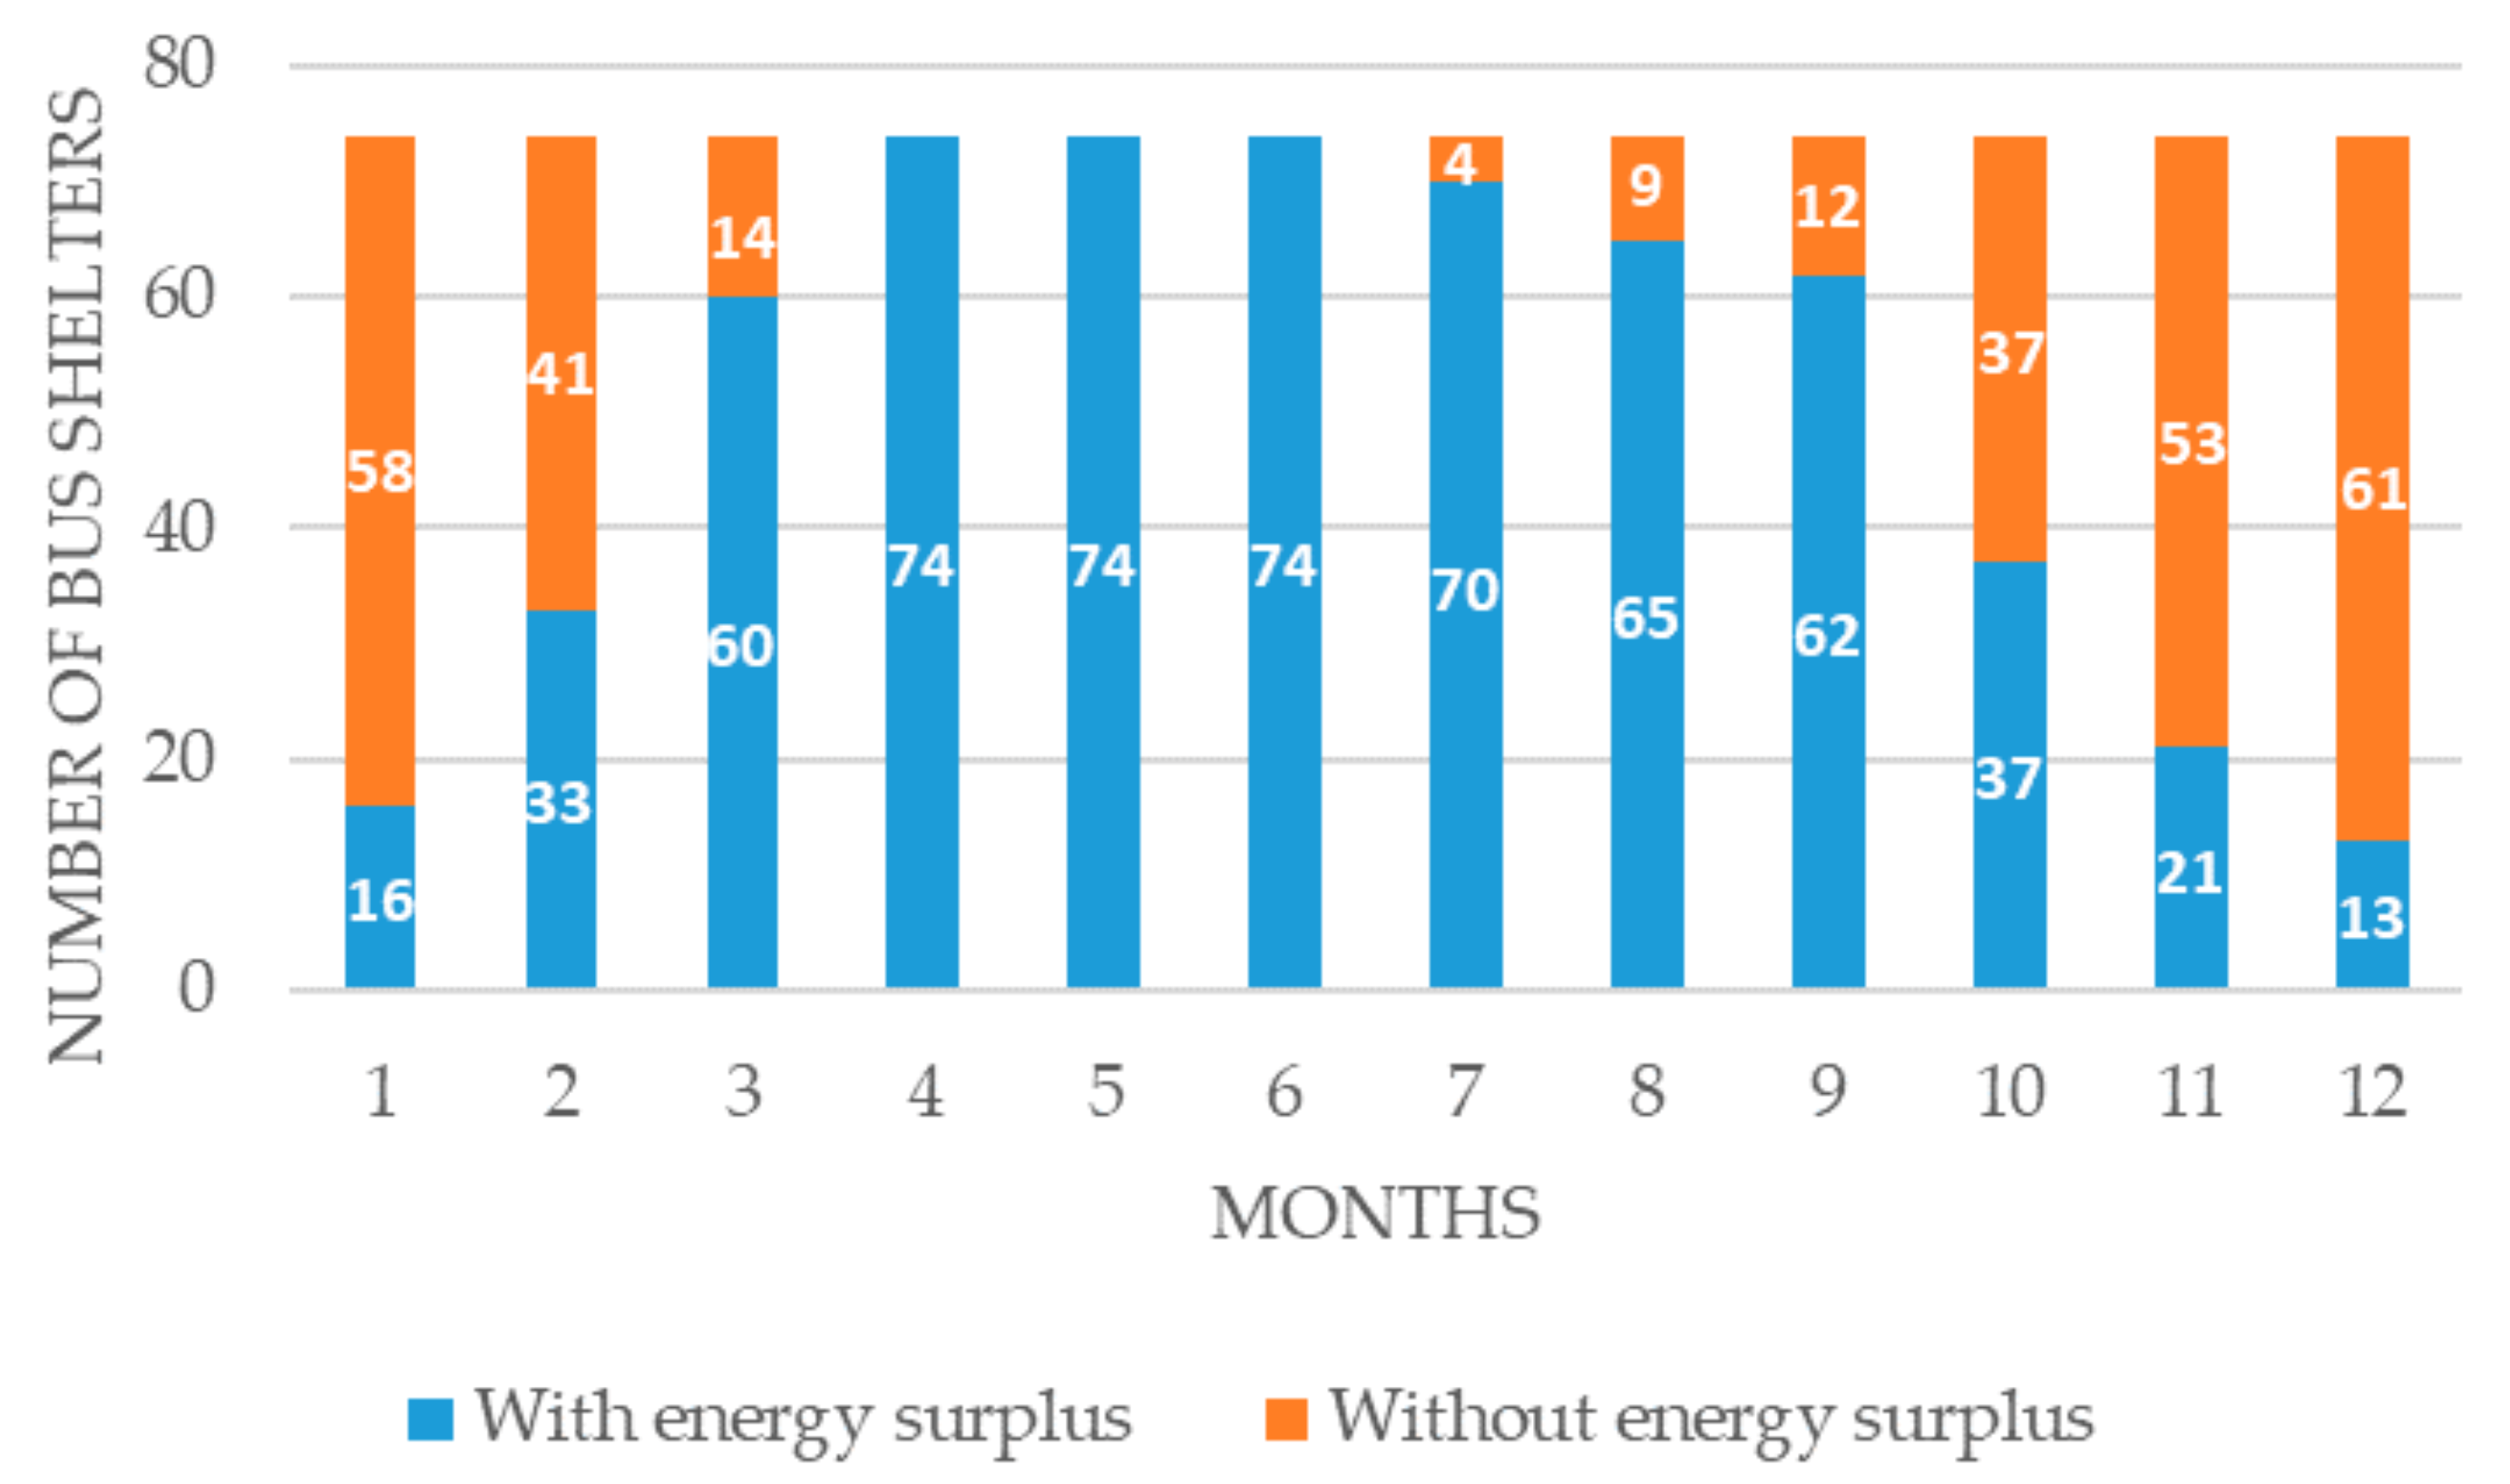
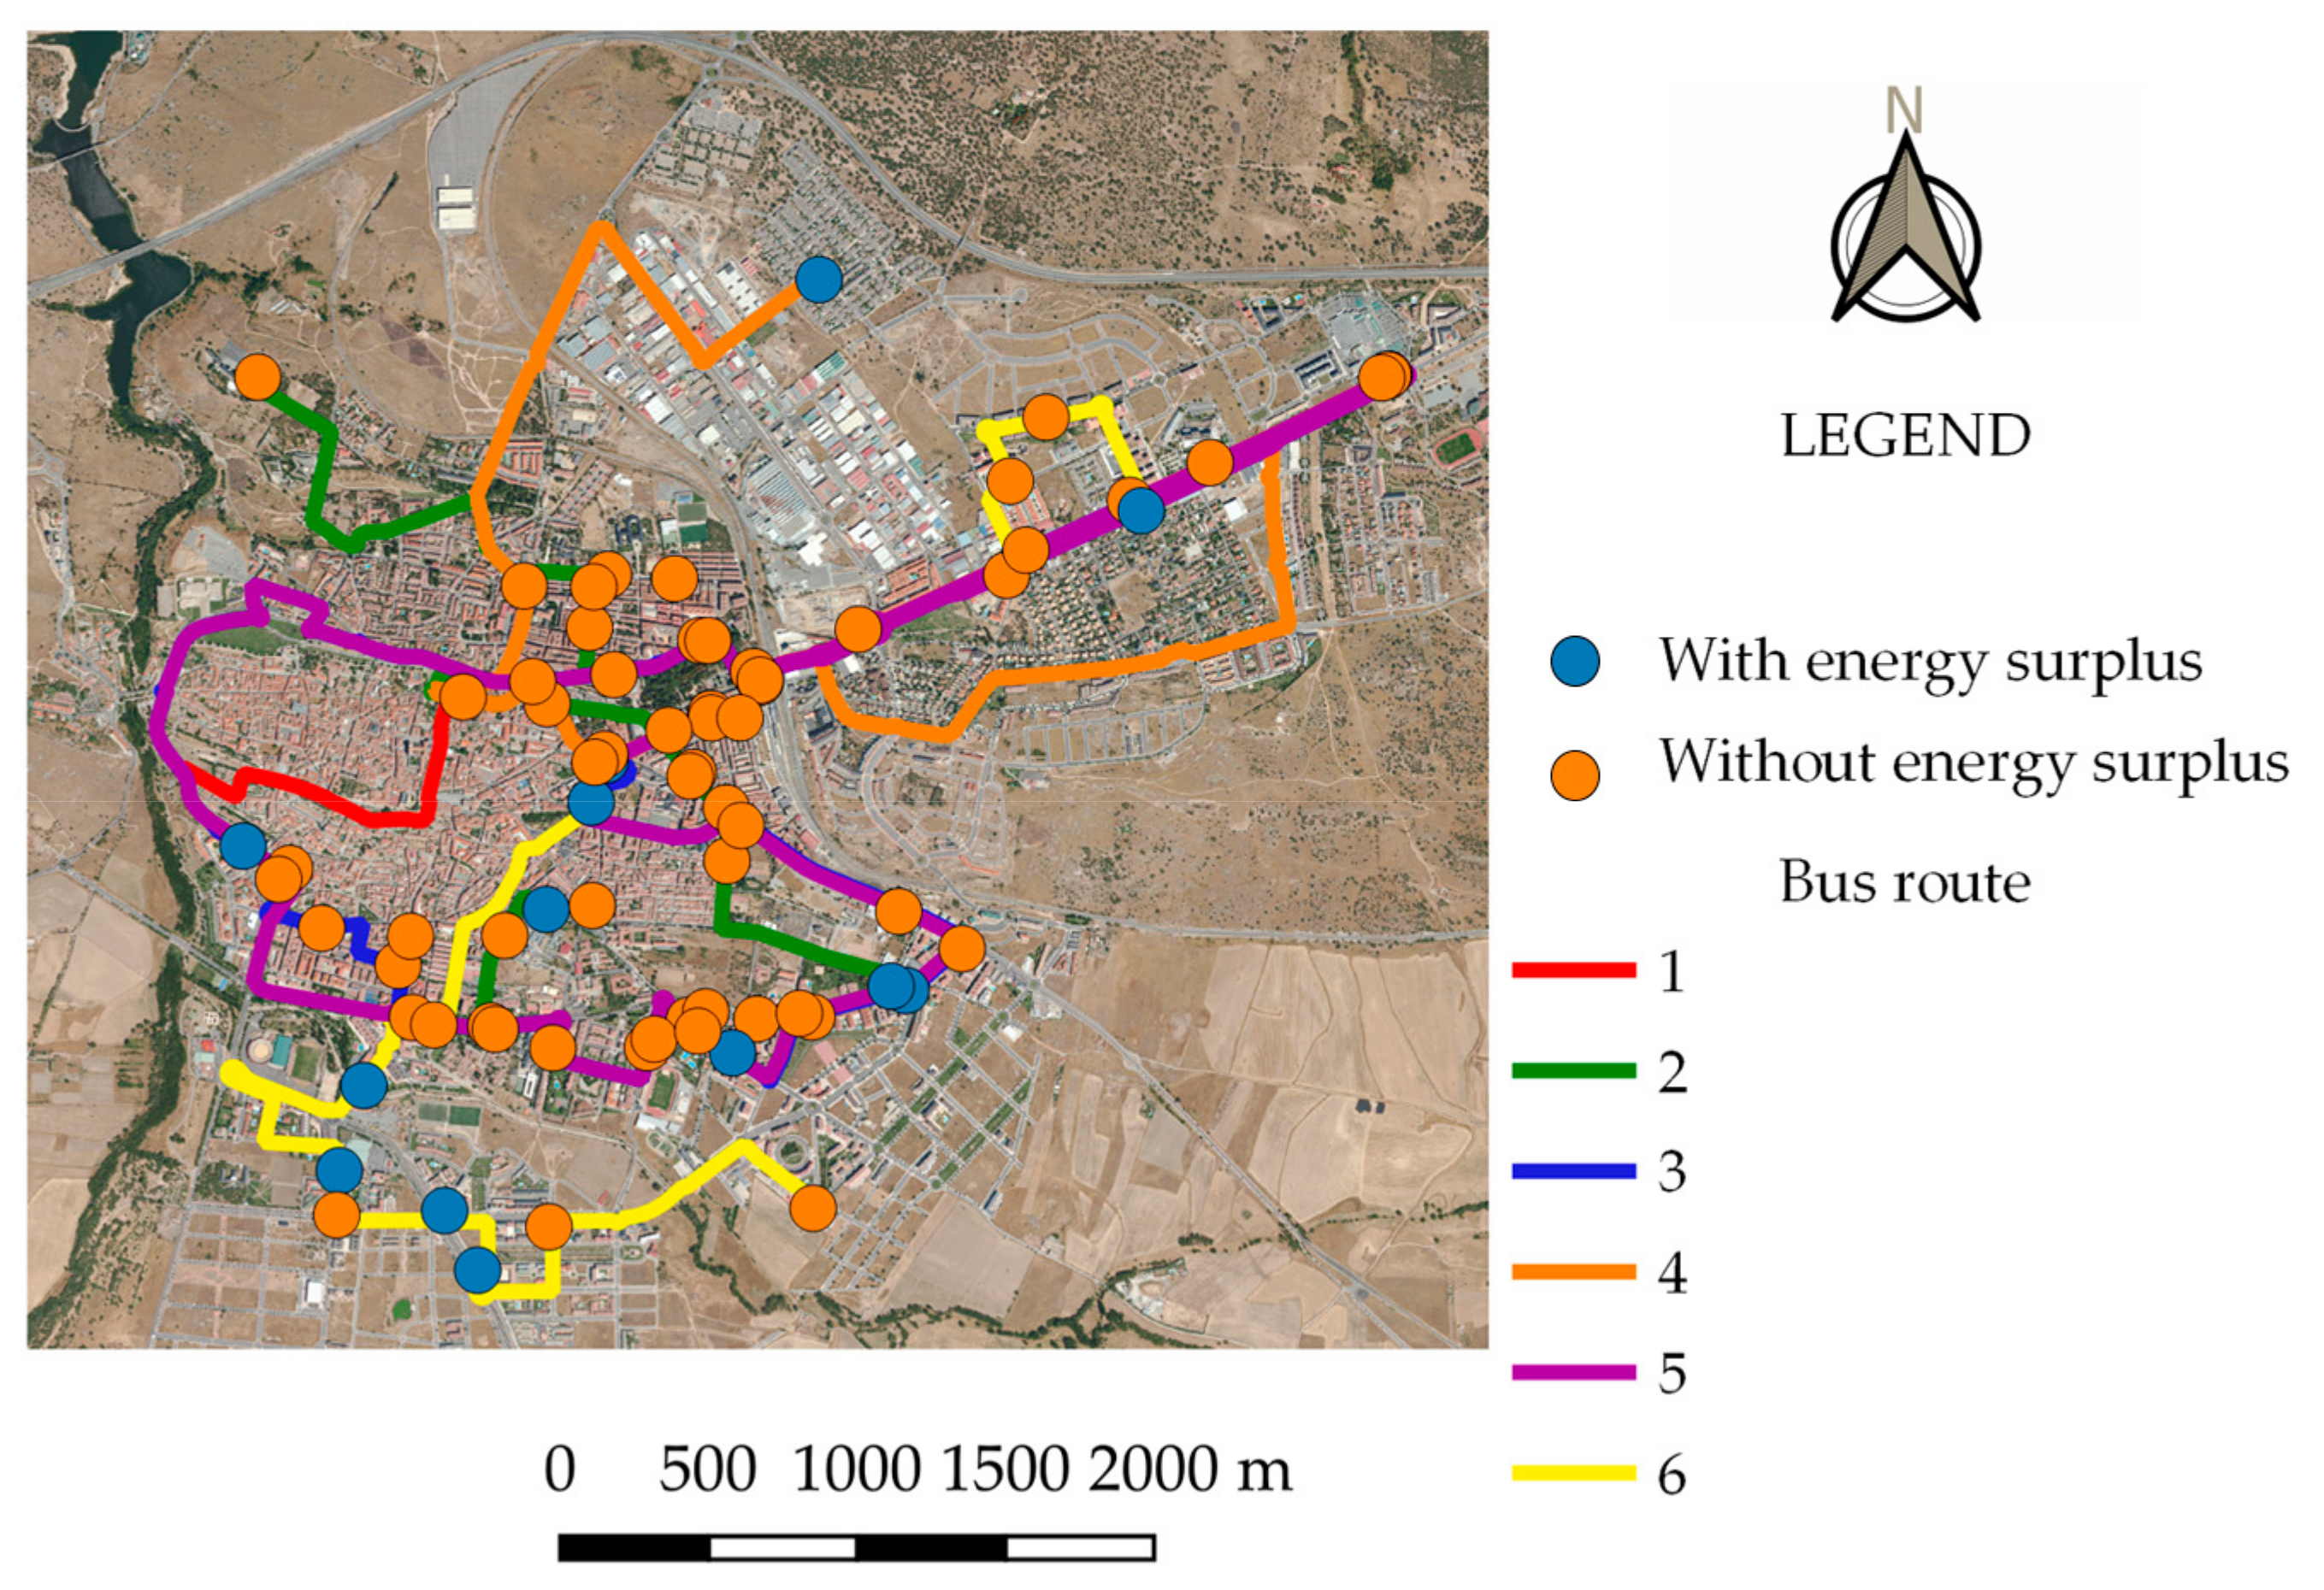
Taking these previous consumption values as a starting point and basing on the knowledge previously obtained, the solar potential of these structures in the city of Avila is estimated using the PVGIS tool in combination with the highest resolution horizon profile. Based on an overall balance between the total energy consumed and the total energy generated throughout the day, the results of this analysis indicate that the integration of flexible solar panels in the current model of bus shelters allows enough energy to be generated in some months to cover the energy consumed. Figure 18 shows the number of bus shelters with and without energy surplus throughout the year. There is no case where the required energy demand is the same as the solar energy production. Figure 19 shows the geographical distribution of bus shelters with and without energy in December.
The following figure (Figure 20) shows graphically the evolution of the average bus shelter surplus per bus shelter on a monthly basis.
This surplus energy could be injected into the grid, either to offset the energy costs of bus shelters that do not generate enough energy for their own consumption or to satisfy other energy consumption sources in the city. Another alternative would be to convert bus shelters with surplus energy into more energy-intensive points, such as charging points for light electric vehicles.
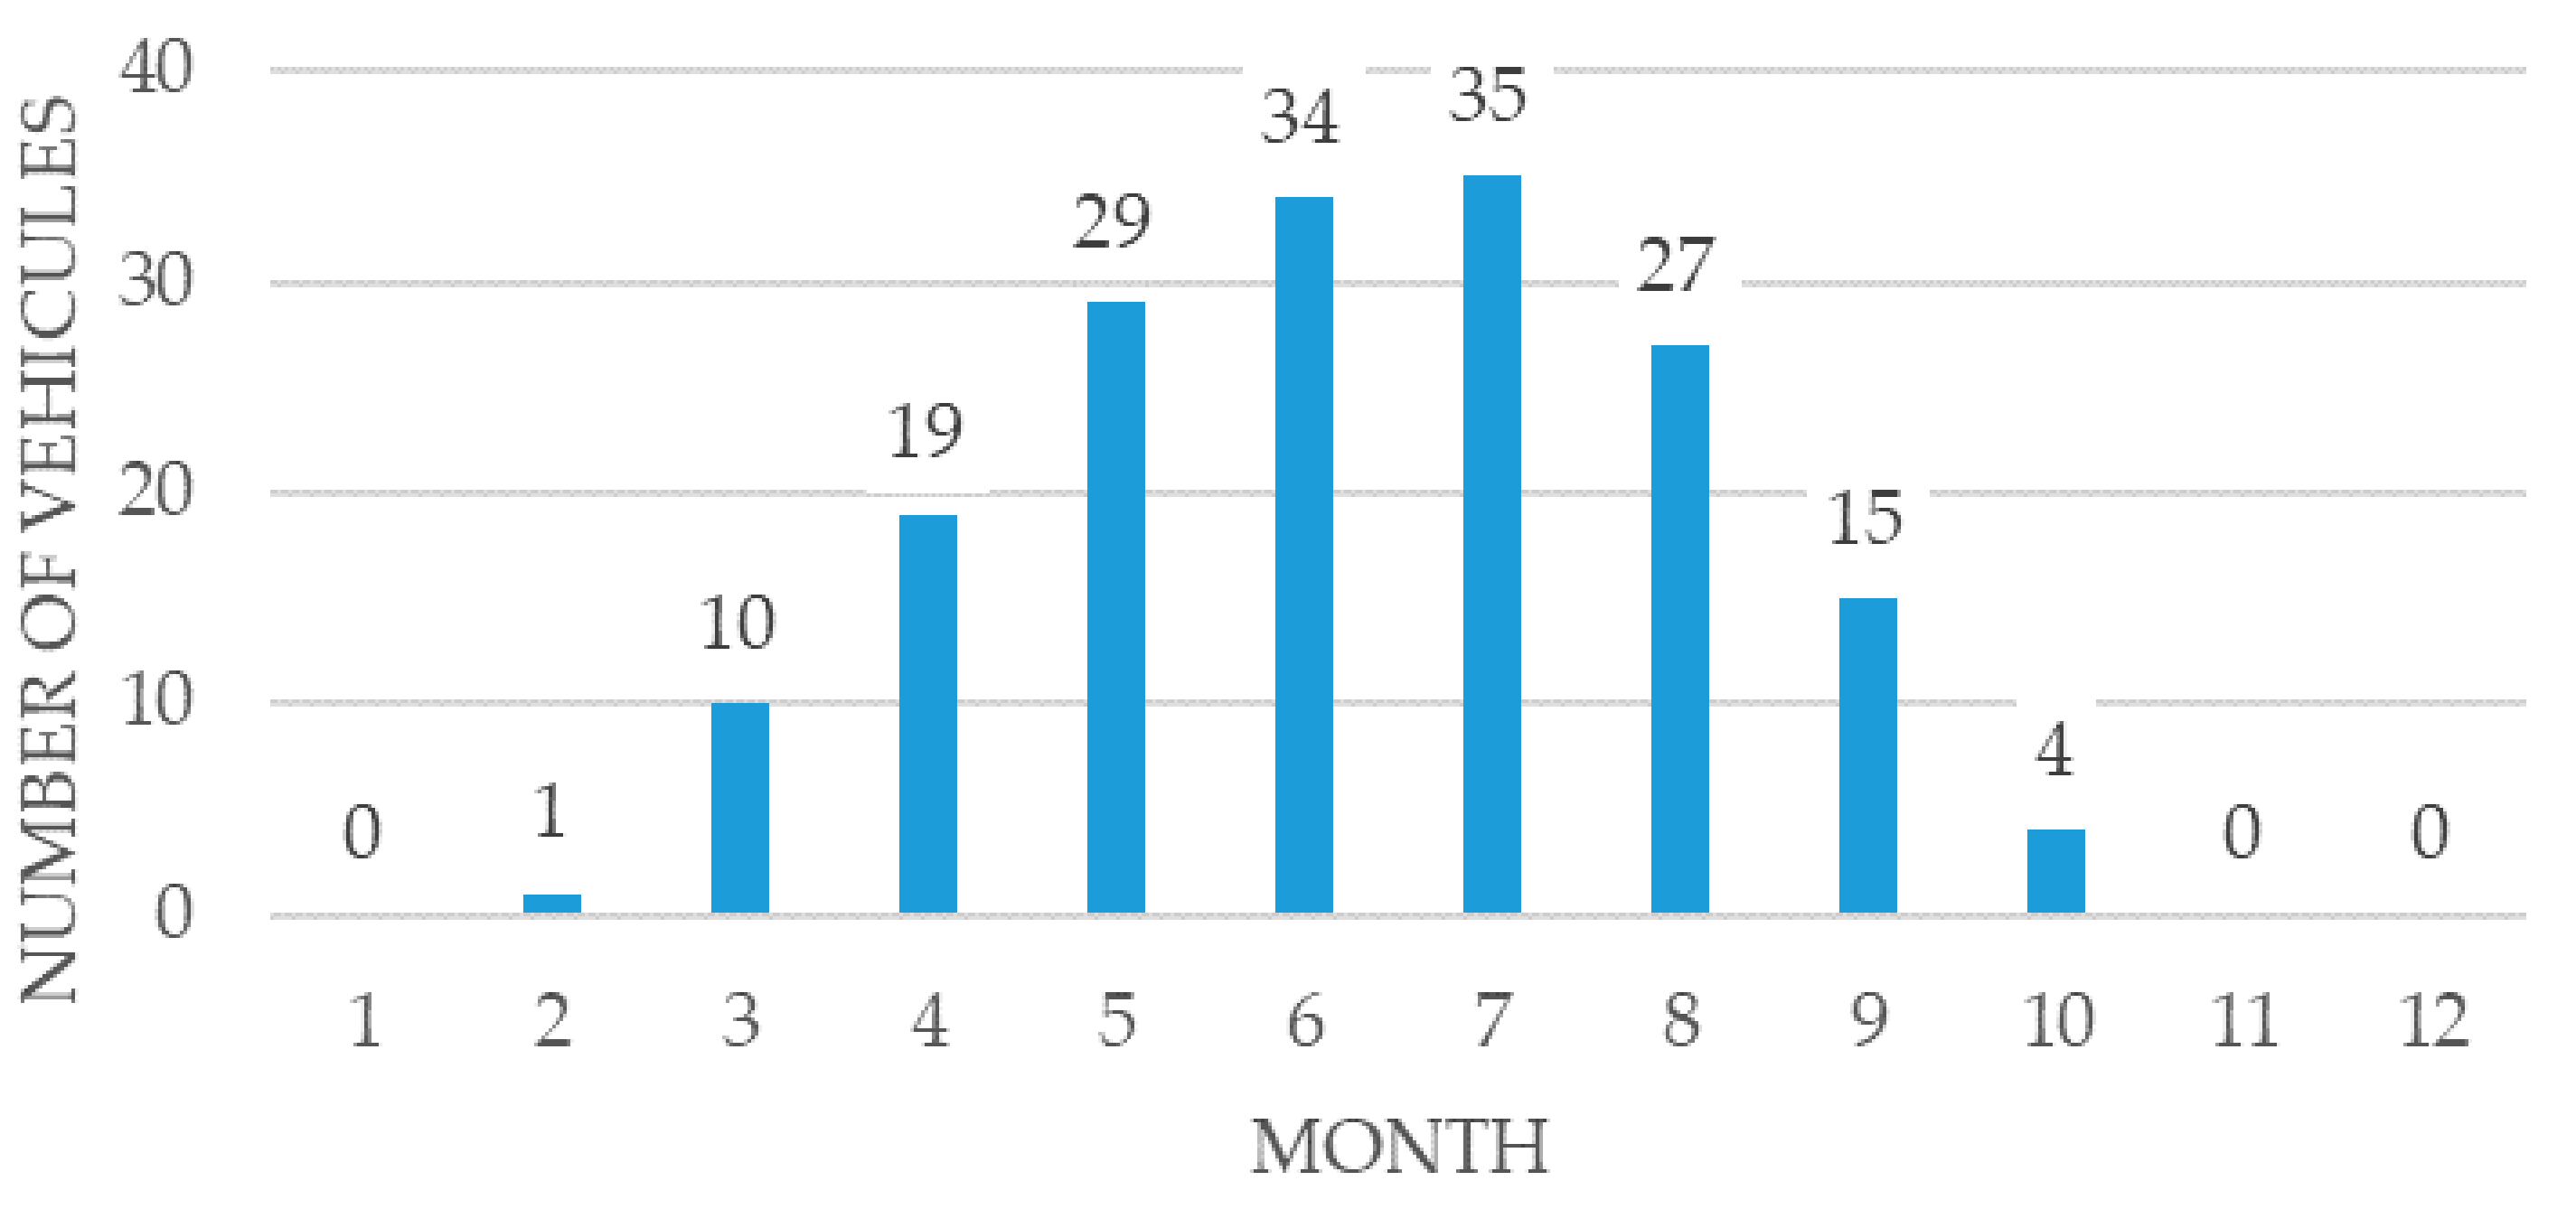
Electric scooters and electric bicycles require on average 0.350 kWh and need 5 h on average to fully charge [40]. Based on the results of the average energy surpluses and consumption of light vehicles, it is estimated that these structures can be converted into charging points without additional energy costs. In January, November and December, the energy generated is insufficient to cover the energy consumption of a bus shelter. The results show that the maximum average number of vehicles charged per bus shelter with an energy surplus was 35 vehicles in July (Figure 21).
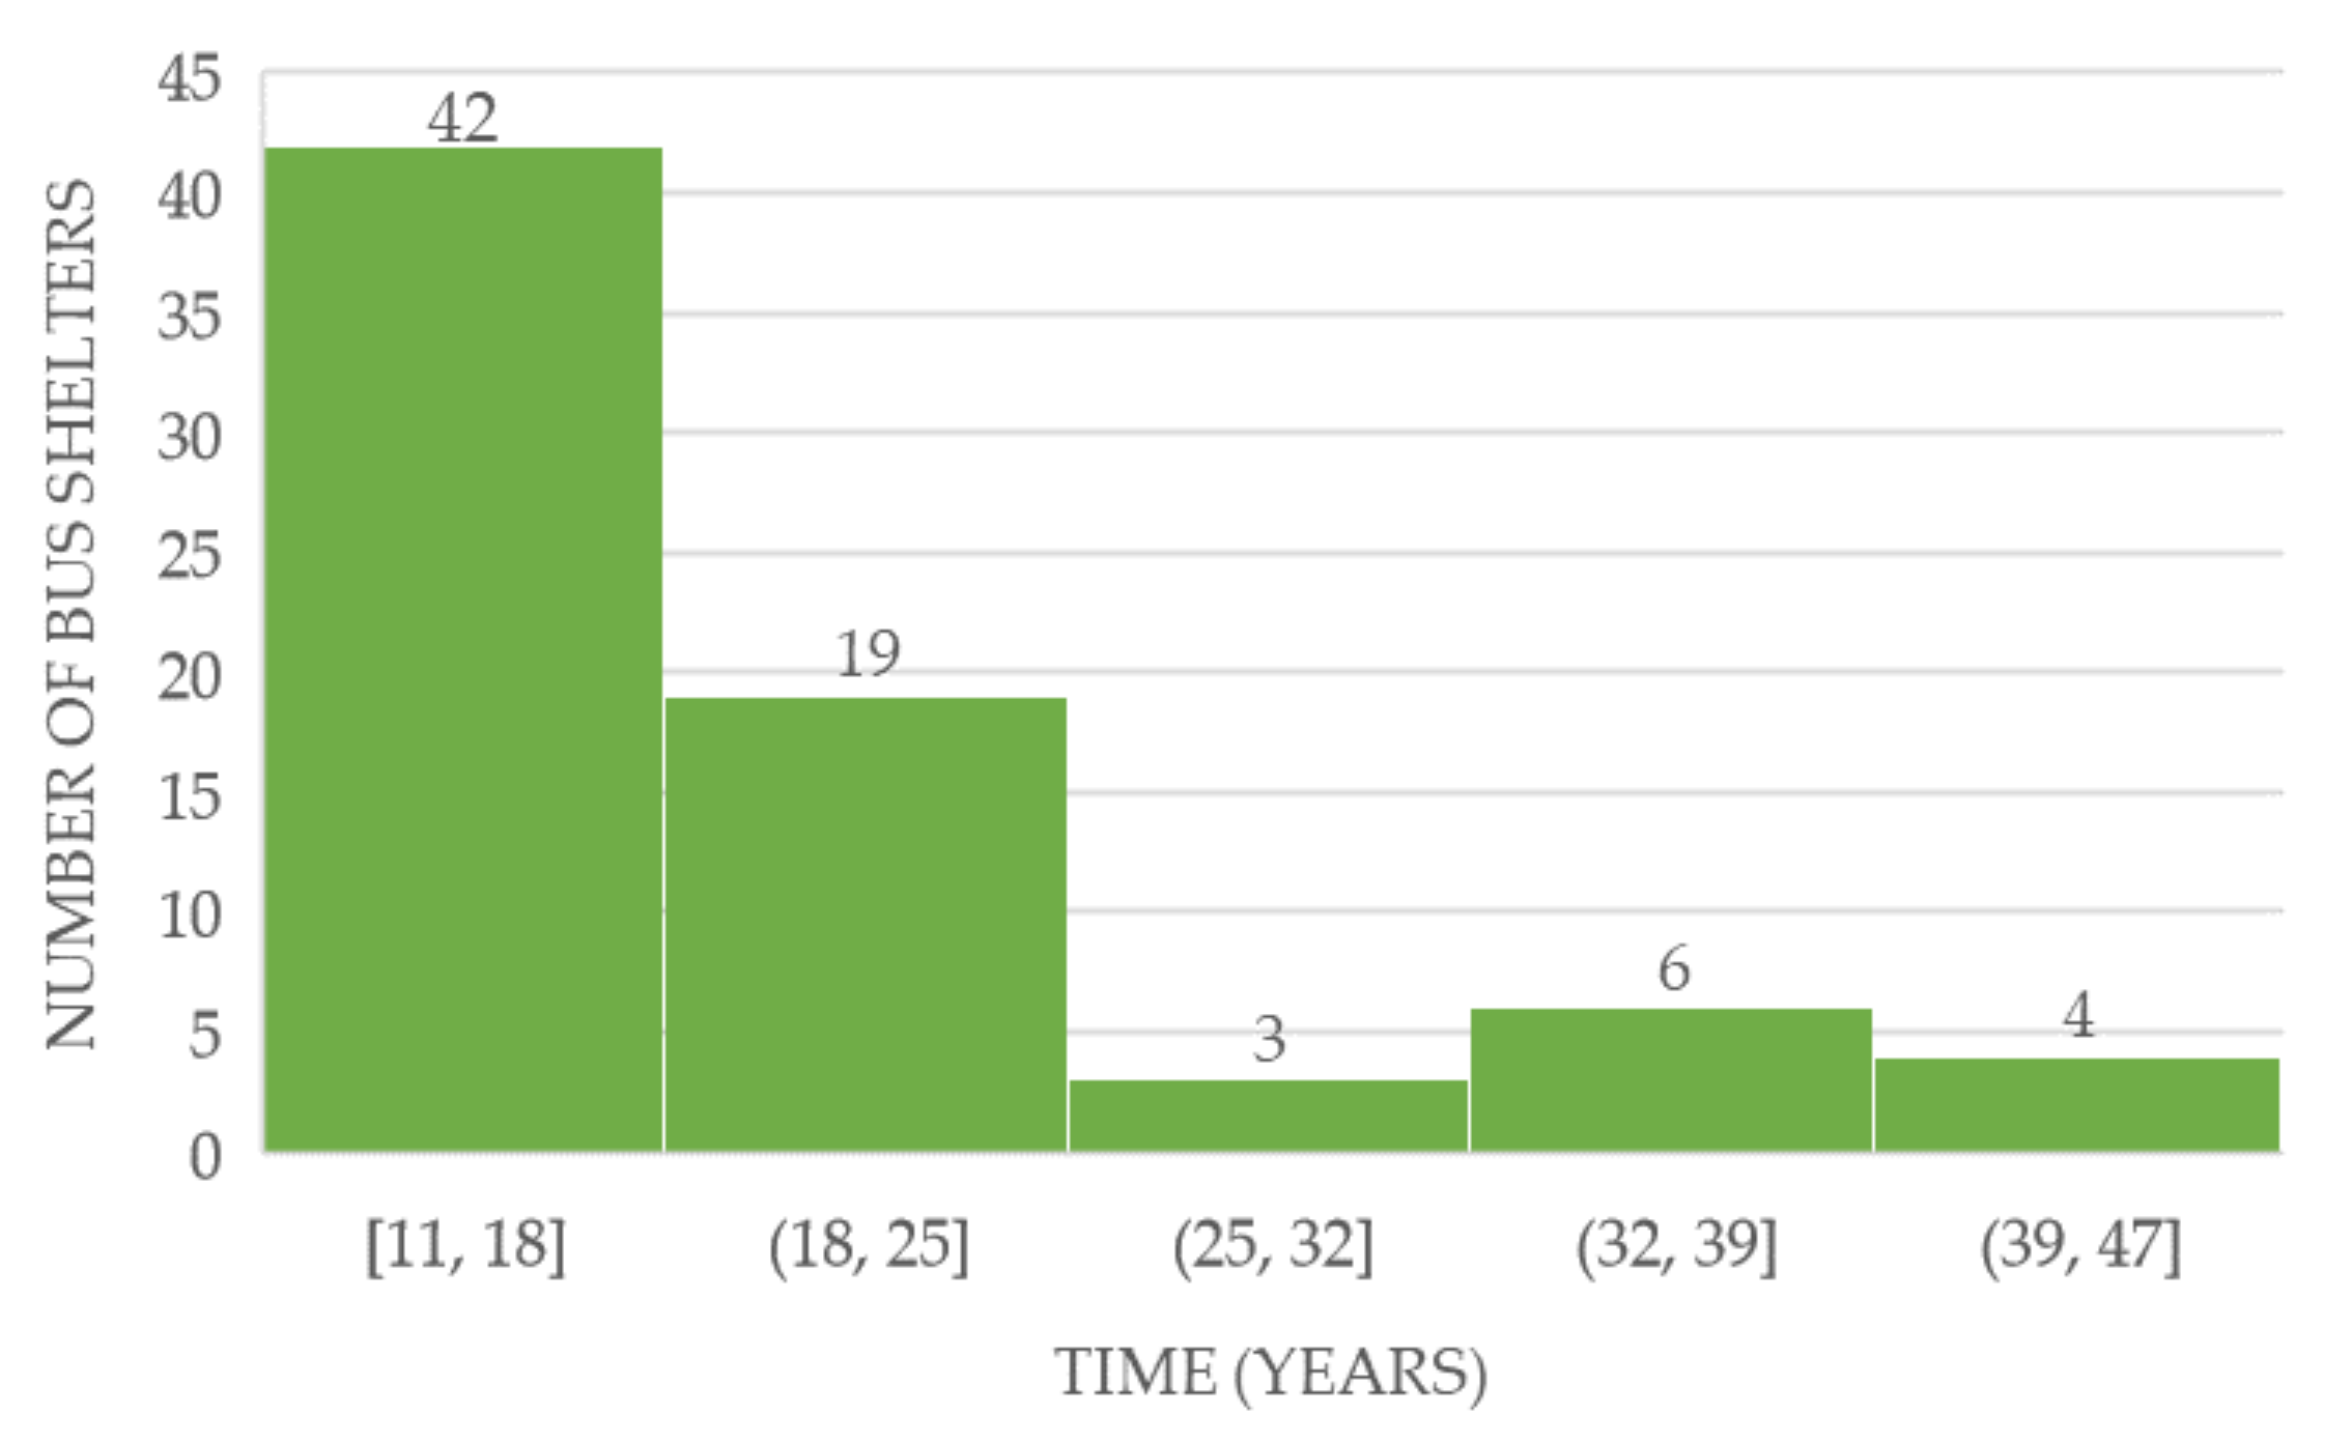
From an economic point of view, taking into account the following issues from a conservative perspective, the time it takes to amortize this solar installation only with the generation of annual energy is 20 years on average (Figure 22): (i) the cost of installing solar panels on the current bus shelter model presents an additional cost for the solar installation of 2340.45 EUR [41,42,43], (ii) the price of energy in 2022 was 0.20111 EUR/kWh [44], and (iii) the production of each bus shelters is calculated considering the horizon profile generated with a density of 1 pt/m2.
5. Conclusions
Bus shelters are one of the most frequent urban furniture elements in cities and can become a great alternative for urban solar energy harvesting and also allow the generation of energy close to consumption centers. The main disadvantage of this type of installation for energy generation is the presence of nearby elements such as buildings or trees that generate shadows. Although they are not usually employed for solar exploitation, bus shelters present great potential for this purpose, as shown in this article.
The research work presented in this article makes a complete analysis of the solar potential of these structures in the city of Avila (Spain), considering the effect of shading using the PVGIS tool. For this purpose, first an evaluation of the solar radiation reaching the bus shelters is carried out in four different cases: (i) without using a horizon profile; (ii) using a low-resolution horizon profile generated by PVGIS; (iii) using a horizon profile generated by a LiDAR point cloud with a resolution of 0.5 pts/m2; and (iv) using a horizon profile generated by a LiDAR point cloud with a resolution of 1 pt/m2. In this first analysis, the effect of the inclusion and resolution of a horizon profile to account for shadows is evaluated, and an automatic and self-developed methodology for the extraction of horizon profiles using LiDAR point clouds is validated. This methodology can be used at different scales within a city due to its low computational cost in combination with the PVGIS tool.
The results of the solar radiation analysis between profiles show little variation in radiation between not using a horizon profile and using the horizon profile generated by PVGIS. This indicates the need to include a higher-resolution horizon profile to account for the effect of shadows. The use of a horizon profile derived from a LiDAR point cloud with a density of 0.5 pts/m2 or 1 pt/m2 allows to obtain a solar radiation value that takes into account the effect of shadows by the different nearby elements, consequently being more adjusted to reality. The greatest differences are found in south-facing installations, since it is the orientation that receives the most solar radiation. Differences that, in the case of a horizon profile derived from a LiDAR point cloud of 0.5 pts/m2, reach a reduction of 29.90% (with regard to the energy generation calculated ignoring the possible shading), while in the case of a LiDAR point cloud of 1 pt/m2, it is 37%.
In order to determine the effect of the electrical energy generated in all the bus shelters, the installation of a little-known and little-used panel model was chosen: flexible panels. This is a solar panel model that fits perfectly with the morphology of the current bus shelters and allows the use of solar energy in the city without changing the structure. This gives an idea of the real possibilities of this technology compared to the most commonly used technology: conventional solar panels.
The results indicate the importance of taking into account the effect of shading on power generation. Although the resolution of the horizon profile is important, its effect is less noticeable on east- and north-facing installations.
When analyzing in depth the effect of shadows on the different bus shelters in the city, different behaviors are observed between the two main elements that generate shadows on the bus shelters: trees and buildings. The difference in solar radiation with the use of the different horizon profiles obtained with the methodology presented in the case of buildings is much less noticeable than in the case of trees. One of the reasons that makes the difference more noticeable is the difference in flight dates. These are elements that increase over time. Therefore, future research should focus on the difference in density using data from very close dates within the same season. Particularly interesting is the analysis in spring when the trees have the greatest volume.
Finally, a last analysis is carried out that shows the real application of the electrical energy generated in cities. Based on the electrical energy generated by the installation of flexible panels, it is observed that in most months of the year, the energy generated is greater than, according to an initial estimate, the bus shelters need for lighting and pedestrian information. This surplus energy, although it could be injected into the grid for another use, is valued for the recharging of light electric vehicles. This means that bus shelters can also be converted into charging points for light vehicles. The results obtained indicate that the bus shelters that generate the most electricity through solar charging allow up to 35 light vehicles to be recharged in the most favorable month, July.
The main general conclusion of this work is the need to take shadows in cities into account when analyzing solar potential. This can be accurately conducted by using horizon profiles with a certain degree of detail. The presented methodology for the extraction of horizon profiles allows the automatic and fast generation of accurate horizon profiles. This methodology can be extrapolated not only to the energy field but also to other fields where it is of interest to know the presence of obstacles and shadows, as well as their geometric characterization. Thanks to this work, the use of the PVGIS tool to evaluate solar potential can be corroborated. In addition, another possible use of bus shelters from the energy point of view is shown: not only as a point of generation of clean energy but also as a charging point for light electric vehicles.
All the work and results shown give rise to further research on the installation of solar panels on bus shelters and public elements. The first direct analysis of this research could be an evaluation of the solar potential of conventional panels. Another point that could be of interest derived from this research is the design of an urban electric vehicle charging network, considering bus shelters as charging points.
Author Contributions
Conceptualization, M.S.-A. and S.L.; methodology, M.S.-A.; software, J.A.M.-J.; validation, M.S.-A., J.A.M.-J. and E.G.-G.; formal analysis, M.S.-A.; writing—original draft preparation, M.S.-A.; writing—review and editing, S.L., J.A.M.-J. and E.G.-G.; funding acquisition, S.L. All authors have read and agreed to the published version of the manuscript.
Funding
This research has been funded by several sources: the European Union through Fondo Social Europeo (EDU/601/2020), Centro de Transferencia del Conocimiento y Diputación de Avila with the financial support for the project “Sistema de refrigeración pasivo para paneles fotovoltaicos flotantes” (6395/2022), Centro de Transferencia del Conocimiento y Diputación de Avila with the financial support for the project “Marquesina inteligente” (18L1IL), NextGenerationEU programme and Ministerio de Asustos Económicos y Transformación digital under grant reference MIA.2021.M04.0008 (IA4TES) and the European Union’s Horizon 2020 research and innovation programme under grant agreement No. 101036926 (TREEADS). Content reflects only the author’s view and European Commission is not responsible for any use that may be made of the information it contains.
Data Availability Statement
Not applicable.
Conflicts of Interest
The authors declare no conflict of interest. The funders had no role in the design of the study; in the collection, analyses, or interpretation of data; in the writing of the manuscript; or in the decision to publish the results.
References
- IRENA. World Energy Transitions Outlook 2023: 1.5 °C Pathway; International Renewable Energy Agency: Masdar City, United Arab Emirates, 2023. [Google Scholar]
- International Energy Agency. Empowering Cities for a Net Zero Future: Unlocking Resilient, Smart, Sustainable Urban Energy Systems; OECD: Paris, France, 2021. [Google Scholar]
- Hassan, Q.; Abdulateef, A.M.; Hafedh, S.A.; Al-samari, A.; Abdulateef, J.; Sameen, A.Z.; Salman, H.M.; Al-Jiboory, A.K.; Wieteska, S.; Jaszczur, M. Renewable Energy-to-Green Hydrogen: A Review of Main Resources Routes, Processes and Evaluation. Int. J. Hydrogen Energy 2023, 48, 17383–17408. [Google Scholar] [CrossRef]
- IRENA. Renewable Capacity Statistics 2023; International Renewable Energy Agency: Masdar City, United Arab Emirates, 2023. [Google Scholar]
- Allouhi, A.; Rehman, S.; Buker, M.S.; Said, Z. Up-to-Date Literature Review on Solar PV Systems: Technology Progress, Market Status and R&D. J. Clean. Prod. 2022, 362, 132339. [Google Scholar]
- IRENA; CPI. Global Landscape of Renewable Energy Finance; International Renewable Energy Agency: Masdar City, United Arab Emirates, 2023. [Google Scholar]
- SolarPower Europe. Solar Cities—21 Solar Solutions for the City Energy Transition. 2023. Available online: https://www.solarpowereurope.org/insights/thematic-reports/solar-cities-21-solar-solutions-for-the-city-energy-transition-1 (accessed on 16 August 2023).
- Yang, Y.; Campana, P.E.; Stridh, B.; Yan, J. Potential Analysis of Roof-Mounted Solar Photovoltaics in Sweden. Appl. Energy 2020, 279, 115786. [Google Scholar] [CrossRef]
- Ouria, M. Solar Energy Potential According to Climatic and Geometrical Parameters of Cities and Buildings: A Case-Study from Tabriz City-Iran. Urban Clim. 2019, 28, 100469. [Google Scholar] [CrossRef]
- Preradović, M. Solar Energy Potential in Freiburg, Graz, Maribor, Banja Luka, Niš, and Athens. Facta Univ. Ser. Electron. Energetics 2022, 35, 393–403. [Google Scholar] [CrossRef]
- Tapia, M.; Ramos, L.; Heinemann, D.; Zondervan, E. Power to the City: Assessing the Rooftop Solar Photovoltaic Potential in Multiple Cities of Ecuador. Phys. Sci. Rev. 2022, 8, 2285–2319. [Google Scholar] [CrossRef]
- Li, Q.; Krapf, S.; Shi, Y.; Zhu, X.X. SolarNet: A Convolutional Neural Network-Based Framework for Rooftop Solar Potential Estimation from Aerial Imagery. Int. J. Appl. Earth Obs. Geoinf. 2023, 116, 103098. [Google Scholar] [CrossRef]
- Martín-Jiménez, J.; Del Pozo, S.; Sánchez-Aparicio, M.; Lagüela, S. Multi-Scale Roof Characterization from LiDAR Data and Aerial Orthoimagery: Automatic Computation of Building Photovoltaic Capacity. Autom. Constr. 2020, 109, 102965. [Google Scholar] [CrossRef]
- Özdemir, S.; Yavuzdoğan, A.; Bilgilioğlu, B.B.; Akbulut, Z. SPAN: An Open-Source Plugin for Photovoltaic Potential Estimation of Individual Roof Segments using Point Cloud Data. Renew. Energy 2023, 216, 119022. [Google Scholar] [CrossRef]
- Sánchez-Aparicio, M.; Martín-Jiménez, J.; Del Pozo, S.; González-González, E.; Lagüela, S. Ener3DMap-SolarWeb Roofs: A Geospatial Web-Based Platform to Compute Photovoltaic Potential. Renew. Sustain. Energy Rev. 2021, 135, 110203. [Google Scholar] [CrossRef]
- Singh, R. Approximate Rooftop Solar PV Potential of Indian Cities for High-Level Renewable Power Scenario Planning. Sustain. Energy Technol. Assess. 2020, 42, 100850. [Google Scholar] [CrossRef]
- Ren, H.; Xu, C.; Ma, Z.; Sun, Y. A Novel 3D-Geographic Information System and Deep Learning Integrated Approach for High-Accuracy Building Rooftop Solar Energy Potential Characterization of High-Density Cities. Appl. Energy 2022, 306, 117985. [Google Scholar] [CrossRef]
- Gassar, A.A.A.; Cha, S.H. Review of Geographic Information Systems-Based Rooftop Solar Photovoltaic Potential Estimation Approaches at Urban Scales. Appl. Energy 2021, 291, 116817. [Google Scholar] [CrossRef]
- Panagiotidou, M.; Brito, M.C.; Hamza, K.; Jasieniak, J.J.; Zhou, J. Prospects of Photovoltaic Rooftops, Walls and Windows at a City to Building Scale. Sol. Energy 2021, 230, 675–687. [Google Scholar] [CrossRef]
- Freitas, S.; Brito, M.C. Solar Façades for Future Cities. Renew. Energy Focus 2019, 31, 73–79. [Google Scholar] [CrossRef]
- Fakour, H.; Imani, M.; Lo, S.; Yuan, M.; Chen, C.; Mobasser, S.; Muangthai, I. Evaluation of Solar Photovoltaic Carport Canopy with Electric Vehicle Charging Potential. Sci. Rep. 2023, 13, 2136. [Google Scholar] [CrossRef] [PubMed]
- Gangwar, P.; Tripathi, R.P.; Singh, A.K. Solar Photovoltaic Tree: A Review of Designs, Performance, Applications, and Challenges. Energy Sources Part A Recovery Util. Environ. Eff. 2021, 1–28. [Google Scholar] [CrossRef]
- Liu, Z.; Fei, T. Road PV Production Estimation at City Scale: A Predictive Model Towards Feasible Assessing Regional Energy Generation from Solar Roads. J. Clean. Prod. 2021, 321, 129010. [Google Scholar] [CrossRef]
- Mutani, G.; Vodano, A.; Pastorelli, M. Photovoltaic Solar Systems for Smart Bus Shelters in the Urban Environment of Turin (Italy). In Proceedings of the 2017 IEEE International Telecommunications Energy Conference (INTELEC), Broadbeach, QLD, Australia, 22–26 October 2017; pp. 20–25. [Google Scholar]
- Santos, T.; Lobato, K.; Rocha, J.; Tenedório, J.A. Modeling Photovoltaic Potential for Bus Shelters on a City-Scale: A Case Study in Lisbon. Appl. Sci. 2020, 10, 4801. [Google Scholar] [CrossRef]
- Eiva, U.R.J.; Fahim, T.M.; Islam, S.S.; Ullah, M.A. Design, Performance, and Techno-economic Analysis of a Rooftop Grid-tied PV System for a Remotely Located Building. IET Renew. Power Gener. 2023, 1–17. [Google Scholar] [CrossRef]
- Reffat, R.M.; Ezzat, R. Impacts of Design Configurations and Movements of PV Attached to Building Facades on Increasing Generated Renewable Energy. Sol. Energy 2023, 252, 50–71. [Google Scholar] [CrossRef]
- Yang, R.; Imalka, S.T.; Wijeratne, W.P.; Amarasinghe, G.; Weerasinghe, N.; Jayakumari, S.D.S.; Zhao, H.; Wang, Z.; Gunarathna, C.; Perrie, J.; et al. Digitalizing Building Integrated Photovoltaic (BIPV) Conceptual Design: A Framework and an Example Platform. Build. Environ. 2023, 243, 110675. [Google Scholar] [CrossRef]
- Salgado-Conrado, L.; Lopez-Montelongo, A.; Alvarez-Macias, C.; Hernadez-Jaquez, J. Review of Heliodon Developments and Computational Tools for Building Shadow Analysis. Buildings 2022, 12, 627. [Google Scholar] [CrossRef]
- Viana-Fons, J.D.; Gonzálvez-Maciá, J.; Payá, J. Development and Validation in a 2D-GIS Environment of a 3D Shadow Cast Vector-Based Model on Arbitrarily Orientated and Tilted Surfaces. Energy Build. 2020, 224, 110258. [Google Scholar] [CrossRef]
- Muhammed, E.; Morsy, S.; El-Shazly, A. Building Rooftops Extraction for Solar PV Potential Estimation using Gis-Based Methods. Int. Arch. Photogramm. Remote Sens. Spat. Inf. Sci. 2021, 44, 119–125. [Google Scholar] [CrossRef]
- Bunme, P.; Shiota, A.; Mitani, Y. Solar Power Estimation using GIS Considering Shadow Effects for Distribution System Planning. In Proceedings of the 2020 IEEE International Conference on Environment and Electrical Engineering and 2020 IEEE Industrial and Commercial Power Systems Europe (EEEIC/I&CPS Europe), Madrid, Spain, 9–12 June 2020; pp. 1–5. [Google Scholar]
- Zhang, Y.; Dai, Z.; Wang, W.; Li, X.; Chen, S.; Chen, L. Estimation of the Potential Achievable Solar Energy of the Buildings using Photogrammetric Mesh Models. Remote Sens. 2021, 13, 2484. [Google Scholar] [CrossRef]
- Suri, M.; Huld, T.; Cebecauer, T.; Dunlop, E.D. Geographic Aspects of Photovoltaics in Europe: Contribution of the PVGIS Website. IEEE J. Sel. Top. Appl. Earth Obs. Remote Sens. 2008, 1, 34–41. [Google Scholar] [CrossRef]
- Sánchez-Aparicio, M.; Del Pozo, S.; Martín-Jiménez, J.A.; González-González, E.; Andrés-Anaya, P.; Lagüela, S. Influence of Lidar Point Cloud Density in the Geometric Characterization of Rooftops for Solar Photovoltaic Studies in Cities. Remote Sens. 2020, 12, 3726. [Google Scholar] [CrossRef]
- Vega-Garita, V.; Alpizar-Gutierrez, V.; Alpízar-Castillo, J. A Practical Method for Considering Shading on Photovoltaics Systems Energy Yield. Energy Convers. Manag. X 2023, 20, 100412. [Google Scholar] [CrossRef]
- González-González, E.; Martín-Jiménez, J.; Sánchez-Aparicio, M.; Del Pozo, S.; Lagüela, S. Evaluating the Standards for Solar PV Installations in the Iberian Peninsula: Analysis of Tilt Angles and Determination of Solar Climate Zones. Sustain. Energy Technol. Assess. 2022, 49, 101684. [Google Scholar] [CrossRef]
- SunPower. SunPower® Flexible Solar Panels|SPR-E-Flex-170 6x8; SunPower: San Jose, CA, USA, 2021. [Google Scholar]
- Ojeda, J.C.; Martínez, J. PNOA-LIDAR. Plan Nacional De Ortofotografía Aérea. Empleo Del LIDAR En Aplicaciones Ambientales Terrestres. In Proceedings of the XV Congreso Nacional Tecnologías De Información Geográfica, Madrid, Spain, 19–21 September 2012; pp. 19–21. [Google Scholar]
- La Vanguardia. ¿Cuánto Cuesta Cargar Un Patinete Eléctrico? Así Se Reflejará En Tu Factura. 2020. Available online: https://www.lavanguardia.com/motor/eco/20201013/33762/cuesta-cargar-patinete-electrico-asi-reflejara-factura.html (accessed on 23 August 2023).
- EfectoLED. Cuadro De Protección PV Monofásico 2-6kW AC MAXGE. 2023. Available online: https://www.efectoled.com/es/comprar-cofrets/87455-cuadro-de-proteccion-pv-maxge-2-6kw-ac-monofasico.html (accessed on 23 August 2023).
- TeknoSolar. Placa Solar Semiflexible SunPower 170W 29.4V. 2023. Available online: https://www.teknosolar.com/placas-solares/placas-solares-barcos-y-caravanas/ (accessed on 23 August 2023).
- El Almacén Fotovoltaico. Microinversor APsystems DS3 880W. 2023. Available online: https://elalmacenfotovoltaico.com/micro-inversores/359-microinversor-apsystems-ds3-880w.html (accessed on 23 August 2023).
- ESIOS. Precio Medio Horario 2022—España. 2023. Available online: https://www.esios.ree.es/es/analisis/10211?compare_indicators=805%2C806%2C807%2C808%2C809%2C810%2C811%2C812%2C813%2C814%2C815%2C816%2C1277%2C10403%2C1286%2C1368&start_date=01-01-2022T00%3A00&geoids=&vis=1&end_date=31-12-2022T23%3A55&compare_start_date=01-01-2021T00%3A00&groupby=year&compare_end_date=31-12-2021T23%3A45 (accessed on 23 August 2023).
Figure 1.
Spatial distribution of bus routes and bus shelters in Ávila.

Figure 2.
The aspect map of the city of Avila derived from a LiDAR point cloud. According to PVGIS criteria, 0° aspect refers to South orientation, while 360° is assigned to North orientation.
Figure 2.
The aspect map of the city of Avila derived from a LiDAR point cloud. According to PVGIS criteria, 0° aspect refers to South orientation, while 360° is assigned to North orientation.

Figure 3.
Current model of the bus shelters installed in the streets of the city.

Figure 4.
Dimensions (m.) of the different elements of the bus shelters installed in Ávila.

Figure 5.
Flexible solar panels (a) Sun Power model adapted with permission from [38] (b) sketch of the position of the flexible solar panels on the roof of the bus shelter.
Figure 5.
Flexible solar panels (a) Sun Power model adapted with permission from [38] (b) sketch of the position of the flexible solar panels on the roof of the bus shelter.

Figure 6.
Installation of flexible solar technology for energy use on existing bus shelters: (a) graphic diagram; (b) single-line diagram.
Figure 6.
Installation of flexible solar technology for energy use on existing bus shelters: (a) graphic diagram; (b) single-line diagram.

Figure 7.
An example of dynamic graphs of monthly irradiation (kWh/m2) of a bus shelter in Avila.

Figure 8.
An example of dynamic graphs of monthly energy (kWh) of a bus shelter in Avila.

Figure 9.
Outline of horizon for the same position through: (a) horizon calculated by PVGIS; (b) horizon file uploaded by the user.
Figure 9.
Outline of horizon for the same position through: (a) horizon calculated by PVGIS; (b) horizon file uploaded by the user.

Figure 10.
Workflow of the methodology developed for the automatic estimation of the horizon height.
Figure 10.
Workflow of the methodology developed for the automatic estimation of the horizon height.

Figure 11.
Average solar electric power (kWh/month) generated in north-facing bus shelters with the presence of shadows using the different horizon profiles analyzed.
Figure 11.
Average solar electric power (kWh/month) generated in north-facing bus shelters with the presence of shadows using the different horizon profiles analyzed.

Figure 12.
Average solar electric power (kWh/month) generated in south-facing bus shelters with the presence of shadows using the different horizon profiles analyzed.
Figure 12.
Average solar electric power (kWh/month) generated in south-facing bus shelters with the presence of shadows using the different horizon profiles analyzed.

Figure 13.
Average solar electric power (kWh/month) generated in east-facing bus shelters with the presence of shadows using the different horizon profiles analyzed.
Figure 13.
Average solar electric power (kWh/month) generated in east-facing bus shelters with the presence of shadows using the different horizon profiles analyzed.

Figure 14.
Average solar electric power (kWh/month) generated in west-facing bus shelters with the presence of shadows using the different horizon profiles analyzed.
Figure 14.
Average solar electric power (kWh/month) generated in west-facing bus shelters with the presence of shadows using the different horizon profiles analyzed.

Figure 15.
Monthly difference of solar electric energy expressed in kWh between the use of different horizon profiles and no horizon profile in bus shelters with shade generated by trees.
Figure 15.
Monthly difference of solar electric energy expressed in kWh between the use of different horizon profiles and no horizon profile in bus shelters with shade generated by trees.

Figure 16.
Monthly difference of solar electric energy expressed in kWh between the use of different horizon profiles and no horizon profile in bus shelters with shade generated by buildings.
Figure 16.
Monthly difference of solar electric energy expressed in kWh between the use of different horizon profiles and no horizon profile in bus shelters with shade generated by buildings.

Figure 17.
Monthly solar electric energy difference expressed in kWh between the use of the horizon profile derived from the 0.5 pts/m2 and 1 pt/m2 point cloud in bus shelters with shading generated by trees and buildings.
Figure 17.
Monthly solar electric energy difference expressed in kWh between the use of the horizon profile derived from the 0.5 pts/m2 and 1 pt/m2 point cloud in bus shelters with shading generated by trees and buildings.

Figure 18.
Number of bus shelters with and without energy surplus per month.

Figure 19.
Geographical distribution of bus shelters with and without energy in December.

Figure 20.
Average monthly value of surplus energy per bus shelter per month.

Figure 21.
Average number of electric vehicles recharged with surplus energy per bus shelter per month.
Figure 21.
Average number of electric vehicles recharged with surplus energy per bus shelter per month.

Figure 22.
Payback time of the solar installations with the electricity generated in the bus shelters in Ávila.
Figure 22.
Payback time of the solar installations with the electricity generated in the bus shelters in Ávila.


Table 1.
Number of bus shelters according to their orientation.
| Orientation | Number of Bus Shelters |
|---|---|
| North | 22 |
| South | 27 |
| East | 12 |
| West | 13 |
Table 2.
Number of bus shelters with obstacles according to their orientation.
| Orientation | Number of Bus Shelters |
|---|---|
| North | 12 |
| South | 22 |
| East | 10 |
| West | 11 |
Table 3.
Main features of the most updated PNOA point cloud of the city of Ávila.
| Point Cloud Density | 0.5 pts/m2 | 1 pt/m2 |
|---|---|---|
| Geodetic reference system | ETRS89 Huso 30 | ETRS89 Huso 30 |
| Altimetric reference system | Orthometric altitude Reference geoid EGM08. | Orthometric altitude Reference geoid EGM08 |
| RMSE Z | ≤40 cm | ≤20 cm |
| Planimetric accuracy | ≤30 cm | ≤30 cm |
| File format | LAS 1.2 format 3 | LAS 1.2 format 3 |
| Date of flight | 27 September 2010 | 30 September 2018 |
Table 4.
Average annual irradiation value [kWh/m2] in North-facing bus shelters.
| Horizon Profile | Average Annual Irradiation Value [kWh/m2] | Standard Deviation |
|---|---|---|
| No profile | 1242.45 | 0.41 |
| PVGIS | 1242.23 | 0.32 |
| Point cloud (0.5 pts/m2) | 1013.83 | 220.81 |
| Point cloud (1 pt/m2) | 965.96 | 301.30 |
Table 5.
Average annual irradiation value [kWh/m2] in South-facing bus shelters.
| Horizon Profile | Average Annual Irradiation Value [kWh/m2] | Standard Deviation |
|---|---|---|
| No profile | 1934.15 | 8.97 |
| PVGIS | 1933.83 | 8.87 |
| Point cloud (0.5 pts/m2) | 1355.75 | 419.85 |
| Point cloud (1 pt/m2) | 1218.55 | 467.64 |
Table 6.
Average annual irradiation value [kWh/m2] in East-facing bus shelters.
| Horizon Profile | Average Annual Irradiation Value [kWh/m2] | Standard Deviation |
|---|---|---|
| No profile | 1643.44 | 4.03 |
| PVGIS | 1641.83 | 3.03 |
| Point cloud (0.5 pts/m2) | 1416.35 | 174.41 |
| Point cloud (1 pt/m2) | 1269.04 | 320.23 |
Table 7.
Average annual irradiation value [kWh/m2] in West-facing bus shelters.
| Horizon Profile | Average Annual Irradiation Value [kWh/m2] | Standard Deviation |
|---|---|---|
| No profile | 1613.52 | 2.50 |
| PVGIS | 1613.42 | 2.52 |
| Point cloud (0.5 pts/m2) | 1240.20 | 230.03 |
| Point cloud (1 pt/m2) | 1227.90 | 283.61 |
Table 8.
Differences in mean annual irradiance and standard deviation between not using a horizon profile and using a horizon profile for each orientation.
Table 8.
Differences in mean annual irradiance and standard deviation between not using a horizon profile and using a horizon profile for each orientation.
| Horizon Profile | Average Difference in Annual Irradiation Value Regarding the Computation with no Horizon Profile [kWh/m2] | |||
|---|---|---|---|---|
| North | South | East | West | |
| PVGIS | 0.22 ± 0.36 | 0.32 ± 0.80 | 1.61 ± 3.14 | 0.10 ± 0.33 |
| Point cloud (0.5 pts/m2) | 228.40 ± 220.61 | 578.08 ± 419.46 | 225.47 ± 174.77 | 373.21 ± 228.92 |
| Point cloud (1 pt/m2) | 276.26 ± 301.14 | 715.28 ± 469.49 | 372.79 ± 320.79 | 385.52 ± 282.62 |
Table 9.
Differences in average annual irradiance expressed as a percentage between not using a horizon profile and using a horizon profile for each orientation.
Table 9.
Differences in average annual irradiance expressed as a percentage between not using a horizon profile and using a horizon profile for each orientation.
| Horizon Profile | % | ||||
|---|---|---|---|---|---|
| North | South | East | West | Average | |
| PVGIS | 0.02 | 0.02 | 0.10 | 0.01 | 0.03 |
| Point cloud (0.5 pts/m2) | 18.40 | 29.90 | 13.82 | 23.14 | 21.32 |
| Point cloud (1 pt/m2) | 22.25 | 37.00 | 22.78 | 23.90 | 26.48 |
Table 10.
Average differences in estimated solar irradiance (kWh/m2) in bus shelters using the different horizon profiles evaluated due to shading by buildings and trees.
Table 10.
Average differences in estimated solar irradiance (kWh/m2) in bus shelters using the different horizon profiles evaluated due to shading by buildings and trees.
| Obstacle | No Profile vs. PVGIS | No Profile vs. Point Cloud (0.5 pts/m2) | No Profile vs. Point Cloud (1 pt/m2) | Point Cloud (0.5 pts/m2) vs. Point Cloud (1 pt/m2) |
|---|---|---|---|---|
| Building | 0.59 ± 1.95 | 364.12 ± 323.72 | 394.55 ± 350.52 | 86.41 ± 110.57 |
| Trees | 0.37 ± 0.66 | 441.21 ± 384.14 | 601.93 ± 450.88 | 238.42 ± 266.38 |
Table 11.
Energy consumption of a bus shelter for the estimation of solar potential in Ávila.
| Element | Power (W) | Time of Use (h) | Energy Consumption (Wh/day) | Energy Consumption (Wh/year) |
|---|---|---|---|---|
| LED panel | 18 | 24 | 432 | 157,680 |
| Lighting | 40 | 15 | 600 | 219,000 |
Disclaimer/Publisher’s Note: The statements, opinions and data contained in all publications are solely those of the individual author(s) and contributor(s) and not of MDPI and/or the editor(s). MDPI and/or the editor(s) disclaim responsibility for any injury to people or property resulting from any ideas, methods, instructions or products referred to in the content. |
© 2023 by the authors. Licensee MDPI, Basel, Switzerland. This article is an open access article distributed under the terms and conditions of the Creative Commons Attribution (CC BY) license (https://creativecommons.org/licenses/by/4.0/).
Share and Cite
MDPI and ACS Style
Sánchez-Aparicio, M.; González-González, E.; Martín-Jiménez, J.A.; Lagüela, S. Solar Potential Analysis of Bus Shelters in Urban Environments: A Study Case in Ávila (Spain). Remote Sens. 2023, 15, 5189. https://doi.org/10.3390/rs15215189
AMA Style
Sánchez-Aparicio M, González-González E, Martín-Jiménez JA, Lagüela S. Solar Potential Analysis of Bus Shelters in Urban Environments: A Study Case in Ávila (Spain). Remote Sensing. 2023; 15(21):5189. https://doi.org/10.3390/rs15215189
Chicago/Turabian StyleSánchez-Aparicio, María, Enrique González-González, Jose Antonio Martín-Jiménez, and Susana Lagüela. 2023. "Solar Potential Analysis of Bus Shelters in Urban Environments: A Study Case in Ávila (Spain)" Remote Sensing 15, no. 21: 5189. https://doi.org/10.3390/rs15215189
Note that from the first issue of 2016, this journal uses article numbers instead of page numbers. See further details here.