
Particle Size Distributions and Extinction Coefficients of Aerosol Particles in Land Battlefield Environments
1
Science and Technology on Electromechanical Dynamic Control Laboratory, Beijing Institute of Technology, Beijing 100081, China
2
Key Laboratory of Traffic Safety on Track, Central South University, Changsha 410083, China
*
Author to whom correspondence should be addressed.
Remote Sens. 2023, 15(20), 5038; https://doi.org/10.3390/rs15205038
Submission received: 30 July 2023
/
Revised: 10 October 2023
/
Accepted: 17 October 2023
/
Published: 20 October 2023
(This article belongs to the Special Issue Understanding the Roles of Aerosols and Clouds in Environment, Meteorology and Climate with Advanced Lidar Remote Sensing Techniques)
Abstract
:In land battlefield environments, aerosol particles can cause laser beams to undergo attenuation, thus deteriorating the operational performance of military laser devices. The particle size distribution (PSD) and extinction coefficient are key optical properties for assessing the attenuation characteristics of laser beams caused by aerosol particles. In this study, we employed the laser diffraction method to measure the PSDs of graphite smoke screen, copper powder smoke screen, iron powder smoke screen, ground dust, and soil explosion dust. We evaluated the goodness of fit of six common unimodal PSD functions and a bimodal lognormal PSD function employed for fitting these aerosol particles using the root mean square error (RMSE) and adjusted R2, and selected the optimal PSD function to evaluate their extinction coefficients in the laser wavelength range of 0.249~12 μm. The results showed that smoke screens, ground dust, and soil explosion dust exhibited particle size ranges of 0.7~50 µm, 1~400 µm, and 1.7~800 μm, respectively. The lognormal distribution had the best goodness of fit for fitting the PSDs of these aerosol particles in the six unimodal PSD functions, followed by the gamma and Rosin–Rammler distributions. For the bimodal aerosol particles with a lower span, the bimodal lognormal PSD functions exhibited the best goodness of fit. The graphite smoke screen exhibited the highest extinction coefficient, followed by the copper and iron powder smoke screens. In contrast, the ground dust and soil explosion dust exhibited the lowest extinction coefficients, reaching their minimum values at a wavelength of approximately 8.2 μm. This study provides a basis for analyzing and improving the detection and recognition performance of lasers in land battlefield environments.
1. Introduction
Lasers are high-energy, narrow beams with an active mode of transmission and outstanding angular resolution, owing to which, they have become widespread in military applications such as communications, guidance systems, fuzes, active imaging devices, illuminators, target tracking, and remote sensing [1,2]. In particular, lasers are being increasingly applied in land battlefield environments, including in lidar, drones, anti-tank missiles, rockets, bombs, and projectiles [3]. The wavelength of common military lasers (Table 1) is largely in the range of 0.249~12 µm, covering ultraviolet (UV), visible light (VIS), as well as near-infrared (NIR), short-wave infrared (SWIR), mid-wave infrared (MWIR), and long-wave infrared (LWIR) of the infrared (IR) spectrum [3,4,5]. However, when laser devices detect military ground targets, such as battlefield vehicles and troops, laser beams may be absorbed and scattered by smoke screens [6,7,8], fog [9], dust [10], and other aerosol particles encountered in land battlefield environments, potentially deteriorating the detection and recognition performance of the laser. The particle size distribution (PSD) and extinction coefficient, which are two vital optical properties of aerosol particles, are closely related to the attenuation characteristics of laser beams in aerosol environments [11]. However, research on the PSDs and extinction coefficients of aerosol particles in land battlefield environments is in its early stages.
Aerosol particles in land battlefield environments primarily contain smoke screens generated by smoke agents and battlefield dust. A smoke screen acts as a smoke barrier composed of solid or liquid particles suspended in the atmosphere and formed by smoke-forming substances. Smoke screens commonly include graphite, copper powder, iron powder, etc. [12]. Dust refers to airborne particles with a specific size range formed by loose particles on the earth’s surface entering the ambient air under the action of natural or external forces. There are three primary sources of battlefield dust: dust rolled up by wind; ground dust kicked up by moving battlefield vehicles, such as tanks and infantry fighting vehicles; and soil explosion dust scattered by the explosion of shallowly buried or ground attack ammunition [13]. Researchers often use a lognormal distribution to describe the PSD of dust rolled up by wind [14]. For smoke screens and ground dust kicked up by moving battlefield vehicles, scholars have generally adopted generalized gamma, lognormal, Rosin–Rammler, or other PSD functions without assessing or comparing their goodness of fit [15,16]. Moreover, there are few studies on the PSD of soil explosion dust. Researchers have primarily focused on the application of extinction coefficients [17]. For instance, the extinction coefficient has been utilized to calculate the attenuation characteristics of laser beams caused by aerosol particles and monitor the aerosol particles in the air [18,19]. There is limited research on how the extinction coefficient varies with the laser wavelength, particularly in the case of smoke screens, ground dust, and soil explosion dust.
To study the PSDs and extinction coefficients of aerosol particles generated in land battlefield environments, we utilized the laser diffraction method to measure the PSDs of various aerosol particles including graphite smoke screen, copper powder smoke screen, iron powder smoke screen, ground dust, and soil explosion dust. We analyzed the applications and relationships of six common unimodal PSD functions, including the lognormal, generalized gamma, gamma, Rosin–Rammler, exponential, and Rayleigh distributions. Based on the experimental data, we determined the optimal fitting PSD function for each aerosol particle by evaluating the goodness of fit of the six common unimodal PSD functions and a bimodal lognormal PSD function. Using these optimal PSD functions, we calculated and analyzed the extinction coefficients of the aerosol particles in the wavelength range of 0.249~12 μm. This study holds significant promise for advancing research on the optical properties of aerosol particles in land battlefield environments and provides guidance for improving the application of lasers in aerosol environments.
2. Methods
2.1. Aerosol Particle Sampling
To mitigate potential interference from other types of aerosol particles, the graphite, copper, and iron powders used for making smoke agents were directly used as the samples of graphite, copper powder, and iron powder smoke screens to be tested. Ground dust was sampled using a ground dust sampling device (Figure 1a), which comprised a sampler, a vacuum pump, a battery, and a silica gel tube. The VCY6020 series brushless micro vacuum pump was used as the vacuum pump, and the inner diameter of the transparent silica gel tube was 8 mm. The filter membrane was placed in the sampler, and the transparent silica gel tube was connected to the air inlet of the vacuum pump. After the tank had passed by at a speed of 40 km/h, the sampler was immediately placed at a height of 1 m in the ground dust environment and positioned as far away as possible from the location of the tank’s exhaust emissions and diffusion. Then the vacuum pump was started to suck the air containing dust particles into the sampler (Figure 1b). Thereafter, the filter membrane intercepted and adsorbed the dust particles in the air, finally completing the sampling of ground dust.
Samples of soil explosion dust were collected by conducting tests with explosives detonated in three types of soil: silt, silt loam, and sandy loam. Figure 2 shows the schematic of the sampling of soil explosion dust. A volume of ϕ3 × 1 m of soil around the initiation site was backfilled and compacted with three different types of soil. Explosion tests were conducted at a shooting range in Hefei, China. The mass of the explosive (JH-2) was 290 g, and the burial depth was 20 cm. Four transparent plastic Petri dishes with a diameter of 150 mm were uniformly placed 4 m away from the initiation site to collect the soil explosion dust, and then these four Petri dishes of soil explosion dust were evenly mixed to measure the PSD. Under the action of detonation, within a short period, the smoke generated by the explosion dispersed and suspended in the air. Consequently, the predominant aerosol particles collected in the Petri dishes were the soil explosion dust.
The following nine aerosol particle samples (Figure 3) were collected: a sample of graphite smoke screen (GrSS); a sample of copper powder smoke screen (CuSS); a sample of iron powder smoke screen (FeSS); three samples of ground dust collected from Baotou City (GD-Bt, loam), Fangshan District (GD-Fs, silt), and Xuzhou City (GD-Xz, silt loam); and three samples of soil explosion dust (SED-A, silt; SED-B, silt loam; SED-C, sandy loam) from three different types of soil. The scanning electron microscope images (Figure 4) of the aerosol particle samples were captured using an SU5000 scanning electron microscope (Hitachi, Japan).
2.2. PSD Measurement
The PSD of aerosol particles refers to the percentage of each particle size class in terms of the number, mass, volume, length, or area within the total distribution. The percentage basis depends on the measurement method of particle size. PSD measurement methods include microscopy, sieving, sedimentation, electrozone sensing, imaging, spectrophotometry, and laser diffraction [20]. The laser diffraction method has the advantages of broad applicability, high accuracy, good repeatability, and high test speed. Therefore, the PSDs of the aerosol particles collected in this study were measured using a volume-based LA-95V2 Laser Scattering Particle Size Distribution Analyzer (Horiba, Japan) based on the Mie scattering theory with a measuring range of 0.01~3000 µm. Graphite, copper powder, and iron powder smoke screens were dispersed in distilled water, while the ground dust and soil explosion dust were dispersed in sodium hexametaphosphate [21]. Before measuring the particle size, the bubbles in the dispersion medium were excluded, and the background values were measured and deducted. The PSD was obtained after gradually adding the samples for ultrasonic dispersion. Each sample was measured thrice in parallel, and the results were averaged.
The testing report recorded the particle size distribution of the particles and parameter values such as , , , and span. The volume-weighted mean diameter is the prevalent mean value used in the laser diffraction method; it is sensitive to the presence of large particles in the distribution and can be expressed as follows [22]:
where is the occurrence frequency of particles in size class with a mean diameter of . Span is the dimensionless width of the PSD, which reflects the PSD uniformity, and can be calculated as follows [23]:
where , , and represent the particle diameters at which particles smaller than these sizes account for 10%, 50%, and 90% of the total volume, respectively. also means the median diameter of the cumulative volume distribution. The lower the span value, the narrower the PSD, and the better the uniformity of the aerosol particles.
2.3. Fitting and Evaluation of PSD Functions
The PSD of aerosol particles can be expressed using tabular, graphical, or functional methods. The functional method is the most convenient for modeling and simulation. Common PSD functions for aerosol particles are the normal, lognormal, generalized gamma, gamma, Rosin–Rammler, exponential, and Rayleigh distributions. Because aerosol particles rarely exhibit a normal distribution and are generally asymmetrically distributed, we often take the logarithm of particle size to obtain the lognormal distribution. The generalized gamma distribution was first proposed by Stacy in 1962. The Rosin–Rammler distribution, proposed by Rosin and Rammler in 1933, is also known as the two-parameter Weibull distribution [24]. Table 2 lists the probability density function of each PSD. Here, is the Gamma function, is the diameter of the aerosol particle, and are the shape parameters, and are the scale parameters, and are the mean and standard deviation of , respectively [25]. As shown in Table 2, the generalized gamma distribution can be converted into a gamma distribution (), Rosin–Rammler distribution (), exponential distribution (, ), or Rayleigh distribution (, , ) by taking some special values for , , and , and it also evolves into a lognormal distribution as approaches [24]. The gamma distribution can be transformed into an exponential distribution (), and the Rosin–Rammler distribution can be transformed into an exponential distribution () or a Rayleigh distribution (, ).
Generalized gamma and gamma distributions have been widely used to describe liquid spray drops, clouds, sea fog, and smog [26,27,28]. The Rosin–Rammler distribution is generally utilized to represent the PSD of various widely distributed dust particles produced by crushing, grinding, sieving, and other processes, as well as of fog droplets and smoke [29,30]. An exponential distribution is commonly utilized to represent the PSD of dust particles [31], and a Rayleigh distribution is typically introduced to represent the PSD of fly ash and wear particles [32]. A lognormal distribution is frequently applied to represent the PSD of aerosol particles with a large dispersion, such as marine aerosol particles, dust in natural environments, and fog produced by explosives and small bombs [33]. In this study, the six unimodal functions listed in Table 2 were used to fit the PSD of the nine aerosol particle samples. If the PSD of an aerosol particle exhibited a bimodal distribution, a bimodal lognormal distribution was simultaneously employed for fitting, and the bimodal lognormal probability density function is expressed as follows [34]:
where is the weight coefficient between the two peaks; , are determined by taking the natural logarithm of the diameters corresponding to the two peaks in the bimodal particle size distribution; and and are the standard deviation of the first and second lognormal distribution, respectively.
The OriginPro 2021 software was used to fit the nine aerosol particle samples according to the six PSD functions listed in Table 2 and Formula (3). The goodness of fit of a fitting function typically describes how well it fits a set of observations, or summarizes how close a curve (data points) is to another curve (data points). Statistically, the root mean square error (RMSE) and coefficient of determination R2 are frequently used to compare the goodness of fit of two or more functions. The RMSE and R2 values can be expressed as follows [35]:
where is the total number of samples; RSS and TSS represent the residual sum of squares and the total sum of squares, respectively; denotes the predicted value of the ith sample; and , are the measured values of the ith sample and the mean of the measured values, respectively. However, a higher value of positive R2 does not necessarily imply a better goodness of fit, as the degree of freedom also affects the R2 value, which will increase if more parameters are introduced, but this does not imply a better goodness of fit [36]. Thus, we used the adjusted R2 as a modified version of R2 accounting for the degrees of freedom to compare the goodness of fit of the different PSD functions in this study. The adjusted R2 can be expressed as follows [36]:
Here, and denote the degrees of freedom of RSS and TSS, respectively.
2.4. Extinction Coefficient Calculation
The extinction coefficient is a fundamental parameter in studying the optical absorption and scattering of laser beams by a medium and represents the total cross section per unit volume [37]. The higher the extinction coefficient, the more severe the attenuation of the laser beams by the aerosol particles. The extinction coefficient of multiple homogeneous aerosol particles at the volume concentration of 1 µm3∙µm−3 can be given by [38,39]:
Here, is the diameter of the aerosol particle; and are the minimum and maximum diameters of the aerosol particles, respectively; denotes the volume-based probability density function of the PSD defined such that , where represents the probability that an aerosol particle has a diameter between and ; and is the extinction efficiency factor of an aerosol particle depending on the diameter , wavelength , and complex refractive index , which can be expressed by [40]:
Here, , is defined as the size parameter; and are Mie scattering factors, and can be determined by [41,42]:
Here, and are Riccati–Bessel functions. In computational programming, an appropriate value for the iteration count in the Formulas (8)~(10) is crucial for balancing computational accuracy and memory efficiency, which can be excellently determined using the following empirical formula [43]:
3. Results and Discussion
3.1. PSDs of Aerosol Particles
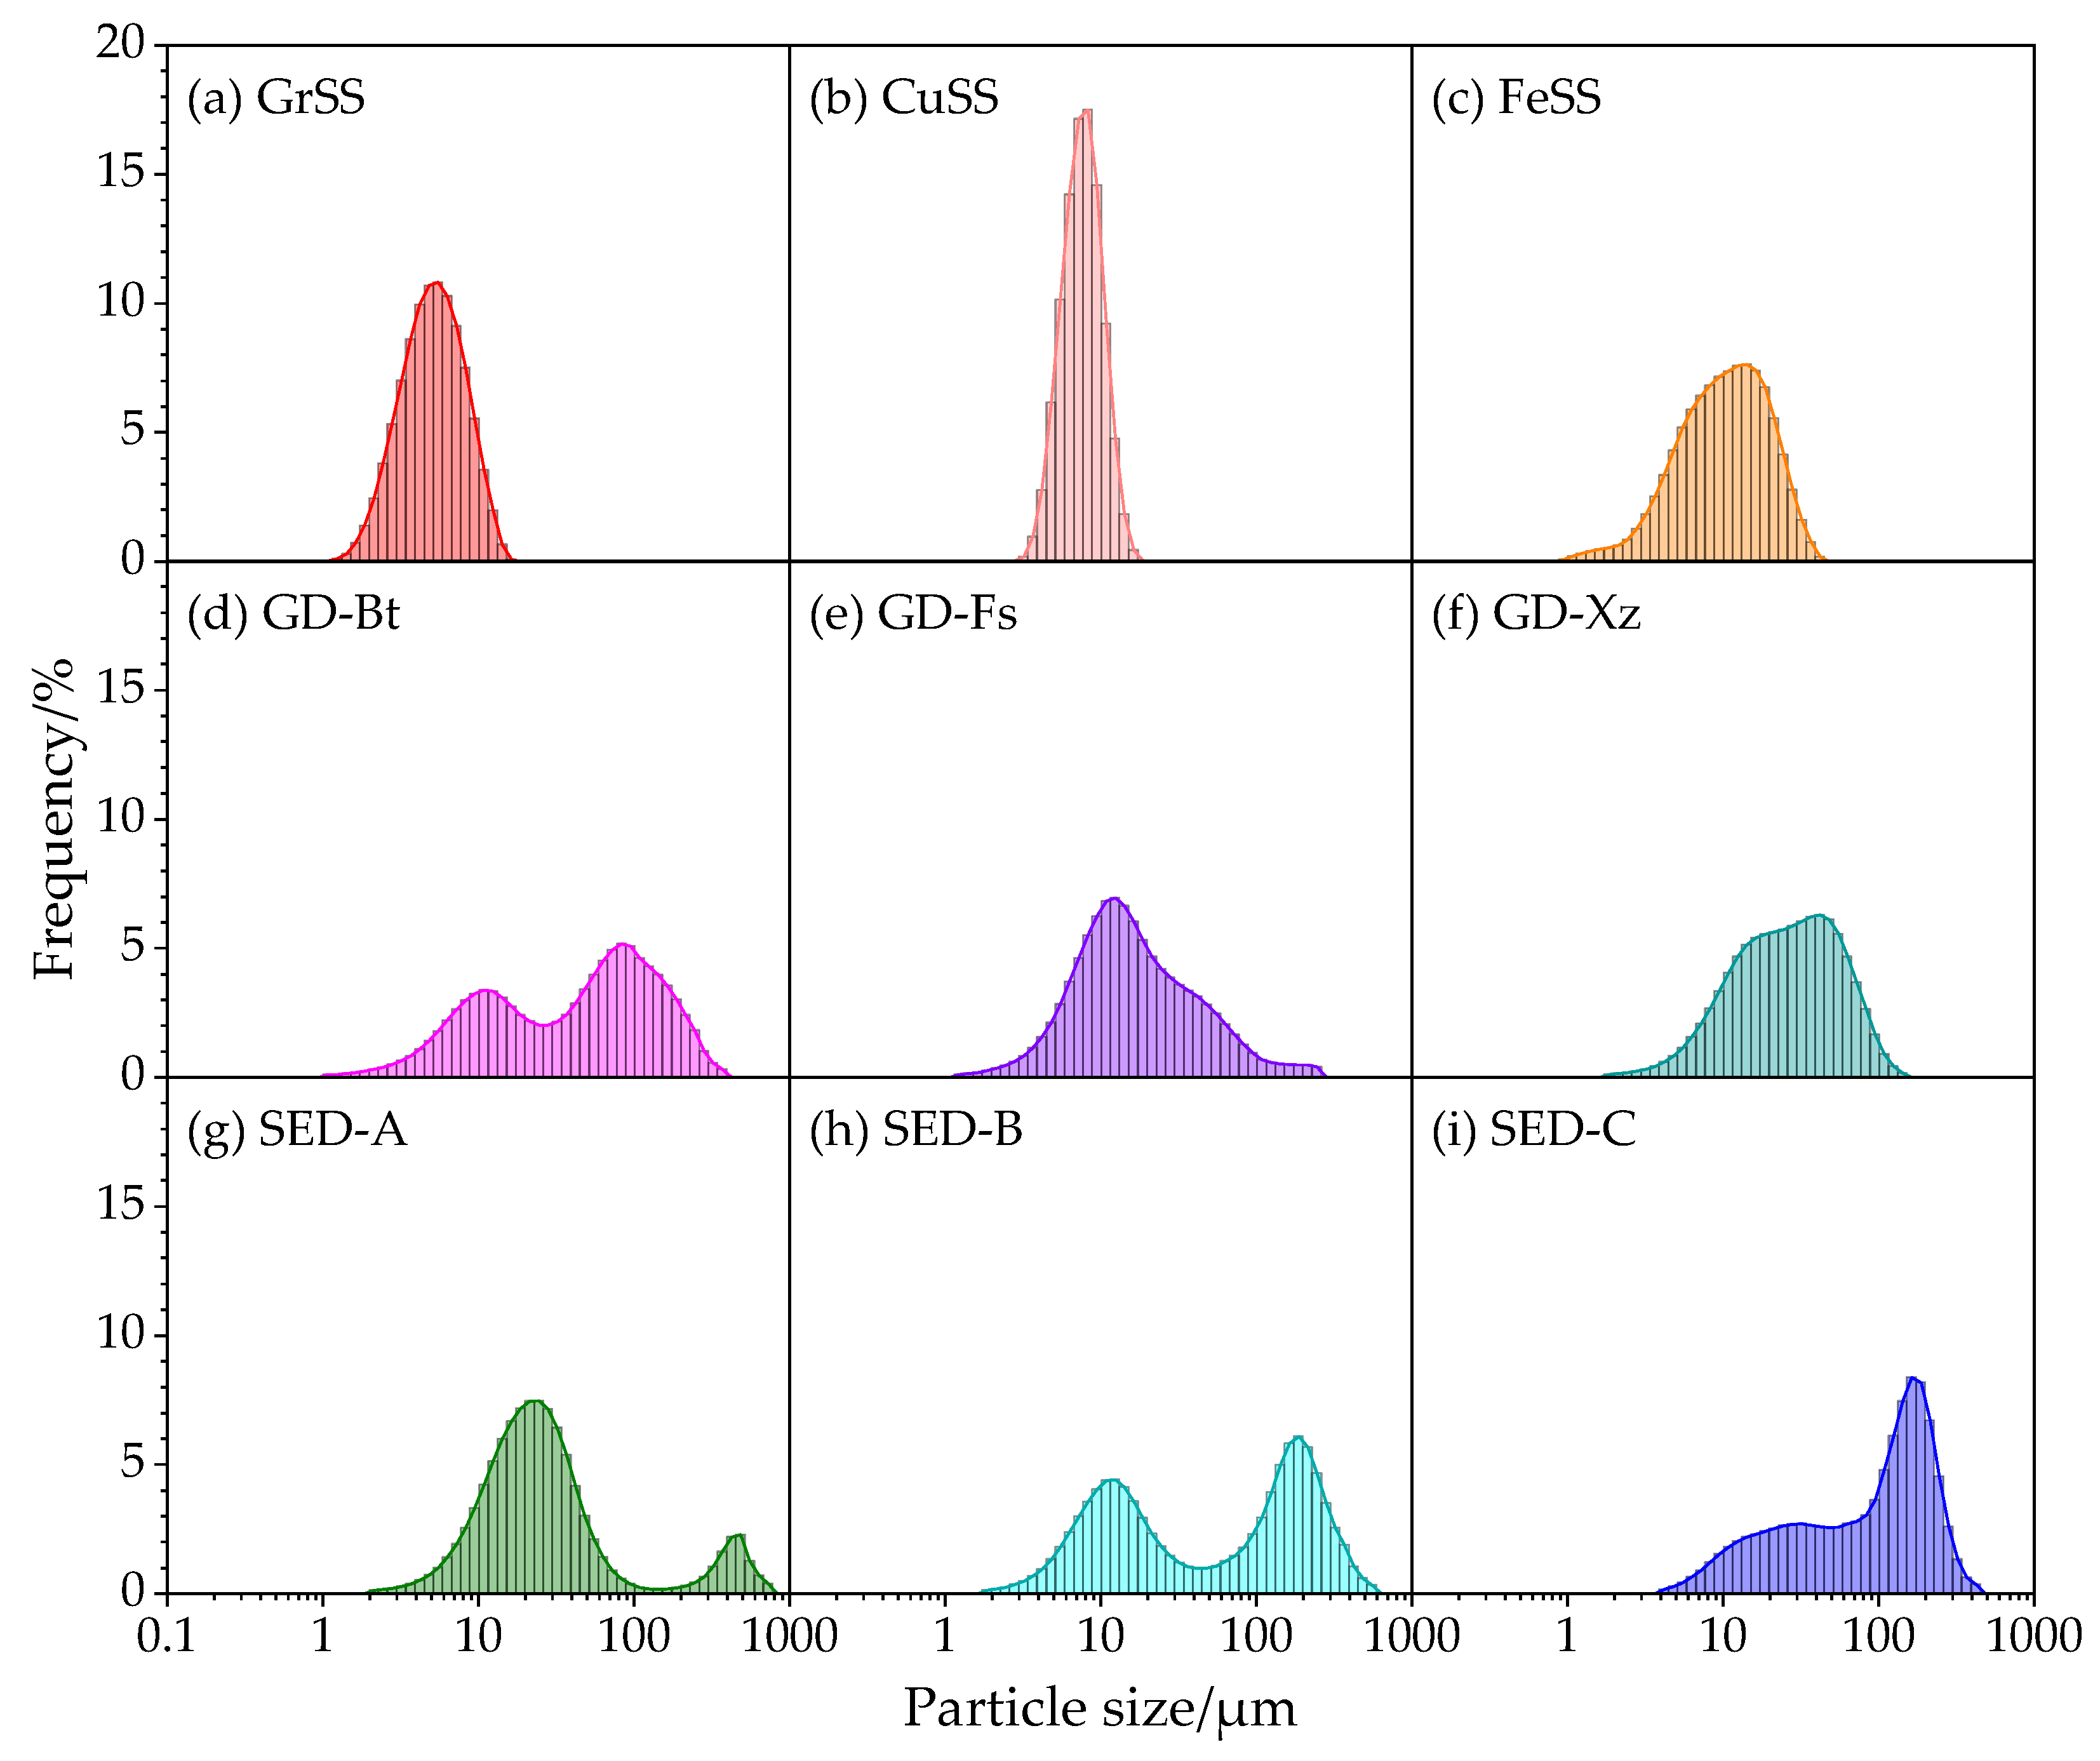
Table 3 presents the characteristic parameters of the reference aerosol particles. Figure 5 shows the volume-based PSD graphics of the nine types of aerosol particles. The smoke screens had a particle size ranging from 0.7 to 50 µm with a volume-weighted mean diameter lower than 10.63 µm, exhibiting a unimodal distribution with the peak particle size ranging from 5.87 to 15.17 µm and a span range of 0.77~1.76. The ground dust had a particle size range of 1~400 µm with a volume-weighted mean diameter range of 26.36~69.71 µm, presenting a unimodal or bimodal PSD with a peak particle size of less than 88.58 µm, and the span was in the range of 2.20~3.48. The soil explosion dust had a particle size range of 1.7~800 μm with a volume-weighted mean diameter range of 70.34~112.28 μm, exhibiting a bimodal PSD with the first peak at tens of microns and the second peak at hundreds of microns, the span being 2.03~11.35. Overall, the PSDs of the dust had wider widths and higher span values with poor uniformity. In particular, SED-A had the worst uniformity with a span value of 11.35, whereas the PSDs of the smoke screens had narrower widths with lower span values, and the uniformity of the particle size was better than that of dust.
3.2. Goodness of Fit of PSD Functions
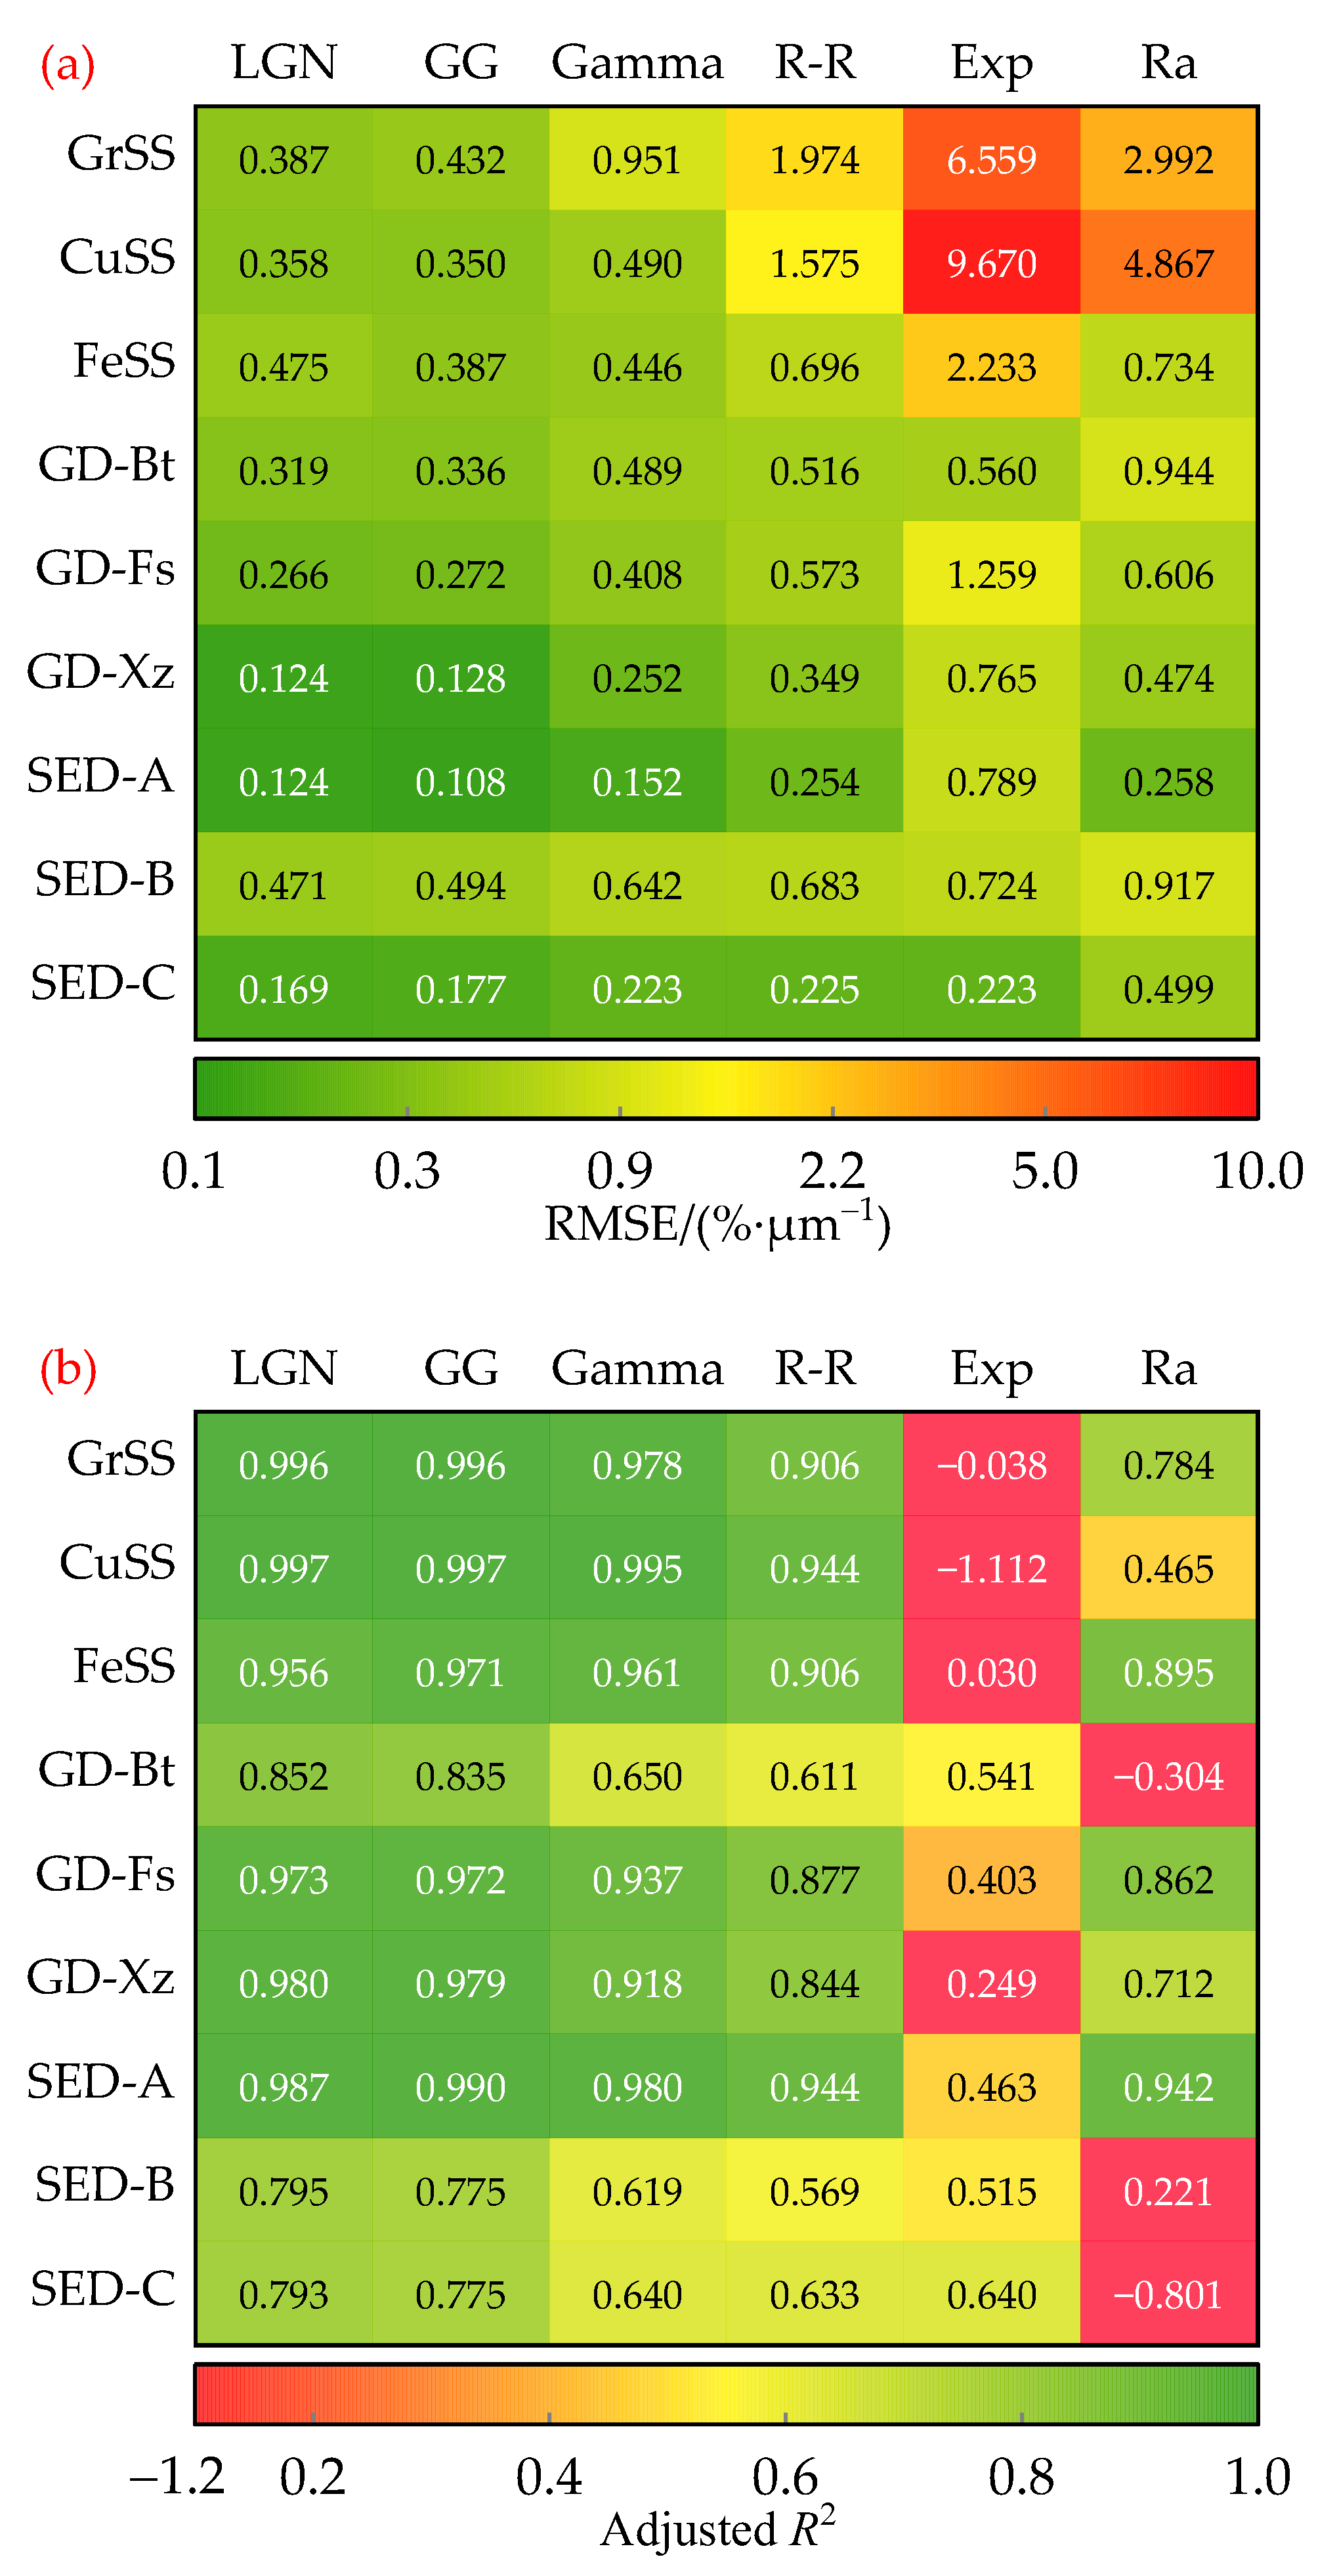
Figure 6 shows the RMSE and adjusted R2 values of the PSD functions listed in Table 2 used for fitting the PSDs of the graphite smoke screen, copper powder smoke screen, iron powder smoke screen, ground dust, and soil explosion dust. The RMSE values of the exponential and Rayleigh distributions were higher than those of the lognormal, generalized gamma, gamma, and Rosin–Rammler distributions (Figure 6a). The RMSE values of the Rosin–Rammler distribution were higher than those of the gamma distribution. The RMSE values of the lognormal distribution were very close to those of the generalized gamma distribution, and their RMSE values were essentially the minimum among the six PSD functions. Because the RMSE is the average distance between the values predicted by the fitting curve and the measured values, taking values in the range [0, +∞), the lower the RMSE, the better the goodness of fit of the fitting function [44]. Thus, a comparison of the RMSE values indicated that the unimodal PSD functions with the optimal goodness of fit for fitting these aerosol particles were the lognormal and generalized gamma distributions, followed by the gamma and Rosin–Rammler distributions; the worst were the exponential and Rayleigh distributions.
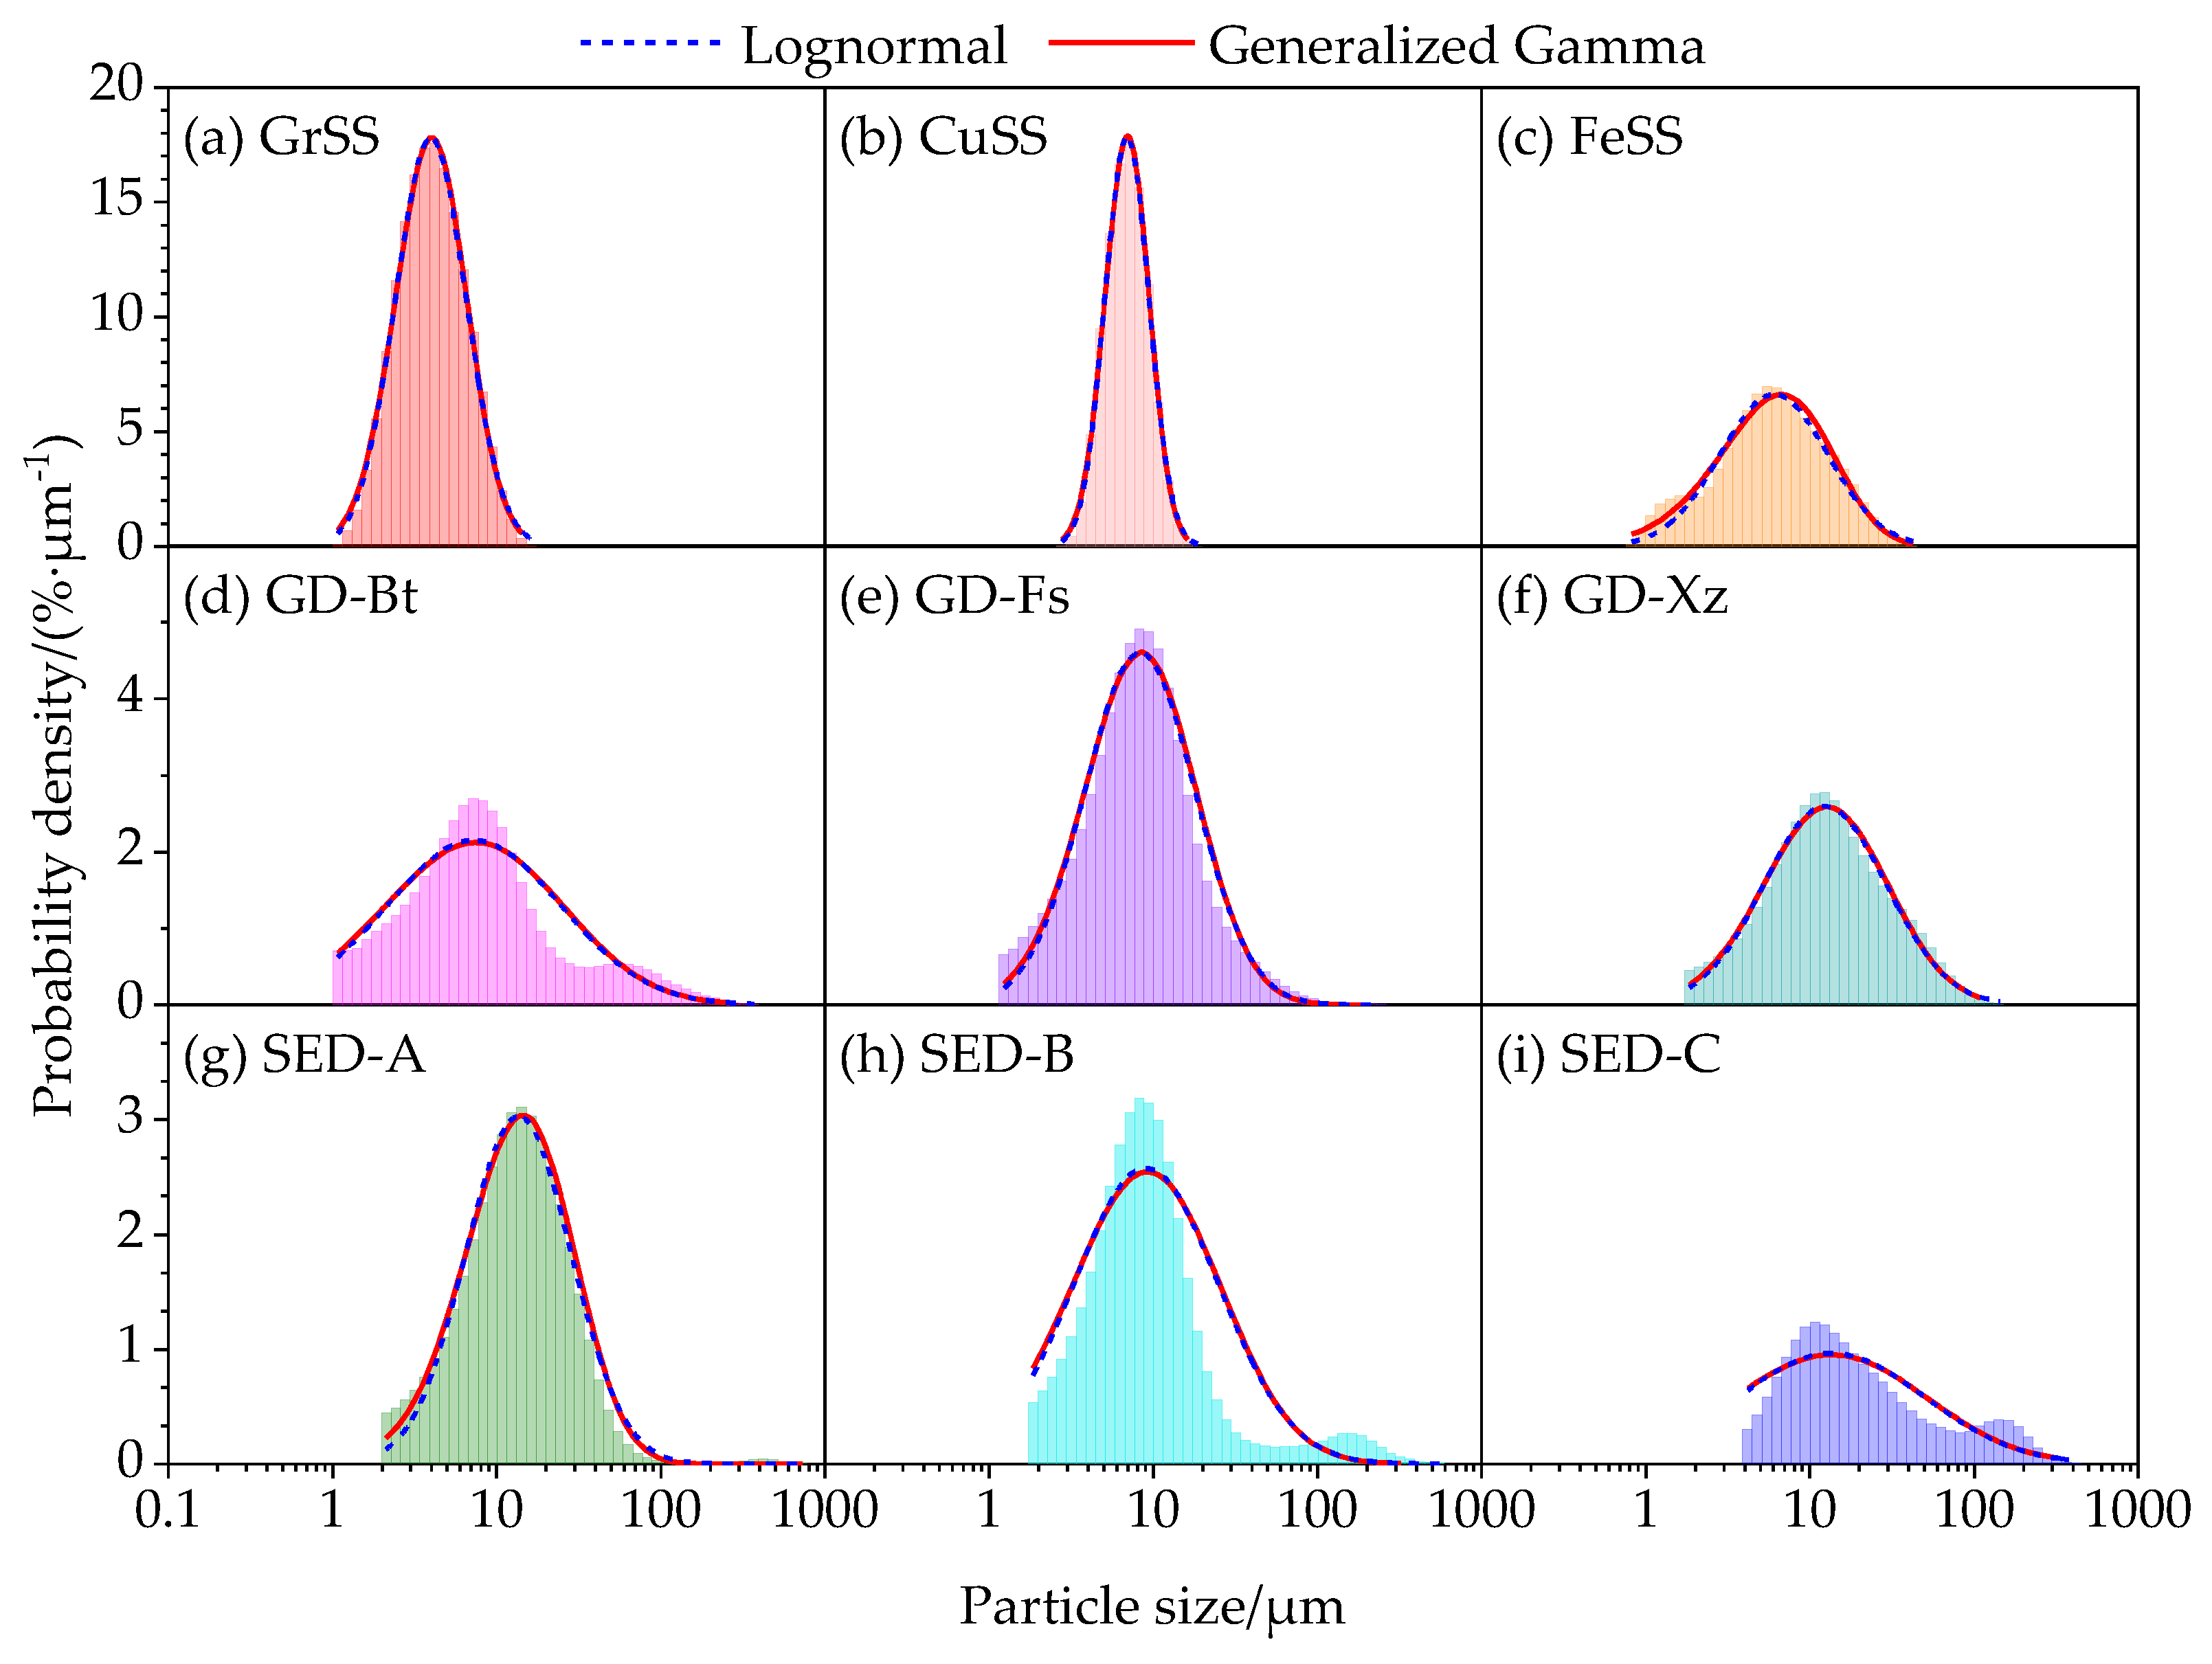
The adjusted R2 values of the exponential and Rayleigh distributions were partially negative (Figure 6b), indicating that their goodness of fit was worse than the average line or that their PSD functions omitted a constant [45]. Their adjusted R2 values were chiefly less than those of the lognormal, generalized gamma, gamma, and Rosin–Rammler distributions. The adjusted R2 values of the Rosin–Rammler distribution were lower than those of the gamma distribution. The adjusted R2 values of the lognormal distribution were very close to those of the generalized gamma distribution, and their adjusted R2 values ranged from 0.775 to 0.997, which mainly represented the maximum among the six PSD functions. The fitting curves of the lognormal and generalized gamma distributions essentially coincided (Figure 7). The positive adjusted R2 is a percentage of the response variable variation explained by the fitting function, and the closer R2 is to 1, the better the goodness of fit of the fitting function. The results obtained by comparing the adjusted R2 values were consistent with those obtained by comparing the RMSE values. Furthermore, the adjusted R2 values of the lognormal and gamma distributions, when used to fit the aerosol particles exhibiting a unimodal distribution and a bimodal distribution with a high span value of 11.35, ranged from 0.956 to 0.997, which was remarkably close to 1. However, for aerosol particles with a bimodal distribution and low span values of no more than 4.0, the adjusted R2 values of the lognormal and gamma distributions ranged from 0.775 to 0.852.
The aforementioned analyses showed that the exponential and Rayleigh distributions are generally unsuitable for fitting the PSDs of aerosol particles in land battlefield environments. Consequently, we further evaluated the parameters of the lognormal, generalized gamma, gamma, and Rosin–Rammler distributions to fit the PSDs of the reference aerosol particles. In statistics, the p-value is the probability of obtaining results at least as extreme as the observed results of a statistical hypothesis test, assuming that the null hypothesis is correct. If the p-value is less than the significance level of 0.0001, it indicates sufficient evidence to reject the null hypothesis. The p-values of the F-test for function fitting of the four probability density functions were all less than the significance level of 0.0001, indicating that the four PSD fitting functions were significantly better than linear curves. The p-values of the t-test for the parameter values of lognormal, gamma, and Rosin–Rammler probability density functions were less than the significance level of 0.0001, indicating sufficient evidence to reject the null hypothesis that the parameter was equal to zero (Table 4). However, some of the p-values of the t-test for the parameters of the generalized gamma distribution were greater than the significance level of 0.1, and most of the scale parameters were very close to 0. Moreover, the dependency values of each parameter were close to 1, indicating that the parameter of the generalized gamma distribution may be redundant. Additionally, because obtaining an optimal parameter initialization value for the generalized gamma distribution proved challenging, we initially employed the Downhill Simplex algorithm to approximate the parameter values for subsequent fitting calculations using the Levenberg–Marquardt algorithm when fitting the PSDs of reference aerosol particles using the OriginPro 2021 software. However, the Downhill Simplex algorithm is generally slower than the Levenberg–Marquardt algorithm, particularly when approaching a local minimum [46].
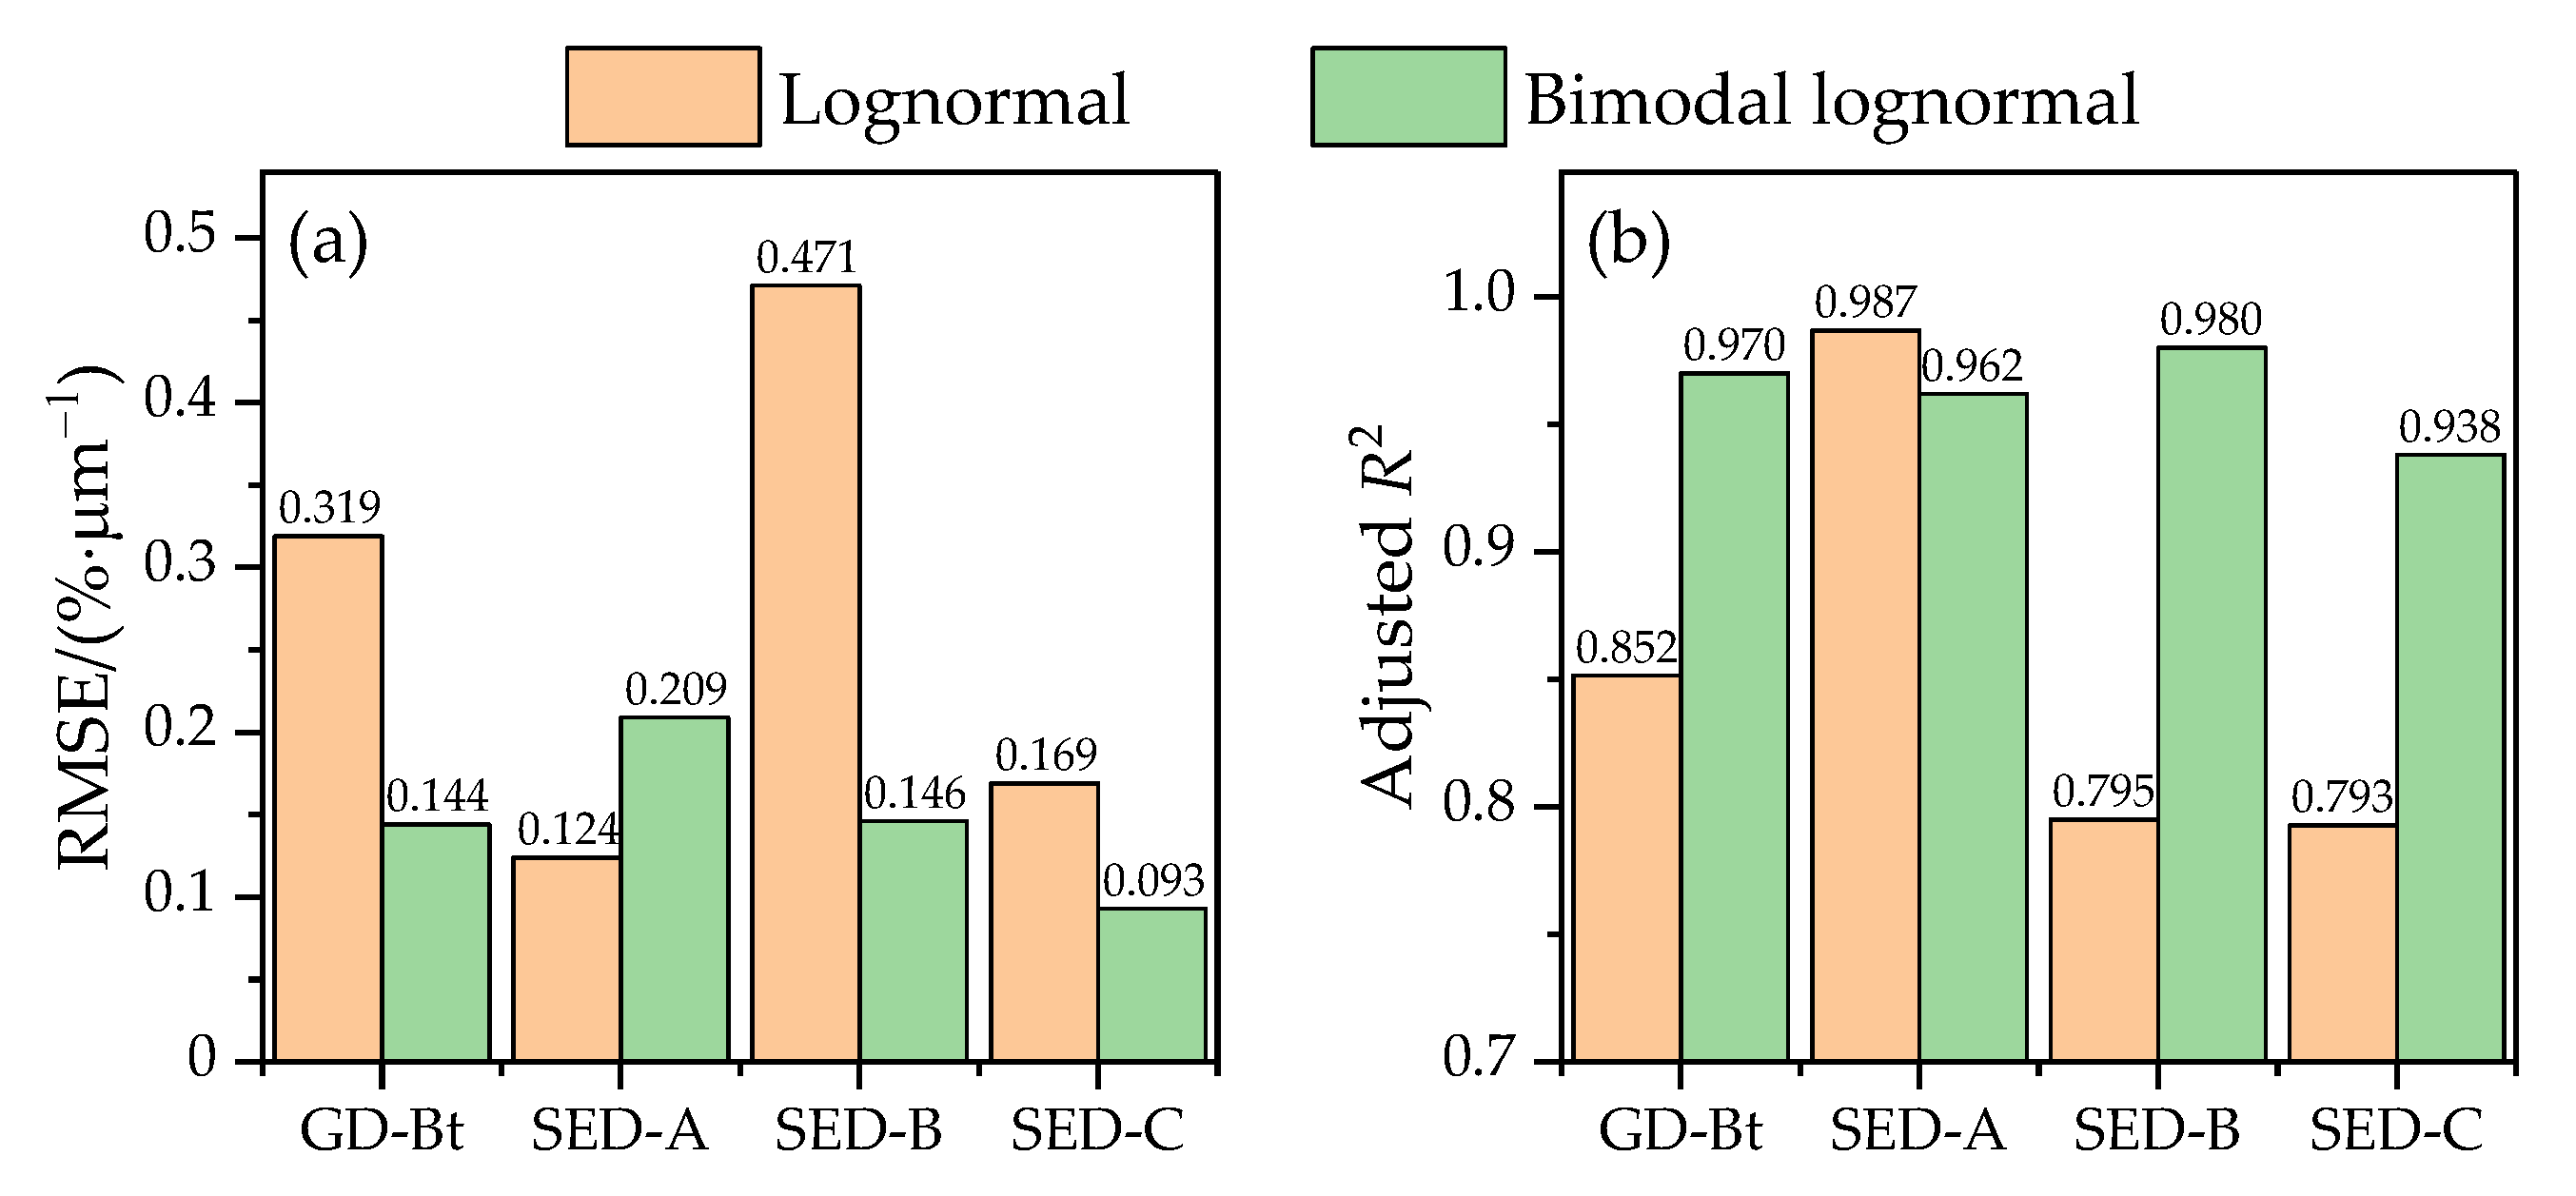
Table 5 shows the parameter values of bimodal lognormal probability density functions for fitting the aerosol particles with a bimodal distribution. The p-value of the parameter values and fitting bimodal lognormal probability density functions were all less than the significance level of 0.0001. The RMSE and adjusted R2 value ranges of bimodal lognormal probability density functions were 0.093~0.209%∙µm−1 (Figure 8a) and 0.938~0.980 (Figure 8b), respectively. Comparing the RMSE and adjusted R2 values between lognormal and bimodal lognormal PSD functions indicated that the bimodal lognormal PSD functions exhibited better goodness of fit than lognormal PSD functions for fitting aerosol particles with a bimodal PSD, excepting for SED-A with a higher span value of 11.354 (Figure 8).
In summary, compared to generalized gamma, exponential and Rayleigh PSD functions, lognormal, gamma, and Rosin–Rammler PSD functions were more suitable for fitting the PSDs of aerosol particles in land battlefield environments, with their goodness of fit decreasing in the following order. The goodness of fit of these three PSD functions for the aerosol particles with a unimodal PSD was better than that in the case of a bimodal PSD unless the aerosol particles with the bimodal PSD had a high span value, such as the SED-A with a span value of 11.354 (Figure 9). For the bimodal aerosol particles with a span value of no more than 4.0, the bimodal lognormal PSD functions exhibited better goodness of fit than the lognormal PSD functions (Figure 9d,h,i).
3.3. Extinction Coefficients of Aerosol Particles
Based on the results described in Section 3.2, we utilized fitting bimodal lognormal PSD functions of GD-Bt, SED-B, SED-C and fitting lognormal PSD functions of the remaining aerosol particles to calculate their extinction coefficients in the wavelength range of 0.249~12 µm. Figure 10 shows the complex refractive indices of the graphite smoke screen, copper powder smoke screen, iron powder smoke screen, ground dust, and soil explosion dust in the laser wavelength range of 0.249~12 µm [47,48]. In this wavelength range, the extinction coefficient ranges for graphite smoke screen, copper powder smoke screen, iron powder smoke screen, ground dust, and soil explosion dust at the volume concentration of 1 were 0.717~0.932, 0.439~0.508, 0.357~0.444, 0.081~0.339, and 0.061~0.227 µm−1, respectively (Figure 11). Notably, at the same laser wavelength and volume concentration, the graphite powder smoke screen exhibited the highest extinction coefficient, followed by the copper powder and iron powder smoke screens, whereas those of the ground dust and soil explosion dust were the lowest. In other words, the attenuation effects of the graphite, copper powder, and iron powder smoke screens on the laser beam transmission were more significant than those of ground dust and soil explosion dust. Additionally, the extinction coefficients of ground dust and soil explosion dust showed similar trends with respect to wavelength variation: (a) in the UV, VIS, and NIR bands (0.249~1.4 μm), their extinction coefficients roughly increased with wavelength; (b) in the SWIR, MWIR, and LWIR bands (1.4~12 μm), their extinction coefficients exhibited oscillatory variations with wavelength and showed trough values of approximately 3, 6.2, and 8.2 μm, respectively; and (c) their extinction coefficients reached a minimum at a wavelength of approximately 8.2 μm, followed by the region near a wavelength of 6.2 μm. Therefore, when prioritizing the anti-interference capabilities of laser detection and identification in ground dust or soil explosion dust environments, laser devices operating at wavelengths near 6.2 μm and 8.2 μm should be the optimal choices.
4. Conclusions
In this study, we measured and fitted the particle size distributions (PSDs) of graphite smoke screens, copper powder smoke screens, iron powder smoke screens, ground dust, and soil explosion dust in land battlefield environments. Additionally, we utilized the optimal PSD functions for fitting the reference aerosol particles to calculate and evaluate their extinction coefficients in the wavelength range of 0.249~12 μm. The following conclusions can be drawn from the results:
(1) The particle size ranges of smoke screens, ground dust, and soil explosion dust were 0.7~50 µm, 1~400 µm, and 1.7~800 μm, respectively. The spans of the ground dust and soil explosion dust were greater than those of the smoke screens, with a wide PSD width and poor uniformity. The smoke screens and soil explosion dust exhibited unimodal and bimodal PSDs, respectively, whereas the ground dust exhibited a unimodal or bimodal PSD.
(2) By comparing the root mean square error (RMSE) and adjusted R2, the lognormal, gamma, and Rosin–Rammler distributions were better suited for describing the PSDs of the aerosol particles, with their goodness of fit decreasing in this order. For the aerosol particles exhibiting bimodal PSDs with a lower span value (≤4.0), bimodal lognormal distributions had the best goodness of fit.
(3) For the same laser wavelength (within 0.249~12 µm) and volume concentration (1 µm3∙µm−3), the graphite smoke screen exhibited the highest extinction coefficient (0.717~0.932 µm−1), followed by the copper powder smoke screen (0.439~0.508 µm−1) and iron powder smoke screen (0.357~0.444 µm−1). In contrast, the extinction coefficients were lowest for the ground dust (0.081~0.339 µm−1) and soil explosion dust (0.061~0.227 µm−1). Specifically, these extinction coefficients reached their minimum values at a wavelength of 8.2 μm, followed by the region near a wavelength of 6.2 μm.
The measurement of aerosol particle size by the laser diffraction method relies on the practical and convenient assumptions that every particle is a sphere and that the measured samples are sufficiently discrete without any aggregation. The reported particle diameter is typically equivalent to a spherical diameter. This is essentially taking the physically measured scattered light value and determining the diameter of the sphere that could produce the data. At present, assuming a non-spherical aerosol particle to be spherical in the whole data treatment is widely used to determine the extinction coefficient [49,50]. Future measuring instruments and techniques are expected to further enhance the accuracy of particle size measurements. In summary, this study provides data to support further research on the attenuation characteristics of lasers caused by aerosol particles in land battlefield environments.
Author Contributions
Conceptualization, H.C.; methodology, L.G. and G.C.; validation, L.G., H.C. and G.C.; formal analysis, L.G.; investigation, L.G.; resources, J.D.; data curation, L.G.; writing—original draft preparation, L.G.; writing—review and editing, G.C. and J.D.; visualization, L.G.; supervision, H.C. and J.D.; project administration, J.D.; funding acquisition, H.C. All authors have read and agreed to the published version of the manuscript.
Funding
This research was funded by the China Scholarship Council (No. 202006030037), Key Foundation of Equipment Advance Research Program (Grant No. 61404160208), and Equipment Advance Research Rapid Support Program (Grant No. 80919010303).
Data Availability Statement
Data underlying the results presented in this paper are not publicly available at this time but may be obtained from the authors upon reasonable request.
Conflicts of Interest
The authors declare no conflict of interest.
References
- Zhang, Y.; Zhang, J.; Wu, S.; Gao, J.; Hao, Z.; Li, C. Study on laser scattering depolarization characteristics of typical aerosol particles. Opt. Commun. 2022, 518, 128183. [Google Scholar] [CrossRef]
- Ahmed, S.A.; Mohsin, M.; Ali, S.M.Z. Survey and technological analysis of laser and its defense applications. Def. Technol. 2021, 17, 583–592. [Google Scholar] [CrossRef]
- Kaushal, H.; Kaddoum, G. Applications of lasers for tactical military operations. IEEE Access 2017, 5, 20736–20753. [Google Scholar] [CrossRef]
- Verhoeven, G. Imaging the invisible using modified digital still cameras for straightforward and low-cost archaeological near-infrared photography. J. Archaeol. Sci. 2008, 35, 3087–3100. [Google Scholar] [CrossRef]
- Scafutto, R.; de Souza Filho, C. Detection of methane plumes using airborne midwave infrared (3–5 µm) hyperspectral data. Remote Sens. 2018, 10, 1237. [Google Scholar] [CrossRef]
- Gao, L.; Chen, H.; Wang, F.; Yang, S.; Lu, C.; Ma, C.; Qi, B.; Deng, J. Study on the graphite smoke echo characteristics of pulsed laser fuze. Proc. SPIE 2020, 11562, 253–261. [Google Scholar]
- Song, C.; Cui, Y.; Liu, B. FMCW laser fuze multiple scattering model and accurate fixed-distance algorithm in a smoke environment. Sensors 2020, 20, 2604. [Google Scholar] [CrossRef]
- Zeng, J.; Bian, A.; Chen, A.; Xu, W.; Cheng, W.; Yan, S.; Wang, S.; Deng, T. A miniaturized aerosol sizing sensor using light-scattering angular spectrum. Opt. Lasers Eng. 2023, 160, 107257. [Google Scholar] [CrossRef]
- Zhang, W.; Li, Y.; Huang, Z.; Ma, C. Fog backscattering interference suppression algorithm for FMCW laser fuze based on normalized frequency spectrum threshold. Optik 2017, 131, 188–193. [Google Scholar] [CrossRef]
- Gao, L.; Lien, F.-S.; Chen, H.; Chen, G.; Yang, S.; Deng, J. Backscattering echo intensity characteristics of laser in soil explosion dust. Sensors 2023, 23, 5638. [Google Scholar] [CrossRef] [PubMed]
- Okuda, T. Measurement of the specific surface area and particle size distribution of atmospheric aerosol reference materials. Atmos. Environ. 2013, 75, 1–5. [Google Scholar] [CrossRef]
- Zhao, X.; Hu, Y.; Gu, Y.; Chen, X.; Wang, X.; Wang, P.; Dong, X. A comparison of infrared extinction performances of bioaerosols and traditional smoke materials. Optik 2019, 181, 293–300. [Google Scholar] [CrossRef]
- Yang, S.; Chen, H.; Gao, L.; Qi, B.; Guo, P.; Deng, J. Study of spatial distribution characteristics for dust raised by vehicles in battlefield environments using CFD. IEEE Access 2021, 9, 48023–48038. [Google Scholar] [CrossRef]
- Guo, J.; Zhu, H. Backscattering attenuation characteristics of multi-sized dust particles to pulsed laser. Optik 2019, 180, 738–744. [Google Scholar] [CrossRef]
- Fedorova, A.A.; Montmessin, F.; Rodin, A.V.; Korablev, O.I.; Määttänen, A.; Maltagliati, L.; Bertaux, J.-L. Evidence for a bimodal size distribution for the suspended aerosol particles on Mars. Icarus 2014, 231, 239–260. [Google Scholar] [CrossRef]
- Yi, B.; Hsu, C.N.; Yang, P.; Tsay, S.C. Radiative transfer simulation of dust-like aerosols: Uncertainties from particle shape and refractive index. J. Aerosol Sci. 2011, 42, 631–644. [Google Scholar] [CrossRef]
- Liang, Y.; Che, H.; Wang, H.; Zhang, W.; Li, L.; Zheng, Y.; Gui, K.; Zhang, P.; Zhang, X. Aerosols direct radiative effects combined ground-based lidar and sun-photometer observations: Cases comparison between haze and dust events in Beijing. Remote Sens. 2022, 14, 266. [Google Scholar] [CrossRef]
- Xiao, D.; Wang, N.; Shen, X.; Landulfo, E.; Zhong, T.; Liu, D. Development of ZJU high-spectral-resolution lidar for aerosol and cloud: Extinction retrieval. Remote Sens. 2020, 12, 3047. [Google Scholar] [CrossRef]
- Li, L. Optimal inversion of conversion parameters from satellite AOD to ground aerosol extinction coefficient using automatic differentiation. Remote Sens. 2020, 12, 492. [Google Scholar] [CrossRef]
- Ghasemy, A.; Rahimi, E.; Malekzadeh, A. Introduction of a new method for determining the particle-size distribution of fine-grained soils. Measurement 2019, 132, 79–86. [Google Scholar] [CrossRef]
- Ryżak, M.; Bieganowski, A. Methodological aspects of determining soil particle-size distribution using the laser diffraction method. J. Plant Nutr. Soil Sci. 2011, 174, 624–633. [Google Scholar] [CrossRef]
- Lyu, F.; Thomas, M.; Hendriks, W.H.; van der Poel, A.F.B. Size reduction in feed technology and methods for determining, expressing and predicting particle size: A review. Anim. Feed Sci. Technol. 2020, 261, 114347. [Google Scholar] [CrossRef]
- Chen, S.; Wang, Z.; Yan, W. Identification and characteristic analysis of powder ejected from a lithium ion battery during thermal runaway at elevated temperatures. J. Hazard. Mater. 2020, 400, 123169. [Google Scholar] [CrossRef]
- Kiche, J.; Oscar, N.; George, O. On generalized gamma distribution and its application to survival data. Int. J. Stat. Probab. 2019, 8, 85–102. [Google Scholar]
- Lin, T.-H.; Chang, K.-E.; Chan, H.-P.; Hsiao, T.-C.; Lin, N.-H.; Chuang, M.-T.; Yeh, H.-Y. Potential approach for single-peak extinction fitting of aerosol profiles based on in situ measurements for the improvement of surface PM2.5 retrieval from satellite AOD product. Remote Sens. 2020, 12, 2174. [Google Scholar] [CrossRef]
- Lecompte, M.; Dumouchel, C. On the capability of the Generalized Gamma function to represent spray drop-size distribution. Part. Part. Syst. Charact. 2008, 25, 154–167. [Google Scholar] [CrossRef]
- Dumouchel, C.; Blaisot, J.B.; Ngo, V.D. On the adequacy between the laser diffraction diameter distribution and the 3-parameter Generalized-Gamma function. Chem. Eng. Sci. 2012, 79, 103–111. [Google Scholar] [CrossRef]
- Zhang, W.; Li, Y.; Huang, Z. Research on the characteristics of fog backscattering signals for frequency modulated continuous wave laser fuze. Optik 2016, 127, 9046–9055. [Google Scholar] [CrossRef]
- Brouwers, H.J.H. Packing fraction of particles with a Weibull size distribution. Phys. Rev. E 2016, 94, 12905. [Google Scholar] [CrossRef]
- Zhang, Z.; Lan, X.; Wen, G.; Long, Q.; Yang, X. An experimental study on the particle size and shape distribution of coal drill cuttings by dynamic image analysis. Geofluids 2021, 2021, 5588248. [Google Scholar] [CrossRef]
- Ahmed, A.S.; Ali, A.A.; Alhaider, M.A. Measurement of atmospheric particle size distribution during sand/duststorm in Riyadh, Saudi Arabia. Atmos. Environ. 1987, 21, 2723–2725. [Google Scholar] [CrossRef]
- Kumar, A.; Ghosh, S.K. Size distribution analysis of wear particles in the transmission system of mining equipment. Proc. Inst. Mech. Eng. Part J J. Eng. Tribol. 2018, 232, 921–926. [Google Scholar] [CrossRef]
- Bao, J.; Zha, B.; Xu, C.; Zhang, H. Study of a laser echo in an inhomogeneous dust environment with a continuous field Monte Carlo radiative transfer model. Opt. Express 2021, 29, 17976–17996. [Google Scholar] [CrossRef]
- He, Z.; Qi, H.; Yao, Y.; Ruan, L. An effective inversion algorithm for retrieving bimodal aerosol particle size distribution from spectral extinction data. J. Quant. Spectrosc. Radiat. Transf. 2014, 149, 117–127. [Google Scholar] [CrossRef]
- Li, T.; Mu, T.; Liu, G.; Yang, X.; Zhu, G.; Shang, C. A method of soil moisture content estimation at various soil organic matter conditions based on soil reflectance. Remote Sens. 2022, 14, 2411. [Google Scholar] [CrossRef]
- Mitra, S.; Ahmad, A.; Biswas, S.; Das, A.K. A machine learning approach to predict the structural and magnetic properties of Heusler alloy families. Comput. Mater. Sci. 2023, 216, 111836. [Google Scholar] [CrossRef]
- Turner, R.E.; Eitner, P.G.; Leonard, C.D.; Snyder, D.G. Battlefield Environment Obscuration Handbook: Volume I; ADA102822; Science Applications Inc.: Ann Arbor, MI, USA, 1980. [Google Scholar]
- Horvath, H. Spectral extinction coefficients of rural aerosol in southern Italy—A case study of cause and effect of variability of atmospheric aerosol. J. Aerosol Sci. 1996, 27, 437–453. [Google Scholar] [CrossRef]
- Jung, C.H.; Kim, Y.P. Theoretical study on the change of the particle extinction coefficient during the aerosol dynamic processes. J. Aerosol Sci. 2008, 39, 904–916. [Google Scholar] [CrossRef]
- Louedec, K.; Dagoret-Campagne, S.; Urban, M. Ramsauer approach to Mie scattering of light on spherical particles. Phys. Scr. 2009, 80, 35403. [Google Scholar] [CrossRef]
- Van de Hulst, H.C. Light Scattering by Small Particles; Dover Publications, Inc.: New York, NY, USA, 1981. [Google Scholar]
- Mätzler, C. MATLAB Functions for Mie Scattering and Absorption; Institut für Angewandte Physik: Bern, Switzerland, 2002. [Google Scholar]
- Wiscombe, W.J. Improved Mie scattering algorithms. Appl. Opt. 1980, 19, 1505–1509. [Google Scholar] [CrossRef]
- Pham, B.T.; Nguyen, M.D.; Bui, K.T.T.; Prakash, I.; Chapi, K.; Bui, D.T. A novel artificial intelligence approach based on Multi-layer Perceptron Neural Network and Biogeography-based Optimization for predicting coefficient of consolidation of soil. Catena 2019, 173, 302–311. [Google Scholar] [CrossRef]
- Chicco, D.; Warrens, M.J.; Jurman, G. The coefficient of determination R-squared is more informative than SMAPE, MAE, MAPE, MSE and RMSE in regression analysis evaluation. PeerJ Comput. Sci. 2021, 7, e623. [Google Scholar] [CrossRef] [PubMed]
- Press, W.H.; Teukolsky, S.A.; Vetterling, W.; Flannery, B.P. Numerical Recipes in C: The Art of Scientific Computing, 2nd ed.; Cambridge University Press: New York, NY, USA, 1992. [Google Scholar]
- Meng, Z.; Yang, P.; Kattawar, G.W.; Bi, L.; Liou, K.N.; Laszlo, I. Single-scattering properties of tri-axial ellipsoidal mineral dust aerosols: A database for application to radiative transfer calculations. J. Aerosol Sci. 2010, 41, 501–512. [Google Scholar] [CrossRef]
- Querry, M.R. Optical Constants; Defense Technical Information Center: Kansas City, MO, USA, 1985. [Google Scholar]
- Fu, Q.; Thorsen, T.J.; Su, J.; Ge, J.M.; Huang, J.P. Test of Mie-based single-scattering properties of non-spherical dust aerosols in radiative flux calculations. J. Quant. Spectrosc. Radiat. Transf. 2009, 110, 1640–1653. [Google Scholar] [CrossRef]
- Yan, J.; Wang, F.; Li, Y.; Liu, H.; Gao, Y.; Li, Z. Research on the Effect of Extinction Characteristics of Coal Dust on Visibility. ACS Omega 2022, 7, 28293–28303. [Google Scholar] [CrossRef] [PubMed]
Figure 1.
Ground dust sampling: (a) physical diagram of ground dust sampling device; (b) real scene of ground dust sampling.
Figure 1.
Ground dust sampling: (a) physical diagram of ground dust sampling device; (b) real scene of ground dust sampling.

Figure 2.
Schematic of soil explosion dust sampling.

Figure 3.
Physical images of aerosol particle samples. GrSS, CuSS, and FeSS, respectively, represent the graphite, copper powder, and iron powder smoke screen samples; GD-Bt, GD-Fs, and GD-Xz, respectively, represent the ground dust samples collected from Baotou City, Fangshan District, and Xuzhou City, with soil types of loam, silt, and silt loam; SED-A, SED-B, and SED-C, respectively, represent the soil explosion dust samples collected from explosives blasted in silt, silt loam, and sandy loam.

Figure 4.
Scanning electron microscope images of aerosol particle samples. GrSS, CuSS, and FeSS, respectively, represent the graphite, copper powder, and iron powder smoke screen samples; GD-Bt, GD-Fs, and GD-Xz, respectively, represent the ground dust samples collected from Baotou City, Fangshan District, and Xuzhou City, with soil types of loam, silt, and silt loam; SED-A, SED-B, and SED-C, respectively, represent the soil explosion dust samples collected from explosives blasted in silt, silt loam, and sandy loam.

Figure 5.
Volume-based PSD graphics of reference aerosol particles: (a) graphite smoke screen (GrSS); (b) copper powder smoke screen (CuSS); (c) iron powder smoke screen (FeSS); (d) ground dust collected from Baotou City (GD-Bt, loam); (e) ground dust collected from Fangshan District (GD-Fs, silt); (f) ground dust collected from Xuzhou City (GD-Xz, silt loam); (g) soil explosion dust collected from explosives blasted in silt (SED-A); (h) soil explosion dust collected from explosives blasted in silt loam (SED-B); and (i) soil explosion dust collected from explosives blasted in sandy loam (SED-C).

Figure 6.
Heatmap of the RMSE and adjusted R2: (a) RMSE; (b) adjusted R2. LGN, GG, gamma, R-R, Exp, and Ra refer to the lognormal, generalized gamma, gamma, Rosin–Rammler, exponential, and Rayleigh distributions, respectively. GrSS, CuSS, and FeSS, respectively, represent the graphite, copper powder, and iron powder smoke screen samples; GD-Bt, GD-Fs, and GD-Xz, respectively, represent the ground dust samples collected from Baotou City, Fangshan District, and Xuzhou City, with soil types of loam, silt, and silt loam; SED-A, SED-B, and SED-C, respectively, represent the soil explosion dust samples collected from explosives blasted in silt, silt loam, and sandy loam.

Figure 7.
Comparison between lognormal and generalized distributions for fitting reference aerosol particles: (a) graphite smoke screen (GrSS); (b) copper powder smoke screen (CuSS); (c) iron powder smoke screen (FeSS); (d) ground dust collected from Baotou City (GD-Bt, loam); (e) ground dust collected from Fangshan District (GD-Fs, silt); (f) ground dust collected from Xuzhou City (GD-Xz, silt loam); (g) soil explosion dust collected from explosives blasted in silt (SED-A); (h) soil explosion dust collected from explosives blasted in silt loam (SED-B); and (i) soil explosion dust collected from explosives blasted in sandy loam (SED-C).

Figure 8.
Comparisons of the RMSE and adjusted R2 values between lognormal and bimodal lognormal PSD functions for fitting aerosol particles with a bimodal distribution: (a) RMSE; (b) adjusted R2. GD-Bt represents the ground dust samples collected from Baotou City with soil types of loam; SED-A, SED-B, and SED-C, respectively, represent the soil explosion dust samples collected from explosives blasted in silt, silt loam, and sandy loam.

Figure 9.
Fitting curves of the lognormal, gamma, and Rosin–Rammler distributions for reference aerosol particles: (a) graphite smoke screen (GrSS); (b) copper powder smoke screen (CuSS); (c) iron powder smoke screen (FeSS); (d) ground dust collected from Baotou City (GD-Bt, loam); (e) ground dust collected from Fangshan District (GD-Fs, silt); (f) ground dust collected from Xuzhou City (GD-Xz, silt loam); (g) soil explosion dust collected from explosives blasted in silt (SED-A); (h) soil explosion dust collected from explosives blasted in silt loam (SED-B); and (i) soil explosion dust collected from explosives blasted in sandy loam (SED-C).

Figure 10.
Complex refractive indices of reference aerosol particles: (a) real part depicted with a solid line; (b) imaginary part depicted with a dashed line. UV, VIS, NIR, SWIR, MWIR, and LWIR, respectively, refer to ultraviolet, visible light, near-infrared, short-wave infrared, mid-wave infrared, and long-wave infrared. GrSS, CuSS, and FeSS represent the graphite, copper powder, and iron powder smoke screen samples, respectively.

Figure 11.
Extinction coefficients of reference aerosol particles at the volume concentration of 1 µm3∙µm−3 in the wavelength range of 0.249~12 µm. GrSS, CuSS, and FeSS, respectively, represent the graphite, copper powder, and iron powder smoke screen samples; GD-Bt, GD-Fs, and GD-Xz, respectively, represent the ground dust samples collected from Baotou City, Fangshan District, and Xuzhou City, with soil types of loam, silt, and silt loam; SED-A, SED-B, and SED-C, respectively, represent the soil explosion dust samples collected from explosives blasted in silt, silt loam, and sandy loam.


Table 1.
Wavelengths of common military lasers.
| Classification | Wavelength Range/µm | Typical Laser Wavelength/µm | |
|---|---|---|---|
| Ultraviolet (UV) | 0.249~0.38 | 0.249 | |
| Visible light (VIS) | 0.38~0.75 | 0.532, 0.694 | |
| Infrared (IR) | Near-infrared (NIR) | 0.75~1.4 | 0.905, 1.06 |
| Short-wave infrared (SWIR) | 1.4~3 | 1.55, 2 | |
| Mid-wave infrared (MWIR) | 3~6 | 4.6 | |
| Long-wave infrared (LWIR) | 6~12 | 10.6 | |
Table 2.
Probability density functions [24] of various PSDs commonly employed for aerosol particles.
Table 2.
Probability density functions [24] of various PSDs commonly employed for aerosol particles.
| Function Name | Probability Density Function | Scale Parameter | Shape Parameter | Shape or Location Parameter |
|---|---|---|---|---|
| Generalized Gamma | ||||
| Gamma | ||||
| Rosin–Rammler | ||||
| Exponential | ||||
| Rayleigh | ||||
| Lognormal |
Table 3.
PSD characteristic parameters of reference aerosol particles. GrSS, CuSS, and FeSS, respectively, represent the graphite, copper powder, and iron powder smoke screen samples; GD-Bt, GD-Fs, and GD-Xz, respectively, represent the ground dust samples collected from Baotou City, Fangshan District, and Xuzhou City, with soil types of loam, silt, and silt loam; SED-A, SED-B, and SED-C, respectively, represent the soil explosion dust samples collected from explosives blasted in silt, silt loam, and sandy loam. Dpeak refers to the diameter corresponding to the peak value of PSD; D4,3 refers to the volume-weighted mean diameter; D10, D50, and D90 represent the particle diameters at which particles smaller than these sizes account for the 10%, 50%, and 90% of the total volume, respectively.
| Sample | Characteristic | /µm | /µm | /µm | /µm | /µm | Span |
|---|---|---|---|---|---|---|---|
| GrSS | Unimodal | 5.87 | 5.56 | 2.70 | 5.09 | 9.16 | 1.27 |
| CuSS | Unimodal | 8.82 | 6.95 | 5.12 | 7.60 | 10.96 | 0.77 |
| FeSS | Unimodal | 15.17 | 10.63 | 4.07 | 10.42 | 22.42 | 1.76 |
| GD-Bt | Bimodal | 11.56, 88.58 | 69.71 | 6.74 | 49.84 | 168.81 | 3.25 |
| GD-Fs | Unimodal | 13.25 | 26.36 | 5.71 | 14.85 | 57.43 | 3.48 |
| GD-Xz | Unimodal | 44.94 | 32.82 | 8.69 | 26.26 | 66.54 | 2.20 |
| SED-A | Bimodal | 26.11, 517.20 | 70.34 | 9.10 | 23.14 | 271.85 | 11.35 |
| SED-B | Bimodal | 13.25, 200.00 | 106.57 | 7.20 | 63.60 | 261.35 | 4.00 |
| SED-C | Bimodal | 34.25, 174.62 | 112.28 | 14.10 | 104.43 | 226.48 | 2.03 |
Table 4.
Parameter values of PSD functions for fitting reference aerosol particles using the OriginPro 2021 software. The superscript of the parameter value represents its p-values for the t-test, and the p-value less than 0.0001 is omitted. GrSS, CuSS, and FeSS, respectively, represent the graphite, copper powder, and iron powder smoke screen samples; GD-Bt, GD-Fs, and GD-Xz, respectively, represent the ground dust samples collected from Baotou City, Fangshan District, and Xuzhou City, with soil types of loam, silt, and silt loam; SED-A, SED-B, and SED-C, respectively, represent the soil explosion dust samples collected from explosives blasted in silt, silt loam, and sandy loam.
| Aerosol Particle | Lognormal | Generalized Gamma | Gamma | Rosin–Rammler |
|---|---|---|---|---|
| GrSS | (1.63, 0.50) | (138.49, 0.17, 2.23 × 10⁻¹²) | (4.91, 1.10) | (2.57, 5.78) |
| CuSS | (2.03, 0.31) | (137.65, 0.28, 1.72 × 10⁻⁷) | (11.47, 0.68) | (3.91, 8.22) |
| FeSS | (2.36, 0.75) | (7.140.4, 0.550.1, 0.330.8) | (2.63, 4.47) | (1.88, 12.53) |
| GD-Bt | (3.46, 1.22) | [139.63, 0.07, (2.90 × 10⁻²⁹)0.01] | (1.36, 29.22) | (1.20, 43.45) |
| GD-Fs | (2.71, 0.77) | [136.580.1, 0.11, (1.99 × 10⁻¹⁸)0.8] | (2.54, 6.49) | (1.83, 17.60) |
| GD-Xz | (3.25, 0.86) | (139.66, 0.10, 1.40 × 10⁻²⁰) | (2.17, 13.53) | (1.66, 31.57) |
| SED-A | (3.15, 0.74) | [17.46, 0.35, (6.36 × 10⁻³)0.6] | (2.73, 9.35) | (1.92, 27.02) |
| SED-B | (3.24, 1.02) | [138.26, 0.09, (1.73 × 10⁻²⁴)0.6] | (1.61, 19.06) | (1.29, 35.26) |
| SED-C | (4.30, 1.30) | [141.03, 0.07, (1.68 × 10⁻³¹)0.7] | (1.10, 89.38) | (1.05, 102.6) |
Table 5.
Parameter values of bimodal lognormal probability density functions for fitting the aerosol particles with a bimodal distribution. GD-Bt represents the ground dust samples collected from Baotou City with soil types of loam; SED-A, SED-B, and SED-C, respectively, represent the soil explosion dust samples collected from explosives blasted in silt, silt loam, and sandy loam.
| Aerosol Particle | |||||
|---|---|---|---|---|---|
| GD-Bt | 0.25 | 2.45 | 0.62 | 4.48 | 1.76 |
| SED-A | 1.00 | 3.26 | 0.80 | 6.25 | 0.01 |
| SED-B | 0.54 | 2.58 | 0.68 | 5.30 | 0.52 |
| SED-C | 0.55 | 3.53 | 0.96 | 5.16 | 0.34 |
Disclaimer/Publisher’s Note: The statements, opinions and data contained in all publications are solely those of the individual author(s) and contributor(s) and not of MDPI and/or the editor(s). MDPI and/or the editor(s) disclaim responsibility for any injury to people or property resulting from any ideas, methods, instructions or products referred to in the content. |
© 2023 by the authors. Licensee MDPI, Basel, Switzerland. This article is an open access article distributed under the terms and conditions of the Creative Commons Attribution (CC BY) license (https://creativecommons.org/licenses/by/4.0/).
Share and Cite
MDPI and ACS Style
Gao, L.; Chen, H.; Chen, G.; Deng, J. Particle Size Distributions and Extinction Coefficients of Aerosol Particles in Land Battlefield Environments. Remote Sens. 2023, 15, 5038. https://doi.org/10.3390/rs15205038
AMA Style
Gao L, Chen H, Chen G, Deng J. Particle Size Distributions and Extinction Coefficients of Aerosol Particles in Land Battlefield Environments. Remote Sensing. 2023; 15(20):5038. https://doi.org/10.3390/rs15205038
Chicago/Turabian StyleGao, Lijuan, Huimin Chen, Guang Chen, and Jiahao Deng. 2023. "Particle Size Distributions and Extinction Coefficients of Aerosol Particles in Land Battlefield Environments" Remote Sensing 15, no. 20: 5038. https://doi.org/10.3390/rs15205038
Note that from the first issue of 2016, this journal uses article numbers instead of page numbers. See further details here.