
A Probabilistic Method-Based Smartphone GNSS Fault Detection and Exclusion System Utilizing PDR Step Length

1
College of Automation Engineering, Nanjing University of Aeronautics and Astronautics, Nanjing 211106, China
2
Laboratory of Advanced Laser Technology of Anhui Province, Hefei 230037, China
3
Department of Photogrammetry and Remote Sensing, Finnish Geospatial Research Institute, 02150 Espoo, Finland
4
School of Computer Science and Engineering, Nanjing University of Science and Technology, Nanjing 210094, China
*
Author to whom correspondence should be addressed.
Remote Sens. 2023, 15(20), 4993; https://doi.org/10.3390/rs15204993
Submission received: 25 August 2023
/
Revised: 3 October 2023
/
Accepted: 6 October 2023
/
Published: 17 October 2023
(This article belongs to the Section Engineering Remote Sensing)
Abstract
:A smartphone equipped with a Global Navigation Satellite System (GNSS) module can generate positional information for location-based services. However, GNSS signals are susceptible to fragility, multipath (MP), and Non-Line-Of-Sight (NLOS) interference, which can lead to a degradation in the accuracy of GNSS positioning on smartphones. Due to limitations in the smartphone’s antenna, GNSS signal strength is typically lower. Moreover, in urban areas, where smartphones rely on GNSS, MP and NLOS signals are the primary factors impeding accurate positioning. In this paper, with the goal of enhancing both the accuracy and robustness of smartphone GNSS positioning, we propose two methods. Firstly, an optimized particle filter method employing a Krill Herd Algorithm (KHA) is suggested for the integration of GNSS and Pedestrian Dead Reckoning (PDR). Secondly, a probabilistic approach is presented to identify faulty GNSS measurements using step distance information obtained from the PDR. Experimental tests were conducted using smartphones to evaluate the performance of the proposed method. The results demonstrate that both the KHA and fault detection methods effectively enhance the performance of integrated PDR and GNSS.
1. Introduction
The smartphone has brought about significant societal changes, incorporating various sensors such as the Global Navigation Satellite System (GNSS), Inertial Measurement Unit (IMU), and Magnetometer to provide location services for individuals [1,2]. Typically, GNSS serves as the primary source for Position, Navigation, and Timing (PNT) information in a smartphone. However, it’s important to note that GNSS signals may not always yield optimal PNT results.
In urban environments, GNSS signals can be obstructed by tall buildings, and the uneven distribution of satellites can lead to a decline in position estimation accuracy [3,4]. Additionally, in certain circumstances, GNSS signals may experience reflections, resulting in multipath and Non-Line-Of-Sight (NLOS) occurrences that further compromise pseudo-range and position accuracy. Given these limitations of GNSS, integrating other sensors with GNSS in smartphones is a common practice to provide a more reliable navigation solution for pedestrians [3,4].
The Inertial Measurement Unit (IMU), which senses body motions, is a ubiquitous component in smartphones and comprises accelerometers and gyroscopes [5,6]. Pedestrian dead reckoning (PDR), which leverages information about pedestrian walking gaits, is typically built upon IMU and magnetic sensor measurements. The accelerometer data is processed to detect steps and estimate step length. Utilizing the heading angle estimated from the gyroscope and magnetic readings, the pedestrian’s position is updated [6,7].
However, due to the presence of noise in the measurements, PDR can exhibit position errors that diverge over time. Extensive efforts have been made by scientists to enhance the accuracy of PDR, with research focusing on improving step detection, step length estimation, and heading estimation [8,9,10,11]. These endeavors have proven effective in mitigating PDR drift to a certain extent.
The integration of GNSS and PDR presents a more reliable solution for generating accurate position information. In normal conditions, GNSS can help calibrate PDR errors and compensate for its inaccuracies. Even in challenging GNSS signal environments, PDR remains functional and capable of providing position information. For instance, Rehman et al. employed an extended Kalman filter (EKF) to merge GNSS with the low-cost MEMS (Microelectromechanical systems) IMU-based PDR in smartphones, resulting in more precise pedestrian position estimation, especially in multipath environments [12]. Angrisano et al. also applied an EKF to integrate GPS/GLONASS with PDR, calibrating PDR drifts by fusing position and yaw information from GNSS [13]. Additionally, a Receiver Autonomous Integrity Monitoring (RAIM) method was implemented to mitigate outliers in pseudo-range, Doppler, and carrier phase measurements in urban areas, effectively reducing position errors [13].
Recognizing the limitations of GNSS in deep urban canyons, HSU et al. explored a 3D map-aided GNSS/PDR integration technique for pedestrian navigation, employing an adaptive Kalman filter (KF) [14]. The 3D map-aided approach was instrumental in mitigating GNSS multipath errors, significantly enhancing pedestrian navigation accuracy [14]. In addition to KF-based GNSS/PDR integration, Jiang et al. introduced a Factor Graph Optimization (FGO) method to fuse GNSS/PDR, leveraging the inherent relationships between historical measurements and states to enhance position estimation performance [15]. Their research demonstrated that FGO-GNSS/PDR outperformed KF-GNSS/PDR [15].
In GNSS/PDR integration, the choice of integration filter method, the quality of GNSS measurements, and the performance of PDR are pivotal factors influencing the ultimate position accuracy. While a significant portion of research efforts has been directed towards enhancing PDR performance [8,9,10,11], there has been limited focus on the integration filter and GNSS measurement fault detection [13,14,15]. While the Extended Kalman Filter (EKF) is widely utilized in most research, Jiang et al. have explored an alternative FGO-GNSS/PDR integration method [15]. Particle filters have shown promise in integrating Wi-Fi/PDR and Map/PDR for indoor positioning [16,17], suggesting their potential applicability in GNSS/PDR integration.
Regarding GNSS fault detection, various approaches have been proposed to identify and address faults and outliers in GNSS measurements. Hsu et al. employ clean GNSS measurements for consistency checks to detect faults and enhance GNSS position accuracy in urban canyons [18]. Yang et al. have introduced a practical method to increase the probability of excluding incorrect measurements in the GNSS Fault Detection and Exclusion (FDE) process, along with a theoretical analysis [19]. Beyond standalone GNSS methods, IMU measurements are also integrated in GNSS/IMU navigation systems. Sun et al. propose a fault detection method that processes raw IMU measurements and GNSS pseudo-range measurements to accurately detect and exclude multiple faults from different satellites [20]. In their pursuit to enhance the reliability of the GNSS/IMU integration system in urban canyons, Yang and Li et al. have designed an adaptive Kalman filter to mitigate the adverse effects of abnormal GNSS measurements [21]. Additionally, Zhang et al. have introduced a novel sliding-window fault detection method, incorporating calculated weight factors to form a gain matrix that adaptively reduces the negative impact of faulty measurements on the system [22].
In our prior work, we investigated PDR/GNSS integration based on Factor Graph Optimization (FGO) [14,23]. We integrated PDR position and step length with GNSS position to enhance position accuracy. However, we observed that the occurrence of faults and measurement outliers can significantly affect position accuracy. Therefore, a fault detection module is indispensable to ensure accuracy. This paper emphasizes the importance of fault detection and outlier mitigation in PDR/GNSS integration. Furthermore, we propose the exploration of PDR step length as a reliable measurement for aiding GNSS fault detection and enhancing reliability, an aspect that has not been extensively explored in GNSS/PDR fault detection.
To enhance GNSS/PDR integration performance, we introduce a novel approach encompassing an intelligent particle filter and a fault detection method, aiming to bolster both position accuracy and robustness. The contributions of this paper can be outlined as follows:
- (1)
- The introduction of an intelligent evolutionary algorithm-optimized particle filter for integrating GNSS and PDR. By incorporating a Krill Herd (KH) algorithm with the particle filter, we address the issue of particle degeneracy, effectively enhancing position accuracy.
- (2)
- We present a probabilistic GNSS fault detection method. This method utilizes the estimated step length derived from accelerometer measurements to construct a probabilistic model for detecting GNSS faults.
The remainder of the paper is organized as follows: Section 2 presents the PDR mechanism and the KF-GNSS/PDR integration method; Section 3 explains the particle filter (PF), the KH algorithm, and the KHA-PF-GNSS/PDR; Section 4 illustrates the probabilistic GNSS fault detection method, including the models and equations; Section 5 presents the experimental details, results, and analysis; and finally, the discussion, conclusion, and reference sections are presented.
2. PDR and KF-PDR/GNSS Integration
2.1. PDR Mechanism
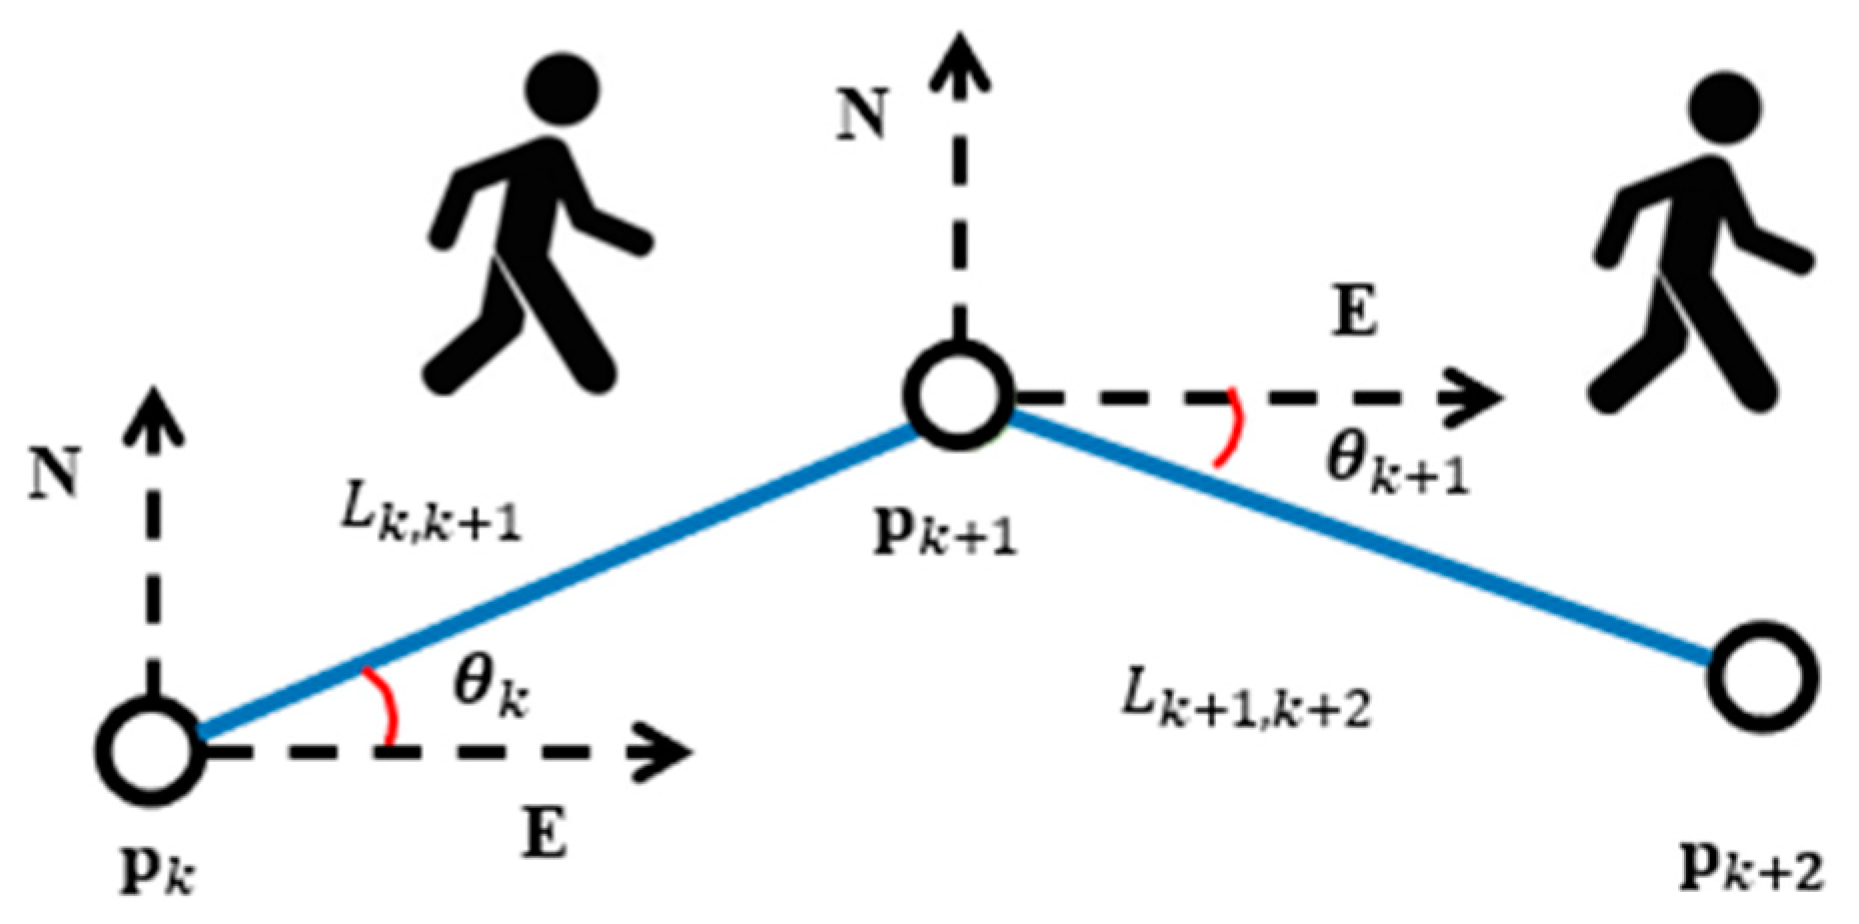
Smartphone pedestrian dead reckoning (PDR) is a relative position method which generates the location information through estimating the step length and heading angle. Normally, accelerometers, gyroscope and magnetic sensors measurements are processed to obtain the position information. Figure 1 presents a schematic illustration of smartphone PDR. Denoting the pedestrian location at epoch is , the heading angle and the step length from to epoch are and ; then, the PDR location updating procedure is expressed as
According to the position updating model presented in Equation (1), step length and heading angle are the two key factors determining the PDR position accuracy. Step length is usually estimated through processing the three-axis accelerometer measurements. The step length estimation model is expressed as follows [23,24]:
where denotes a constant which ranges from 0 to 1, and , and denote the three-axis accelerometers outputs.
2.2. PDR/GNSS Integration
In view of the fact that PDR position errors diverge over time, PDR is usually integrated with GNSS for more reliable navigation solutions. While GNSS works well, PDR position errors can be calibrated after integration. In challenging GNSS signal environments, PDR can still generate navigation solutions. Kalman Filter (KF)-based GNSS/PDR integration is presented with following equations.
Normally, state and measurement models are the basis of the integrated model. In the KF-GNSS/PDR integration model, position correction is utilized as the state vector, and the difference between the GNSS position and PDR position is employed to compose the measurement vector.
The state transformation model is expressed as follows [24]:
KF-GNSS/PDR integration measurement model is expressed as
where denotes the GNSS position measurement at the epoch; denotes the PDR position measurement at the epoch; denotes the state transformation matrix; denotes the observation matrix; denotes the state process noise; and denotes the measurement noise.
The “Prediction” procedure in KF is described as with the state and measurement models.
where denotes the predicted state vector, and denotes the predicted covariance matrix.
where denotes the Kalman gain matrix, and denotes an identity matrix with size. KF functions recursively and estimates the state to correct the PDR position. The corrected PDR position is employed as the output navigation solutions.
3. PDR and KF-PDR/GNSS Integration
3.1. Particle Filter
The fundamental concept behind the particle filter is to leverage a collection of randomly sampled points in the state space to approximate the posterior probability density function. The state estimate is then derived by computing the mean values of these samples. Assuming a nonlinear system, it is represented as follows [25]:
where denotes the state, denotes the state function, denotes the state noise, denotes the measurement, denotes the observation function, and denotes the measurement noise.
Supposing the initial probability density values of the state , then the prediction can be expressed as
Then, the state updating is described as
where
The weight function can re-written as
The weights can be expressed as
Sampling points from , the probability density function is as follows
where denotes the Dirac delta function, and the weighting updating is described as
Finally, normalizing the weights, the estimated state is calculated as
3.2. Krill Herd (KH) Algorithm
The Krill Herd (KH) algorithm is a bio-inspired intelligent algorithm proposed by Gandomi [26,27] which simulates the ecological behavior of krill. In nature, the krill individuals’ position change mainly depends on the following three aspects:
- (1)
- Induced movement: the movement of krill individuals is affected by the other individuals in the group;
- (2)
- Foraging behavior of krill individuals;
- (3)
- Random diffusion motion of krill individuals.
Therefore, the movement of a krill individual can be expressed as
where denotes the position change of the krill individual, denotes the movement induced by other individuals, denotes the movement induced by the foraging behavior, and denotes the movement caused by the random diffusion.
(1) Induced Movement
Krill individual induced movement can be modeled as follows [26]:
where denotes the maximum induction speed, denotes the individual movement direction, denotes the sum vector of the movement vector of neighbors around the individual, represents the direction vector provided by the optimal individual, denotes the position change from the last epoch, and denotes the weights which range between 0 and 1.
(2) Foraging Behavior
The foraging behavior of krill individuals mainly has two parameters: position of the current food source and position of the previous food source. The movement induced by foraging behavior is expressed as [26]:
where represents the individual foraging speed, represents the attractiveness value, represents the inertia weight, and represents the foraging motion vector of the krill individual in last epoch.
(3) Random Diffusion Motion
The physical random diffusion process of krill individuals can be expressed as follows [26]:
where represents the maximum diffusion speed, denotes a random vector direction and , represents the current number of iterations, and represents the maximum number of iterations.
3.3. KHA-PF PDR/GNSS
In the KHA-PF PDR/GNSS, the PF and KHA are integrated together to fuse the GNSS and PDR information. In the PF, the particle degradation problem occurs, and KHA is utilized here to optimize the particle distribution. Particles from PF move according to the krill herd movement described in Equations (22)–(26). Then, the PF weights are updated and normalized to obtain optimal estimates. In the conventional PF, the weights of particles are concentrated on a few particles, and even after a few steps of recursion, only one particle may have a non-zero weight. After the optimization, the particle degradation is prevented or the negative influence can be alleviated.
In the KHA-PF PDR/GNSS, the state vector at the k epoch is the pedestrian position . The state is updated based on the PDR according to Equation (1) where heading angle and step length are utilized to update the state. After updating the state, the weights are calculated with the predicted states and the measurements from GNSS.
where denotes the predicted state position, and denotes the covariance matrix of the measurements noise.
After calculating the weights, the KHA is employed in the particles resampling step. These particles move according to the KHA method to avoid particle degradation. The optimized estimation of the state is expressed as:
where denotes the amount of the particles, and denotes the estimated state as the ultimate output of the KHA-PF-PDR/GNSS.
4. Fault Detection
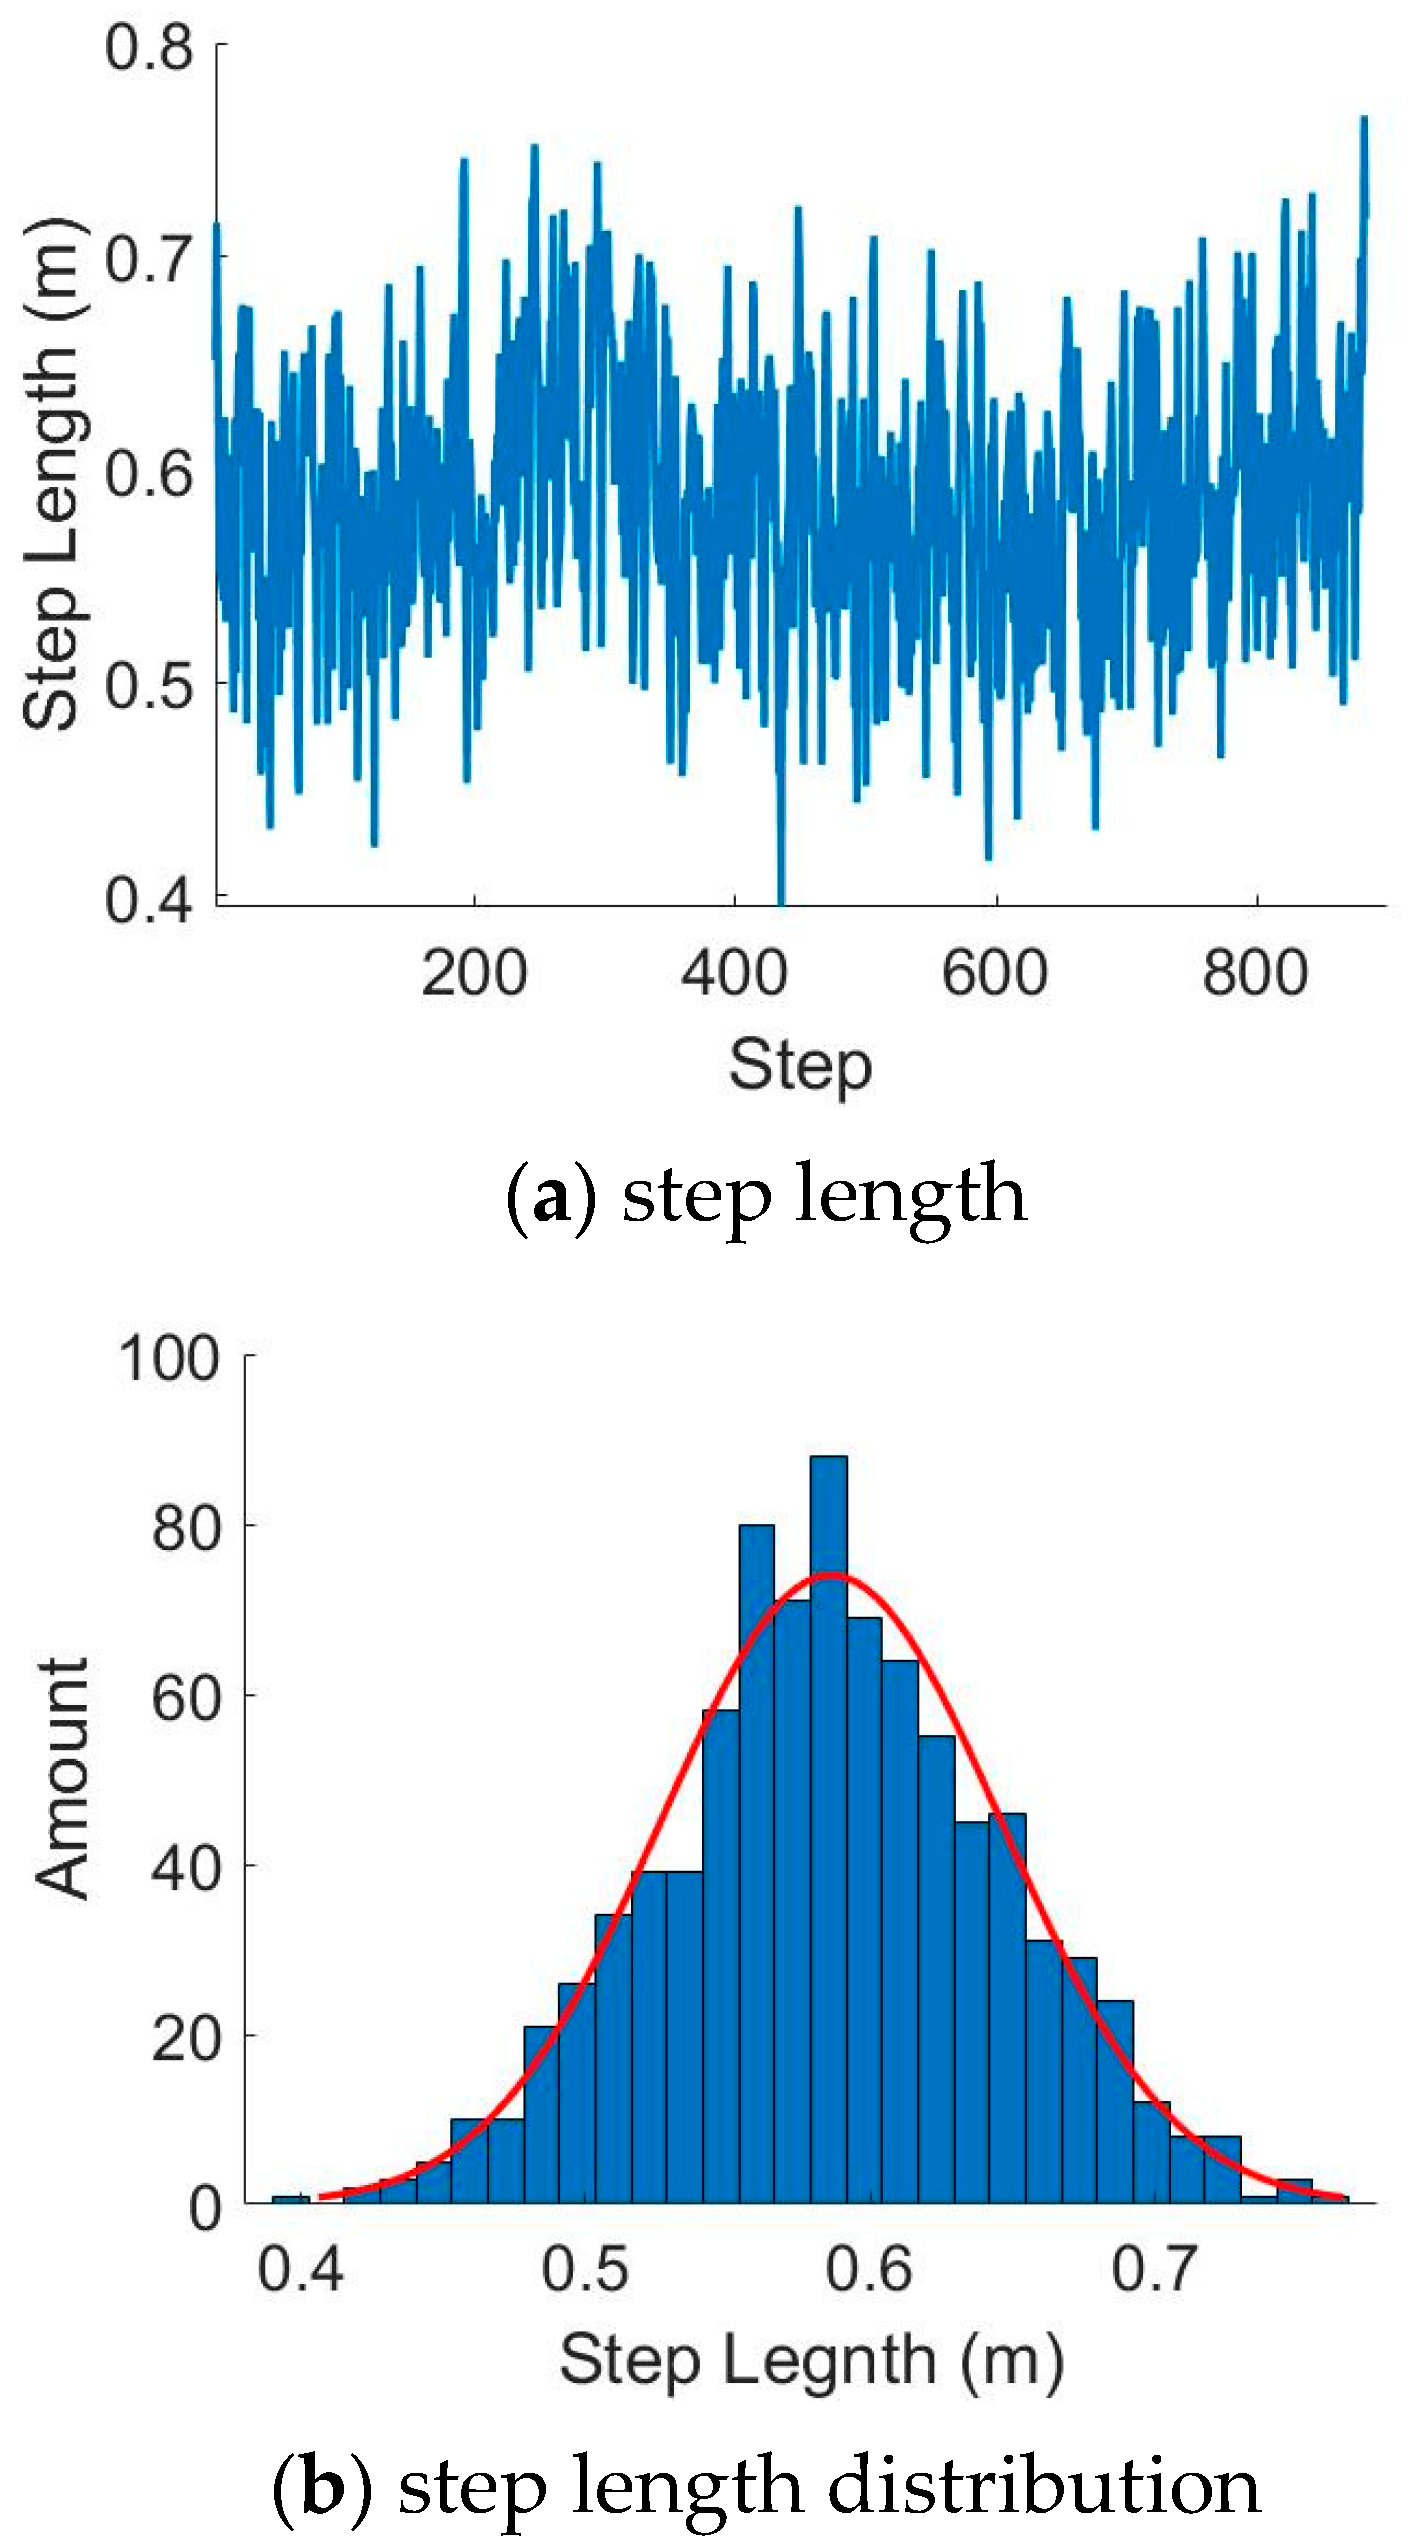
GNSS measurement quality determines the GNSS/PDR integration performance, and GNSS fault detection is critical for ensuring the reliability of the system. As mentioned above, in the smartphone-based PDR, step length is estimated by processing the accelerometer’s measurements. Figure 2 shows an example of the estimated step length and its distributions fitted by a Gaussian model.
Here, we model it as a Gaussian distribution, which is described as
where denotes the PDR step length, denotes the mean value, represents the variance, and denotes the Gaussian distribution function.
The distance between the epoch and epoch calculated with the PDR step distance can be expressed as:
where denotes the PDR heading angle. Distance calculated with the GNSS position can be expressed as
where and denote the GNSS positions corresponding to the PDR epoch and epoch, respectively.
To simplify the model, Equation (28) can be simplified as in the following equation with the assumption that the pedestrian walks straight.
Therefore, is also subject to a Gaussian distribution, which is expressed as
Supposing that is subject to a Gaussian distribution, its model is expressed as
The difference between and can be modeled as
Assuming
Then, Equation (33) can be expressed as
Normally, the step distance difference between the GNSS and PDR is nearly zero under the condition that the pedestrian walks straight. In the smartphone GNSS position measurement fault detection, a hypothesis test is carried out with a binary decision form. Specifically, : normal; : abnormal. Two different mistakes are possible:
- (1)
- False alarm: the detector decides for , but actually is true.
- (2)
- Miss, the detector decides for , but is true.
Under the normal condition, the distribution is expressed as
Under the abnormal condition, the distribution is expressed as
We set a threshold for , and while , the is true. Under this condition, the false alarm probability is expressed as
where denotes the Gaussian probability function.
With Equation (37) above, the threshold can be expressed as
where denotes the inverse function of the Gaussian probability .
Under the condition that and the is true, the detection probability can be expressed as
Substituting the defined threshold in Equation (39) with Equation (38), the relationship between the detection probability and false alarm probability is expressed as
5. Results
To evaluate the performance of KHA-PF and the probabilistic faulty detection method, experiments were conducted using a smartphone under various conditions. The Huawei Mate Pro 40 was utilized to gather datasets in two distinct environments. Further details regarding the equipment and software for dataset collection can be found in our previously published paper [15].
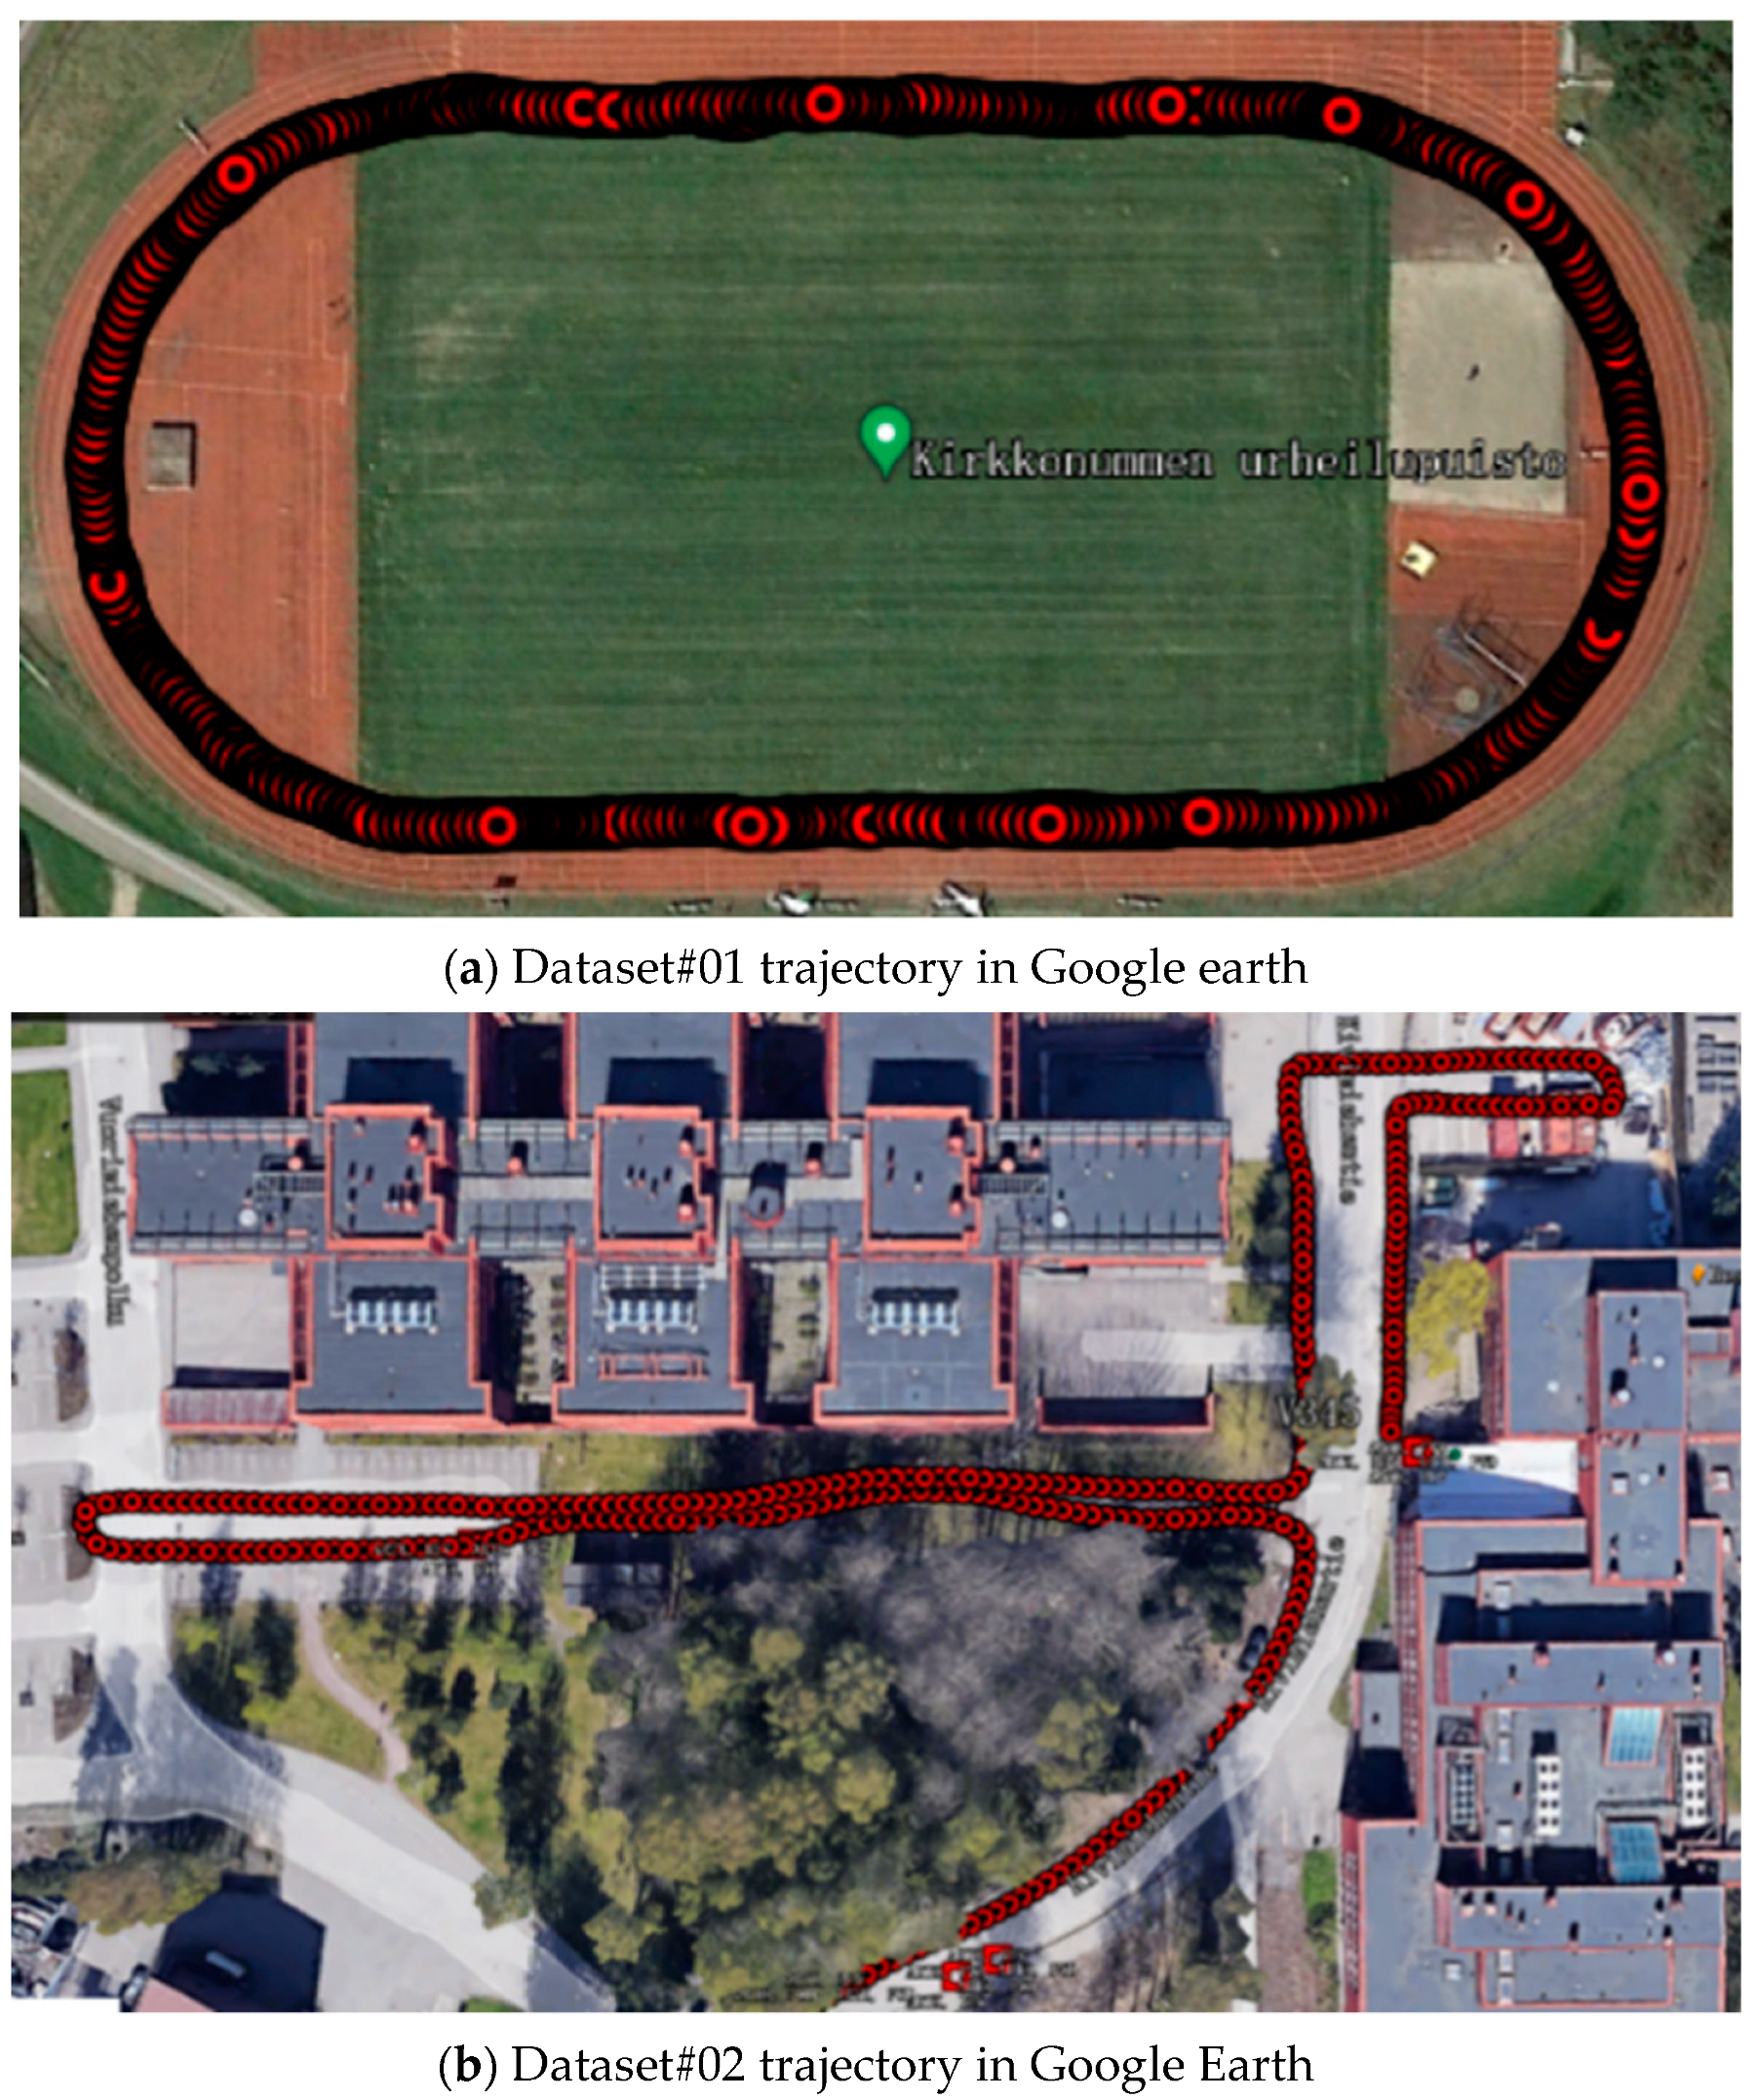
Initially, tests were carried out in an open-sky sports track where the available satellites provided an ideal scenario; as depicted in Figure 3a, the reference trajectory of the collected dataset is shown. In this setting, there were no tall buildings or obstructions affecting GNSS signal propagation. Consequently, GNSS signals and their distribution were anticipated to be ideal for generating reliable position information. Subsequently, datasets were collected in a typical urban environment, as illustrated in Figure 3b in Google Earth. Notably, there were tall buildings and dense forests lining the narrow roads, which could potentially introduce GNSS measurement outliers due to signal reflection from the tall buildings and signal degradation from the surrounding forest.
5.1. Sports Track Experiments in Open-Sky Environments
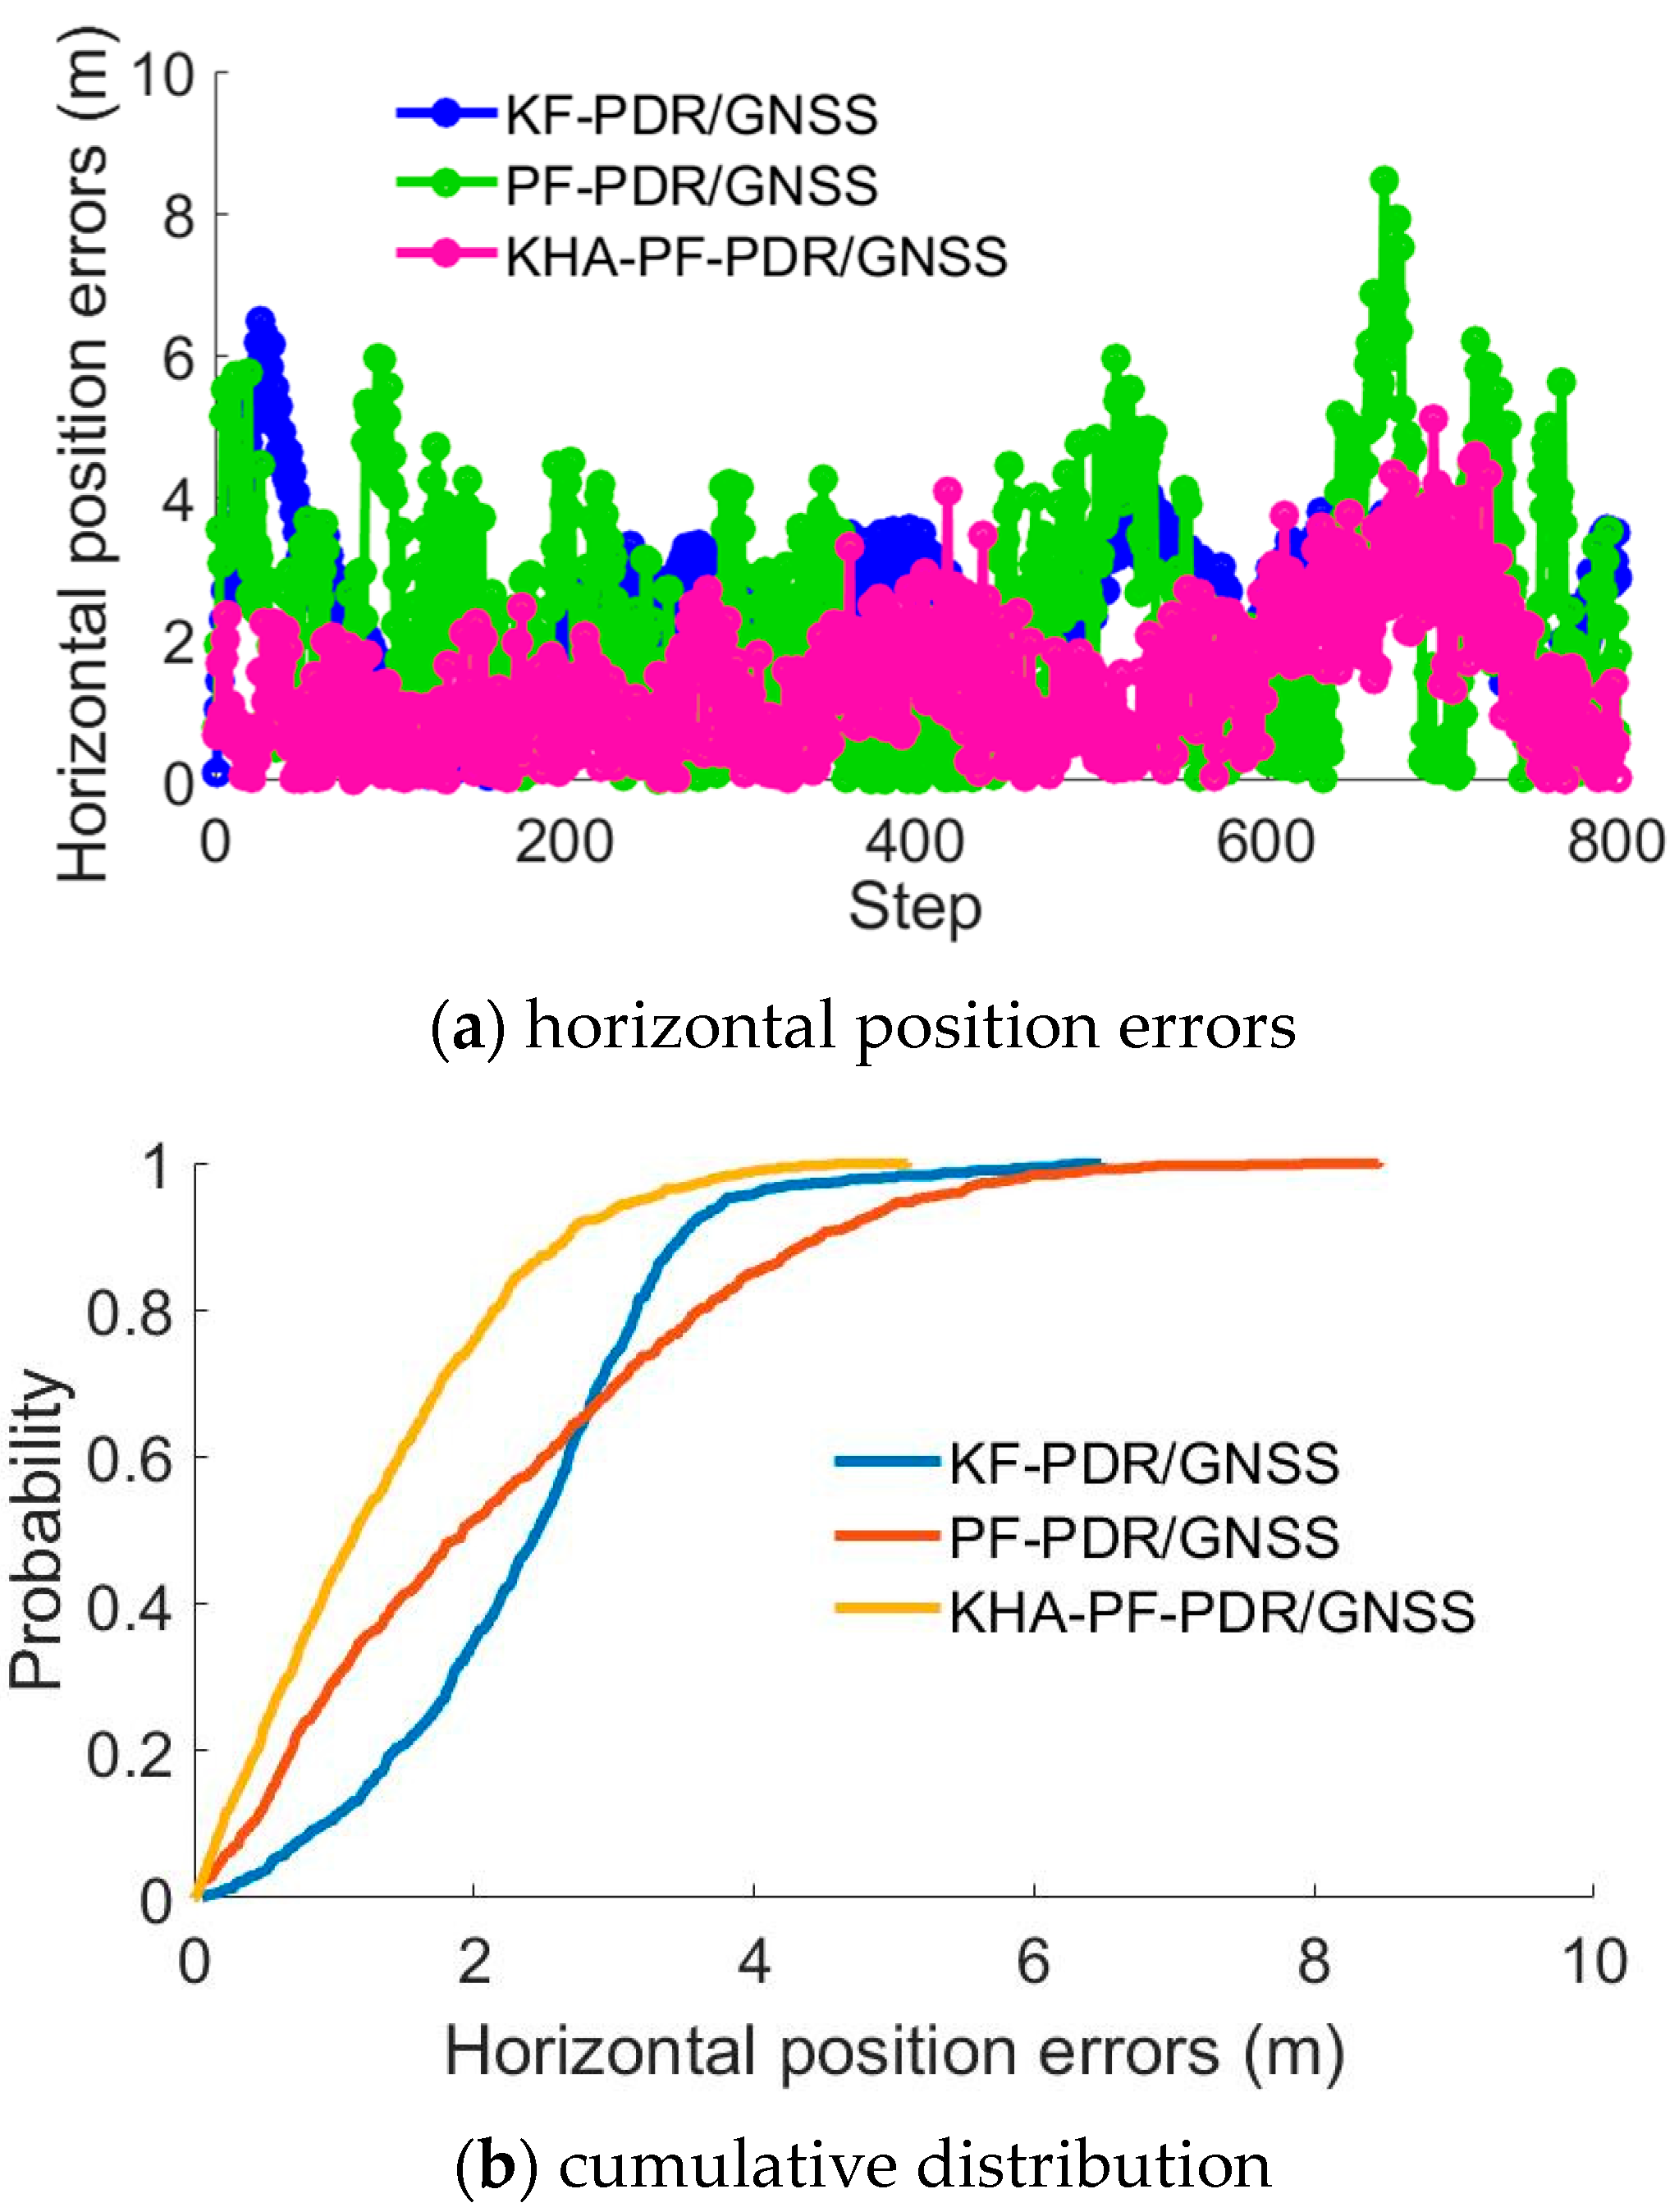
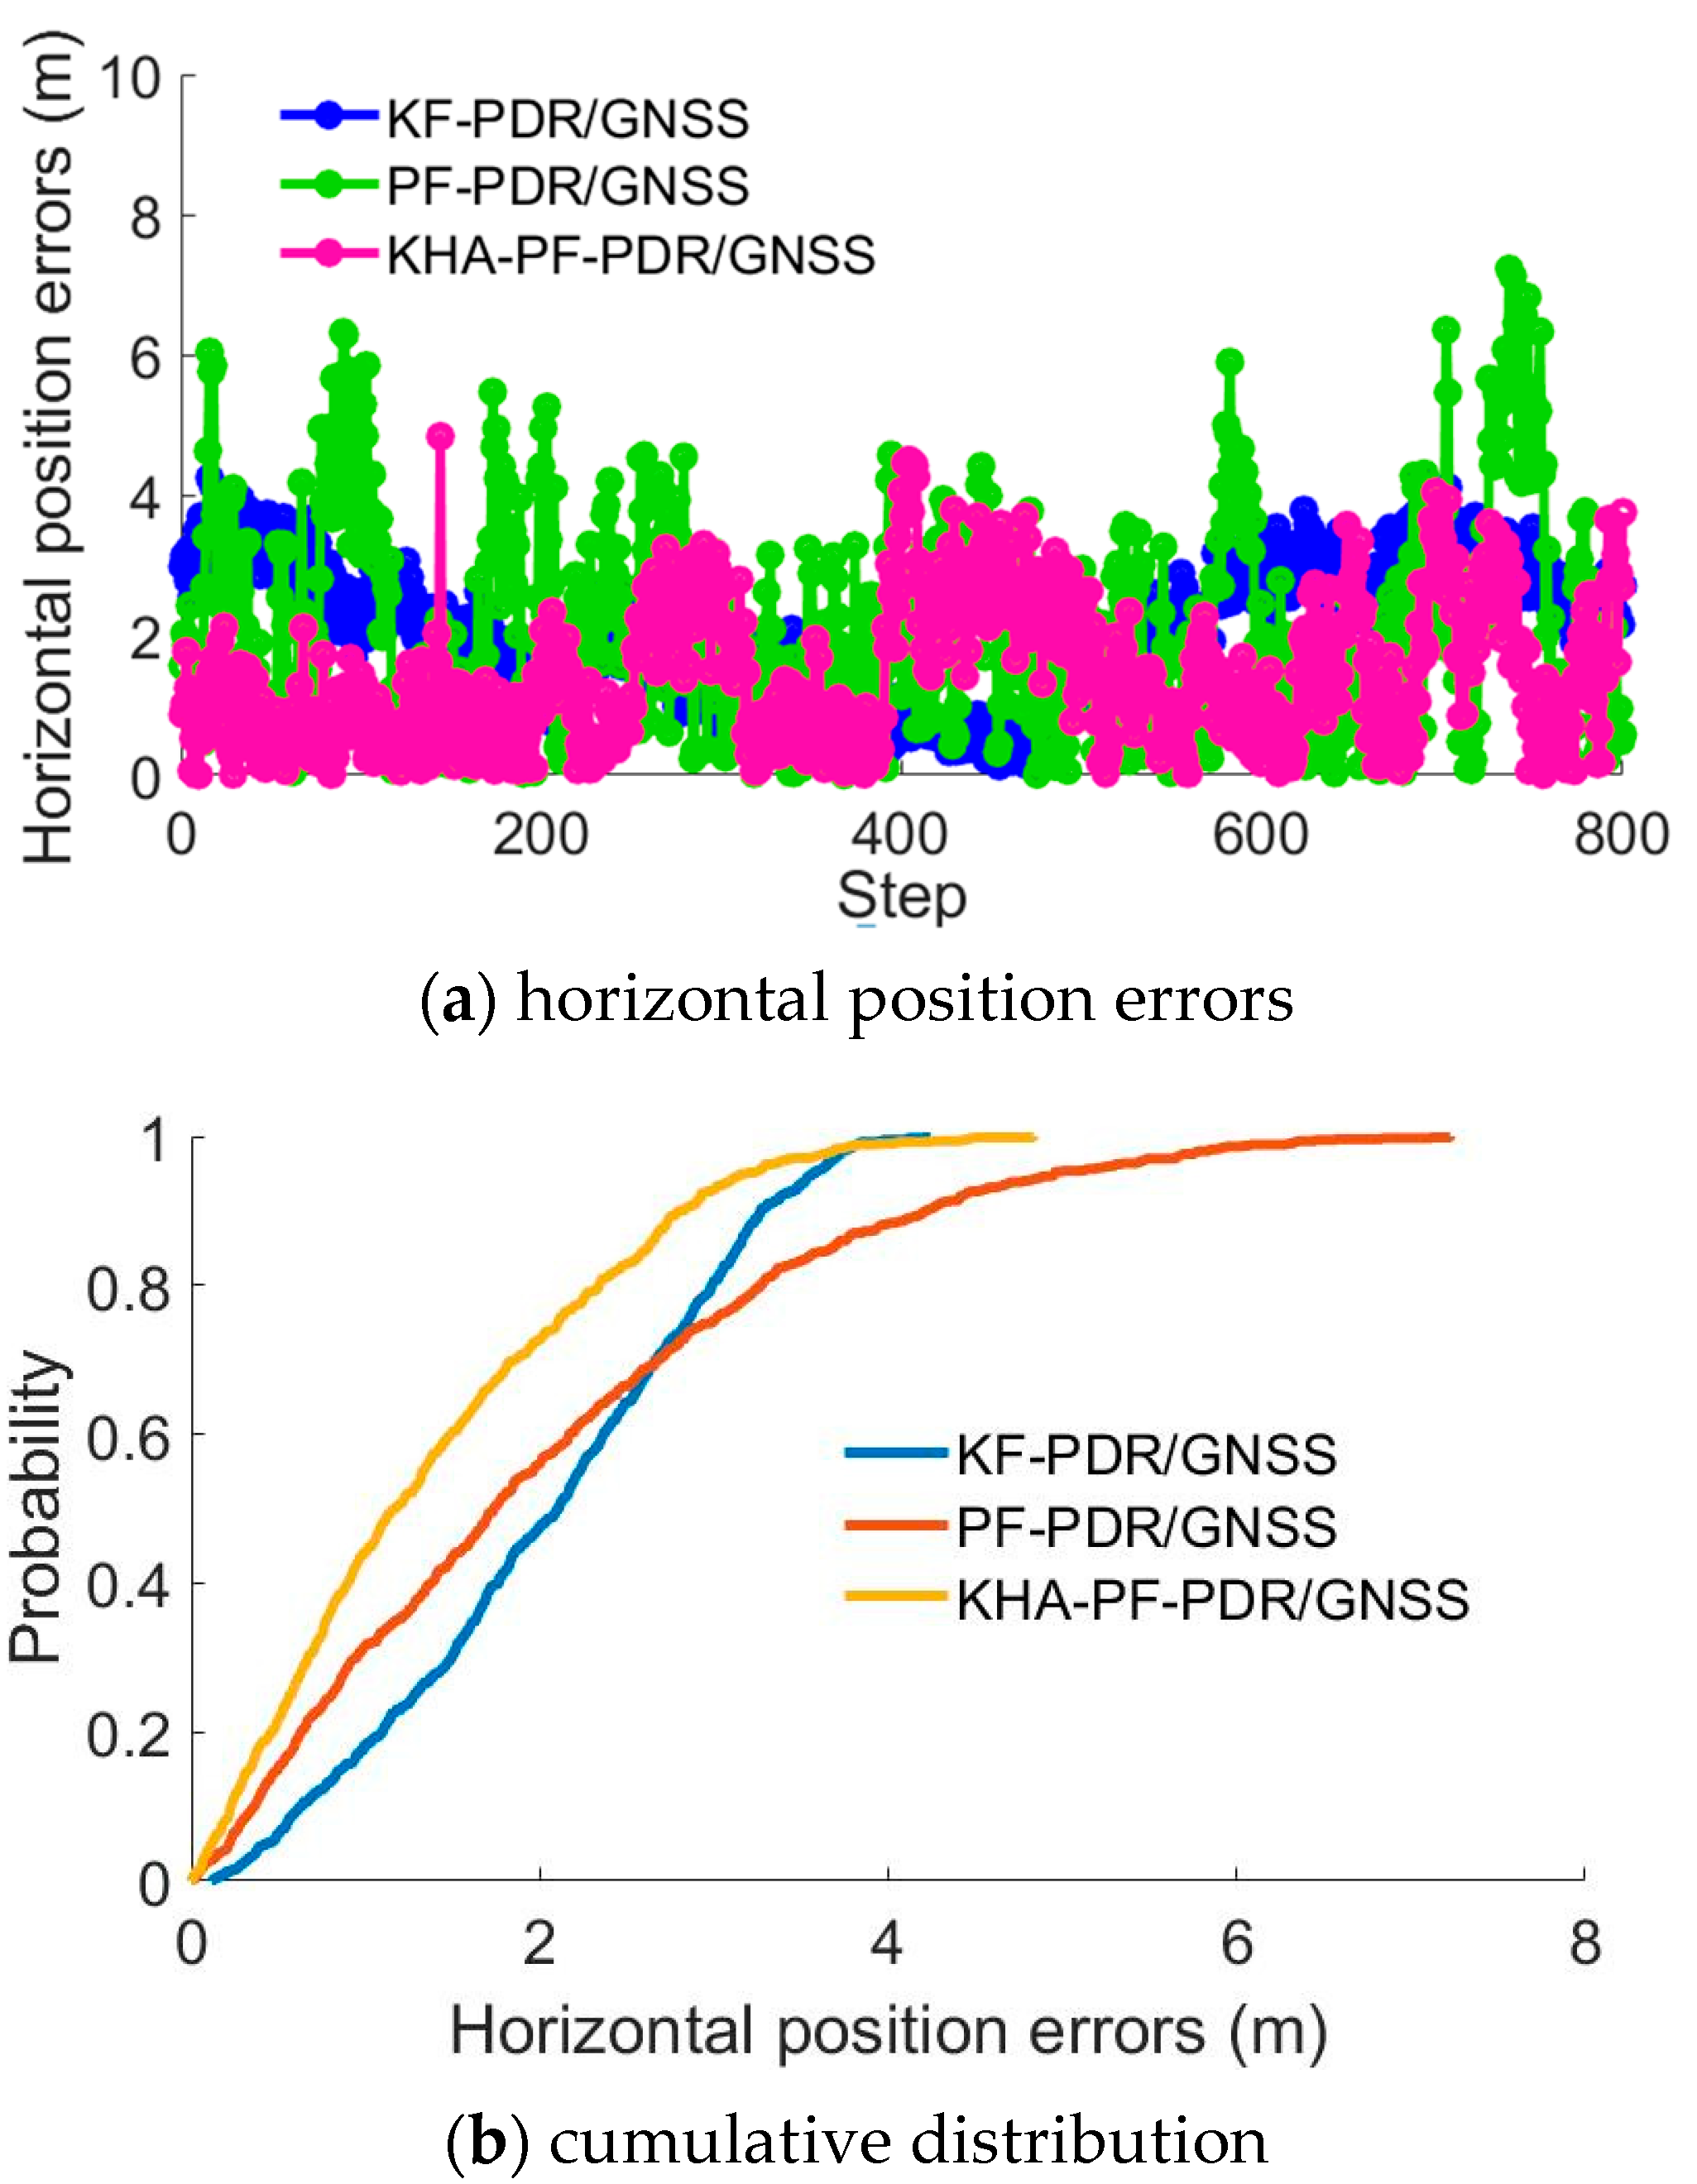
Two different persons carrying the smartphone walked around the standard sport track. The KF-PDR/GNSS, PF-PDR/GNSS and KHA-PDR/GNSS methods were utilized to process the datasets. The horizontal position errors were calculated and are shown in Figure 4a and Figure 5a. The red line represents the horizontal position results from the KF-PDR/GNSS method, and the green line represents the horizontal position results from the PF-PDR/GNSS. It can be observed that the KHA-PF has the best performance with the smaller position errors. Here, the both PF and KHA-PF sample value is set to 200.
The results of the statistical analysis of the horizontal position errors are listed in Table 1 and Table 2. The mean values and the median values of the horizontal position errors are presented. It can be observed that KHA-PF performs the best. Specifically, for Dataset#01, the KHA-PF mean position errors decreased by 39.6% compared with KF-PDR/GNSS, and the median values of the horizontal position errors decreased by 39.5%; for Dataset#02, the KHA-PF mean and median horizontal position errors improved by 31.5% and 32.8%. Furthermore. Figure 3b and Figure 4b show the horizontal position errors distribution, which also support the conclusion that KHA-PF had the better performance. Basically, the horizontal position results show that the KHA method is effective for optimizing the particle distribution in the PF, which contributes to better position results.
5.2. Fault Detection Experiments and Analysis
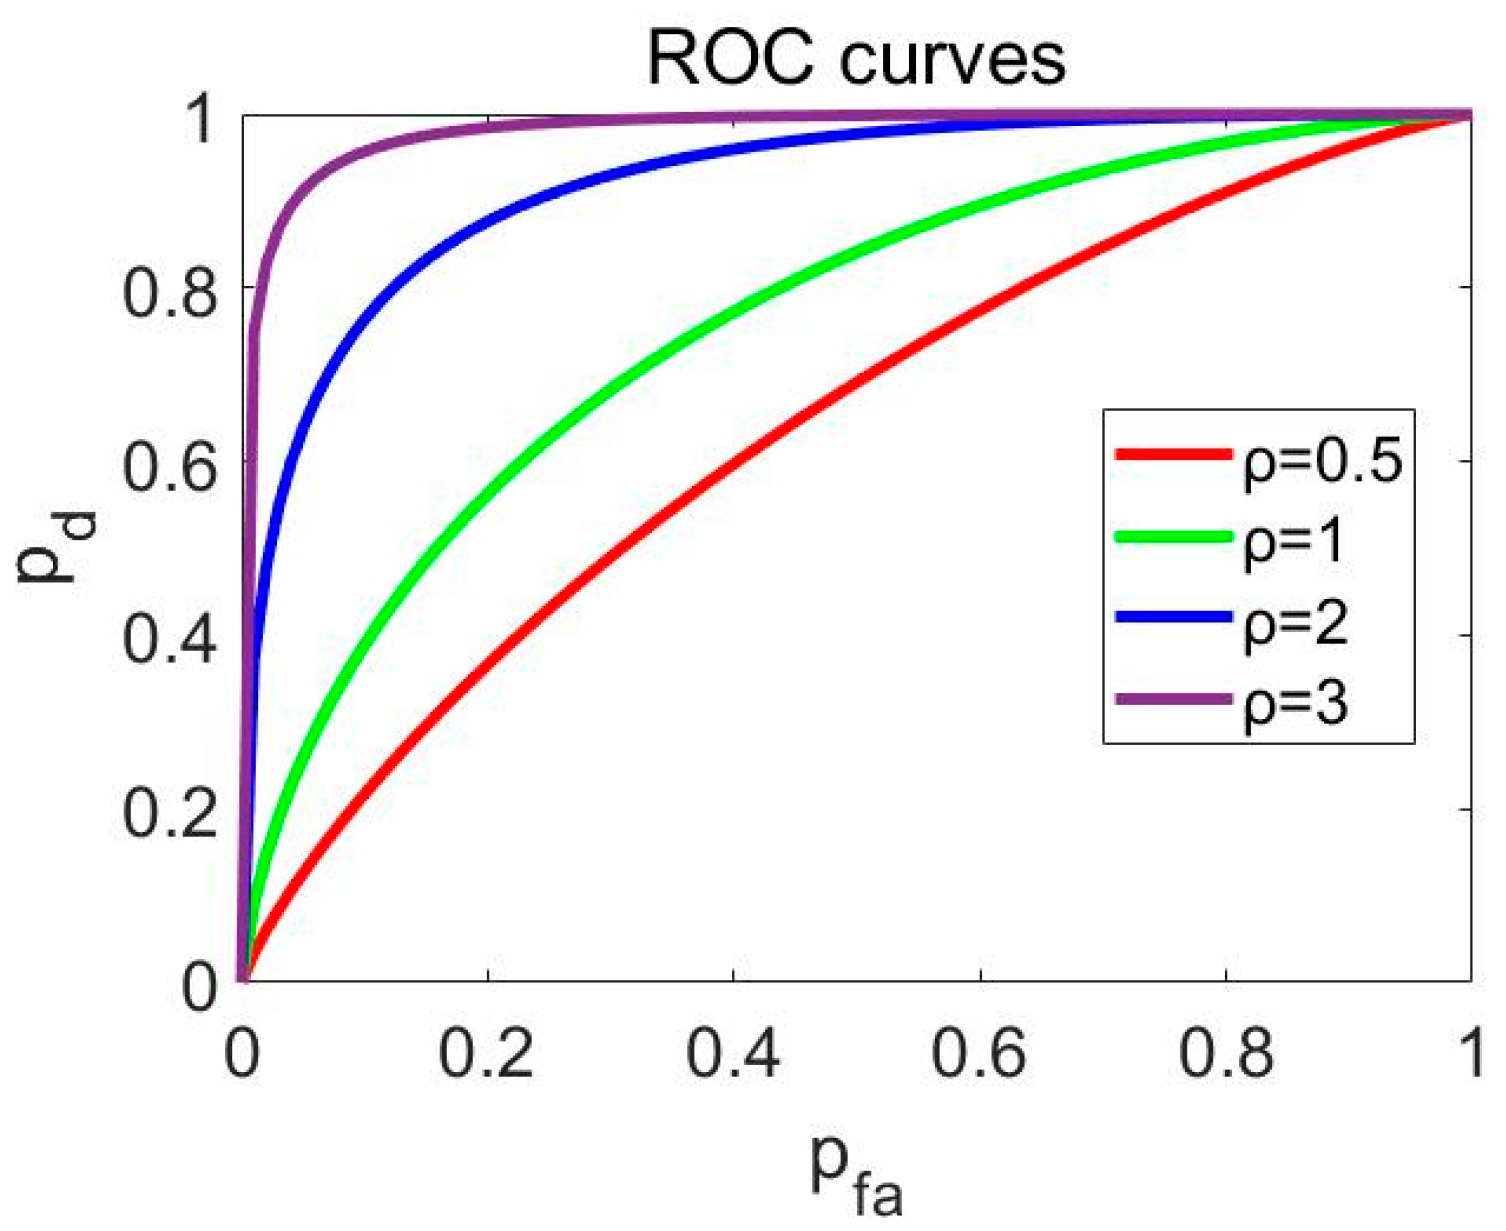
Before analyzing the detection method performance, we first analyzed the relationship between the detection probability and false alarm probability. Equation (43) describes the detection probability and false alarm probability, and receiver operating curves are utilized to assess the detection performance. We denote that in Equation (43). Figure 6 denotes the ROC curves with different values. It shows that higher a value contributes to better detection performance and lower false alarm probability.
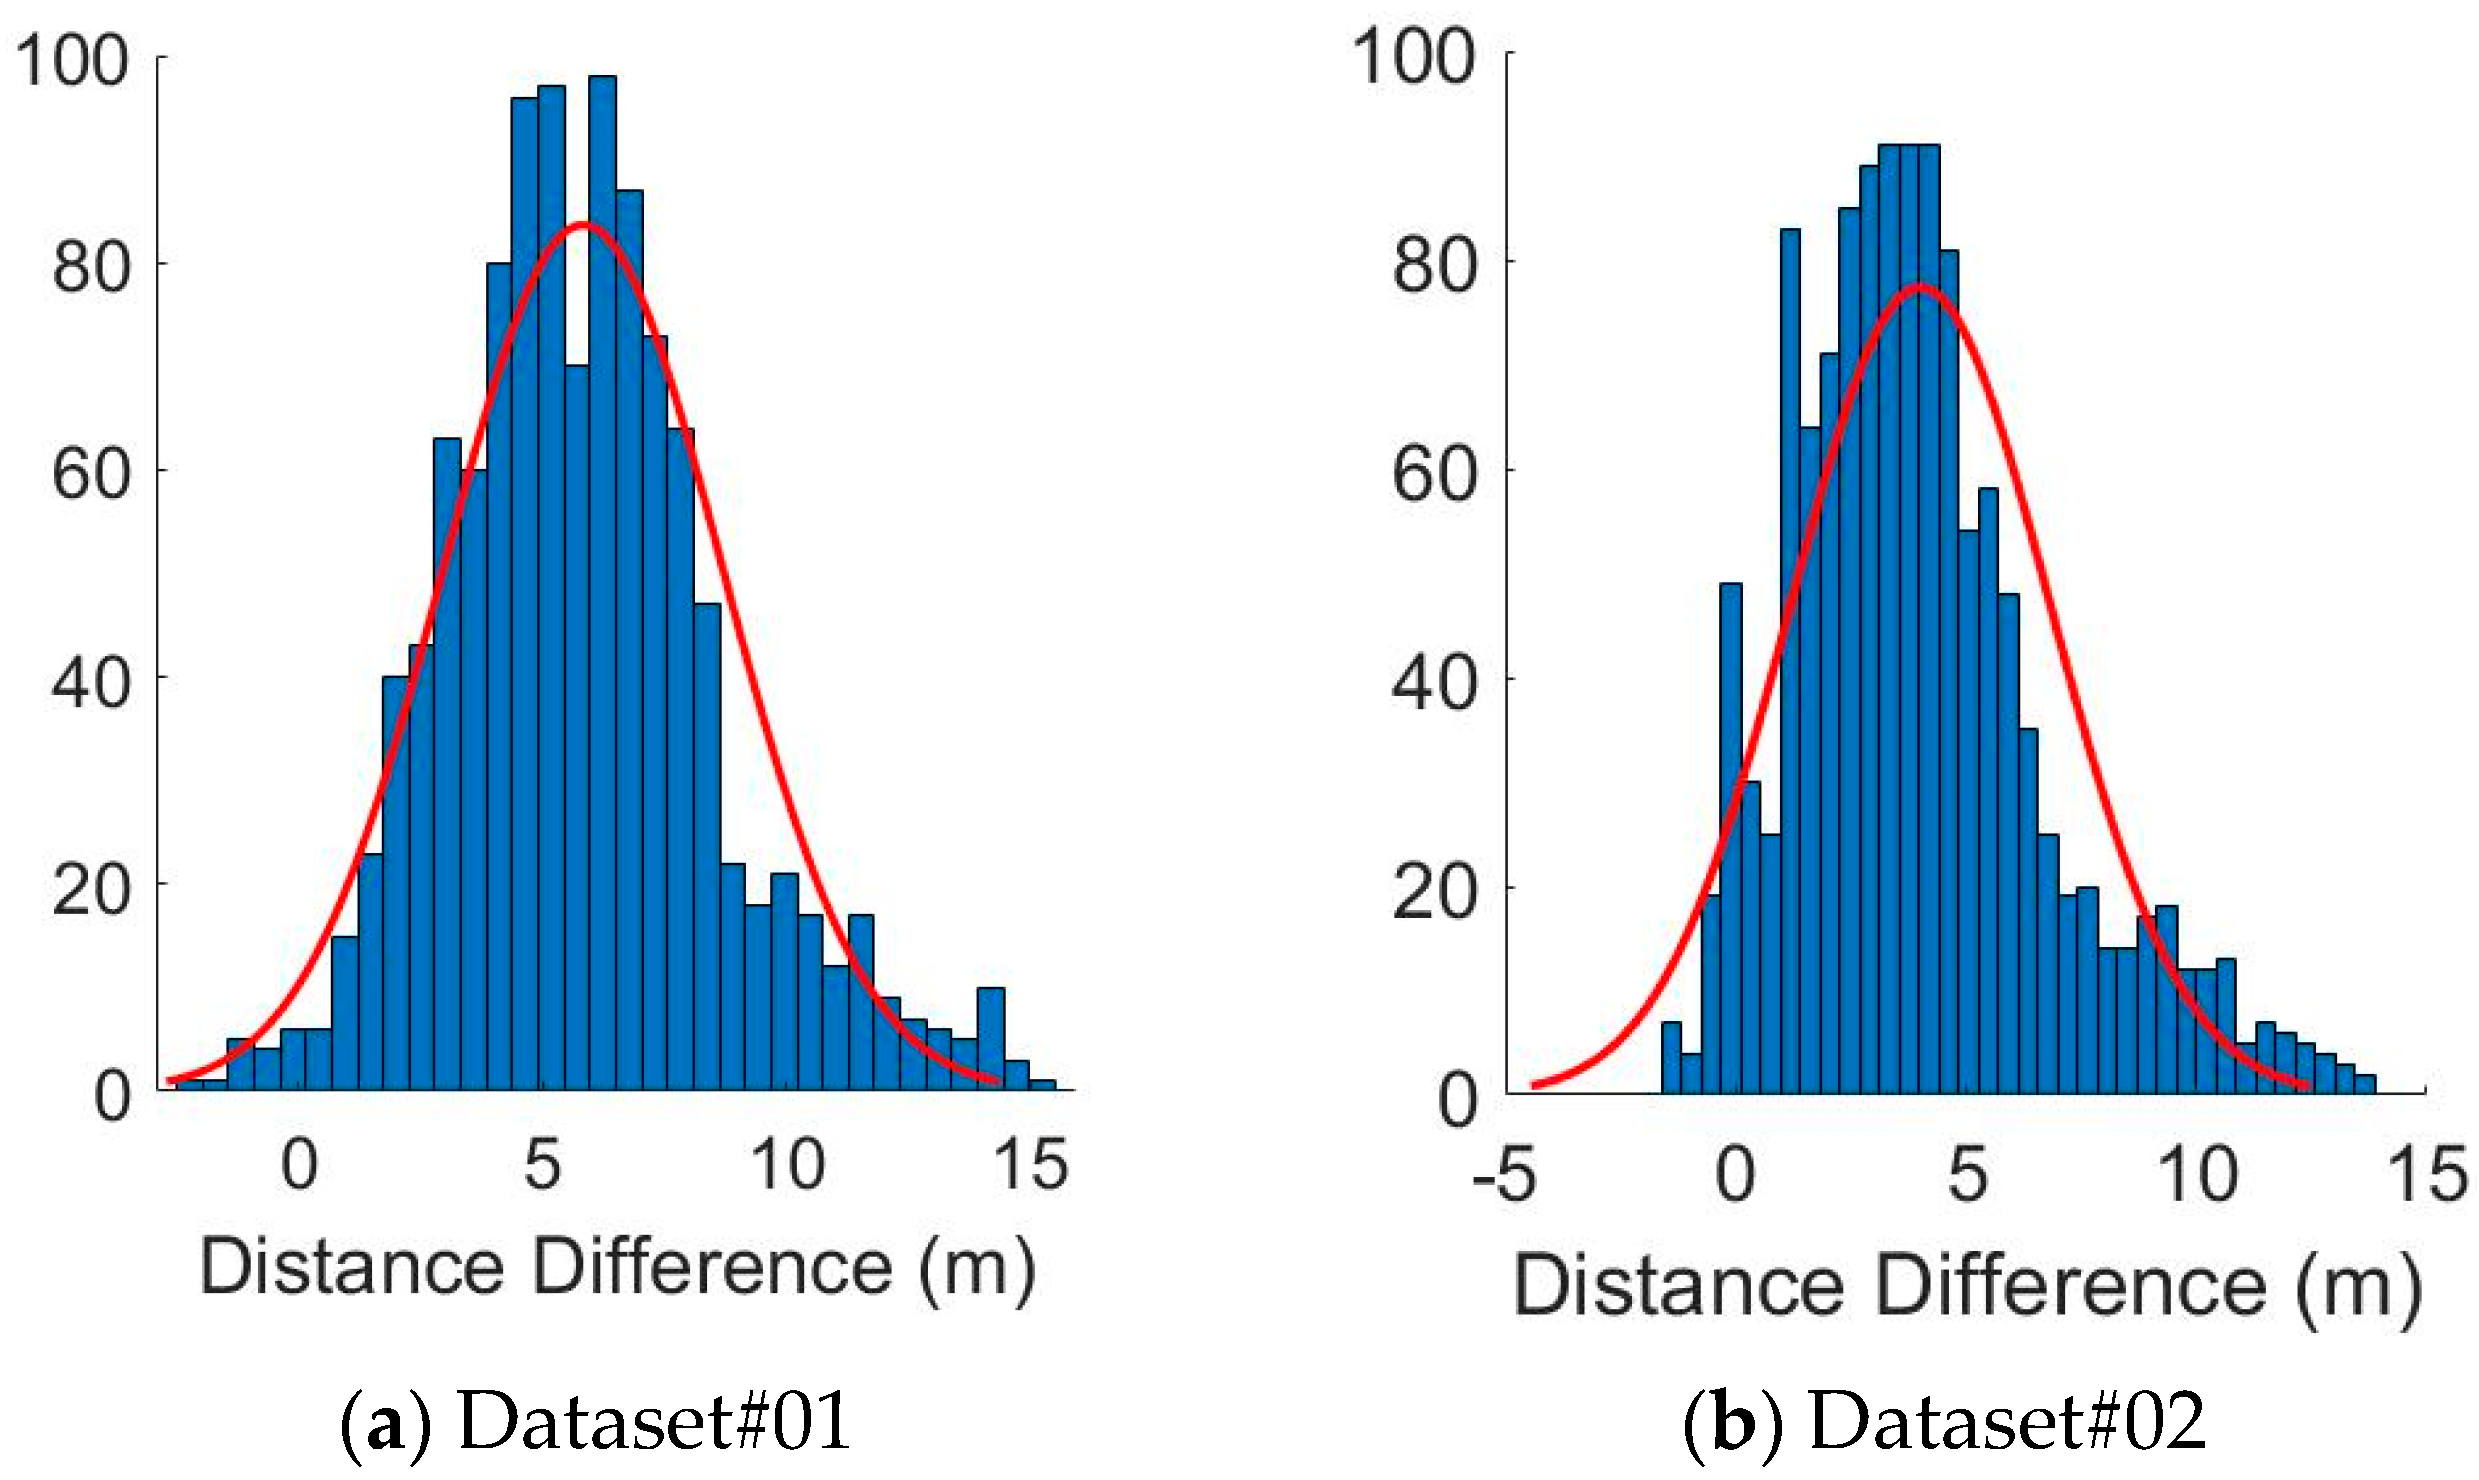
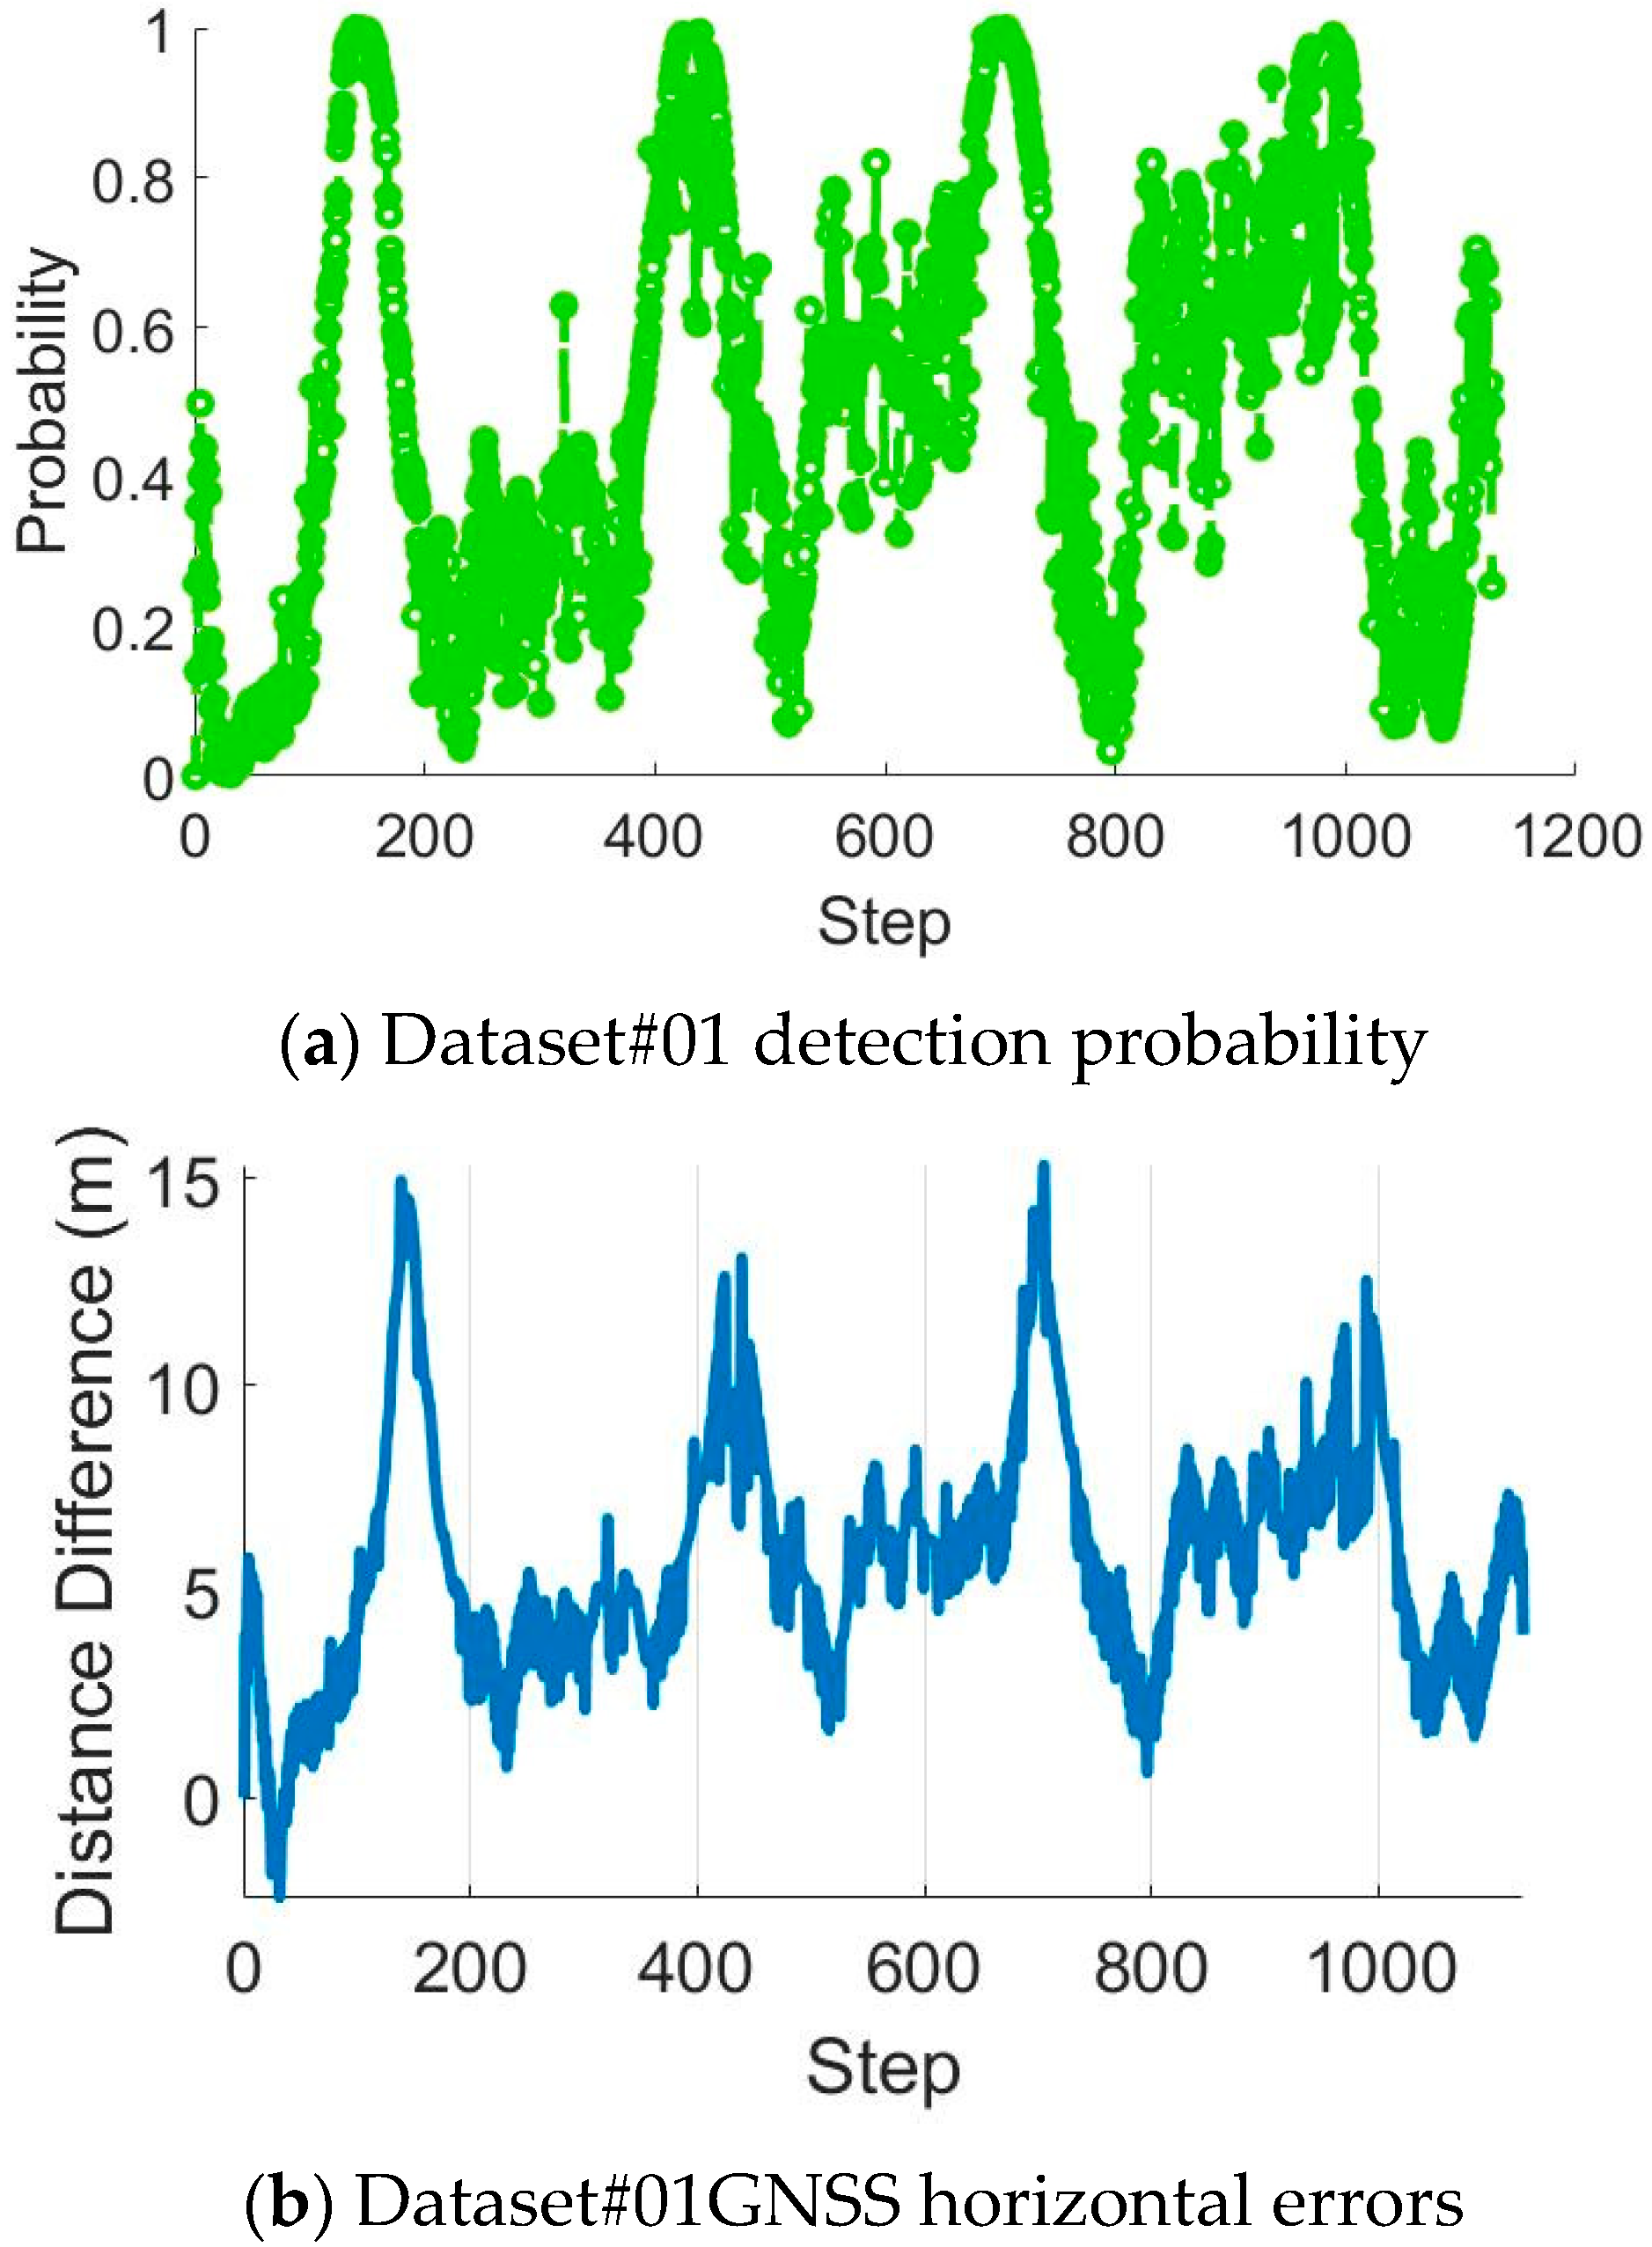
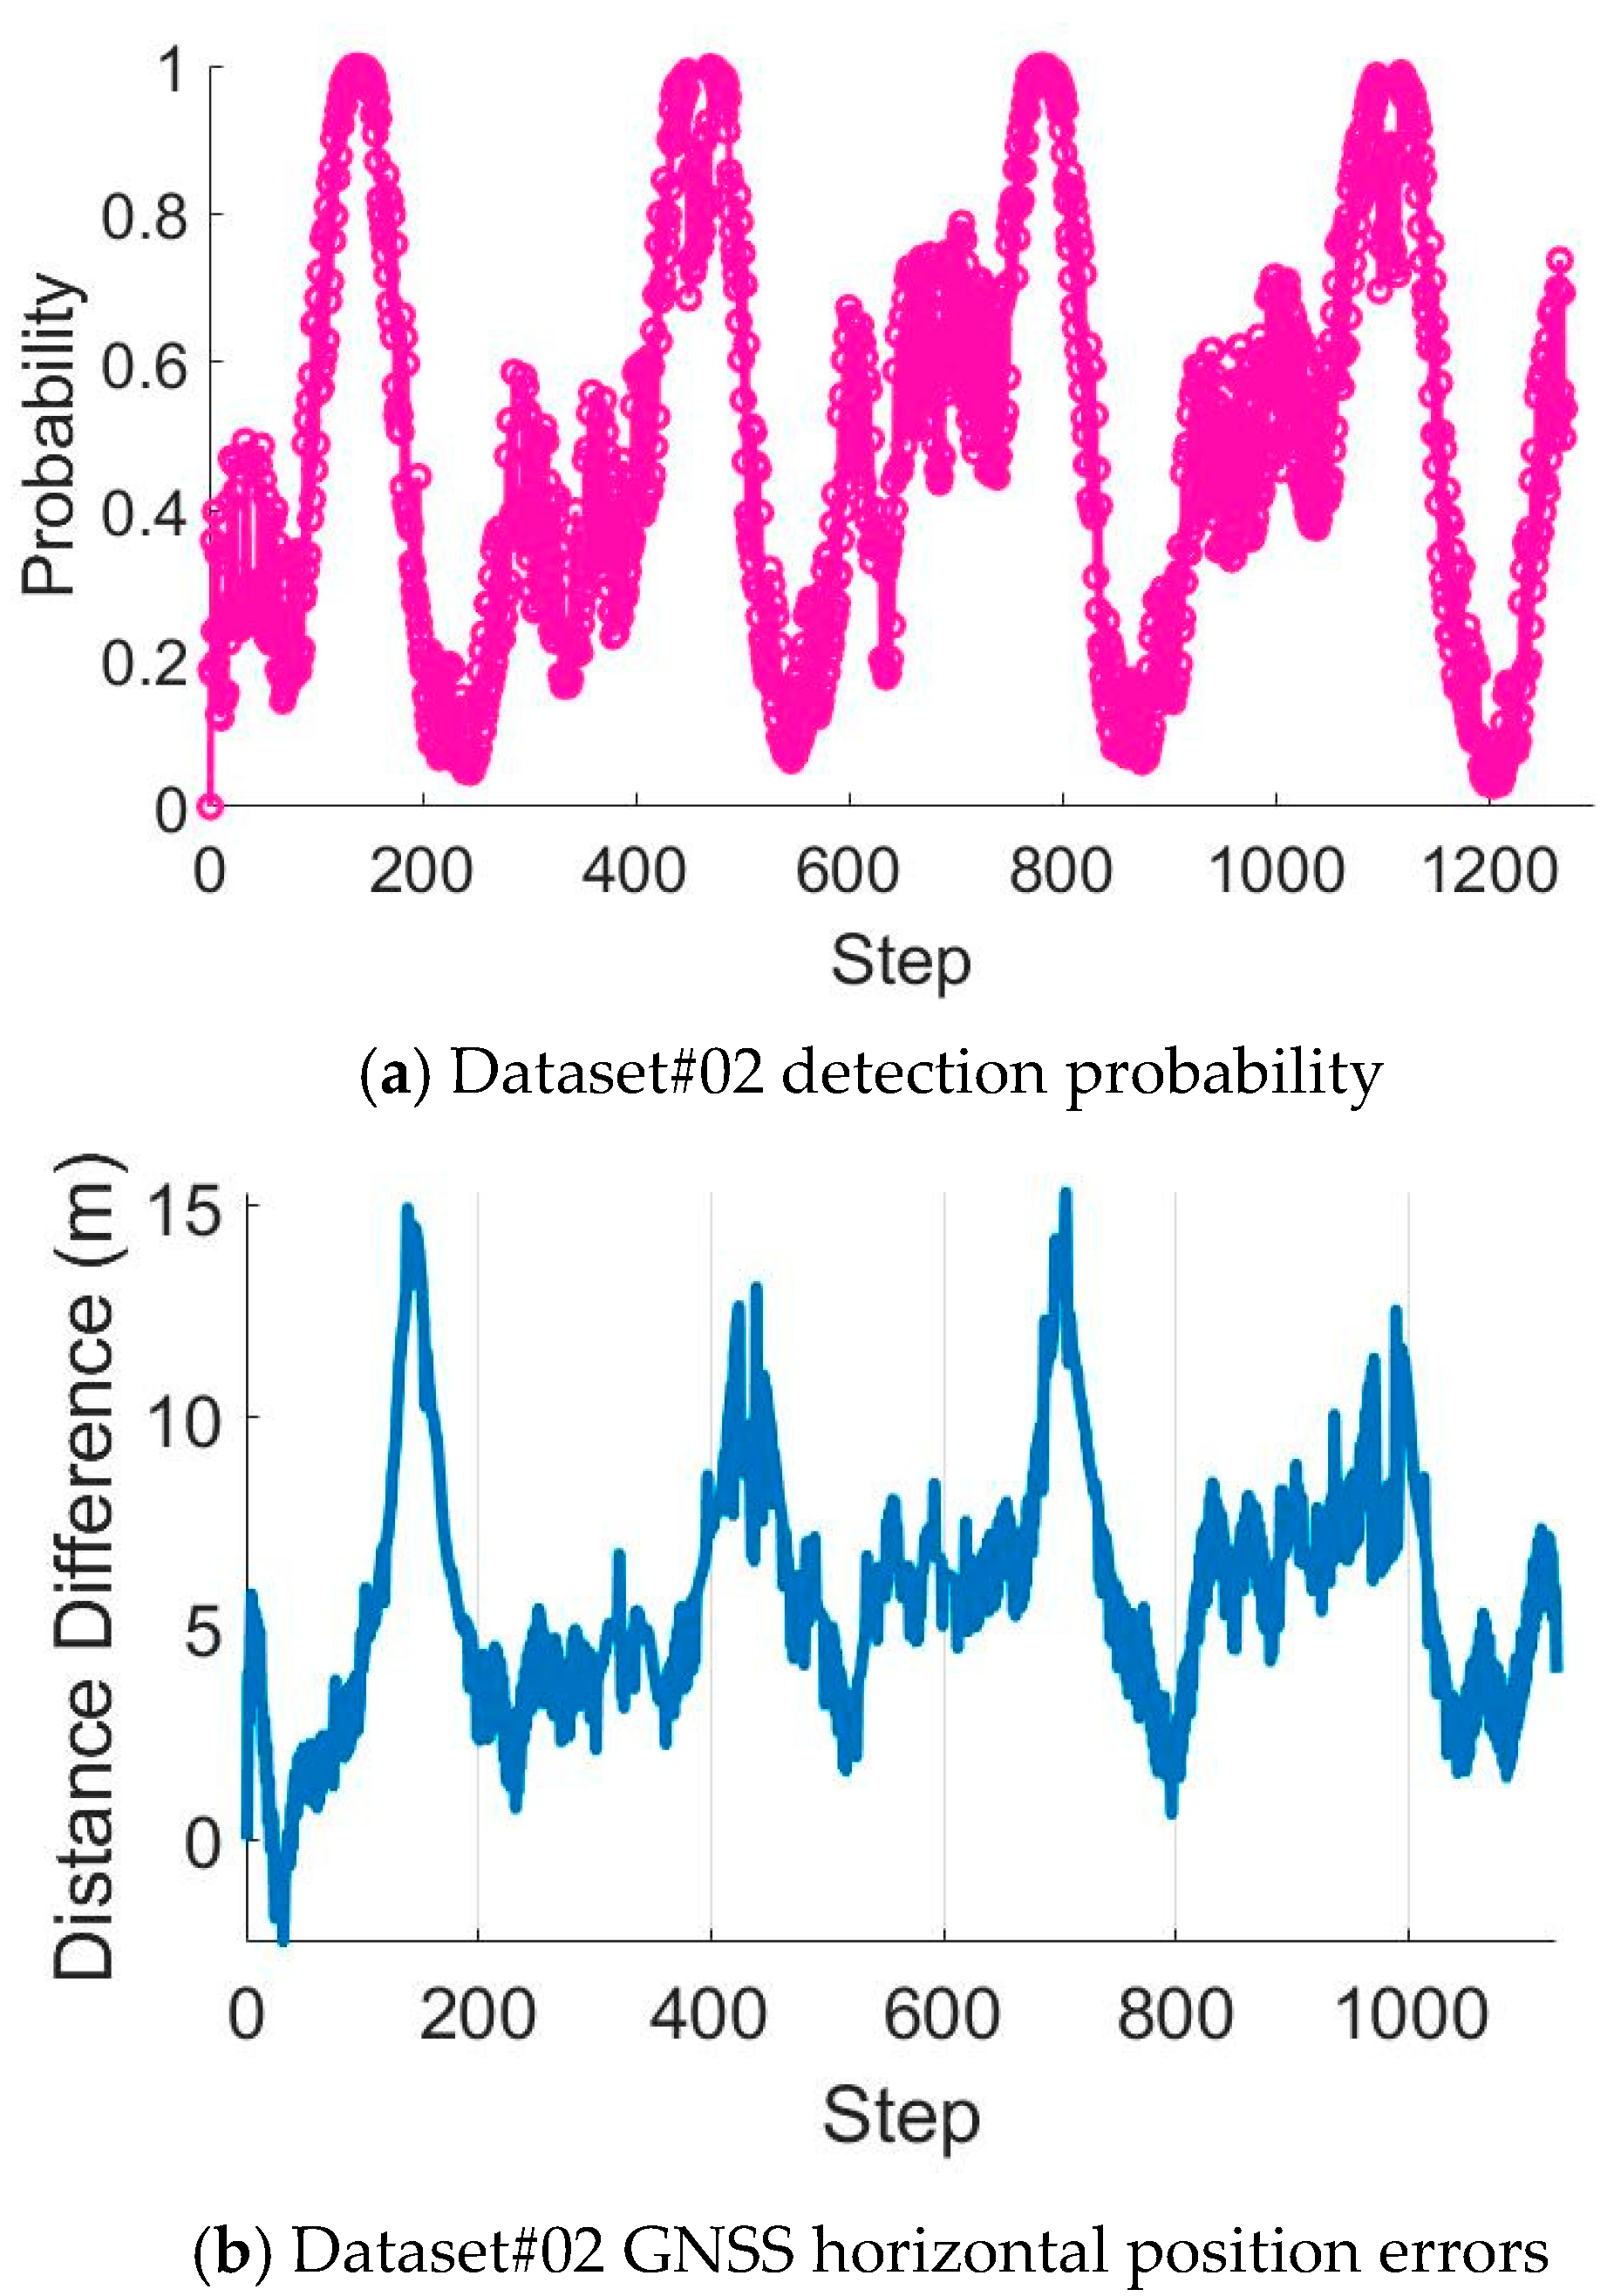
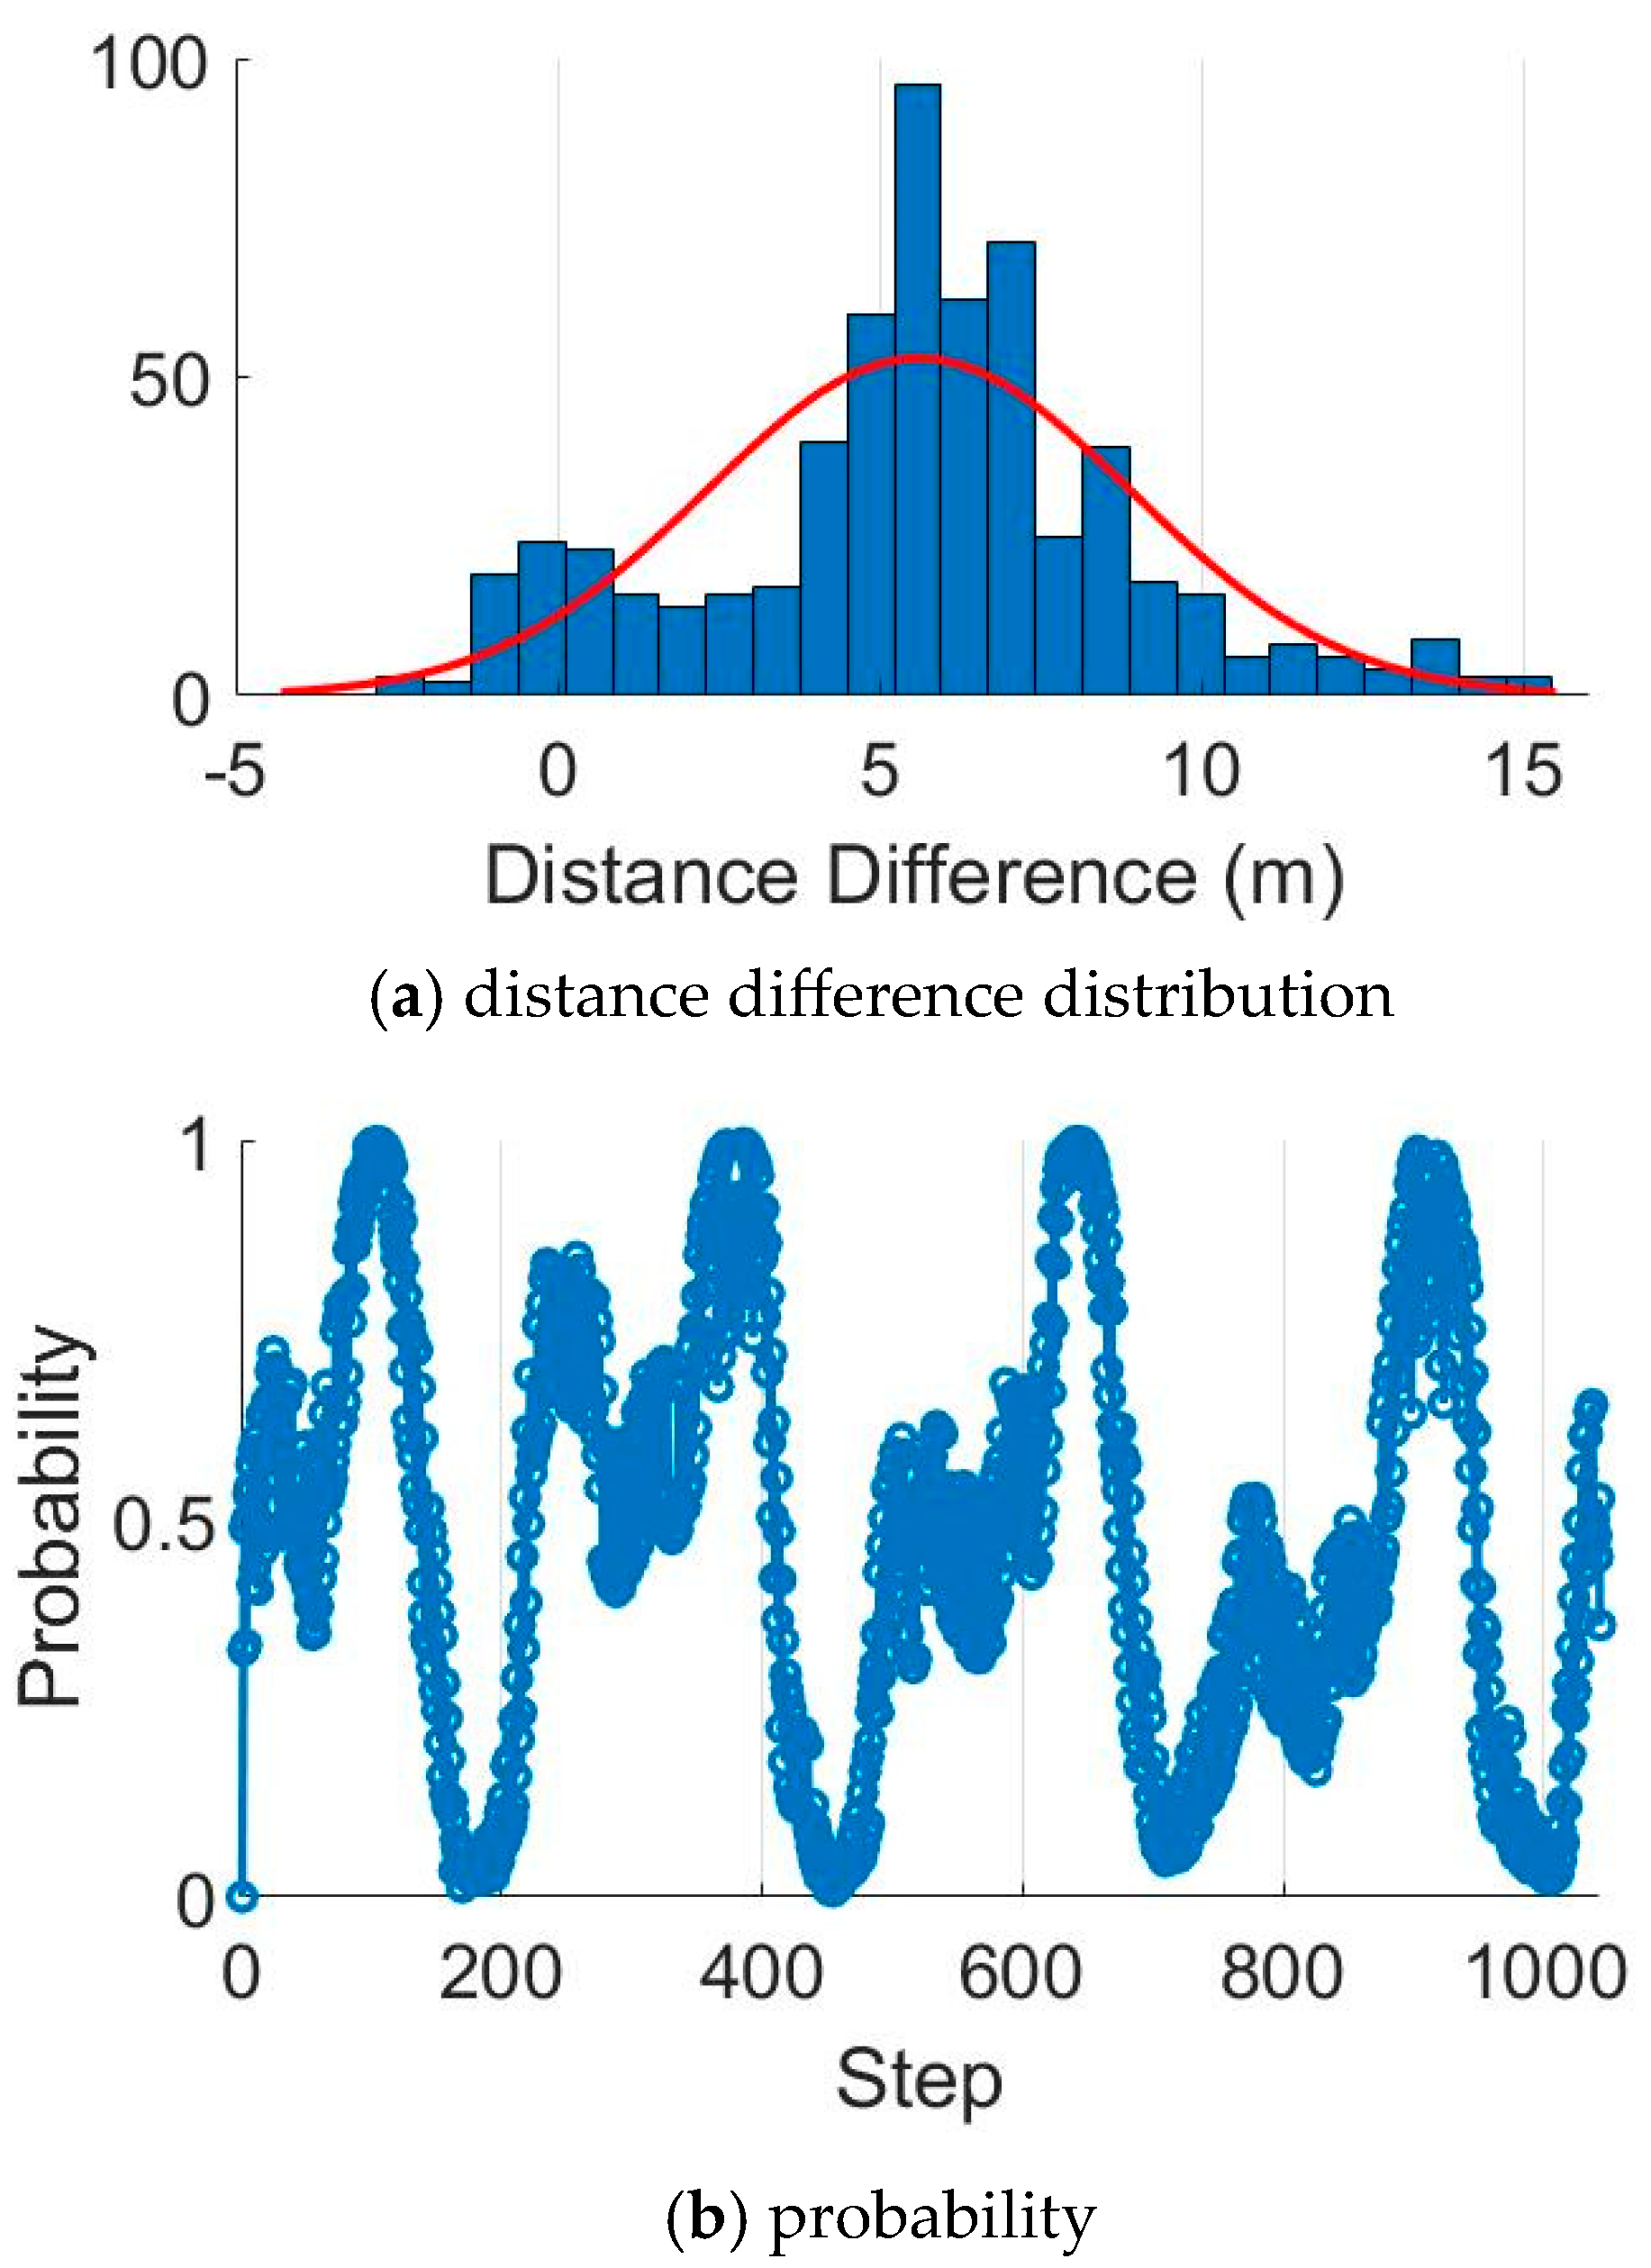
The GNSS and PDR distance difference values distribution is presented in Figure 7; specifically, Figure 7a presents the distance difference distribution from Dataset#01 in the last sub-section, and Figure 7b shows the distance distribution from Dataset#02. A Gaussian model is utilized to fit the distributions, and the red line denotes the fitted Gaussian model probability density curves. It can be observed that the mean values of the fitted Gaussian model are not zero. Ideally, the mean values should be zero. We suggest the following two reasons could account for this: (1) As described in Section 4, we build the probability model assuming the pedestrian is walking straight, and this assumption is not always satisfied. (2) The GNSS measurements contain some errors, even if the datasets are collected in an open-sky environment. Based on the fitted Gaussian model, it is possible to detect the GNSS measurement outliers with the input distance difference measurements. Based on the fitted models, Figure 8 and Figure 9 present the distance difference and the corresponding detection probability results of the two datasets, which shows it is feasible to apply the fitted model to detect the GNSS outliers after properly selecting the detection threshold.
5.3. Fault Detection Experiments with Simulated Faults
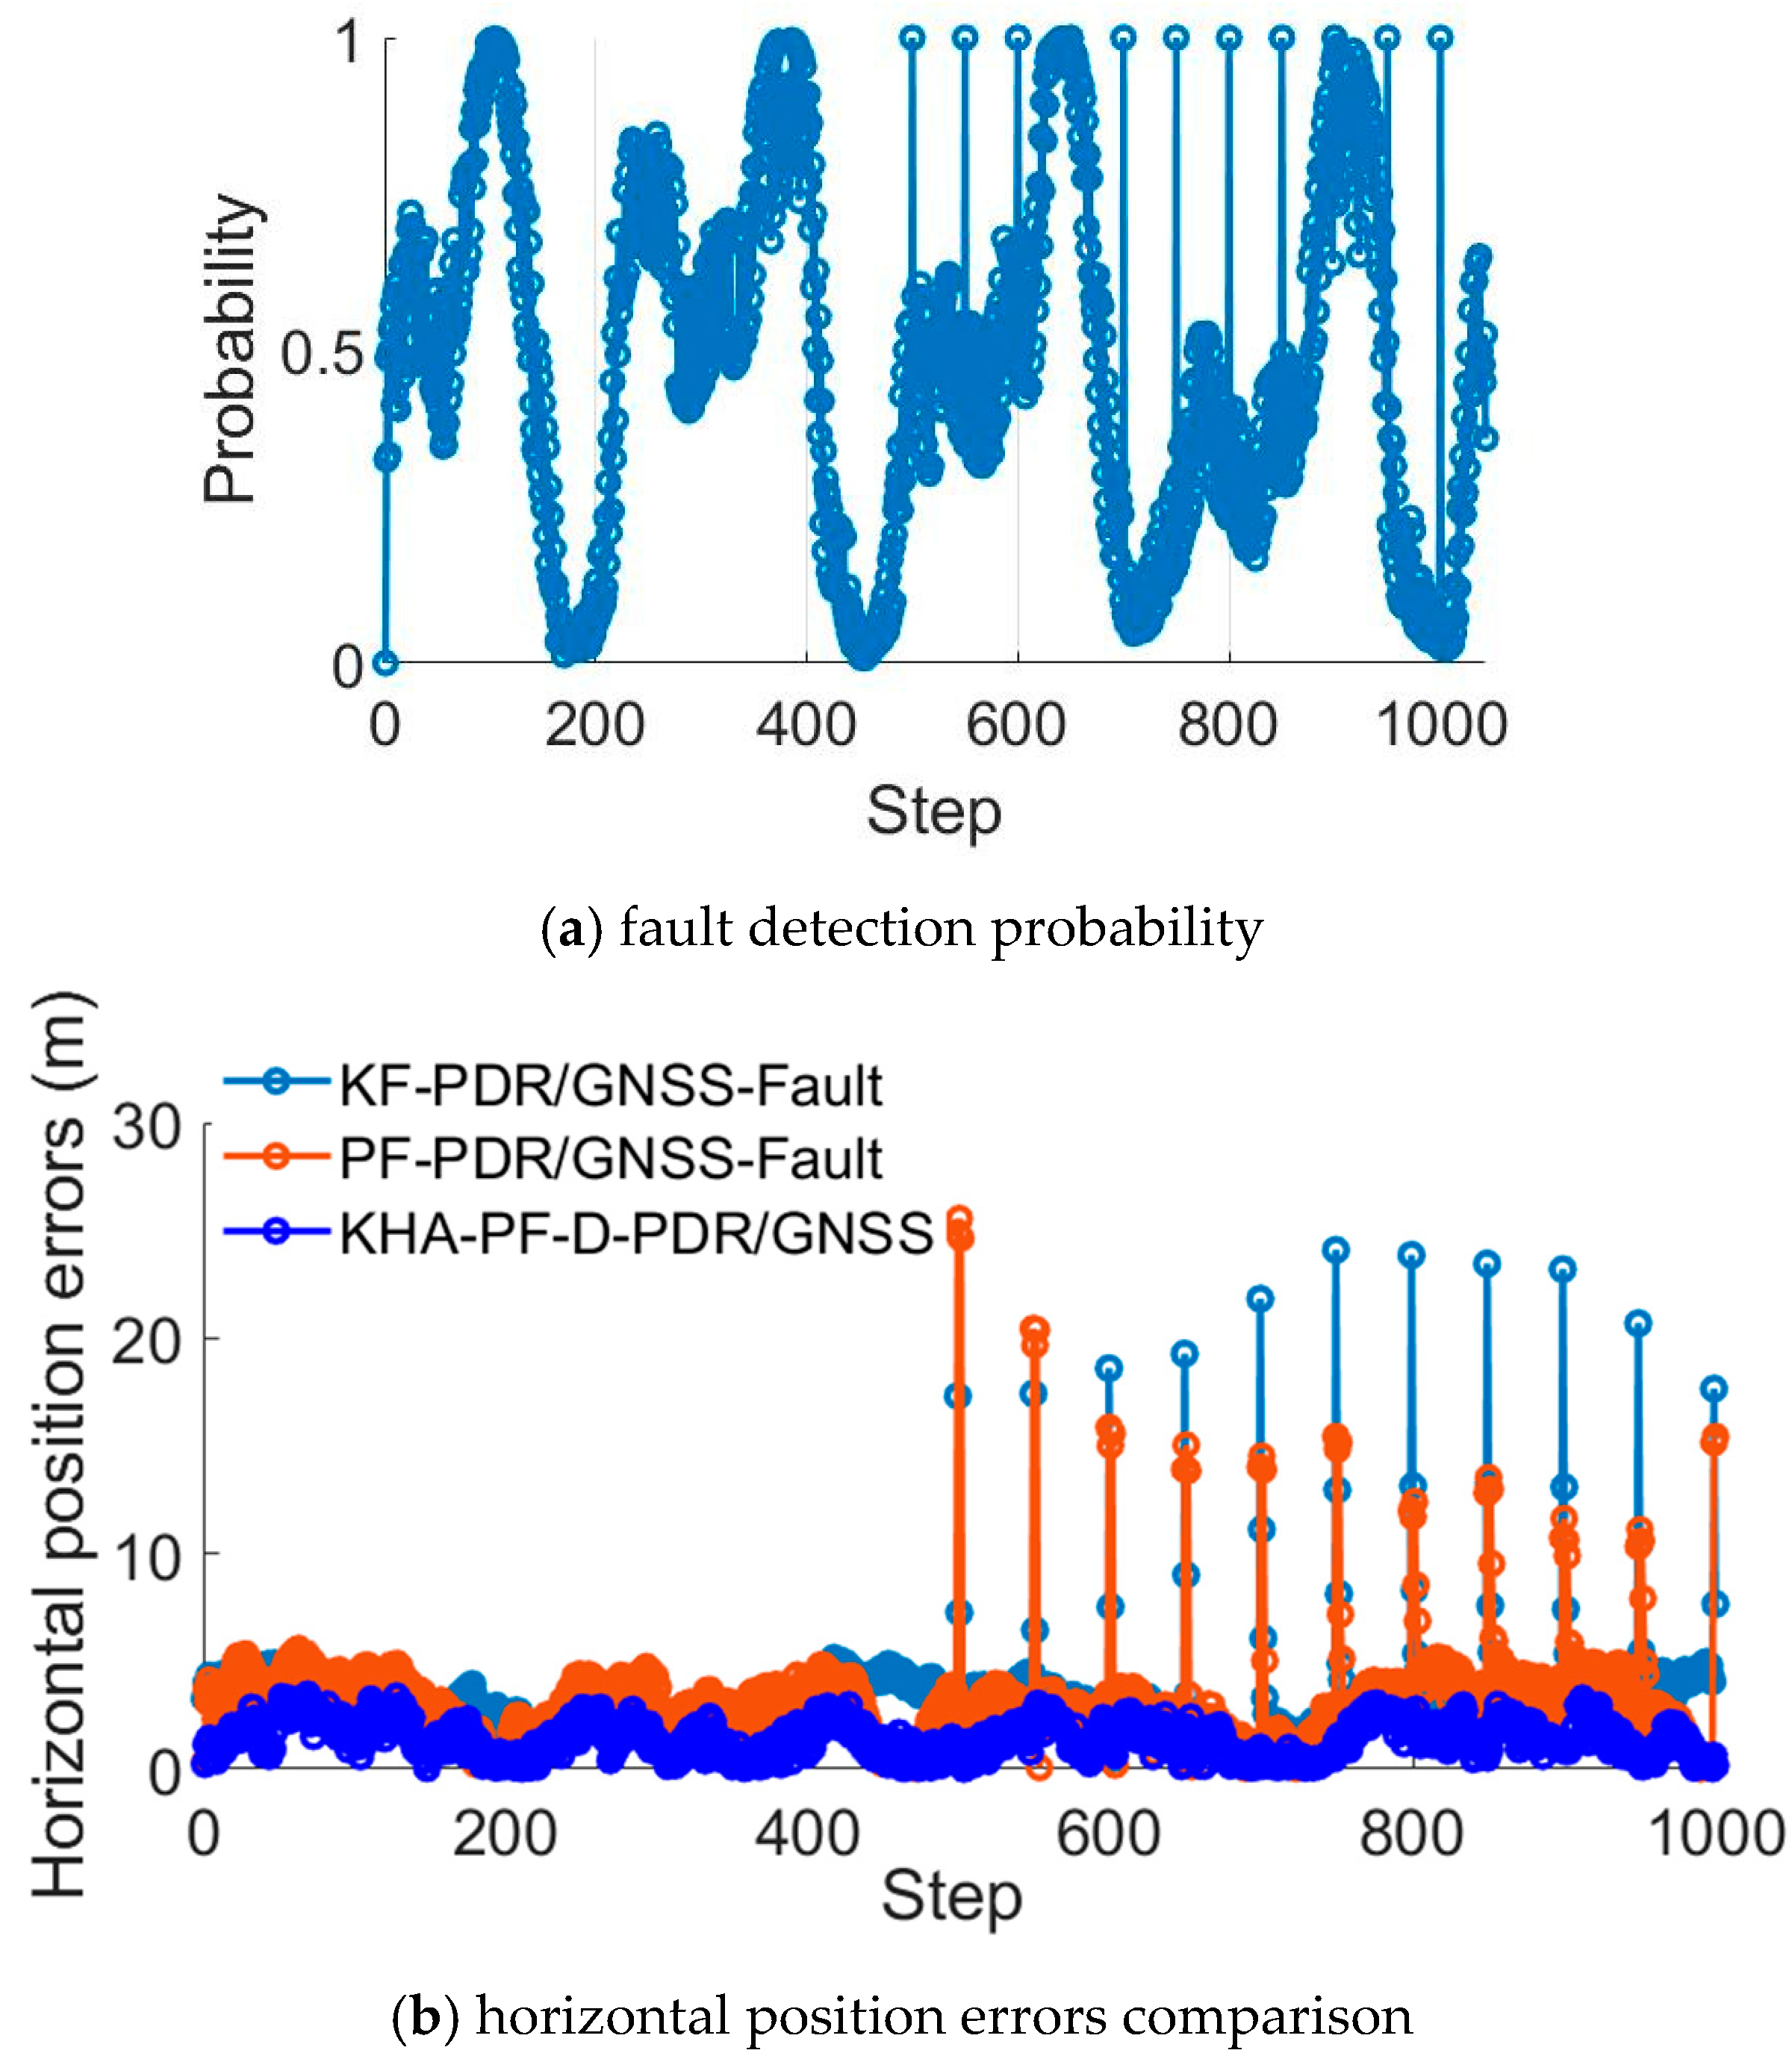
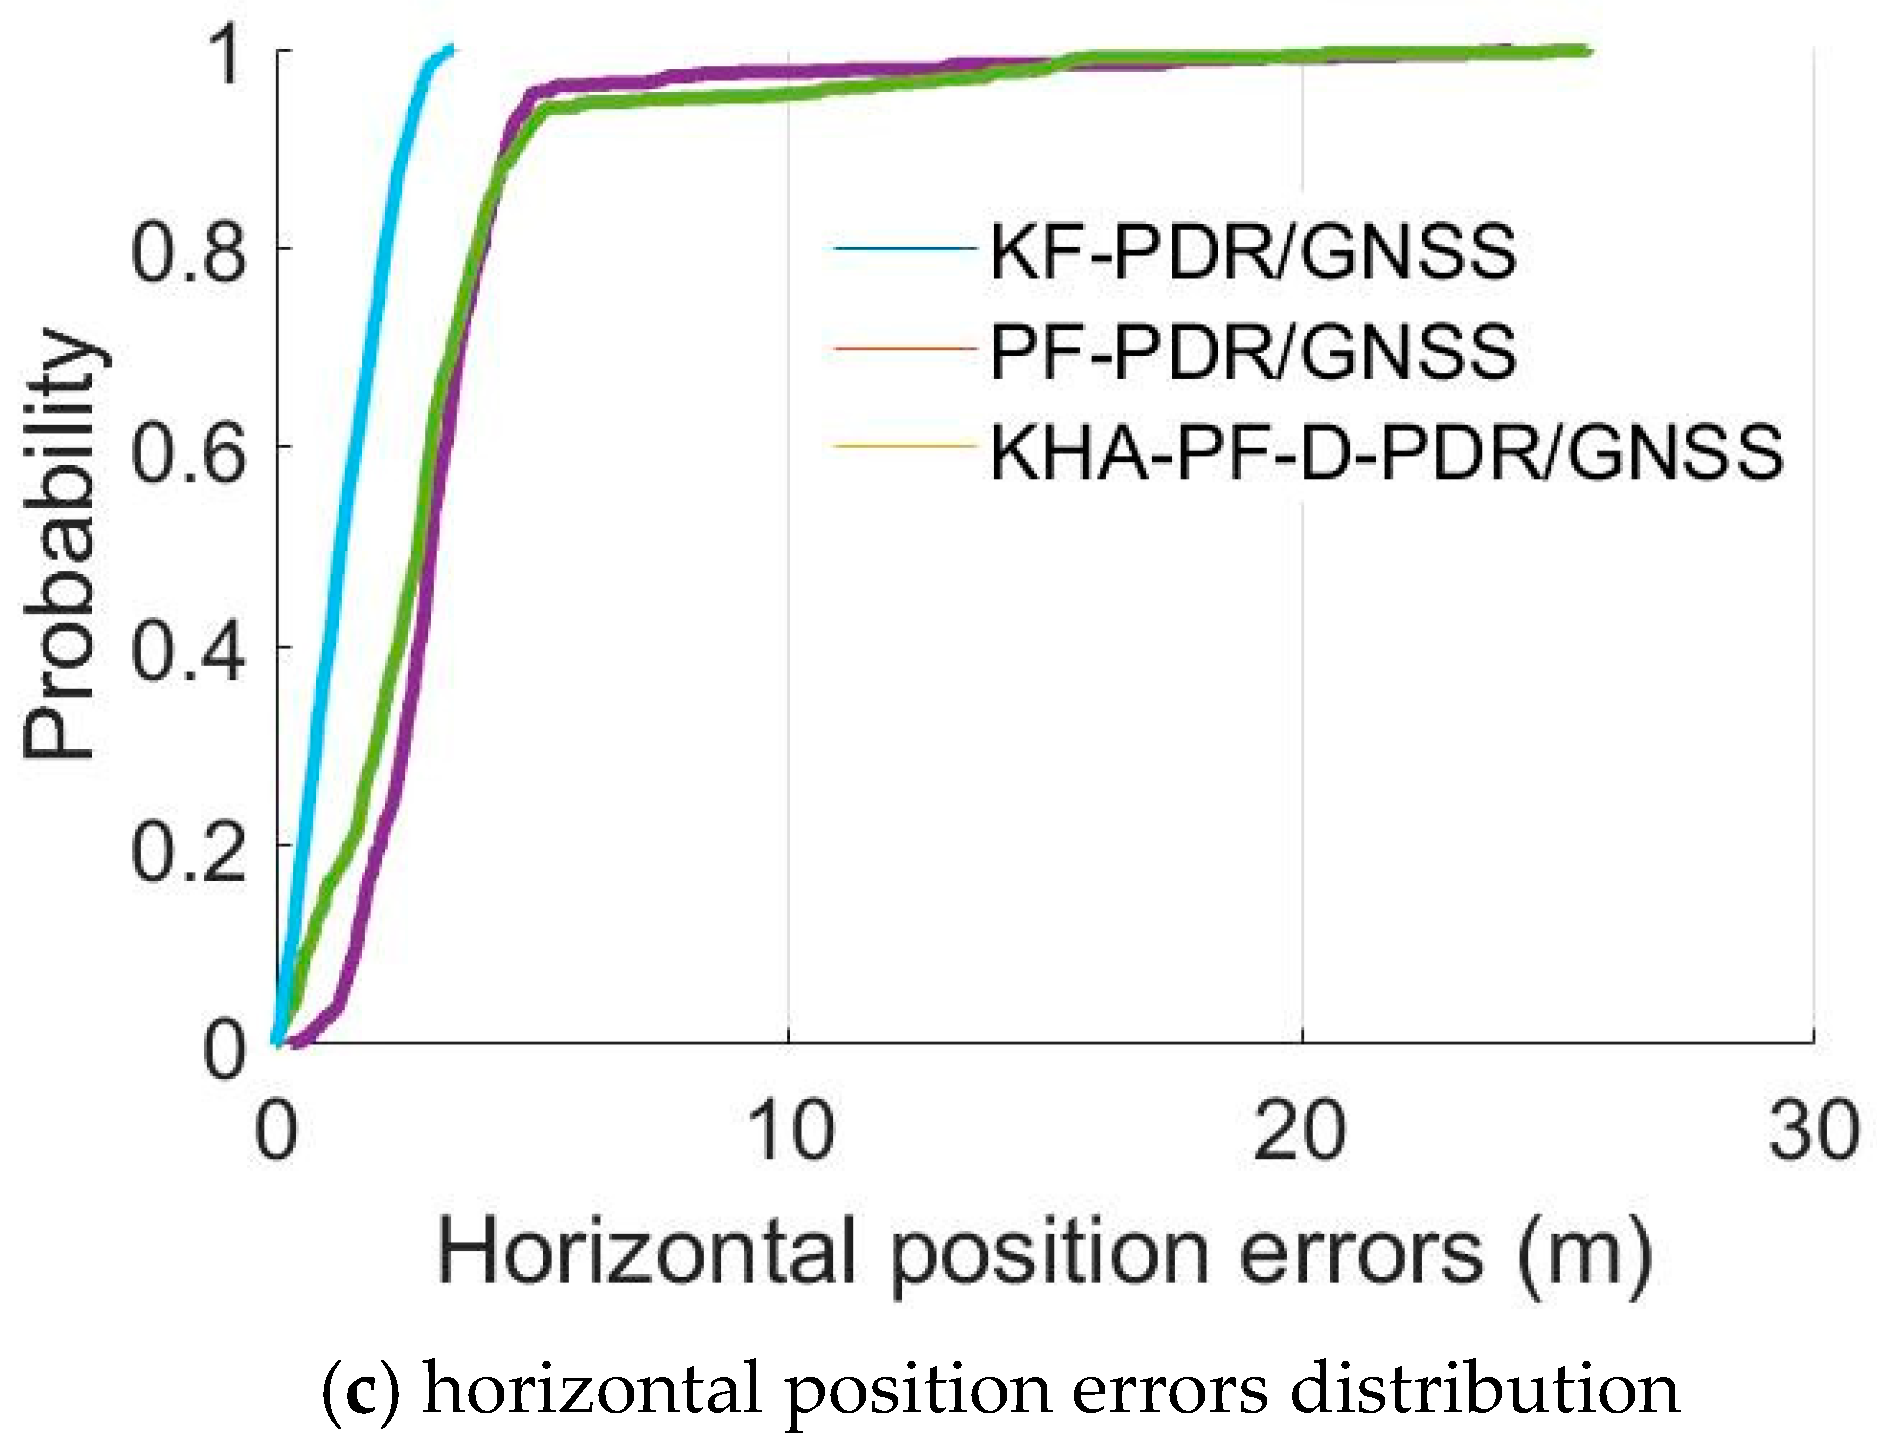
In order to fully assess the performance of the fault detection method, we collected another different sports-track dataset (Dataset#03) with a different person walking to test the proposed method. In Dataset#03, there are about 1000 steps, and we selected the first 300-step dataset to fit the model. Figure 10a presents the distance difference distribution and the fitted model. Figure 10b shows the detection probability according to the distance difference values. Here, we simulated outliers by manually adding bias to the GNSS position measurement. We added a 30 m bias to the GNSS position at the 500, 550, 600, 650, 700, 750, 800, 850, 900, 950 and 1000 epochs. The detection results are presented in Figure 11a, and it can be observed that the outliers are detected with a probability close to 100%. The horizontal position errors from the KF-PDR/GNSS, PF-PDR/GNSS and KHA-PF-D-PDR/GNSS methods are presented in Figure 11b. It can be seen that the GNSS outliers degrade the position results, and the KHA-PF-D-PDR/GNSS with the fault detection module can reduce the negative influence of the GNSS outliers. The statistical analysis results of the horizontal position data from the 301 epochs to the end are listed in Table 3. It can be seen that KHA-PF-D-PDR/GNSS performed the best. In terms of the mean values, the KHA-PF-D-PDR/GNSS mean values decreased by 52.4% compared with the PF-PDR/GNSS without the fault detection module. In addition, the median values also improved: specifically, the median values of the horizontal position errors decreased by 49.6%. Furthermore, Figure 11c presents the horizontal position errors distribution, which also supports the conclusion that the KHA-PF-D-PDR/GNSS method had better performance.
5.4. Fault Detection Experiments in Urban Areas
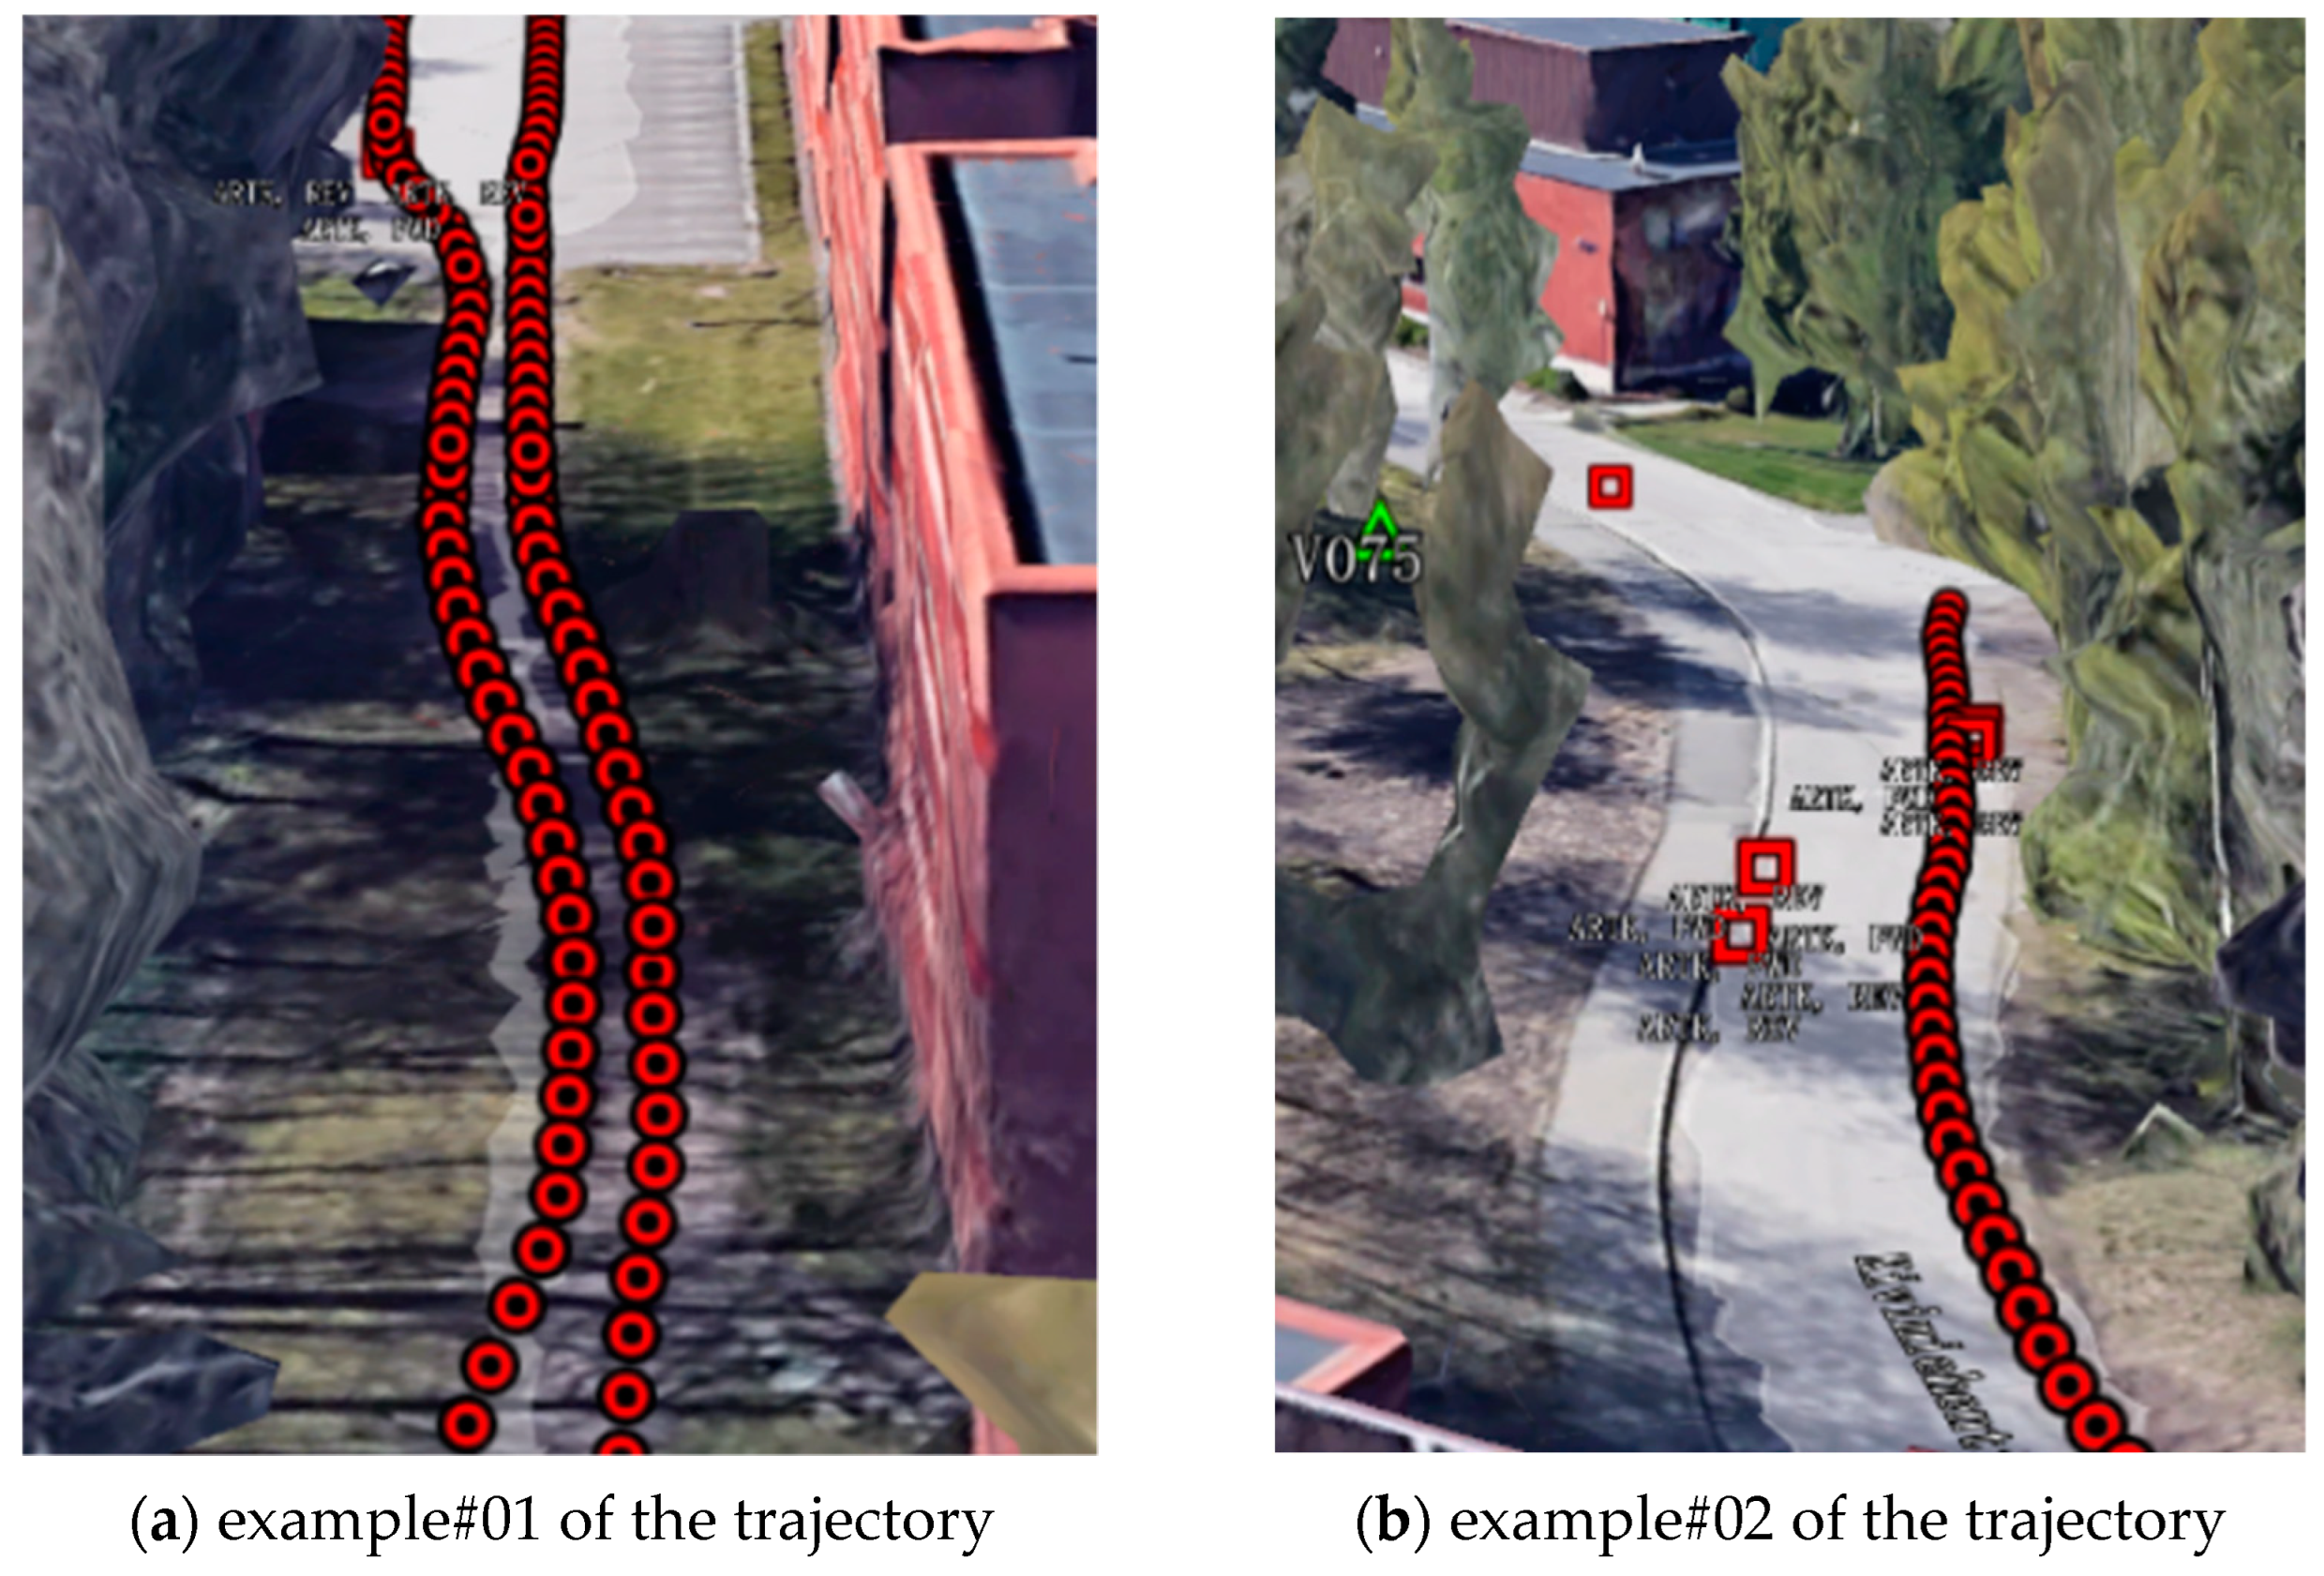
In this subsection, we analyze another dataset collected in urban areas; the experimental trajectory is described Figure 2b. Figure 12 shows the details of the surrounding environments of part of the trajectory. The surrounding tall buildings and dense forests might induce abnormal GNSS measurements.
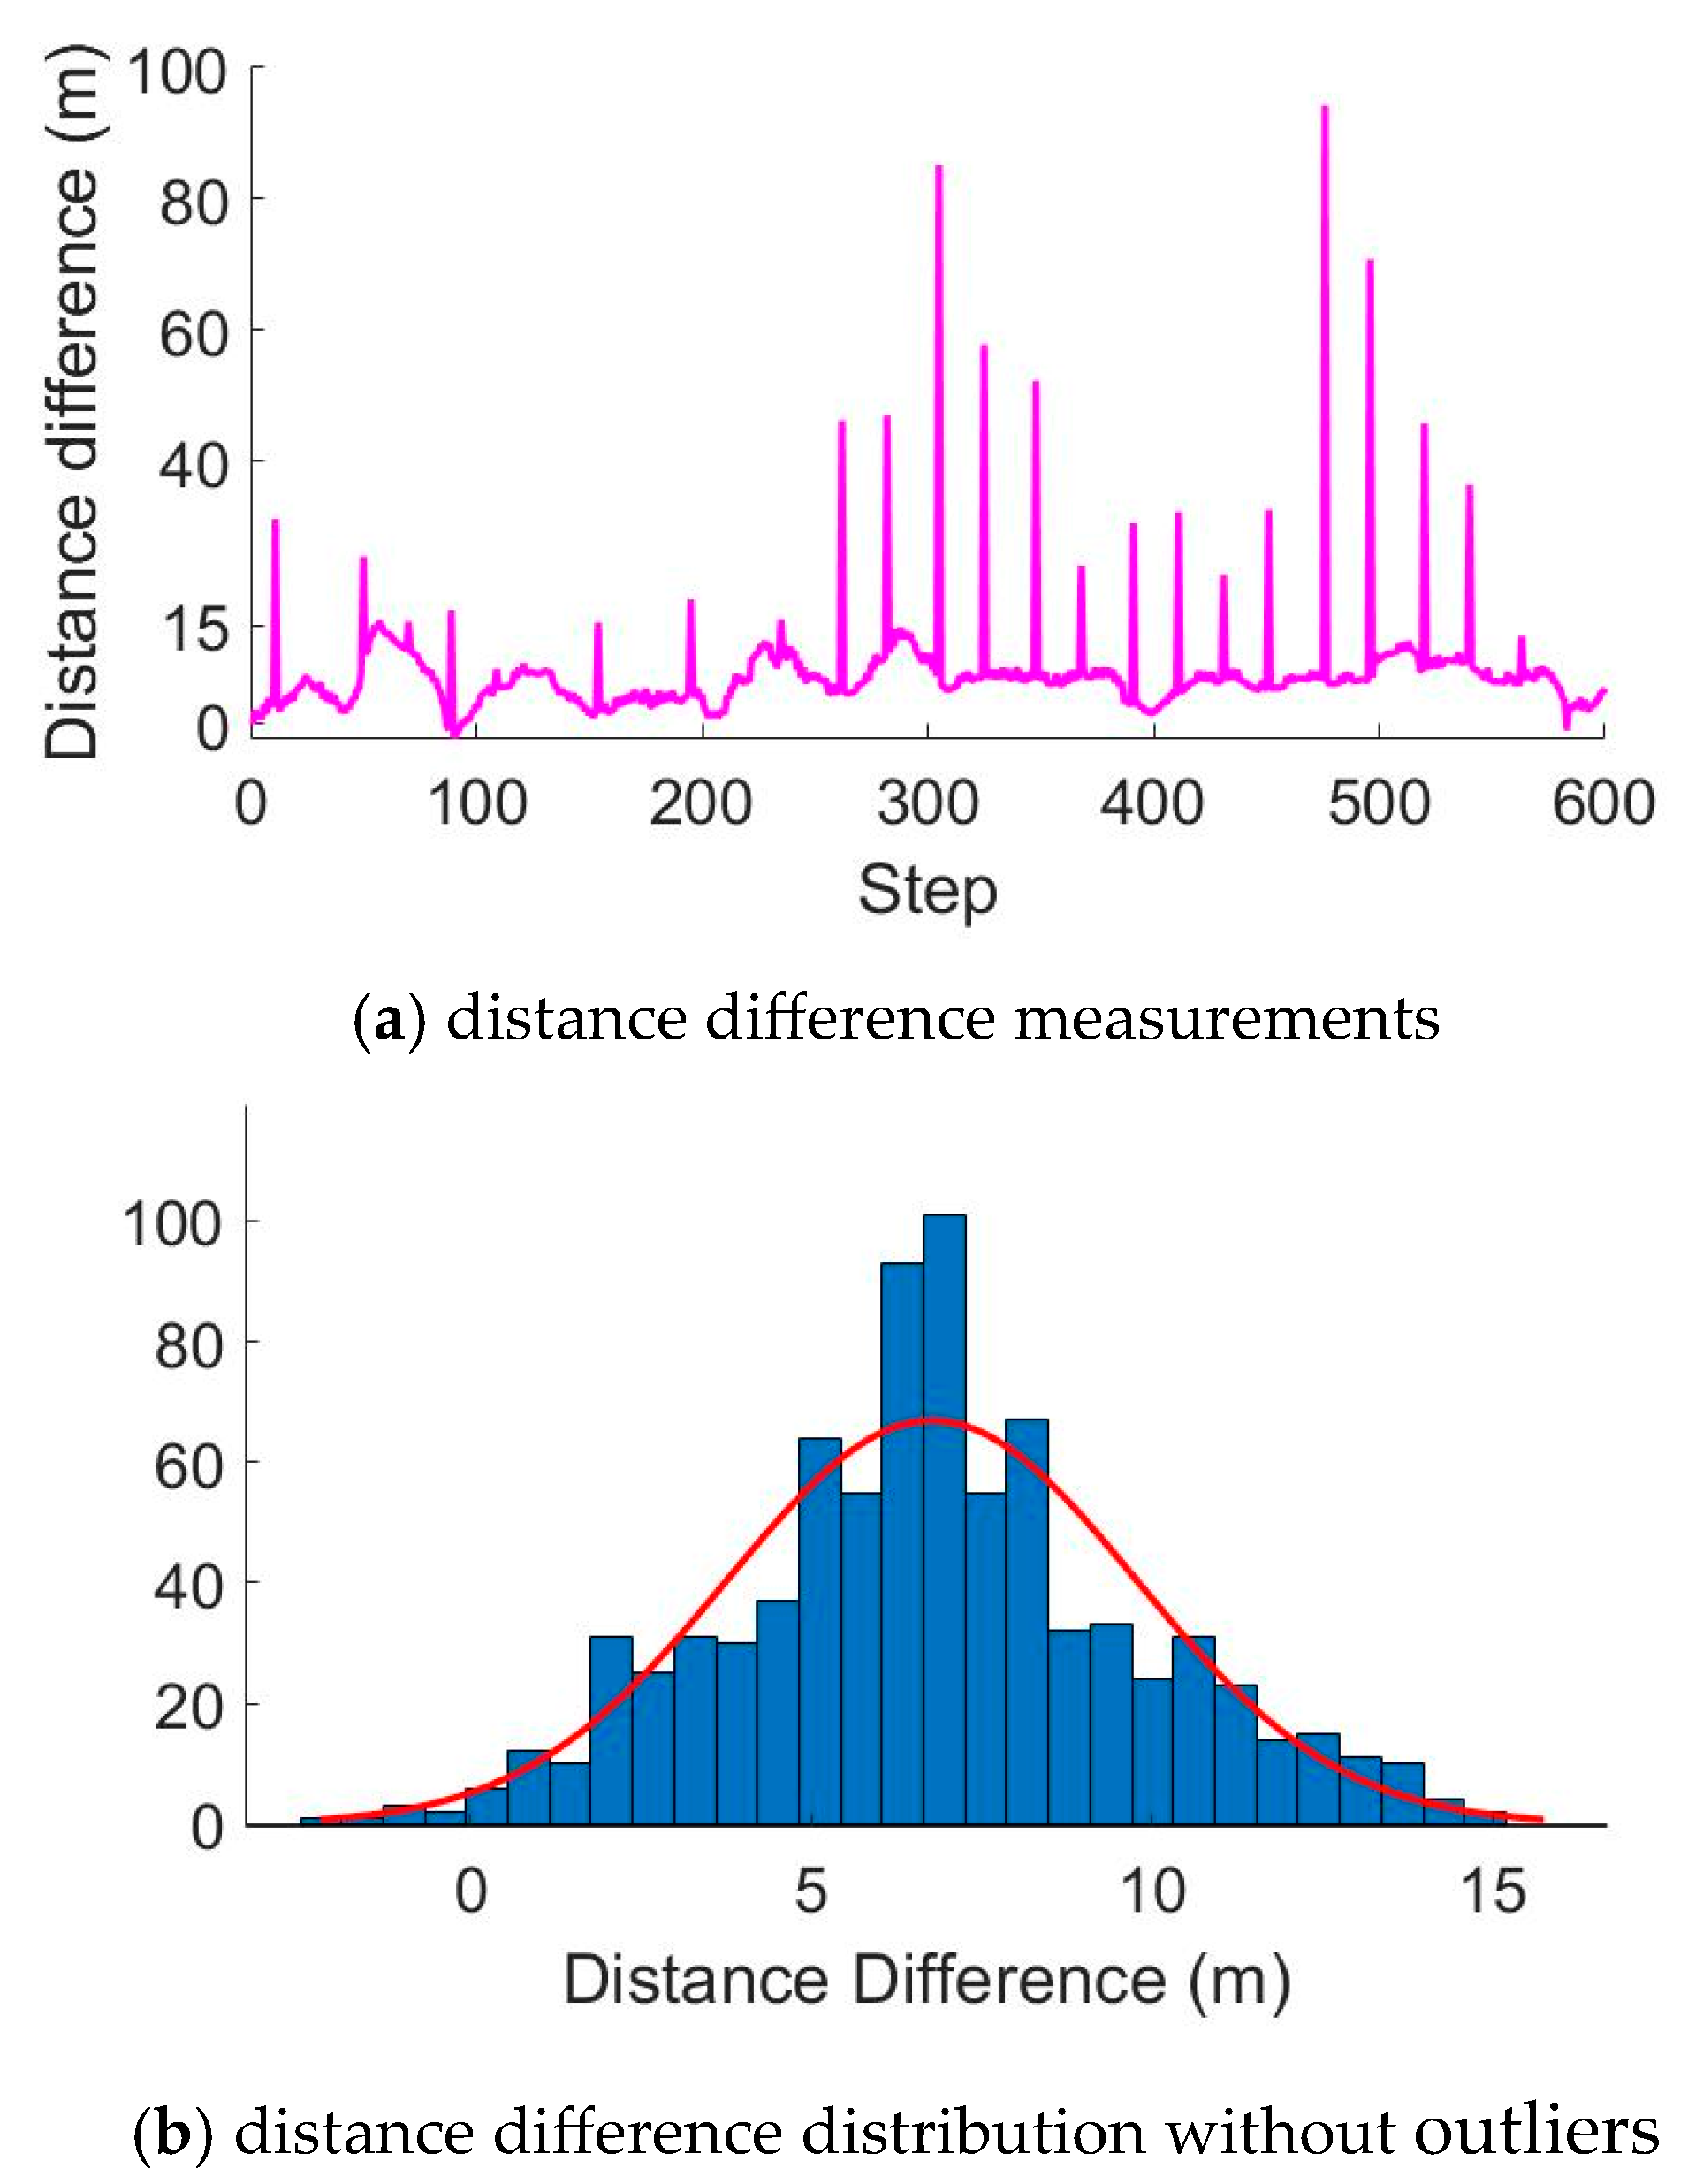
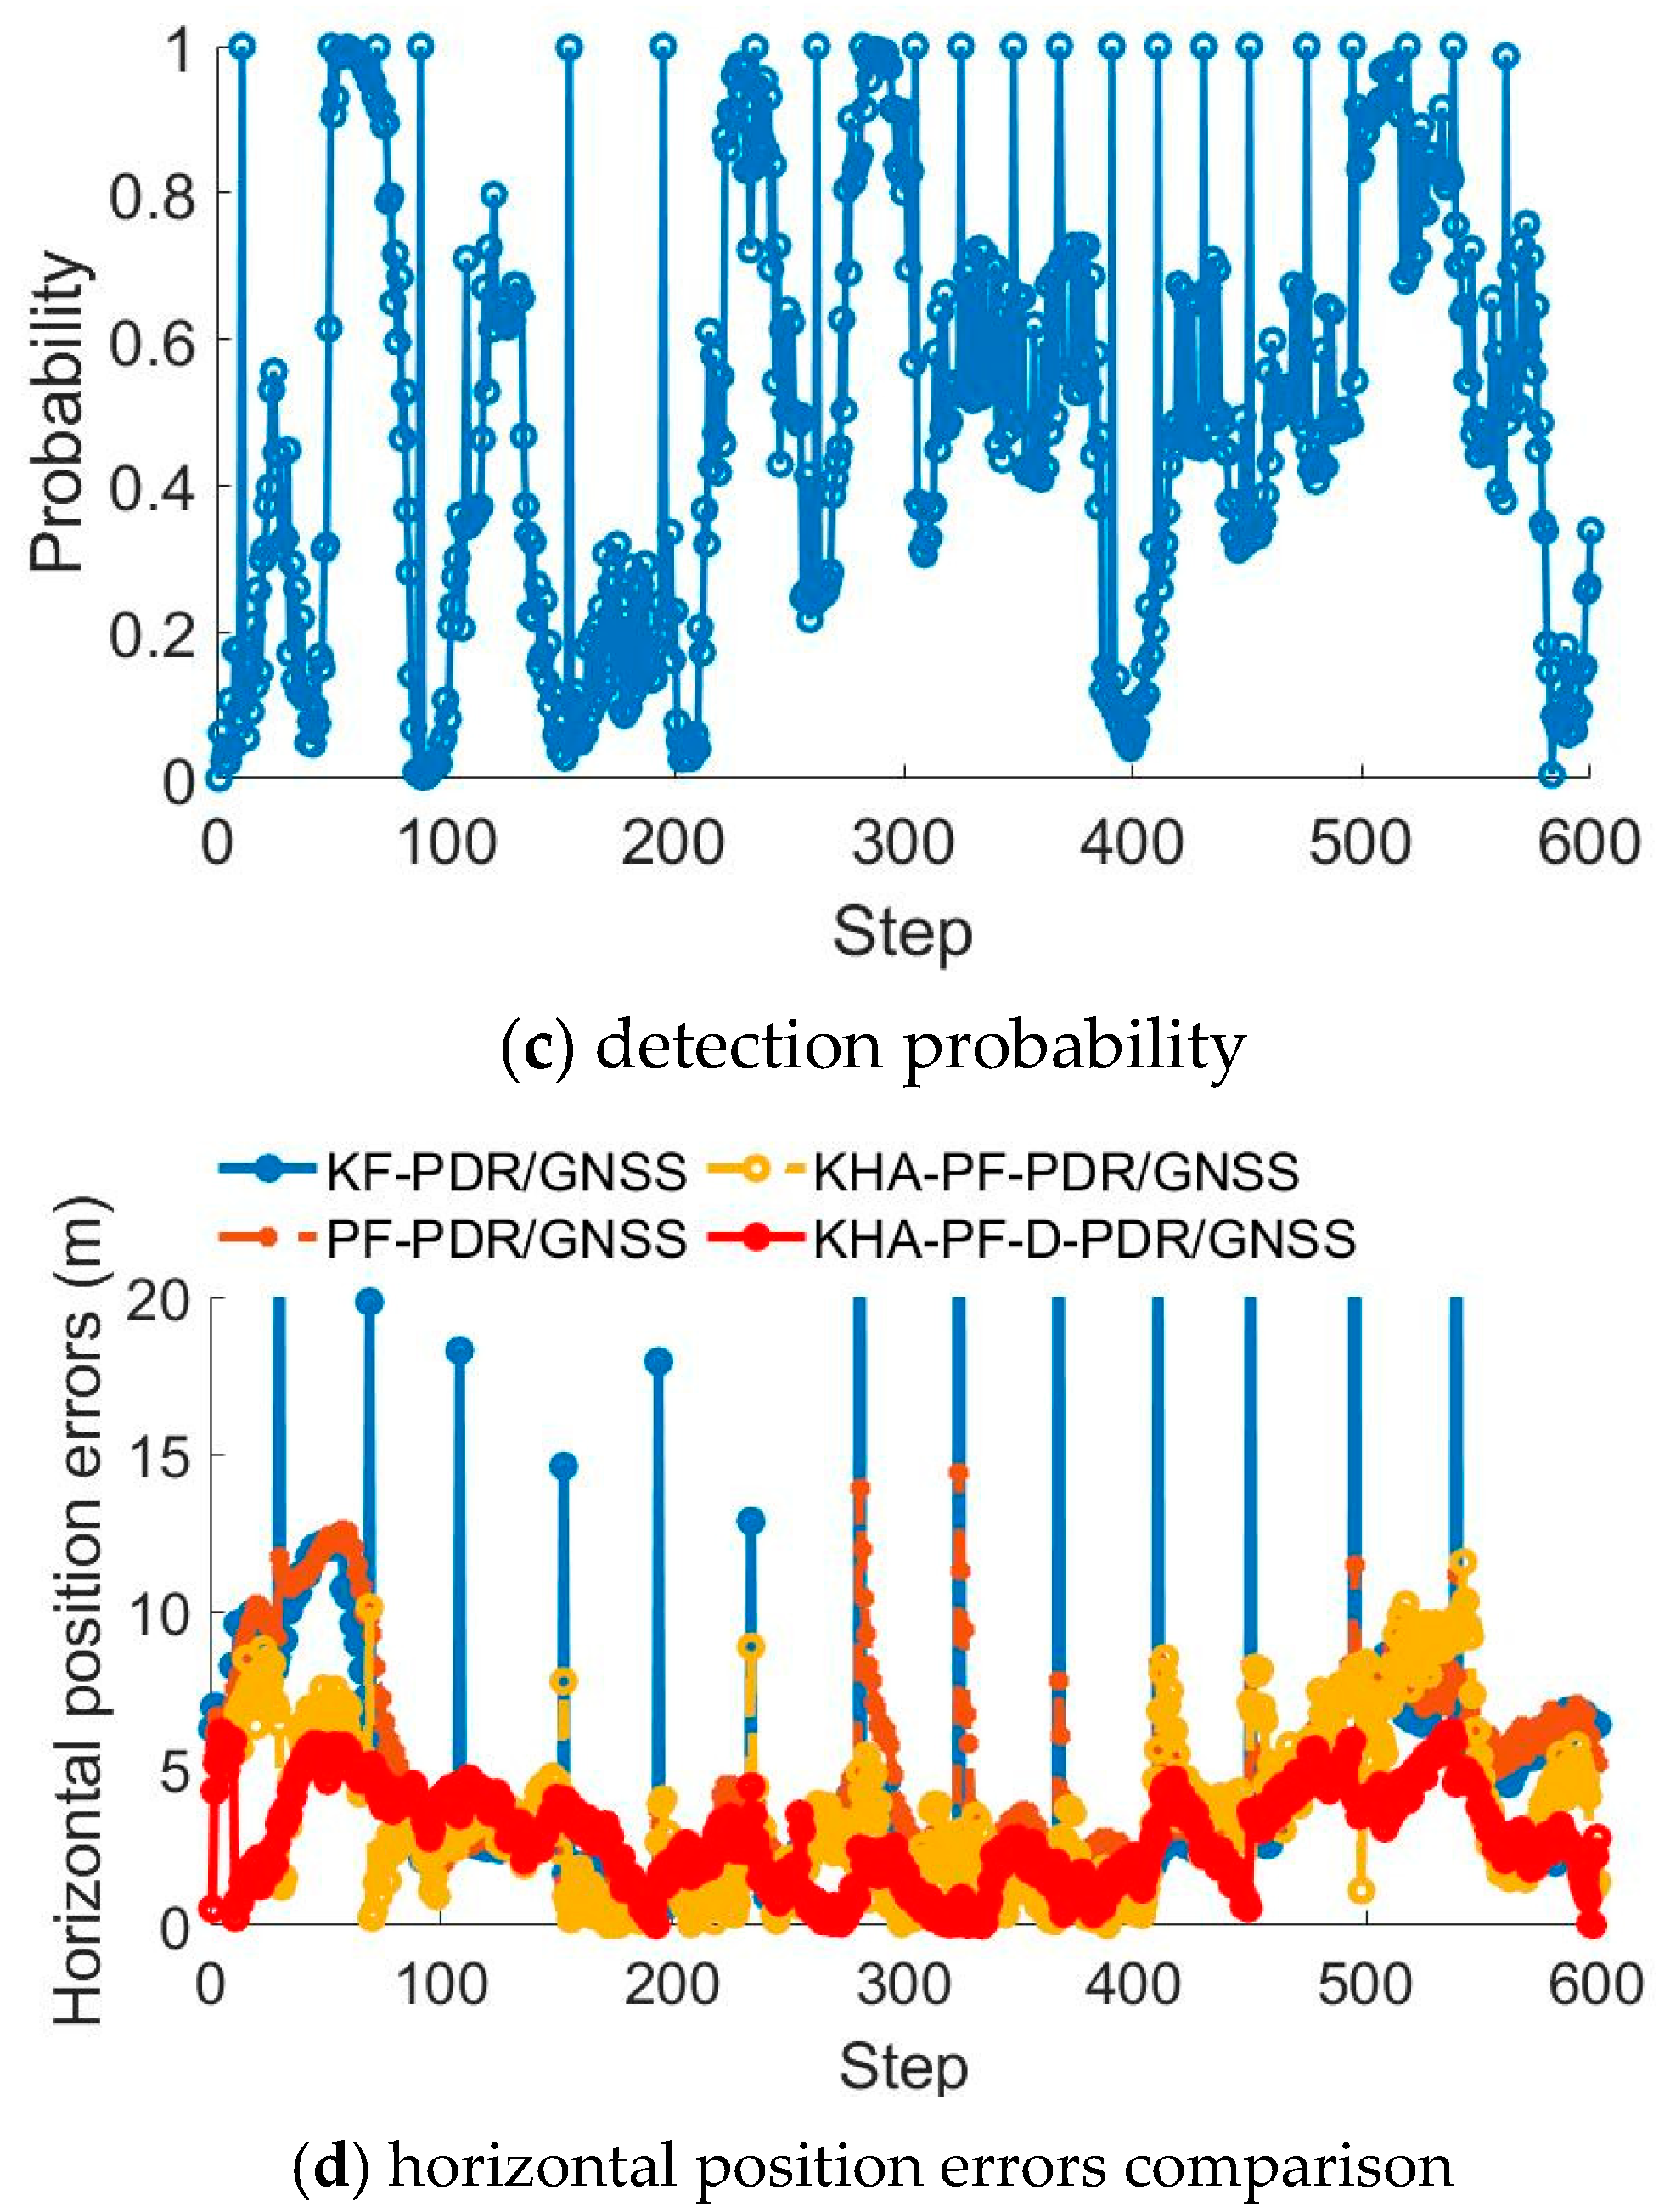
We processed this dataset collected in urban areas in which the GNSS contains outliers. The first 300 step distance difference measurements were fitted to a Gaussian model, and the results were employed to evaluate the performance of the fault detection method. Figure 13a shows the distance difference measurements, and it is obvious that there are many outliers. Here, we set the outliers threshold at 15 m. When the distance difference is larger than 15 meters, the GNSS measurement is regarded as an abnormal measurement. In our strategy, the PDR position substitutes the GNSS/PDR integration results under abnormal GNSS measurement conditions. The Gaussian fitting results based on the distance difference measurements are presented in Figure 13b. When fitting the model with the first 300 step distance difference measurements, we removed the abnormal GNSS measurements according to the pre-defined threshold.
We utilized the fitted model to detect the GNSS outliers for 600 step measurements, and the horizontal position errors comparisons are shown in Figure 13d. The remaining 300 step measurements are not included when fitting the model, but are employed as the testing data. Table 4 presents the statistical analysis of the horizontal position errors for different methods. It shows that using our proposed model, the mean values of the horizontal position errors decrease by 20.6% and the median values reduce by 13.9%.
6. Discussion and Future Work
Based on four different tests, we demonstrate that the KHA-PF and fault detection method are effective at reducing the GNSS outliers’ negative influence on position errors, and improving the robustness. However, we suggest there are still two main limitations worthy of discussion and investigation in future:
- (1)
- In this paper, we utilize the Gaussian distribution to model the distance difference measurements; in Equations (28) and (29), we assume that the pedestrian walks straight when building the model. Although the results show that the Gaussian distribution fit the data well, it would still be interesting to build a more universal model with other probability distribution models.
- (2)
- The fault detection method requires some prepared datasets to fit the model, which might be a disadvantage when extending the method to smartphones for real-time applications. Different individuals are likely to have different step length parameters in the Gaussian distribution. GNSS measurements under different conditions have different statistical parameters. It would be valuable to explore more practical solutions to improve the smartphone GNSS robustness, Artificial Intelligence (AI) is a prospective method.
In addition, we suggest the following areas are of great interest for investigations in the future.
- (1)
- In this paper, PDR is integrated with GNSS; however, there are many other sensors in smartphones, i.e., Wi-Fi, Bluetooth. Integrating more sensors to PDR/GNSS could be a more reliable solution to generate navigation solutions under different conditions.
- (2)
- In the PDR/GNSS integration method described in this paper, the position from GNSS is integrated with PDR; in fact, there is potential to carry out investigations integrating GNSS pseudo-ranges and pseudo-range rates measurements with PDR.
7. Conclusions
This paper proposes a KHA-PF-PDR/GNSS method and a probabilistic fault detection method to enhance the PDR/GNSS integrated position accuracy under different conditions. Different datasets were collected with a Huawei Mate 40 Pro to assess the proposed method, and the experimental results supported the conclusion that the KHA-PF method could improve the PDR/GNSS horizontal position accuracy, and that the probabilistic method was feasible to detect the GNSS measurements faults.
Author Contributions
Conceptualization, C.J., Y.C. and Q.X.; methodology, Z.L. and C.C.; software, writing—original draft preparation, C.J.; writing—review and editing, C.J.; project administration, Y.C. and J.H.; funding acquisition, Y.C. and J.H.; All authors have read and agreed to the published version of the manuscript.
Funding
This research was financially supported by Academy of Finland projects “Ultrafast Data Production with Broadband Photodetectors for Active Hyperspectral Space Imaging (336145)”, Forest-Human-Machine Interplay—Building Resilience, Redefining Value Networks and Enabling Meaningful Experiences (UNITE), (337656) and Strategic Research Council project. Additional support was provided by the National Natural Science Foundation of China (42101445, 62103192).
Data Availability Statement
The datasets and source codes are available by contacting the corresponding author.
Acknowledgments
This research was financially supported by Academy of Finland projects “Ultrafast Data Production with Broadband Photodetectors for Active Hyperspectral Space Imaging (336145)”, Forest-Human-Machine Interplay—Building Resilience, Redefining Value Networks and Enabling Meaningful Experiences (UNITE), (337656) and Strategic Research Council project “Competence-Based Growth Through Integrated Disruptive Technologies of 3D Digitalization, Robotics, Geospatial Information and Image Processing/Computing—Point Cloud Ecosystem (314312)”. Additional support was provided by the National Natural Science Foundation of China (42101445, 62103192).
Conflicts of Interest
The authors declare no conflict of interest.
References
- Wang, D.; Dong, Y.; Li, Z.; Li, Q.; Wu, J. Constrained MEMS-based GNSS/INS tightly coupled system with robust Kalman filter for accurate land vehicular navigation. IEEE Trans. Instrum. Meas. 2019, 69, 5138–5148. [Google Scholar] [CrossRef]
- Gong, Z.; Liu, P.; Wen, F.; Ying, R.; Ji, X.; Miao, R.; Xue, W. Graph-based adaptive fusion of GNSS and VIO under intermittent GNSS-degraded environment. IEEE Trans. Instrum. Meas. 2020, 70, 1–16. [Google Scholar] [CrossRef]
- Groves, P.D.; Jiang, Z. Height aiding, C/N0 weighting and consistency checking for GNSS NLOS and multipath mitigation in urban areas. J. Navig. 2013, 66, 653–669. [Google Scholar] [CrossRef]
- Groves, P.D.; Adjrad, M. Likelihood-based GNSS positioning using LOS/NLOS predictions from 3D mapping and pseudoranges. GPS Solut. 2017, 21, 1805–1816. [Google Scholar] [CrossRef]
- Lyu, P.; Bai, S.; Lai, J.; Wang, B.; Sun, X.; Huang, K. Optimal Time Difference-Based TDCP-GPS/IMU Navigation Using Graph Optimization. IEEE Trans. Instrum. Meas. 2021, 70, 1–10. [Google Scholar] [CrossRef]
- Li, X.; Wei, D.; Lai, Q.; Xu, Y.; Yuan, H. Smartphone-based integrated PDR/GPS/Bluetooth pedestrian location. Adv. Space Res. 2017, 59, 877–887. [Google Scholar] [CrossRef]
- Hostettler, R.; Särkkä, S. IMU and magnetometer modeling for smartphone-based PDR. In Proceedings of the 2016 International Conference on Indoor Positioning and Indoor Navigation (IPIN), Alcala de Henares, Spain, 4–7 October 2016; pp. 1–8. [Google Scholar]
- Yao, Y.; Pan, L.; Fen, W.; Xu, X.; Liang, X.; Xu, X. A robust step detection and stride length estimation for pedestrian dead reckoning using a smartphone. IEEE Sens. J. 2020, 20, 9685–9697. [Google Scholar] [CrossRef]
- Naqvib, N.Z.; Kumar, A.; Chauhan, A.; Sahni, K. Step counting using smartphone-based accelerometer. Int. J. Comput. Sci. Eng. 2012, 4, 675. [Google Scholar]
- Gu, F.; Khoshelham, K.; Shang, J.; Yu, F.; Wei, Z. Robust and accurate smartphone-based step counting for indoor localization. IEEE Sens. J. 2017, 17, 3453–3460. [Google Scholar] [CrossRef]
- Al Abiad, N.; Kone, Y.; Renaudin, V.; Robert, T. Smartstep: A Robust STEP Detection Method Based on SMARTphone Inertial Signals Driven by Gait Learning. IEEE Sens. J. 2022, 22, 12288–12297. [Google Scholar] [CrossRef]
- Rehman, A.; Shahid, H.; Afzal, M.A.; Bhatti, H.M.A. Accurate and direct GNSS/PDR integration using extended Kalman filter for pedestrian smartphone navigation. Gyroscopy Navig. 2020, 11, 124–137. [Google Scholar] [CrossRef]
- Angrisano, A.; Vultaggio, M.; Gaglione, S.; Crocetto, N. Pedestrian localization with PDR supplemented by GNSS. In Proceedings of the 2019 European Navigation Conference (ENC), Warsaw, Poland, 9–12 April 2019; pp. 1–6. [Google Scholar]
- Hsu, L.T.; Gu, Y.; Huang, Y.; Kamijo, S. Urban pedestrian navigation using smartphone-based dead reckoning and 3-D map-aided GNSS. IEEE Sens. J. 2015, 16, 1281–1293. [Google Scholar] [CrossRef]
- Jiang, C.; Chen, Y.; Chen, C.; Jia, J.; Sun, H.; Wang, T.; Hyyppä, J. Smartphone PDR/GNSS Integration via Factor Graph Optimization for Pedestrian Navigation. IEEE Trans. Instrum. Meas. 2022, 71, 1–12. [Google Scholar] [CrossRef]
- Qian, Y.; Chen, X. An improved particle filter based indoor tracking system via joint Wi-Fi/PDR localization. Meas. Sci. Technol. 2020, 32, 014004. [Google Scholar] [CrossRef]
- Liu, W.; Li, J.; Deng, Z.; Fu, X.; Cheng, Q. A calibrated-RSSI/PDR/Map integrated system based on a novel particle filter for indoor navigation. In Proceedings of the IEEE International Conference on Indoor Positioning and Indoor Navigation (IPIN), Pisa, Italy, 30 September–3 October 2019; pp. 1–8. [Google Scholar]
- Hsu, L.T.; Tokura, H.; Kubo, N.; Gu, Y.; Kamijo, S. Multiple faulty GNSS measurement exclusion based on consistency check in urban canyons. IEEE Sens. J. 2017, 17, 1909–1917. [Google Scholar] [CrossRef]
- Yang, L.; Knight, N.L.; Li, Y.; Rizos, C. Optimal fault detection and exclusion applied in GNSS positioning. J. Navig. 2013, 66, 683–700. [Google Scholar] [CrossRef]
- Sun, R.; Wang, J.; Cheng, Q.; Mao, Y.; Ochieng, W.Y. A new IMU-aided multiple GNSS fault detection and exclusion algorithm for integrated navigation in urban environments. GPS Solut. 2021, 25, 147. [Google Scholar] [CrossRef]
- Yang, L.; Li, Y.; Wu, Y.; Rizos, C. An enhanced MEMS-INS/GNSS integrated system with fault detection and exclusion capability for land vehicle navigation in urban areas. GPS Solut. 2014, 18, 593–603. [Google Scholar] [CrossRef]
- Zhang, C.; Zhao, X.; Pang, C.; Wang, Y.; Zhang, L.; Feng, B. Improved fault detection method based on robust estimation and sliding window test for INS/GNSS integration. J. Navig. 2020, 73, 776–796. [Google Scholar] [CrossRef]
- Yan, D.; Shi, C.; Li, T. An improved PDR system with accurate heading and step length estimation using handheld smartphone. J. Navig. 2022, 75, 141–159. [Google Scholar] [CrossRef]
- Jiang, C.; Chen, Y.; Chen, C.; Jia, J.; Sun, H.; Wang, T.; Hyyppa, J. Implementation and performance analysis of the PDR/GNSS integration on a smartphone. GPS Solut. 2022, 26, 81. [Google Scholar] [CrossRef]
- Liu, X.; Zhou, B.; Huang, P.; Xue, W.; Li, Q.; Zhu, J.; Qiu, L. Kalman filter-based data fusion of WI-FI RTT and PDR for indoor localization. IEEE Sens. J. 2021, 21, 8479–8490. [Google Scholar] [CrossRef]
- Shi, L.F.; Yu, M.X.; Yin, W. PDR/Geomagnetic Fusion Localization Method Based on AOFA-Improved Particle Filter. IEEE Trans. Instrum. Meas. 2022, 71, 1–9. [Google Scholar] [CrossRef]
- Gandomi, A.H.; Alavi, A.H. Krill herd: A new bio-inspired optimization algorithm. Commun. Nonlinear Sci. Numer. Simul. 2012, 17, 4831–4845. [Google Scholar] [CrossRef]
Figure 1.
Schematic illustration of the PDR.

Figure 2.
An example of the step length and its distribution.

Figure 3.
Trajectories for the two datasets.

Figure 4.
Horizontal position results.

Figure 5.
Horizontal position results.

Figure 6.
ROC curves comparison.

Figure 7.
Distance difference distributions.

Figure 8.
Detection probability results.

Figure 9.
Detection probability results.

Figure 10.
Distance difference distributions and probability.

Figure 11.
Fault detection probability and the horizontal position results.


Figure 12.
Surrounding environments of part of the trajectory.

Figure 13.
Distance difference, distribution, and the horizontal position results.


Table 1.
Statistical analysis results.
| Mean (m) | Median (m) | |
|---|---|---|
| KF-PDR/GNSS | 2.37 | 2.45 |
| PF-PDR/GNSS | 2.22 | 1.92 |
| KHA-PDR/GNSS | 1.34 | 1.16 |
Table 2.
Statistical analysis results.
| Mean (m) | Median (m) | |
|---|---|---|
| KF-PDR/GNSS | 2.04 | 2.11 |
| PF-PDR/GNSS | 2.03 | 1.74 |
| KHA-PDR/GNSS | 1.39 | 1.17 |
Table 3.
Statistical analysis results.
| Mean (m) | Median (m) | |
|---|---|---|
| KF-PDR/GNSS | 3.36 | 3.02 |
| PF-PDR/GNSS | 3.17 | 2.78 |
| KHA-PF-D-PDR/GNSS | 1.51 | 1.40 |
Table 4.
Statistical analysis of the horizontal position errors.
| Mean (m) | Median (m) | |
|---|---|---|
| KF-PDR/GNSS | 4.76 | 2.90 |
| PF-PDR/GNSS | 4.73 | 3.67 |
| KHA-PDR/GNSS | 3.54 | 3.09 |
| KHA-PDR-D-/GNSS | 2.81 | 2.66 |
Disclaimer/Publisher’s Note: The statements, opinions and data contained in all publications are solely those of the individual author(s) and contributor(s) and not of MDPI and/or the editor(s). MDPI and/or the editor(s) disclaim responsibility for any injury to people or property resulting from any ideas, methods, instructions or products referred to in the content. |
© 2023 by the authors. Licensee MDPI, Basel, Switzerland. This article is an open access article distributed under the terms and conditions of the Creative Commons Attribution (CC BY) license (https://creativecommons.org/licenses/by/4.0/).
Share and Cite
MDPI and ACS Style
Jiang, C.; Chen, Y.; Liu, Z.; Xia, Q.; Chen, C.; Hyyppa, J. A Probabilistic Method-Based Smartphone GNSS Fault Detection and Exclusion System Utilizing PDR Step Length. Remote Sens. 2023, 15, 4993. https://doi.org/10.3390/rs15204993
AMA Style
Jiang C, Chen Y, Liu Z, Xia Q, Chen C, Hyyppa J. A Probabilistic Method-Based Smartphone GNSS Fault Detection and Exclusion System Utilizing PDR Step Length. Remote Sensing. 2023; 15(20):4993. https://doi.org/10.3390/rs15204993
Chicago/Turabian StyleJiang, Changhui, Yuwei Chen, Zuoya Liu, Qingyuan Xia, Chen Chen, and Juha Hyyppa. 2023. "A Probabilistic Method-Based Smartphone GNSS Fault Detection and Exclusion System Utilizing PDR Step Length" Remote Sensing 15, no. 20: 4993. https://doi.org/10.3390/rs15204993
Note that from the first issue of 2016, this journal uses article numbers instead of page numbers. See further details here.