Technical Note

Enhancing Water Depth Estimation from Satellite Images Using Online Machine Learning: A Case Study Using Baidu Easy-DL with Acoustic Bathymetry and Sentinel-2 Data

1
School of Information Science and Technology, Hainan Normal University, Haikou 571158, China
2
States Key Laboratory of Satellite Ocean Environment Dynamics, Second Institute of Oceanography, State Oceanic Administration, Hangzhou 310012, China
3
China Siwei Surveying and Mapping Technology Co., Ltd., Beijing 100048, China
4
School of Marine Science, Shanghai Ocean University, Shanghai 201306, China
5
Marine Surveying and Mapping Engineering and Technology Research Center, Shanghai 201306, China
*
Author to whom correspondence should be addressed.
Remote Sens. 2023, 15(20), 4955; https://doi.org/10.3390/rs15204955
Submission received: 20 August 2023 / Revised: 28 September 2023 / Accepted: 10 October 2023 / Published: 13 October 2023
(This article belongs to the Special Issue Artificial Intelligence for Ocean Remote Sensing)

Abstract

:
Water depth estimation is paramount in various domains, including navigation, environmental monitoring, and resource management. Traditional depth measurement methods, such as bathymetry, can often be expensive and time-consuming, especially in remote or inaccessible areas. This study delves into the application of machine learning techniques, specifically focusing on the Baidu Easy DL model for water depth estimation leveraging satellite imagery. Utilizing Sentinel-2 satellite data over Rushikonda Beach in India and processing it into remote sensing reflectance using ACOLITE software, this research compares the performance of several machine learning algorithms, including the Stumpf model, Log-Linear model, and the Baidu Easy DL model, for accurate depth estimation. The results indicate that the Easy-DL model outperforms traditional methods, particularly excelling in the 0–11 m depth range. This study showcases the substantial potential of machine learning in remote sensing, offering robust water depth estimates, even in complex coastal environments. Furthermore, it underscores the critical role of comprehensive training datasets and ensemble learning techniques in enhancing accuracy. This research opens avenues for the further exploration of machine learning applications in remote sensing and highlights the promising prospects of online model APIs when streamlining remote sensing data processing.

Graphical Abstract

1. Introduction

Water depth is an important parameter for a wide range of applications, including navigation, resource management, and environmental monitoring [1]. Accurate and up-to-date information on water depth is essential for ensuring safe navigation, managing fisheries and other aquatic resources, and monitoring changes in the environment [2]. Remote sensing is a powerful tool that allows us to gather information about the Earth’s surface without physically being there. It involves the use of satellites, aircraft, or drones to collect data on the environment using sensors that detect reflected or emitted electromagnetic radiation [3,4]. One of the many applications of remote sensing is water depth inversion, which is the process of estimating the depth of a body of water based on the characteristics of reflected light [5,6].
Traditionally, water depth inversion has been performed using methods such as bathymetry, which involves physically measuring the depth of a body of water using sonar or other instruments [7,8]. However, these methods can be time-consuming and expensive and may not always be feasible in remote or inaccessible areas. Remote sensing offers a more efficient and cost-effective alternative, allowing us to estimate water depth over large areas quickly and accurately [9].
In recent years, machine learning has emerged as a powerful tool for data analysis, with applications in a wide range of fields. Machine learning algorithms can learn from data to make predictions or decisions without being explicitly programmed to perform this [10]. This makes them well-suited for tasks such as water depth inversion, where traditional methods may be inadequate. Machine learning is a rapidly growing field that has seen many advances in recent years, particularly with the availability of online resources [11]. These resources, such as online courses, tutorials, and documentation, have made it easier for individuals and organizations to learn about and apply machine-learning techniques to various fields, including remote sensing bathymetry [12,13].
Large models, particularly large language models, have seen rapid development in recent years. These models are trained on vast amounts of data and have a large number of parameters, allowing them to generate human-like text and perform a wide range of tasks. Some examples of large language models include GPT-3, Megatron-Turing NLG, and Gopher [14]. Large models have also been applied to the field of remote sensing data processing. Remote sensing involves the collection and analysis of data regarding the Earth’s surface using satellites, aircraft, or drones. The amount of data generated by remote sensing is increasing dramatically, creating challenges for storage, analysis, and visualization [15]. To address these challenges, researchers have developed frameworks and systems that process remote sensing big data using large models and parallel processing. These frameworks provide scalability, flexibility, and generalization without dependency on specific data or processing techniques [15,16]. They also provide reasonable results to quality criteria, such as the response time, efficiency, and performance development of large models, which have had a significant impact on many fields, including remote sensing data processing. These models offer new capabilities for analyzing and understanding large amounts of data, leading to new insights and discoveries [15,16].
Some people are currently using online remote sensing platforms to conduct some remote sensing research, such as using the Google Earth Engine [17]. However, the application of online AI remote sensing is limited by the confidentiality of field data and the legal review of countries where scientists are located. Baidu Easy-DL is a zero-threshold AI development platform that provides a simple and easy way to customize and deploy AI models. One of its features is table data prediction, which helps users discover potential patterns from tabular data through machine learning techniques, thereby creating machine learning models, processing new data based on machine learning models, and generating predictive results for business applications [18].
DL’s easily structured data supports one-click customization, automatically processes data, generates machine learning models, and can achieve scenarios such as table data prediction. This feature can be used to solve binary classifications, multi-classification, regression, and other problems and is suitable for scenarios such as customer churn prediction, fraud detection, and price prediction. The Baidu Easy DL platform provides a simple and easy way to customize and deploy AI models, where the prediction feature of table data can help users quickly mine hidden patterns in data and generate predictive results for business applications.
This article employs Baidu Easy-DL to construct a water depth inversion model. Initially, satellite data were transformed into tabular data. Subsequently, the structured data processing platform developed by Baidu Easy DL was utilized for data prediction, culminating in the acquisition of predicted water depth values. While Baidu Easy DL’s structured data prediction does not strictly qualify as a large model platform, it offers valuable insights for future remote sensing large model platforms when processing remote sensing data.
The objective of this paper is to explore the potential of online general artificial intelligence models in handling remote sensing tasks. The structure of this paper is as follows: an introduction, followed by “Section 2”, which presents data “Section 3”, which outlines the methodology “Section 4”, which discusses the results “Section 5”, which engages in a discourse about these findings, and finally Section 6. This structure allows readers to gain a clear understanding of the experimental setup, execution, and results and facilitates discussion on potential future research directions.

2. Experimental Data Collection

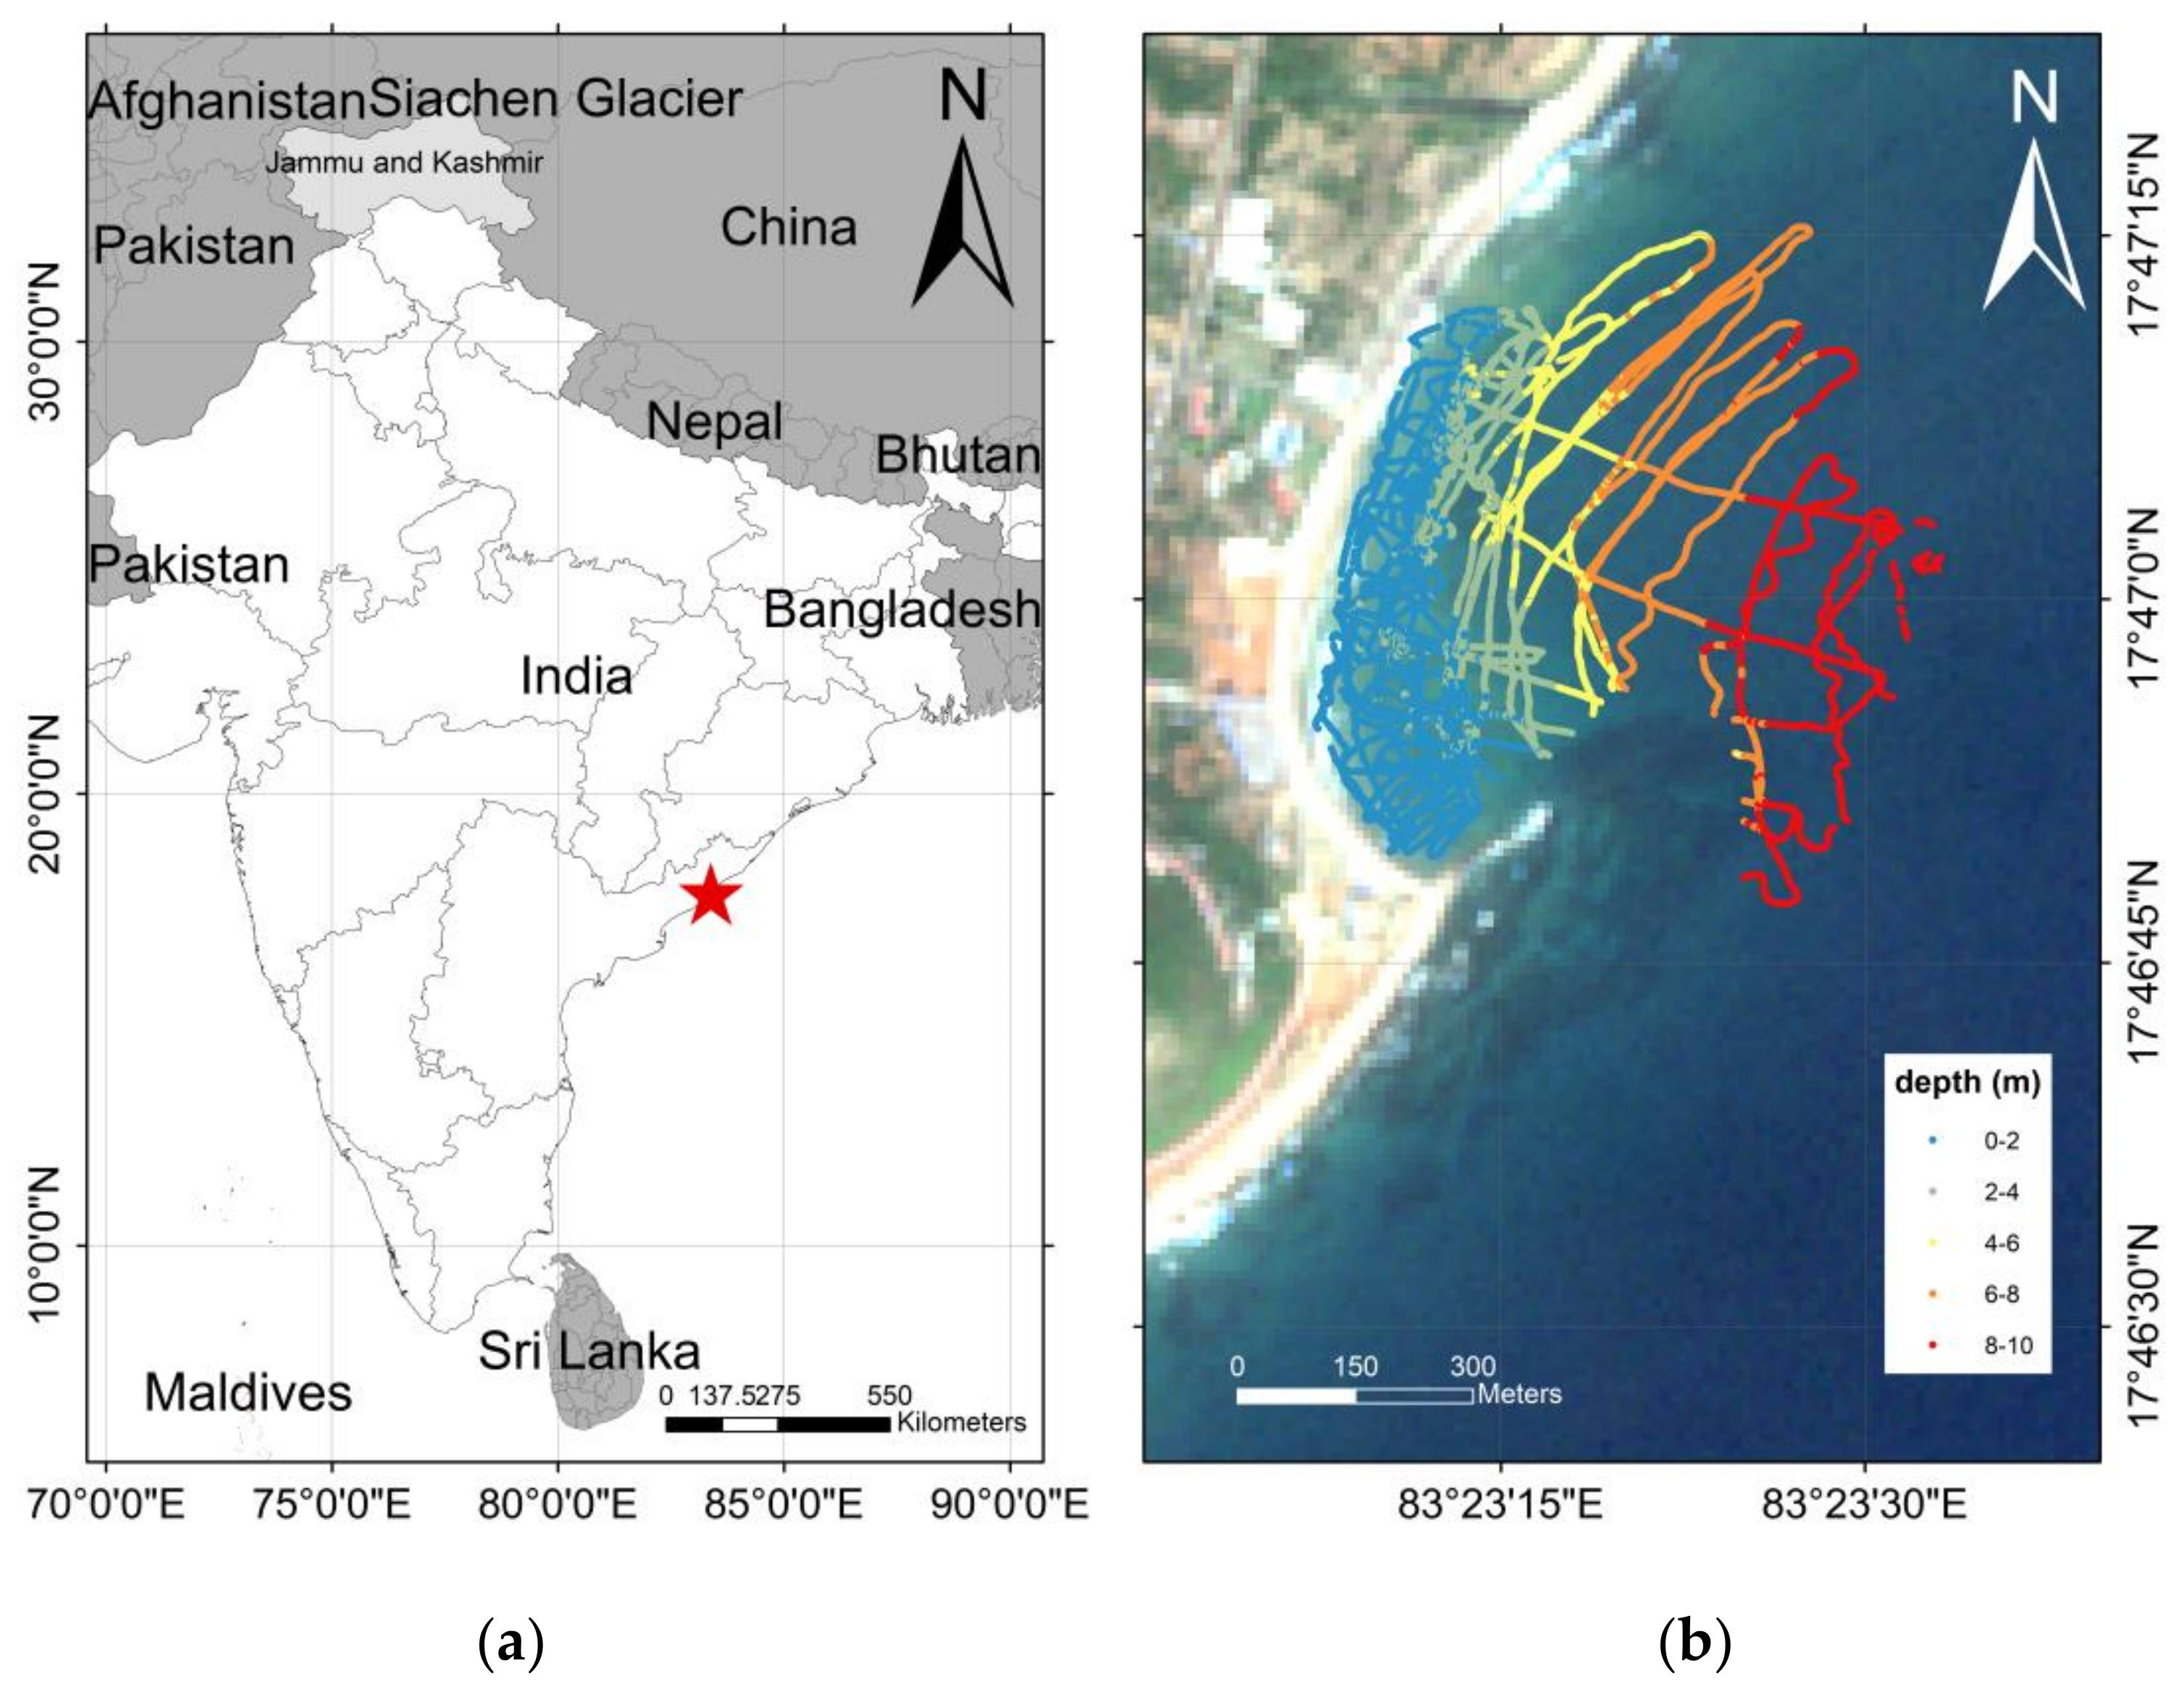
2.1. The Study Areas and Sentinel-2 Imagery

We acquired bathymetric data (https://github.com/wuzhenghan2022/ESAY-DL.git, accessed on 5 October 2023) using a modified jet ski with an acoustic survey system at Rushikonda Beach, a scenic c-shaped bay on the east coast of India, located approximately between Chennai and Kolkata (see Figure 1) [19]. The coastal area is mainly composed of fine sand with a median grain size of 0.45–0.5 mm [19]. Moreover, some parts of the beach have submerged and protruding rocky outcrops. Notably, Rushikonda Beach was selected as one of the 12 pilot beaches in India for the “Blue Flag Certification” by the Ministry of Environment, Forest and Climate Change (MoEF and CC). Therefore, the continuous monitoring of nearshore processes is important for tourism activities and safety.
In our study, we used data obtained on 24 November 2018. We processed the images into remote sensing reflectance (Rrs or Rw) [17,18] using the latest ACOLITE software (Python 20190326.0 version) provided by the Royal Belgian Institute of Natural Sciences (RBINS) [20,21]. ACOLITE provides Rrs data (sr-1) for all visible and near-infrared bands, which are resampled to a 10 m spatial resolution [19]. We predicted the bathymetry map based on the image data of multiple spectral reflectance bands (bands 1, 2, 3, 4, 5, 6, 8, and 10) from Sentinel-2 [19]. All spectral images were resampled to a resolution of 10 × 10 m. Finally, we mitigated the sun glint effect by resampling with an S2 view in ACOLITE software (Version 20210802.0) (Figure 2).

2.2. In-Situ Data

We conducted two acoustic surveys on 23–24 October 2018 at Rushikonda using a modified jet ski to obtain bathymetric data. The jet ski was equipped with a 200 kHz CEESCOPETM echosounder and a 10 Hz Novatel OEMStar L1/L2 GNSS receiver, both provided by CEE Hydro systems. The echosounder had a high accuracy, with a vertical error of 1 cm ± 0.1% for the depth. The GNSS receiver had a horizontal error of about ±0.5 m. To improve the quality of data, the echosounder also had an inertial motion unit (IMU) sensor to record the three-dimensional motion. The IMU sensor had impressive accuracy, including roll and pitch angles ±0.1° (over 360°), heading angle ±1°, and heave distance ±5 cm. We applied wave correction to the echosounder depth data using heave data from the IMU sensor, following the method of Dugan et al. [22]. We applied a tidal correction to depth data using the tide gauge data located near Visakhapatnam Harbor (17°40′60″N, 83°16′60″E).

3. Proposed Machine Learning Algorithms for Bathymetry Mapping

3.1. Stumpf Model

In order to avoid the situation where the radiance received by the optical remote sensor and the radiance in the deep water was negative, Stumpf et al. [23]. proposed a model based on the log conversion ratio:
Z = m 1 ln n R λ i ln n R λ i + m 0
where m0 and m1 are the regression coefficients; n is a fixed constant, usually taken as 1000; R (λi) and R (λj) are the remote sensing reflectance of the blue band i and the green band j.

3.2. Log-Linear Model

The dual-band log-linear model formula is as follows [5,6,24]:
Z = a 1 ln L λ i L λ i + a 2 ln L λ j L λ j + a 3
Here, a1, a2, and a3 are the regression coefficients; L (λi) and L (λj) are the radiance of the blue band i and the green band j; L∞(λi) and L∞(λj) are the radiance of each band in deep water.

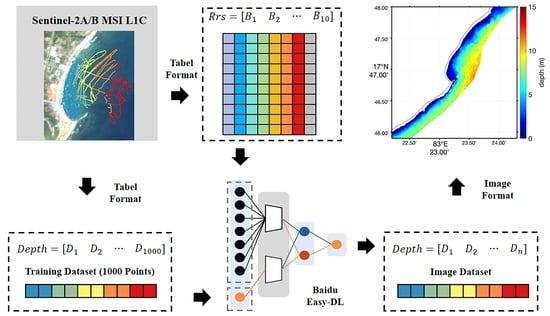
3.3. Baidu Easy DL Model

Easy-DL is an AI development platform for developers and data scientists, which was designed to help them quickly build high-quality AI models and implement their commercial applications. Its table prediction feature is an important part of the platform, used for predictions based on a given data table.
The table prediction feature consists of the following steps:
(a)
Data preparation: Upload or import the data table that is to be used for prediction. Easy-DL supports multiple data formats, such as CSV, Excel, JSON, etc.
(b)
Model selection: select a suitable pre-trained model for prediction based on the characteristics of the table data and the prediction requirements.
(c)
Data preprocessing: preprocess the table data, including data cleaning, feature selection, data enhancement, and table format conversion, to improve the training effect of the model.
(d)
Model training: Based on the uploaded table data and the selected model, Easy-DL automatically performs model training. During the training process, you can monitor the training progress and view performance indicators during training.
(e)
Model evaluation: after the model training is complete, Easy-DL provides a series of evaluation indicators, such as accuracy, precision, and recall, to evaluate the performance of the model.
(f)
Model deployment: After model evaluation is complete, the trained model can be deployed to the production environment. Easy-DL provides multiple deployment options, such as API, SDK, and a custom code, to meet different application needs.
(g)
Prediction: The deployed model can be applied to actual scenarios for prediction. Through the API or SDK provided by Easy-DL, the prediction of the table can be easily performed.
The table prediction feature allows developers to build and apply AI models for prediction without in-depth knowledge of AI technology and algorithms. It is suitable for various scenarios, such as commercial prediction, disease prediction, recommendation systems, etc. By using Easy-DL’s table prediction feature, developers can quickly and efficiently implement the development and deployment of AI applications.

3.4. Accuracy Evaluation Methods

The accuracy evaluation indexes of water depth accuracy are the mean absolute error (MAE), the mean relative error (MRE), and the root mean square error (RMSE), and the corresponding formula areas are as follows [7]:
M A E = i = 1 n Z i Z i n
M R E = i = 1 n Z i Z i / Z i n
R M S E = i = 1 n Z i Z i 2 n
where zi is the estimated water depth; Z i is the actual water depth; and n is the number of water depth points.

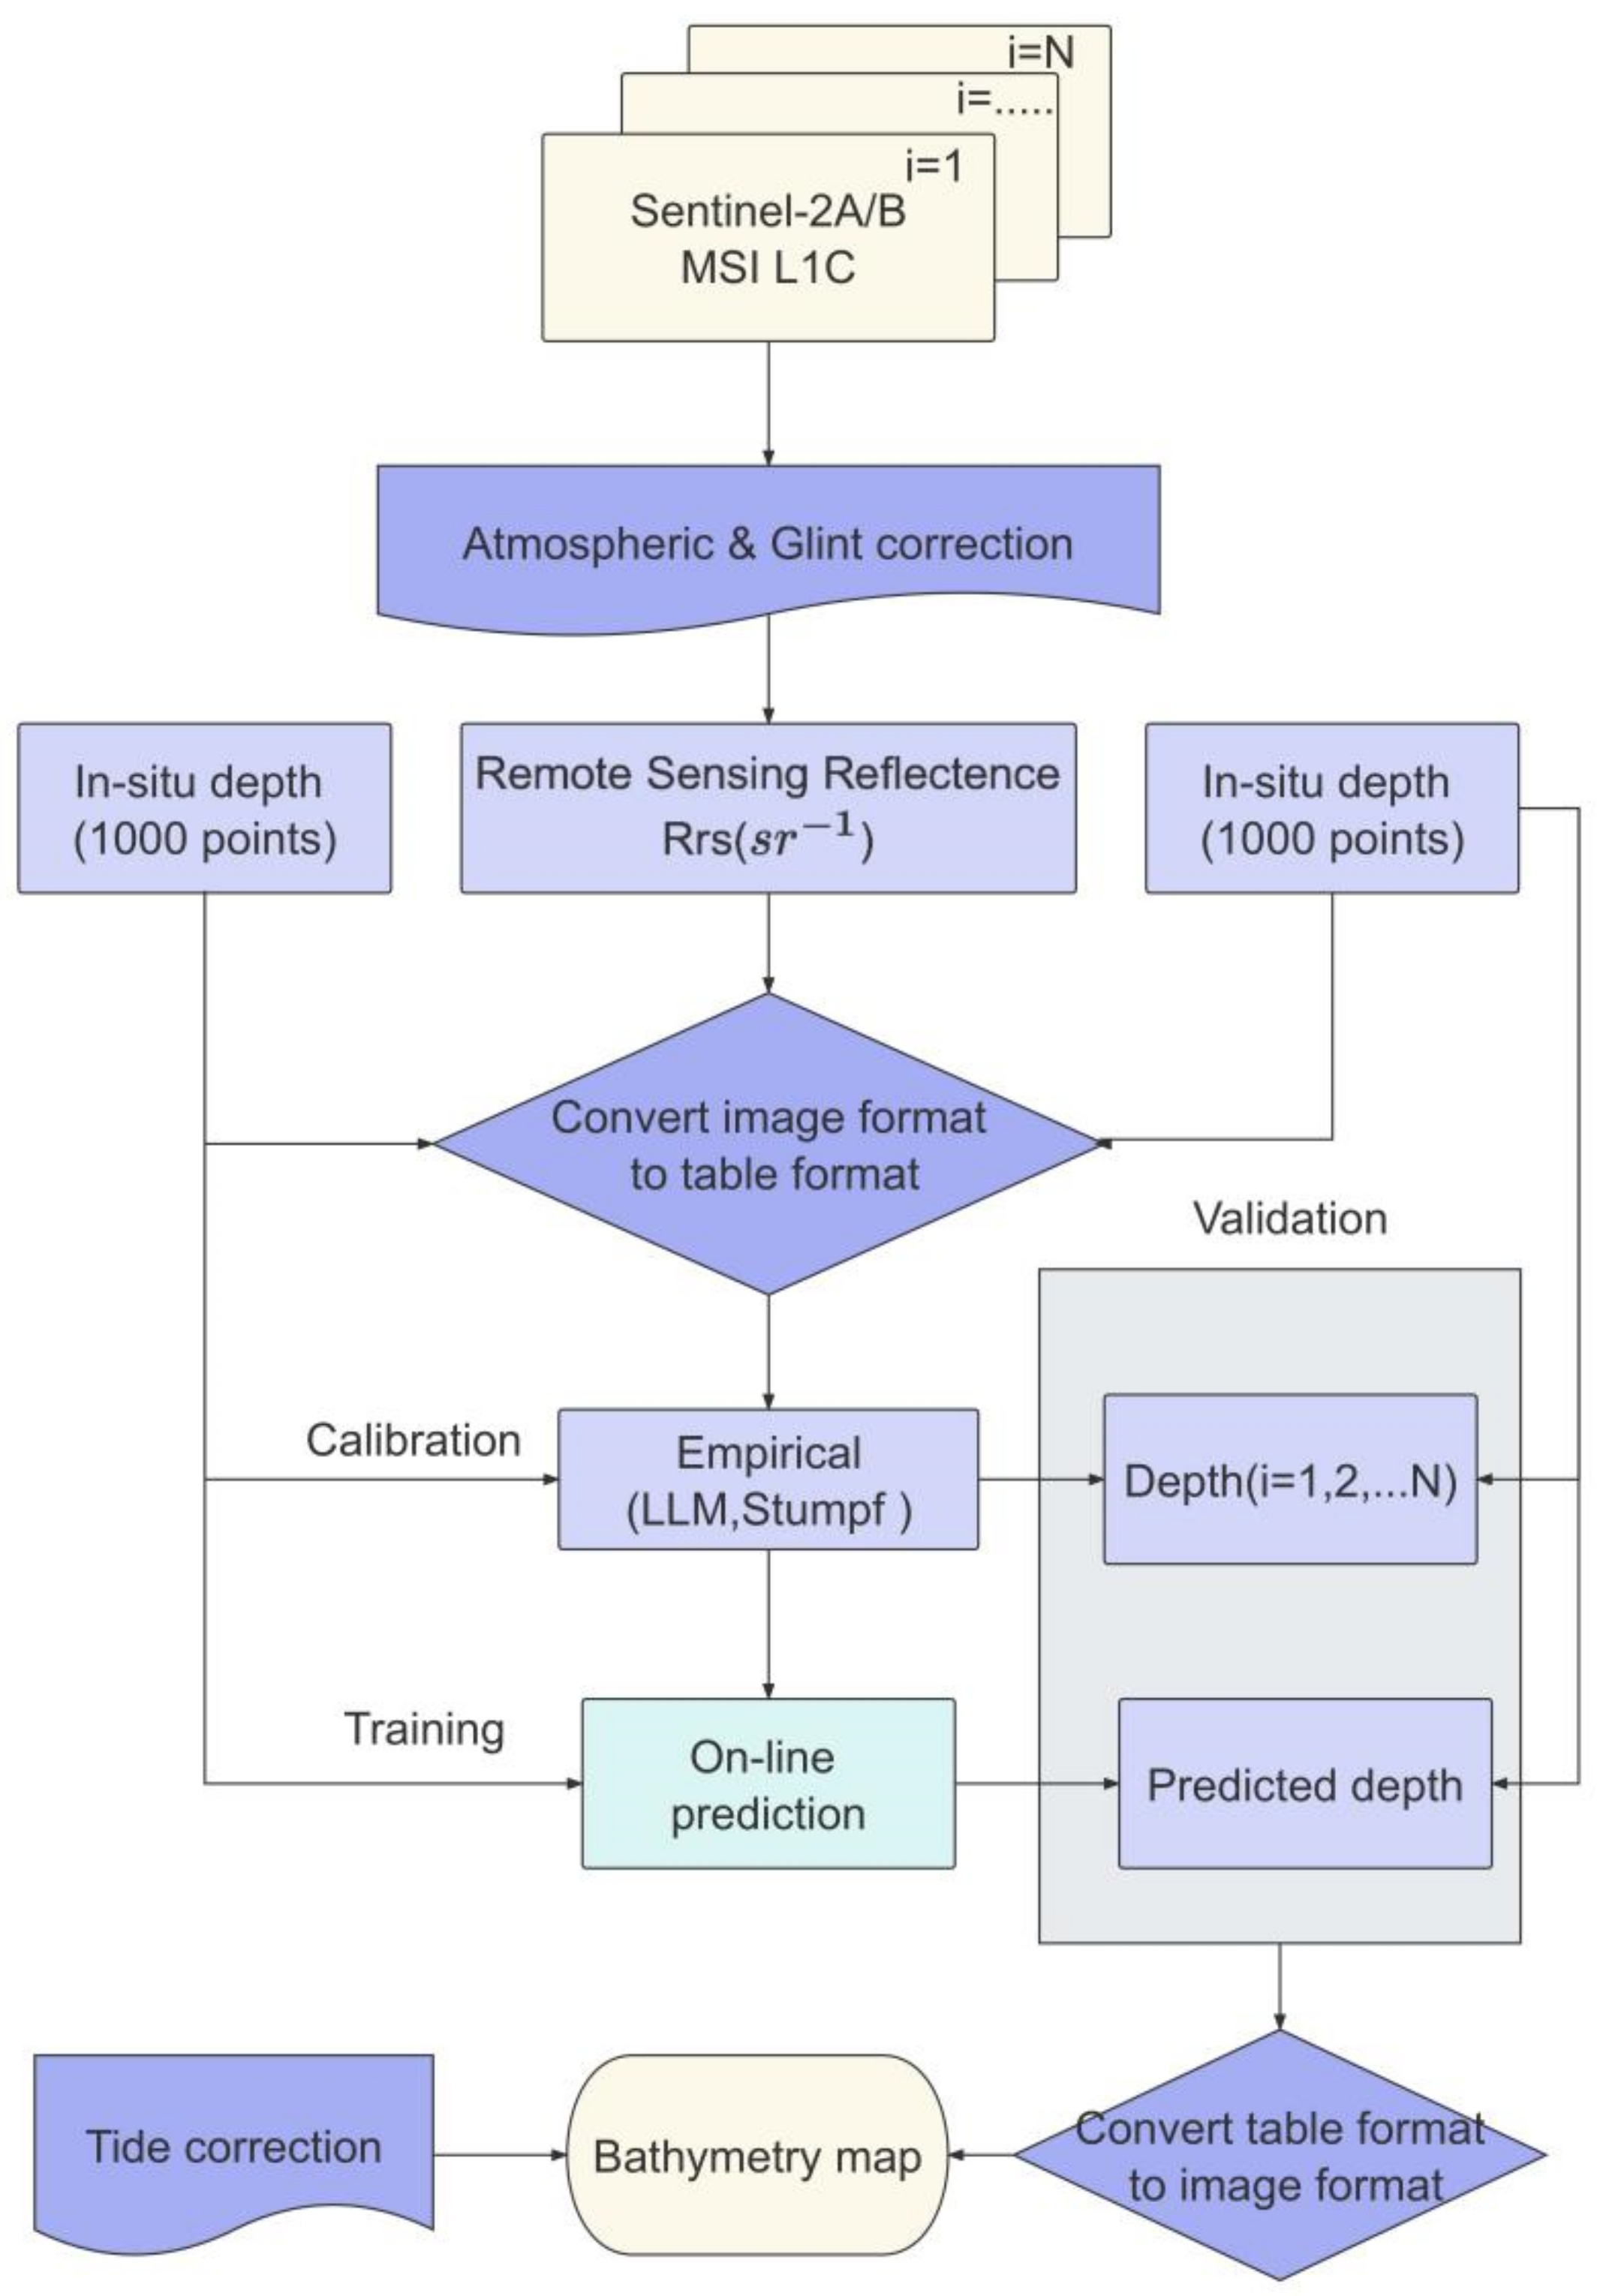
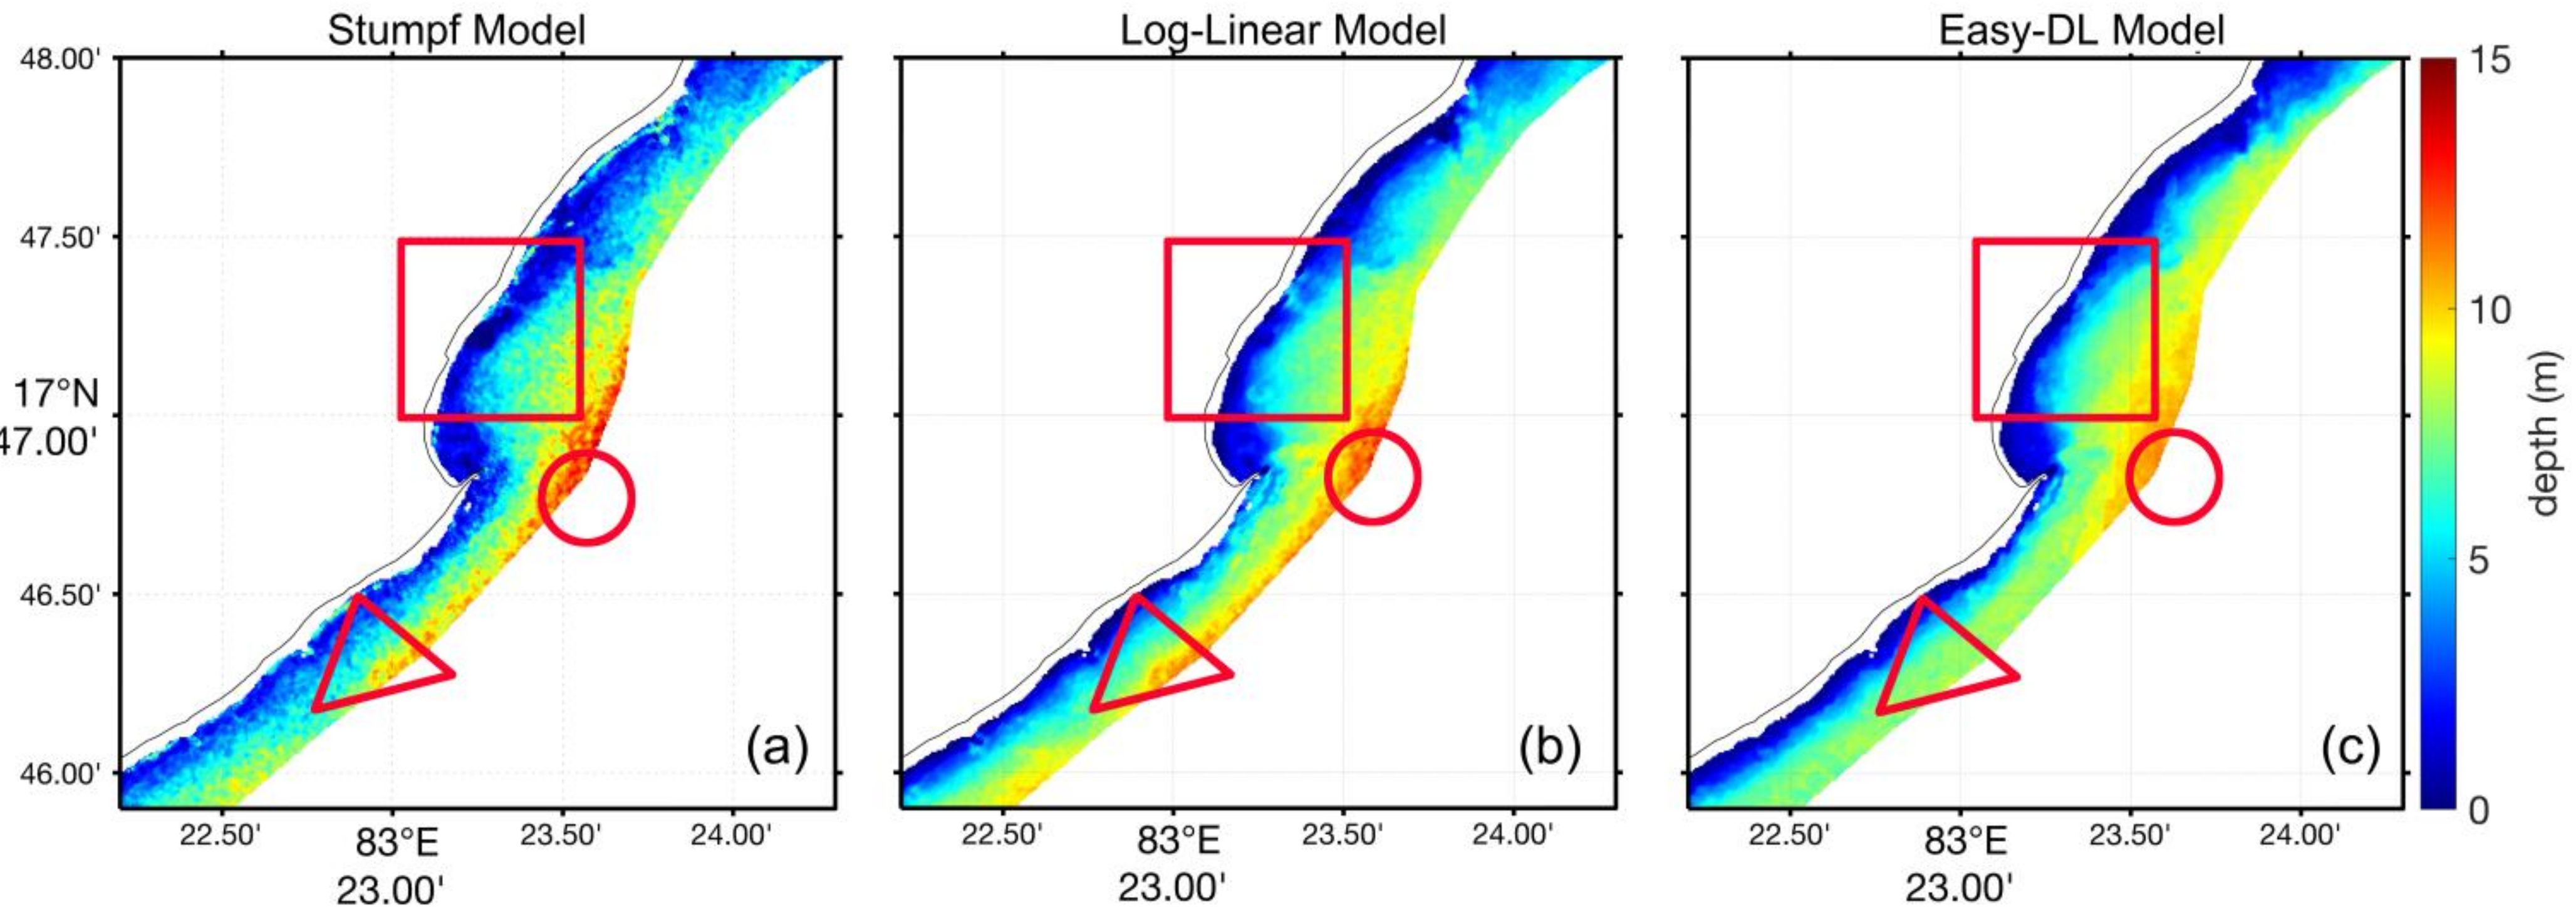
3.5. Bathymetry Mapping

Satellite-derived bathymetry (SDB) is a technique that uses remote sensing data to estimate water depth in shallow areas. One of the key factors that affect the accuracy of SDB is the selection of water depth control points, which are used to calibrate and validate the SDB models. Usually, about 1000 control points are selected from a single image of the study area, though this method may introduce variability in the SDB results depending on the number and locations of these control points.
In this study, we propose a comprehensive and robust process for water depth retrieval using SDB. The first step of our process is to select a high-quality remote sensing image that matches the timing of the scene and measured data. We then perform atmospheric correction and remove sunlight effects to obtain accurate reflectance data. Next, we applied various bathymetry algorithms to estimate water depth from the reflectance data and then corrected for tide effects to obtain consistent water depth values. Finally, we created a topographic map by integrating the estimated water depths. Our process consists of two stages for water depth estimation. In the first stage, we converted both remote sensing data and water depth data into a tabular format and used them for training purposes. In the second stage, we used Sentinel-2 data, which were also converted into the tabular format, for depth prediction. To evaluate the performance of our proposed SDB method, we compared the predicted depths with in situ depth values. We found that our method utilized water depth control point information effectively, reducing depth estimation errors and improving the accuracy of water depth inversion.

4. Experimental Setup and Results

In this comprehensive study, we meticulously explore the precision of water depth estimation through the application of machine learning algorithms and multiple training datasets derived from Sentinel-2 images. Our training dataset is extensive, comprising a total of 2000 data points.
The first phase involved the utilization of 1000 points for the initial estimation of water depth. This was followed by the application of an additional 1000-point training set for inversion, which facilitated the acquisition of preliminary values. Remote sensing reflectance data, corresponding to identical geographical coordinates as water depth data, were collected and systematically organized into a tabular format. The primary column represents water depth, while the subsequent columns correspond to data from various bands, specifically bands 1, 2, 3, 4, 5, 6, 8, and 10.
The process of water depth retrieval was initiated based on control points associated with one of the 1000-point training sets. This training set was subsequently employed for inversion to derive the final depth of results. The final results obtained through online prediction were utilized to compute the key evaluation metrics. These included the Mean Absolute Error (MAE), Mean Relative Error (MRE), Root Mean Square Error (RMSE), and the coefficient of determination (R2).
Three models were selected for this study: the Stumpf model, the Log-Linear model, and the Baidu Easy-DL model. Each model was trained using remote sensing reflectance values from various bands as the input variables. The dataset was split using spatial random sampling to ensure a diverse range of data points for model training and verification.
Quality checks were conducted throughout the process to ensure the accuracy and reliability of our results. Possible branching was also considered in our study design. For instance, depth mapping was conducted within a certain range along the coast.
This rigorous approach ensured a comprehensive understanding of water depth estimation using machine learning algorithms and Sentinel-2 images. It provides valuable insights that could be used to further refine these techniques and improve their accuracy in future studies.
All data format conversions and experiments were carried out within the Matlab environment. For training points and verification points, we used a random sampling method to extract the samples. Our approach involved the random selection of calibration samples in accordance with the depth distribution. For each sample, we computed the MAE, MRE, RMSE, and R2 values by comparing the estimated water depth values with ground-truth measurements. The ultimate results were presented as the mean values across all samples.
The results of water depth estimation exhibited significant variations among the different bathymetry algorithms employed. Notably, the accuracy of the Easy-DL model stood out as the highest among the three algorithms, followed by the Log-Linear model in second place, while the Stumpf model lagged behind in terms of accuracy (refer to Figure 3). These conclusions are substantiated by examining parameters such as the correlation coefficient, R2, MAE, MRE, RMSE.
For the Easy-DL model, the water depth inversion results closely align with the 1:1 line, with fewer discrete data points. By contrast, the Stumpf model exhibited the lowest accuracy, characterized by a higher degree of data discreteness in the water depth inversion. Following this trend, the Log-Linear model fell in between the other two algorithms in terms of accuracy.
Notably, within the depth range of 0–3 m, the Easy-DL model demonstrated a high degree of alignment with actual measurements, resulting in a noticeably higher accuracy compared to the other two models. However, when the water depth exceeded 10 m in the Easy-DL model, the retrieved values started to decrease slightly, deviating marginally from the measured water depth values. Obviously, within the range of 10 m in the study area, the water depth inversion results given by the Baidu Easy-DL platform were the best, while the MAE, MRE, RMSE, and R2 values performed better (Refer to Figure 3).
Figure 4 presents a comprehensive map of estimated water depths across the study area, spanning depths from 0 to 15 m. The results highlight variations in accuracy, notably showcasing lower accuracies in shallow depths (<0.5 m) and deeper depths (>15 m) within the study area, particularly in their proximity to the shoreline.
The topographic map derived from the Easy-DL model exhibited less noise, and the inversion results from shallow to deep waters closely mirrored the actual conditions. An examination of the scatter map reveals a noticeably superior accuracy in the inversion of water depth compared to the other two models. When compared to the measured data, the topographic map derived from satellite data effectively captures the general trend of water depth variability, albeit with some minor discrepancies in the finer details.
In the 0–5 m depth range, the inversion results of the three algorithms exhibit a similar trend, albeit with some localized variations. For instance, in specific areas, the Stumpf model manages to mitigate the influence of seabed geological heterogeneity on water depth inversion results, a feat not achieved by the Log-Linear algorithm. However, even though the Easy-DL model boasts high accuracy, it does exhibit errors in these regions.
Yet, it is worth noting that the Stumpf model shows pronounced error bands in nearshore areas, which could potentially be attributed to wave-related factors. In the depth range of 6–10 m, the water depth changed trends, appearing consistent across models; however, the Stumpf model contained more noise points in a triangular region compared to the smoother results from the Easy-DL model.
In locations exceeding 10 m in depth, such as the circular section, data from the Easy-DL model tended to underestimate water depth inversion results, which is consistent with the scatter plot observations. Collectively, these results underscore the reliability of satellite-based water depth estimation. However, it is noteworthy that when the water depth in the Easy-DL model exceeded 10 m, the inverted water depth values began to exhibit a slight decline, deviating marginally from the measured water depth values.

5. Discussion

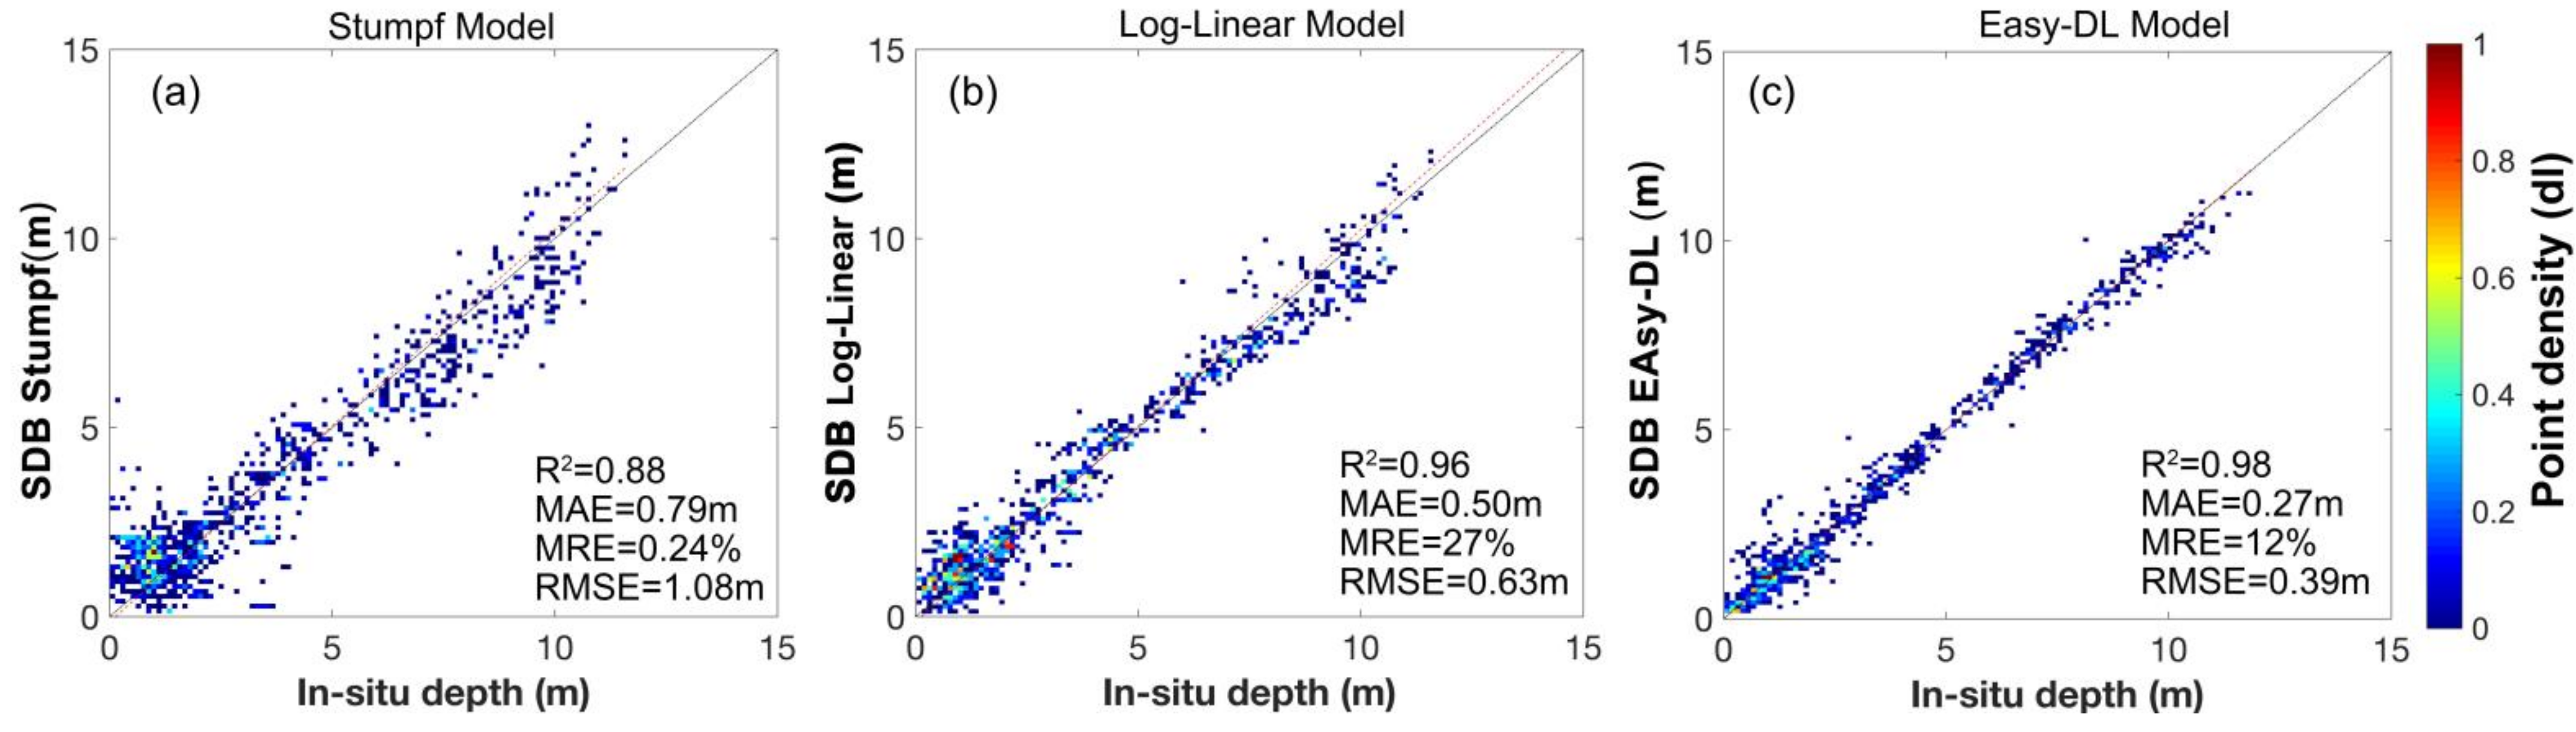
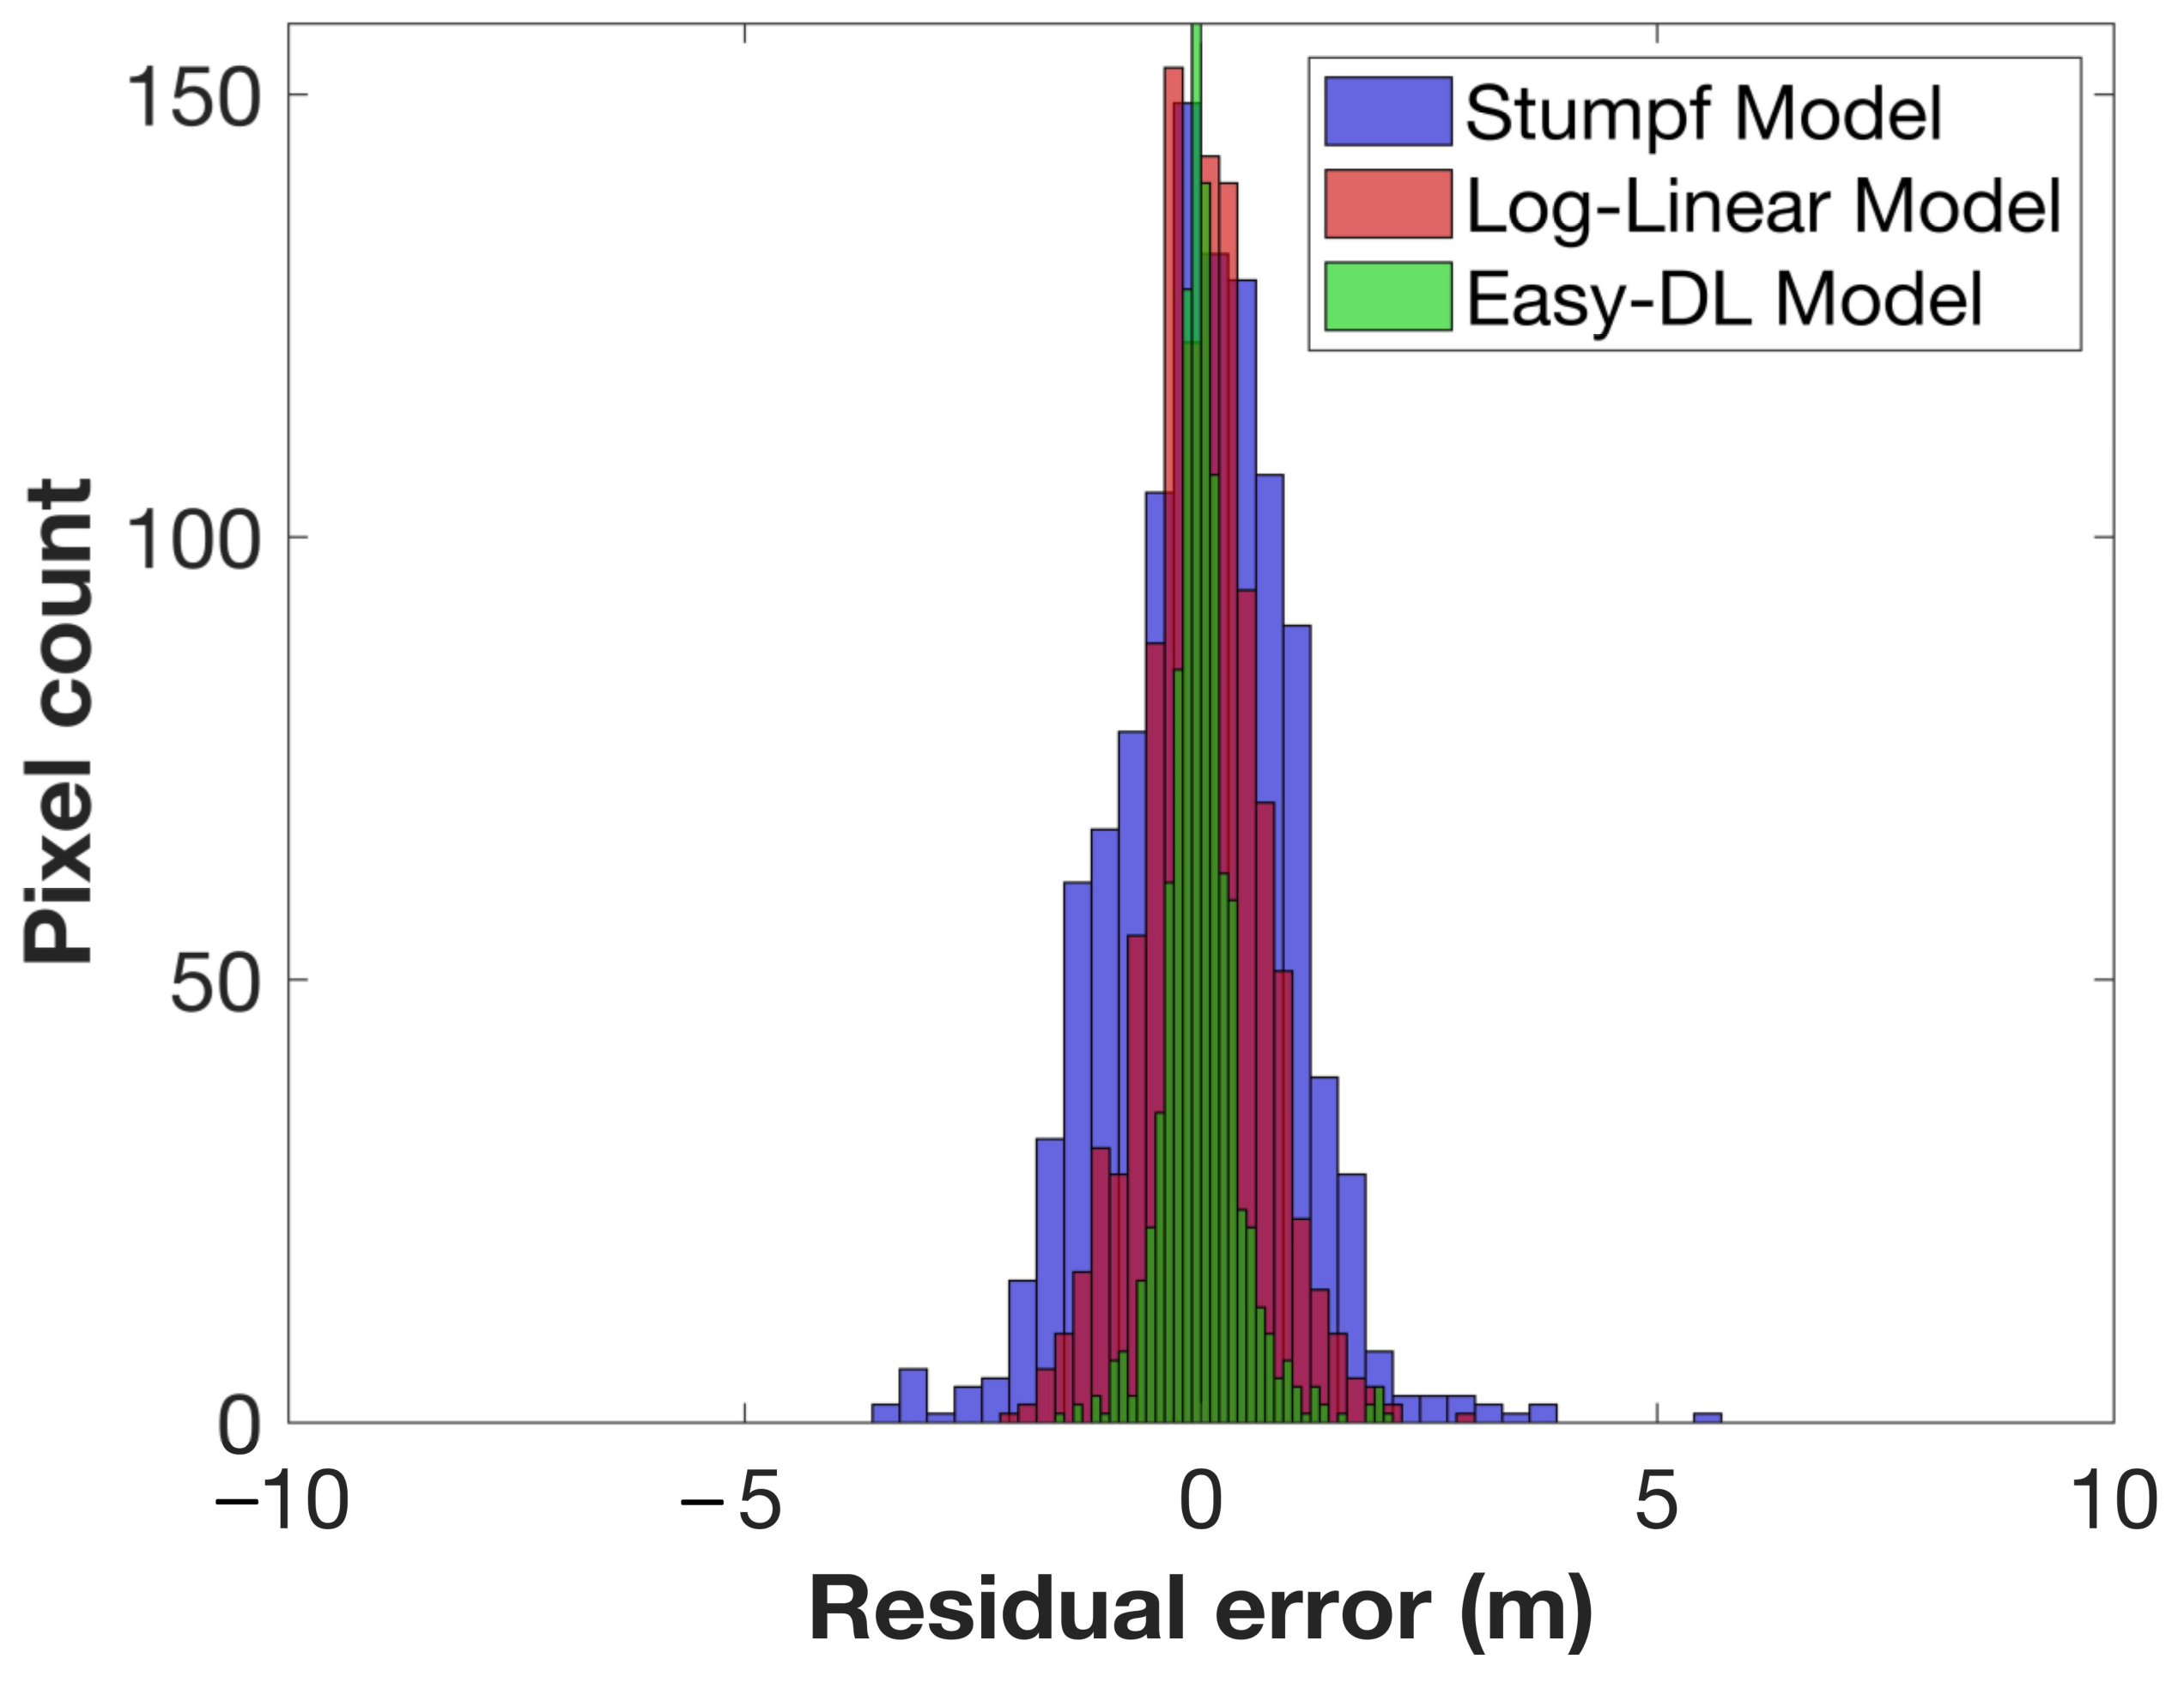
5.1. The Performance of Water Depth Inversion Model

As illustrated in the scatterplot presented in Figure 3, our proposed method exhibits a remarkably high level of accuracy in water depth inversion. This becomes particularly evident when compared to two classical algorithms: the Stumpf and Log-Linear algorithms. To comprehensively assess the bathymetry results across various water depth ranges, we calculated the root-mean-square errors (RMSE) for both the classical methods and our proposed online deep-learning method (see Table 1).
These methods enable precise water depth estimation under diverse conditions, encompassing factors such as human activities, pollution, and sediment accretion. Notably, our proposed online deep learning method consistently outperforms all other methods in terms of overall accuracy, boasting an RMSE that is 0.24 m less than the closest RMSE value among all other methods.
Moreover, the proposed online deep learning method excels in overall accuracy and demonstrates superior performance in the inversion accuracy of specific water depth ranges. Notably, within the 6–9 m range, our method achieved remarkable accuracy, with an RMSE as low as 0.23 m. In the case of the Stumpf algorithm, similar conclusions were obtained, where the RMSE was 0.94 m, albeit slightly lower than the overall accuracy. Conversely, the Log-Linear algorithm exhibited its smallest error in the 3–6 meter water depth range, with an RMSE of 1.01 m.
However, it is important to acknowledge that when the water depth exceeded 9 m, all algorithms tended to experience an increase in accuracy deviation and RMSE values, surpassing the overall results. This phenomenon can be attributed to the comprehensive approach employed in our method, where various machine learning algorithms were integrated to perform depth inversion. This enabled optimal depth estimation overall, yielding superior results in localized estimations as well.
Given that the study area encompasses an open coast, it is susceptible to significant influences from various environmental factors. Remote sensing images reveal valuable insights into the seabed quality of the nearshore sea, suggesting relatively high water transparency in this region.
As depicted in Figure 5, the results obtained through the approach proposed in this paper exhibit substantial improvements compared to those obtained through traditional methods. These improvements are noticeable across the entire depth range under consideration, which spanned from 0 to 15 m, with a particularly noteworthy enhancement at a depth of four meters.
Additionally, it is worth highlighting that the histogram depicting the residuals was limited to ±1 m in comparison to the previous method. In this context, the distributions observed for all three methods appeared to follow a normal pattern (see Figure 5). This reaffirms the feasibility and effectiveness of the method proposed in this paper.

5.2. The Uncertainty and Implications of Baidu Easy-DL Model

Obviously, within the range of 10 m in the study area, the water depth inversion results given by the Baidu Easy-DL platform were the best, while the MAE, MRE, RMSE, and R2 values performed better. However, in the work of remote sensing for the inversion of water depth in turbid water bodies using the online artificial intelligence platform Baidu Easy-DL, there were certain uncertainties and impacts:
(a)
Model Selection: The choice of the model may affect the accuracy of the inversion results. Although machine learning models generally have higher robustness than traditional semi-empirical, bio-optical, and semi-analytical models², different machine learning models may produce different results. For example, a study found that the Genetic Algorithm Optimized Extreme Learning Machine (GA-ELM) had a more compact network structure and better generalization ability than the Extreme Learning Machine (ELM).
(b)
Input Variables: The choice of input variables may also affect the results. For example, using remote sensing reflectance values at different bands as input variables may lead to different inversion results.
(c)
Data Quality: The quality of remote sensing data also affects the inversion results. For example, if remote sensing data contain noise or are affected by factors such as atmosphere and water turbidity, it may lead to inaccurate inversion results.
The methodology provided in this study holds significant implications for various research areas:
(a)
Depth Inversion: This work is of paramount importance for depth inversion, offering valuable support for marine engineering, shipping, and maritime military security.
(b)
Environmental Monitoring: This methodology can also be utilized for environmental monitoring, such as monitoring the water quality of inland bodies of water.
(c)
Scientific Advancement: This work can propel scientific progress in related fields, such as enhancing the accuracy and robustness of remote sensing inversion models.
These implications underscore the practical application and scientific research value of this study, demonstrating its potential to contribute significantly to both practice and research in these areas.
In summary, despite certain uncertainties, the remote sensing inversion of turbid water depth using Baidu Easy DL still has important practical and scientific value. In future work, we can reduce uncertainty and improve the accuracy of inversion results by improving models, optimizing input variable selection, and improving the quality of data. At the same time, we need to pay attention to the various impacts that this work may bring in order to better utilize its application potential in practice and research.

6. Conclusions

This paper presents an online water depth estimation method that employs a comprehensive approach. This method uses a general large model, combining remote sensing data with measured training datasets, and incorporates multiple machine learning algorithms. The results achieved with this approach in water depth inversion have been promising. Moreover, using the online ensemble learning algorithm clearly shows different water depth estimations. In comparison, ensemble learning techniques can be further integrated with these algorithms to improve depth estimation accuracy, often resulting in a halving of the RMSE. Within the experimental area, our proposed method demonstrated superior precision, lower RMSE values, and higher R2 values when compared to the classical Stumpf and Log-linear algorithms. The experimental results indicate that this method can effectively improve depth estimation within the range of 0 to 11 m, with an RMSE of 0.39 m. Remarkably, for water depths less than 9 m, the inversion accuracy is consistently high. The reduction in performance for depths exceeding 9 m may be attributed to similar water quality conditions and a substantial water depth, which might challenge the accurate reflection of depth changes through remote sensing reflectivity data.
It is worth noting that while the quantity of training samples significantly impacts the performance of depth estimation, this paper’s algorithms are all based on a large volume of training data. Importantly, this method has the potential to be extended to estimate other physical parameters based on remote sensing image analysis, such as water turbidity and chlorophyll concentration. In summary, the method proposed in this paper effectively estimates the water depth from satellite images by leveraging the synergy between publicly available large-scale models and remote sensing depth retrieval. This method outperforms traditional remote sensing depth retrieval approaches. Due to the non-parametric nature of machine learning methods, it successfully achieves relatively high coherence and consistency from observed satellite images compared to depth estimation through acoustic methods.
Looking ahead, with the continuous advancement of large models, the method presented here, which involves invoking network online model APIs for remote sensing image processing, represents a promising direction in remote sensing applications. While many scholars have used remote sensing APIs for specific tasks in remote sensing image processing, the lack of an API for Satellite-based bathymetry is a challenge. Converting the formats of remote sensing data into the import and export formats of common online learning algorithms is crucial for future research and the widespread application of remote sensing online data processing.

Author Contributions

Z.W. and S.W. processed analysis and wrote manuscript. All authors reviewed and commented on the manuscript. Z.W. and H.Y. designed the algorithm with input from W.S. The BATHYMETRY project was conceived by Z.M., who also obtained funding and collected remote sensing data and Sonar data. All authors have read and agreed to the published version of the manuscript.

Funding

This research was funded by the Hainan Natural Science Foundation of China [No.620RC602], the National Natural Science Foundation of China [No.61966013], the 2023 Hainan Province “South China Sea New Star” Science and Technology Innovation Talent Platform Project [NHXXRCXM202316], and was funded by the Teaching Reform Research Project, Hainan Normal University [hsjg2023-07].

Data Availability Statement

The data and codes supporting the findings of this study can be found at the provided link: https://github.com/wuzhenghan2022/ESAY-DL.git.

Acknowledgments

Thanks to Zhao Yuchen, Zhang Xianyao, Luo Hui, Liu Pei-ran and Chen Hua-ze from the School of Information Science and Technology of Hainan Normal University for their valuable suggestions on paper revision.

Conflicts of Interest

The authors declare no conflict of interest.

References

  1. Liu, Y.; Zhao, J.; Deng, R.; Liang, Y.; Gao, Y.; Chen, Q.; Xiong, L.; Liu, Y.; Tang, Y.; Tang, D. A downscaled bathymetric mapping approach combining multitemporal Landsat-8 and high spatial resolution imagery: Demonstrations from clear to turbid waters. ISPRS J. Photogramm. Remote Sens. 2021, 180, 65–81. [Google Scholar] [CrossRef]
  2. Cao, B.; Deng, R.; Zhu, S. Universal algorithm for water depth refraction correction in through-water stereo remote sensing. Int. J. Appl. Earth Obs. Geoinf. 2020, 91, 102108. [Google Scholar] [CrossRef]
  3. Niroumand-Jadidi, M.; Legleiter, C.J.; Bovolo, F. River Bathymetry Retrieval from Landsat-9 Images Based on Neural Networks and Comparison to SuperDove and Sentinel-2. IEEE J. Sel. Top. Appl. Earth Obs. Remote Sens. 2022, 15, 5250–5260. [Google Scholar] [CrossRef]
  4. Liu, H.; Li, J.; Meng, X.; Zhou, B.; Fang, G.; Spencer, B.F. Discrimination Between Dry and Water Ices by Full Polarimetric Radar: Implications for China’s First Martian Exploration. IEEE Trans. Geosci. Remote Sens. 2022, 61, 5100111. [Google Scholar] [CrossRef]
  5. Lyzenga, D.R. Passive remote sensing techniques for mapping water depth and bottom features. Appl. Opt. 1978, 17, 379–383. [Google Scholar] [CrossRef] [PubMed]
  6. Lyzenga, D.R.; Malinas, N.R.; Tanis, F.J. Multispectral bathymetry using a simple physically based algorithm. IEEE Trans. Geosci. Remote Sens. 2006, 44, 2251–2259. [Google Scholar] [CrossRef]
  7. Brando, V.E.; Anstee, J.M.; Wettle, M.; Dekker, A.G.; Phinn, S.R.; Roelfsema, C. A physics based retrieval and quality assessment of bathymetry from suboptimal hyperspectral data. Remote Sens. Environ. 2009, 113, 755–770. [Google Scholar] [CrossRef]
  8. Liu, Z.; Xu, J.; Liu, M.; Yin, Z.; Liu, X.; Yin, L.; Zheng, W. Remote sensing and geostatistics in urban water-resource monitoring: A review. Mar. Freshw. Res. 2023, 74, 747–765. [Google Scholar] [CrossRef]
  9. Liu, Y.; Deng, R.; Qin, Y.; Cao, B.; Liang, Y.; Liu, Y.; Tian, J.; Wang, S. Rapid estimation of bathymetry from multispectral imagery without in situ bathymetry data. Appl. Opt. 2019, 58, 7538–7551. [Google Scholar] [CrossRef]
  10. Wu, Z.; Mao, Z.; Shen, W. Integrating Multiple Datasets and Machine Learning Algorithms for Satellite-Based Bathymetry in Seaports. Remote Sens. 2021, 13, 4328. [Google Scholar] [CrossRef]
  11. Traganos, D.; Poursanidis, D.; Aggarwal, B.; Chrysoulakis, N.; Reinartz, P. Estimating Satellite-Derived Bathymetry (SDB) with Google Earth Engine and Sentinel-2. Remote Sens. 2018, 10, 859. [Google Scholar] [CrossRef]
  12. Zhou, W.; Tang, Y.; Jing, W.; Li, Y.; Yang, J.; Deng, Y.; Zhang, Y. A Comparison of Machine Learning and Empirical Approaches for Deriving Bathymetry from Multispectral Imagery. Remote Sens. 2023, 15, 393. [Google Scholar] [CrossRef]
  13. Li, J.; Knapp, D.E.; Lyons, M.; Roelfsema, C.; Phinn, S.; Schill, S.R.; Asner, G.P. Automated Global Shallow Water Bathymetry Mapping Using Google Earth Engine. Remote Sens. 2021, 13, 1469. [Google Scholar] [CrossRef]
  14. Wen, C.; Hu, Y.; Li, X.; Yuan, Z.; Zhu, X.X. Vision-Language Models in Remote Sensing: Current Progress and Future Trends. arXiv 2023, arXiv:2305.05726. [Google Scholar]
  15. Hu, Y.; Yuan, J.; Wen, C.; Lu, X.; Li, X. RSGPT: A Remote Sensing Vision Language Model and Benchmark. arXiv 2023, arXiv:2307.15266. [Google Scholar]
  16. Zhang, J.; Zhou, Z.; Mai, G.; Mu, L.; Hu, M.; Li, S. Text2Seg: Remote Sensing Image Semantic Segmentation via Text-Guided Visual Foundation Models. arXiv 2023, arXiv:2304.10597. [Google Scholar]
  17. Tian, H.; Huang, N.; Niu, Z.; Qin, Y.; Pei, J.; Wang, J. Mapping winter crops in China with multi-source satellite imagery and phenology-based algorithm. Remote Sens. 2019, 11, 820. [Google Scholar] [CrossRef]
  18. Chen, M.; Zhang, B.; Topatana, W.; Cao, J.; Zhu, H.; Juengpanich, S.; Mao, Q.; Yu, H.; Cai, X. Classification and mutation prediction based on histopathology H&E images in liver cancer using deep learning. NPJ Precis. Oncol. 2020, 4, 14. [Google Scholar]
  19. Arun Kumar, V.V. Numerical Modelling of Coastal and Nearshore Processes in the Vicinity of Shoreline Harbours with Special Reference to Visakhapatnam Coast India. Ph.D. Thesis, Andhra University, Visakhapatnam, India. 2012. Available online: http://hdl.handle.net/10603/407131 (accessed on 12 October 2023).
  20. Ruddick, K.; Vanhellemont, Q.; Dogliotti, A.; Nechad, B.; Pringle, N.; Van der Zande, D. New opportunities and challenges for high resolution remote sensing of water colour. In Proceedings of the Ocean Optics XXIII, Victoria, BC, Canada, 23–28 October 2016; Volume 7. [Google Scholar]
  21. Vanhellemont, Q.; Ruddick, K. Acolite for Sentinel-2: Aquatic applications of MSI imagery. In Proceedings of the 2016 ESA Living Planet Symposium, Prague, Czech Republic, 9–13 May 2016; pp. 9–13. [Google Scholar]
  22. Dugan, J.; Morris, W.; Vierra, K.; Piotrowski, C.; Farruggia, G.; Campion, D. Jetski-based nearshore bathymetric and current survey system. J. Coast. Res. 2001, 17, 900–908. [Google Scholar]
  23. Stumpf, R.P.; Holderied, K.; Sinclair, M. Determination of water depth with high-resolution satellite imagery over variable bottom types. Limnol. Oceanogr. 2003, 48, 547–556. [Google Scholar] [CrossRef]
  24. Lyzenga, D.R. Shallow-water bathymetry using combined lidar and passive multispectral scanner data. Int. J. Remote Sens. 1985, 6, 115–125. [Google Scholar] [CrossRef]
Figure 1. The general workflow of the proposed system for bathymetry from Sentienel-2 images.
Remotesensing 15 04955 g001
Figure 2. The geographical location of the study area (a); Data collection area where different colors represent variations of in situ depth data (b).
Remotesensing 15 04955 g002
Figure 3. Correlation between the in situ depths and depth results based on different bathymetry methods: (a) Stumpf model; (b) Log-Linear model (c) Easy-DL model.
Remotesensing 15 04955 g003
Figure 4. The water depth map estimated based on satellite image data and a different bathymetry method (a) Stumpf model; (b) Log-Linear model (c) Easy-DL model.
Remotesensing 15 04955 g004
Figure 5. The histogram map of the residual error obtained from different methods.
Remotesensing 15 04955 g005
Table 1. A comparison of the RMSE errors for different water depths and different bathymetry methods.
Training MethodRMSE
0–3 m (580 Points)3–6 m (214 Points)6–9 m (200 Points)>9 m (95 Points)Overall (1089 Points)
Stumpf1.121.010.941.191.08
Log-Linear0.590.580.660.890.63
Easy-DL0.430.290.230.390.39
Disclaimer/Publisher’s Note: The statements, opinions and data contained in all publications are solely those of the individual author(s) and contributor(s) and not of MDPI and/or the editor(s). MDPI and/or the editor(s) disclaim responsibility for any injury to people or property resulting from any ideas, methods, instructions or products referred to in the content.

