
Optical Properties and Vertical Distribution of Aerosols Using Polarization Lidar and Sun Photometer over Lanzhou Suburb in Northwest China

 and
and 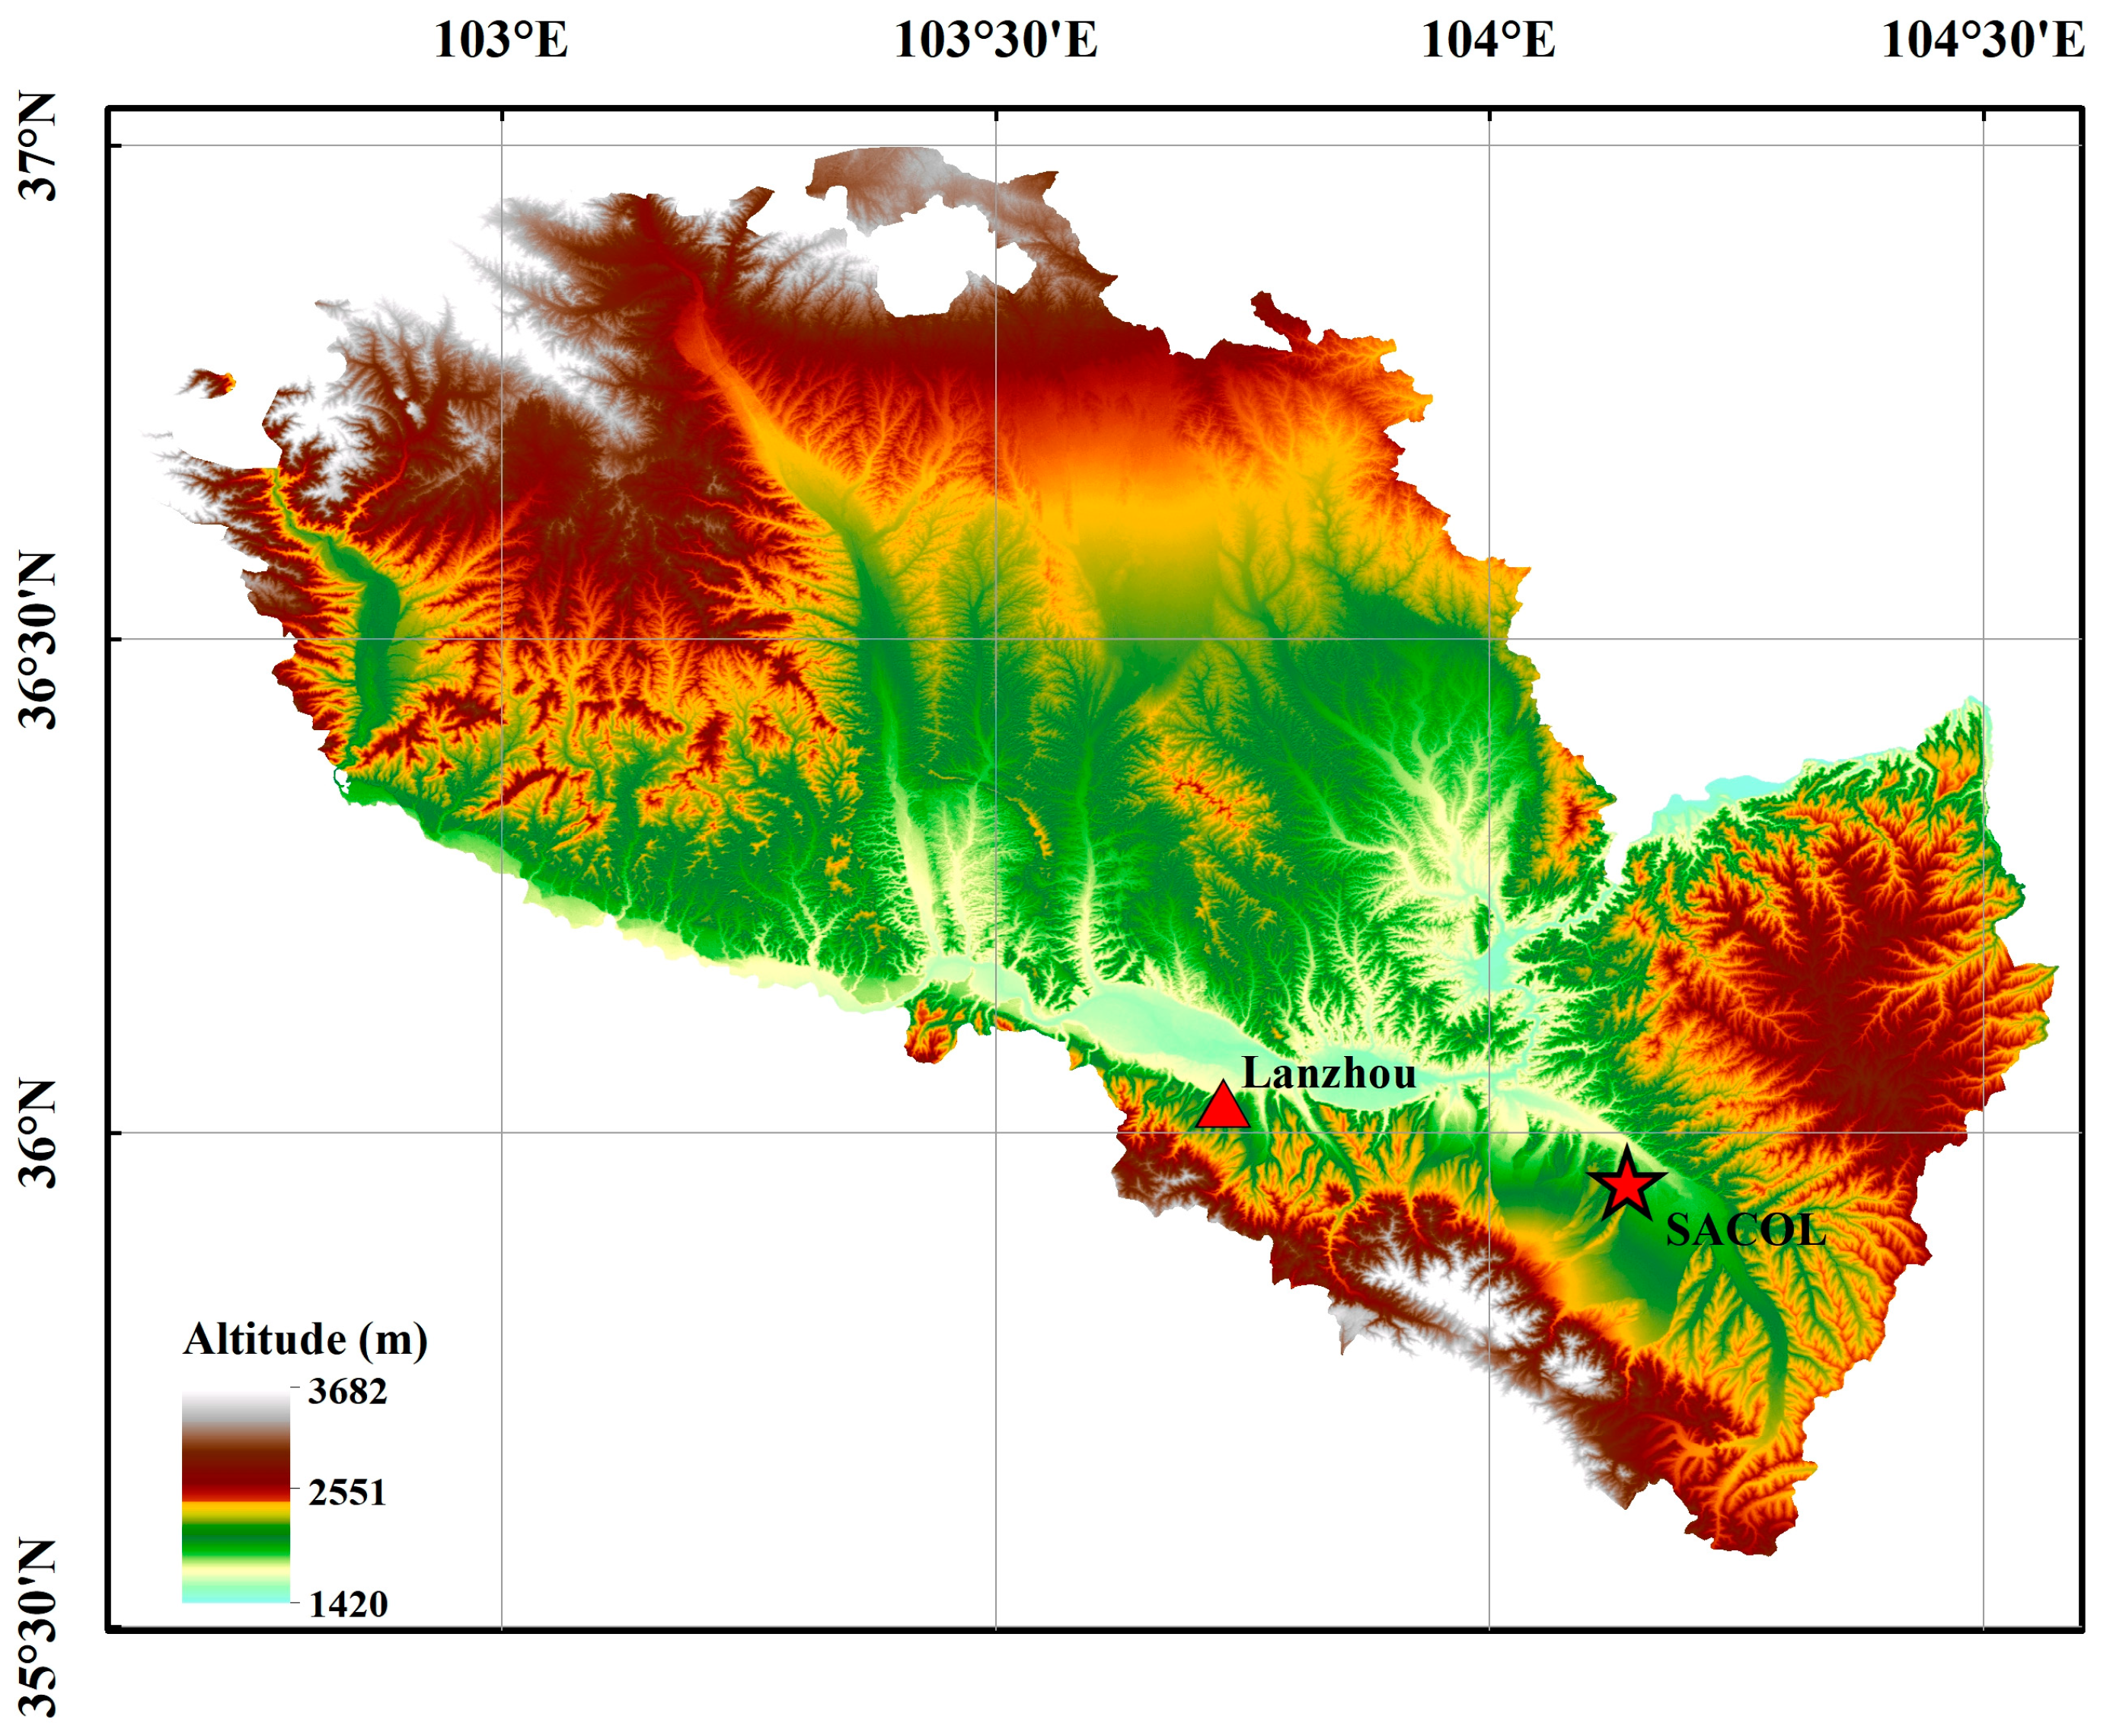
Abstract
:1. Introduction
2. Data and Methods
2.1. Site Description
2.2. Polarization Lidar and Retrieval Method
2.3. Sun Photometer and AERONET Products
2.4. Backward Trajectory Model
3. Results
3.1. Vertical Distribution and Seasonal Variation of Aerosol Optical Properties
3.2. Vertical Distribution and Optical Microphysical Properties of a Dust Event
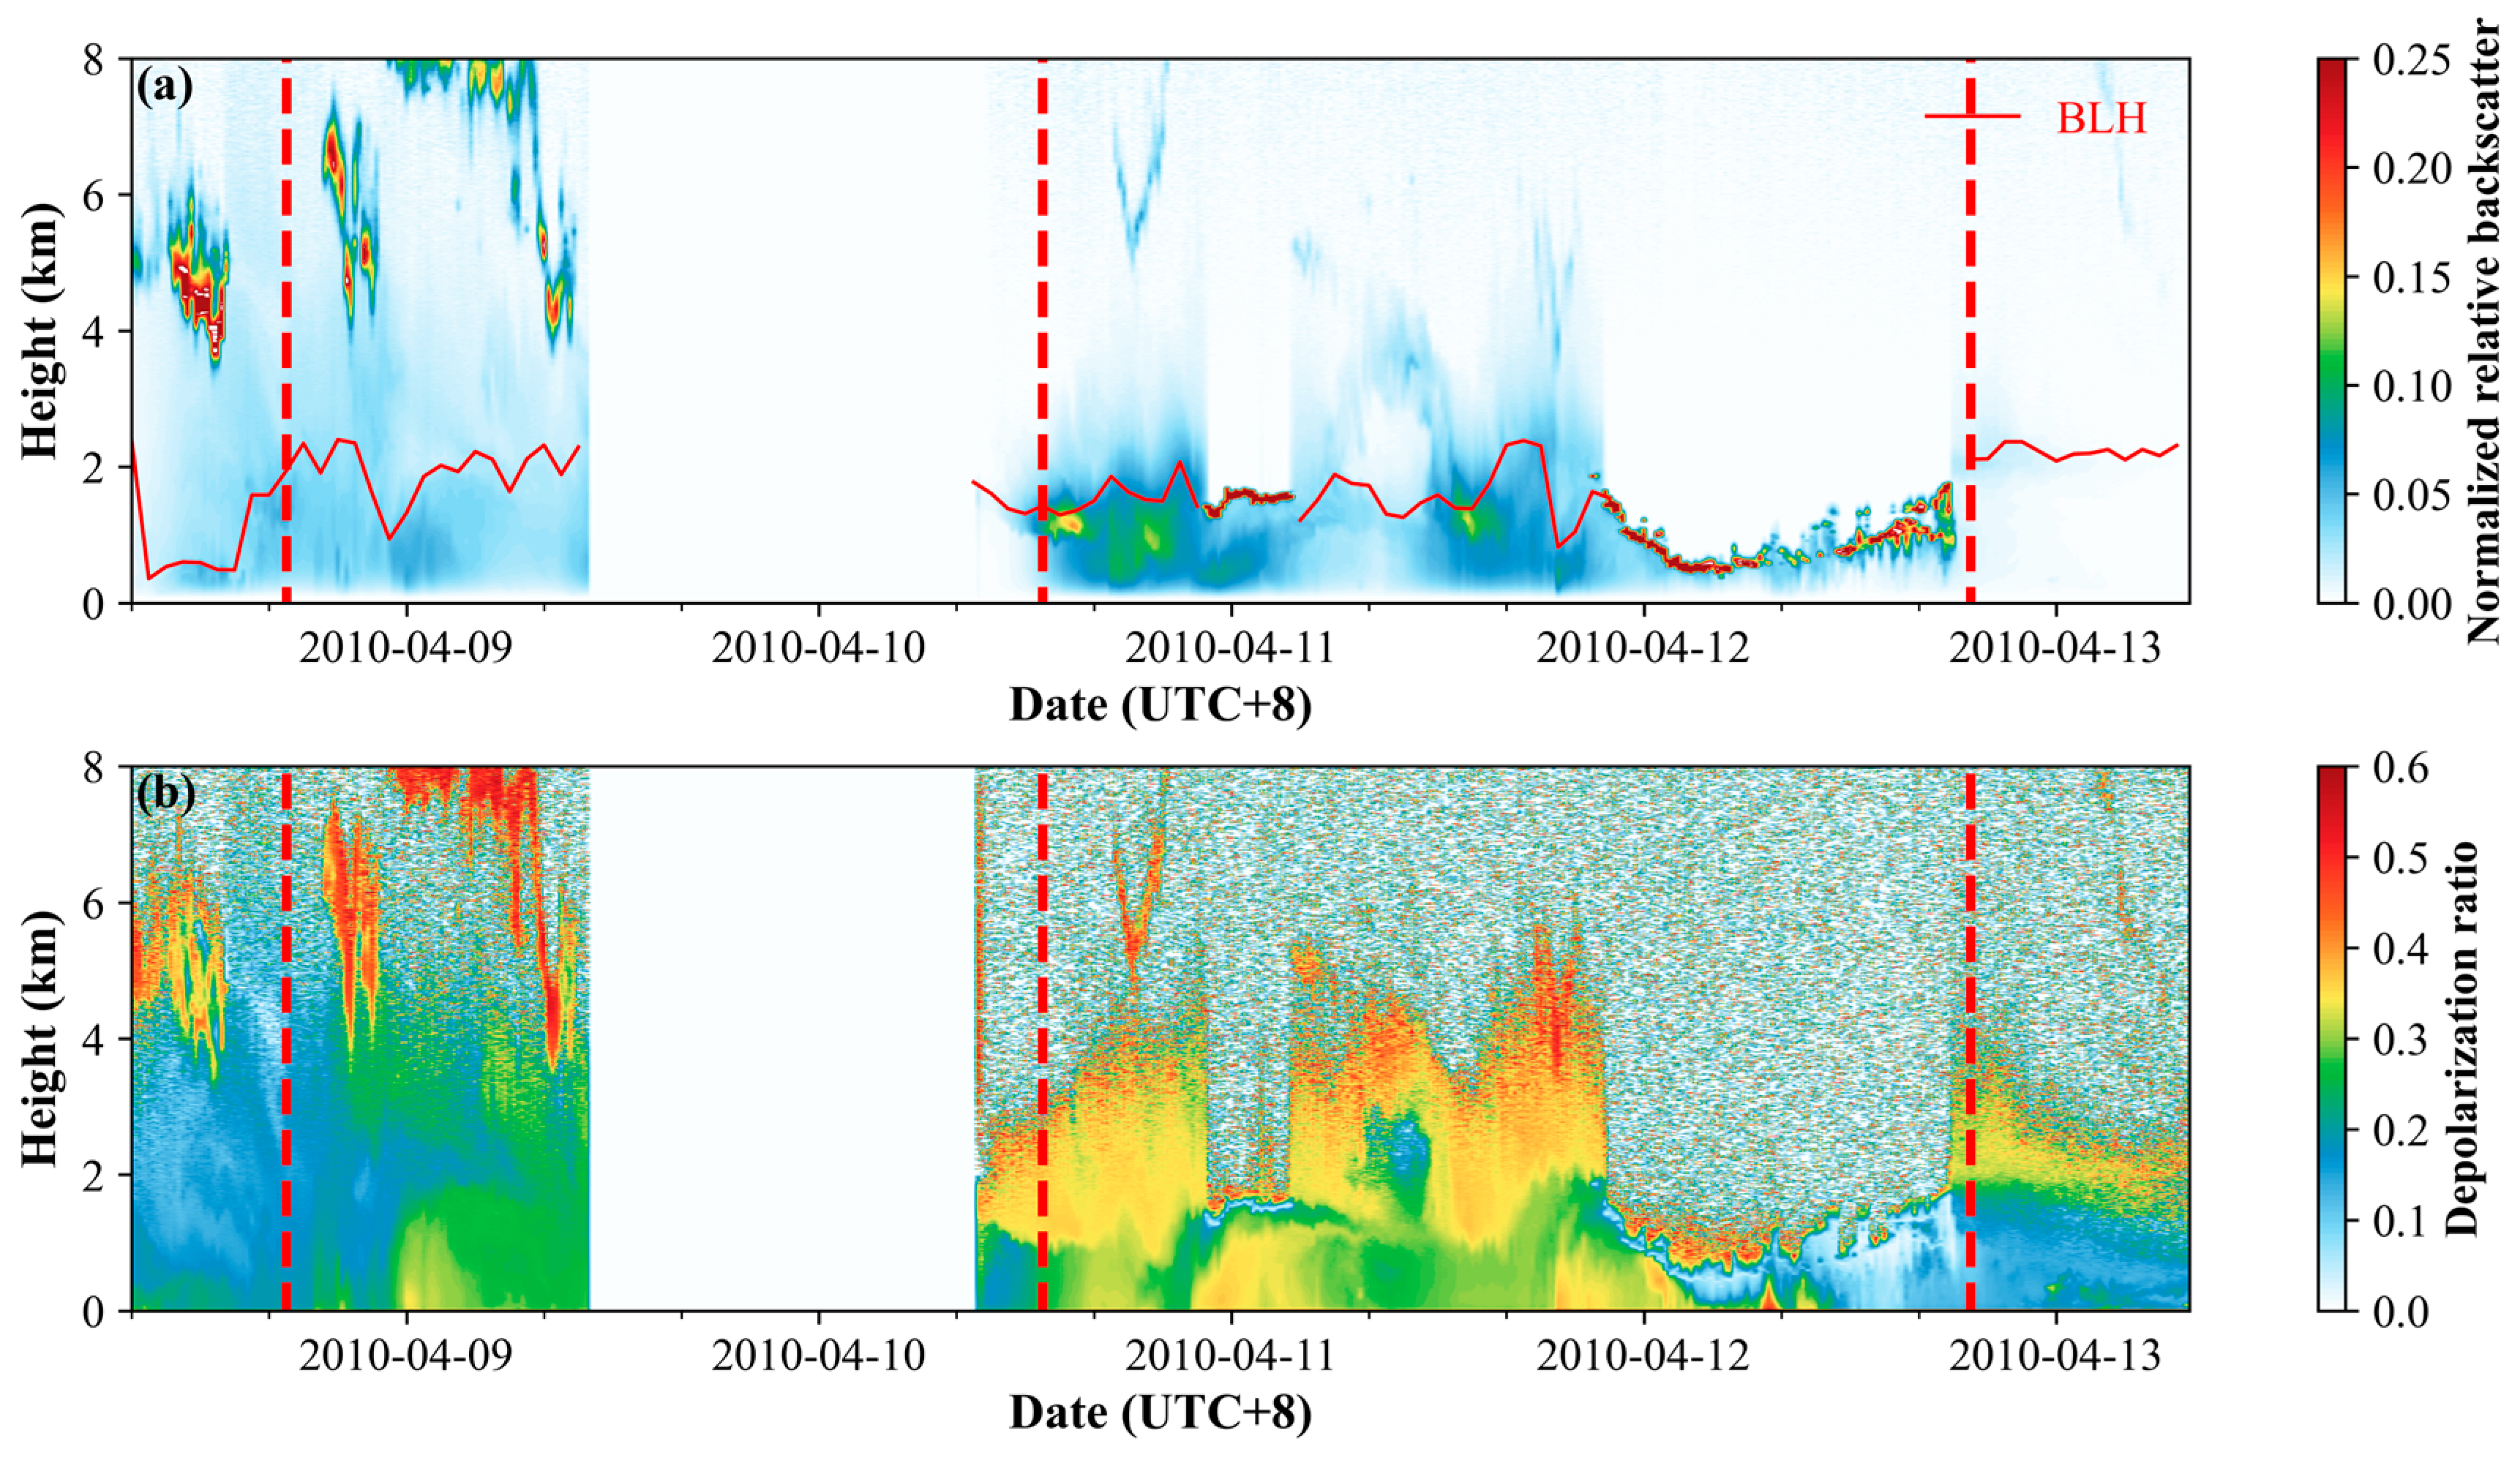
3.2.1. Vertical Distribution Characteristics of Aerosol in the Dust Event
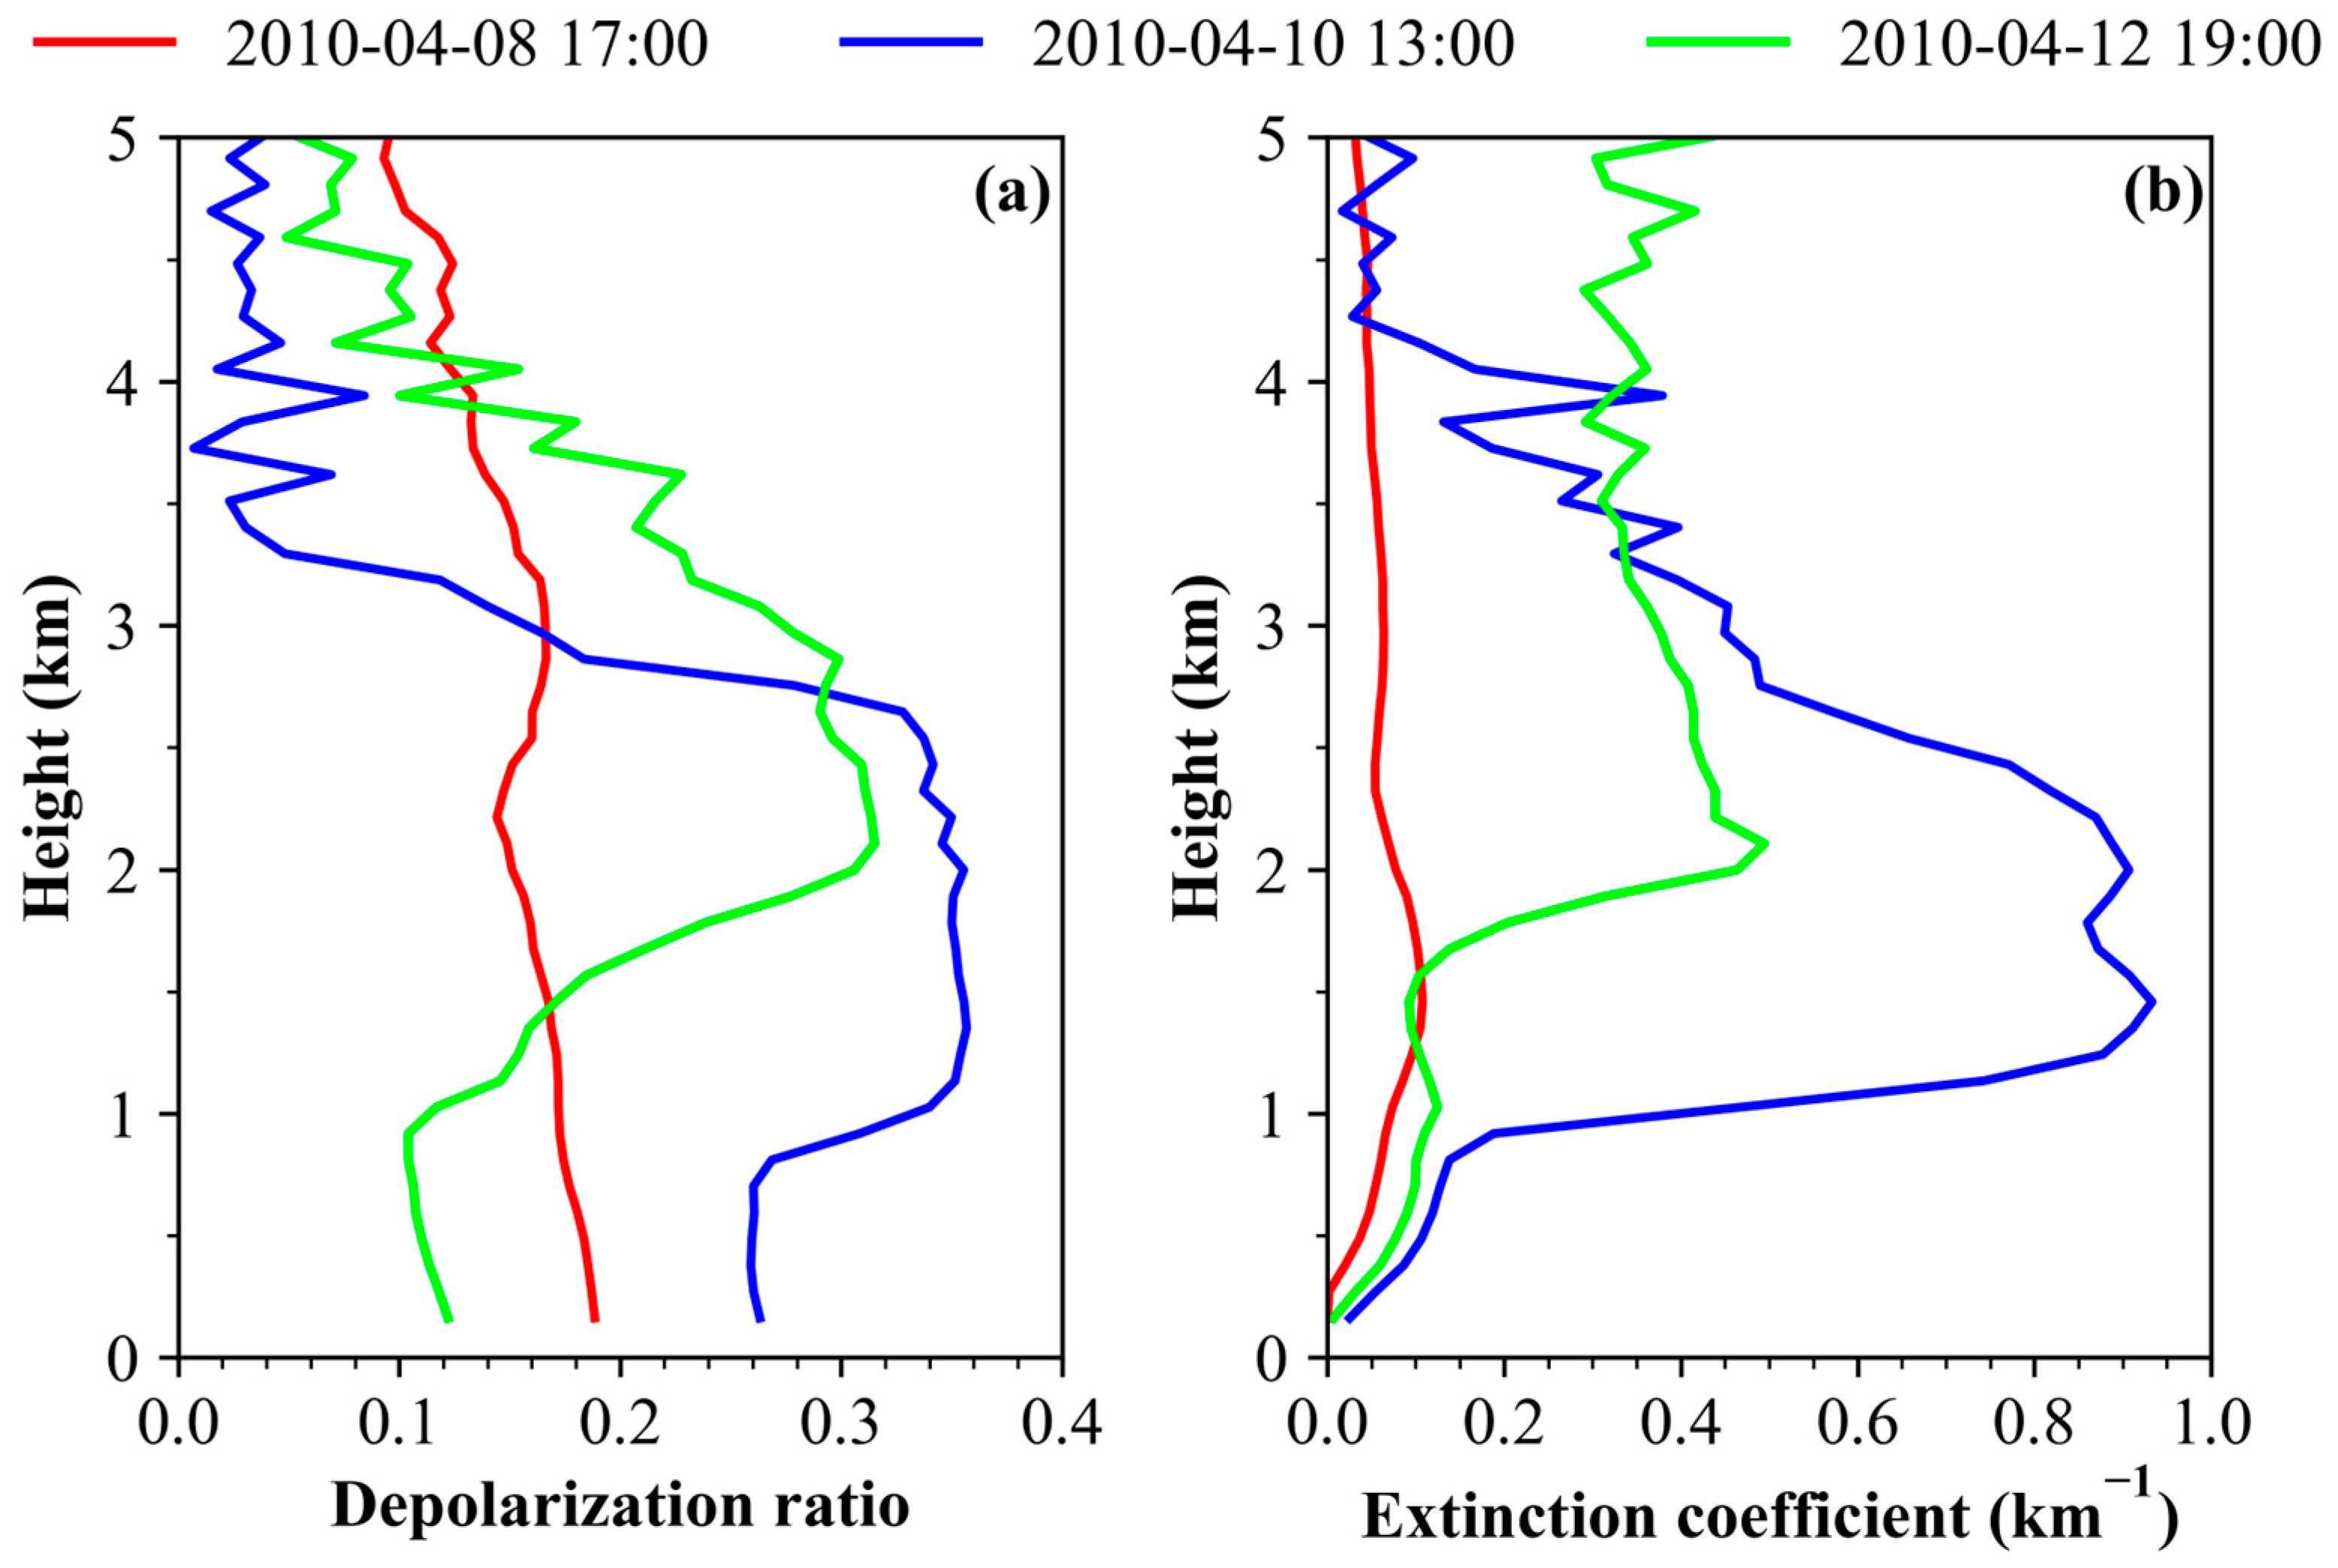
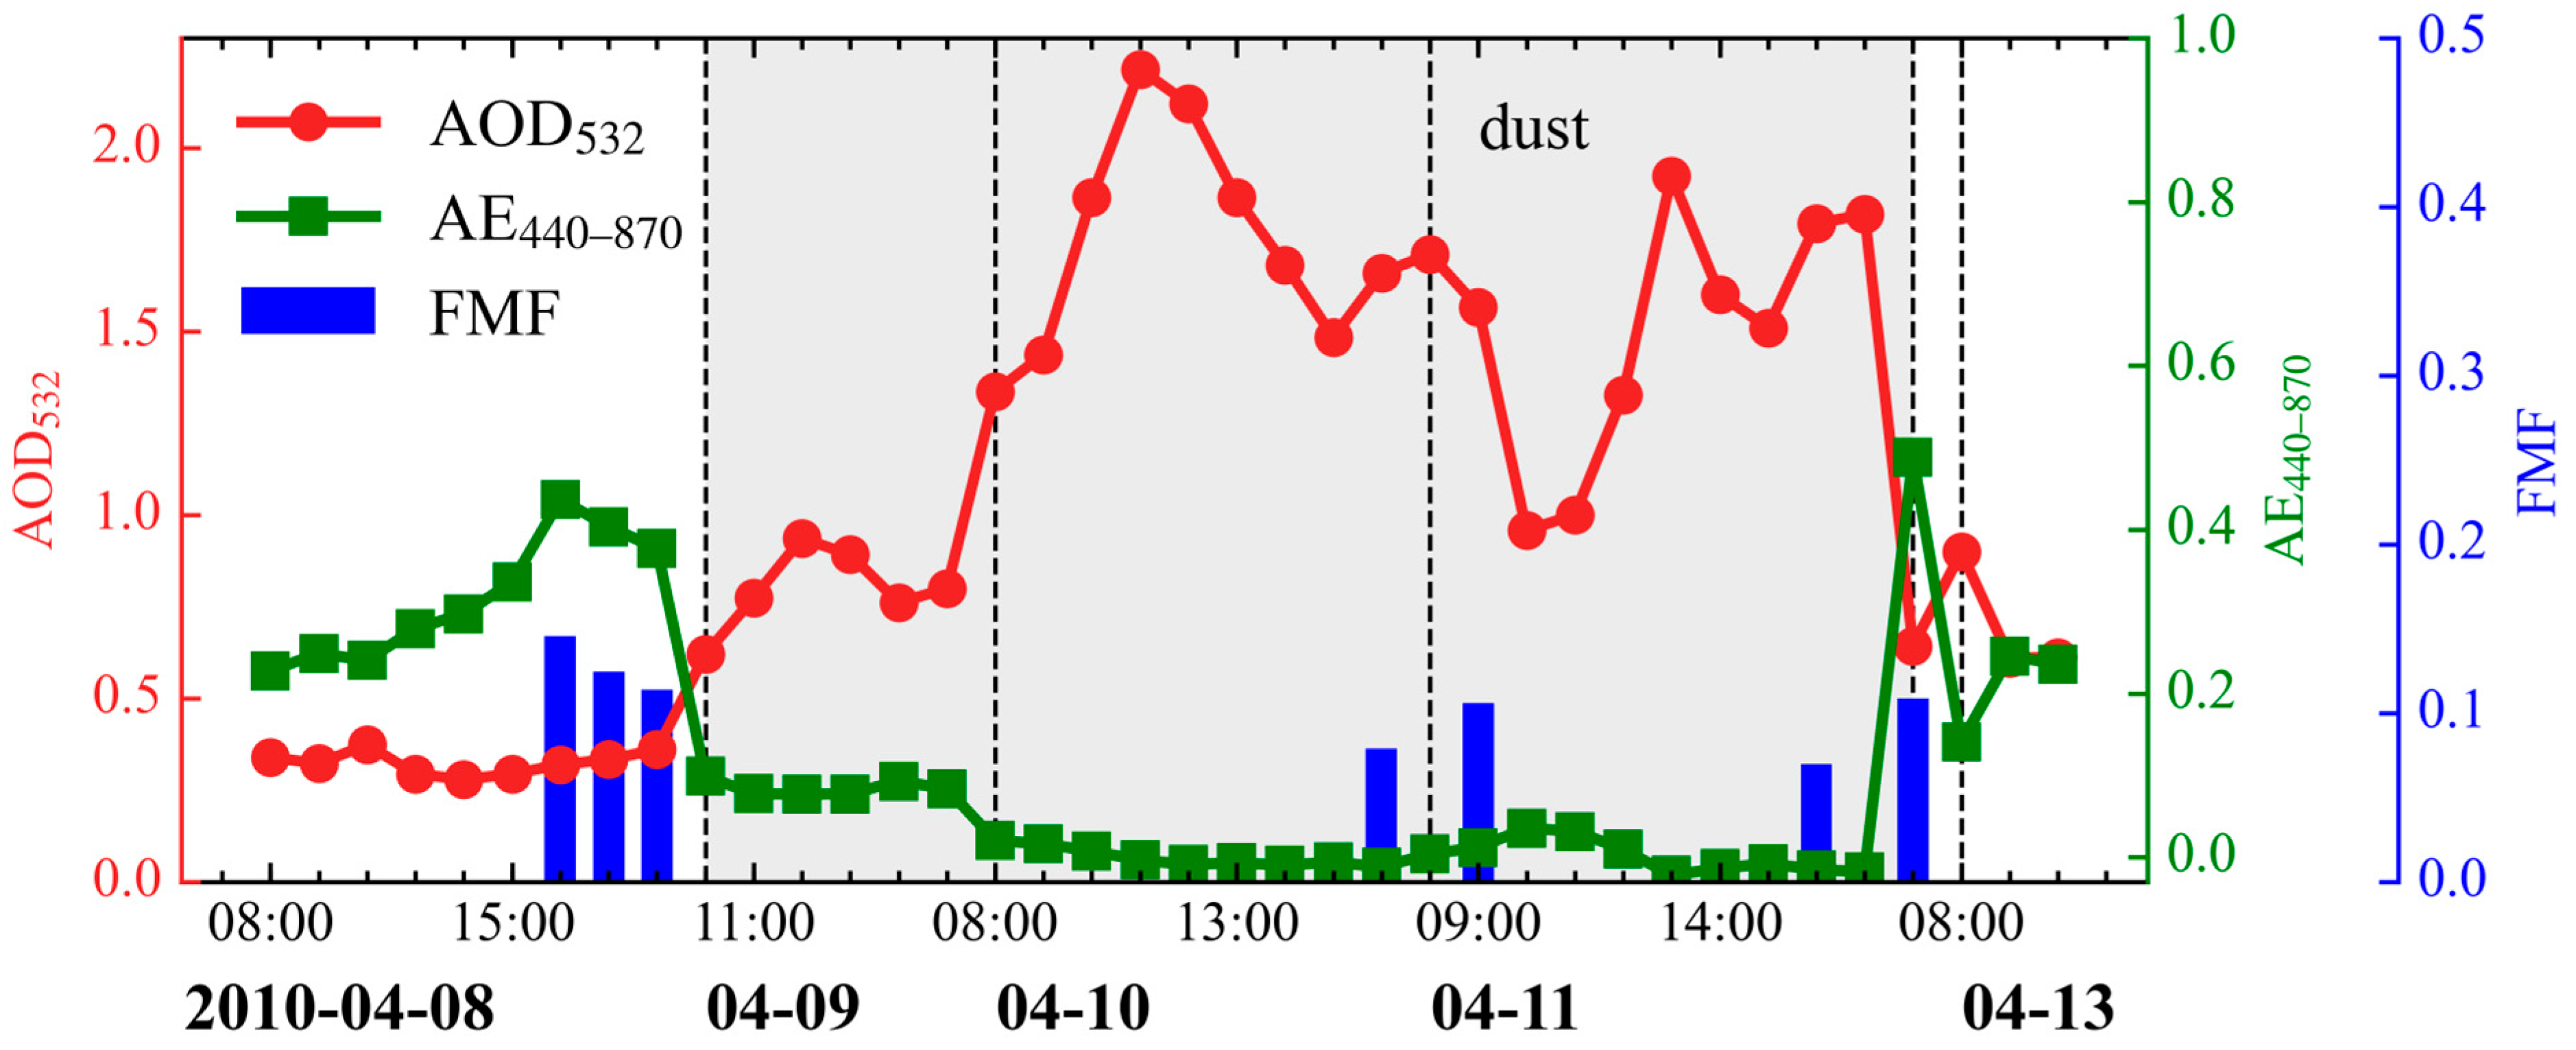
3.2.2. Optical and Microphysical Properties of Aerosol in the Dust Event
4. Conclusions and Discussion
- (1)
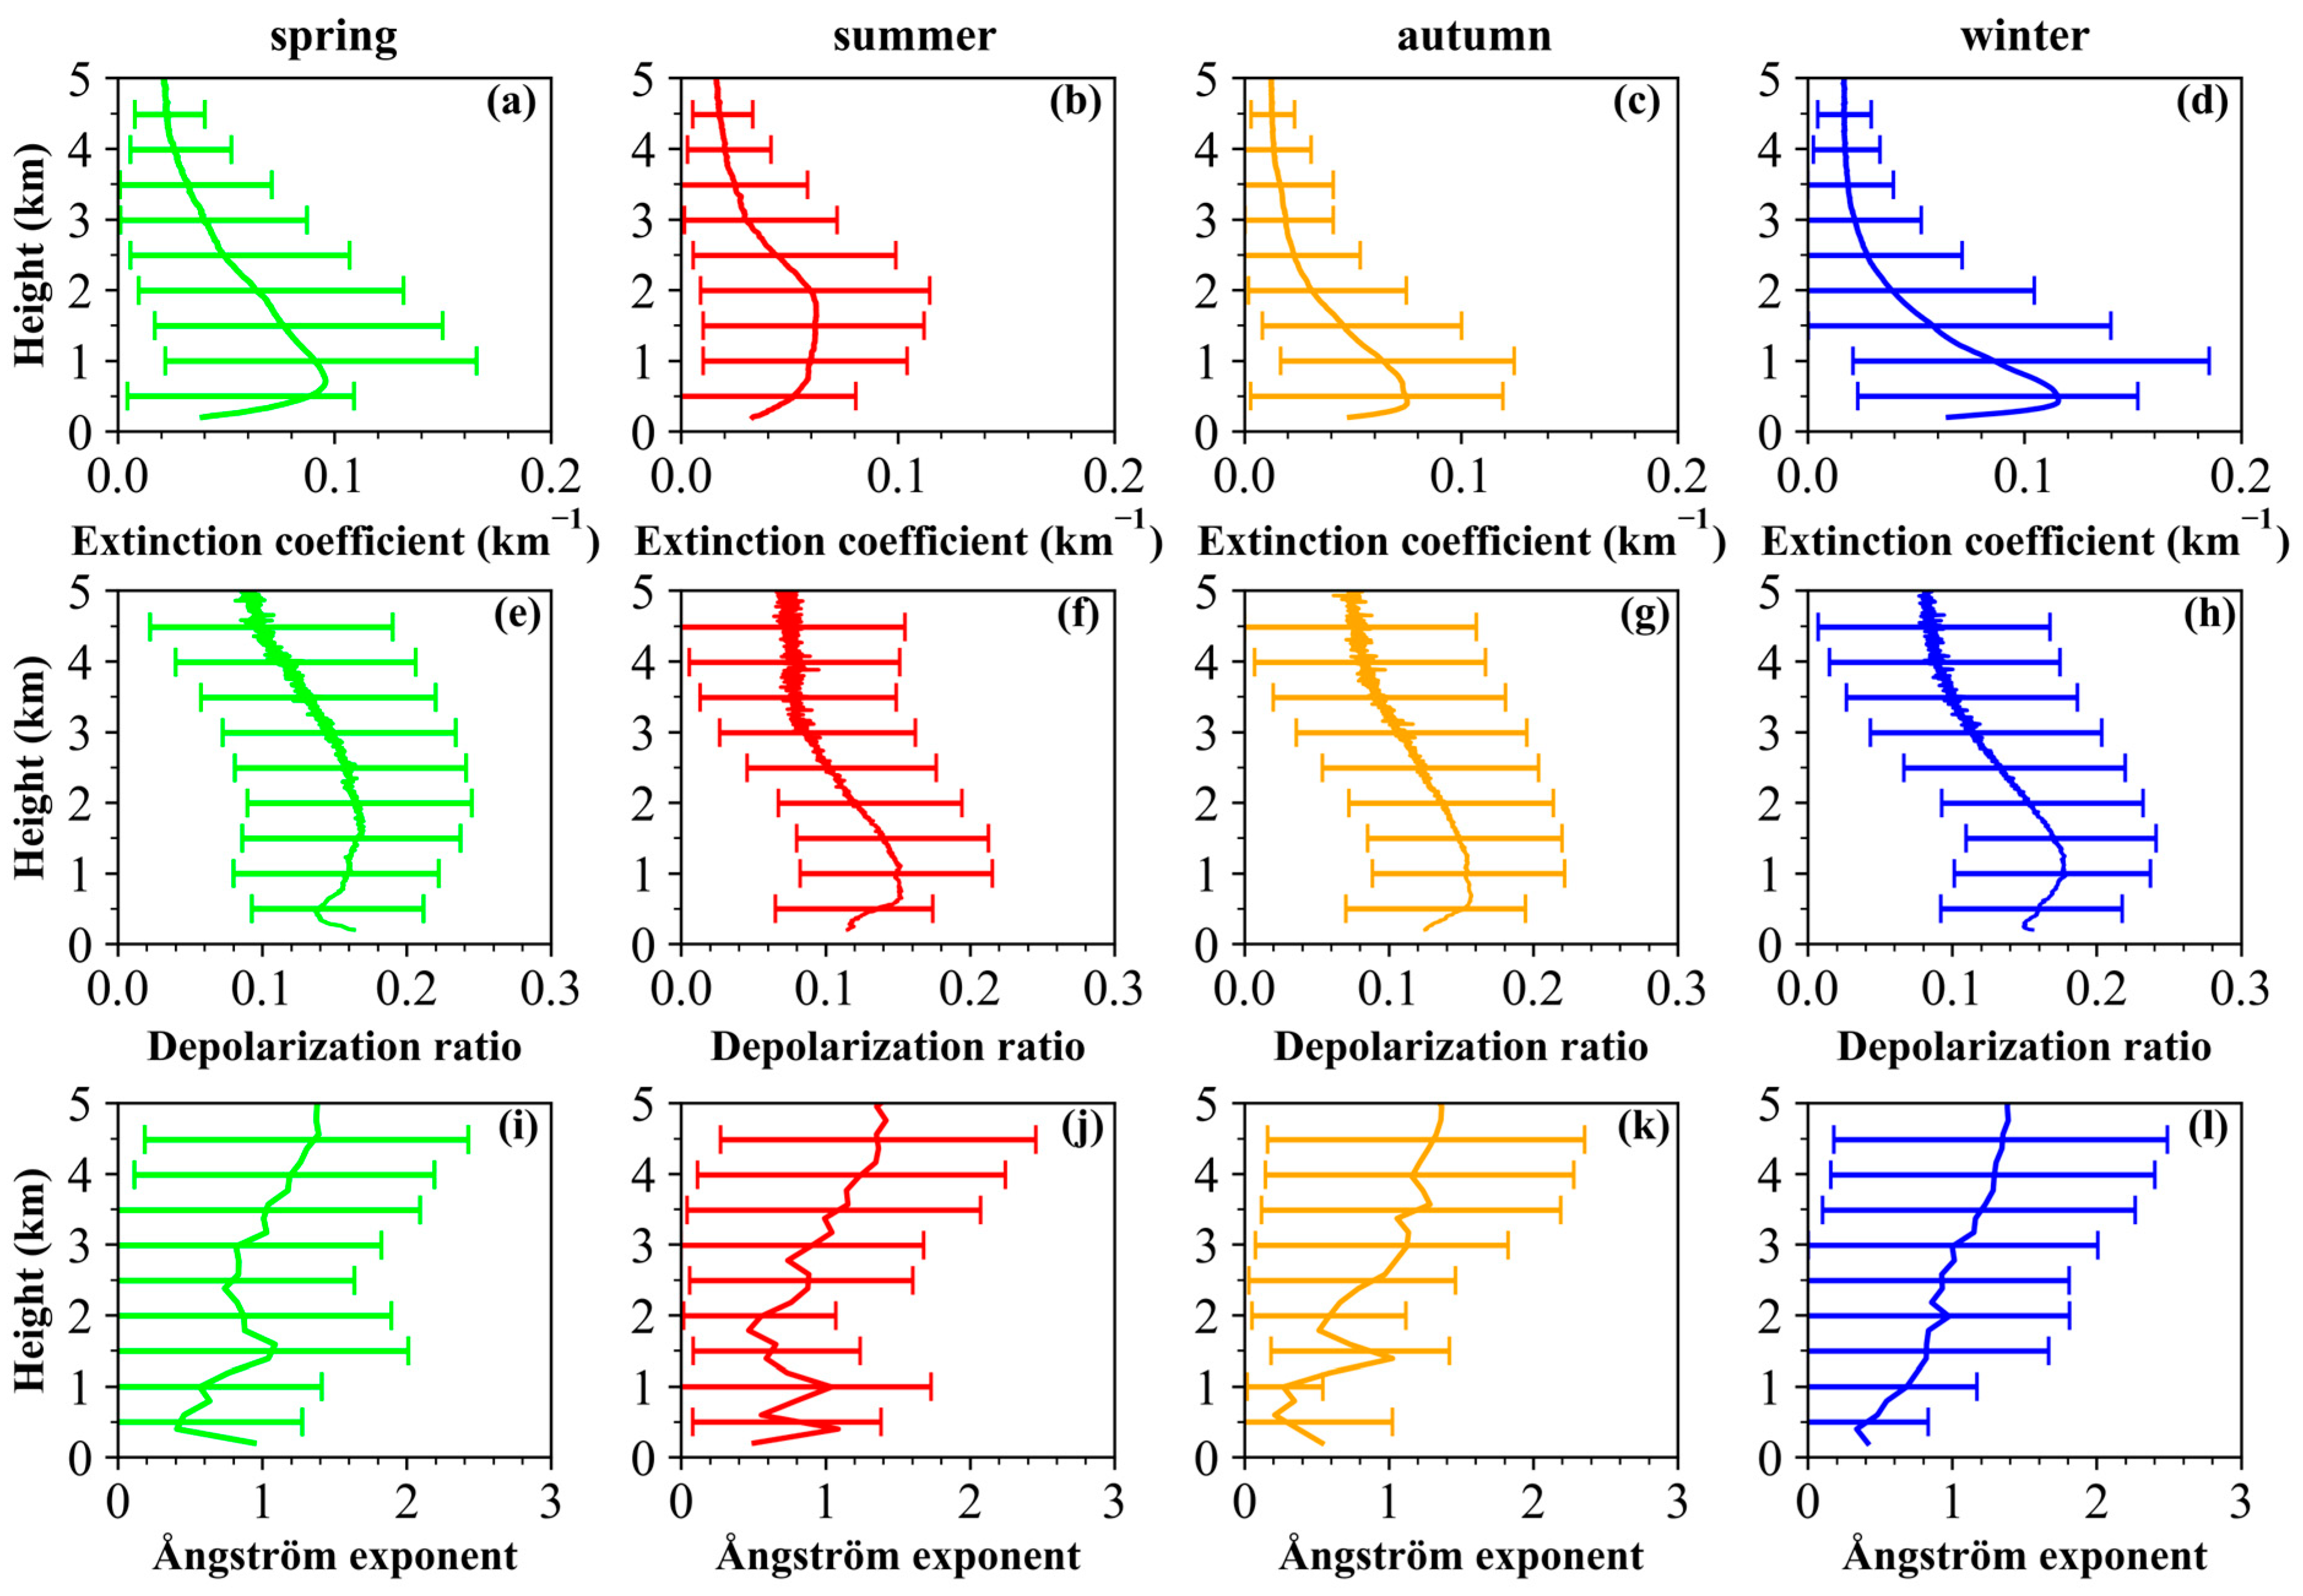
- The vertical profiles of the extinction coefficient and depolarization ratio show seasonal variation characteristics. In the winter, the heating and stable meteorological conditions lead to the extinction coefficient near the surface being the largest and decreased rapidly with height, while due to the strong convection mainly in the summer, the aerosols distributed uniformly below 2 km and the average extinction coefficient was the smallest.
- (2)
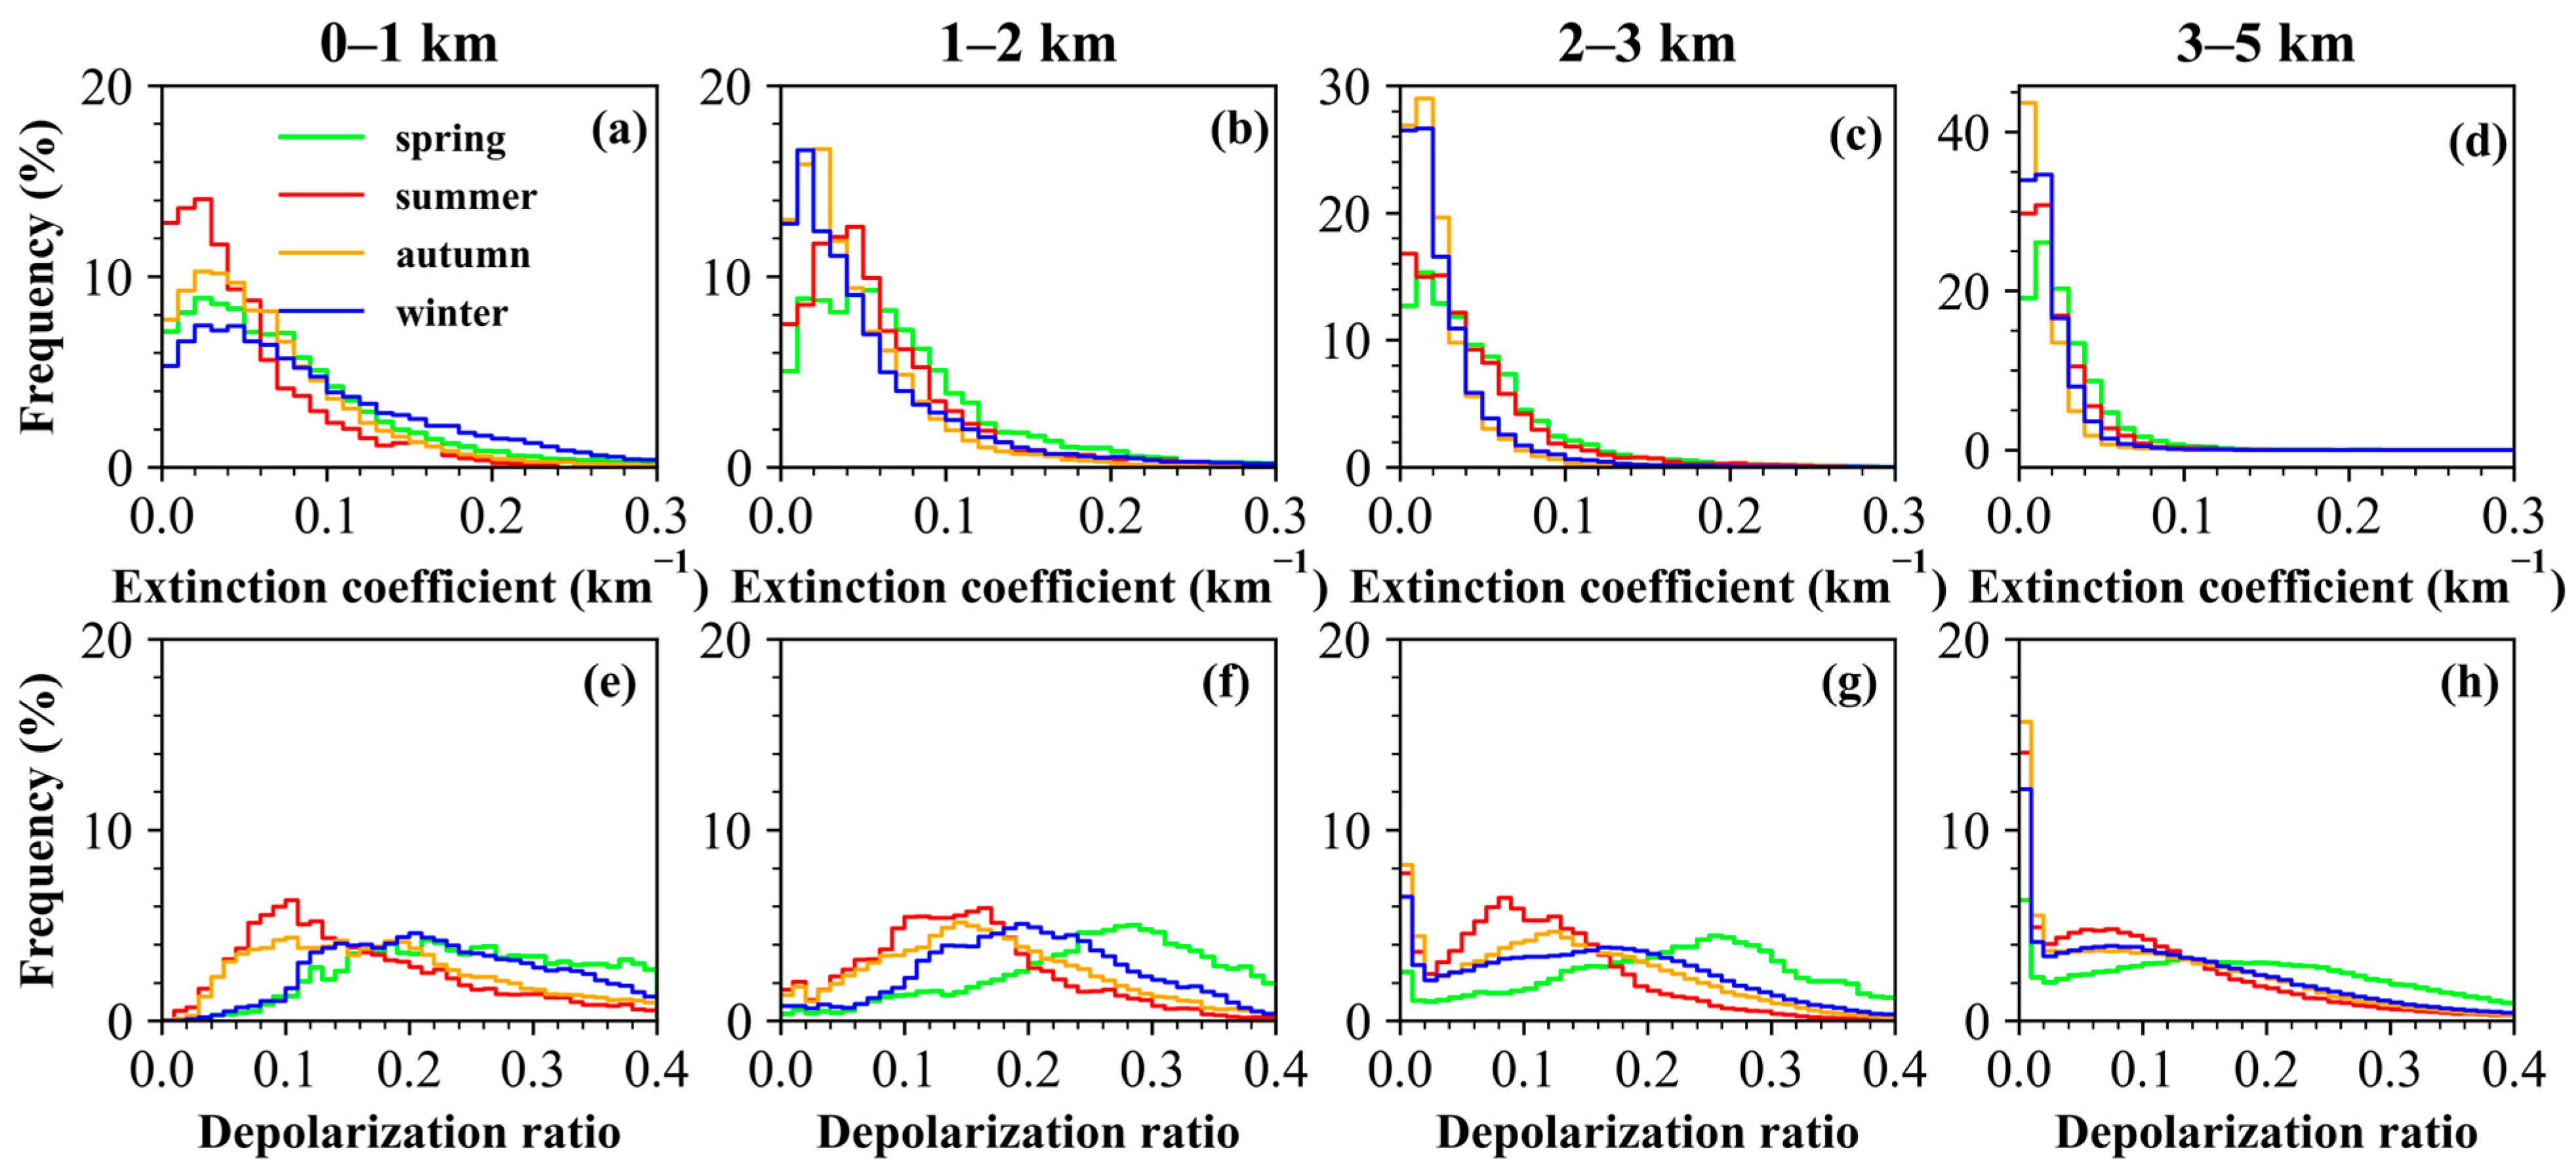
- The depolarization ratio decreased with increasing height in all four seasons, and it was the greatest near the surface in the spring, followed by the winter, autumn and summer. In the spring, the degree of non-spherical was most distinctively due to the presence of dust aerosol, and the depolarization ratio ranged from 0 to 0.35 below 3 km, while the depolarization ratio was mainly between 0 and 0.15 in the summer. The backscatter Ångström exponent had similar vertical variation characteristics in the four seasons, and the particle size of aerosol in the lower layers was larger than that in the upper layers.
- (3)
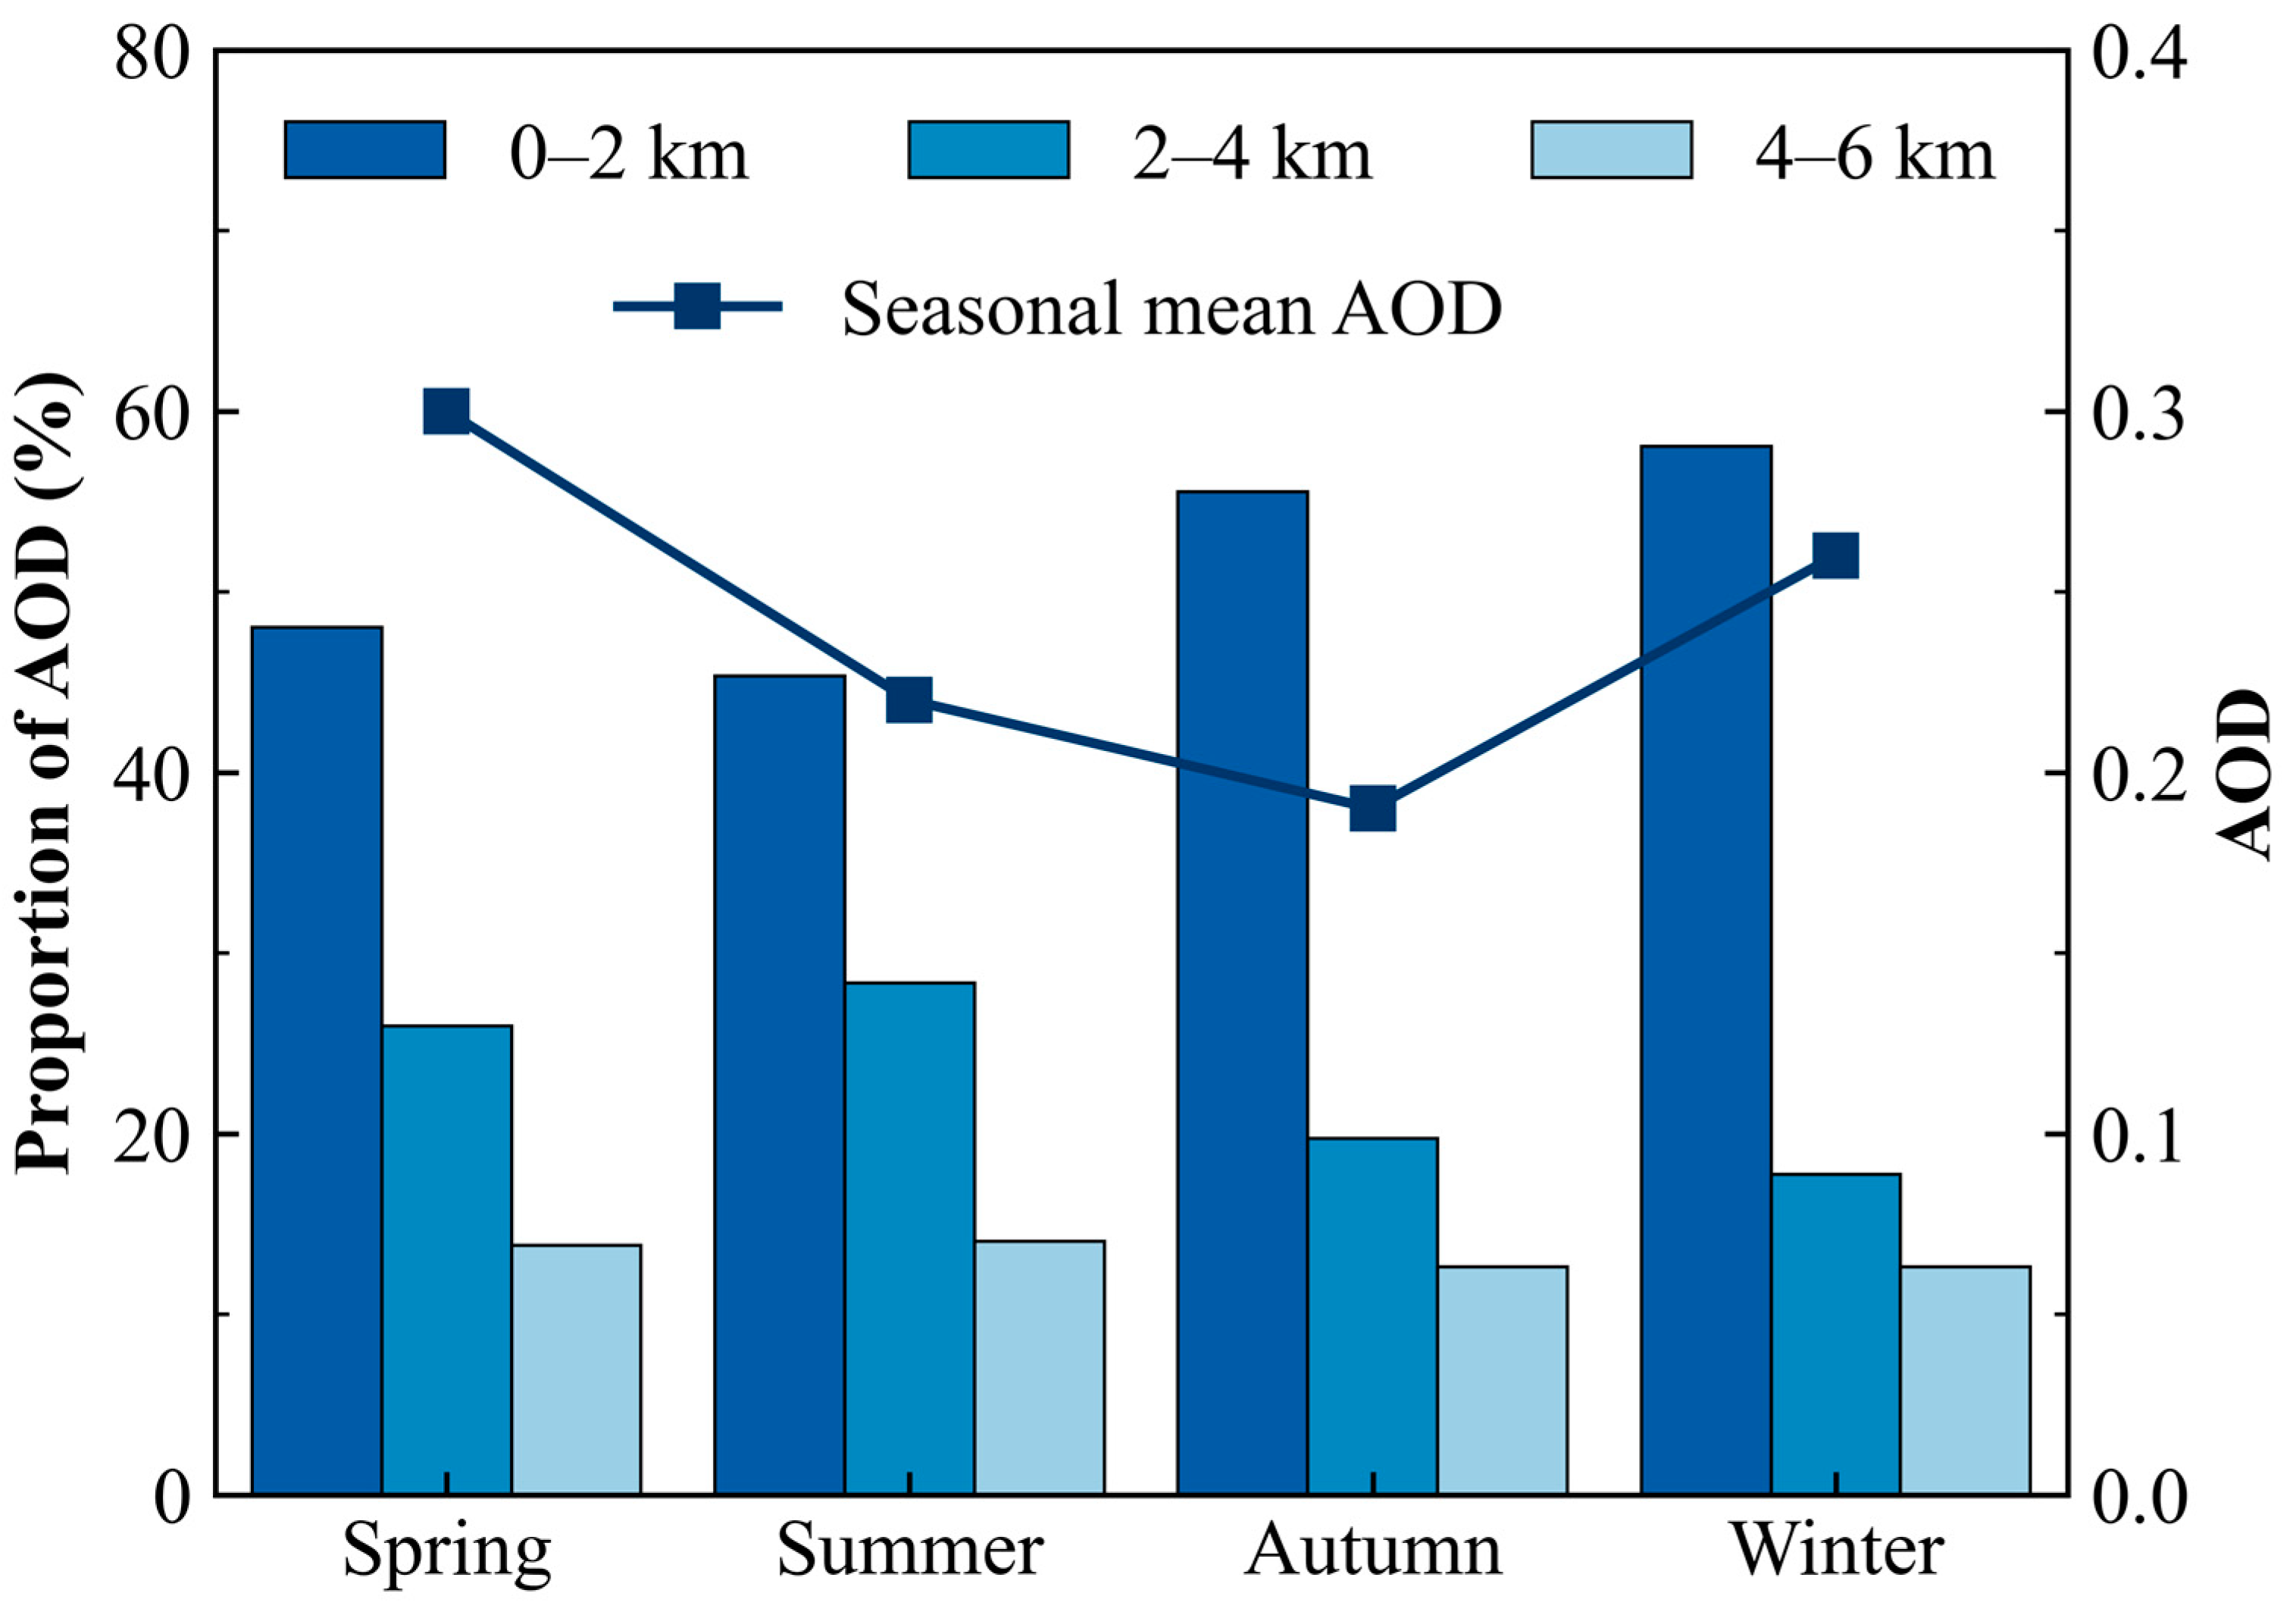
- The aerosol extinction coefficient at 0–2 km contributed most to the total extinction coefficient, and the AOD of spring, summer, autumn and winter accounted for 48%, 45%, 56% and 58% of the total AOD. The mean AOD was 0.30 ± 0.16, 0.22 ± 0.14, 0.19 ± 0.10 and 0.26 ± 0.15 in the spring, summer, autumn and winter, respectively. The main pollutants were dust aerosols in the spring and the mixtures of dust with anthropogenic pollution in the winter.
- (4)
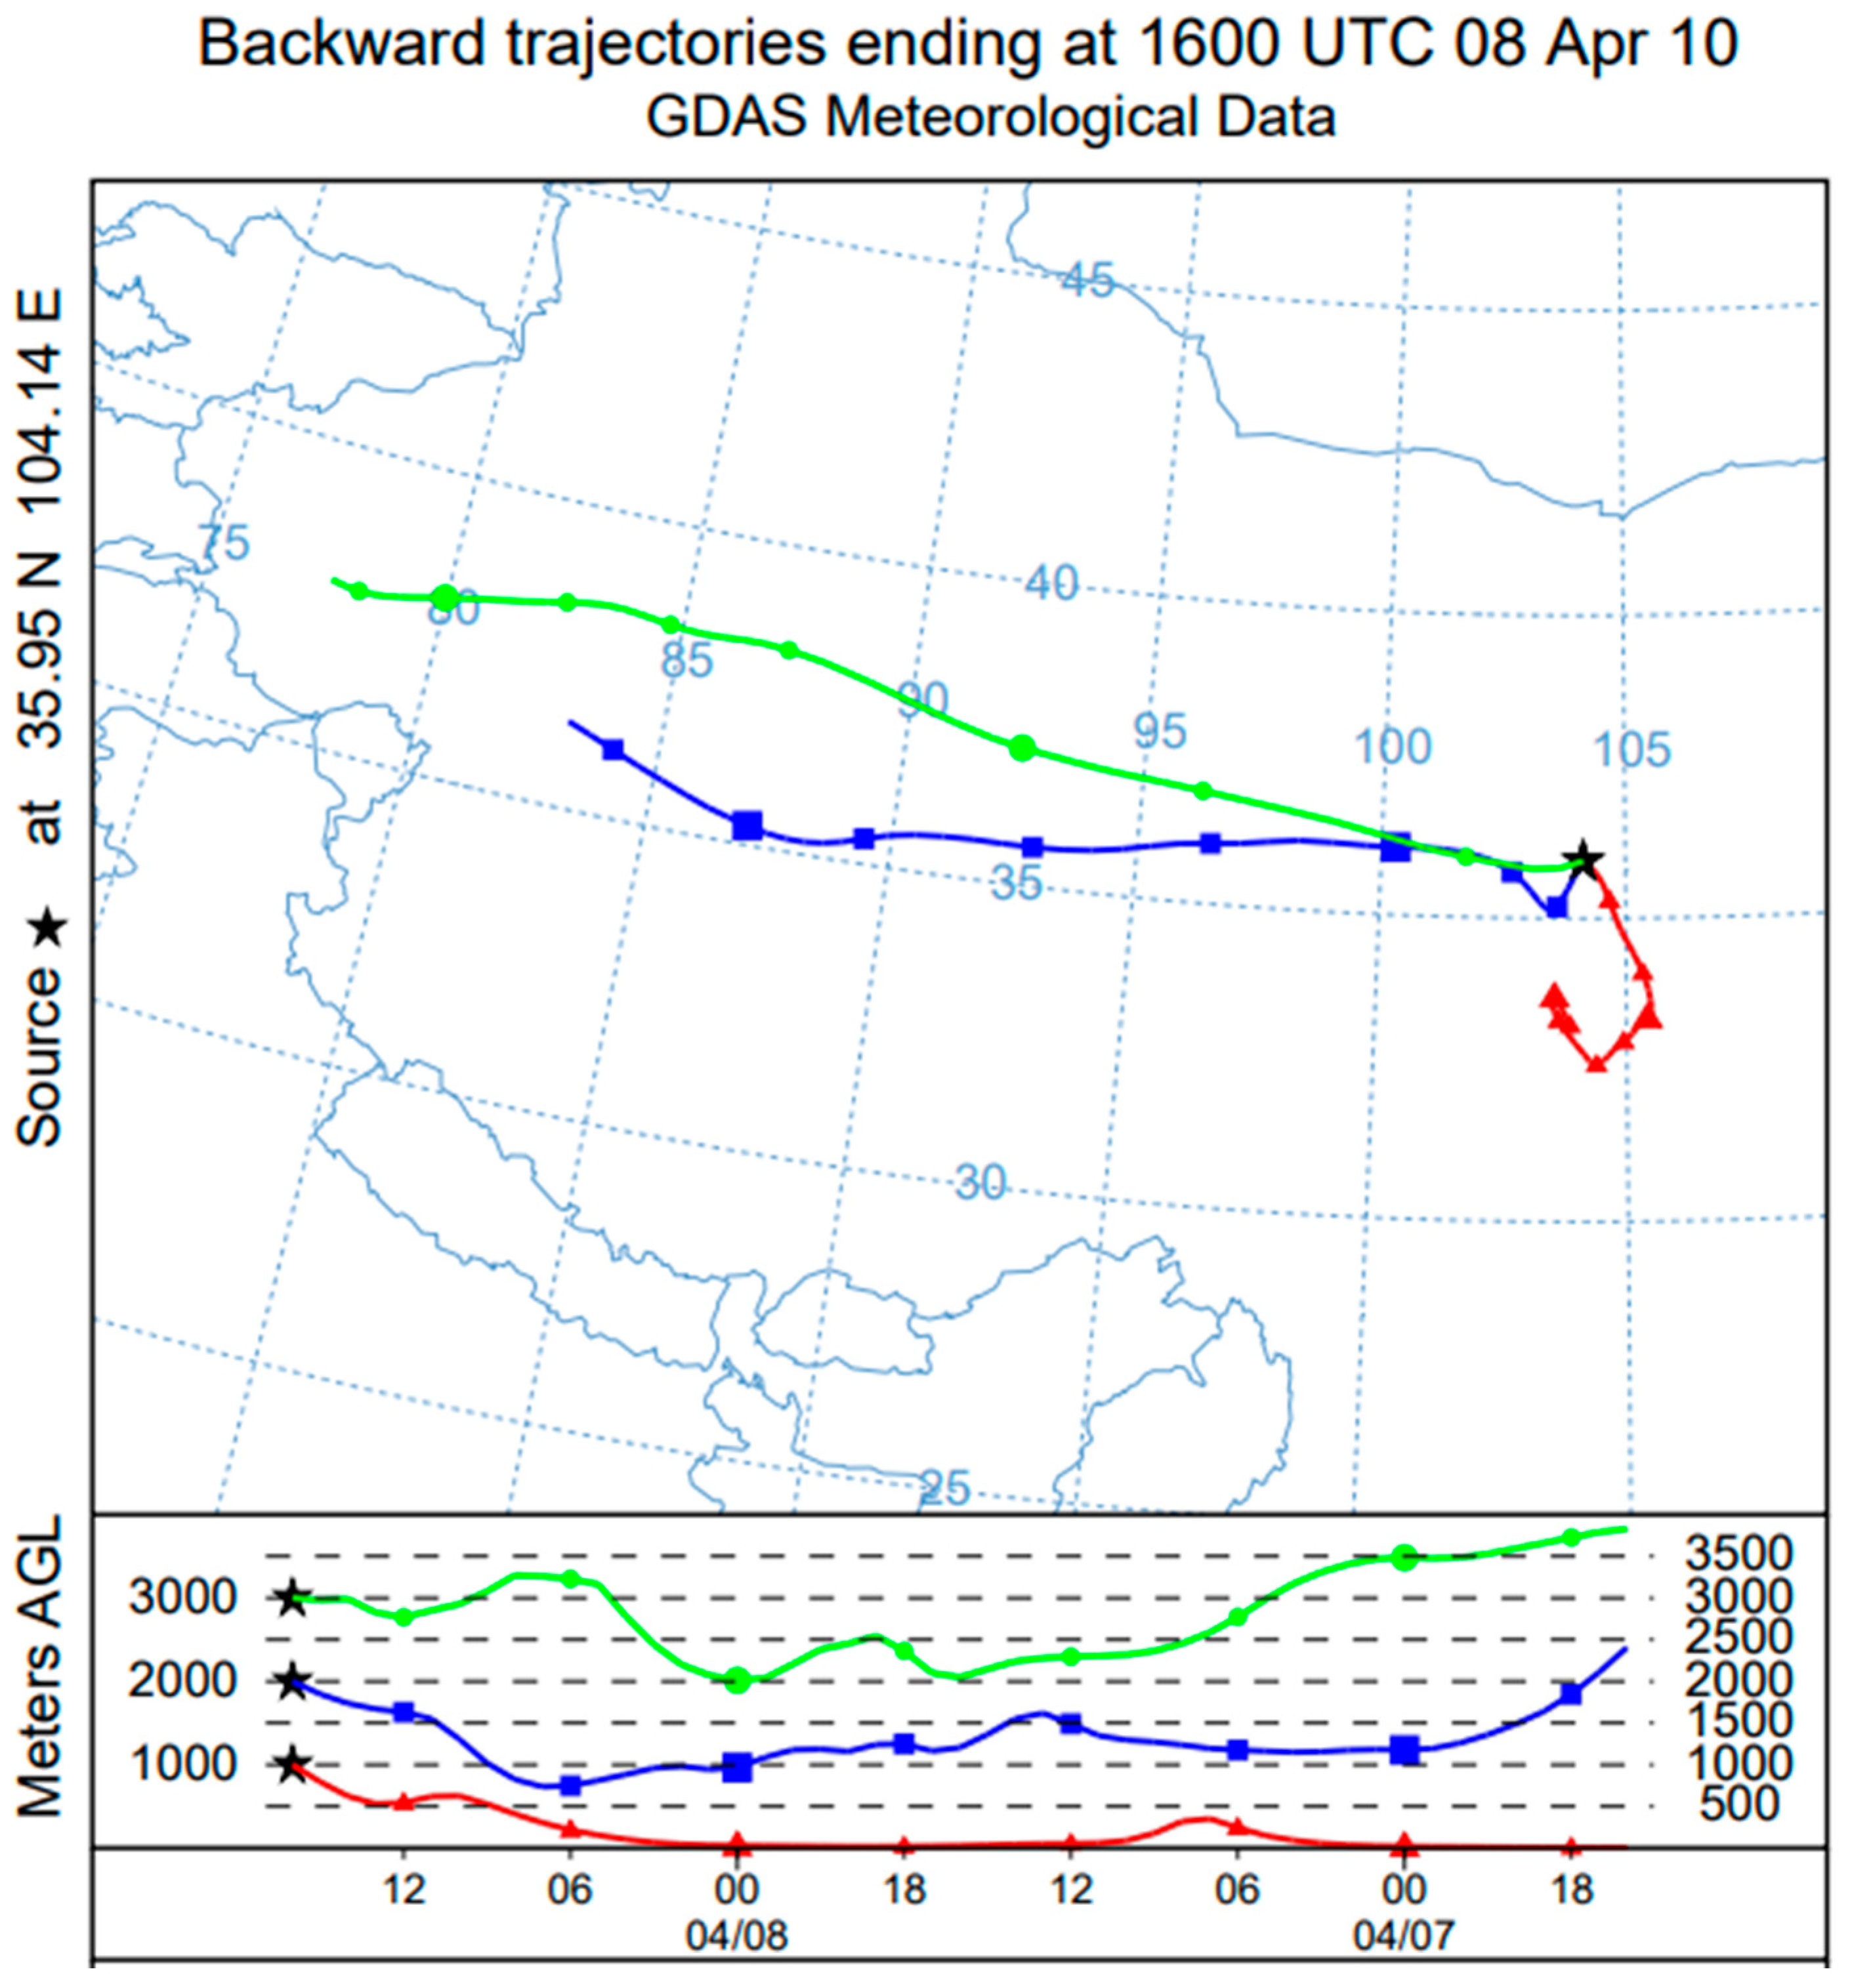
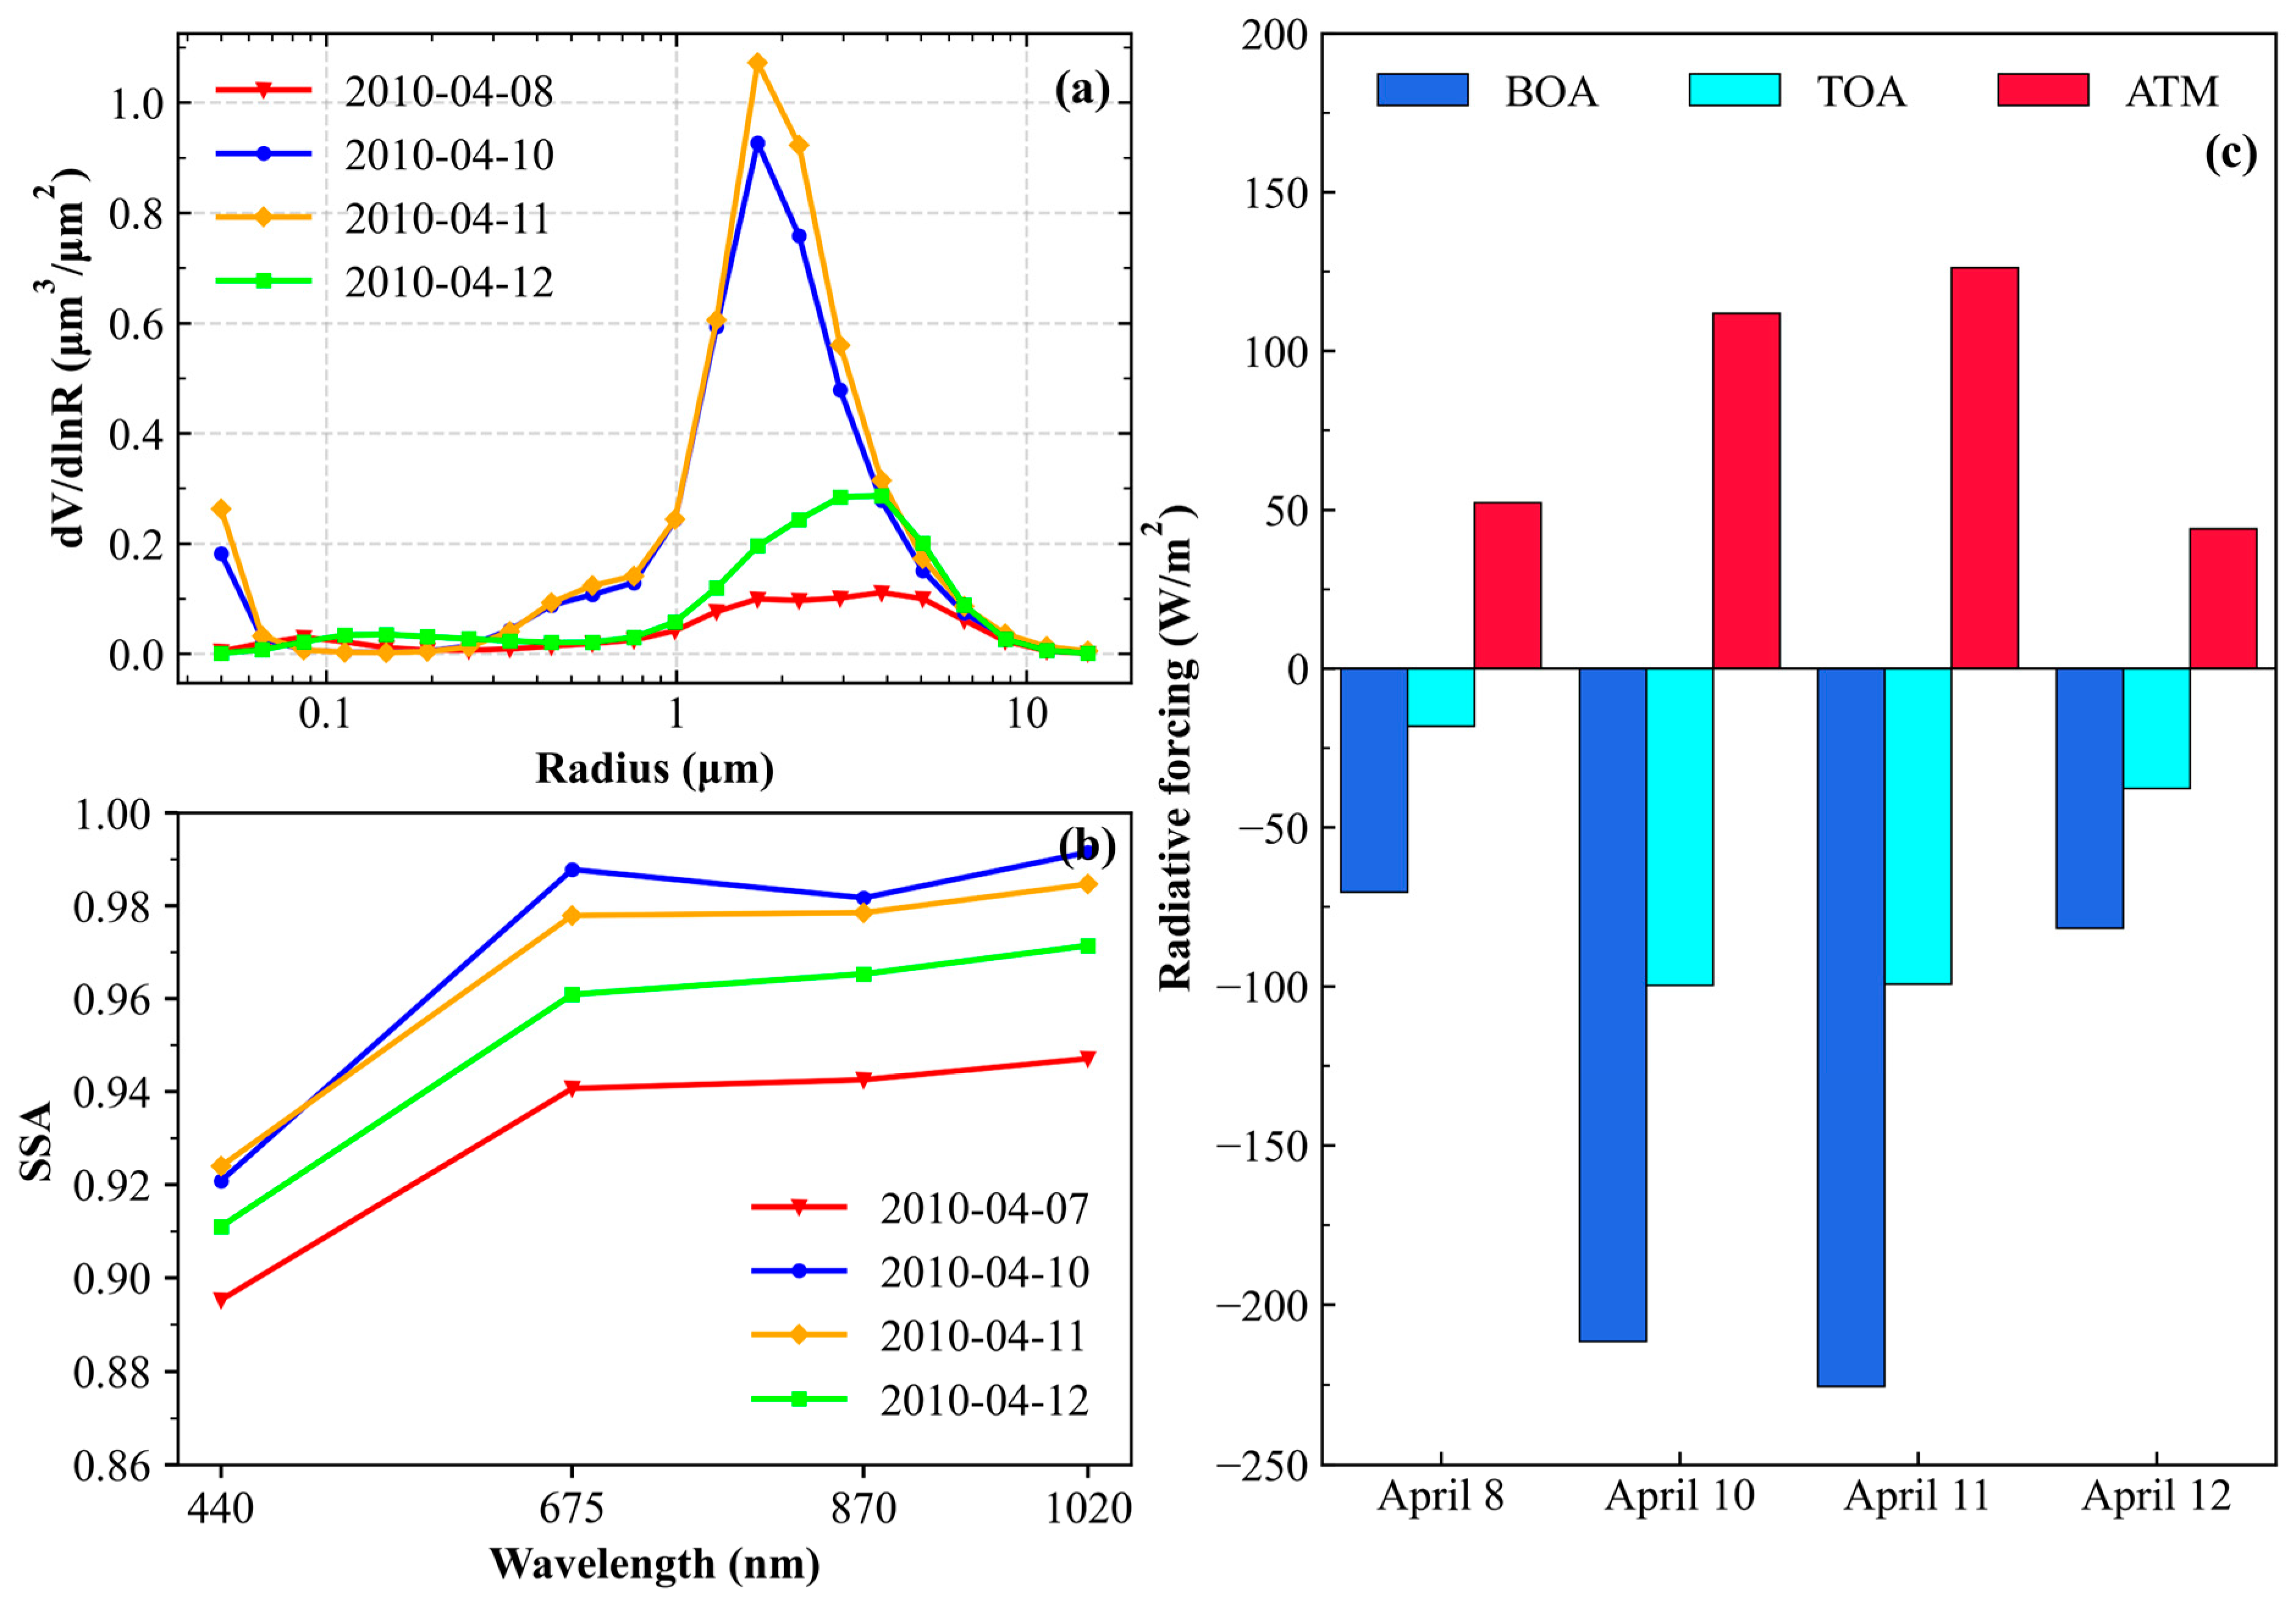
- During the dust event from 9 April to 11 April 2010, the dust mainly originated from the Taklimakan Desert and was transported over a long distance at a high altitude. The depolarization ratio, extinction coefficient and AOD increased drastically when the dust arrived. The SSA was between 0.92 and 0.99. The AE was less than 0.1, indicating that coarse-mode particles dominated in the whole dust event. The dust aerosol resulted in the decrease in solar radiation reaching the surface and the enhancement of a cooling effect at the surface. With the increasing of radiative forcing in the atmosphere, the maximum reached 126.15 W/m2.
Author Contributions
Funding
Data Availability Statement
Acknowledgments
Conflicts of Interest
References
- Twomey, S. Aerosols, Clouds and Radiation. Atmos. Environ. 1991, 25, 2435–2442. [Google Scholar] [CrossRef]
- Yin, Y.; Wurzler, S.; Levin, Z.; Reisin, T.G. Interactions of Mineral Dust Particles and Clouds: Effects on Precipitation and Cloud Optical Properties. J. Geophys. Res. 2002, 107, AAC 19-1–AAC 19-14. [Google Scholar] [CrossRef]
- Li, J.; Carlson, B.E.; Yung, Y.L.; Lv, D.; Hansen, J.; Penner, J.E.; Liao, H.; Ramaswamy, V.; Kahn, R.A.; Zhang, P.; et al. Scattering and Absorbing Aerosols in the Climate System. Nat. Rev. Earth Environ. 2022, 3, 363–379. [Google Scholar] [CrossRef]
- Monforte, P.; Ragusa, M.A. Temperature Trend Analysis and Investigation on a Case of Variability Climate. Mathematics 2022, 10, 2202. [Google Scholar] [CrossRef]
- Che, H.; Xia, X.; Zhu, J.; Wang, H.; Wang, Y.; Sun, J.; Zhang, X.; Shi, G. Aerosol Optical Properties under the Condition of Heavy Haze over an Urban Site of Beijing, China. Environ. Sci. Pollut. Res. 2015, 22, 1043–1053. [Google Scholar] [CrossRef]
- Manisalidis, I.; Stavropoulou, E.; Stavropoulos, A.; Bezirtzoglou, E. Environmental and Health Impacts of Air Pollution: A Review. Front. Public Health 2020, 8, 14. [Google Scholar] [CrossRef]
- IPCC. Climate Change 2013: The Physical Science Basis; Cambridge University Press: Cambridge, UK, 2013. [Google Scholar]
- IPCC. Climate Change 2021: The Physical Science Basis; Cambridge University Press: Cambridge, UK, 2021. [Google Scholar]
- Chung, C.E.; Ramanathan, V.; Kim, D.; Podgorny, I.A. Global Anthropogenic Aerosol Direct Forcing Derived from Satellite and Ground-Based Observations. J. Geophys. Res. 2005, 110, D24207. [Google Scholar]
- Satheesh, S.K.; Moorthy, K.K.; Babu, S.S.; Vinoj, V.; Dutt, C.B.S. Climate Implications of Large Warming by Elevated Aerosol over India. Geophys. Res. Lett. 2008, 35, L19809. [Google Scholar] [CrossRef]
- Li, J.; Jian, B.; Huang, J.; Hu, Y.; Zhao, C.; Kawamoto, K.; Liao, S.; Wu, M. Long-Term Variation of Cloud Droplet Number Concentrations from Space-Based Lidar. Remote Sens. Environ. 2018, 213, 144–161. [Google Scholar] [CrossRef]
- Radhakrishnan, S.R.; Satyanarayana, M.; KrishnaKumar, V.; Mahadevan pillai, V.P.; Reghunath, K. Lidar measurements on aerosol characteristics at the tropical stations Trivandrum (8.33°N, 77°E) and Gadanki (13.5°N, 79.2°E). In Proceedings of the 2009 International Conference on Ultra Modern Telecommunications & Workshops, St. Petersburg, Russia, 12–14 October 2009; pp. 1–4. [Google Scholar] [CrossRef]
- Lv, M.; Wang, Z.; Li, Z.; Luo, T.; Ferrare, R.; Liu, D.; Wu, D.; Mao, J.; Wan, B.; Zhang, F.; et al. Retrieval of Cloud Condensation Nuclei Number Concentration Profiles from Lidar Extinction and Backscatter Data. J. Geophys. Res. Atmos. 2018, 123, 6082–6098. [Google Scholar] [CrossRef]
- Liu, B.; Ma, X.; Ma, Y.; Li, H.; Jin, S.; Fan, R.; Gong, W. The Relationship between Atmospheric Boundary Layer and Temperature Inversion Layer and Their Aerosol Capture Capabilities. Atmos. Res. 2022, 271, 106121. [Google Scholar] [CrossRef]
- Hayasaka, T.; Satake, S.; Shimizu, A.; Sugimoto, N.; Matsui, I.; Aoki, K.; Muraji, Y. Vertical Distribution and Optical Properties of Aerosols Observed over Japan during the Atmospheric Brown Clouds–East Asia Regional Experiment 2005. J. Geophys. Res. 2007, 112, D22S35. [Google Scholar] [CrossRef]
- Menon, S. Current uncertainties in assessing aerosol effects on climate. Annu. Rev. Environ. Resour. 2004, 29, 1–30. [Google Scholar] [CrossRef]
- Liu, Y.; Lin, T.; Hong, J.; Wang, Y.; Shi, L.; Huang, Y.; Wu, X.; Zhou, H.; Zhang, J.; de Leeuw, G. Multi-Dimensional Satellite Observations of Aerosol Properties and Aerosol Types over Three Major Urban Clusters in Eastern China. Atmos. Chem. Phys. 2021, 21, 12331–12358. [Google Scholar] [CrossRef]
- Yu, X.; Zhu, B.; Fan, S.; Yin, Y.; Bu, X. Ground-Based Observation of Aerosol Optical Properties in Lanzhou, China. J. Environ. Sci. 2009, 21, 1519–1524. [Google Scholar] [CrossRef]
- Filonchyk, M.; Yan, H. The characteristics of air pollutants during different seasons in the urban area of Lanzhou, Northwest China. Environ. Earth Sci. 2018, 77, 763. [Google Scholar] [CrossRef]
- Cao, X.; Wang, Z.; Tian, P.; Wang, J.; Zhang, L.; Quan, X. Statistics of Aerosol Extinction Coefficient Profiles and Optical Depth Using Lidar Measurement over Lanzhou, China since 2005–2008. J. Quant. Spectrosc. Radiat. Transf. 2013, 122, 150–154. [Google Scholar] [CrossRef]
- Liu, Y.; Huang, J.; Shi, G.; Takamura, T.; Khatri, P.; Bi, J.; Shi, J.; Wang, T.; Wang, X.; Zhang, B. Aerosol Optical Properties and Radiative Effect Determined from Sky-Radiometer over Loess Plateau of Northwest China. Atmos. Chem. Phys. 2011, 11, 11455–11463. [Google Scholar] [CrossRef]
- Gong, C.; Xin, J.; Wang, S.; Wang, Y.; Zhang, T. Anthropogenic Aerosol Optical and Radiative Properties in the Typical Urban/Suburban Regions in China. Atmos. Res. 2017, 197, 177–187. [Google Scholar] [CrossRef]
- Yu, J.; Che, H.; Chen, Q.; Xia, X.; Zhao, H.; Wang, H.; Wang, Y.; Zhang, X.; Shi, G. Investigation of Aerosol Optical Depth (AOD) and Ångström Exponent over the Desert Region of Northwestern China Based on Measurements from the China Aerosol Remote Sensing Network (CARSNET). Aerosol Air Qual. Res. 2015, 15, 2024–2036. [Google Scholar] [CrossRef]
- Wang, S.; Yuan, W.; Shang, K. The Impacts of Different Kinds of Dust Events on PM10 Pollution in Northern China. Atmos. Environ. 2006, 40, 7975–7982. [Google Scholar] [CrossRef]
- Wu, X.; Liu, J.; Wu, Y.; Wang, X.; Yu, X.; Shi, J.; Bi, J.; Huang, Z.; Zhou, T.; Zhang, R. Aerosol Optical Absorption Coefficients at a Rural Site in Northwest China: The Great Contribution of Dust Particles. Atmos. Environ. 2018, 189, 145–152. [Google Scholar] [CrossRef]
- Wang, W.; Huang, J.; Zhou, T.; Bi, J.; Lin, L.; Chen, Y.; Huang, Z.; Su, J. Estimation of Radiative Effect of a Heavy Dust Storm over Northwest China Using Fu–Liou Model and Ground Measurements. J. Quant. Spectrosc. Radiat. Transf. 2013, 122, 114–126. [Google Scholar] [CrossRef]
- Huang, J.; Zhang, W.; Zuo, J.; Bi, J.; Shi, J.; Wang, X.; Chang, Z.; Huang, Z.; Yang, S.; Zhang, B.; et al. An Overview of the Semi-Arid Climate and Environment Research Observatory over the Loess Plateau. Adv. Atmos. Sci. 2008, 25, 906–921. [Google Scholar] [CrossRef]
- Shimizu, A.; Nishizawa, T.; Jin, Y.; Kim, S.-W.; Wang, Z.; Batdorj, D.; Sugimoto, N. Evolution of a Lidar Network for Tropospheric Aerosol Detection in East Asia. Opt. Eng. 2016, 56, 031219. [Google Scholar] [CrossRef]
- Sugimoto, N.; Huang, Z. Lidar Methods for Observing Mineral Dust. J. Meteorol. Res. 2014, 28, 173–184. [Google Scholar] [CrossRef]
- Murayama, T.; Okamoto, H.; Kaneyasu, N.; Kamataki, H.; Miura, K. Application of Lidar Depolarization Measurement in the Atmospheric Boundary Layer: Effects of Dust and Sea-Salt Particles. J. Geophys. Res. 1999, 104, 31781–31792. [Google Scholar] [CrossRef]
- Gasteiger, J.; Wiegner, M.; Groß, S.; Freudenthaler, V.; Toledano, C.; Tesche, M.; Kandler, K. Modelling Lidar-Relevant Optical Properties of Complex Mineral Dust Aerosols. Tellus B 2011, 63, 725. [Google Scholar] [CrossRef]
- Gao, X.; Cao, X.; Tian, P.; Zhang, L.; Huang, Z.; Zhou, T. Combined Observation of a Dust Storm over the Loess Plateau Using a Dual-Wavelength Lidar and an Aethalometer. Atmos. Pollut. Res. 2017, 8, 1103–1112. [Google Scholar] [CrossRef]
- Freudenthaler, V.; Esselborn, M.; Wiegner, M.; Heese, B.; Tesche, M.; Ansmann, A.; Müller, D.; Althausen, D.; Wirth, M.; Fix, A.; et al. Depolarization Ratio Profiling at Several Wavelengths in Pure Saharan Dust during SAMUM 2006. Tellus B 2009, 61, 165. [Google Scholar] [CrossRef]
- Cao, X.; Liang, J.; Tian, P.; Zhang, L.; Quan, X.; Liu, W. The Mass Concentration and Optical Properties of Black Carbon Aerosols over a Semi–Arid Region in the Northwest of China. Atmos. Pollut. Res. 2014, 5, 601–609. [Google Scholar] [CrossRef]
- Gao, X.; Cao, X.; Wang, J.; Guo, Q.; Du, T.; Zhang, L. Analysis of Aerosol Optical Properties in a Lanzhou Suburb of China. Atmos. Res. 2020, 246, 105098. [Google Scholar] [CrossRef]
- Mao, F.; Gong, W.; Zhu, Z. Simple Multiscale Algorithm for Layer Detection with Lidar. Appl. Opt. 2011, 50, 6591. [Google Scholar] [CrossRef]
- Fernald, F.G. Analysis of Atmospheric Lidar Observations: Some Comments. Appl. Opt. 1984, 23, 652. [Google Scholar] [CrossRef]
- Wiegner, M.; Groß, S.; Freudenthaler, V.; Schnell, F.; Gasteiger, J. The May/June 2008 Saharan dust event over Munich: Intensive aerosol parameters from lidar measurements. J. Geophys. Res. 2011, 116, D23213. [Google Scholar] [CrossRef]
- Mattis, I.; Ansmann, A.; Müller, D.; Wandinger, U.; Althausen, D. Dual-wavelength Raman lidar observations of the extinction-to-backscatter ratio of Saharan dust. Geophys. Res. Lett. 2002, 29, 20-1–20-24. [Google Scholar] [CrossRef]
- Müller, D.; Ansmann, A.; Mattis, I.; Tesche, M.; Wandinger, U.; Althausen, D.; Pisani, G. Aerosol-Type-Dependent Lidar Ratios Observed with Raman Lidar. J. Geophys. Res. 2007, 112, D16202. [Google Scholar] [CrossRef]
- Sheng, Z.; Che, H.; Chen, Q.; Xia, X.; Liu, D.; Wang, Z.; Zhao, H.; Gui, K.; Zheng, Y.; Sun, T.; et al. Aerosol Vertical Distribution and Optical Properties of Different Pollution Events in Beijing in Autumn 2017. Atmos. Res. 2019, 215, 193–207. [Google Scholar] [CrossRef]
- Holben, B.N.; Eck, T.F.; Slutsker, I.; Tanré, D.; Buis, J.P.; Setzer, A.; Vermote, E.; Reagan, J.A.; Kaufman, Y.J.; Nakajima, T.; et al. AERONET—A Federated Instrument Network and Data Archive for Aerosol Characterization. Remote Sens. Environ. 1998, 66, 1–16. [Google Scholar] [CrossRef]
- Giles, D.M.; Sinyuk, A.; Sorokin, M.G.; Schafer, J.S.; Smirnov, A.; Slutsker, I.; Eck, T.F.; Holben, B.N.; Lewis, J.R.; Campbell, J.R.; et al. Advancements in the Aerosol Robotic Network (AERONET) Version 3 Database—Automated near-Real-Time Quality Control Algorithm with Improved Cloud Screening for Sun Photometer Aerosol Optical Depth (AOD) Measurements. Atmos. Meas. Tech. 2019, 12, 169–209. [Google Scholar] [CrossRef]
- Draxler, R.R.; Hess, G.D. An Overview of the HYSPLIT_4 Modelling System for Trajectories, Dispersion, and Deposition. Aust. Met. Mag. 1998, 47, 295–308. [Google Scholar]
- Stein, A.F.; Draxler, R.R.; Rolph, G.D.; Stunder, B.J.B.; Cohen, M.D.; Ngan, F. NOAA’s HYSPLIT Atmospheric Transport and Dispersion Modeling System. Bull. Am. Meteorol. Soc. 2015, 96, 2059–2077. [Google Scholar]
- Leng, C.; Duan, J.; Xu, C.; Zhang, H.; Wang, Y.; Wang, Y.; Li, X.; Kong, L.; Tao, J.; Zhang, R.; et al. Insights into a Historic Severe Haze Event in Shanghai: Synoptic Situation, Boundary Layer and Pollutants. Atmos. Chem. Phys. 2016, 16, 9221–9234. [Google Scholar] [CrossRef]
- Guo, J.; Miao, Y.; Zhang, Y.; Liu, H.; Li, Z.; Zhang, W.; He, J.; Lou, M.; Yan, Y.; Bian, L.; et al. The Climatology of Planetary Boundary Layer Height in China Derived Fromradiosonde and Reanalysis Data. Atmos. Chem. Phys. 2016, 16, 13309–13319. [Google Scholar] [CrossRef]
- Sun, T.; Che, H.; Qi, B.; Wang, Y.; Dong, Y.; Xia, X.; Wang, H.; Gui, K.; Zheng, Y.; Zhao, H.; et al. Characterization of Vertical Distribution and Radiative Forcing of Ambient Aerosol over the Yangtze River Delta during 2013–2015. Sci. Total Environ. 2019, 650, 1846–1857. [Google Scholar] [CrossRef] [PubMed]
- Chew, B.N.; Campbell, J.R.; Salinas, S.V.; Chang, C.W.; Reid, J.S.; Welton, E.J.; Holben, B.N.; Liew, S.C. Aerosol Particle Vertical Distributions and Optical Properties over Singapore. Atmos. Environ. 2013, 79, 599–613. [Google Scholar] [CrossRef]
- Liu, B.; Ma, Y.; Gong, W.; Zhang, M. Observations of Aerosol Color Ratio and Depolarization Ratio over Wuhan. Atmos. Pollut. Res. 2017, 8, 1113–1122. [Google Scholar] [CrossRef]
- Sakai, T.; Shibata, T.; Kwon, S.-A.; Kim, Y.-S.; Tamura, K.; Iwasaka, Y. Free tropospheric aerosol backscatter, depolarization ratio, and relative humidity measured with the Raman lidar at Nagoya in 1994–1997: Contributions of aerosols from the Asian Continent and the Pacific Ocean. Atmos. Environ. 2000, 34, 431–442. [Google Scholar] [CrossRef]
- Shimizu, A. Continuous Observations of Asian Dust and Other Aerosols by Polarization Lidars in China and Japan during ACE-Asia. J. Geophys. Res. 2004, 109, D19S17. [Google Scholar] [CrossRef]
- Mishra, A.K.; Shibata, T. Climatological Aspects of Seasonal Variation of Aerosol Vertical Distribution over Central Indo-Gangetic Belt (IGB) Inferred by the Space-Borne Lidar CALIOP. Atmos. Environ. 2012, 46, 365–375. [Google Scholar] [CrossRef]
- Sugimoto, N.; Lee, C.H. Characteristics of Dust Aerosols Inferred from Lidar Depolarization Measurements at Two Wavelengths. Appl. Opt. 2006, 45, 7468. [Google Scholar] [CrossRef] [PubMed]
- Sugimoto, N.; Nishizawa, T.; Shimizu, A.; Matsui, I.; Kobayashi, H. Detection of internally mixed Asian dust with air pollution aerosols using a polarization optical particle counter and a polarization-sensitive two-wavelength lidar. J. Quant. Spectrosc. Radiat. Transf. 2015, 150, 107–113. [Google Scholar] [CrossRef]
- Zhang, X.; Xu, X.; Chen, H.; Hu, X.-M.; Gao, L. Dust-planetary boundary layer interactions amplified by entrainment and advections. Atmos. Res. 2022, 278, 106359. [Google Scholar] [CrossRef]
- Chen, L.; Zhang, M.; Zhu, J.; Skorokhod, A. Model Analysis of Soil Dust Impacts on the Boundary Layer Meteorology and Air Quality over East Asia in April 2015. Atmos. Res. 2017, 187, 42–56. [Google Scholar] [CrossRef]
- Kok, J.F.; Adebiyi, A.A.; Albani, S.; Balkanski, Y.; Checa-Garcia, R.; Chin, M.; Colarco, P.R.; Hamilton, D.S.; Huang, Y.; Ito, A.; et al. Contribution of the World’s Main Dust Source Regions to the Global Cycle of Desert Dust. Atmos. Chem. Phys. 2021, 21, 8169–8193. [Google Scholar] [CrossRef]
- Zhang, X.Y.; Gong, S.L.; Shen, Z.X.; Mei, F.M.; Xi, X.X.; Liu, L.C.; Zhou, Z.J.; Wang, D.; Wang, Y.Q.; Cheng, Y. Characterization of Soil Dust Aerosol in China and Its Transport and Distribution during 2001 ACE-Asia: 1. Network Observations. J. Geophys. Res. 2003, 108, ACH 3-1–ACH 3-14. [Google Scholar] [CrossRef]
- Huang, J.; Minnis, P.; Lin, B.; Wang, T.; Yi, Y.; Hu, Y.; Sun-Mack, S.; Ayers, K. Possible Influences of Asian Dust Aerosols on Cloud Properties and Radiative Forcing Observed from MODIS and CERES. Geophys. Res. Lett. 2006, 33, L06824. [Google Scholar] [CrossRef]
- Che, H.; Wang, Y.; Sun, J.; Zhang, X.; Zhang, X.; Guo, J. Variation of Aerosol Optical Properties over the Taklimakan Desert in China. Aerosol Air Qual. Res. 2013, 13, 777–785. [Google Scholar] [CrossRef]
- Zhang, S.; Huang, Z.; Li, M.; Shen, X.; Wang, Y.; Dong, Q.; Bi, J.; Zhang, J.; Li, W.; Li, Z.; et al. Vertical Structure of Dust Aerosols Observed by a Ground-Based Raman Lidar with Polarization Capabilities in the Center of the Taklimakan Desert. Remote Sens. 2022, 14, 2461. [Google Scholar] [CrossRef]
- Bi, J.; Huang, J.; Holben, B.; Zhang, G. Comparison of Key Absorption and Optical Properties between Pure and Transported Anthropogenic Dust over East and Central Asia. Atmos. Chem. Phys. 2016, 16, 15501–15516. [Google Scholar] [CrossRef]
- Filonchyk, M.; Peterson, M.; Hurynovich, V. Air Pollution in the Gobi Desert Region: Analysis of Dust-storm Events. Q. J. R. Meteorol. Soc. 2021, 147, 1097–1111. [Google Scholar] [CrossRef]
- Hansen, J.; Sato, M.; Ruedy, R. Radiative Forcing and Climate Response. J. Geophys. Res. 1997, 102, 6831–6864. [Google Scholar] [CrossRef]
- She, L.; Xue, Y.; Guang, J.; Che, Y.; Fan, C.; Li, Y.; Xie, Y. Towards a Comprehensive View of Dust Events from Multiple Satellite and Ground Measurements: Exemplified by the May 2017 East Asian Dust Storm. Nat. Hazards Earth Syst. Sci. 2018, 18, 3187–3201. [Google Scholar] [CrossRef]
- Yu, X.; Cheng, T.; Chen, J.; Liu, Y. A Comparison of Dust Properties between China Continent and Korea, Japan in East Asia. Atmos. Environ. 2006, 40, 5787–5797. [Google Scholar] [CrossRef]
- Eck, T.F.; Holben, B.N.; Dubovik, O.; Smirnov, A.; Goloub, P.; Chen, H.B.; Chatenet, B.; Gomes, L.; Zhang, X.-Y.; Tsay, S.-C.; et al. Columnar aerosol optical properties at AERONET sites in central eastern Asia and aerosol transport to the tropical mid-Pacific. J. Geophys. Res. 2005, 110, D06202. [Google Scholar] [CrossRef]
- Kim, D.-H. Aerosol Optical Properties over East Asia Determined from Ground-Based Sky Radiation Measurements. J. Geophys. Res. 2004, 109, D02209. [Google Scholar] [CrossRef]
- Alam, K.; Trautmann, T.; Blaschke, T.; Subhan, F. Changes in Aerosol Optical Properties Due to Dust Storms in the Middle East and Southwest Asia. Remote Sens. Environ. 2014, 143, 216–227. [Google Scholar] [CrossRef]
- Tiwari, S.; Kumar, A.; Pratap, V.; Singh, A.K. Assessment of Two Intense Dust Storm Characteristics over Indo-Gangetic Basin and Their Radiative Impacts: A Case Study. Atmos. Res. 2019, 228, 23–40. [Google Scholar] [CrossRef]


Disclaimer/Publisher’s Note: The statements, opinions and data contained in all publications are solely those of the individual author(s) and contributor(s) and not of MDPI and/or the editor(s). MDPI and/or the editor(s) disclaim responsibility for any injury to people or property resulting from any ideas, methods, instructions or products referred to in the content. |
© 2023 by the authors. Licensee MDPI, Basel, Switzerland. This article is an open access article distributed under the terms and conditions of the Creative Commons Attribution (CC BY) license (https://creativecommons.org/licenses/by/4.0/).
Share and Cite
Li, M.; Cao, X.; Zhang, Z.; Ji, H.; Zhang, M.; Guo, Y.; Tian, P.; Liang, J. Optical Properties and Vertical Distribution of Aerosols Using Polarization Lidar and Sun Photometer over Lanzhou Suburb in Northwest China. Remote Sens. 2023, 15, 4927. https://doi.org/10.3390/rs15204927
Li M, Cao X, Zhang Z, Ji H, Zhang M, Guo Y, Tian P, Liang J. Optical Properties and Vertical Distribution of Aerosols Using Polarization Lidar and Sun Photometer over Lanzhou Suburb in Northwest China. Remote Sensing. 2023; 15(20):4927. https://doi.org/10.3390/rs15204927
Chicago/Turabian StyleLi, Mengqi, Xianjie Cao, Zhida Zhang, Hongyu Ji, Min Zhang, Yumin Guo, Pengfei Tian, and Jiening Liang. 2023. "Optical Properties and Vertical Distribution of Aerosols Using Polarization Lidar and Sun Photometer over Lanzhou Suburb in Northwest China" Remote Sensing 15, no. 20: 4927. https://doi.org/10.3390/rs15204927