
Detection and Mapping of Chestnut Using Deep Learning from High-Resolution UAV-Based RGB Imagery

1
State Key Laboratory of Resource Insects, Chinese Academy of Agricultural Sciences, Beijing 100093, China
2
Key Laboratory for Insect-Pollinator Biology of the Ministry of Agriculture and Rural Affairs, Institute of Apicultural Research, Chinese Academy of Agricultural Sciences, Beijing 100093, China
3
Zhangzhou Institute of Technology, Zhangzhou 363000, China
*
Author to whom correspondence should be addressed.
Remote Sens. 2023, 15(20), 4923; https://doi.org/10.3390/rs15204923
Submission received: 21 August 2023
/
Revised: 30 September 2023
/
Accepted: 6 October 2023
/
Published: 12 October 2023
Abstract
:The semantic segmentation method based on high-resolution RGB images obtained by unmanned aerial vehicle (UAV) provides a cost-effective way to improve the accuracy of detection and classification in forestry. Few studies have explored the impact of sample distribution patterns on deep learning model detection accuracy. The study was carried out using the data from the 4.78 km2 RGB image of a chestnut (Castanea mollissima Blume) plantation obtained by the DJI Phantom 4-RTK, and the model training was conducted with 18,144 samples of manually delineated chestnut tree clusters. The performance of four semantic segmentation models (U-Net, DeepLab V3, PSPNet, and DeepLab V3+) paired with backbones (ResNet-34, ResNet-50) was evaluated. Then, the influence of chestnut data from different planting patterns on the accuracy and generalization performance of deep learning models was examined. The results showed that the combination of DeepLab V3 with ResNet-34 backbone gives the best performance (F1 score = 86.41%), while the combination of DeepLab V3+ with ResNet-50 backbone performed the worst. The influence of different backbone networks on the detection performance of semantic segmentation models did not show a clear pattern. Additionally, different spatial distribution patterns of chestnut planting affected the classification accuracy. The model MIX, trained on comprehensive training data, achieves higher classification accuracies (F1 score = 86.13%) compared to the model trained on single training data (F1 score (DP) = 82.46%; F1 score (SP) = 83.81%). The model performance in complex scenario data training is superior to that of the model in simple scene data training. In conclusion, comprehensive training databases can improve the generalization performance of chestnut classification with different spatial distribution patterns. This study provides an effective method for detecting chestnut cover area based on semantic segmentation, allowing for better quantitative evaluation of its resource utilization and further development of inventories for other tree species.
1. Introduction
Fruit trees, which are agricultural crops that are cultivated and managed primarily for the purpose of generating economic returns, have tremendous commercial value [1]. They not only provide economic returns but also alleviate employment pressures and exert significant impacts on food security [2], landscape patterns [3], environment, and culture [4]. With the continuous expansion of the cultivation of economic crops, there is an increasing demand for accurate management and planning information [5]. Timely and reliable orchard monitoring information, especially regarding fruit tree counting [6], yield prediction [5], and spatial distribution [7], can serve as a basis for orchard management and planning. It can help farmers achieve sustainable orchard operations, make the most of existing land resources, and obtain favorable economic benefits [8].
Considering the large-scale cultivation of fruit trees in orchards, managers employ traditional ground sampling designs for field measurements [9]. This method is usually based on simple random sampling, where weighted random samples are selected from a few small areas to estimate the yield of the entire orchard or a larger area [10,11]. However, these methods require significant labor, financial resources, and time investment. Due to limited coverage, these methods can only observe and evaluate a small number of samples, resulting in low statistical accuracy, low efficiency, and incomplete results [11,12,13]. Additionally, subjective factors introduced by humans may also affect the accuracy of the statistical findings. To overcome these challenges, an inspiring approach involves combining remote sensing (RS) technology with deep learning to provide a method for obtaining and detecting spatial distribution information of large-scale fruit tree plantations.
With the progress of remote sensing, the improved availability and implementation of new image processing methods and machine learning algorithms provide more possibilities for deep information extraction and analysis in classification scenarios [14]. Traditional image processing methods, including k-means clustering [15], nearest neighbor algorithm [16], and edge detection algorithm [17], are complex in manual design and feature extraction. Moreover, they pose difficulties in the handling of large-scale data due to storage and computational resource limitations. The development of machine learning methods has greatly improved the accuracy of tree species classification and made it more convenient [18]. Guo et al. [19] employed random forest (RF), support vector machine (SVM), and k-nearest neighbor (KNN) classifiers to achieve accurate identification of urban trees in nine schemes. Yan et al. [20] explored the potential of different methods in identifying individual tree species. Compared to RF and SVM methods, the convolutional neural network (CNN) method exhibits higher classification performance in tree species classification. Among them, deep learning, as a type of machine learning, especially CNN, has shown great potential in computer vision applications [21,22]. CNN performs well in remote sensing image classification tasks with its hierarchical feature extraction ability, parameter sharing and local connectivity mechanisms in convolutional layers [23]. The effectiveness of CNN in the task of mapping fruit tree species in remote sensing images has been proven in recent studies [24,25,26]. Ferreira et al. [7] used CNN and high-resolution imagery to delineate tree crown boundaries and achieve accurate mapping of Brazil nut trees (Bertholletia excelsa) in Amazonian forests, achieving a maximum F1 score of 71.95%. La Rosa et al. [27] implemented tree species classification in dense forest canopy using a multi-task fully convolutional network (F1 score = 87.51%).
However, the complexity of the deep learning network structure, as well as the differences in crown characteristics between different fruit trees, makes accurate detection and classification of fruits challenging [28]. A deep learning model consisting of different backbone networks and image-splitting networks was designed to detect and classify fruit trees. Zhu et al. [29] employed an improved version of YOLO 4 (with MobileNet V3 backbone) for fast target detection of citrus fruit trees. Ferreira et al. [30] utilized DeepLab V3+ (with ResNet-18 backbone) for individual tree detection and species classification of Amazonian palms. However, the use scenarios for these models and the advantages of detection for specific tree species have not been determined, and it is necessary to train deep learning models for different network structures and to compare their classification accuracy to determine the appropriate network structure model and establish the feasibility of the model for the study object in practical applications. Ferreira et al. [7] compared the impact of different backbone networks on the accuracy of model detection for character extraction, achieving the highest detection with ResNet-18, and ultimately chose DeepLab V3+ (with ResNet-18 backbone) to detect and map nuts accurately. Wang et al. [31] compared the built Multi-Unet with several mainstream network models, such as SegNet, FCN8s, and RefineNet, and ultimately determined that Multi-Unet was the most suitable model for pear tree classification.
Training data is another key factor influencing the accuracy of the deep learning model, and researchers have emphasized the importance of training sample differences for the accurate detection and classification of vegetation when using deep learning methods [32,33,34], including the quantity of the reference data, the distribution of sample marks and the time–space differences in the sample data. In addition to the training sample itself, when the forest environment in which the vegetation is located differs from the forest structure in the sample data, also affects the detection performance of the deep learning model [28]. Studies have shown that in complex forest structures, heterogeneous backgrounds cause variations in tree appearance, making samples more difficult to draw, leading to the need for more samples to effectively train CNN. However, obtaining these data is often challenging when the forest structure is different, and vegetation grows in a complex forest environment rather than in planted artificial forests [9]. Therefore, determining the contribution of different forest structure training samples to the accuracy of deep learning model detection is important for the detection of vegetation in complex forest structures.
The focus of our research was chestnut (Castanea mollissima Blume), an important economic crop whose value lies not only in the economic contribution of its fruit and timber, but also in the fact that it provides food resources and habitats for pollinating insects and plays a positive role in maintaining ecological balance [35]. Based on the existing literature, there is a knowledge gap in choosing the appropriate detection and drawing methods for chestnut, and in order to understand the distribution area of chestnut artificial forests as well as the impact of different forest structure samples on the detection performance of the model, the first purpose of this study was to identify the most suitable classification model for chestnut. Using drone RGB images as the data source, the accuracy of different semantic separation methods for chestnut detection was analyzed. The detection accuracy of four semantic splitting models coupled with the backbone networks was evaluated. The second purpose of the study was to investigate the impact of different forest structure samples on the model accuracy based on the most suitable classification model, and to assess the transferability of the model between different forest structures. Identifying reference data for different forest structures by exploring the feasibility of establishing a common deep learning detection model for chestnut, as well as determining the viability of the model for cross-regional chestnut detection, will be crucial for vegetation forecasting.
2. Materials and Methods
2.1. Study Site
The study area is located in Jugezhuang Town, in the southeast region of Miyun District, Beijing, China; the specific locations are shown in Figure 1a. The terrain in this region is mostly characterized by low-lying hills, with mountains surrounding it on the east, south, and north sides. The central part consists of east–west oriented intermontane plains. The basic topographic framework was formed during the Mesozoic Yanshan movement. The region has a temperate continental monsoon type of semi-humid and semi-arid climate, with a mean annual temperature of 10.8 °C and mean annual precipitation of 1235.2 mm. The parent material for soil formation in the region is primarily weathered granite and similar types of rocks. Due to the suitable soil and climate conditions for chestnut growth, chestnuts have a planting history of over 2000 years in the local area. The area of the Miyun District where chestnuts are planted currently totals 200 km2.
2.2. Acquisition and Annotation of Images
2.2.1. Field Data
The field investigation was carried out in mid-May 2022, which marked the beginning of the chestnut flowering season. In the research area, chestnuts are mainly cultivated in small-scale farming systems, clustered near villages and easily accessible main roads for convenient farming. The concentrated planting areas of chestnuts were relatively small and scattered irregularly due to the influence of terrain. Deforestation on a large scale often occurred, and there was no artificial distribution of chestnut forests above an altitude of 380 m on mountain slopes and hilltops. Through on-site ground surveys, the survey team members investigated the distribution of artificial chestnut forests in the research area, collected significant amounts of information on chestnut planting distribution, and classified the chestnut planting distribution patterns into two categories based on different terrains: densely planted with a single species and scattered distribution with complex backgrounds (Figure 2). In the densely planted category, chestnut trees are usually neatly arranged and serve as the primary source of production (Figure 2a). In the scattered distribution category, chestnut trees are dispersed within artificial forests dominated by dominant tree species. They have a wide distribution area and play a significant ecological role as ecologically beneficial plants (Figure 2c).
To comprehensively cover chestnut forests with these two different planting patterns in the research area, we employed a sampling method combining transects and typical sample plots. Two transects, namely the Mixing Road running east–west and the Jiuhuang Road running north–south, were set up for investigation, traversing Jugezhuang town. Typical sample plots were set up on both sides of the transects according to different chestnut planting distribution patterns. These typical sample plots were distributed in low-lying hilly areas accessible at altitudes ranging from 116 to 330 m. A total of 21 sample sites were selected, with 11 sample sites having dense planting of a single chestnut tree species, and 10 sample sites with chestnut trees scattered in complex backgrounds (Figure 1b).
2.2.2. UAV Data Acquisition and Processing
The UAV imagery was collected using a DJI Phantom 4 RTK, a small four-rotor high-precision aerial survey UAV weighing only 1388 g and equipped with a three-band (red, green, blue) sensor (1-inch CMOS, 20 million effective pixels) and 24 mm focal length lens (35 mm format equivalent). The use of the DJI Phantom 4 RTK greatly benefits the comprehensive improvement of aerial survey efficiency [36]. The UAV data were captured during the summer of 2022 on clear weather days. The flight time spanned from 9:00 to 11:30 in the morning and from 13:00 to 15:30 in the afternoon. The flight parameters included a 70% forward overlap and an 80% side-lap at 100 m above ground level, and the flight speed was 7.9 m/s. For each sample plot, the average flight shooting time was 15 min. The UAV flight operation obtained a total of 7391 images. For the sample sites, we derived a total of 21 ortho-mosaic images using DJI Terra’s visible-based task reconstruction image matching, and the average ground sampling distance was 2.9 cm. A total of 17 orthorectified photos were utilized for training and detection in the semantic segmentation model, excluding low-quality images impacted by elements like weather. The total coverage area of the 17 sample sites was 4.78 km2, with an average size of 0.28 km2 per plot.
2.2.3. Manual Data Labeling
For deep learning model training, obtaining high-quality and precisely specified training samples is essential, since they have a direct influence on the model’s performance and accuracy [4,33]. To ensure the quality of the chestnut tree pixel label dataset, we employed ArcGIS Pro 2.9 in conjunction with UAV imagery to meticulously delineate the contours of all chestnut trees. Considering the small spacing between individual chestnut tree crowns in the study area, it was challenging to visually depict the boundaries of single crown samples. We treated all tree crowns as a single semantic category and used a semantic segmentation model to better differentiate them from the background and other objects. Therefore, we viewed adjacent clusters of tree crowns as a single entity. We manually outlined the entire cluster of crowns and assigned a unified class label to each cluster. These labeled clusters were then used as semantic segmentation samples. The labeling process was comprehensive, including two different planting distribution types and clusters of chestnut trees of different ages in the dataset (Figure 2). In total, we delineated 18,144 samples of chestnut tree clusters.
2.3. Experiment Design
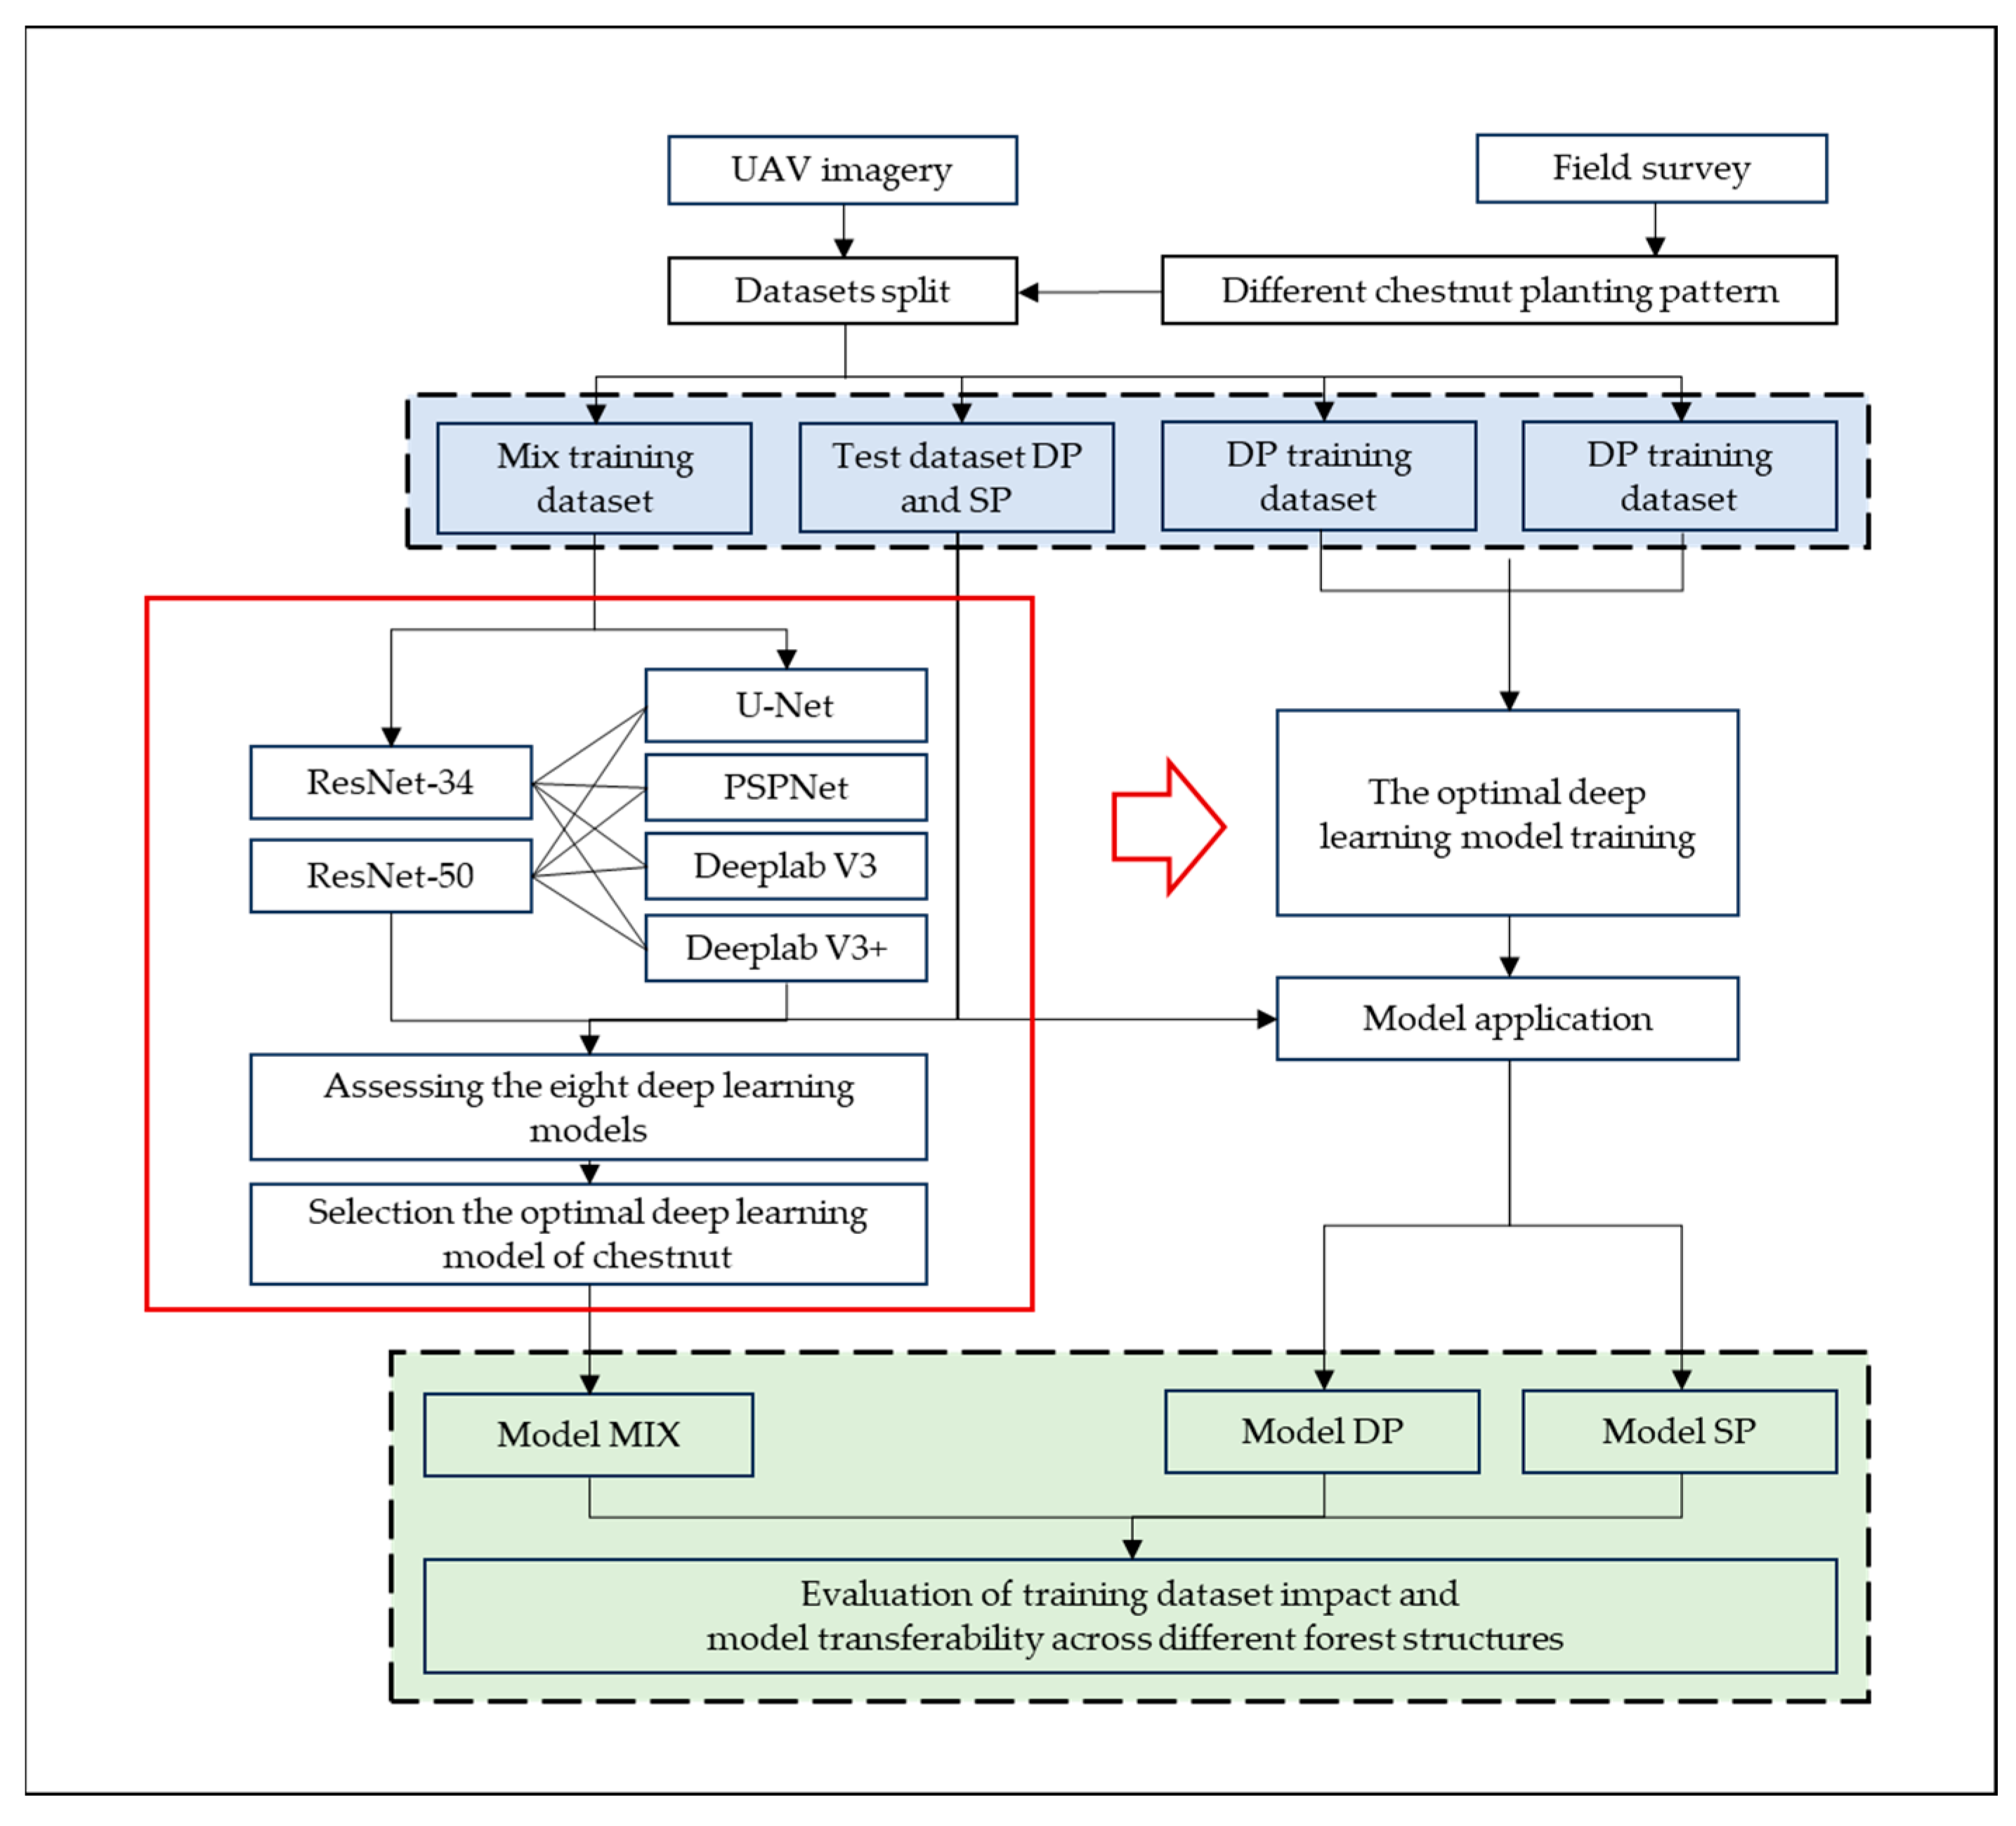
The purpose of this study was to evaluate the classification accuracy of four semantic segmentation models paired with backbone networks and to determine the best classification model to depict the distribution and location of chestnut trees. Using the most suitable classification model to determine the impact of training datasets composed of different chestnut distribution patterns on model transferability (Figure 3).
In order to choose the most appropriate categorization model, we first examined the performance of eight alternative deep learning models. These models integrated two backbone networks, ResNet-34 and ResNet-50, with four popular semantic segmentation networks: U-Net, DeepLab V3, PSPNet, and DeepLab V3+. We identified the optimal deep learning model for chestnut classification by comparing these models using the whole training validation set. The chosen model was then trained and validated using various training datasets that represent various chestnut distribution patterns, and the impact of these diverse distribution patterns on the accuracy of the deep learning model was then analyzed. The training datasets composed of different chestnut distribution patterns included (1) chestnuts densely planted with a single tree species (DP) labeled as a training dataset; (2) chestnuts with a scattered planting distribution in a complex background (SP) labeled as a training dataset, with the same amount of data as in 1; (3) a mixed training dataset composed of two distribution patterns of chestnut.
2.3.1. Semantic Segmentation Model
A typical problem in computer vision is semantic segmentation, which involves taking raw data as input and transforming them into masks that highlight regions of interest. Each pixel in the image is assigned a category label based on the object it belongs to [37]. Compared to traditional methods, deep learning can learn more discriminative features from raw data, thereby significantly improving segmentation accuracy in semantic segmentation tasks [38].
In remote sensing image analysis, semantic segmentation techniques can accurately delineate the contours of objects in images at a fine granularity and incorporate their spatial information, thus providing a more precise depiction of the “background” information in remote sensing imagery [39]. Currently, CNNs are widely used for semantic segmentation with various approaches based on different network design principles, such as dilated convolutions, encoder–decoder architectures, feature fusion, and recurrent neural networks (RNN). This study evaluated the classification accuracy of representative networks, including U-Net, DeepLab V3, PSPNet, and DeepLab V3+, for each of these methods.
The U-Net network structure adopts a “U-shape” encoder–decoder structure; encoder and decoder network structure is one of the more common structures in the common network structure model used for semantic segmentation [40]. The encoder typically consists of multiple convolutional layers and pooling layers, which aim to extract feature maps containing both positional and semantic information from the image [41]. On the other hand, the decoder typically consists of deconvolutional (transpose convolution) layers and unpooling (reverse pooling) layers, which aim to restore the spatial dimensions and positional information lost in the feature maps, generating the prediction map [42]. This structure can integrate high-level semantics and low-level fine-grained surface information, thereby obtaining more accurate results through the synthesis of information from both aspects. Currently, it has been widely applied in fields such as biological image classification [43] and medical image analysis [44].
The DeepLab V3 network is a semantic segmentation method based on hollow convolution. Chen et al. [45] proposed the DeepLab V3 network based on DeepLab V1 and DeepLab V2 in 2017, and introduced the Atrous Spatial Pyramid Pooling (ASPP) module into the DeepLab V2 network. A batch normalization (BN) layer was added to further improve it, and the cavity convolution module was designed in a cascading way. In the framework of the cascade module and spatial pyramid pool, a larger receptive field can be obtained to obtain more global-context scale information [45]. As a classical semantic segmentation network, DeepLab V3 is commonly used as a comparative network in tree crown detection and classification tasks to assess the accuracy of classification precision [46].
DeepLab V3+ adds a decoder module to the DeepLab V3 network to refine boundary details. This method applies depth-wise separable convolutions in both the decoder module and ASPP pool [47]. Xia et al. [48] used deep learning semantic segmentation CNN DeepLab V3+ to identify infected pine trees and evaluate the extent of damage caused by the disease.
The Pyramid Scene Parsing Network (PSPNet) method is a semantic segmentation approach based on feature fusion, proposed by Zhao et al. [49] in 2017. It introduces a spatial pyramid pooling module to aggregate features at different scales, enabling more effective capture of contextual information. PSPNet provides effective global context information for pixel-level scene analysis and improves the performance of open vocabulary objects and content recognition in complex scene analysis. Stubbings et al. [50] utilized the semantic segmentation PSPNet network to quantify urban trees at the city street level.
2.3.2. Model Training and Application
The following are the main processes in developing and using a model that are covered by the study design:
- (1)
- Preparation for the training dataset
All 17 orthophoto parcels were utilized as the training, validation, and testing dataset after being filtered and manually labeled. Two parcels were set aside for testing the model’s effectiveness. Since this experiment was mainly divided into two parts, the training/validation datasets needed to be set separately according to different requirements. To support the ideal classification model for chestnuts, many sample data were required in order to achieve universality. Therefore, except for the test set, all 15 annotated parcels were used as the training/validation dataset to train the deep learning model, which was composed of two types of chestnut distributions in the mixed training dataset. In order to analyze the impact of two different types of chestnut distribution on the model accuracy, single-species chestnut with dense planting and complex background with sparsely distributed chestnut respectively composed the training dataset for evaluating the transferability of models between different types of chestnut distributions. The extra two parcels were used as a testing set to evaluate the model’s performance in selecting the optimal classification model for chestnuts. Moreover, these two parcels contained two different types of chestnut distribution patterns (DP and SP), which could be used to evaluate the data transferability performance of models trained with different chestnut planting patterns.
ArcGIS Pro 2.9 (ESRI, Redlands, CA, USA) software was used to convert the existing chestnut crown clustering training samples into training and validation datasets suitable for deep learning models. The image patch size was set at 256 × 256 pixels, with a stride offset of 128 × 128 pixels (50% overlap). Additionally, the labeled samples were rotated by 90° to enhance the training data and ensure the comprehensive capture of chestnut crown information within the patches during the training and validation process [51].
A total of 726,188 image chips and 1,284,500 features were obtained from a mixed training dataset composed of two distribution patterns of chestnuts. The labeled dataset for densely planted chestnuts of a single species yielded 284,120 image chips and 506,136 features, and the labeled dataset for chestnuts with a scattered distribution and complex background yielded 147,648 image chips and 276,068 features.
- (2)
- Model training
In the training process, we selected 75% of the training and validation set for model training, and the remaining 25% for validation [23]. We also compared the performance impact of using different backbone network structures, ResNet-34 and ResNet-50, on these networks. U-Net, DeepLab V3, PSPNet, and DeepLab V3+ were the four network models that were used in this investigation. To better handle the task and make it easier for them to pick up new skills, their backbones were modified [52]. A total of 10 different models were trained, including compositions of different training datasets used to compare the transferability of the most suitable model. In order to reduce overfitting, training was halted when the models showed no signs of progress [51]. The training and inference were performed on a workstation with an AMD Ryzen 9 5950X 16-Core Processor CPU, NVIDIA GeForce RTX 3090 GPU, and 64.0 GB of RAM.
- (3)
- Model application
Each model trained with the selected optimal classification model was used to detect the test sets DP (dense planting of a single chestnut tree species) and SP (scattered distribution of chestnuts with complex backgrounds) in the test dataset. The average detection results were then calculated for comparison, analyzing the impact of training different datasets on model transferability.
2.3.3. Model Accuracy Evaluation
To evaluate the accuracy of the semantic segmentation models and determine the most suitable model for chestnut tree crown detection, this study primarily employed three evaluation metrics: user’s accuracy, producer’s accuracy, and F1 score [53]. User’s accuracy measures the ratio of correctly classified pixels to the total number of pixels predicted by the model (1). Producer’s accuracy assesses the model’s ability to successfully detect pixels belonging to the target class and represents the recall rate for positive samples (2). The F1 score is the harmonic mean of user’s accuracy and producer’s accuracy, taking into account both the precision and recall of the model. These metrics were used to evaluate the performance of different models and determine the most appropriate chestnut tree crown detection model.
where (true positive) represents the number of pixels correctly classified as chestnut trees, (false positive) represents the number of pixels erroneously classified as chestnut trees, and (false negative) represents the number of pixels that were not correctly classified as chestnut trees.
3. Results
3.1. Results of Chestnut Segmentation
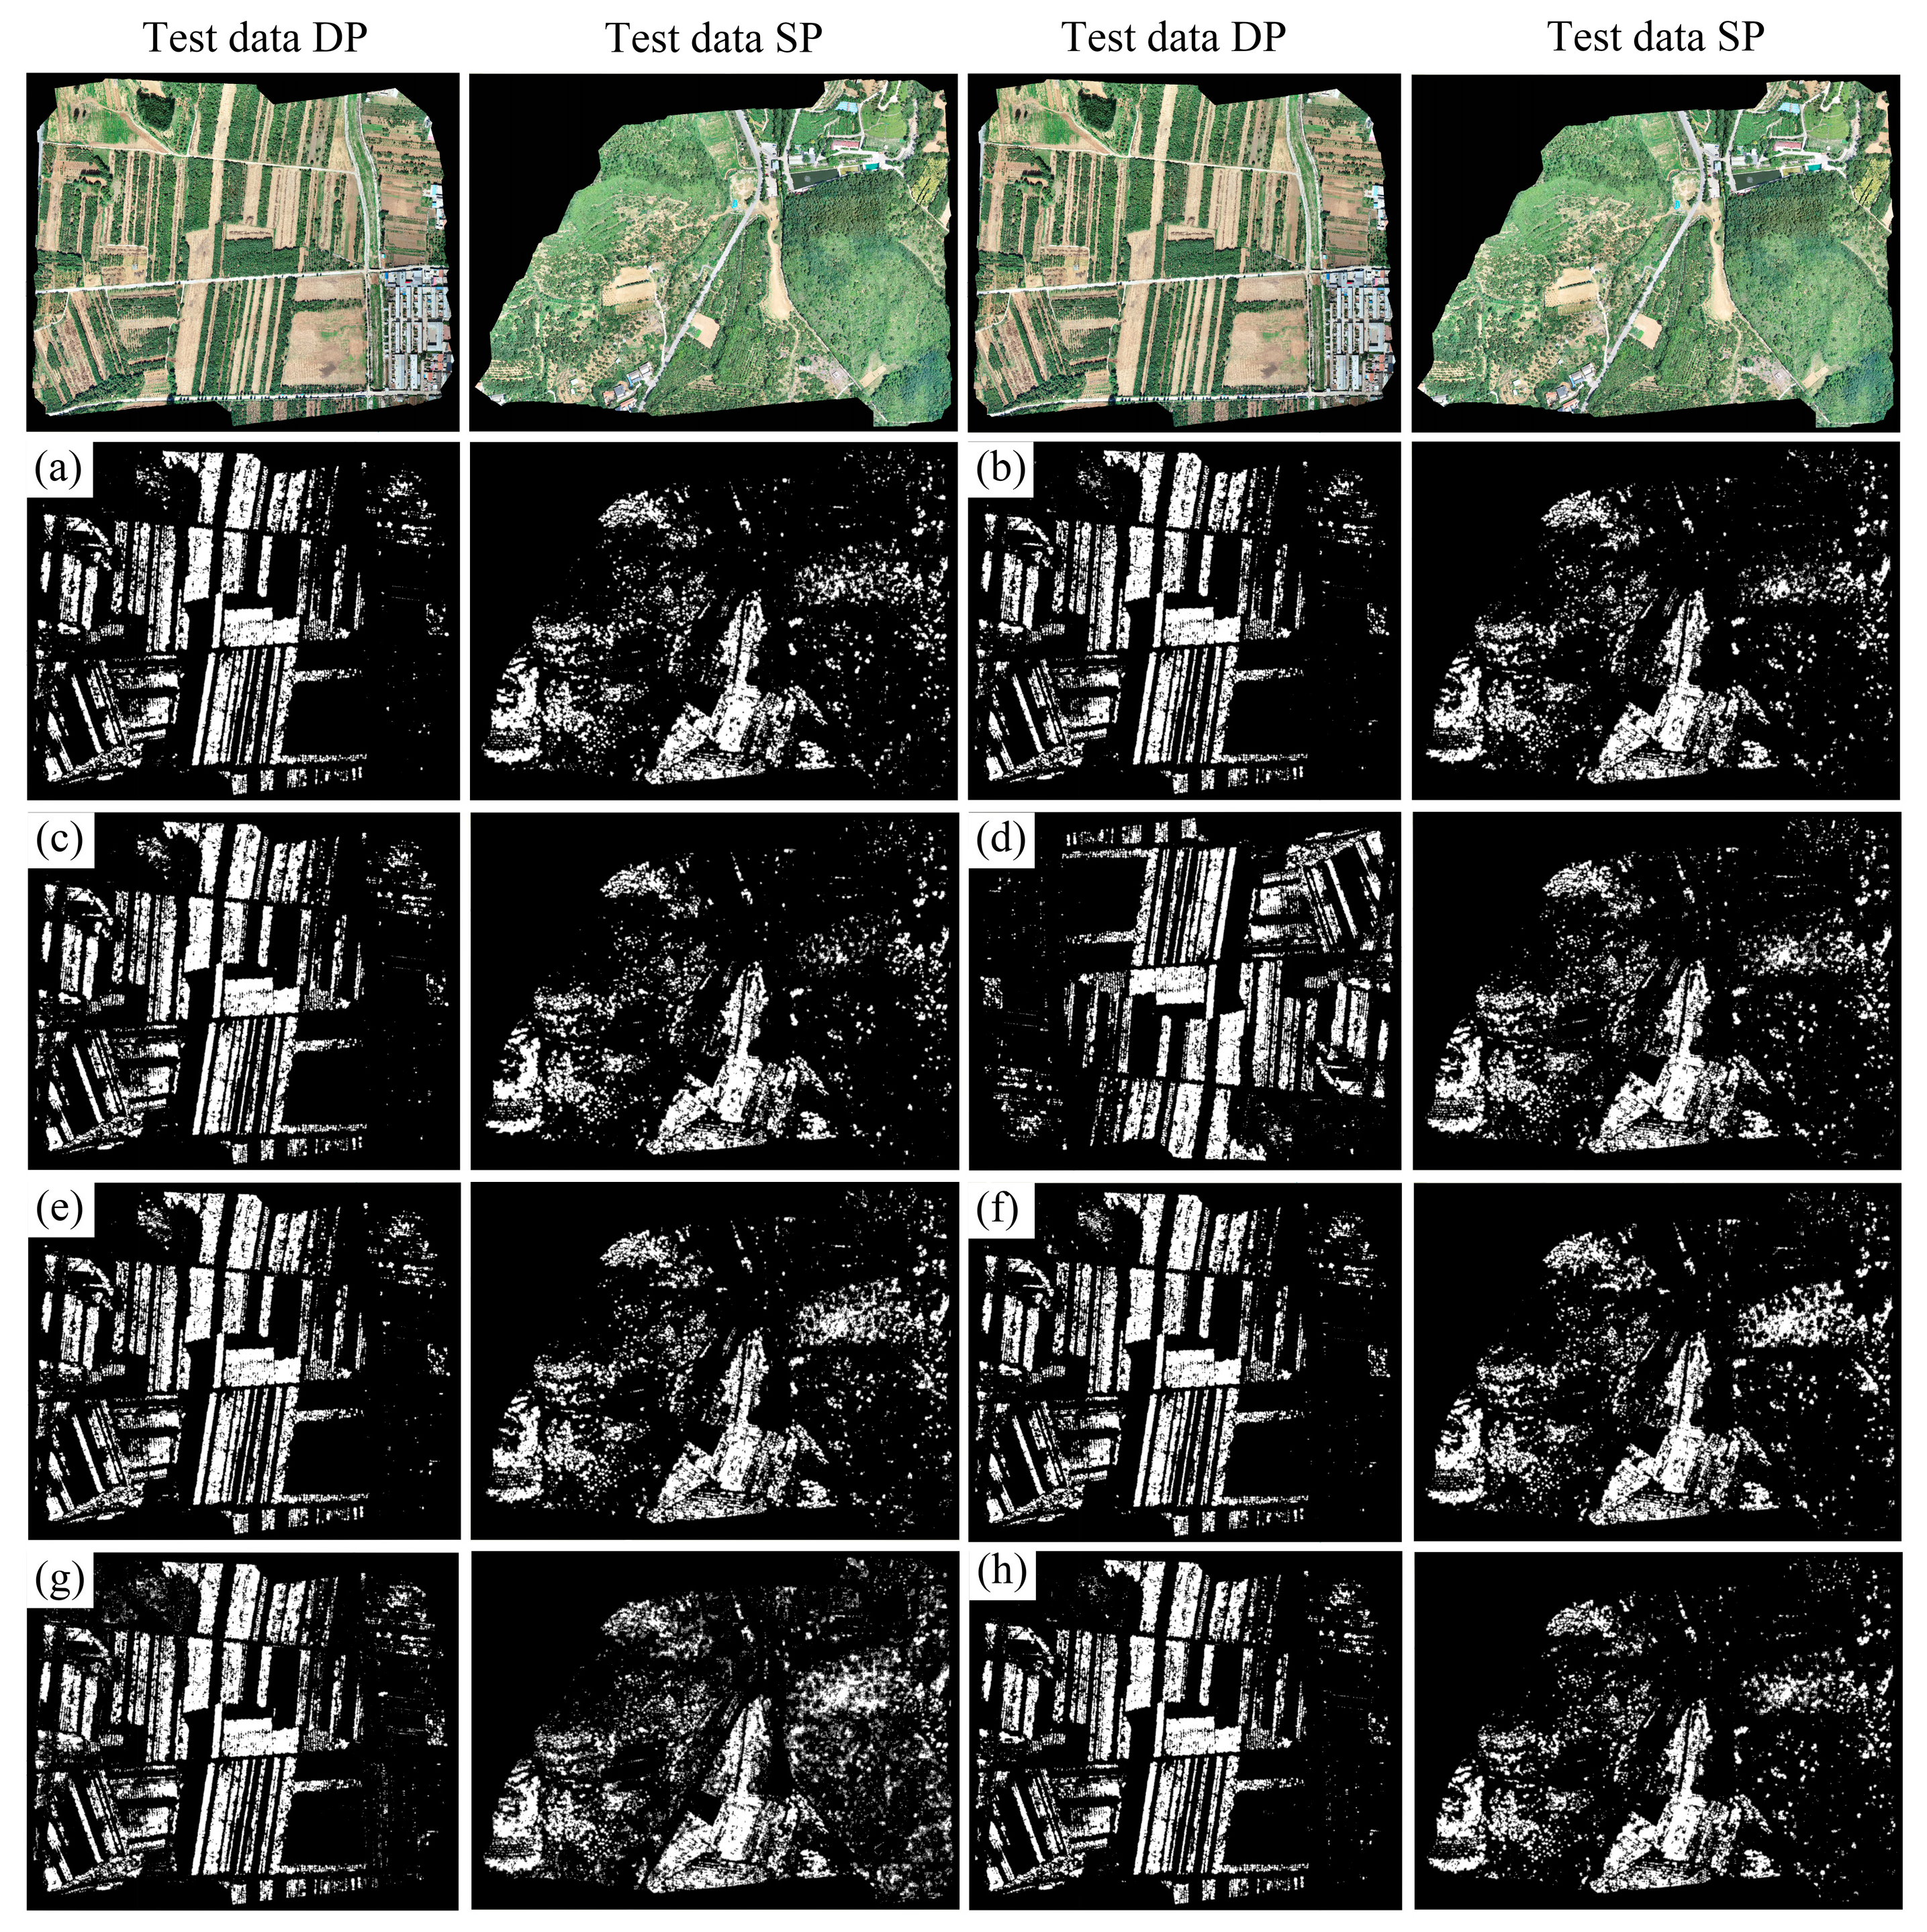
This study investigated the potential of deep learning networks with different backbone models for tree segmentation on large-scale chestnut orchards. Eight trained models were used, including U-Net (with ResNet-34 backbone), U-Net (with ResNet-50 backbone), DeepLab V3 (with ResNet-34 backbone), DeepLab V3 (with ResNet-50 backbone), PSPNet (with ResNet-34 backbone), PSPNet (with ResNet-50 backbone), DeepLab V3+ (with ResNet-34 backbone), and DeepLab V3+ (with ResNet-50 backbone). They were tested on the dataset and successfully delineated the chestnuts. The performance of different models for detection is shown in Table 1. It can be observed that the deep learning network with ResNet-34 backbone, DeepLab V3, performed the best in the test dataset. It achieved an average F1 score of 86.13%. The DeepLab V3 model with a ResNet-34 backbone demonstrated the highest user’s accuracy and producer’s accuracy, indicating its accurate classification of chestnut pixels with fewer omissions and misclassifications. It achieved an F1 score that was 1.05%–7.44% higher than the scores other models. The model with the ResNet-34 backbone network, DeepLab V3+, performed the worst on the test dataset. It achieved the lowest average average F1 score of 78.69%. The classification performance of each model on different test sets is shown in Figure 4.
3.2. Impact of Backbone Networks ResNet-34 and ResNet-50 on Model Performance
According to the accuracy evaluation of different backbone models for various network architectures shown in Table 1, the classification performance varied. In the U-Net network, the F1 score of the ResNet-34 backbone (84.78%) was slightly lower than that of the ResNet-50 backbone (85.08%). In the DeepLab V3 network, the F1 score of the ResNet-34 backbone (86.13%) was higher than that of the ResNet-50 backbone (84.75%). In the PSPNet network, the F1 score of the ResNet-34 backbone (83.16%) was higher than that of the ResNet-50 backbone (82.67%). In the DeepLab V3+ network, the F1 score of the ResNet-34 backbone (78.69%) was lower than that of the ResNet-50 backbone (84.78%). It can be observed that there was no clear pattern in the classification results among different backbone models for the different network architectures.
3.3. Evaluation of Model Generalization on Different Test Datasets
Models have different detection accuracy for different types of test data (Table 2). There was a certain difference between the F1 scores on test set DP and test set SP. The F1 scores on test set DP were consistently lower than those on test set SP, indicating that the detection accuracy on test set SP was significantly influenced. When using the optimal classification model, DeepLab V3 (utilizing the ResNet-34 backbone model), the minimum difference in F1 scores between test set DP and test set SP was 5.15%, and it achieved the highest detection accuracy on test set SP (F1 score = 83.55%).
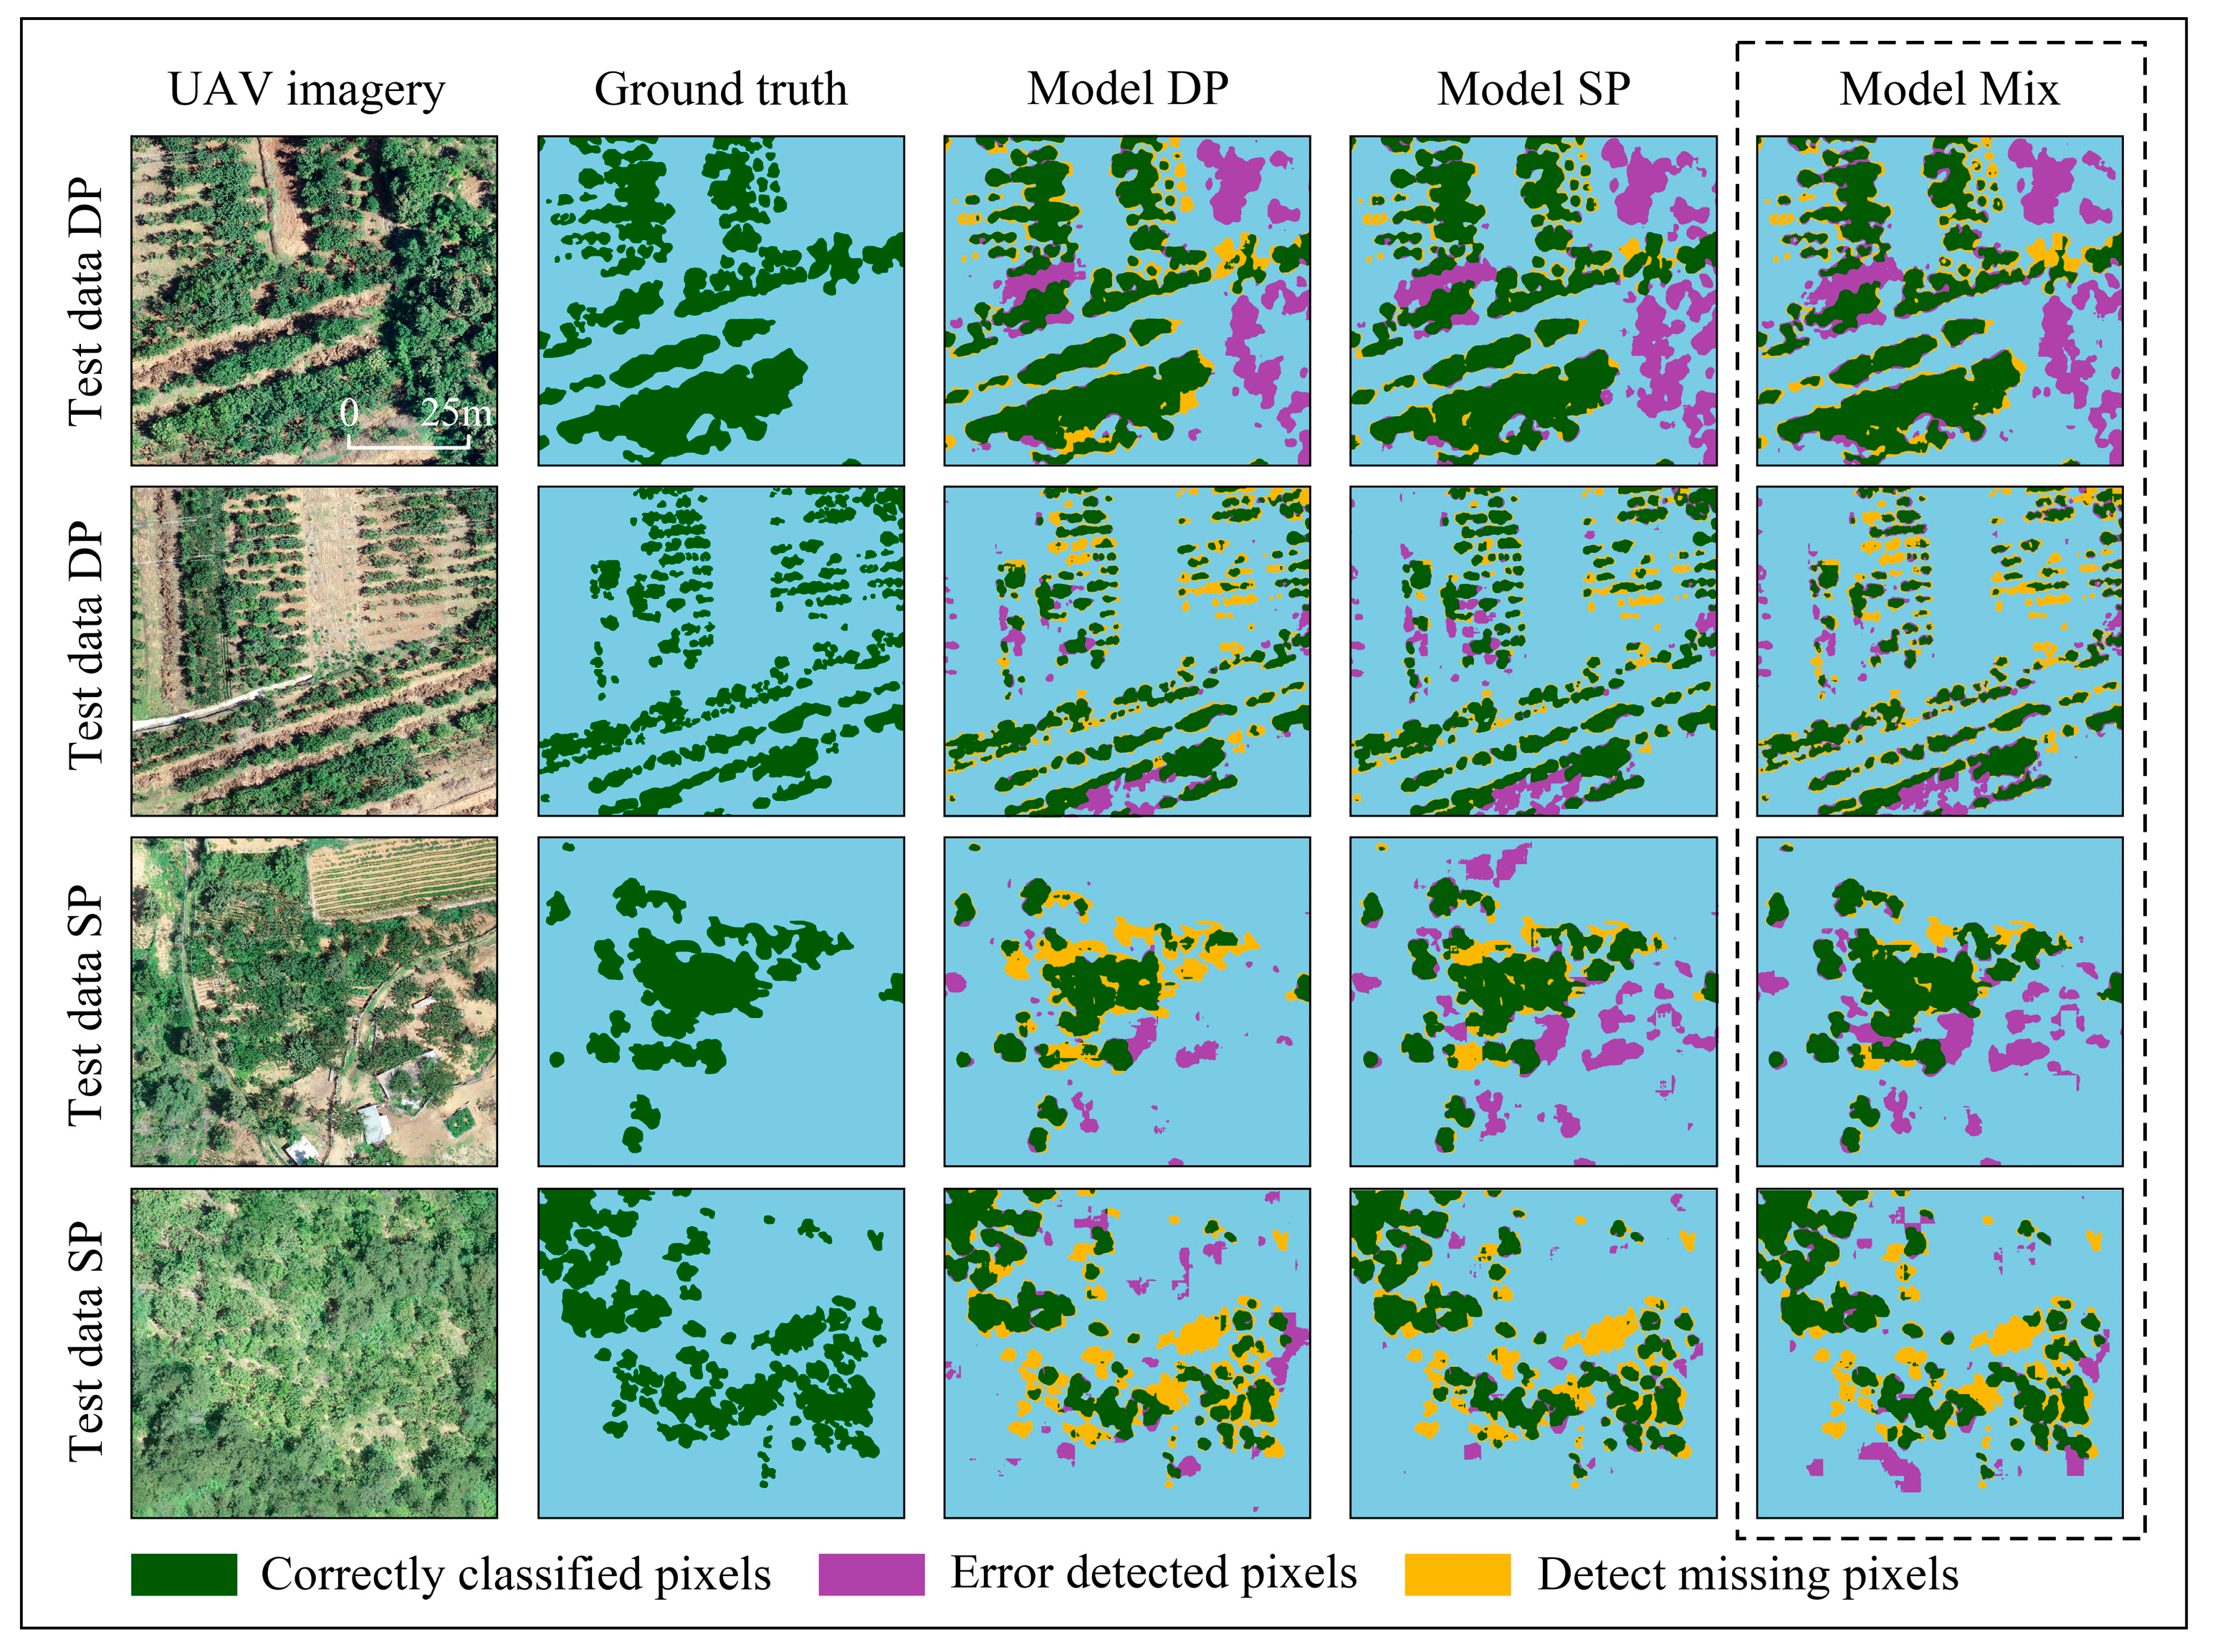
The accuracy evaluation of chestnut detection and classification on test sets DP and SP by models trained on different training datasets using the most suitable classification model DeepLab V3 (with ResNet-34 backbone model) is shown in Table 3 and Figure 5. The detection performance of models DP and SP was lower than that of model MIX on all sites, and there were varying degrees of deviation in terms of detection errors and missed pixels across different sites. The deep learning model trained on the mixed training dataset composed of two distribution patterns of chestnuts achieved the highest mean detection accuracy and the best classification performance, with a mean F1 score of 86.13%. Models trained using a single training dataset composed of a singular distribution pattern exhibited significant decreases in detection accuracy when applied outside the research area. Specifically, the model trained solely on DP data showed lower classification accuracy on test set SP (F1 score = 77.36%). On the other hand, the model trained with a single SP training dataset had a relatively smaller impact on the classification accuracy for the test set DP (F1 score = 86.79%), and the difference from the highest classification accuracy was also relatively small. However, it still performed worse than the model trained with the training dataset that includes two different planting patterns (F1 score = 88.71%).
4. Discussion
Spatial distribution information on chestnut forests is essential for accurately evaluating their area and quantity. Compared to traditional ground sampling surveys, remote sensing technology combined with high-resolution RGB imagery provides an effective means of detecting and acquiring the spatial distribution information on large-scale chestnut plantations. Deep learning, especially CNN, demonstrates excellent performance in extracting spatial distribution information on large-scale chestnut plantations from drone imagery, as demonstrated by the comparison of different semantic segmentation models, particularly DeepLab V3 utilizing the ResNet-34 backbone model.
4.1. Semantic Segmentation
High-resolution RGB images obtained through UAVs were solely utilized in our research. We employed four semantic segmentation models with two different backbone models to detect chestnut pixels in the test dataset and determine the coverage area of chestnut planting. Among these models, DeepLab V3 (with a ResNet-34 backbone) achieved the highest accuracy, with an F1 score of 86.13%. The use of high-resolution RGB imagery can significantly reduce the need for extensive ground truth surveys, especially in dense forest canopies such as tropical forests [7,54]. Compared to satellite imagery, which is limited by weather conditions and spatial resolution, UAV remote sensing offers greater flexibility [55]. In the context of tree species classification, remote sensing-based semantic segmentation tasks have already been successfully used for large-scale mapping of fruit trees such as coconut palms [4], citrus [6], and bananas [56] from UAV-based RGB images. The combination of high-spectral and multi-spectral imagery with RGB imagery has not demonstrated significant advantages in many tasks [6,57]. The combination of high-resolution RGB imagery and deep learning semantic segmentation models provides a method for fruit tree detection with maneuverability, flexibility, simplicity, and low cost.
By utilizing a well-trained semantic segmentation model, there is no need for tree segmentation or localization steps prior to model inference. This enables us to fully leverage the end-to-end learning capability of CNNs. This streamlined approach enhances both the efficiency and accuracy in estimating the coverage area of chestnut planting [23]. Many studies adopt object-based classification methods to delineate individual tree crowns (ITCs) [25,30]. Combined with visible light (RGB) and multispectral data, as well as multi-temporal analysis, a method was employed to detect chestnut vegetation coverage using a canopy height model (CHM) and vegetation index thresholds [58,59]. CHM determines the position of tree crowns based on height information and can detect the center point of chestnut tree crowns [56]. However, due to potential mismatches between the top point of chestnut trees and the center of their crowns, there may be slight displacements of the highest point relative to the center. Additionally, in managed forests, trees constantly grow, leading to varying degrees of crown overlap in chestnut plantations. It is challenging to visually identify ITCs in unmanned aerial imagery [60]. This was the main reason for using semantic segmentation methods to annotate and classify chestnut in this study.
4.2. Model Performance
The results obtained with the four semantic segmentation models, U-Net, DeepLab V3, PSPNet, and DeepLab V3+, showed significant differences in RGB image detection. The average F1 scores for these models were all above 80%, except for DeepLab V3+ (with the ResNet-34 backbone model). DeepLab V3 with ResNet-34 achieved the highest average F1 score (86.13%), followed by U-Net with the ResNet-50 backbone model (F1 score = 85.08%), and DeepLab V3+ with the ResNet-34 backbone model had the lowest F1 score (78.69%). Many studies have compared the detection accuracy of different semantic segmentation architectures [61,62,63]. Jeon et al. [64] compared the performance of deep learning models for seagrass habitat detection and classification using U-Net, SegNet, PSPNet, and DeepLab V3+. Among them, U-Net, which has a relatively simple structure and fewer parameters, exhibited the best performance. Gibril et al. [4] evaluated the performance of U-Net (ResNet-50 backbone), PSPNet (ResNet-50 backbone), DeepLab V3+ (Xception backbone), U-Net (VGG-16 backbone), and DeepLab V3+ (ResNet-50 backbone) models based on a large-scale dataset of coconut palm tree RGB images. Although newer deep learning models are expected to demonstrate better semantic segmentation performance, in this study, DeepLab V3 with a simpler architecture exhibited better performance than DeepLab V3+ with deeper neural networks and more parameters. The U-Net network and DeepLab V3+ model showed significant deviations regardless of image types, as the complexity of the model may lead to overfitting or difficulties in training [64].
Each semantic segmentation model was tested using both the ResNet-34 and ResNet-50 backbone networks to evaluate the impact of different backbone networks on the detection results. There was no clear pattern regarding the influence of different backbone networks on the detection performance of the semantic segmentation models (Table 1). Generally, deeper backbone networks, such as ResNet-50, can provide richer feature representation capabilities and learn more complex and abstract feature information compared to shallower backbone networks like ResNet-34, which may result in better semantic segmentation performance [65]. However, when combined with different backbone architectures and semantic segmentation models, the accuracy of deeper backbone networks may not necessarily surpass that of shallower backbone networks due to factors such as dataset characteristics, parameter settings, and model architectures. It is advised to carry out tests and assessments that are specifically adapted to the current dataset and task while carrying out semantic segmentation tasks. The ideal backbone network and semantic segmentation model combination can be found by analyzing several combinations in order to attain the best detection performance [36].
4.3. Distribution of Sample Data
The impact of training data from different distribution patterns on model accuracy was compared, and the transferability of models between different forest structures was assessed. The results showed that different distribution patterns of training data influenced changes in the background and context that the model had to deal with, resulting in differences in detection accuracy for the trained model on the same test data [66]. Compared to the training data for a single forest environment, the mixed training data training MIX model had higher accuracy in testing data detection for different wood structures. Training datasets for complex forest backgrounds yielded greater improvements in model performance compared to a single training dataset. This means that for training samples of different wood structures, samples in complex backgrounds are more representative, and closed canopy areas with dense stands and complex vertical structures provide more identifiable features to the available complex background samples. Research by Morell-Monzó et al. [66] reveals that when transferring the model outside the training area, there is a poor recall for abandoned orchards in complex environments. These results also emphasize the importance of having a well-represented dataset for abandoned orchards in complex environments. However, this does not mean that single forest environmental training data is useless for the identification of chestnuts in complex environments; on the contrary, when classifying test data for complex forest environments, single forest environment training data also contributes. Therefore, it is necessary to add more training samples, especially complex forest background samples, for the identification of chestnut in complex forest environments. Culman et al. [66] employed training samples from different vegetation scenarios and found that expanding the size and diversity of the current dataset, along with enriching the data for palm feature learning, helps train a powerful and efficient vegetation detection model.
4.4. Portability across Data Types
Different planting patterns of chestnuts could affect the accuracy of model classification and detection. When evaluating the most suitable classification model based on two types of test data, DP and SP, all models performed better on the DP test data, with a difference ranging from 5.15% to 16.65%. It was demonstrated that when the model was transferred to areas outside the training region, the detection accuracy for trees with complex backgrounds was the lowest among three different data types [66]. In order to better understand the impact of the spatial distribution and data composition of the training dataset on model performance, two sets of models were trained using training data consisting of a single type. These models were evaluated for their transferability across different chestnut planting distribution patterns. Models trained on training datasets composed of only DP or SP showed a significant decrease in detection and classification performance on cross-data type test data. This means that without including training data of the target dataset, good generalization results cannot be achieved solely based on a single training dataset. Moreover, models trained on a single training dataset also showed differences in the generalization performance for different data types. The single SP training data showed better generalization performance for different data types compared to single DP training data. This indicates that the complex background and scattered planting chestnut training data, due to their data diversity, enhance the model’s robustness and enable the model to learn richer feature representations, resulting in better performance in other scenarios [64].
The classification accuracy of the mixed training data model was higher than that of the single training data models. When comparing different training data compositions, the models trained on the mixed training dataset showed better classification performance. They achieved higher detection accuracy on both types of test data compared to the models trained on the single training datasets. Difficulties in tree detection and classification under complex backgrounds were reported before. Volpi et al. [67] studied the classification of abandoned olive tree groves using a balanced dataset and obtained poor recall rates and emphasized the importance of having a representative database with a good representation of the SP class. However, deep learning semantic segmentation models performed well in classifying and detecting the SP class test data when trained on a mixed training data composition.
4.5. Limitations and Practical Considerations
Different semantic segmentation models for accurately depicting chestnut species and vegetation communities in high-resolution RGB data were compared. The impact of different data compositions on the classification and detection results for different data types was validated, and the hybrid training data were proved to perform the best on test data of different types. It is worth noting that this study did not employ instance segmentation to individually segment complex and dense tree crowns, and thus did not achieve accurate labeling and classification of ITCs due to overlapping crown heights [9] and the lack of clear distinction between the crown edge and the top texture in the study area [61]. It has been pointed out that the interference of overlapping tree crowns and tree branches with crown-like features in orthoimagery is the main factor limiting the application of instance segmentation in forestry for ITC detection [23,68]. However, with the development of the computer industry, methods such as image enhancement using LoG filters [25], defining rule-constrained parameter updates using probabilistic soft logic (PSL) [69], and introducing model structures that enhance the performance and generalization ability of neural networks offer the possibilities of accurate tree crown classification and efficient application.
In agricultural environments where single-species tree classification is needed, cost-effective consumer-grade UAVs can achieve relatively accurate tree crown classification [70]. To further improve the detection accuracy in different planting modes, future studies should focus on enhancing the model’s spatial transferability and feature extraction capabilities on training data of different planting modes, which would be meaningful for accurately detecting chestnut distribution over a larger area.
5. Conclusions
The combination of low-cost UAV remote sensing data and semantic segmentation models provides an effective method for precise real-time monitoring and evaluation of tree canopy coverage. Four semantic segmentation models and backbone networks were used to determine the most suitable means for classifying chestnut trees, and the effect of chestnut planting patterns on model accuracy was examined. DeepLab V3 (with ResNet-34 backbone) exhibits the best performance, while more complex and deeper CNN structures or backbone networks may not improve the classification performance. In addition, the spatial distribution patterns of different forest structures affect the accuracy of model classification, and training datasets in complex forest backgrounds enhance the performance of the model, so when obtaining limited training datasets, it is necessary to give priority to the acquisition of data from complex forests backgrounds.
Author Contributions
Conceptualization, Y.S. and J.H.; methodology, Y.S. and Z.H.; software, Y.S. and Z.H.; validation, Y.S.; formal analysis, Y.S., J.H. and Z.H.; investigation, Y.S.; resources, Y.S.; data curation, Y.S.; writing—original draft preparation, Y.S.; writing—review and editing, Y.S., Z.G., Z.L., Z.H. and J.H.; visualization, Y.S.; supervision, J.H.; project administration, J.H.; funding acquisition, J.H. All authors have read and agreed to the published version of the manuscript.
Funding
This study was supported in part by the National Key R&D Program of China (2022YFD1600205), the Agricultural Science and Technology Innovation Program of CAAS, grant number CAAS-ASTIP-2023-IAR; and the China Agriculture Research System-Bee, grant number CARS-44-KXJ5.
Data Availability Statement
The data presented in this study are available on request from the corresponding author.
Acknowledgments
We would like to thank W.S. and G.D. for participating in the field survey. In addition, we wish to thank the anonymous reviewers and editors for their detailed comments and suggestions.
Conflicts of Interest
The authors declare that they have no known competing financial interest or personal relationships that could have influenced the work reported in this paper.
References
- Maxwell, S.; Fernando, A. Cash crops in developing countries: The issues, the facts, the policies. World Dev. 1989, 17, 1677–1708. [Google Scholar]
- Anderman, T.L.; Remans, R.; Wood, S.A.; DeRosa, K.; DeFries, R.S. Synergies and tradeoffs between cash crop production and food security: A case study in rural Ghana. Food Secur. 2014, 6, 541–554. [Google Scholar]
- Su, S.; Yang, C.; Hu, Y.; Luo, F.; Wang, Y. Progressive landscape fragmentation in relation to cash crop cultivation. Appl. Geogr. 2014, 53, 20–31. [Google Scholar] [CrossRef]
- Gibril, M.B.A.; Shafri, H.Z.M.; Shanableh, A.; Al-Ruzouq, R.; Wayayok, A.; Hashim, S.J. Deep convolutional neural network for large-scale date palm tree mapping from UAV-based images. Remote Sens. 2021, 13, 2787. [Google Scholar] [CrossRef]
- Maheswari, P.; Raja, P.; Apolo-Apolo, O.E.; Pérez-Ruiz, M. Intelligent fruit yield estimation for orchards using deep learning based semantic segmentation techniques—A review. Front. Plant Sci. 2021, 12, 684328. [Google Scholar]
- Osco, L.P.; Arruda, M.D.S.D.; Marcato Junior, J.; Da Silva, N.B.; Ramos, A.P.M.; Moryia, É.A.S.; Imai, N.N.; Pereira, D.R.; Creste, J.E.; Matsubara, E.T.; et al. A convolutional neural network approach for counting and geolocating citrus-trees in UAV multispectral imagery. ISPRS J. Photogramm. 2020, 160, 97–106. [Google Scholar] [CrossRef]
- Ferreira, M.P.; Lotte, R.G.; D’Elia, F.V.; Stamatopoulos, C.; Kim, D.; Benjamin, A.R. Accurate mapping of brazil nut trees (Bertholletia excelsa) in amazonian forests using WorldView-3 satellite images and convolutional neural networks. Ecol. Inform. 2021, 63, 101302. [Google Scholar]
- Badiu, D.; Arion, F.; Muresan, I.; Lile, R.; Mitre, V. Evaluation of economic efficiency of apple orchard investments. Sustainability 2015, 7, 10521–10533. [Google Scholar] [CrossRef]
- Braga, J.R.G.; Peripato, V.; Dalagnol, R.; Ferreira, M.P.; Tarabalka, Y.; OC Aragão, L.E.; De Campos Velho, H.F.; Shiguemori, E.H.; Wagner, F.H. Tree crown delineation algorithm based on a convolutional neural network. Remote Sens. 2020, 12, 1288. [Google Scholar]
- Wulfsohn, D.; Aravena Zamora, F.; Potin Téllez, C.; Zamora Lagos, I.; García-Fiñana, M. Multilevel systematic sampling to estimate total fruit number for yield forecasts. Precis. Agric. 2012, 13, 256–275. [Google Scholar] [CrossRef]
- He, L.; Fang, W.; Zhao, G.; Wu, Z.; Fu, L.; Li, R.; Majeed, Y.; Dhupia, J. Fruit yield prediction and estimation in orchards: A state-of-the-art comprehensive review for both direct and indirect methods. Comput. Electron. Agr. 2022, 195, 106812. [Google Scholar]
- Mitchard, E.T.A.; Feldpausch, T.R.; Brienen, R.J.W.; Lopez Gonzalez, G.; Monteagudo, A.; Baker, T.R.; Lewis, S.L.; Lloyd, J.; Quesada, C.A.; Gloor, M.; et al. Markedly divergent estimates of Amazon forest carbon density from ground plots and satellites. Glob. Ecol. Biogeogr. 2014, 23, 935–946. [Google Scholar] [CrossRef]
- White, J.C.; Coops, N.C.; Wulder, M.A.; Vastaranta, M.; Hilker, T.; Tompalski, P. Remote sensing technologies for enhancing forest inventories: A review. Can. J. Remote Sens. 2016, 42, 619–641. [Google Scholar]
- Osco, L.P.; Marcato Junior, J.; Marques Ramos, A.P.; de Castro Jorge, L.A.; Fatholahi, S.N.; de Andrade Silva, J.; Matsubara, E.T.; Pistori, H.; Gonçalves, W.N.; Li, J. A review on deep learning in UAV remote sensing. Int. J. Appl. Earth Obs. Geoinf. 2021, 102, 102456. [Google Scholar]
- Liang, X.; Wang, Y.; Pyörälä, J.; Lehtomäki, M.; Yu, X.; Kaartinen, H.; Kukko, A.; Honkavaara, E.; Issaoui, A.E.I.; Nevalainen, O.; et al. Forest in situ observations using unmanned aerial vehicle as an alternative of terrestrial measurements. For. Ecosyst. 2019, 6, 20. [Google Scholar] [CrossRef]
- Zhang, C.; Xia, K.; Feng, H.; Yang, Y.; Du, X. Tree species classification using deep learning and RGB optical images obtained by an unmanned aerial vehicle. J. For. Res. 2021, 32, 1879–1888. [Google Scholar] [CrossRef]
- Xu, Z.; Shen, X.; Cao, L.; Coops, N.C.; Goodbody, T.R.H.; Zhong, T.; Zhao, W.; Sun, Q.; Ba, S.; Zhang, Z.; et al. Tree species classification using UAS-based digital aerial photogrammetry point clouds and multispectral imageries in subtropical natural forests. Int. J. Appl. Earth Obs. 2020, 92, 102173. [Google Scholar]
- Horvitz, E.; Mulligan, D. Machine learning: Trends, perspectives, and prospects. Science 2015, 349, 253–255. [Google Scholar] [CrossRef] [PubMed]
- Guo, Q.; Zhang, J.; Guo, S.; Ye, Z.; Deng, H.; Hou, X.; Zhang, H. Urban tree classification based on object-oriented approach and random forest algorithm using unmanned aerial vehicle (UAV) multispectral imagery. Remote Sens. 2022, 14, 3885. [Google Scholar] [CrossRef]
- Yan, S.; Jing, L.; Wang, H. A new individual tree species recognition method based on a convolutional neural network and high-spatial resolution remote sensing imagery. Remote Sens. 2021, 13, 479. [Google Scholar] [CrossRef]
- LeCun, Y.; Bengio, Y.; Hinton, G. Deep learning. Nature 2015, 521, 436–444. [Google Scholar]
- Schmidhuber, J. Deep learning in neural networks: An overview. Neural Netw. 2015, 61, 85–117. [Google Scholar]
- Schiefer, F.; Kattenborn, T.; Frick, A.; Frey, J.; Schall, P.; Koch, B.; Schmidtlein, S. Mapping forest tree species in high resolution UAV-based RGB-imagery by means of convolutional neural networks. ISPRS J. Photogramm. 2020, 170, 205–215. [Google Scholar] [CrossRef]
- Guo, J.; Xu, Q.; Zeng, Y.; Liu, Z.; Zhu, X.X. Nationwide urban tree canopy mapping and coverage assessment in Brazil from high-resolution remote sensing images using deep learning. ISPRS J. Photogramm. 2023, 198, 1–15. [Google Scholar]
- Lassalle, G.; Ferreira, M.P.; La Rosa, L.E.C.; de Souza Filho, C.R. Deep learning-based individual tree crown delineation in mangrove forests using very-high-resolution satellite imagery. ISPRS J. Photogramm. 2022, 189, 220–235. [Google Scholar]
- Kumar, S.; Jayagopal, P. Delineation of field boundary from multispectral satellite images through U-Net segmentation and template matching. Ecol. Inform. 2021, 64, 101370. [Google Scholar]
- La Rosa, L.E.C.; Sothe, C.; Feitosa, R.Q.; de Almeida, C.M.; Schimalski, M.B.; Oliveira, D.A.B. Multi-task fully convolutional network for tree species mapping in dense forests using small training hyperspectral data. ISPRS J. Photogramm. 2021, 179, 35–49. [Google Scholar] [CrossRef]
- Zhao, H.; Morgenroth, J.; Pearse, G.; Schindler, J. A systematic review of individual tree crown detection and delineation with convolutional neural networks (CNN). Curr. For. Rep. 2023, 9, 149–170. [Google Scholar]
- Zhu, Y.; Zhou, J.; Yang, Y.; Liu, L.; Liu, F.; Kong, W. Rapid target detection of fruit trees using UAV imaging and improved light YOLOv4 algorithm. Remote Sens. 2022, 14, 4324. [Google Scholar] [CrossRef]
- Ferreira, M.P.; Almeida, D.R.A.D.; Papa, D.D.A.; Minervino, J.B.S.; Veras, H.F.P.; Formighieri, A.; Santos, C.A.N.; Ferreira, M.A.D.; Figueiredo, E.O.; Ferreira, E.J.L. Individual tree detection and species classification of Amazonian palms using UAV images and deep learning. For. Ecol. Manag. 2020, 475, 118397. [Google Scholar] [CrossRef]
- Wang, J.; Ding, J.; Ran, S.; Qin, S.; Liu, B.; Li, X. Automatic pear extraction from high-resolution images by a visual attention mechanism network. Remote Sens. 2023, 15, 3283. [Google Scholar]
- Kattenborn, T.; Schiefer, F.; Frey, J.; Feilhauer, H.; Mahecha, M.D.; Dormann, C.F. Spatially autocorrelated training and validation samples inflate performance assessment of convolutional neural networks. ISPRS Open J. Photogramm. Remote Sens. 2022, 5, 100018. [Google Scholar] [CrossRef]
- Hao, Z.; Lin, L.; Post, C.J.; Mikhailova, E.A.; Yu, K.; Fang, H.; Liu, J. The co-effect of image resolution and crown size on deep learning for individual tree detection and delineation. Int. J. Digit. Earth 2023, 16, 3754–3772. [Google Scholar] [CrossRef]
- Weinstein, B.G.; Marconi, S.; Bohlman, S.A.; Zare, A.; White, E.P. Cross-site learning in deep learning RGB tree crown detection. Ecol. Inform. 2020, 56, 101061. [Google Scholar] [CrossRef]
- Martín, M.A.; Mattioni, C.; Molina, J.R.; Alvarez, J.B.; Cherubini, M.; Herrera, M.A.; Villani, F.; Martín, L.M. Landscape genetic structure of chestnut (Castanea sativa Mill.) in Spain. Tree Genet. Genomes 2012, 8, 127–136. [Google Scholar] [CrossRef]
- Retallack, A.; Finlayson, G.; Ostendorf, B.; Lewis, M. Using deep learning to detect an indicator arid shrub in ultra-high-resolution UAV imagery. Ecol. Indic. 2022, 145, 109698. [Google Scholar] [CrossRef]
- Guo, Y.; Liu, Y.; Oerlemans, A.; Lao, S.; Wu, S.; Lew, M.S. Deep learning for visual understanding: A review. Neurocomputing 2016, 187, 27–48. [Google Scholar]
- Guo, Y.; Liu, Y.; Georgiou, T.; Lew, M.S. A review of semantic segmentation using deep neural networks. Int. J Multimed. Inf. Retr. 2018, 7, 87–93. [Google Scholar] [CrossRef]
- Yuan, X.; Shi, J.; Gu, L. A review of deep learning methods for semantic segmentation of remote sensing imagery. Expert Syst. Appl. 2021, 169, 114417. [Google Scholar]
- Zunair, H.; Ben Hamza, A. Sharp U-Net: Depthwise convolutional network for biomedical image segmentation. Comput. Biol. Med. 2021, 136, 104699. [Google Scholar] [CrossRef] [PubMed]
- Goodfellow, I.; Bengio, Y.; Courville, A. Deep Learning; MIT Press: Cambridge, MA, USA, 2016. [Google Scholar]
- Garcia-Garcia, A.; Orts-Escolano, S.; Oprea, S.O.; Villena-Martinez, V.; Garcia-Rodriguez, J. A review on deep learning techniques applied to semantic segmentation. arXiv 2022, arXiv:1704.06857. [Google Scholar]
- Ronneberger, O.; Fischer, P.; Brox, T. U-Net: Convolutional networks for biomedical image segmentation. In Proceedings of the Medical Image Computing and Computer-Assisted Intervention–MICCAI 2015: 18th International Conference, Munich, Germany, 5–9 October 2015; Proceedings, Part III 18. Springer International Publishing: Berlin/Heidelberg, Germany, 2015; pp. 234–241. [Google Scholar]
- Zhou, Z.; Siddiquee, M.; Tajbakhsh, N.; Liang, J. UNet++: A nested U-Net architecture for medical image segmentation. In Proceedings of the Deep Learning in Medical Image Analysis and Multimodal Learning for Clinical Decision Support, Granada, Spain, 20 September 2018; Springer International Publishing: Berlin/Heidelberg, Germany; Volume 11045, pp. 3–11. [Google Scholar]
- Chen, L.; Papandreou, G.; Schroff, F.; Adam, H. Rethinking atrous convolution for semantic image segmentation. arXiv 2017, arXiv:1706.05587, preprint. [Google Scholar]
- Choi, K.; Lim, W.; Chang, B.; Jeong, J.; Kim, I.; Park, C.; Ko, D.W. An automatic approach for tree species detection and profile estimation of urban street trees using deep learning and Google street view images. ISPRS J. Photogramm. 2022, 190, 165–180. [Google Scholar]
- Chen, L.; Zhu, Y.; Papandreou, G.; Schroff, F.; Adam, H. Encoder-Decoder with atrous separable convolution for semantic image segmentation. In Proceedings of the European Conference on Computer Vision (ECCV), Munich, Germany, 8–14 September 2018; pp. 801–818. [Google Scholar]
- Xia, L.; Zhang, R.; Chen, L.; Li, L.; Yi, T.; Wen, Y.; Ding, C.; Xie, C. Evaluation of deep learning segmentation models for detection of pine wilt disease in unmanned aerial vehicle Images. Remote Sens. 2021, 13, 3594. [Google Scholar] [CrossRef]
- Zhao, H.; Shi, J.; Qi, X.; Wang, X.; Jia, J. Pyramid scene parsing network. In Proceedings of the 2017 IEEE Conference on Computer Vision and Pattern Recognition (CVPR), Honolulu, HI, USA, 21–26 July 2017. [Google Scholar]
- Stubbings, P.; Peskett, J.; Rowe, F.; Arribas-Bel, D. A hierarchical urban forest index using street-level imagery and deep learning. Remote Sens. 2019, 11, 1395. [Google Scholar] [CrossRef]
- Hao, Z.; Lin, L.; Post, C.J.; Mikhailova, E.A.; Li, M.; Chen, Y.; Yu, K.; Liu, J. Automated tree-crown and height detection in a young forest plantation using mask region-based convolutional neural network (Mask R-CNN). ISPRS J. Photogramm. Remote Sens. 2021, 178, 112–123. [Google Scholar]
- Castilla, G.; Filiatrault, M.; McDermid, G.J.; Gartrell, M. Estimating individual conifer seedling height using drone-based image point clouds. Forests 2020, 11, 924. [Google Scholar] [CrossRef]
- Rodríguez-Garlito, E.C.; Paz-Gallardo, A.; Plaza, A. Mapping invasive aquatic plants in sentinel-2 images using convolutional neural networks trained with spectral indices. IEEE J.-Stars 2023, 16, 2889–2899. [Google Scholar] [CrossRef]
- Puliti, S.; Ene, L.T.; Gobakken, T.; Næsset, E. Use of partial-coverage UAV data in sampling for large scale forest inventories. Remote Sens. Environ. 2017, 194, 115–126. [Google Scholar]
- Flood, N.; Watson, F.; Collett, L. Using a U-net convolutional neural network to map woody vegetation extent from high resolution satellite imagery across Queensland, Australia. Int. J. Appl. Earth Obs. 2019, 82, 101897. [Google Scholar]
- Jiang, Q.; Huang, Z.; Xu, G.; Su, Y. MIoP-NMS: Perfecting crops target detection and counting in dense occlusion from high-resolution UAV imagery. Smart Agric. Technol. 2023, 4, 100226. [Google Scholar] [CrossRef]
- Zhao, X.; Yuan, Y.; Song, M.; Ding, Y.; Lin, F.; Liang, D.; Zhang, D. Use of unmanned aerial vehicle imagery and deep learning U-Net to extract rice lodging. Sensors 2019, 19, 3859. [Google Scholar] [CrossRef]
- Pádua, L.; Marques, P.; Martins, L.; Sousa, A.; Peres, E.; Sousa, J.J. Monitoring of chestnut trees using machine learning techniques applied to UAV-based multispectral data. Remote Sens. 2020, 12, 3032. [Google Scholar] [CrossRef]
- Marques, P.; Pádua, L.; Adão, T.; Hruška, J.; Peres, E.; Sousa, A.; Sousa, J.J. UAV-Based automatic detection and monitoring of chestnut trees. Remote Sens. 2019, 11, 855. [Google Scholar] [CrossRef]
- Di Gennaro, S.F.; Nati, C.; Dainelli, R.; Pastonchi, L.; Berton, A.; Toscano, P.; Matese, A. An automatic UAV based segmentation approach for pruning biomass estimation in irregularly spaced chestnut orchards. Forests 2020, 11, 308. [Google Scholar]
- Kattenborn, T.; Eichel, J.; Fassnacht, F.E. Convolutional Neural Networks enable efficient, accurate and fine-grained segmentation of plant species and communities from high-resolution UAV imagery. Sci. Rep. 2019, 9, 17656. [Google Scholar] [CrossRef]
- Morales, G.; Kemper, G.; Sevillano, G.; Arteaga, D.; Ortega, I.; Telles, J. Automatic segmentation of Mauritia flexuosa in Unmanned Aerial Vehicle (UAV) imagery using deep learning. Forests 2018, 9, 736. [Google Scholar] [CrossRef]
- Lobo Torres, D.; Queiroz Feitosa, R.; Nigri Happ, P.; Elena Cué La Rosa, L.; Marcato Junior, J.; Martins, J.; Olã Bressan, P.; Gonçalves, W.N.; Liesenberg, V. Applying fully convolutional architectures for semantic segmentation of a single tree species in urban environment on high resolution UAV optical imagery. Sensors 2020, 20, 563. [Google Scholar] [CrossRef]
- Jeon, E.; Kim, S.; Park, S.; Kwak, J.; Choi, I. Semantic segmentation of seagrass habitat from drone imagery based on deep learning: A comparative study. Ecol. Inform. 2021, 66, 101430. [Google Scholar] [CrossRef]
- Yang, X.; Li, S.; Chen, Z.; Chanussot, J.; Jia, X.; Zhang, B.; Li, B.; Chen, P. An attention-fused network for semantic segmentation of very-high-resolution remote sensing imagery. ISPRS J. Photogramm. 2021, 177, 238–262. [Google Scholar] [CrossRef]
- Morell-Monzó, S.; Sebastiá-Frasquet, M.; Estornell, J.; Moltó, E. Detecting abandoned citrus crops using Sentinel-2 time series. A case study in the Comunitat Valenciana region (Spain). ISPRS J. Photogramm. 2023, 201, 54–66. [Google Scholar]
- Volpi, I.; Marchi, S.; Petacchi, R.; Hoxha, K.; Guidotti, D. Detecting olive grove abandonment with Sentinel-2 and machine learning: The development of a web-based tool for land management. Smart Agric. Technol. 2023, 3, 100068. [Google Scholar] [CrossRef]
- Kattenborn, T.; Leitloff, J.; Schiefer, F.; Hinz, S. Review on Convolutional Neural Networks (CNN) in vegetation remote sensing. ISPRS J. Photogramm. 2021, 173, 24–49. [Google Scholar]
- Harmon, I.; Marconi, S.; Weinstein, B.; Graves, S.; Wang, D.Z.; Zare, A.; Bohlman, S.; Singh, A.; White, E. Injecting domain knowledge into deep neural networks for tree crown delineation. IEEE T. Geosci. Remote. 2022, 60, 1–19. [Google Scholar] [CrossRef]
- Jin, H.; Jin, X.; Zhou, Y.; Guo, P.; Ren, J.; Yao, J.; Zhang, S. A survey of energy efficient methods for UAV communication. Veh. Commun. 2023, 41, 100594. [Google Scholar]
Figure 1.
Experimental site: (a) Location of the study site (the red triangle indicates Jugezhuang Town, Miyun District, Beijing); (b) study area scope and sample point distribution (red markers indicate the locations of typical sample sites); (c) example of orthorectified image of a typical sample site; (d) scattered distribution of chestnut area; (e) densely planted chestnut cultivation area.

Figure 2.
Illustration of orthorectified imagery with labeled samples: (a) Sample plots of chestnut were densely planted with single species; (b) labeled sample data of chestnut plots that were densely planted with single species; (c) scattered chestnut sample plots with complex background; (d) labeled sample data of chestnut plots that were scattered in complex background.

Figure 3.
The flowchart of the optimal deep learning model screening of chestnut and different forest structure training datasets on the model performance impact and generalization performance comparison. The white objects inside the red box represent the process of selecting the optimal deep learning model; the light blue color represents the split of datasets for training different depth learning models; the light green color represents the different models used for generalization evaluation.

Figure 4.
Visualization of semantic segmentation results from different test datasets. (a) U-Net (with ResNet-34 backbone); (b) U-Net (with ResNet-50 backbone); (c) DeepLab V3 (with ResNet-34 backbone); (d) DeepLab V3 (with ResNet-50 backbone); (e) PSPNet (with ResNet-34 backbone); (f) PSPNet (with ResNet-50 backbone); (g) DeepLab V3+ (with ResNet-34 backbone); (h) DeepLab V3+ (with ResNet-50 backbone).

Figure 5.
Detection results for models trained on different training sample compositions, as well as UAV remote sensing data and ground truth labels.
Figure 5.
Detection results for models trained on different training sample compositions, as well as UAV remote sensing data and ground truth labels.


Table 1.
Comparison of classification performance among different combinations of semantic segmentation models and backbone networks.
Table 1.
Comparison of classification performance among different combinations of semantic segmentation models and backbone networks.
| Semantic Segmentation Model | Backbone Network | Producer’s Accuracy (%) | User’s Accuracy (%) | F1 Score (%) |
|---|---|---|---|---|
| U-Net | ResNet-34 | 80.91 | 89.15 | 84.78 |
| ResNet-50 | 82.31 | 88.13 | 85.08 | |
| DeepLab V3 | ResNet-34 | 83.77 | 88.63 | 86.13 1 |
| ResNet-50 | 79.85 | 90.51 | 84.75 | |
| PSPNet | ResNet-34 | 77.69 | 89.60 | 83.16 |
| ResNet-50 | 78.06 | 88.26 | 82.67 | |
| DeepLab V3+ | ResNet-34 | 71.39 | 88.47 | 78.69 |
| ResNet-50 | 82.20 | 87.60 | 84.78 |
1 The DeepLab V3 (ResNet-34) model had the highest detection accuracy.
Table 2.
Comparison of detection accuracy of different semantic segmentation models on test datasets DP and SP.
Table 2.
Comparison of detection accuracy of different semantic segmentation models on test datasets DP and SP.
| Semantic Segmentation Model | Test Data | Producer’s Accu-racy (%) | User’s Accuracy (%) | F1 Score (%) |
|---|---|---|---|---|
| U-Net | Test data DP | 86.84 | 90.11 | 88.44 |
| Test data SP | 76.38 | 87.17 | 81.41 | |
| DeepLab V3 | Test data DP | 86.12 | 91.04 | 88.51 |
| Test data SP | 77.50 | 88.09 | 82.37 | |
| PSPNet | Test data DP | 85.46 | 91.01 | 88.13 |
| Test data SP | 70.29 | 86.85 | 77.69 | |
| DeepLab V3+ | Test data DP | 85.18 | 90.64 | 87.80 |
| Test data SP | 68.41 | 85.43 | 75.67 |
Table 3.
Evaluation of model generalization on different test datasets.
| Model | Training Data | Test Data | Producer’s Accuracy (%) | User’s Accuracy (%) | F1 Score (%) |
|---|---|---|---|---|---|
| Model DP | DP | Test data DP | 88.53 | 86.61 | 87.56 |
| Test data SP | 76.28 | 78.46 | 77.36 | ||
| Mean | 82.41 | 82.54 | 82.46 | ||
| Model SP | SP | Test data DP | 85.28 | 88.35 | 86.79 |
| Test data SP | 78.15 | 83.73 | 80.84 | ||
| Mean | 81.72 | 86.04 | 83.81 | ||
| Model Mix | Mix | Test data DP | 86.47 | 91.06 | 88.71 |
| Test data SP | 81.06 | 86.20 | 83.55 | ||
| Mean | 83.77 | 88.63 | 86.13 |
Disclaimer/Publisher’s Note: The statements, opinions and data contained in all publications are solely those of the individual author(s) and contributor(s) and not of MDPI and/or the editor(s). MDPI and/or the editor(s) disclaim responsibility for any injury to people or property resulting from any ideas, methods, instructions or products referred to in the content. |
© 2023 by the authors. Licensee MDPI, Basel, Switzerland. This article is an open access article distributed under the terms and conditions of the Creative Commons Attribution (CC BY) license (https://creativecommons.org/licenses/by/4.0/).
Share and Cite
MDPI and ACS Style
Sun, Y.; Hao, Z.; Guo, Z.; Liu, Z.; Huang, J. Detection and Mapping of Chestnut Using Deep Learning from High-Resolution UAV-Based RGB Imagery. Remote Sens. 2023, 15, 4923. https://doi.org/10.3390/rs15204923
AMA Style
Sun Y, Hao Z, Guo Z, Liu Z, Huang J. Detection and Mapping of Chestnut Using Deep Learning from High-Resolution UAV-Based RGB Imagery. Remote Sensing. 2023; 15(20):4923. https://doi.org/10.3390/rs15204923
Chicago/Turabian StyleSun, Yifei, Zhenbang Hao, Zhanbao Guo, Zhenhu Liu, and Jiaxing Huang. 2023. "Detection and Mapping of Chestnut Using Deep Learning from High-Resolution UAV-Based RGB Imagery" Remote Sensing 15, no. 20: 4923. https://doi.org/10.3390/rs15204923
Note that from the first issue of 2016, this journal uses article numbers instead of page numbers. See further details here.