Article

Analysis of Spatial and Temporal Variability of Ecosystem Service Values and Their Spatial Correlation in Xinjiang, China

1
College of Grassland Science, Xinjiang Agricultural University, Urumqi 830046, China
2
State Key Laboratory of Desert and Oasis Ecology, Xinjiang Institute of Ecology and Geography, Chinese Academy of Sciences, Urumqi 830011, China
3
College of Geography and Remote Sensing Sciences, Xinjiang University, Urumqi 830046, China
*
Author to whom correspondence should be addressed.
Remote Sens. 2023, 15(19), 4861; https://doi.org/10.3390/rs15194861
Submission received: 17 July 2023 / Revised: 3 October 2023 / Accepted: 4 October 2023 / Published: 7 October 2023
(This article belongs to the Special Issue Remote Sensing of Arid/Semiarid Lands II)

Abstract

:
Xinjiang is located in arid northwest China, which is a key area for promoting the high-quality development of the regional ecological environment. In recent years, against a background of increasing human activities and rapid natural changes, Xinjiang has faced enormous ecological challenges. This paper utilizes land-use data from 2000 to 2020 to verify the region’s current state of the ecosystem. Additionally, it uses the value equivalent factor per unit area, ecosystem service value (ESV) loss and gain matrix, and double-factor spatial autocorrelation analysis to study the spatial and temporal variabilities of ESV in Xinjiang and its attribution to spatial correlation. The results show that (1) the ESV in Xinjiang exhibits an overall increasing trend during 2000–2020, with a total increase of about CNY 18.202 billion. Regulation-service ESV takes the main position in the single-service function, accounting for about 67.18% of the total ESV. In northern Xinjiang, the ESV demonstrates a decreasing trend, dropping by about CNY 16.885 billion, while in southern Xinjiang, the ESV shows an increasing trend, rising by CNY 35.086 billion. (2) For the study period, the main loss of ESV in Xinjiang is the conversion of ecological land with a high ESV into cropland or barren land with a low ESV. The conversion of bare land to grassland led to the largest increase in ESV (about CNY 209.308 billion), whereas the conversion of grassland to barren land led to the largest loss (about CNY 183.046 billion). (3) There are positive correlations among ESV, net primary productivity (NPP), and human activity intensity (HAI). However, all of the relationships weaken year by year. The spatial agglomeration of ESV ∩ NPP is significantly greater than that of ESV ∩ HAI, so NPP is the dominant factor in the spatial correlation of ESV in Xinjiang. The findings of this study provide a scientific basis for promoting high-quality regional ecological development in China’s arid northwest.

1. Introduction

Ecosystem services are the gains that ecosystems provide to human production in the output process and are the key to maintaining stability and sustainability in an ecosystem’s structure [1]. To further deepen the understanding of ecosystem services, Costanza et al. [2] proposed a global ESV assessment system in 1997. ESV, expressed in monetary terms, was proposed and used to quantify the intensity of ecosystem service capacity and the health of ecosystems. This evaluation system has good intuition and universal applicability, and its simple form is helpful for the assessment of ecosystem service function and ecological asset accounting [3,4]. The study of ecosystem services is currently one of the hottest research areas in ecology.
In recent years, research on land use and ESV change has become a hot topic. Shrestha et al. [5] used land use/cover change (LUCC) mapping analysis to study spatial and temporal changes in regional ESV. Their results showed that natural and human factors lead to LUCC changes, which, in turn, cause the evolution of ESV development. Gashaw et al. [6] discovered that land use changes and regional single ESV are strongly linked, such as the shift from forest to agriculture. This link weakens the role of regional gas regulation and climate regulation, but also enhances the protection of food production and biodiversity. Subham et al. [7] found that regional land class transformation and water quality health have effects on the ecological value of wetlands, and that the decrease in water quality is caused by multiple human activities, indirectly involving food security and total ecological value change. Xie et al. [8], in 2015, optimized and improved the ecosystem service function according to the characteristics of regional ecosystems in China and proposed an equivalent factor evaluation system with regional spatial characteristics. This system laid the foundation for the study of ESV in China. The equivalent factor coefficient is now being applied and is widely recognized in China’s national studies [9] with regard to the value of ecosystem services in various types of units. These units include cities [10,11], basins [12], and islands [13,14]. Many current studies have focused on the effects of human activities on ESV [15], but considering the ecological environment characteristics of Xinjiang, this study combines human activities and natural vegetation changes to attribute the spatial heterogeneity of ESV at the spatial scale.
Net Primary Productivity (NPP) is the main source of food, wood products, and fuel for human beings, which is essential for the stable development of human society and the economy [16]. Humans intervene in the natural development of the ecosystem and encroach on the NPP of vegetation under a series of activities such as production, living, and other modifications of land resources, of which the domination of land types is the most human-characterized form of activity [17]. The process of the human alteration of regional land use structures can seriously disturb the composition and function of ecosystems [18], resulting in changes in carbon stock and the carbon cycle [19]. Clarifying the relationship between ESV and NPP changes in the context of land use change plays a key role in carrying out ecological adaptive regulation and enhancing ecological stability and sustainable development in the region [20].
Under the influence of climate change and intensified human activities, the ecological environment in Xinjiang has encountered enormous challenges. The degradation of regional vegetation and soils caused by drought, desertification, salinization, and high-intensity anthropogenic disturbance activities [21,22,23] has severely reduced the level of ecological protection and disrupted the balance between natural and artificial ecosystems. At the same time, accelerated urbanization and population growth have led to increased demand for agricultural and livestock products [24,25].
Irrigation and the construction of reservoirs and other water conservation facilities across the arid zone have changed the distribution pattern and deployment of water resources [26,27]. The result has been a serious scarcity of water in the middle and lower reaches of the rivers, leading to the destruction of natural forests and grasslands [28,29]. In recent years, the ecological problems in Xinjiang have attracted extensive attention from government departments within China as well as from researchers around the world. Based on the research findings, the government has initiated a series of ecological restoration projects to address various ecological problems, such as the return of cultivated land to forest and grass, ecological water transfer, and ecological protection forests [30]. These have somewhat improved the ecological environment in Xinjiang.
In this paper, the ESV and its spatial and temporal change characteristics in the Xinjiang region from 2000 to 2020 were estimated based on the unit-area value equivalent factor method using long-term land use data; the ESV gains and losses and their causes were calculated by the LUCC transfer matrix; and the forces leading to the spatial heterogeneity of the ESV between ESV ∩ human activity intensity and ESV ∩ vegetation NPP were explored by means of two-factor spatial autocorrelation analysis, respectively. It mainly addresses the spatial and temporal characteristics of ESV changes in the study area, the analysis of ESV gain and loss changes, and the impact of human activities and vegetation changes on ESV, with a view to providing theoretical support for the high-quality development of the regional ecological environment and the positioning of ecological protection policies.

2. Materials and Methods

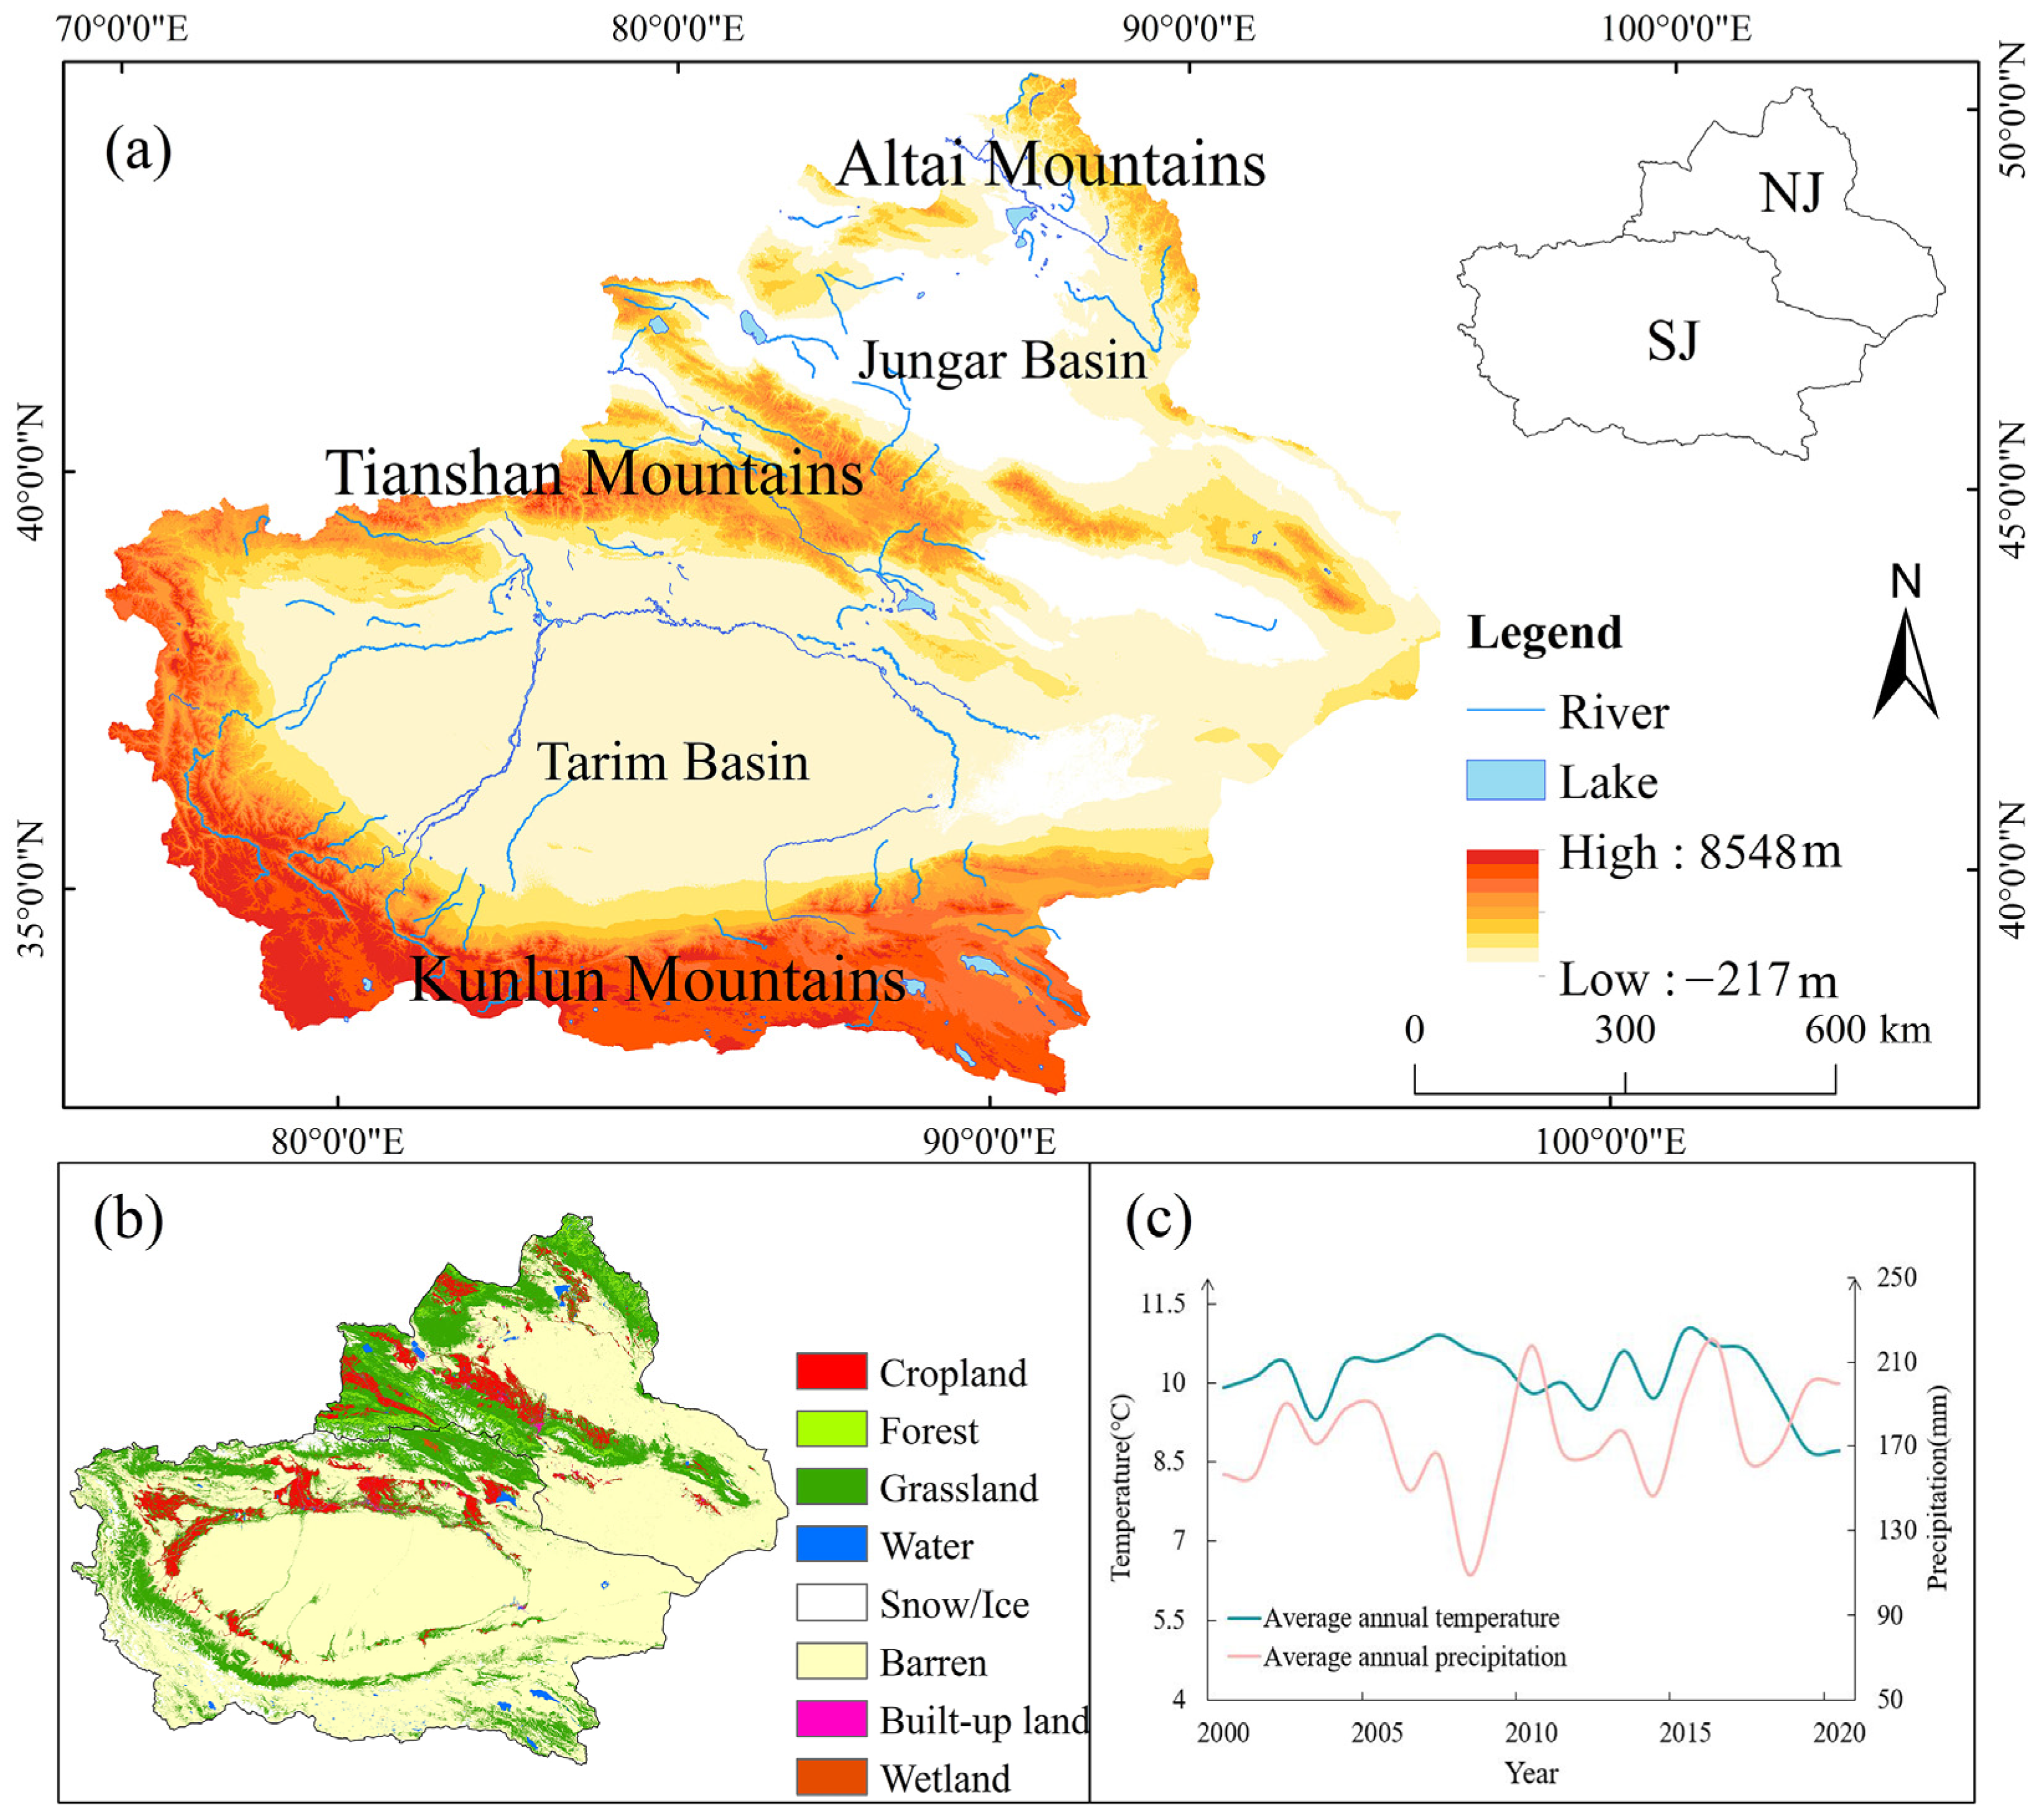
2.1. Description of the Study Area

Xinjiang is situated in the hinterland of Central Asia and East Asia, lying between 73°40′–96°18′E and 34°25′–48°10′N. It covers a total area of around 1.6 million square kilometers (166.49 × 10⁴ km2) and has an altitude ranging between 8483 and −217 m. The natural landscape of Xinjiang, which includes forest, grassland, glacial tundra, and desert, has a topographic distribution that can be summed up as “three mountains and two basins”. The three major mountain systems include the Altai Mountain, Tianshan Mountain, and Kunlun Mountain systems. The two basins include the Junggar Basin, which is located between the Altai Mountains and the central Tianshan Mountains in northern Xinjiang, and the Tarim Basin, which is located between the Kunlun Mountains and the central Tianshan Mountains in southern Xinjiang (Figure 1) [31]. The geomorphological features that characterize the region create a unique natural ecosystem.
Xinjiang has a typical continental arid climate, with average annual precipitation reaching around 173.90 mm. Most of the precipitation falls as rain in the summertime, and is heavier to the north of the Tianshan Mountains than to the south. Additionally, there is more precipitation in the west than in the east and more in the mountains than in the plains and basins [32]. The scarce precipitation and strong evaporation give Xinjiang an extremely dry climate. The average annual temperature is around 10.10 °C.
Despite its extremely fragile ecological environment, Xinjiang is a key part of China’s “Belt and Road” socio-economic construction. Therefore, the regional economic development and ecological civilization construction in the region are high priorities in China’s 14th Five-Year Plan.

2.2. Data Sources

In this paper, we selected five periods of current land use data in Xinjiang from 2000 to 2020, with a spatial resolution of 30 m. The data come from the Annual China Land Cover Dataset, published by Wuhan University, which has an overall classification accuracy of more than 80% [33]. The data requirements of ESV are based on the actual situation and research needs of the study area, and the dataset was reclassified into seven categories of land use types: cropland, forest, grassland, water, snow/ice, barren land, and wetland.
Data on the study area’s temperature and precipitation were obtained from the National Climatic Data Center, which is part of the National Oceanic and Atmospheric Administration. The topography and slope data were obtained from the SRTM DEM dataset, published by the Geospatial Data Cloud (http://www.gscloud.cn (12 May 2023)), with a spatial resolution of 30 m.
Vegetation net primary productivity (NPP) data were selected from the National Aeronautics and Space Administration (http://landweb.nascom.nasa.gov/ (24 July 2023)). MOD17A3 images with a spatial resolution of 500 m were obtained from the MODIS/Terra satellite terrestrial observation product, which is an output of global interannual variability in terrestrial vegetation NPP through the BIOME-BGC model [34]. The MOD17A3 data in HDF format were converted to tiff format using the MRT Tool and then re-projected. Cropping, scale conversion, and image production were performed using ArcGIS 10.2 software (Table 1).

2.3. Estimation of ESV

Ecosystem service value is an estimate of ecosystem services and natural capital using economic laws. This study refers to the Chinese ESV equivalent proposed by Xie et al. [8], in which agricultural land and unused land are relabeled cropland and barren land, respectively. They are then modified according to the actual situation in the study area. The coefficient is mainly calculated based on the value of food crops per unit area. However, due to the large spatial variability of natural conditions in China, there are significant differences in agricultural land productivity. The coefficient was therefore adjusted by the yield of food crops per unit area in the study area [35] to obtain a more appropriate accounting result of ecosystem service value. The revised value of individual ecosystem service equivalent factors for 2000–2020 in the study area is 1735.41 CNY·hm−2. The resulting service value coefficient per unit area of the Xinjiang ecosystem (Table 2) was used to calculate the value of ecosystem services in the study area, which was calculated as follows [36,37]:
E S V = A a × V C a E S V b = A a × V C b a
where ESV is the ecosystem service value, ESVb is the ecosystem service value of item b, Aa is the area of land use type a in the study area, VCa denotes the coefficient of ecological service value of land use type a, and VCba refers to the ecosystem service value of item b of land use type a.

2.4. ESV Gain/Loss Analysis

First, the land-use transfer matrix is calculated. Then, the ESV gain/loss flow is obtained to quantitatively analyze the ESV response to human activities [38]. The ESV gain/loss is calculated as:
P L i j = ( V C j V C i ) × A i j
where PLij is the ecosystem service value gain or loss after the conversion of land type i to land type j (CNY), VCj is the ecosystem service value coefficient of land type j (CNY/hm2), and Aij is the area of land type i converted to land type j (hm2).

2.5. ESV Anthropogenic Impact Index Analysis Method

The comprehensive anthropogenic impact index can reflect the characteristics of human activities or exploitation intensity (HAI) of different land types in Xinjiang, as well as changes in land use and landscape composition. Based on this, the HAI index is applied to evaluate the relationship between the intensity of anthropogenic disturbance and the ecological environment in Xinjiang [39]. The formula is as follows:
H A I = i = 1 n A i P i T A
where HAI is the comprehensive index of anthropogenic impact, Ai is the total area of the ith land type, Pi is the HAI parameter reflected by the ith land type, TA is the total area of land types in the evaluation unit, and n is the number of land types. In the present study, based on existing related research [40], the assignment method is used to assign a value to the parameter P by combining the characteristics of regional land class attributes.

2.6. Spatial Clustering Model

Spatial autocorrelation is an important indicator of the degree of correlation between a geographical phenomenon or its attribute values in a particular region and the same phenomenon or attribute values in neighboring regional units. The clustering and anomalies in the spatial distribution pattern of ecosystem service values are explored here, based on Global Moran’s I and Local Moran’s I in the GeoDa model [41]. The method is a method for spatial data analysis aimed at identifying spatial clustering patterns and recognizing the spatial dependencies of factors. It compares each region with its neighboring regions and calculates a local spatial correlation index for each region, which facilitates the discovery of spatial interaction phenomena between factors. Cluster analysis can also be divided into four categories based on clustering patterns: high–high, low–low, high–low, and low–high. The association characteristics of ESV ∩ HAI and ESV ∩ NPP in space were calculated separately using the bivariate spatial autocorrelation calculation method. The formula was calculated as:
I = n j = 1 n w i j x i x ¯ x j x ¯ i = 1 n j = 1 n w i j j = 1 n x i x ¯ 2
I i = ( x i x ¯ ) m 0 j = 1 n w i j ( x i x ¯ )
m 0 = i = 1 n ( x i x ¯ ) 2 / n
where x is the value of factor I, X ¯ is the mean of the factor values, wi, j is the spatial weight matrix between factors i and j, n is the total number of factors, and m0 is the standard deviation.

3. Results

3.1. Spatial and Temporal Variation Characteristics of ESV in Xinjiang

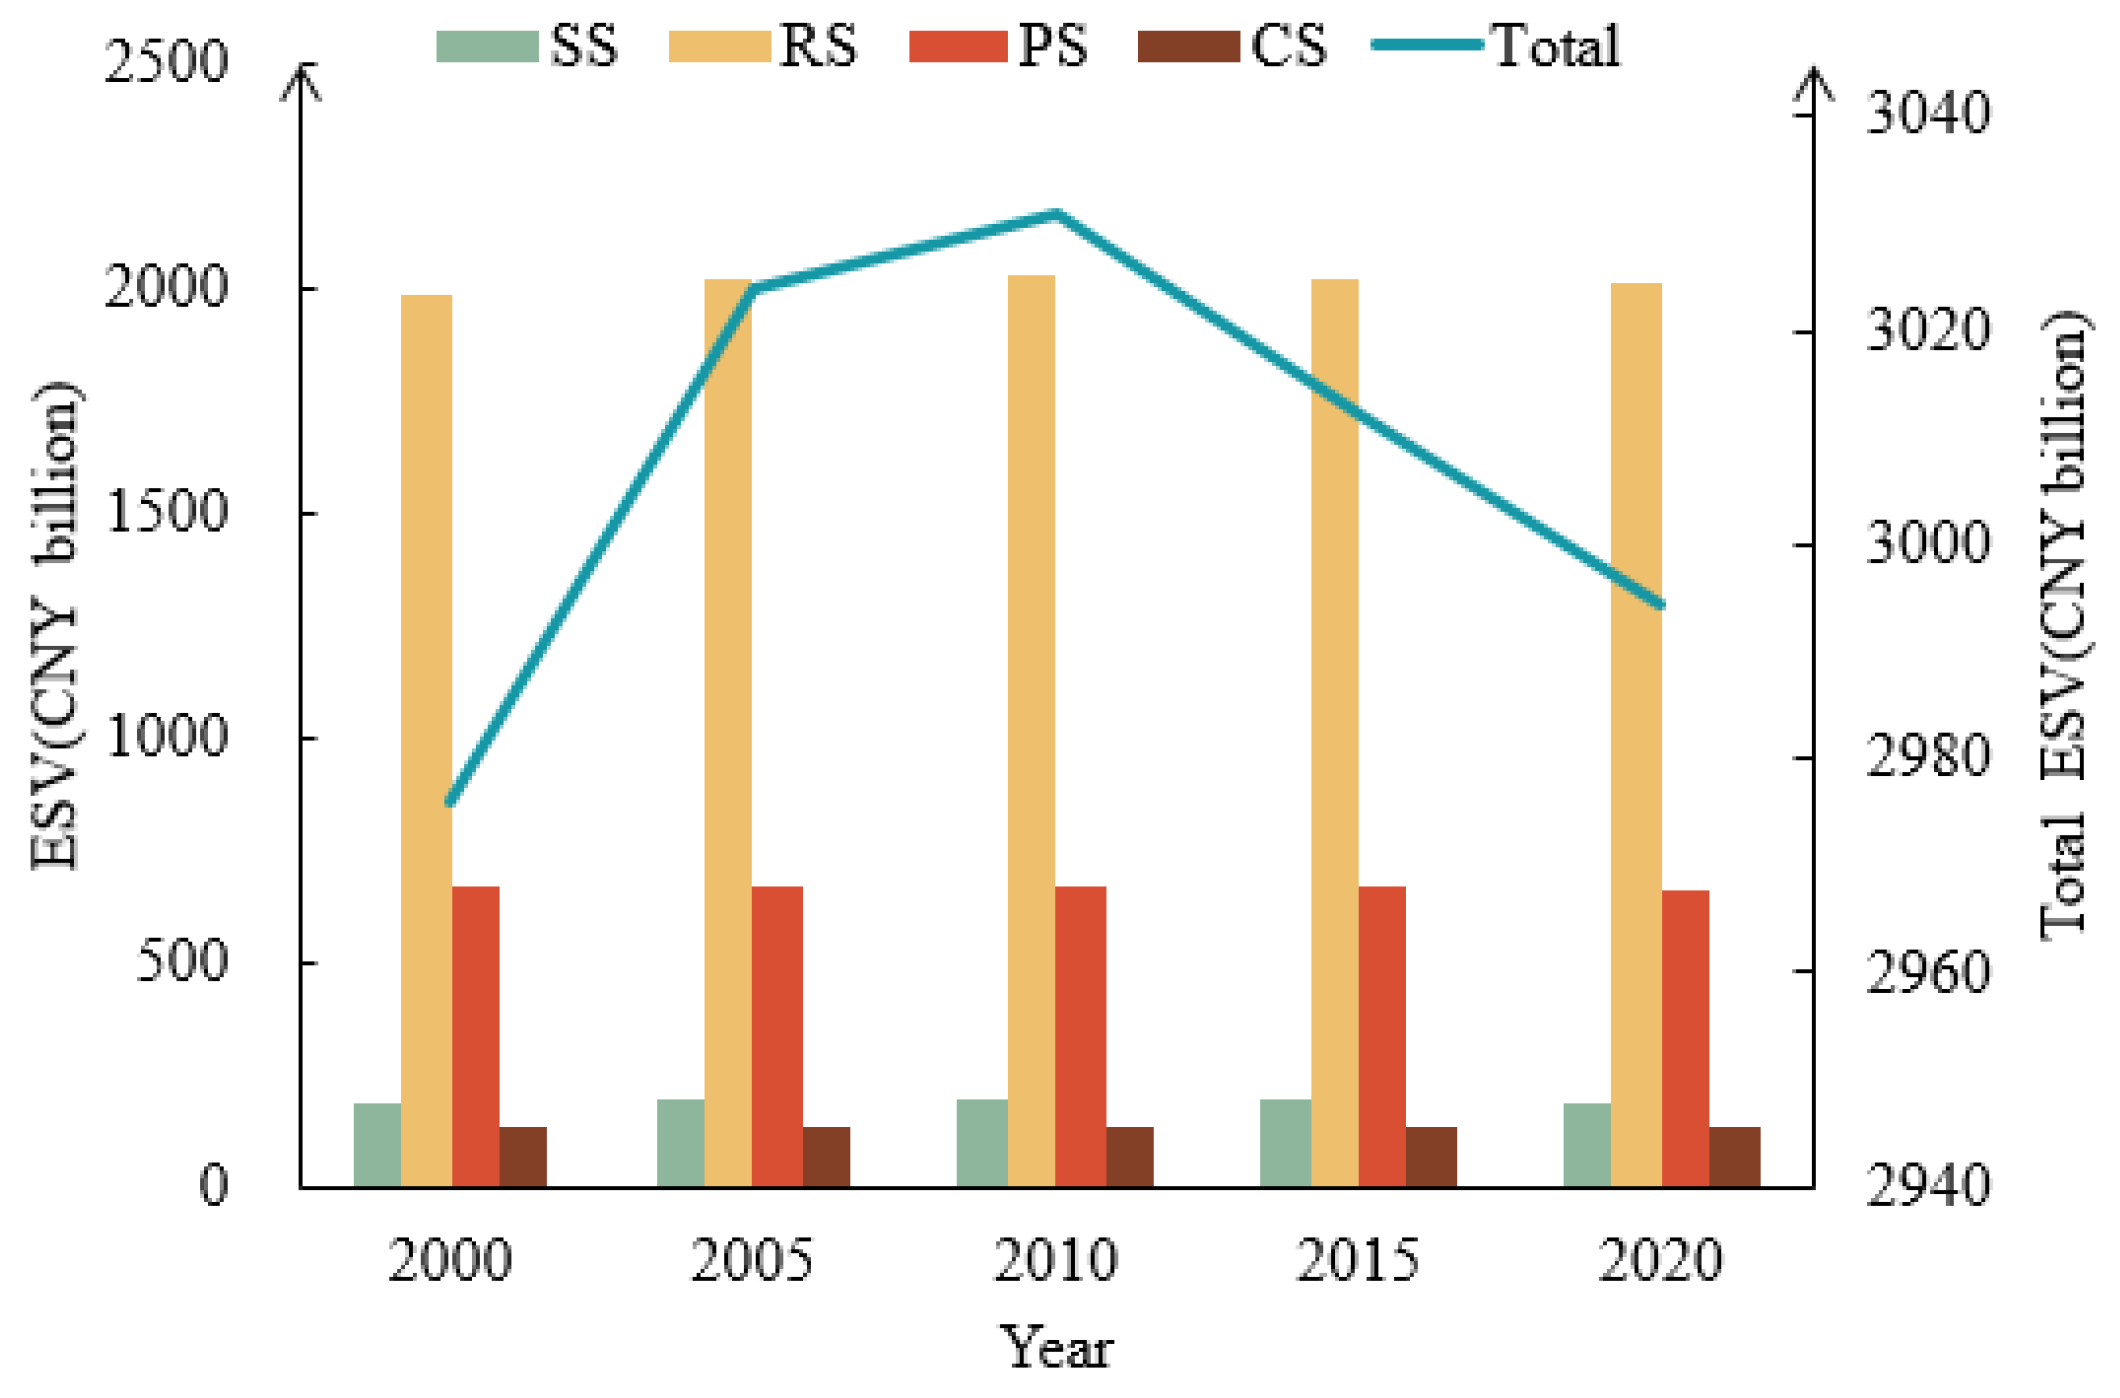
3.1.1. Changes in ESV

This paper calculates the total ecosystem service value of Xinjiang from 2000 to 2020 based on current land use in the region. The ESV in Xinjiang generally shows an increasing trend followed by a decreasing one. The highest ESV was CNY 3,030,934 million in 2010, followed by CNY 301,207 million in 2015, CNY 3,023,790 million in 2005, and CNY 299,470 million in 2020. The lowest ESV was in 2000, at CNY 2,976,069 million. The ESV in Xinjiang grew around CNY 18.202 billion between 2000 and 2020, showing a growth rate of around 0.61% (Figure 2).
In the composition of ESV, there are obvious differences in the change characteristics in southern and northern Xinjiang. The ESV in northern Xinjiang is slightly larger than that in southern Xinjiang as a whole, but there are opposite change trends in southern and northern Xinjiang. Among them, northern Xinjiang shows a fluctuating decreasing trend that drops around CNY 16.885 billion during 2000–2020, whereas southern Xinjiang shows a fluctuating increasing trend, with the ESV in 2020 adding about CNY 35.086 billion relative to 2000. The increase in the south of the region is twice the decrease in the north of the region, so the overall ESV in Xinjiang shows an increasing change trend.
Among the changes in each individual ESV, regulating service dominates, showing an ESV of CNY 201.613 billion in 2020 compared with CNY 198.4802 billion in 2000. This represents an increase of about CNY 26.811 billion, which is the largest change for individual ESVs. On the other hand, although the overall ESV of regulating services charts a growing trend, the climate-regulating function and the function of purifying the environment both show a loss. Support service ESV, which is second only to regulation service, exhibits a fluctuating decreasing trend, dropping CNY 6.929 billion during the study period. This reduction is mainly due to the loss of soil conservation function and biodiversity ESV. The supply service ESV changed insignificantly in Xinjiang during 2000–2020, with a total decrease of about CNY 0.09 billion. It first showed an increasing trend during 2000–2010, and then a significant decreasing trend during 2010–2020. Meanwhile, cultural services followed a decreasing trend, declining CNY 1.671 billion during 2000–2020.
From the above, it is clear that the ESV in Xinjiang shows an increasing trend from 2000 to 2020. However, there are obvious differences in the change characteristics of ESV between southern and northern Xinjiang, and these mainly show a decrease in northern Xinjiang and an increase in southern Xinjiang. After analyzing the individual ESVs, this study found that the increase in regulating services is the main reason for ESV growth in Xinjiang, and the loss of support services, supply services, and cultural services led to its decline.

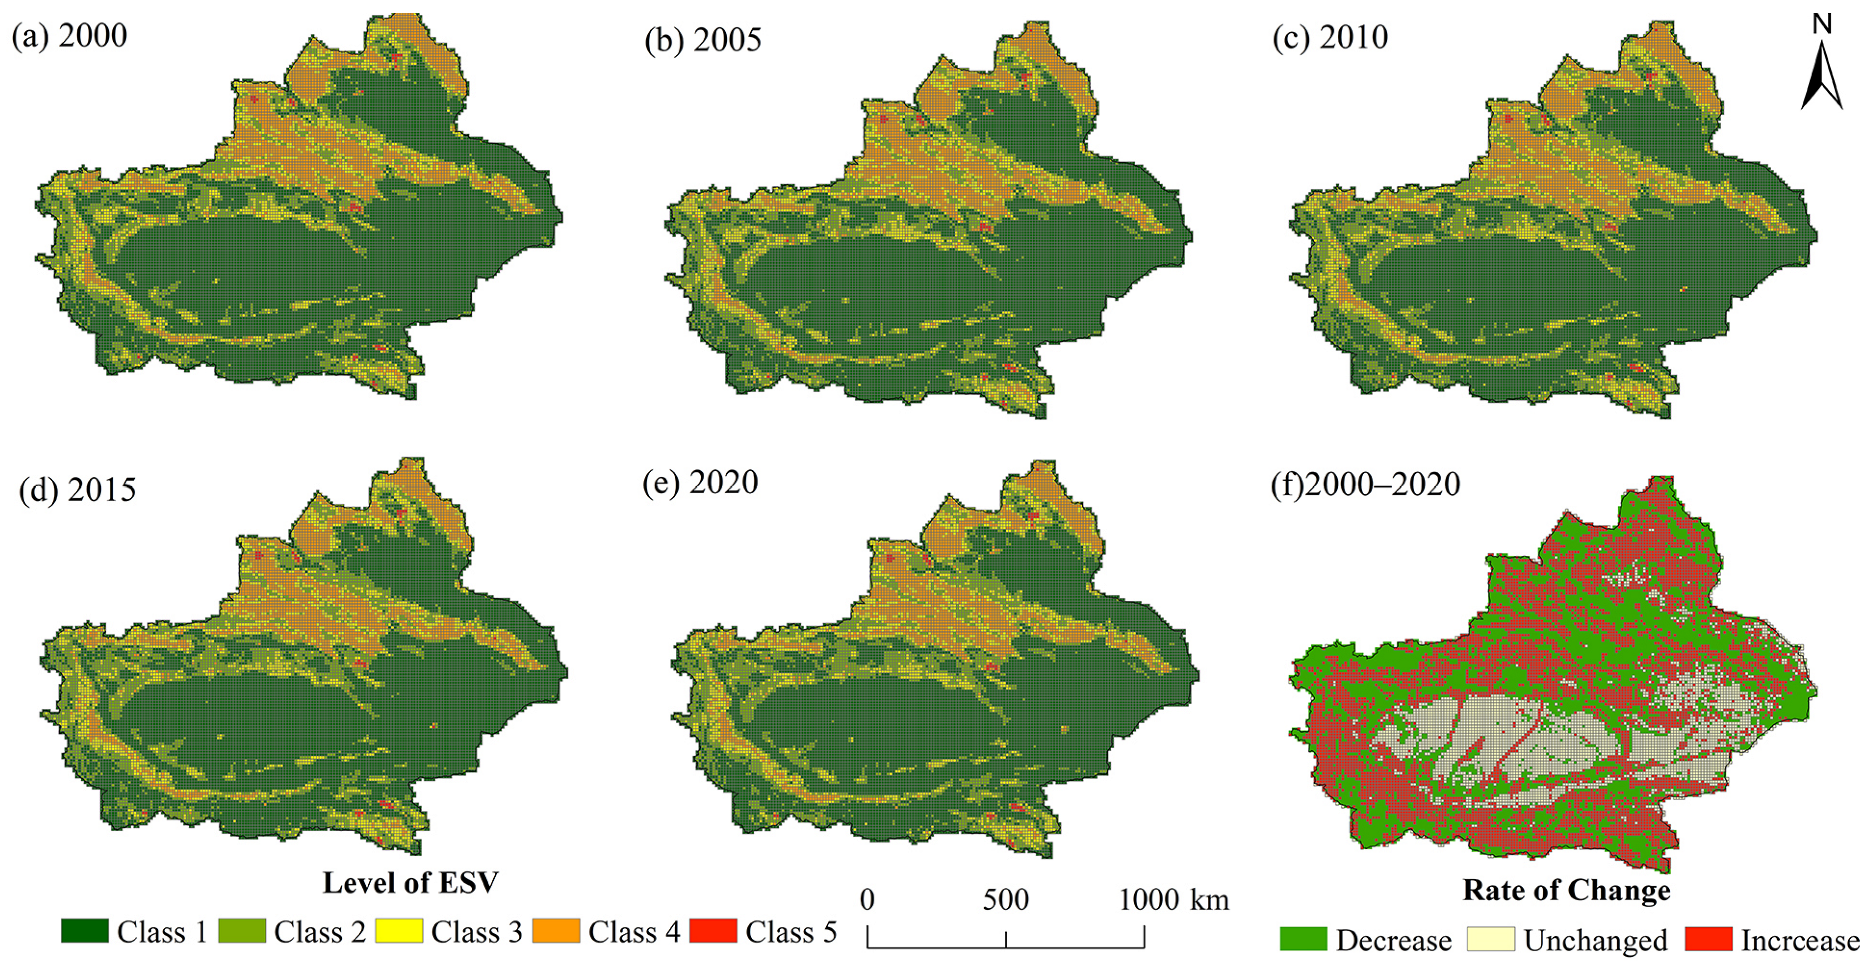
3.1.2. Spatial Change Characteristics of Ecosystem Service Values

Based on the current spatial distribution of ESVs in the Xinjiang region from 2000 to 2020—Figure 3), ESV is divided into five classes: Class 1 (CNY 0–0.11 billion), Class 2 (CNY 0.11–0.31 billion), Class 3 (CNY 0.31–0.52 billion), Class 4 (CNY 0.52–1.12 billion), and Class 5 (CNY 1.12–2.09 billion). ESV was found to show an overall spatial distribution characteristic of low in the central region and high in the surrounding area, which is compatible with the distribution characteristics of geomorphological types in the study area. The central basin has large sections of barren land and low ESV, whereas the oasis areas (mainly cropland) and mountainous areas (with large areas of grassland) have high ESV. In general, the high-value areas are mainly distributed in the mountainous areas in the northern, southern, and central regions of the study area, such as the Altai, Tianshan, and Kunlun mountain regions.
A comparison of changes in the spatial distribution of ESV between 2000 and 2020 reveals major increases and decreases. Specifically, the number of grids occupied by Class 2 areas increased by 429 and those occupied by Class 5 areas rose by 10. However, the number of grids occupied by Class 3 and Class 4 areas dropped by 26 and 127, respectively, and those occupied by Class 1 areas fell by 285, which is a significant decline. In view of this, the increase in the area of Class 2 and Class 5 and the decrease in the area of Class 1 resulted in an overall increase in ESV in Xinjiang.
The spatial distribution of ESV gain and loss changes is plotted in Figure 3f. During the study period, the overall increase in ESV is widely distributed, mainly in the middle and low mountain belt, mountain–plains junctions, and oases. The areas of decrease are located primarily in the high-altitude zones, the periphery of the oases, and the oasis–desert intersections. It is worth noting that in the central Tarim Basin and eastern Xinjiang, the changes are insignificant, as these locations are covered by desert all year round.
In general, the spatial changes in the ESV in Xinjiang mainly occurred in the oasis and mountainous areas, among which the most significant changes appeared in the Altay Prefecture, Tianshan Mountains, and Kunlun Mountains. Class 2, 4, and 1 are the most active regions for ESV changes in Xinjiang, while Class 3 and 5 are less active.

3.1.3. Ecosystem Service Value Loss and Gain Analysis

Based on the results of the transfer matrix of ecosystem service value gains and losses in Xinjiang (Figure 4, Table 3), the main loss of ESV in Xinjiang in 2000–2020 was caused by the transfer of land types with higher ESVs to those with lower values. The total loss of each land type to bare land and the conversion of each land type to cropland is CNY 196.630 billion and CNY 100.076 billion, respectively. On the other hand, the increase in ESV is due to the conversion of land types with lower ESVs to those with higher ones. The main conversions were the transfer of each land type to grassland, watershed, and forest land, with a total ESV increase of CNY 409.547 billion, accounting for 98.50% of the total ESV increase.
The largest increase in ESV (about CNY 209.308 billion) was due to the conversion of barren land to grassland. This was followed by the conversion of grassland to water (~CNY 92.773 billion), barren land to water (~CNY 49.677 billion), cropland to grassland (~CNY 30.886 billion), barren land to cropland (~CNY 9199 billion), and barren land to snow/ice (~CNY 7449 billion). The largest decrease in ESV (about CNY 183.046 billion) was due to the conversion of grassland to barren land, followed by the conversion of grassland to cropland (~CNY 102,161 billion). The ESV loss due to these two conversion phenomena accounts for 96.12% of the total ESV loss.
Through the changes in ESV loss and gain in Xinjiang, the increase or decrease in cropland resulted in an ESV loss of CNY 64.680 billion from 2000 to 2020. Among these changes, the transfer of grassland was mostly responsible for the loss of ESV. Population growth and economic development prompted a major increase in food demand, resulting in the reclamation of a large amount of grassland (23,517.36 km2), forest land (283.35 km2), and water (214.55 km2). The conversion of ecological land to agricultural land and barren land to agricultural land amounted to 9076.59 km2, resulting in an increased ESV of CNY 9199 million, and mitigating the loss of cropland ESV to some extent. Additionally, there was an increase of CNY 22.404 billion in forest land, which is mainly due to the inflow of 3777.26 km2 of grassland, resulting in an increase of CNY 24.709 billion in ESV.
During the 20-year study period, grassland showed an increasing trend, with a cumulative increase of about CNY 65.34 billion. This was mostly due to the conversion of barren land with a lower ESV into grassland (39,068.01 km2) and the conversion of cropland into grassland (7109.85 km2), resulting in an increase in the grassland ESV of CNY 209.308 billion and CNY 30.89 billion, respectively. The conversion of water to grassland (484.43 km2) resulted in a loss of grassland ESV of about CNY 6.652 billion. Water ESV showed an overall increasing trend from 2000–2020, with a total increase of CNY 131.73 billion. The conversion of grassland to water (615.39 km2) resulted in an increase in ESV of CNY 92.77 billion, and the process of barren land conversion to water (2602.48 km2) resulted in an increase in ESV of CNY 49.677 billion.
In general, the loss of water ESV is primarily due to the conversion of water to barren land with a lower ESV function. Nearly 375.22 km2 was converted, causing a loss of CNY 7.162 billion. The conversion of water to agricultural land (214.55 km2) resulted in a decrease in the water ESV of CNY 3.878 billion. Snow/ice ESV increased by CNY 3.924 billion during 2000–2020, of which CNY 1.784 billion was lost during the snow/ice transfer-out process, mainly due to the conversion of snow/ice to barren land (4541.49 km2), resulting in a loss of CNY 6.255 billion. Conversely, the ESV increased by CNY 5.708 billion during the snow/ice transfer-in process, mostly due to the conversion of barren land to snow/ice (5408.01 km2), increasing the ESV by CNY 7.449 billion.
The loss of snow/ice ESV was caused by the conversion of grassland to snow/ice (359.32 km2), resulting in a loss of CNY 1.430 billion. The increase or decrease in barren land led to an increase of CNY 79.099 billion; the ESV then rose by CNY 275.729 billion during the transfer-out of barren land. However, in the transfer-in process, the barren land ESV dropped to CNY 196.630 billion. Overall, the gain or loss of barren land ESV is mainly due to the process of mutual transformation of barren land and grassland.
The preceding findings show that the changes in ESV in Xinjiang are mainly due to the shift from high-ESV areas to low-value areas. Among them, the increase in water in the context of climate change and the implementation of several ecological projects have led to the conversion of a large amount of barren land into grassland with optimal ecological service functions and the restoration of the ecological environment.

3.2. Analysis of the Correlation between ESV and Intensity of Human Activities

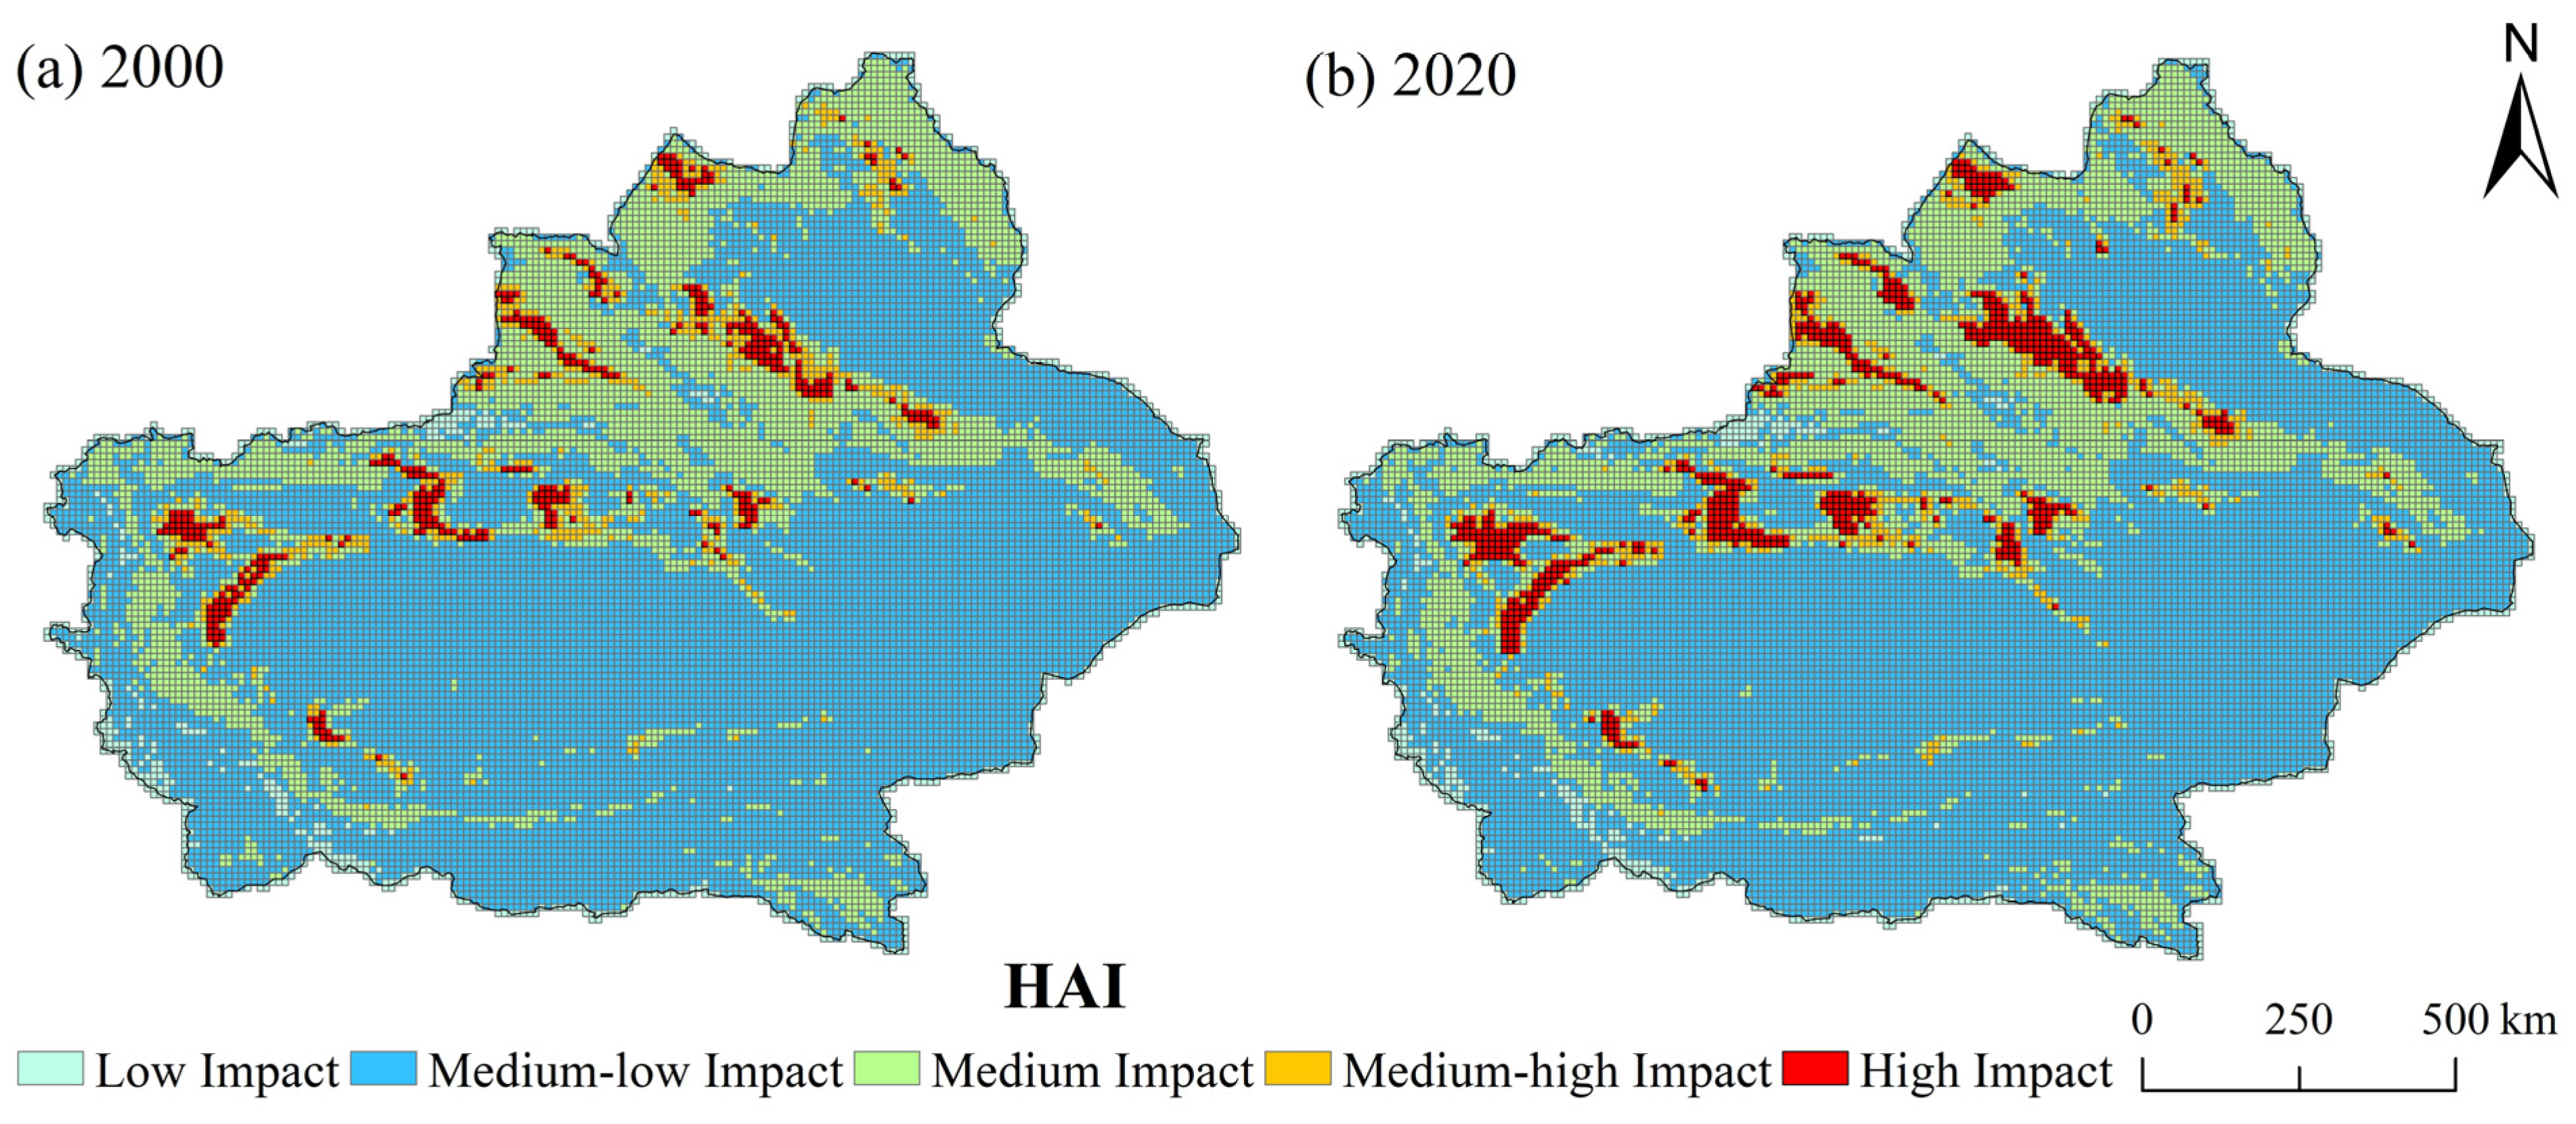
3.2.1. Analysis of Changes in Intensity of Human Activities

The anthropogenic impact index (HAI) was used to reflect the changes in ecosystem service values in Xinjiang during 2000–2020. On this basis, the HAI index was applied to evaluate the relationship between anthropogenic disturbance intensity and ecosystem service functions. The spatial distribution pattern of anthropogenic disturbance intensity was obvious, showing a distribution pattern that was high in the north and west, and low in the central and south (Figure 5). Further, the low-impact intensity occupies a dominant position and is concentrated in the Gurbantunggut Desert in northern Xinjiang, the Taklamakan Desert in southern Xinjiang, the Kunlun Mountains, the Kumtag Desert, and other desert and alpine areas. These poor ecological environments are generally unsuitable for human activities, and they do not have the water and heat conditions required for the growth of natural forests and grasslands.
Although the range of low-impact intensity on a regional scale is broad, the proportion has been gradually decreasing over time. This change is related to the large amount of human and material resources invested in ecological, economic, and social development in Xinjiang in recent years. The medium–low impact intensity is concentrated along the edges of oases and high mountainous areas on the periphery of deserts, such as the Tianshan region and the Altai Mountains in northern Xinjiang, the Bayanbulak grasslands in southern Xinjiang, and the western mountainous areas of Kashgar Prefecture. The landform types of these regions are mainly mountains and hills, and the natural forests and grasslands are more widely distributed and, thus, have a better ecological environment. However, because their geographical areas and environmental conditions are not suitable for human activities, the intensity of human activities is low.
At present, with the progress of climate warming and national economic construction development, the medium–low-impact area has gradually spread to a high human activity intensity range, such as a medium-impact degree and medium–high-impact degree. A comparison of the changes in spatial distribution of impact intensity in the HAI index from 2000 to 2020 indicates that the range of medium-impact intensity has continuously expanded. Furthermore, it mainly occurs in the northern part of the Altai Mountains, Tacheng Prefecture, the intersection with the desert north of the Tianshan region in northern Xinjiang, the Bayanbulak grasslands in southern Xinjiang, the eastern part of the Kunlun Mountains, and the western part of Aksu Prefecture. These locations have the most natural forest grassland in Xinjiang, and the flat terrain is primarily located in oases or desert–oasis interlacing zones, which are vulnerable to human activities. The increase in the area of this type of land clearly shows the surge of human activity on formerly bare land.
Meanwhile, the medium–high-impact intensity is transformed from an earlier speckle-like distribution to a more patchy distribution with some aggregation. During the study period, certain locations mostly shifted from medium-impact intensity to medium–high intensity. In southern Xinjiang, these locations were mainly distributed in oasis areas, such as Altay Prefecture, central Tacheng Prefecture, the Yili area, and the northern Tianshan Mountains in northern Xinjiang, while in southern Xinjiang, they were mainly distributed in Aksu Prefecture, Bayingoleng Mongol Autonomous Prefecture, and Kashgar Prefecture. These land types, which are dominated by artificial vegetation, natural grasslands, a high population, and urbanization, are under more stress from water resources, and are therefore more affected by human activities.
The high-impact intensity areas are mainly located in Tacheng Prefecture, the Yili area, the northern Tianshan Mountains, Aksu Prefecture, and Kashgar Prefecture. The densest distribution occurs in the northern Tianshan Mountains, which is the core area of economic development in Xinjiang and is characterized by high urbanization and a large population. The increase in this land use type leads to the expansion of artificial vegetation areas, which subsequently results in the decrease in natural forest and grassland areas. Moreover, even a slight increase will inevitably affect regional ecological environment change and natural forest grassland development.

3.2.2. Correlation Analysis

The bivariate global Moran’s I of ESV ∩ HAI in Xinjiang during 2000–2020 is greater than 0, 0.354, 0.343, 0.312, 0.281, and 0.276, respectively. These results passed the significance test, indicating a significant positive correlation of HAI ∩ ESV in Xinjiang. However, Moran’s I showed a decreasing trend, indicating a gradual weakening in its positive correlation. It is worth noting that this result only determines a similar clustering phenomenon existing in the study area, while its local spatial clustering structure is still unclear. With analysis help from the local Moran’s I index, this paper developed a LISA clustering map (Figure 6).
The local spatial correlation of the ESV ∩ HAI index in Xinjiang includes four major land-use types. The High–High aggregation area is mainly distributed in the southern edge of the Junggar Basin, Tacheng Prefecture, Yili River valley, and Altay Prefecture in northern Xinjiang, and in various oases in southern Xinjiang. The main land-use type in the High–High aggregation is arable land, which is influenced by human activities. Between 2000 and 2020, the number of grids covered by this type of agglomeration decreased by 37. The second land-use type occurs in Low–High aggregations, which are mainly located along the edges of oases. This type of area is mainly urban land and barren land near cropland, with low ecosystem service capacity and a high intensity of human activities. The number of grids covered by this land-use type increased by 116 during the study period. In Low–Low aggregation areas, the main land-use type is barren land, with a low intensity of human activities and weak ecosystem service function. The number of grids covered by this type of land use dropped by 60 during the study period, indicating that the value of ecosystem services in Xinjiang is increasing. In High–Low aggregation areas, the main land-use type is snow/ice. These areas are mainly distributed in snow/ice-covered locations at high altitudes. The number of High–Low grids increased by 35, mostly due to the influence of climate change, as the melting of snow/ice has increased the area.

3.3. Ecosystem Service Value and Natural Vegetation Correlation Analysis

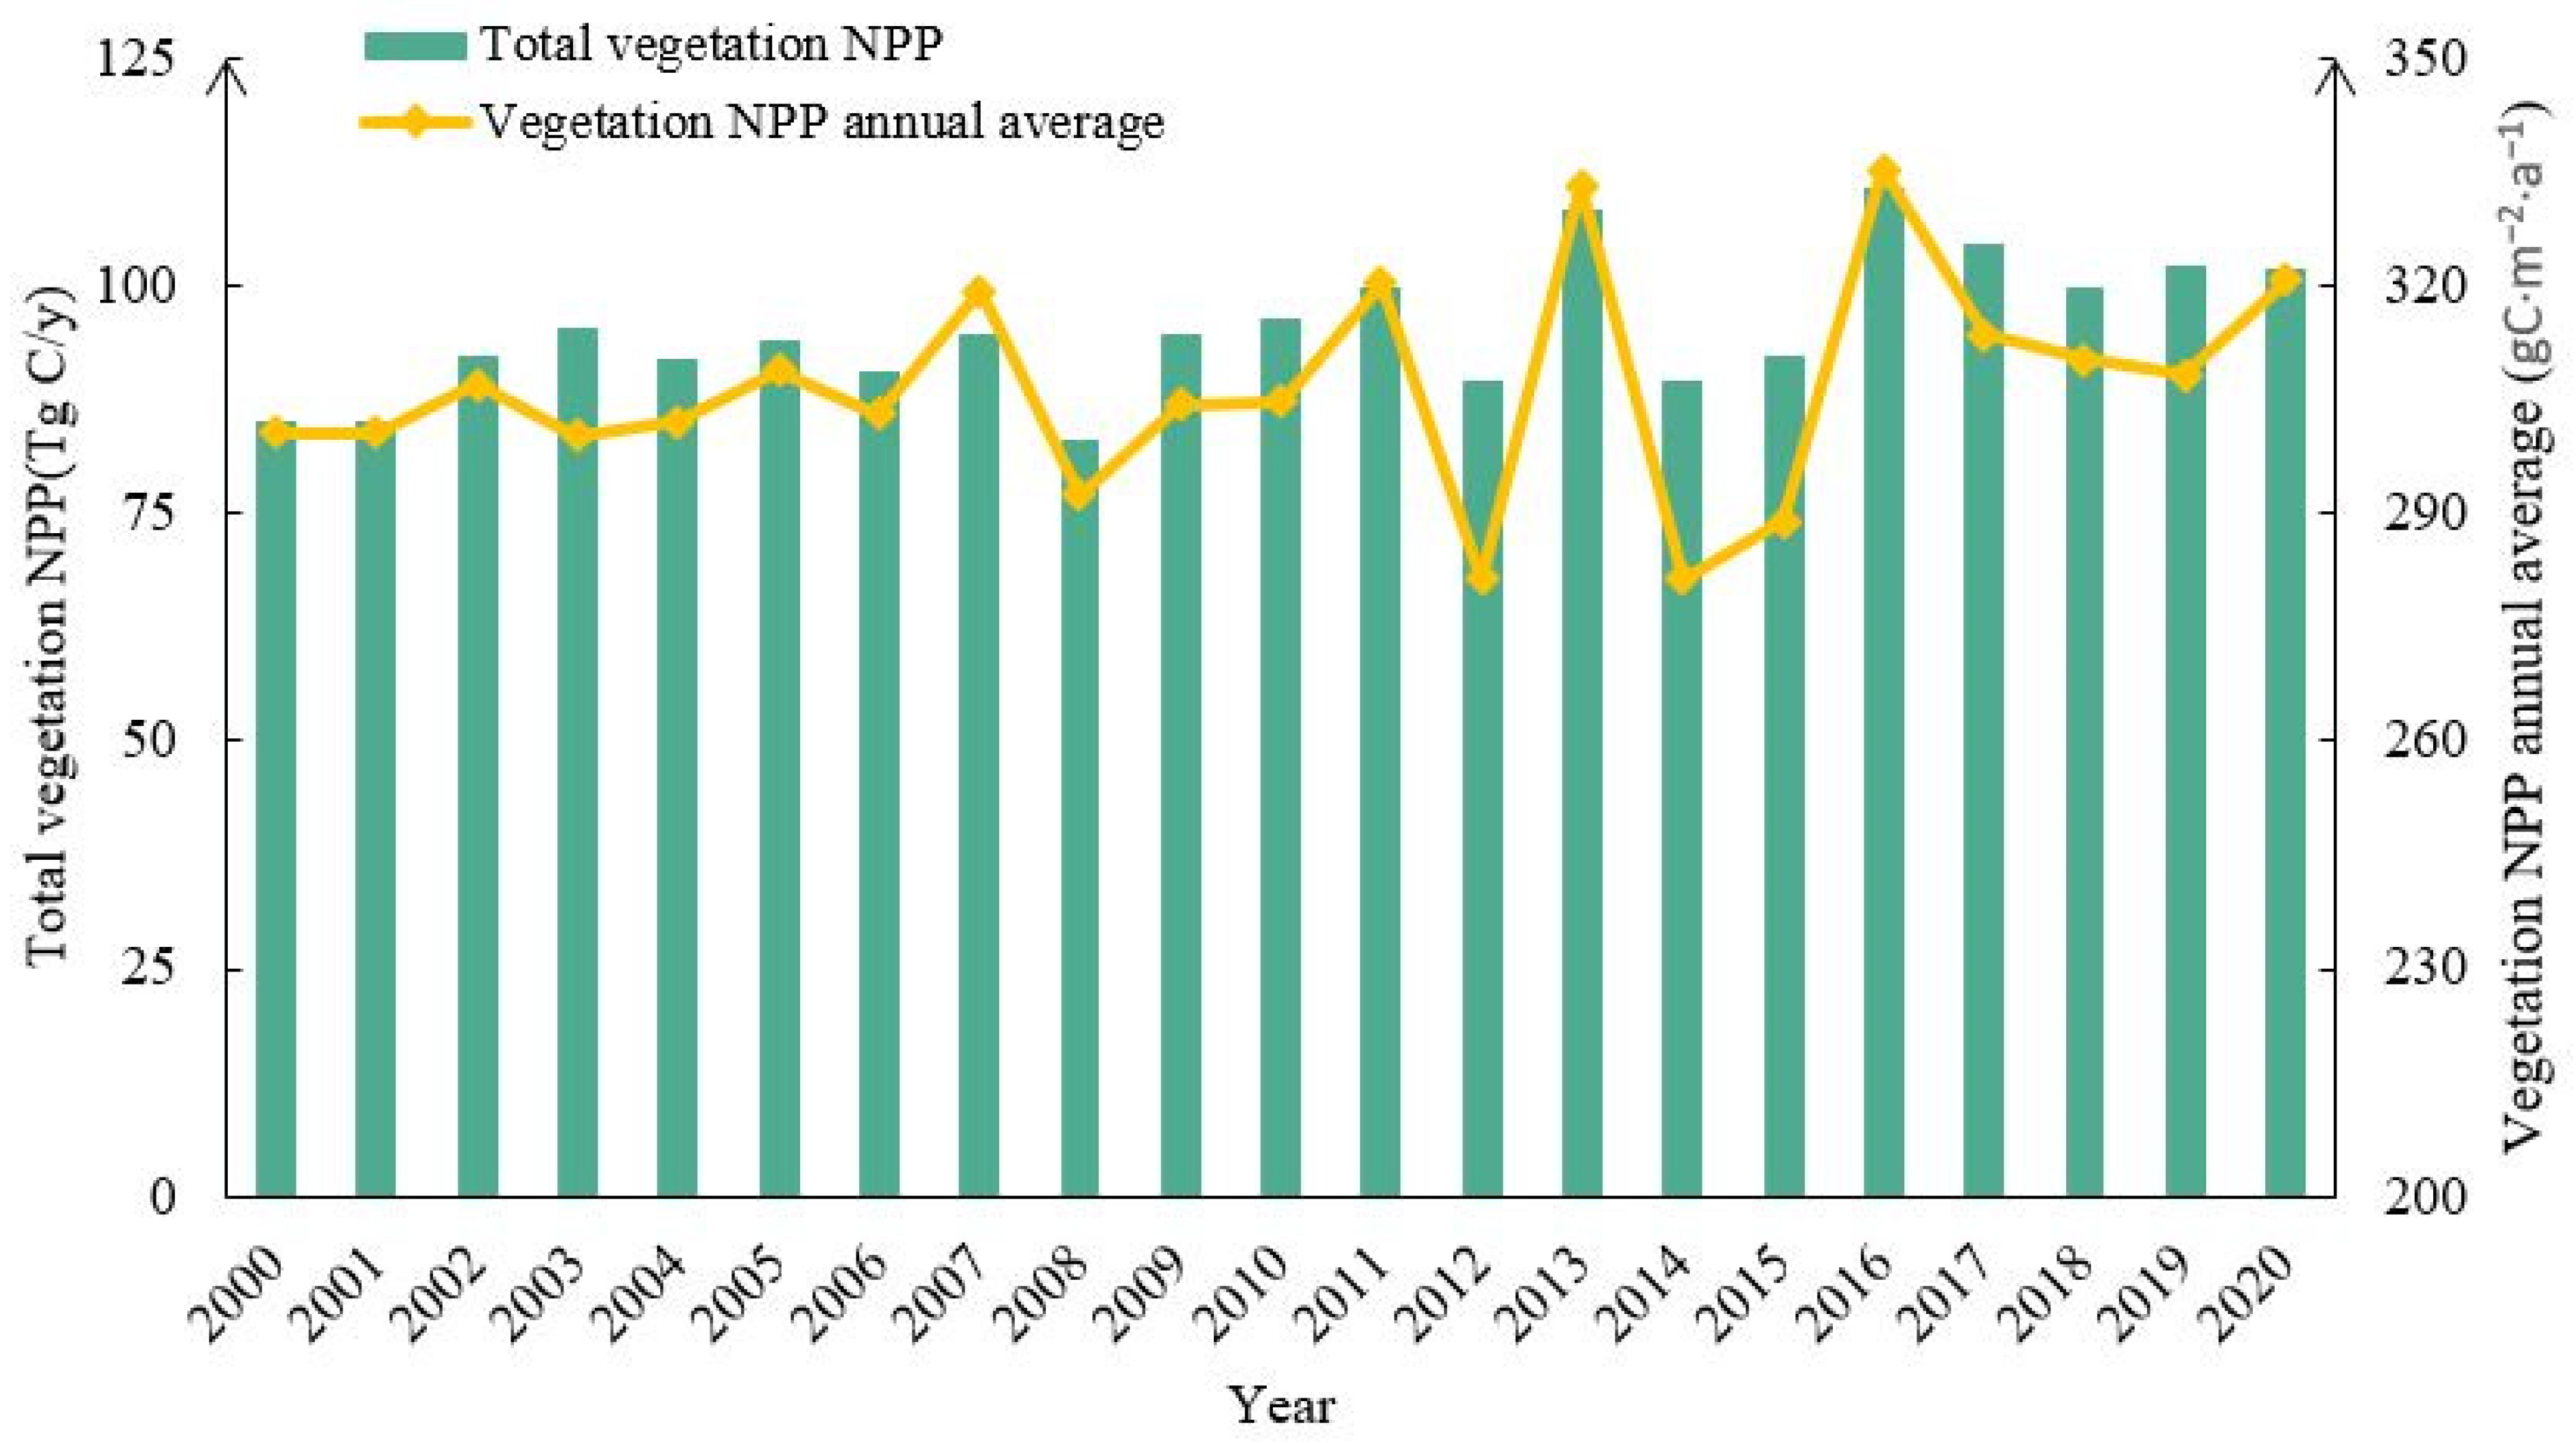
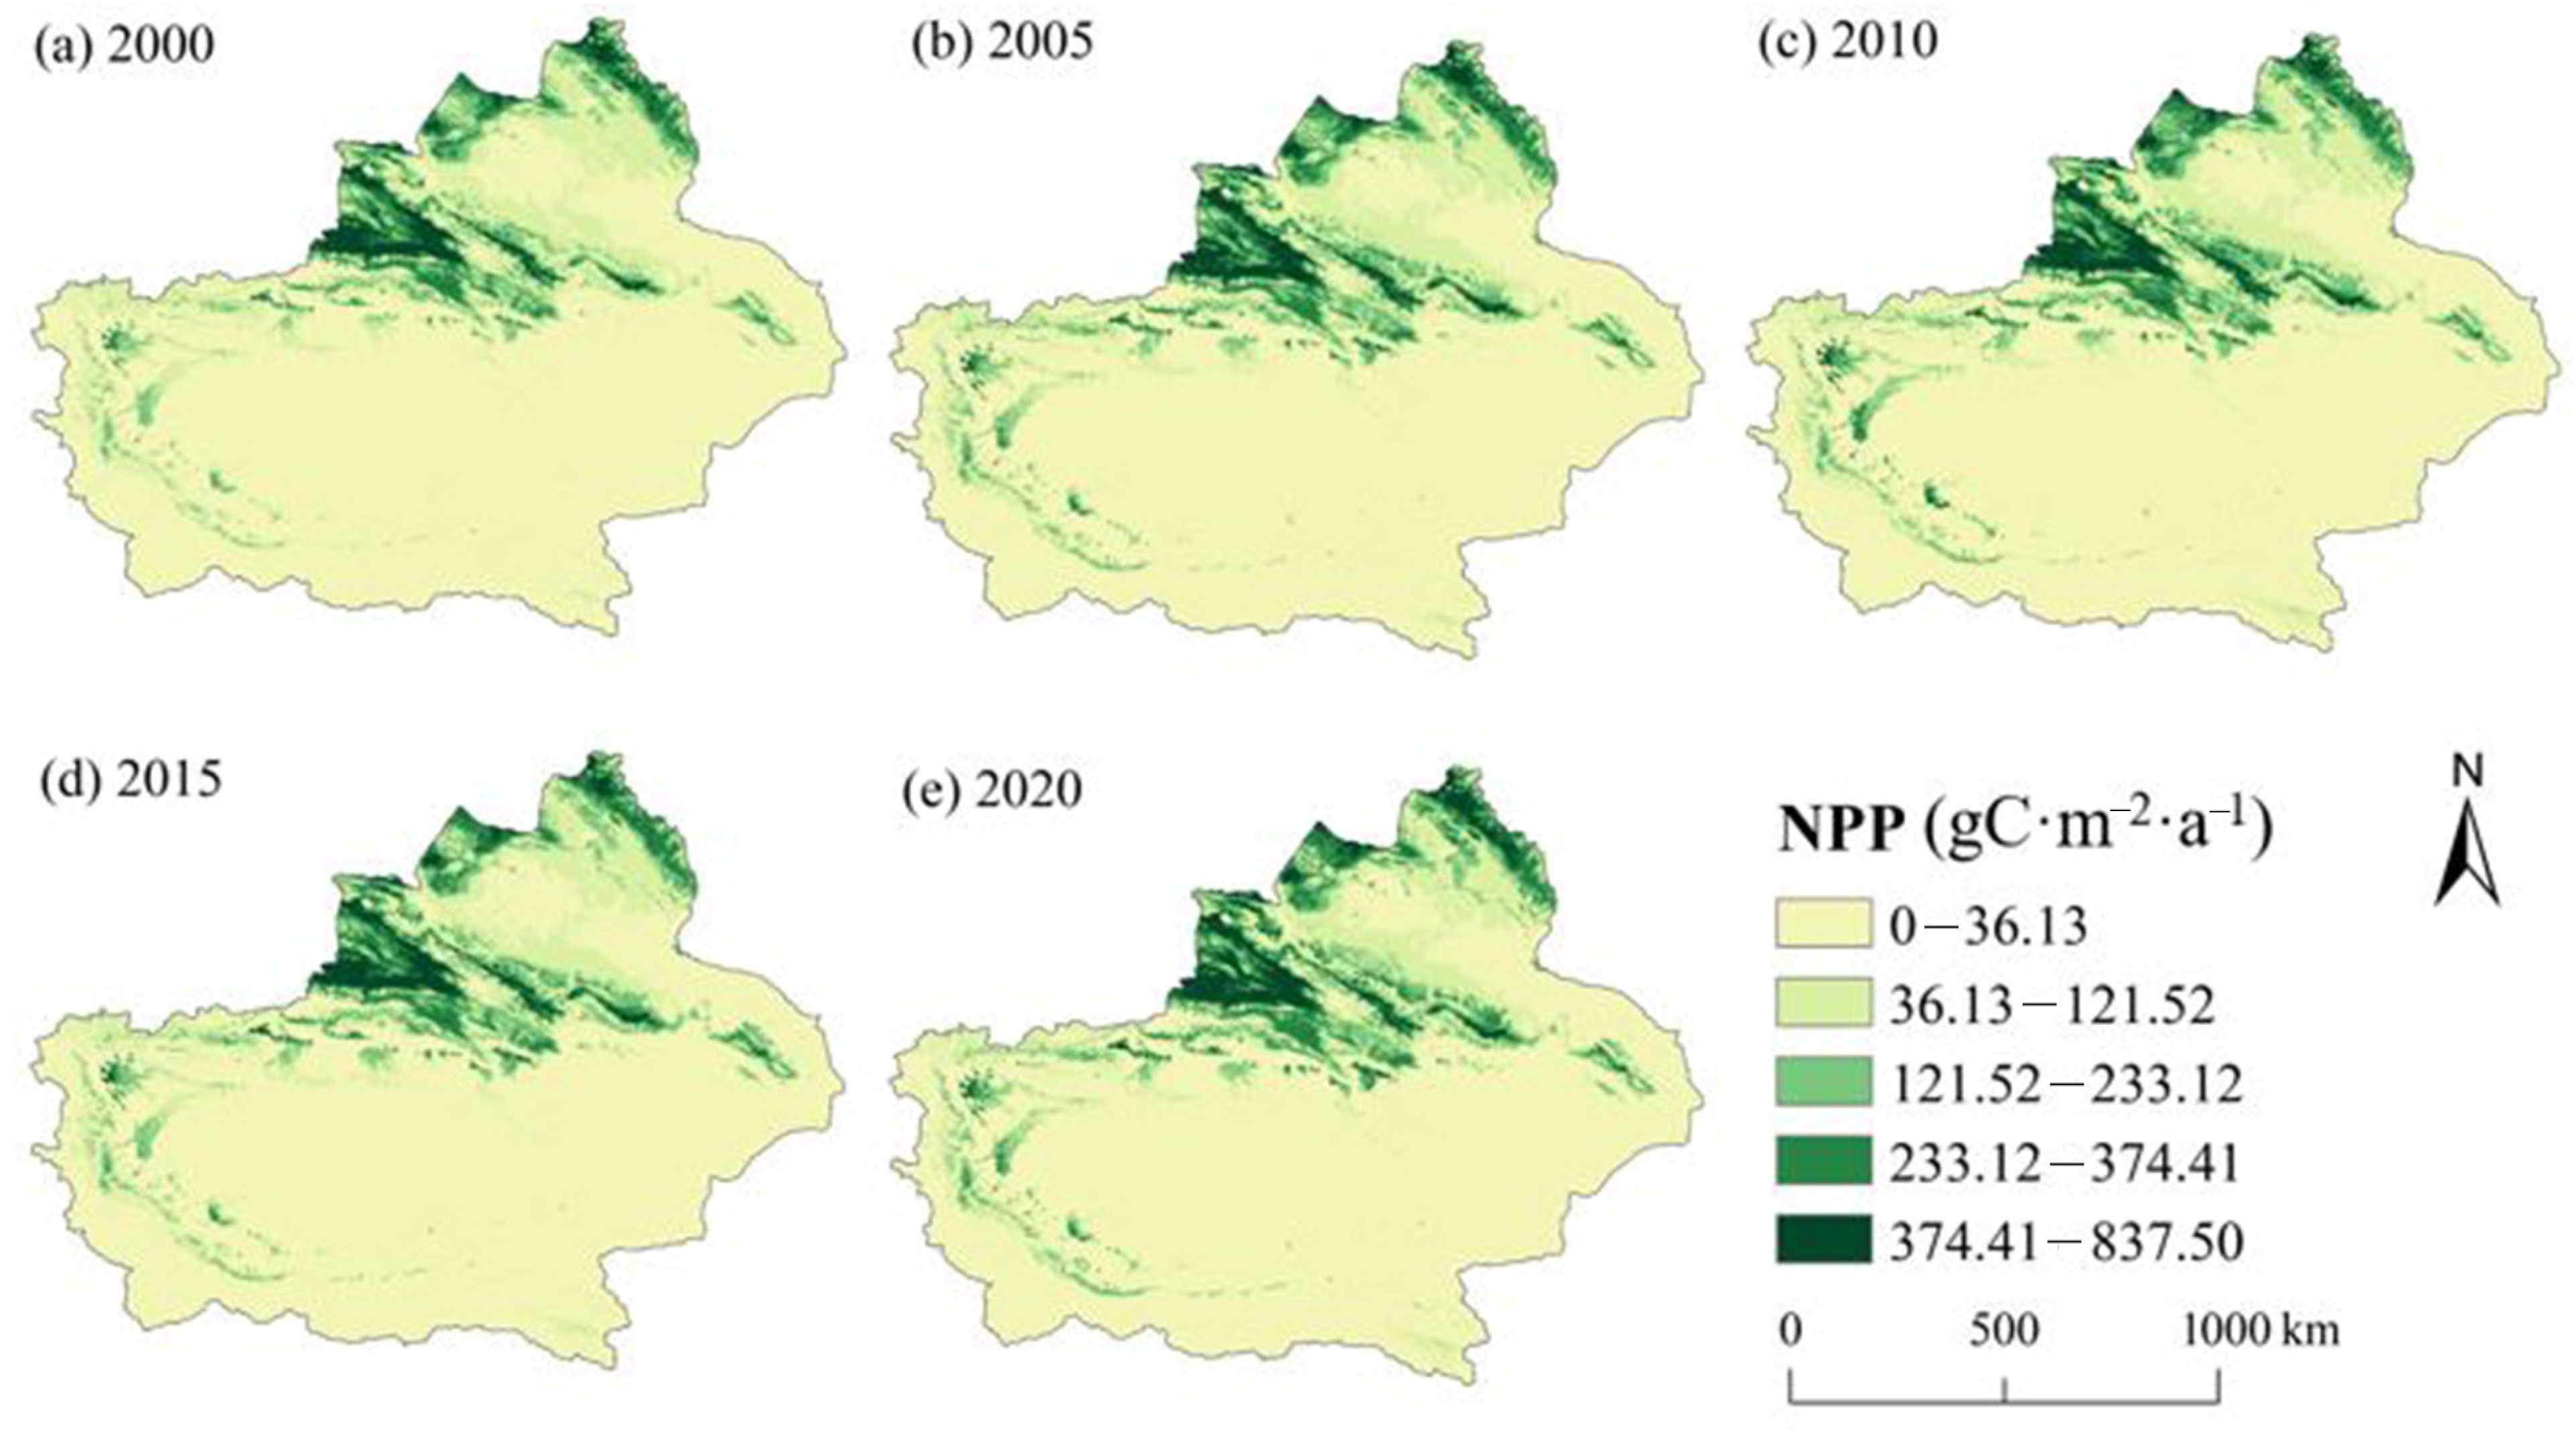
3.3.1. Analysis of Spatial and Temporal Changes in Vegetation NPP

According to the above results, natural vegetation is an important cause of ESV transformation in Xinjiang. Therefore, this study analyzed the correlation between vegetation NPP and its ESV to study the mechanism of ecosystem service value change in the region. The findings indicate that the spatial variation of vegetation NPP was significant and had five distinct phases (2000–2007, 2008, 2008–2016, 2016, 2017–2020) during the study period. Further, its spatial variations were mainly low in the south, high in the north, and higher in the mountains than in the plains. The overall trend showed a fluctuating increase (Figure 7).
Specifically, the total vegetation NPP in the study area increased from 85.35 TgC·a−1 in 2000 to 101.86 TgC·a−1 in 2020, for a growth rate of about 19.34%. The total vegetation NPP increased continuously from 2000 to 2007, with an increase of about 9.32 TgC·a−1. In 2008, there was a large loss of total NPP, dropping to 83.16 TgC·a−1. During 2008–2016, NPP showed a more dramatic oscillatory change, but still had an overall increasing trend. Then, in 2016, total NPP peaked at 110.32 TgC·a−1. From that point onward, total NPP was on a slight decreasing trend.
The annual mean value of vegetation NPP in the basin fluctuated more highly from 2000 to 2020, with a total increase of 20.07 gC·m−2·a−1. The mean annual mean value of vegetation NPP was 306.58 gC·m−2·a−1, with interannual variations fluctuating between 281.50 and 335.34 gC·m−2·a−1. Among them, the annual average value of NPP changes fluctuated relatively smoothly during 2000–2011, but fluctuated more sharply during 2011–2016. Thereafter, the annual average value of NPP showed a small decreasing trend. Overall, the annual average value of NPP of vegetation in Xinjiang showed an increasing trend from 2000 to 2020.
Based on vegetation NPP variations, the natural breakpoint method was used to classify the spatial distribution characteristics of NPP into five classes, including 0 < NPP ≤ 36.13, 36.13 < NPP ≤ 121.52, 121.52 < NPP ≤ 233.12, 233.12 < NPP ≤ 374.41, and 374.41 < NPP ≤ 837.50 (Figure 8). The high NPP area is concentrated in the central and western Tianshan Mountains, the Altai Mountains, and Tacheng Prefecture in northern Xinjiang, and also along some rivers in southern Xinjiang. The low NPP area covers a large portion of central Xinjiang as well as a large portion of the region’s central desert.
Additionally, the zonal distribution of desert vegetation in the arid northwest affects the changes in spatial transfer of ESV resources. The area of 374.41 < NPP ≤ 837.50 showed a significant growth trend during the study period, rising from 41,848.25 km2 to 58,629 km2. This represents an increase of 40.10%. The area demarcated by 233.12 < NPP ≤ 374.41 is widely distributed in the Altai and Tianshan mountains in northern Xinjiang, along with the southern region and around the basin. The prevailing trend in this location is continuous expansion. The area represented by 121.52 < NPP ≤ 233.12 is mainly distributed in the middle altitude area. It has hydrothermal conditions favorable for the growth of vegetation, so the area expanded from 126,906.25 km2 in 2000 to 147,216.75 km2 in 2020, which again shows an increasing trend.
The areas indicated by 36.13 < NPP ≤ 121.52 are mostly located in oases and along rivers, which are affected by the increase in water consumption for irrigation in agriculture, the acceleration of desertification processes, and the growth of natural vegetation on partially abandoned land. Hence, the vegetation NPP is somewhat reduced, decreasing to 245,510.50 km2 in 2020. Finally, the area denoted by 0 < NDVI ≤ 36.13 is primarily located in the southern and central parts of the study area, which is at an oasis–desert intersection. In such locations, the vegetation suffers poor growing conditions. The combined effects of natural environment and human land use have led to a continuous decrease in the area since 2000. Specifically, it dropped from 1,316,850 km2 in 2000 to 1,294,772.25 km2 in 2020, at a rate of 1103.89 km2/a, which is about 22,077.80 km2. Forest and grassland are representative of high ESV in Xinjiang and have high individual value contributions. The distribution of regional natural vegetation resources is correlated with the development of ecological service values.

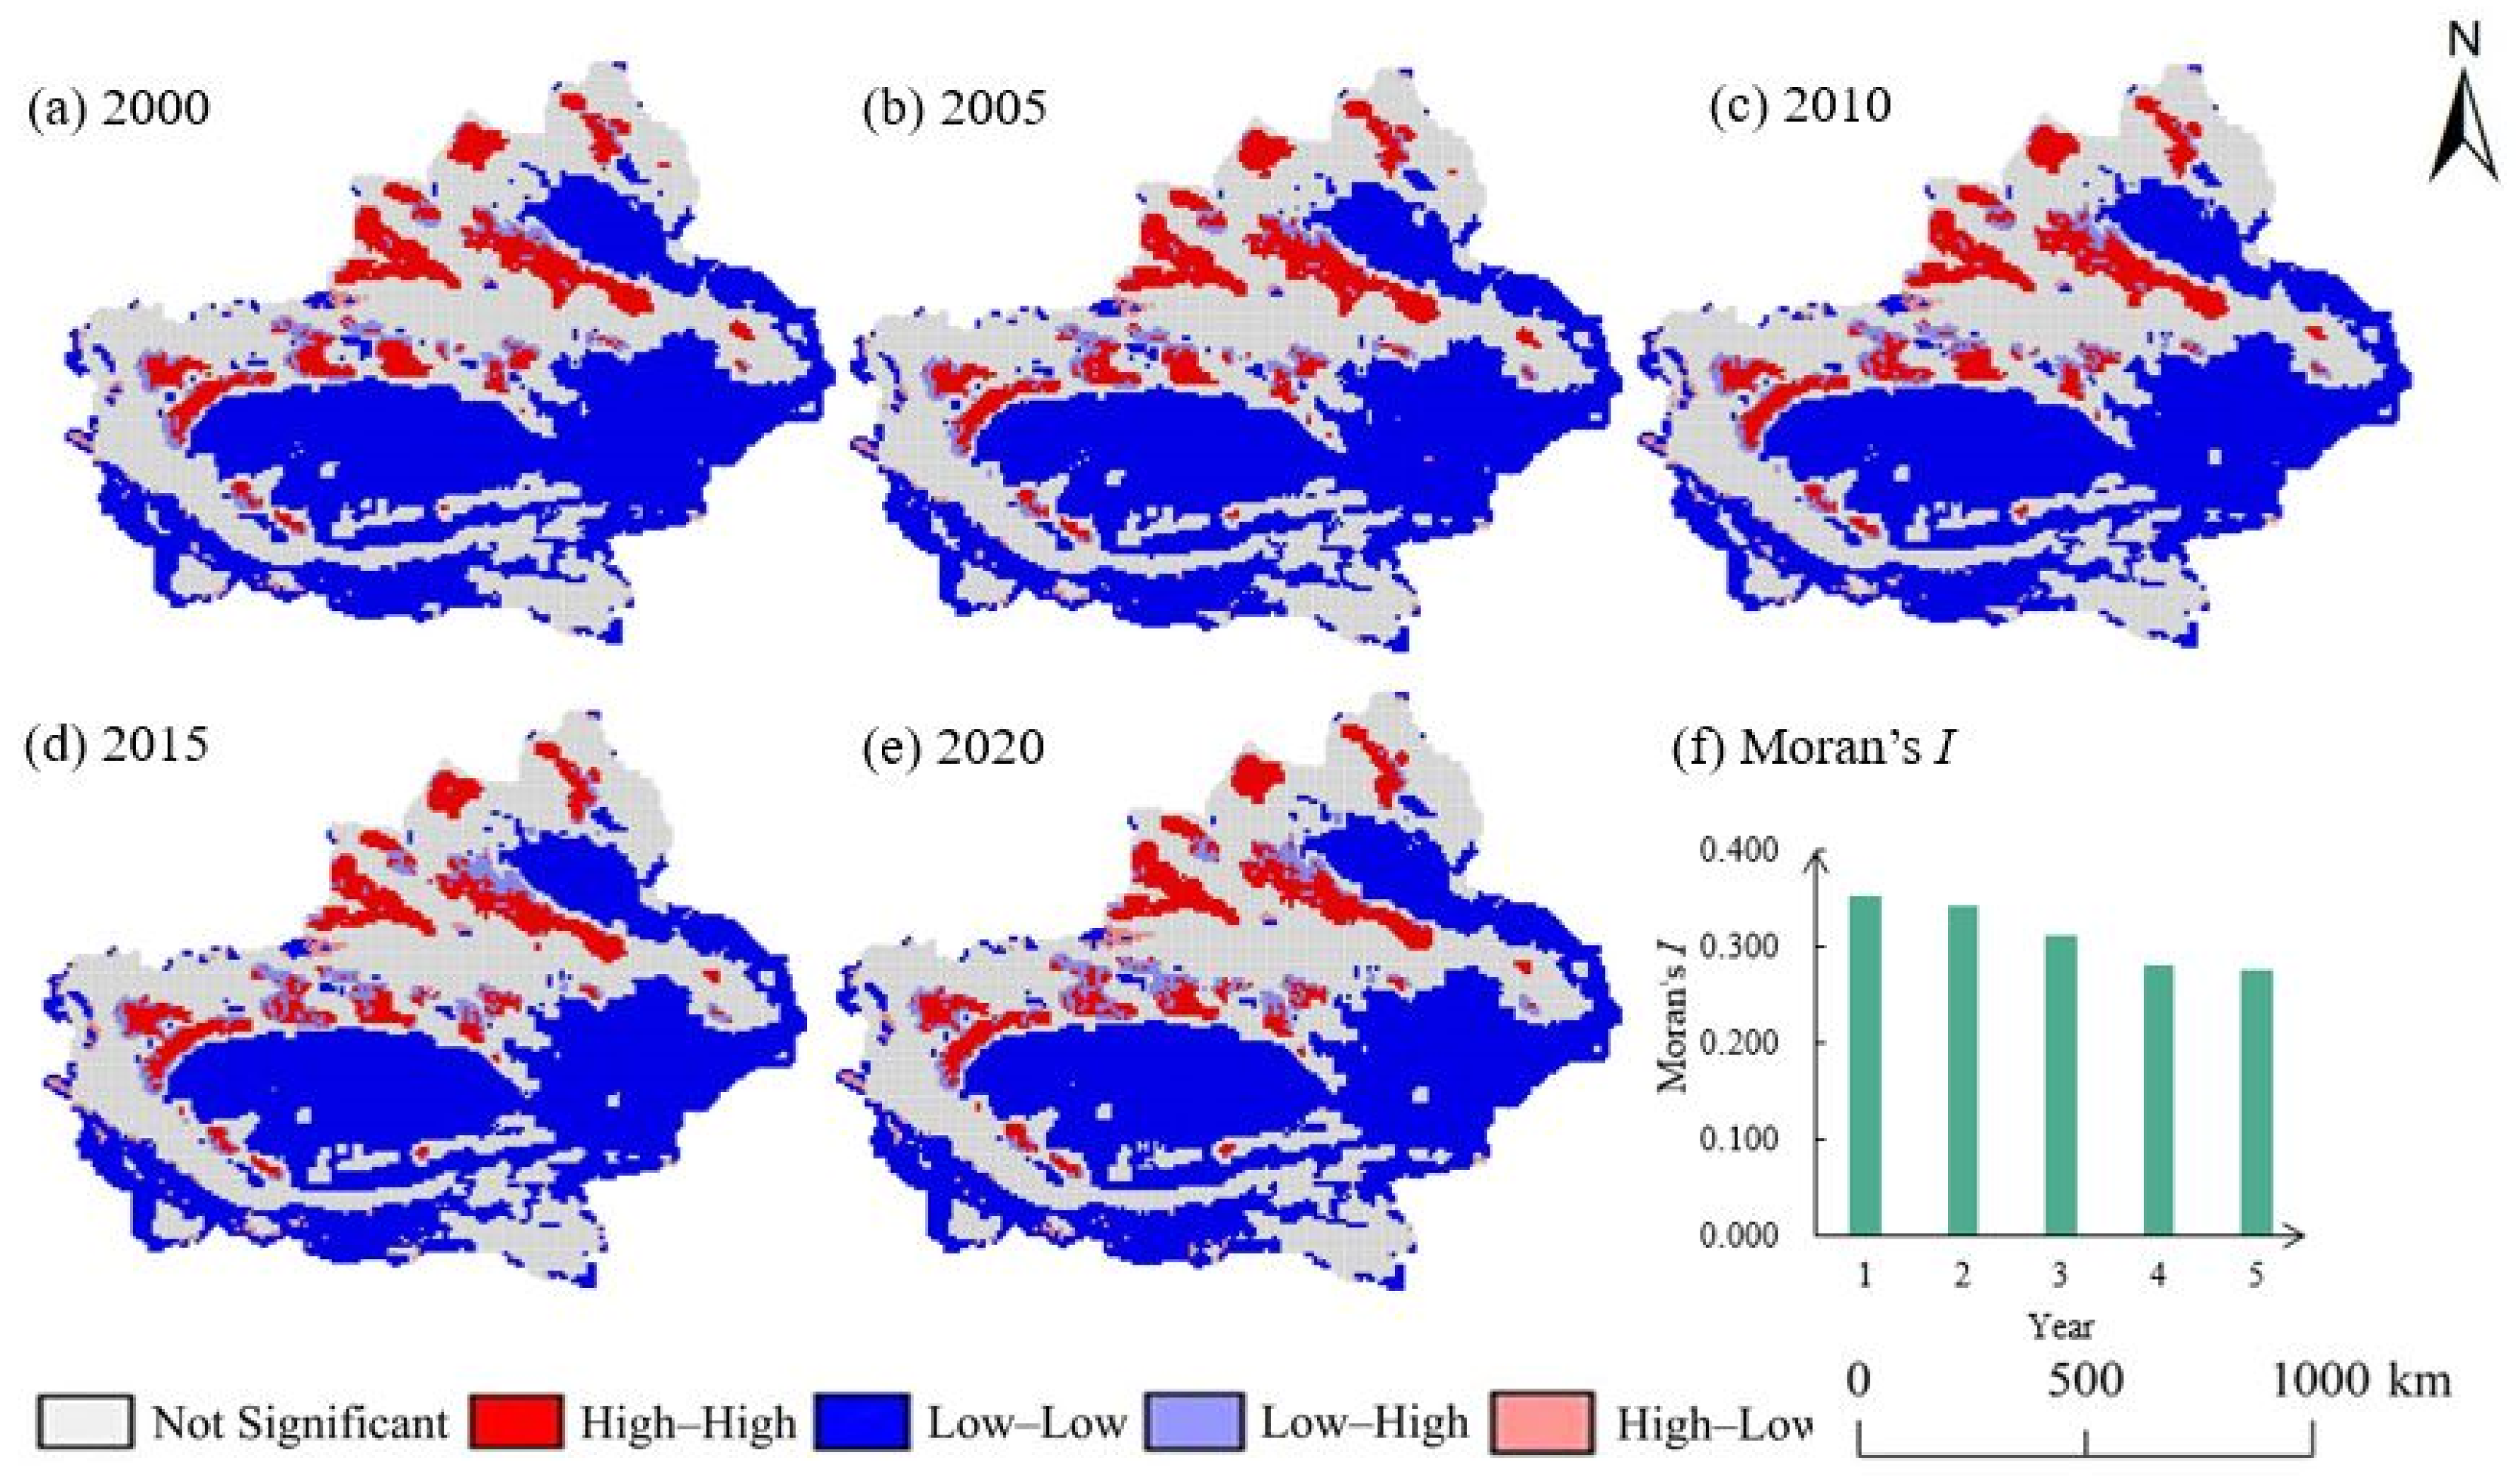
3.3.2. ESV and NPP Correlation Analysis

The bivariate global Moran’s I of ESV ∩ NPP in Xinjiang during 2000–2020 was greater than 0, and overall higher than ESV ∩ HAI, 0.665, 0.664, 0.663, 0.659, and 0.649, respectively, passing the significance test. This shows that there is a significant positive correlation between ESV ∩ NPP in Xinjiang, and that this relationship is higher than the agglomeration between ESV ∩ HAI. Additionally, the Moran’s I also shows a gradual decreasing trend, with the positive correlation between them tending to weaken. The local spatial clustering structure of ESV ∩ HAI was further analyzed using the local Moran’s I, and the LISA clustering map was also obtained (Figure 9).

4. Discussion

4.1. Research Methods

Estimation methods for ESV are mainly based on the functional price per unit of service and the equivalent factor of unit area value. However, because the functional value method has more input parameters, it also has a more cumbersome calculation process, and cannot optimally unify the evaluation methods and parameter criteria for each service value [42]. In contrast, the equivalence factor method is more intuitive, easier to use, and requires fewer data. Additionally, it has a uniform evaluation method and parameter criteria, and is suitable for regional ecosystem service assessment [43]. Nonetheless, despite being the preferred approach for many scholars, the method is influenced by the ESV per unit area, so correcting the equivalence factor for different regions is critical for improving the accuracy of ESV estimation.
Many scholars also use another correction method that assumes “the economic value of an ESV-equivalent factor is equal to 1/7 of the market value of the average grain yield of the year” [44,45]. Therefore, this paper is based on the modified unit area value equivalent factor method. Namely, in order to make a more accurate ESV assessment of the study area, it has been modified according to the average yield and unit price of grain crops per unit area in Xinjiang and the characteristics of the region’s ecosystem.

4.2. Characterization of Temporal and Spatial Variations in ESV

Xinjiang’s ESV showed a more significant increasing trend between 2000 and 2010, when the ESV of cropland, forest, water, snow/ice, and wetland all rose. Additionally, the rapid increase in the population in the study area and the increased demand for food and cash crops led to a 25.65% expansion in the cropland area, thus making cropland ESV increase significantly. Despite this rapid growth, Xinjiang still suffers from inherent ecological imbalances caused by an arid climate, vast deserts, and creeping desertification due to climate warming [46]. In order to improve the region’s ecological security, the government has implemented a series of projects, such as “Returning Cultivated Land to Forest” and “Desertification Control”. These have improved the current situation of forest and grass resources and increased the area of forest, thus boosting the forest ESV [47].
In the context of climate warming, the water circulation process within the study area has been accelerated, resulting in an increase in mountain precipitation snow/ice melt [48]. The year 2010 was an abundant water year in Xinjiang [49], and the combined effect of multiple causes showed an increasing trend in water, wetland, and snow/ice ESV. After 2010, the ESV in the study area decreased, and the loss of grassland and snow/ice was more significant, mainly due to the continuous rise in the population, which rose 40.04% (from 18,494,100 to 25,900,000). To accommodate the rapid influx of people, a large amount of ecological land was converted into agricultural land through the reclamation of grassland into arable land. The increase in demand for livestock products also led to an increase in the number of livestock in Xinjiang, which rose ~6,920,600 head between 2000 and 2020. More livestock led to a reduction in the area of grassland due to overgrazing and other behaviors. This resulted in a decline in ESV. At the same time, the increase in temperature caused an acceleration of the melting of glacial snow accumulation and a subsequent decrease in glacial snow accumulation ESV.
The changes in the total value of ESV in Xinjiang indicate that grassland and barren land have the highest impact, and that their dynamic transformation plays a dominant and positive role in the loss and gain of ESV. Among the individual ecological service values, regulating services and supporting services have a crucial guiding role and are the types of services that should be focused on in the study area. This finding is consistent with the results of Lin et al.’s study [50] on the optimization of land use structure in the Tarim River Basin.
The interannual variation of ESV in different zoning units in Xinjiang is significant, with a decreasing ESV trend in northern Xinjiang and an increasing trend in southern Xinjiang. Further, in northern Xinjiang, the change in grassland area is the main cause of regional ESV loss, and the basic pattern of ESV was high in the north and southwest, and low in the central and southeast. In southern Xinjiang, grassland and barren land are the major causes of ESV loss. Nevertheless, compared with northern Xinjiang, the loss of grassland ESV is relatively small. The basic ESV pattern that prevails in Xinjiang is “high at the edge and low in the center”. This pattern is caused by the positioning of the desert in the central part of southern Xinjiang. Desert land is poor and has sparse vegetation, resulting in a low regional ESV contribution rate. However, at the edge of the desert, there are oases and pre-mountain plains with cropland and good grass cover, giving these areas a higher regional ESV contribution rate.
The Xinjiang region is currently in an era of rapid socio-economic development, with a rapid increase in population, while due to climate change [51], the melting of glaciers and snow in the mountainous areas of the region has led to an increase in surface water runoff and an elevated rate of evaporation in the downstream areas. Increased population activity and climate change have had a large impact on the ecosystems in the study area. Based on this, this study visualizes the distribution and retention of ecological assets in the study area by accounting for the value of ecosystem services, which provides a basis for environmental protection measures [52], for example, by accounting for the current status and changes in the distribution of ecological assets and vegetation in the areas along the banks of rivers in the downstream areas of the watershed, which provides a basis for the analysis of the status quo and orientation for the protection and restoration of ecology along the banks of rivers in the downstream areas in the later stages [53].

4.3. Effects of Human Activities and Vegetation Changes on ESV

Despite the overall increase in ESV benefits in Xinjiang, a large number of ecological problems still exist in the region. The comprehensive impact of multiple factors should be considered to explore the balance point of the loss and gain of regional ESV and implement ecological restoration projects according to regional environmental characteristics, if the goal is to maintain the retention of regional ecological assets and promote green and high-quality development. In particular, vegetation changes and human activities are the dominant factors leading to ESV changes in Xinjiang, and investigating the spatial interconnections between ESV ∩ HAI and NPP ∩ ESV can help to clarify the extent of the effects of vegetation changes and human activity intensity changes on ESV and their spatial correlation.
The spatial correlation between NPP and ESV was found to be higher than that between ESV and HAI. In both correlations, the Moran’s I showed a decreasing trend, indicating that they were weakening. The higher correlation between vegetation NPP and ESV is mostly distributed in the northern border area, mainly because the spatial distribution of natural forest and grass vegetation is more concentrated there. The High–High area type is mostly distributed in mountainous areas and in the intersection of mountainous and plains areas, which indicates a more significant increase in the area of this type of vegetation. This result further supports the assertion that against a background of climate change, the increase in surface water resources leads to an increase in vegetation area, which affects ESV changes.
Meanwhile, the increase in Low–High type areas indicates an increase in cropland areas and a high spatial aggregation of crop NPP. The low-value area is caused by the weak ecosystem service capacity of agricultural land. Furthermore, in the analysis of the spatial correlation between ESV and HAI, a decreasing trend was found in the High–High type area, indicating that human activities interfere with ESV in Xinjiang. Specifically, there is a decrease in ESV in areas with a high intensity of human activities, mainly due to overgrazing, the reclamation of cropland, and other behaviors that convert ecological lands such as grassland, wetland, and water into agricultural land and barren land, resulting in ESV loss. The lower Moran’s I of HAI ∩ ESV is mainly due to the fact that built-up land does not have ecosystem service capacity. Therefore, this study ignores built-up land in ESV accounting, while built-up land in the HAI index has the most obvious intensity of human disturbance and the largest intensity coefficient, thus affecting the primary cause for the spatial autocorrelation between ESV and HAI [54].
In recent years, scholars have proposed that there are certain ecosystem service functions possessed by built-up land [55], but no unified conclusion on these functions has been reached. Moreover, there are significant spatial variabilities in the ecological and natural conditions in Xinjiang, all influenced by the region’s unique topography and complex ecosystem. Thus, the further refinement of the estimation of ESV and the driving mechanism of its change is needed and could provide a future work topic by combining topography and ecosystem function zoning.

5. Conclusions

This study explored the spatial correlation between ESV ∩ HAI and ESV ∩ NPP based on land-use data in Xinjiang and spatial autocorrelation analysis methods. The following conclusions have been drawn:
(1)
The ESV in Xinjiang showed an increasing trend from 2000 to 2010, and a downward trend from 2010 to 2020. However, the overall increase from 2000 to 2020 was about CNY 18.20 billion, including a decrease of CNY 16.89 billion in the ESV in northern Xinjiang and an increase of about CNY 35.09 billion in the ESV in southern Xinjiang. The spatial distribution characteristics of the ESV in Xinjiang are mainly low in the central areas and high around the peripheral oases, with ESV Class 2, Class 4, and Class 1 regions being the most active.
(2)
The results of the ESV gain/loss transfer matrix show that the main loss of ESV in Xinjiang during 2000–2020 was primarily due to the flow of ecological land types to barren land and the conversion of other land types to cropland, totaling CNY 196.63 billion and CNY 100.08 billion, respectively. The increase in ESV was mostly due to the conversion of each land type to grassland, water, and forestland, resulting in a total ESV increase of CNY 409.55 billion.
(3)
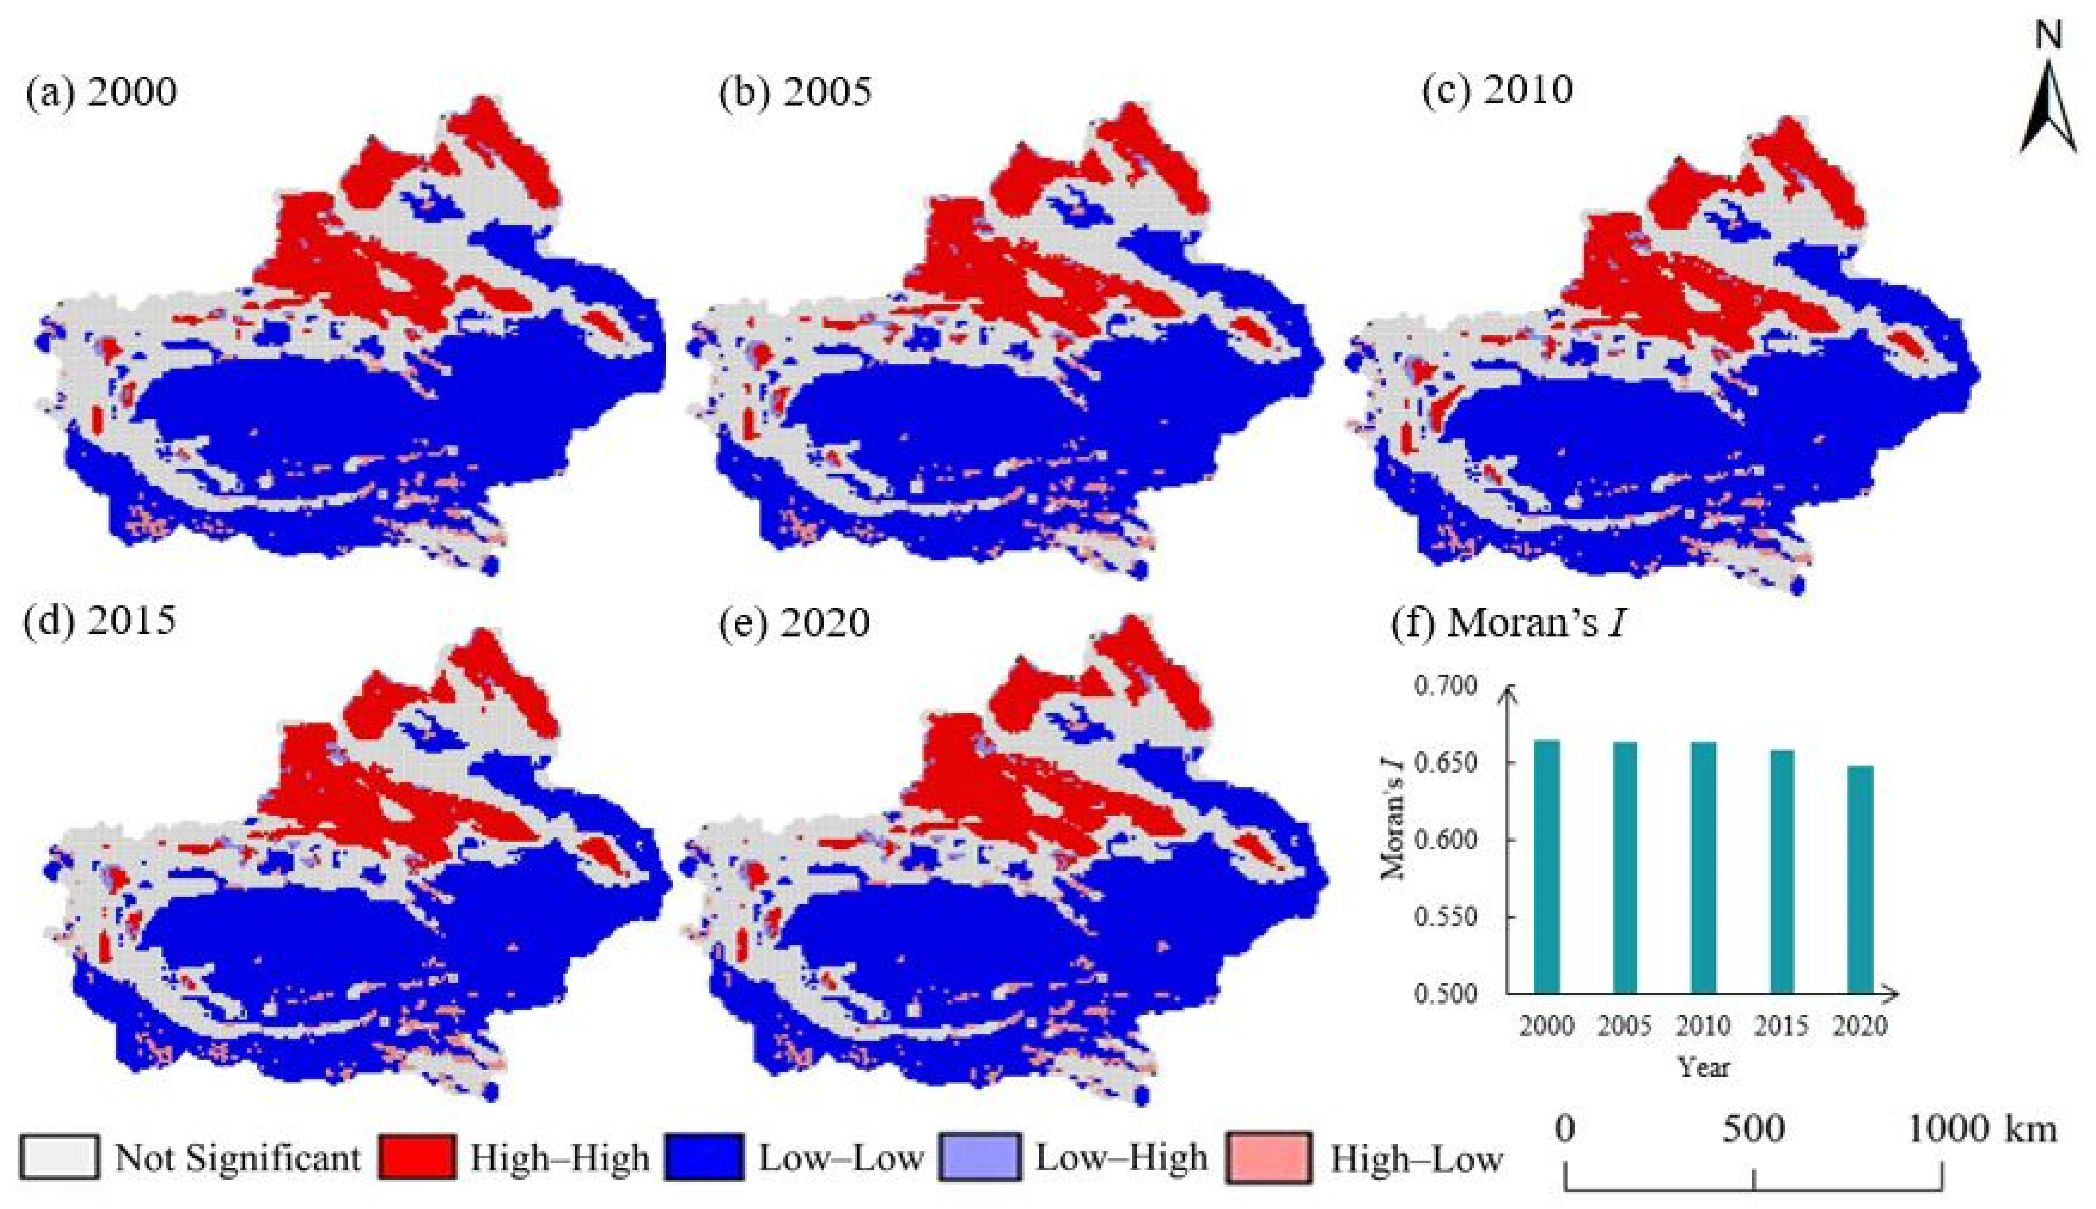
Additionally, this study found an overall increasing trend in the HAI index. Moreover, the area covered by intense human activities displayed an expansion trend, whereby a large amount of ecological land transformed into agricultural land and built-up land, thus decreasing the ESV in Xinjiang. The increase in vegetation NPP also increased the ESV. Finally, the spatial clustering between ESV ∩ HAI and ESV ∩ NPP was found to be higher than that of ESV ∩ HAI, indicating that vegetation change is an important reason for the dominant spatial correlation of ESV. Therefore, in the future, Xinjiang should pay more attention to the protection of vegetation between deserts and oases, as well as adjusting the structure of water resource utilization, rationally allocating water resources, and integrating and efficiently utilizing land resources in order to promote the overall benign development of the basin ecological environment.

Author Contributions

S.Z. conceived the initial design and wrote the first draft of the paper. W.X. and Z.S. completed the data calculations for the paper. Z.Z. and Y.H. provided constructive comments, and Y.W. provided financial support. All authors have read and agreed to the published version of the manuscript.

Funding

This research was funded by the National Natural Science Foundation of China, grant number: 31960360.

Data Availability Statement

The data presented in this study are available on request from the corresponding author.

Conflicts of Interest

The authors declare no conflict of interest.

References

  1. Wu, C.Y.; Chen, B.W.; Huang, X.J.; Wei, Y.H.D. Effect of land-use change and optimization on the ecosystem service values of Jiangsu Province, China. Ecol. Indic. 2020, 117, 106507. [Google Scholar] [CrossRef]
  2. Costanza, R.; D’Arge, R.; Groot, R.D.; Farber, S.; Grasso, M.; Hannon, B.; Limburg, K.; Naeem, S.; O’Neill, R.V.; Paruelo, J. The value of the world’s ecosystem services and natural capital. Nature 1997, 387, 253–260. [Google Scholar] [CrossRef]
  3. Costanza, R.; de Groot, R.; Sutton, P.; van der Ploeg, S.; Anderson, S.J.; Kubiszewski, L.; Farber, S.; Turner, R.K. Changes in the global value of ecosystem services. Glob. Environ. Chang. 2014, 26, 152–158. [Google Scholar] [CrossRef]
  4. Zhou, Z.X.; Robinson, G.M.; Song, B.J. Experimental research on trade-offs in ecosystem services: The agro-ecosystem functional spectrum. Ecol. Indic. 2019, 106, 105536. [Google Scholar] [CrossRef]
  5. Shrestha, B.; Ye, Q.H.; Khadka, N. Assessment of Ecosystem Services Value Based on Land Use and Land Cover Changes in the Transboundary Karnali River Basin, Central Himalayas. Sustainability 2019, 11, 3183. [Google Scholar] [CrossRef]
  6. Gashaw, T.; Tulu, T.; Argaw, M.; Worqlul, A.W.; Tolessa, T.; Kindu, M. Estimating the impacts of land use/land cover changes on Ecosystem Service Values: The case of the Andassa watershed in the Upper Blue Nile basin of Ethiopia. Ecosyst. Serv. 2018, 31, 219–228. [Google Scholar] [CrossRef]
  7. Mukherjee, S.; Sikdar, P.K.; Pal, S.; Schutt, B. Assessment of Environmental Water Security of an Asian Deltaic Megacity and Its Peri-Urban Wetland Areas. Sustainability 2021, 13, 2772. [Google Scholar]
  8. Xie, G.D.; Zhang, C.X.; Zhang, L.M.; Chen, W.H.; Li, S.M. Improvement of the Evaluation Method for Ecosystem Service Value Based on Per Unit Area. J. Nat. Resour. 2015, 30, 1243–1254. [Google Scholar]
  9. Li, T.; Zhou, Z. Positive and negative ecosystem services evaluation and its spatial pattern analysis on urban landscape: A case study of Xi’an City. Acta Geogr. Sin. 2016, 71, 1215–1230. [Google Scholar]
  10. Yu, L.; Zhang, X.; Li, Y.; Zhao, X.; Ma, S.; Cao, H.; Cao, J. Coastal ecosystem services and their spatial-temporal variation in Haikou, China. Acta Ecol. Sin. 2016, 36, 2431–2441. [Google Scholar]
  11. Li, Z.; Xu, Y.; Sun, Y.; Wu, M.; Zhao, B. Urbanization-Driven Changes in Land-Climate Dynamics: A Case Study of Haihe River Basin, China. Remote Sens. 2020, 12, 2701. [Google Scholar] [CrossRef]
  12. Yang, S.; Zhao, W.; Liu, Y.; Wang, S.; Wang, J.; Zhai, R. Influence of land use change on the ecosystem service trade-offs in the ecological restoration area: Dynamics and scenarios in the Yanhe watershed, China. Sci. Total Environ. 2018, 644, 556–566. [Google Scholar] [CrossRef] [PubMed]
  13. Geng, T.; Chen, H.; Zhang, X. Spatiotemporal evolution of land ecosystem service value and its influencing factors in Shaanxi province based on GWR. J. Nat. Resour. 2020, 35, 1714–1727. [Google Scholar]
  14. Peng, J.; Tian, L.; Zhang, Z.; Zhao, Y.; Green, S.; Quine, T.; Liu, H.; Meersmans, J. Distinguishing the impacts of land use and climate change on ecosystem services in a karst landscape in China. Ecosyst. Serv. 2020, 46, 101199. [Google Scholar] [CrossRef]
  15. He, Z.Q.; Shang, X.; Zhang, T.H.; Yun, J.Y. Coupled regulatory mechanisms and synergy/trade-off strategies of human activity and climate change on ecosystem service value in the loess hilly fragile region of northern Shaanxi, China. Ecol. Indic. 2022, 143, 109325. [Google Scholar] [CrossRef]
  16. Lang, M.; Kõlli, R.; Nikopensius, M.; Nilson, T. Assessment of MODIS NPP algorithm-based estimates using soil fertility and forest inventory data in mixed hemiboreal forest. For. Stud. 2017, 66, 49–64. [Google Scholar] [CrossRef]
  17. Zhu, W.Q.; Pan, Y.Z.; Zhang, J.S. Estimation of net primary productivity of chinese terrestrial vegetation based on remote sensing. Chin. J. Plant Ecol. 2007, 31, 413–424. [Google Scholar]
  18. Defries, R.S.; Field, C.B.; Fung, I.; Collatz, G.J.; Bounoua, L. Combining satellite data and biogeochemical models to estimate global effects of human-induced land cover change on carbon emissions and primary productivity. Glob. Biogeochem. Cycles 1999, 13, 803–815. [Google Scholar] [CrossRef]
  19. Xu, X.B.; Tan, Y.; Yang, G.S.; Li, H.P.; Su, W.Z. Impacts of China’s Three Gorges Dam Project on net primary productivity in the reservoir area. Sci. Total Environ. 2011, 409, 4656–4662. [Google Scholar] [CrossRef]
  20. Imhoff, M.L.; Tucker, C.J.; Lawrence, W.T.; Stutzer, D.C. The use of multisource satellite and geospatial data to study the effect of urbanization on primary productivity in the United States. IEEE Trans. Geosci. Remote Sens. 2000, 38, 2549–2556. [Google Scholar]
  21. Chen, Y.; Li, W.; Chen, Y.; Zhu, C. Science in supporting the ecological restoration and sustainable development of the Tarim River Basin. Arid. Land Geogr. 2018, 41, 901–907. [Google Scholar]
  22. Liu, W.; Jiang, F.Q.; Li, X.L. Spatiotemporal evolution of adaptive capacity to climate change in Xinjiang. Arid Zone Res. 2017, 34, 531–540. [Google Scholar]
  23. Hou, Y.; Chen, Y.; Ding, J.; Li, Z.; Li, Y.; Sun, F. Ecological impacts of land use change in the arid Tarim River Basin of China. Remote Sens. 2022, 14, 1894. [Google Scholar] [CrossRef]
  24. Wei, H.J.; Liu, H.M.; Xu, Z.H.; Ren, J.H.; Lu, N.C.; Fan, W.G.; Zhang, P.; Dong, X.B. Linking ecosystem services supply, social demand and human well-being in a typical mountain-oasis-dessert area, Xinjiang, China. Ecosyst. Serv. 2018, 31, 44–57. [Google Scholar] [CrossRef]
  25. Song, F.; Su, F.L.; Mi, C.X.; Sun, D. Analysis of driving forces on wetland ecosystem services value change: A case in Northeast China. Sci. Total Environ. 2020, 751, 141778. [Google Scholar] [CrossRef] [PubMed]
  26. Yang, P.; Xia, J.; Zhang, Y.; Zhan, C.; Sun, S. How is the risk of hydrological drought in the Tarim River Basin, Northwest China? Sci. Total Environ. 2019, 693, 133555. [Google Scholar] [CrossRef]
  27. Sun, F.; Wang, Y.; Chen, Y.; Li, Y.; Zhang, Q.; Qin, J.; Kayumba, P.M. Historic and simulated desert-oasis ecotone changes in the arid Tarim River Basin, China. Remote Sens. 2021, 13, 647. [Google Scholar] [CrossRef]
  28. Chen, Y.; Chen, Y.; Zhu, C.; Li, W. The concept and mode of ecosystem sustainable management in arid desert areas in northwest China. Acta Ecol. Sin. 2019, 39, 7410–7417. [Google Scholar]
  29. Li, Z.; Li, Y.P.; Li, H.W.; Liu, Y.C.; Wang, C. Analysis of drought change and its impact in Central Asia. Adv. Earth Sci. 2022, 37, 37–50. [Google Scholar]
  30. Kang, T.T.; Li, Z.; Gao, Y.C. Effectiveness of ecological restoration in the mountain-oasis-desert system of northwestern arid area of China. Acta Ecol. Sin. 2019, 39, 7418–7431. [Google Scholar]
  31. Guo, Z.C.; Wei, W.; Shi, P.J.; Zhou, L.; Wang, X.F.; Li, Z.Y.; Pang, S.F.; Jie, B.B. Spatiotemporal changes of land desertification sensitivity in the arid region of Northwest China. Acta Geogr. Sin. 2020, 75, 1948–1965. [Google Scholar]
  32. Qian, W.; Zhai, P.M.; Qin, D.H. New perspectives on ‘warming–wetting’ trend in Xinjiang, China. Adv. Clim. Chang. Res. 2020, 11, 252–260. [Google Scholar]
  33. Yang, J.; Huang, X. The 30 m annual land cover dataset and its dynamics in China from 1990 to 2019. Earth Syst. Sci. Data 2021, 13, 3907–3925. [Google Scholar] [CrossRef]
  34. Running, S.; Zhao, M. Mod17a3hgf Modis/Terra Net Primary Production Gap-Filled Yearly L4 Global 500m Sin Grid v006; Nasa Eosdis Land Processes DAAC: Sioux Falls, SD, USA, 2019; Volume 6.
  35. Deng, C.X.; Zhong, X.L.; Xie, B.G.; Wan, Y.L.; Song, X.W. Spatial and temporal changes of land ecosystem service value in Dongting Lake area in 1995–2015. Geogr. Res. 2019, 38, 844–855. [Google Scholar]
  36. Fu, J.; Zhang, Q.; Wang, P.; Zhang, L.; Tian, Y.; Li, X. Spatio-Temporal Changes in Ecosystem Service Value and Its Coordinated Development with Economy: A Case Study in Hainan Province, China. Remote Sens. 2022, 14, 970. [Google Scholar] [CrossRef]
  37. Qiao, B.; Zhu, C.X.; Cao, X.Y.; Xiao, J.S.; Zhaxi, L.D.; Yan, Y.Q.; Chen, G.Q.; Shi, F.F. Spatial autocorrelation analysis of land use and ecosystem service value in Maduo County, Qinghai Province, China at the grid scale. Chin. J. Appl. Ecol. 2020, 31, 1660–1672. [Google Scholar]
  38. Zhang, X.; Chen, D.C.; Fan, J.D.; Yu, C.; Zhou, Y.; Tang, J.J. Study on the change of ecosystem service value and its correlation with human activities: Taking Changzhou City as an example. J. Environ. Eng. Technol. 2022, 12, 2124–2131. [Google Scholar]
  39. Huang, M.; Fang, B.; Yue, W.; Feng, S. Spatial differentiation of ecosystem service values and its geographical detection in Chaohu Basin during 1995–2017. Geogr. Res. 2019, 38, 2790–2803. [Google Scholar]
  40. Zhang, C.; Bai, Z.; Li, X.; Ran, Q.; Wei, Z.; Lei, T.; Wang, N. Spatio-temporal evolution and attribution analysis of human effects of vegetation cover on the Loess Plateau from 2001 to 2018. Arid Land Geogr. 2021, 44, 188–196. [Google Scholar]
  41. Xin, D.; Wang, L.C.; Huang, C.B.; Fang, L.L.; Wang, S.Q.; Wang, L.Z. Spatio-temporal variations of ecosystem services in the urban agglomerations in the middle reaches of the Yangtze River, China. Ecol. Indic. 2020, 115, 106394. [Google Scholar]
  42. Xie, G.D.; Zhang, C.X.; Zhang, C.S.; Xiao, Y.; Lu, Y.X. The value of ecosystem services in China. Resour. Sci. 2015, 37, 1740–1746. [Google Scholar]
  43. Lu, X.; Ming, S.H.; Yi, W. Integrating ecosystem services value and uncertainty into regional ecological risk assessment: A case study of Hubei Province, Central China. Sci. Total Environ. 2020, 740, 104126. [Google Scholar]
  44. Qin, Y.L.; Shi, P.; He, W.H.; Huo, C.P.; Li, Z.B.; Yang, S.T.; Feng, Z.H. Influence of urbanization on landscape pattern and ecosystem service value in Xi’an City. Acta Ecol. Sin. 2020, 40, 8239–8250. [Google Scholar]
  45. Pan, N.; Guan, Q.; Wang, Q.; Sun, Y.; Li, H.; Ma, Y. Spatial Differentiation and Driving Mechanisms in Ecosystem Service Value of Arid Region: A case study in the middle and lower reaches of Shule River Basin, NW China. J. Clean. Prod. 2021, 319, 128718. [Google Scholar] [CrossRef]
  46. Zhang, X.; Shen, J.; Sun, F.; Wang, S. Spatial-Temporal Evolution and Influencing Factors Analysis of Ecosystem Services Value: A Case Study in Sunan Canal Basin of Jiangsu Province, Eastern China. Remote Sens. 2023, 15, 112. [Google Scholar] [CrossRef]
  47. Li, Z.; Zhang, F.; Hsiang-te, K.; Zhang, Y.; Jing, Y.Q. Spatial and temporal ecosystem changes in the Ebinur Wetland Nature Reserve from 1998 to 2014. Acta Ecol. Sin. 2017, 37, 4984–4997. [Google Scholar]
  48. Chen, Y.N.; Zhang, X.Q.; Fang, G.H.; Wang, F.; Qin, J.X.; Sun, F. Potential risks and challenges of climate change in the arid region of northwestern China. Reg. Sustain. 2020, 1, 20–30. [Google Scholar] [CrossRef]
  49. Sannigrahi, S.; Chakraborti, S.; Joshi, K.P.; Saskia, K.; Somnath, S.; Saikat, K.P.; Urs, K.; Paul, C. Ecosystem service value assessment of a natural reserve region for strengthening protection and conservation. J. Environ. Manag. 2019, 244, 208–277. [Google Scholar] [CrossRef]
  50. Sarker, S. Fundamentals of Climatology for Engineers: Lecture Note. Eng 2022, 3, 573–595. [Google Scholar] [CrossRef]
  51. Sarker, S.; Sarker, T.; Leta, O.T.; Raihan, S.U.; Khan, I.; Ahmed, N. Understanding the Planform Complexity and Morphodynamic Properties of Brahmaputra River in Bangladesh: Protection and Exploitation of Riparian Areas. Water 2023, 15, 1384. [Google Scholar] [CrossRef]
  52. Wang, G.; Wang, Y.; Gui, D. A review on water resources research in Tarim River Basin. Arid Land Geogr. 2018, 41, 1151–1159. [Google Scholar]
  53. Lin, J.; Zhao, C.Y.; Ma, X.F.; Shi, F.Z.; Wu, S.X.; Zhu, J. Optimization of land use structure based on ecosystem service value in the mainstream of Tarim river. Arid Zone Res. 2021, 38, 1140–1151. [Google Scholar]
  54. He, S.S.; Ye, L.P.; Zhu, W.B.; Cui, Y.P.; Zhu, L.Q. Soil erosion and water supply change in Qihe watershed of Taihang Mountains from 2000 to 2015. Geogr. Res. 2018, 37, 1775–1787. [Google Scholar]
  55. Xue, M.G.; Xing, L.; Wang, X.L. Spatial Correction and Evaluation of Ecosystem Services in China. China Land Sci. 2018, 32, 81–88. [Google Scholar]
Figure 1. Sketch map of Xinjiang. (a) Geographical overview of Xinjiang; (b) LUCC in Xinjiang; (c) average annual temperature and average annual precipitation in Xinjiang.
Remotesensing 15 04861 g001
Figure 2. Value of ecosystem services in Xinjiang (RS: regulatory services, SS: support services, PS: provisioning services, CS: cultural services).
Remotesensing 15 04861 g002
Figure 3. Spatial distribution characteristics of ESV in Xinjiang: (ae) show the spatial distribution characteristics of ESV classes in the study area for each 5-year period from 2000 to 2020; (f) shows the change characteristics of ESV in the study area from 2000 to 2020.
Remotesensing 15 04861 g003
Figure 4. Land-use transfer matrix (CR/CR1: cropland, FO/FO1: forestland; GR/GR1: grassland, WA/WA1: water, SN/SN1: snow/ice, BA/BA1: barren land, WE/WE1: wetland).
Remotesensing 15 04861 g004
Figure 5. Spatial distribution of HAI index in Xinjiang.
Remotesensing 15 04861 g005
Figure 6. ESV ∩ HAI two-factor spatial clusters.
Remotesensing 15 04861 g006
Figure 7. Changes in NPP in Xinjiang from 2000 to 2020. gC·m−2·a−1.
Remotesensing 15 04861 g007
Figure 8. Current spatial distribution of NPP in Xinjiang from 1990 to 2020.
Remotesensing 15 04861 g008
Figure 9. ESV ∩ NPP two-factor spatial clusters.
Remotesensing 15 04861 g009
Table 1. Data sources.
DataAccuracyData Sources
Land use data30 mAnnual China Land Cover Dataset data set
Temperature and precipitation data500 mNational Climatic Data Center
DEM data30 mSRTM DEM dataset (http://www.gscloud.cn (12 May 2023))
Vegetation Net Primary Productivity data500 mMODIS/Terra satellite land observation products (http://landweb.nascom.nasa.gov/ (24 July 2023))
Table 2. ESV coefficient for the lower reaches of Xinjiang (CNY·hm−2).
ESV
Primary TypeSecondary TypeCroplandForestGrasslandWaterSnow/IceBarrenWetland
Support service
Provision of service
Food production3393.571550.911074.891228.440.0015.36783.13
Material production752.423562.481581.62353.180.0046.07767.78
Water supply−4007.791842.66875.2612,729.713316.7930.713977.07
Regulation serviceGas conditioning2733.2811,716.255558.691182.37276.40199.622917.55
Climate regulation1428.0635,056.6114,695.213516.41829.20153.565527.98
Purify environment414.6010,272.834852.348522.30245.69629.585527.98
Hydrological adjusting4591.2922,941.1210,764.21156,994.6310,948.47368.5337,206.38
Support serviceSoil conservation1596.9714,265.266771.781428.060.00230.333547.12
Maintain nutrient circulation476.021090.24522.09107.490.0015.36276.40
Biodiversity522.0912,990.756157.563915.6515.36214.9812,084.78
Cultural serviceAesthetic landscape230.335696.892717.922902.19138.2092.137263.15
Total12,130.85120,985.9855,571.55192,880.4415,770.101996.2279,879.31
Table 3. ESV profit and loss matrix for Xinjiang over the period 2000–2020.
2020
CroplandForestGrasslandWaterSnow/IceBarrenWetland
2
0
0
0
Cropland8.46308.8637.970.00−1.650.32
Forest−30.84−1.190.560.000.00−0.01
Grassland−1021.61247.09927.73−14.30−1830.464.82
Water−38.78−2.39−66.52−3.11−71.62−0.05
Snow/ice0.001.346.7636.62−62.550.00
Barren91.990.942093.08496.7774.490.03
Wetland−1.520.08−0.860.150.00−0.02
Disclaimer/Publisher’s Note: The statements, opinions and data contained in all publications are solely those of the individual author(s) and contributor(s) and not of MDPI and/or the editor(s). MDPI and/or the editor(s) disclaim responsibility for any injury to people or property resulting from any ideas, methods, instructions or products referred to in the content.

