1. Introduction
Lake Sarez, named after the village of Sarez in the eastern Pamir region of Tajikistan, originated as a result of a significant earthquake that struck on 18 February 1911, causing the collapse of mountainous terrain. Notably, the Usoi landslide dam stands as the world’s highest dam, whether of natural or man-made origin [
1]. The entirety of Tajikistan falls within a seismically active zone, with seismic specialists forecasting a potential substantial earthquake recurrence in the vicinity of the lake approximately 80 to 130 years after the preceding seismic event. This denotes that the region presently faces an elevated seismic hazard [
2,
3,
4,
5]. Should a significant seismic event occur in the region, there exists a potential hazard of the Usoi dam’s structural integrity being compromised, leading to the release of lake water and resulting in the flooding of certain border regions within Tajikistan [
6], with potential consequences extending to Afghanistan and Uzbekistan. The potential impact could be extensive, affecting millions of individuals and inducing severe ecological harm across Central Asia. The resultant outcomes may encompass substantial loss of life property and immeasurable environmental damage [
2,
7].
The Usoi dam at Lake Sarez faces instability due to seismic activity, glacier melting, and climate change, leading to a significant risk of dam failure. Extensive research and analysis by scholars, both domestically and internationally, have been focused on the assessment and comprehensive management of dam risks since the dam’s formation [
4,
8]. Hanisch conducted a comprehensive examination of crack records derived from slope monitoring data spanning the period from 1985 to 1990. The findings reveal that the Lake Sarez landslide region has exhibited annual movement rates reaching a magnitude of 100 mm [
9]. Grebby confirmed the presence of ground motion in the coastal landslide area of Lake Sarez, including the right bank landslide area, via the use of Interferometric Synthetic Aperture Radar (InSAR) technology [
10]. With the development of differential interferometric synthetic aperture radar (DInSAR) technology, radar line-of-sight deformation can be obtained up to the millimeter level [
11,
12,
13,
14,
15,
16]. The research above predominantly employs extended-term techniques, such as InSAR or hydrological records, to acquire data on deformations. This preference stems from the dam’s distant and elevated positioning, coupled with the inhospitable surroundings, posing difficulties in the application of cutting-edge, high-accuracy, real-time monitoring techniques for tracking dam and coastal deformations. Consequently, these methods prove inadequate in enhancing monitoring frequency and attaining up-to-the-minute, precise dynamic deformation data, crucial for timely risk evaluation and scientific preemptive alerts regarding the dam’s stability.
In recent years, satellite navigation positioning technology has experienced rapid development [
17]. Global Navigation Satellite System (GNSS) offers advantages such as continuous, all-weather, and all-time observations, ease of automated implementation, non-line-of-sight communication between users, and high precision. Consequently, GNSS has been widely applied in the field of deformation monitoring by Precise Point Positioning (PPP), Real-Time Kinematic (RTK) et al. [
18,
19,
20]. On 31 July 2020, the Beidou global navigation satellite system (BDS) was officially launched, providing continuous and stable navigation positioning and timing services worldwide [
21]. Research indicates that BDS is comparable to GPS in terms of positioning accuracy and availability [
21,
22,
23]. The Chinese Academy of Sciences and the Academy of Sciences of Tajikistan collaboratively established a professional team to acquire comprehensive and timely deformation data concerning the Lake Sarez dam and the surrounding mountainous terrain [
24]. By adeptly integrating equipment development suited for gathering data in challenging environmental conditions, network communication, real-time high-precision positioning utilizing BDS, they successfully devised and implemented a unique BDS-based deformation monitoring system for the Usoi dam. This significant accomplishment facilitates the high-precision monitoring of dam deformations, constituting a valuable contribution to international disaster reduction cooperation [
25].
This study mainly focuses on the precise positioning and computational analysis of BDS/GPS observational data obtained from one base site and seven monitoring sites situated around the dam. The outcome of this analysis pertains to the assessment of deformation, yielding significant findings that underpin a scientifically grounded evaluation of the risk associated with the dam’s deformation status.
2. Study Area and Monitoring System
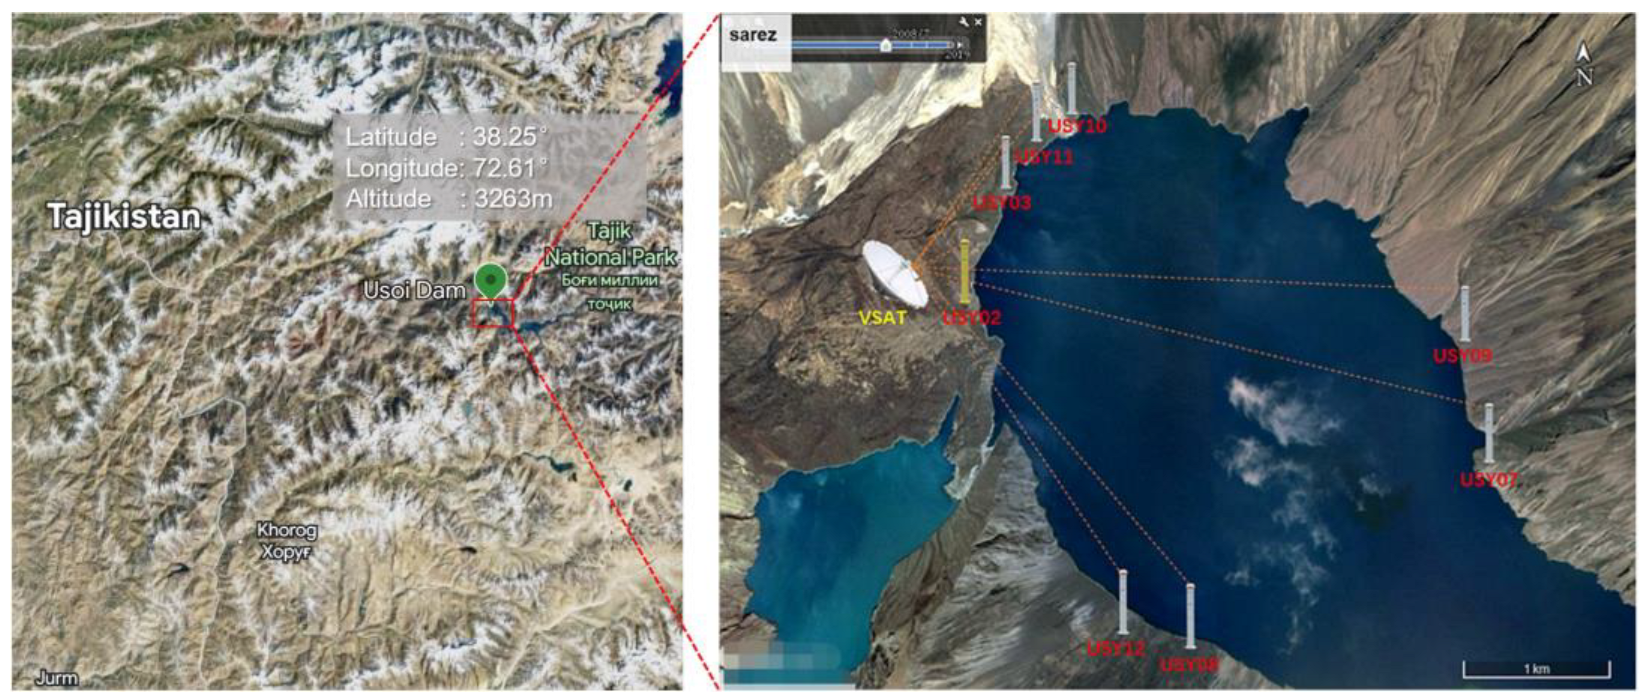
Lake Sarez rests at an altitude of 3263 m. This natural lake stretches for approximately 60 km (37 miles), boasting a maximum depth of around 550 m (1800 feet) and a total volume of roughly 17 cubic kilometers (4 cubic miles). The lake’s surface currently rests just above an altitude of 3200 m (10,500 feet), encircled by towering mountain peaks that reach elevations exceeding 6000 m (19,700 feet).
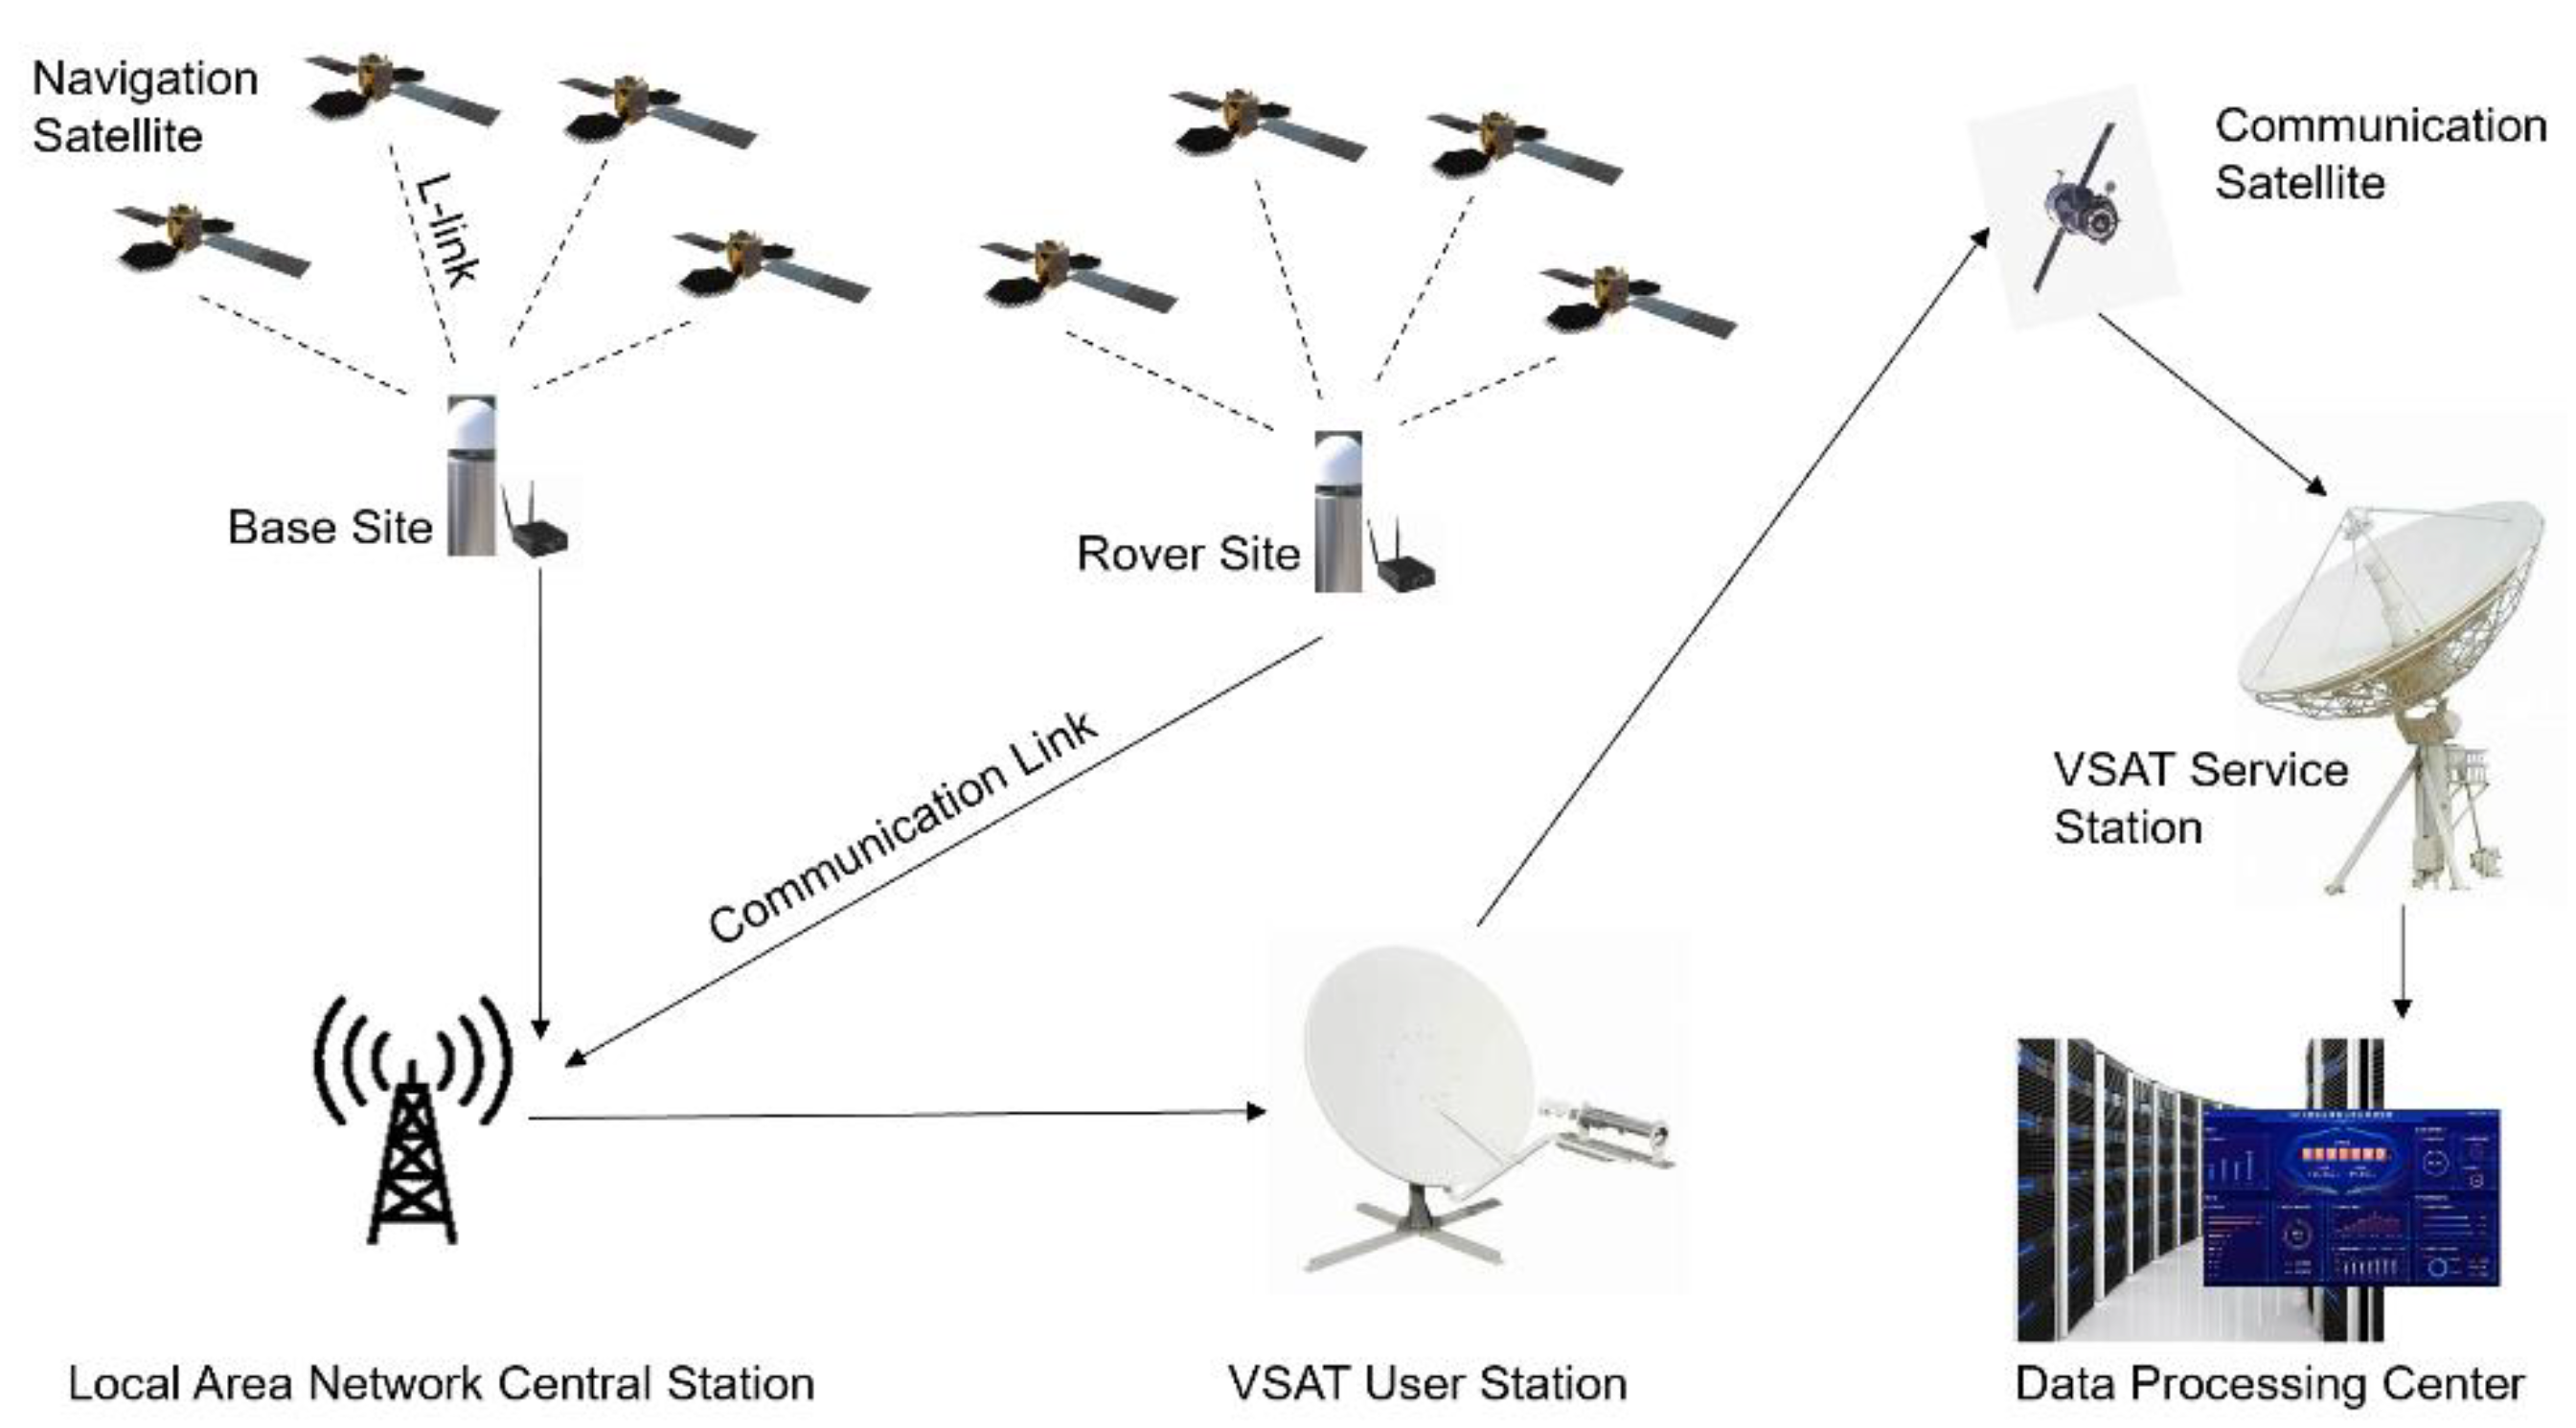
In order to conduct 24-h, all-weather deformation monitoring of the natural dam, a specialized deformation monitoring system has been collaboratively designed and developed, addressing the unique challenges posed by the absence of basic infrastructure such as electricity, network connectivity, roads, and personnel. This system is composed of four essential components, as depicted in
Figure 1: ① The sites situated at the dam serve the purpose of tracking satellite signals and collecting observational data. ② A local communication network is employed to transmit the raw data from the sites to the central station located at the dam. ③ A satellite-based wide-area communication platform that aggregates data collected from various sites, facilitating transmission to the global internet using communication satellites. ④ Data integration and processing center, entrusted with the responsibility of processing and conducting a comprehensive analysis of the collected data.
After conducting a thorough geological survey and scientific assessment to address the challenging monitoring requirements of the dam, a joint working group has formulated a two-phase plan for constructing sites. The first phase, completed on 8 October 2021, involved establishing a demonstration system comprising two sites: USY02, situated in an area with stable soil and rock foundation, serving as the base site and conveniently located near the maintenance campsite, and USY03, designated as a deformation monitoring site, positioned on the western bank of the lake within the central dam region, rendering it susceptible to deformation due to lake water pressure. The subsequent phase, which concluded on 17 September 2022, involved system enhancement by adding a total of six sites: USY07, USY08, USY09, USY10, USY11, and USY12. The base site remained based on USY02. The spatial distribution of these sites is visually represented in
Figure 2. Notably, USY10 and USY11 are situated on the sliding mass near the dam’s water outlet, while USY07 and USY09 are positioned on the opposite sliding mass across the dam, and USY08 and USY12 are located on the sliding mass to the right of the dam. All of these points hold the potential for significant displacement.
The baseline length and height difference of the sites are shown in
Table 1, and the distance between the seven sites and the base site is within 5 km, which meets the requirements of RTK calculation on the one hand and the scope of communication equipment on the dam area on the other hand.
4. Results and Discussion
This research employs real-time data streams and archives observational files acquired from sites positioned on the dam. The data comprises dual-system observational data (BDS: B1I, B2I, B3I; GPS: L1, L2, L5) as well as broadcast ephemeris. The precise products used for baseline network solutions and PPP data processing were sourced from the IGS (
http://cddis.gsfc.nasa.gov/pub/gps/products/mgex (accessed on 26 April 2023)). Baseline network solution and PPP processing modes follow a daily single-day solution approach, yielding one monitoring outcome per day. Additionally, for the comparison, the RTK approach also used the average value of the one day’s results as the daily solution.
4.1. Result of Baseline Network
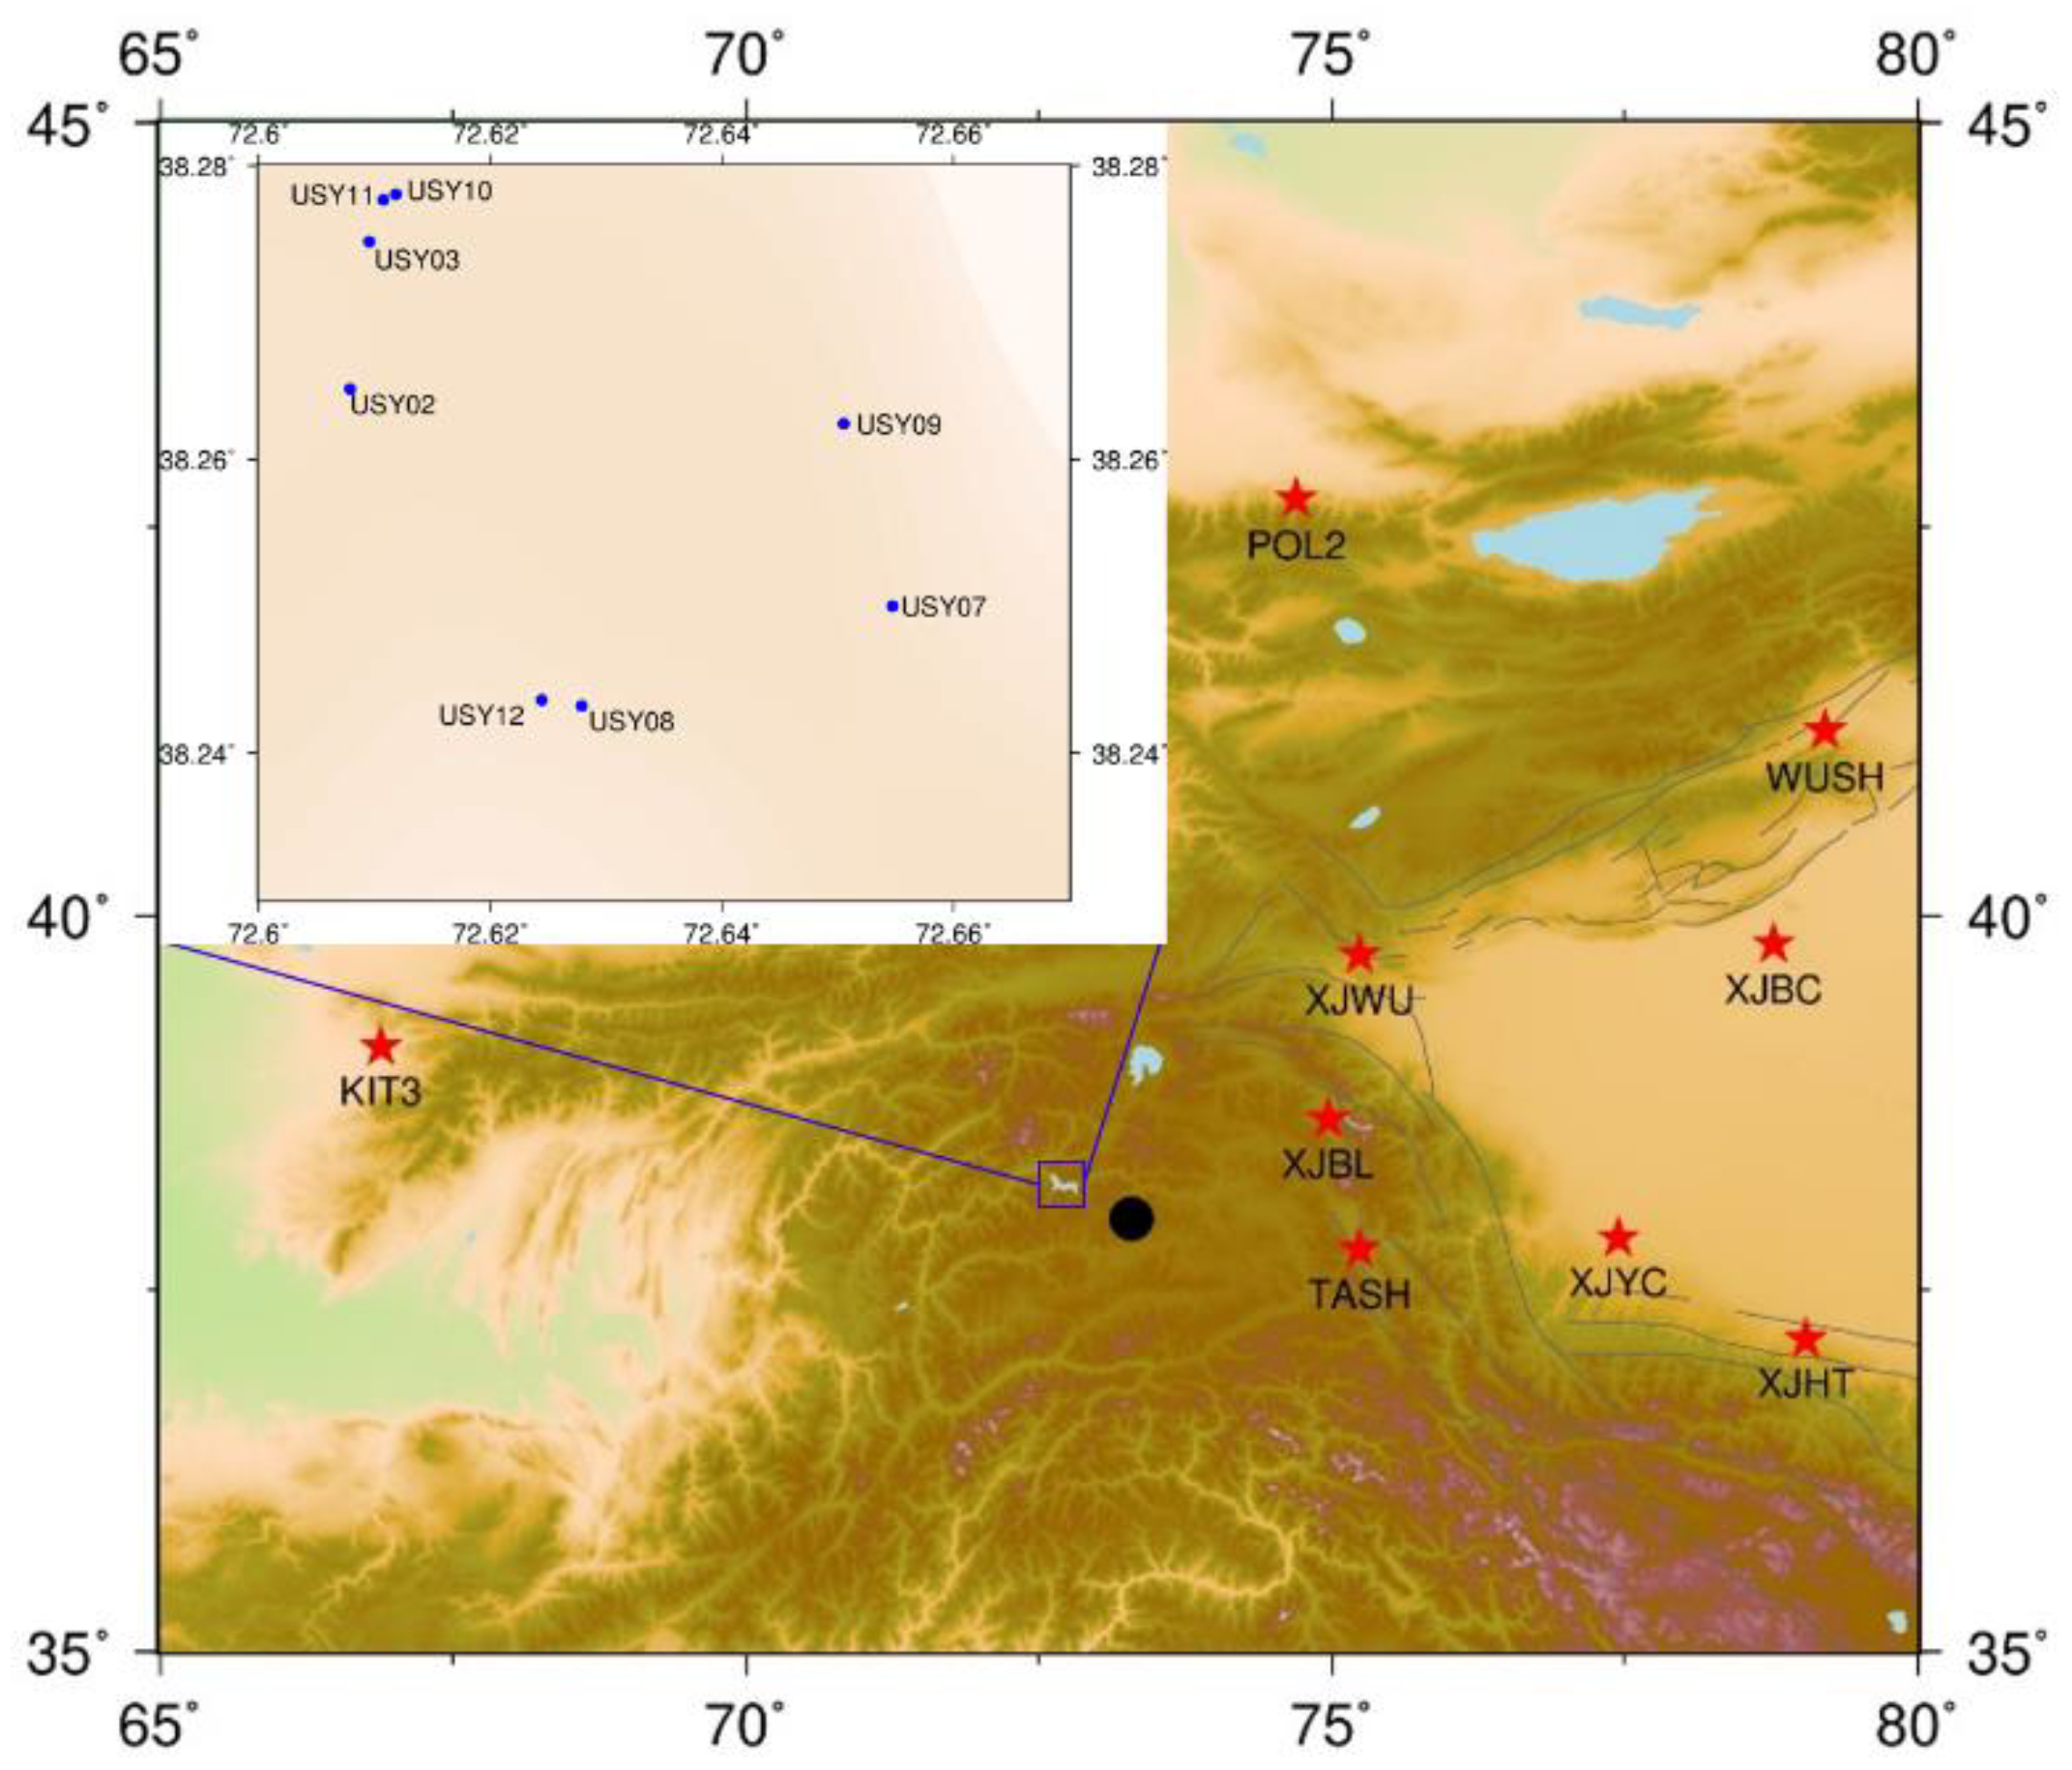
The GAMIT/GLOBK software was utilized to process observational data from eight sites and nine regional reference sites situated around a dam.
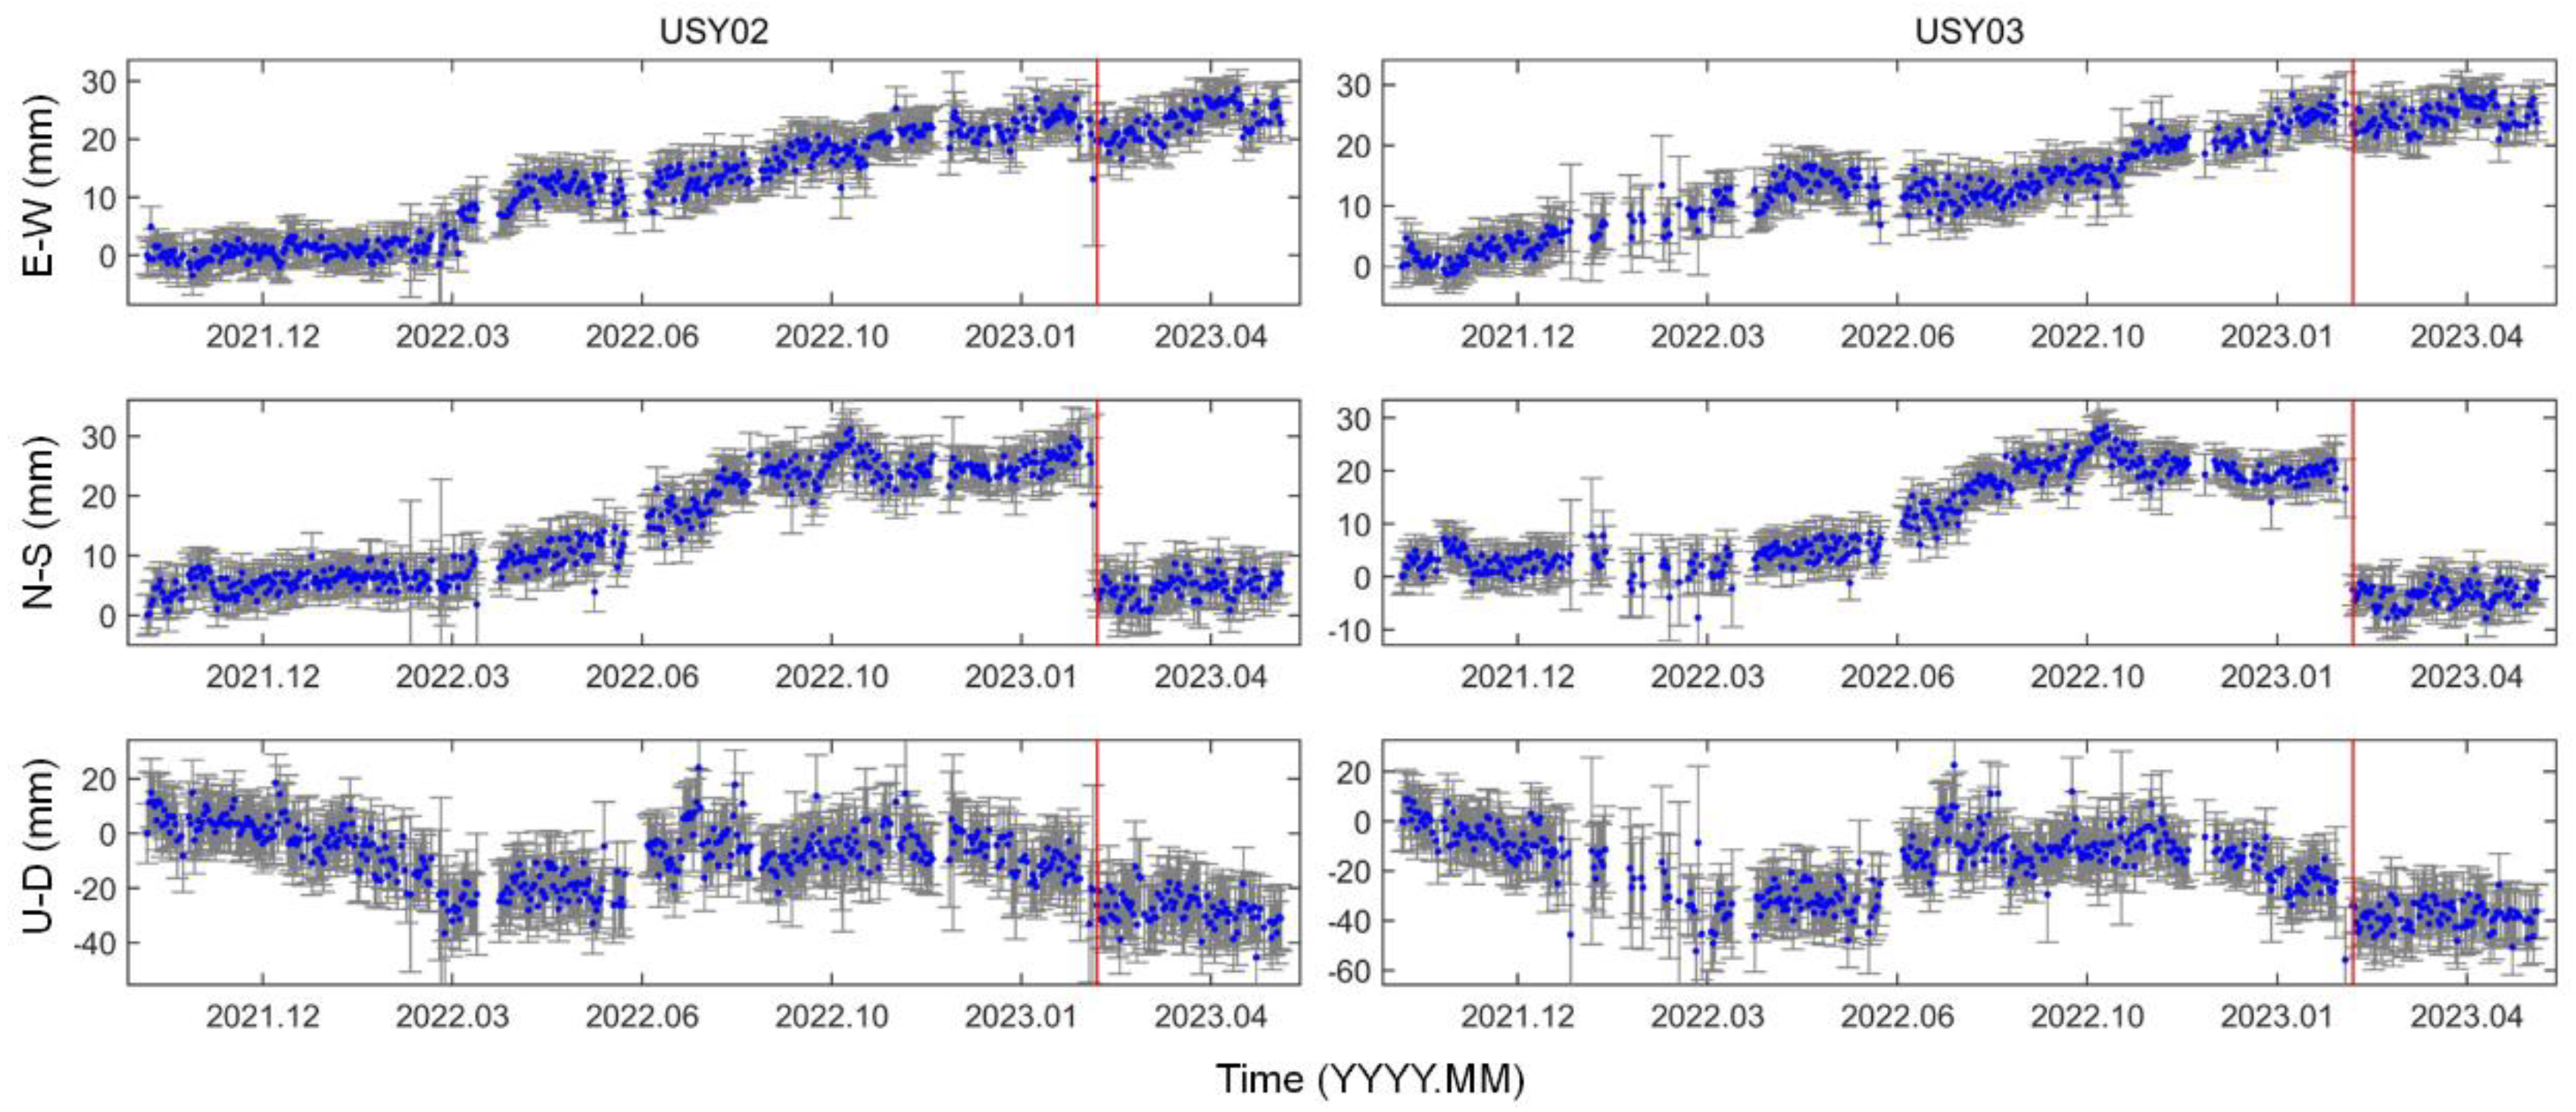
Figure 3 shows the geographical distribution of the regional GNSS station positions used in the current data processing network. This processing covered the period between 10 October 2021 and 11 March 2023 (Coordinated Universal Time, UTC+0), resulting in daily displacement solutions for both the monitoring and regional reference sites. A consistent computational approach was maintained by concurrently processing data from 70 IGS stations, 250 terrestrial network stations, and nine regional reference sites within the same temporal parameters. This strategy allowed for daily displacement solutions to be obtained for global and regional reference sites. The GLOBK software applied a 7-parameter similarity transformation to combine the daily displacement solutions from the monitoring, regional, and global reference sites, generating coordinate time series and associated errors. The time series, respectively at east–west (E–W), north–south (N–S), and up–down (U–D) directions, are shown in
Figure 4.
The analysis of
Figure 4 indicates that before February 2022, the northward displacement of USY02 was comparatively weaker than that of USY03. However, after February 2022, both USY02 and USY03 experienced an intensified northward displacement trend. Additionally, before February 2022, the eastward displacement of USY03 was generally weaker compared to USY02. Yet, post-May 2022, both sites demonstrated an accelerated eastward movement. Vertically, both USY02 and USY03 exhibited a descending trend, which ceased after May 2022. Despite a significant earthquake in Tajikistan on 23 February 2023, the motion trends of USY02 and USY03 remained unaffected. The displacement of both sites changed in the same direction and at a relatively consistent speed. Additionally, fluctuations observed in both sites may be attributed to thermal expansion and cold contraction of the dam due to seasonal temperature changes.
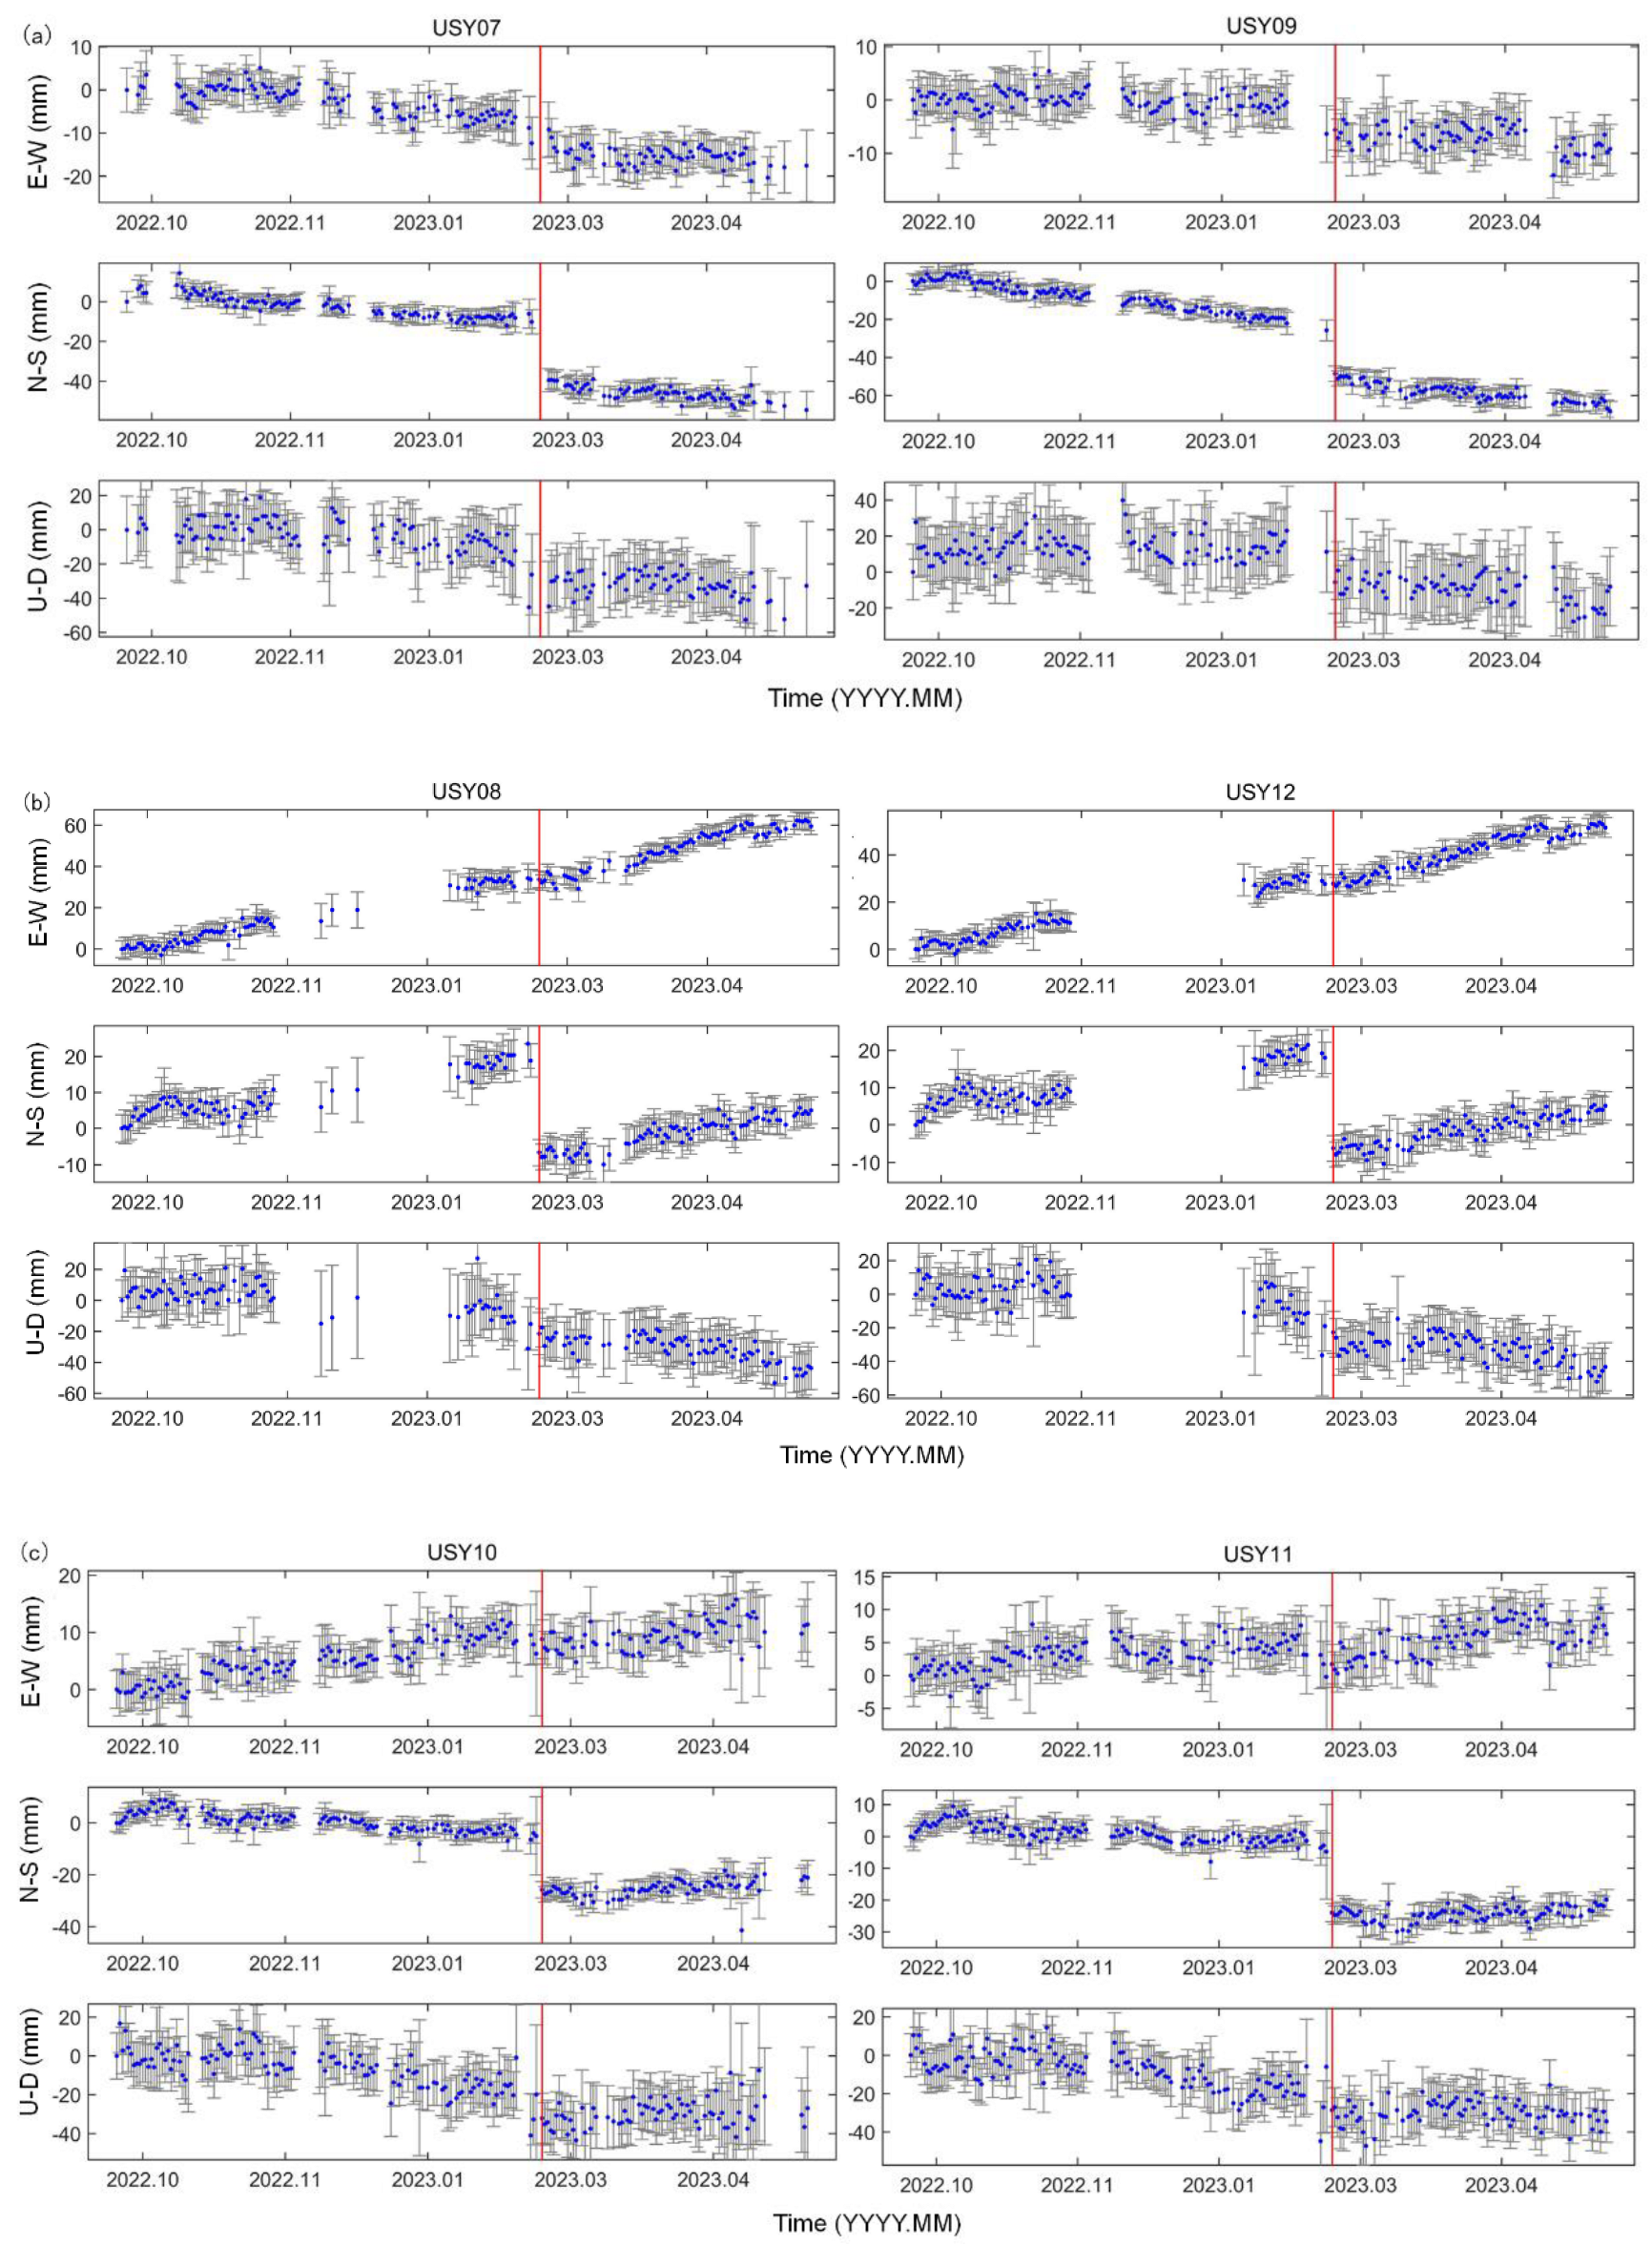
Based on
Figure 5, it is clear that the six sites deployed during the second phase show varying levels of displacement and deformation. Notably, there is consistent displacement observed among corresponding sites within the same region, specifically between sites USY07 and USY09, USY08 and USY12, as well as USY10 and USY11. The Tajikistan earthquake event on 23 February 2023 (marked by red line in
Figure 4 and
Figure 5) significantly caused all sites to experience significant co-seismic displacements, particularly in the E–W direction, with magnitudes reaching 20 mm. After the strong earthquake, site USY08 demonstrated an accelerated northward displacement, while site USY10 displayed a decelerating trend in the eastward direction. These behaviors can be attributed to the geological structural characteristics of the sites, although it is important to acknowledge the potential influence of post-seismic deformation.
4.2. Result of PPP
This study also utilizes PPP to process monitoring data from various sites. The data spans specific time intervals for each site, excluding periods with missing data. The computation employs custom-developed PPP software capable of achieving high post-processing positioning accuracy (up to 5 mm). The static computation mode is applied, and the key parameters are listed in
Table 2. The computed parameters include site positions, receiver clock corrections, and tropospheric corrections. The XYZ coordinates of the sites are projected into Universal Transverse Mercator Projection (UTM) Zone 43 (Northern Hemisphere) relative to the PPP results from the initial calculation date.
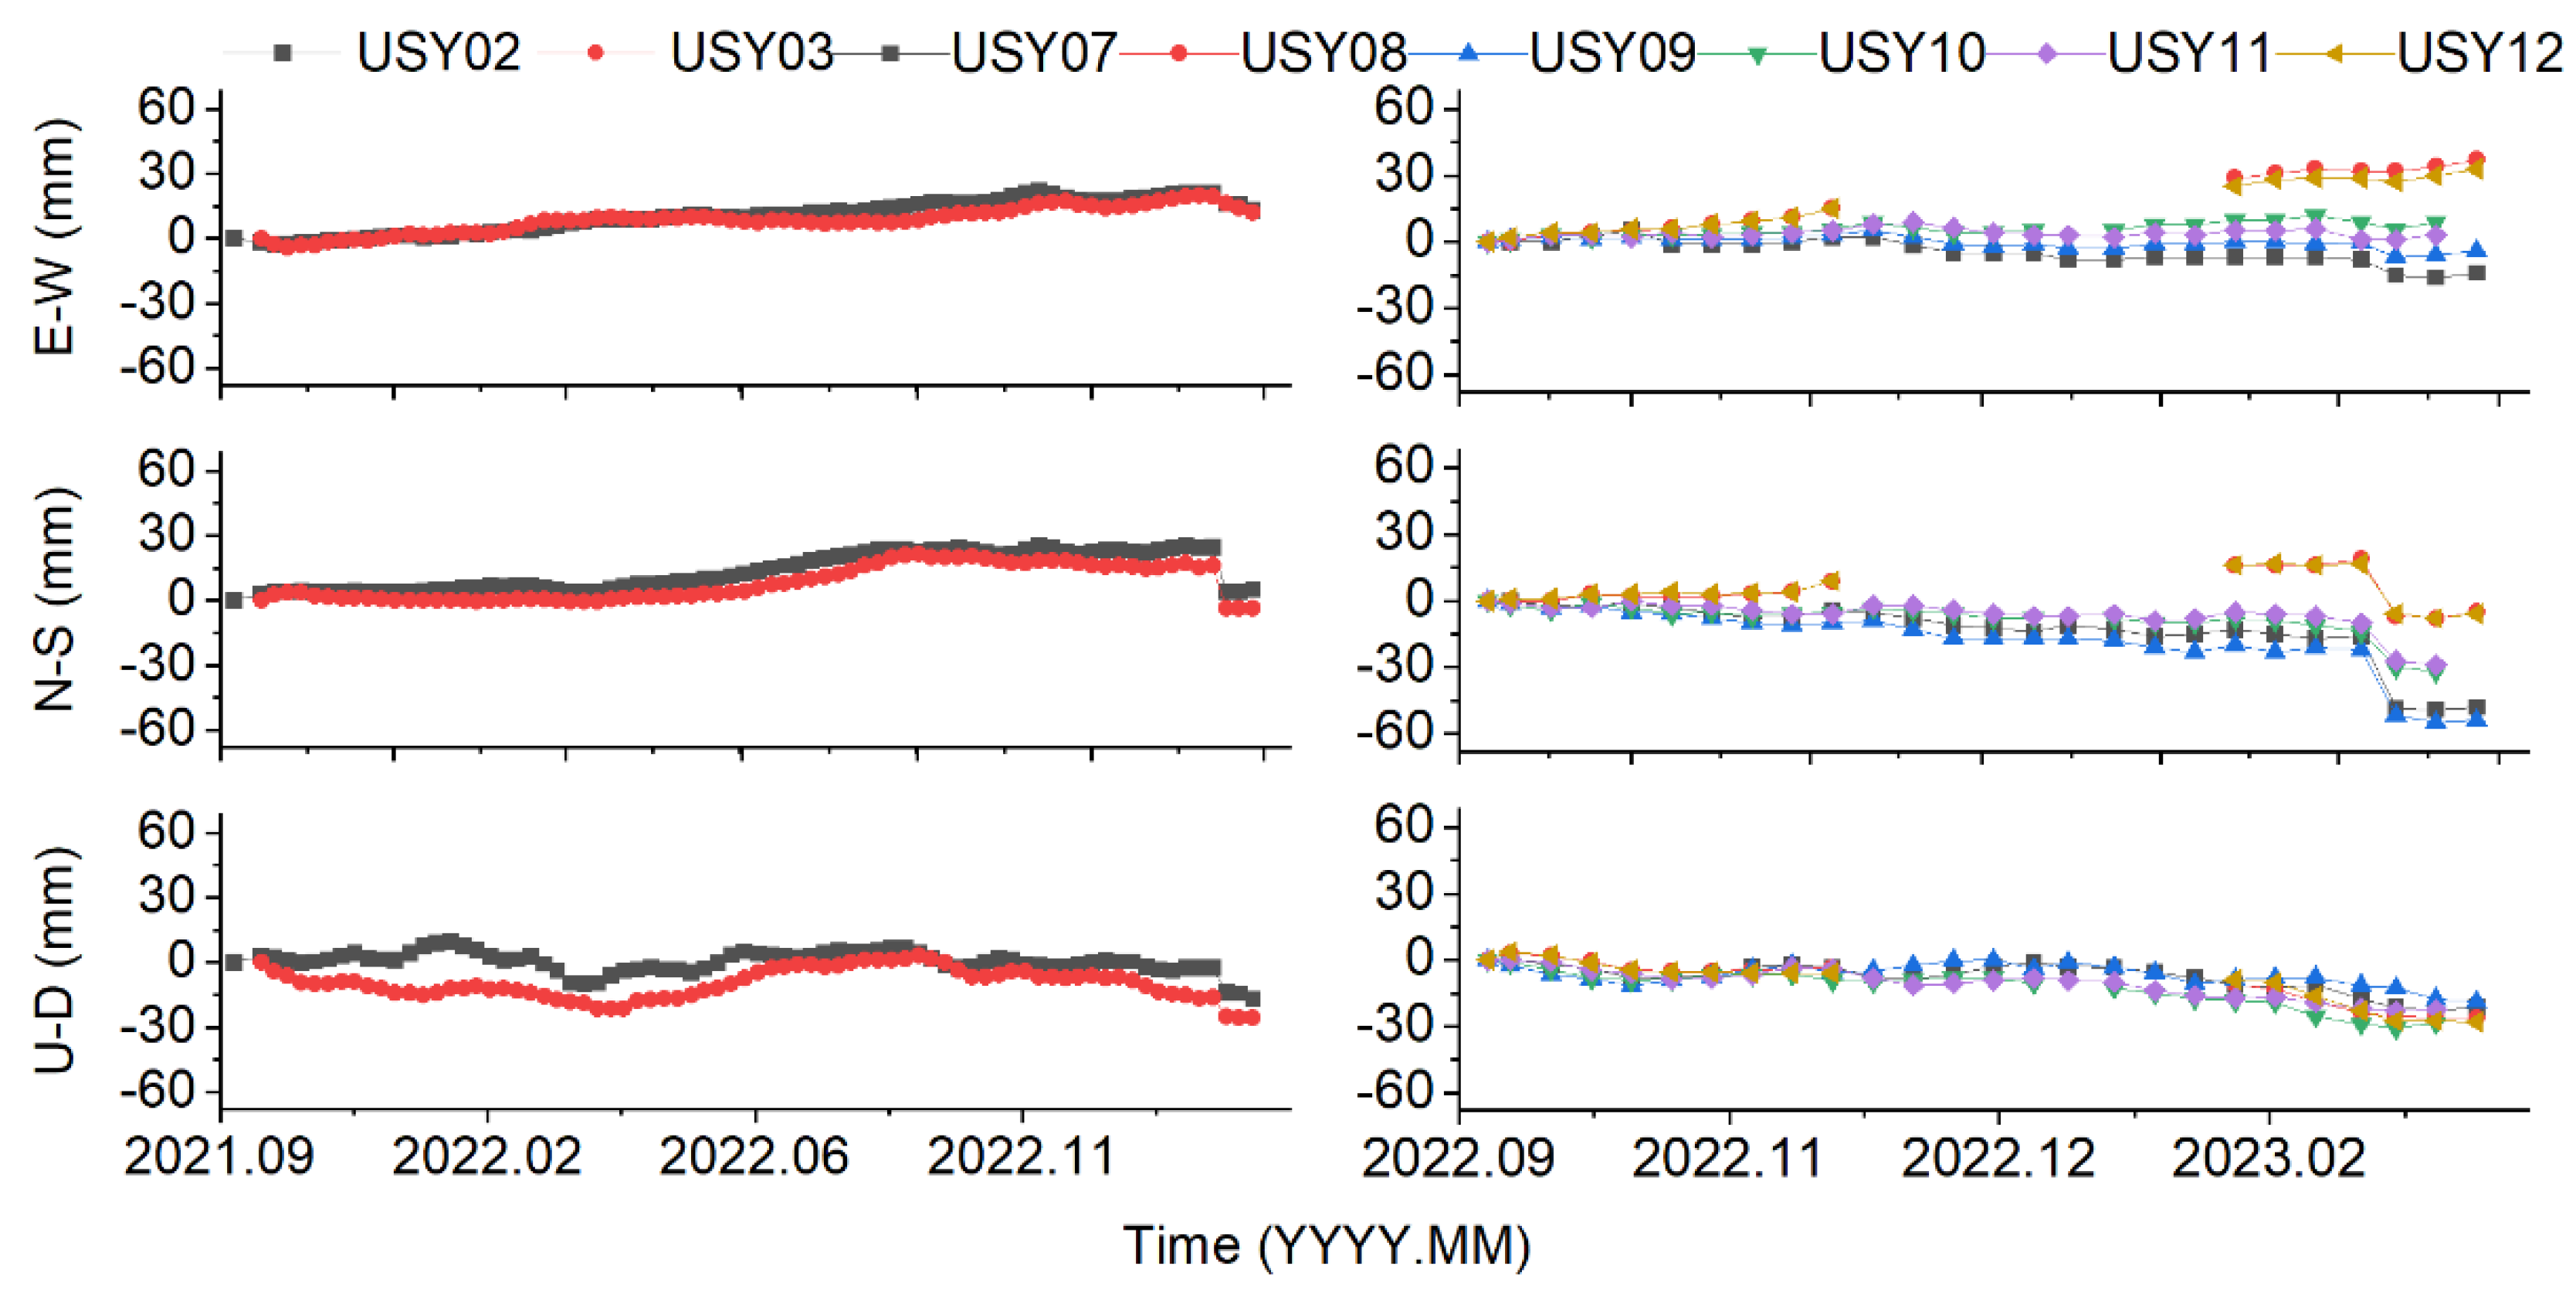
Figure 6 displays the displacement change sequence of each monitoring site relative to the initial establishment site, with a weekly interval up to 11 March 2023.
As can be seen from
Figure 6, USY02 and USY03 exhibit an eastward movement with a slow velocity of approximately 1.25 mm/month, while USY03 remains relatively stable in the U–D direction. USY02 shows periodic fluctuations with an amplitude of around 12 mm. On the other hand, USY08, USY10, USY11, and USY12 exhibit eastward displacements of −31.00 mm, 10.67 mm, 5.33 mm, and 27.33 mm, respectively, with velocities of 1.91 mm, 0.66 mm, 0.33 mm, and 1.68 mm per month. In contrast, USY07 and USY09 exhibit westward displacements of 7.00 mm. Additionally, USY08 and USY12 show northward deformation with deformation amounts of 16.00 mm and 16.33 mm, respectively, at rates of 0.99 mm and 1.01 mm per month. Conversely, USY07, USY09, USY10, and USY11 experience southward deformation, with deformation amounts of 15.00 mm, 21.44 mm, 9.33 mm, and 6.00 mm, respectively, at a uniform rate of 0.92 mm, 1.32 mm, 0.58 mm, and 0.37 mm per month. In the U–D direction, all sites exhibit subsidence, each with an equivalent average of 13.15 mm and a speed of 0.81 mm/month. Notably, the sites are uniformly distant from the river bank in the horizontal displacement direction, leading to uniform deformation over a short period. It is crucial to prioritize attention to USY07, USY08, USY09, and USY12 due to their significant horizontal displacements. This conclusion is supported by a comparison with
Figure 2, which need to be paid more attention.
According to the reports from the China Earthquake Networks Center, on 23 February 2023, at 08:37 (UTC+8 time), a magnitude 7.2 earthquake occurred in Tajikistan (latitude 37.98 degrees N, longitude 73.29 degrees E) with a focal depth of 10 km. Following this event, several aftershocks were observed. It is evident from
Figure 6 that there was a noticeable and consistent increase in sites between 19 February 2023 and 25 February 2023. This observation is attributed to the proximity of the earthquake center to the lake area, with a distance of approximately 52 km, and the absence of any concurrent geological events in the region. This suggests a strong possibility that the earthquake is the causal factor behind this phenomenon. The displacement resulting from the earthquake can be determined by calculating the difference in displacement between 19 February 2023 and 25 February 2023, as depicted in
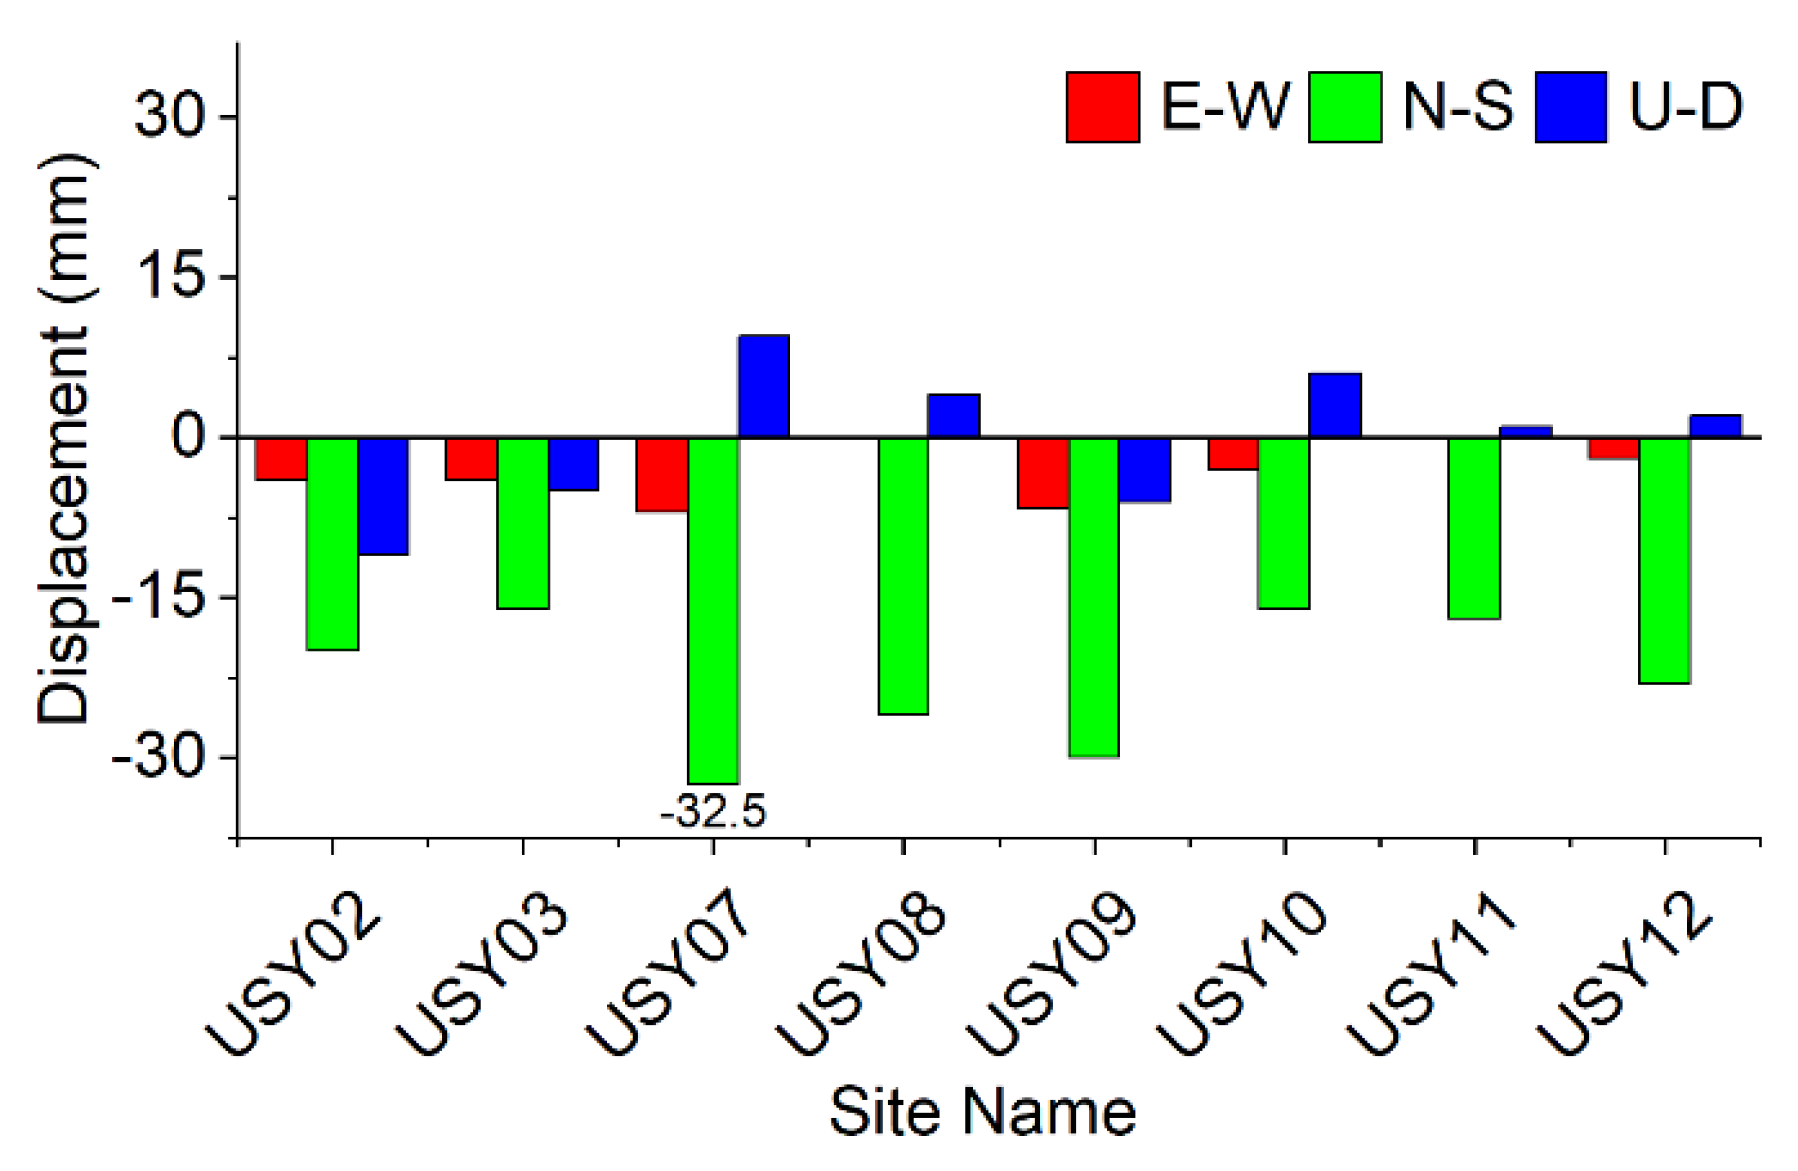
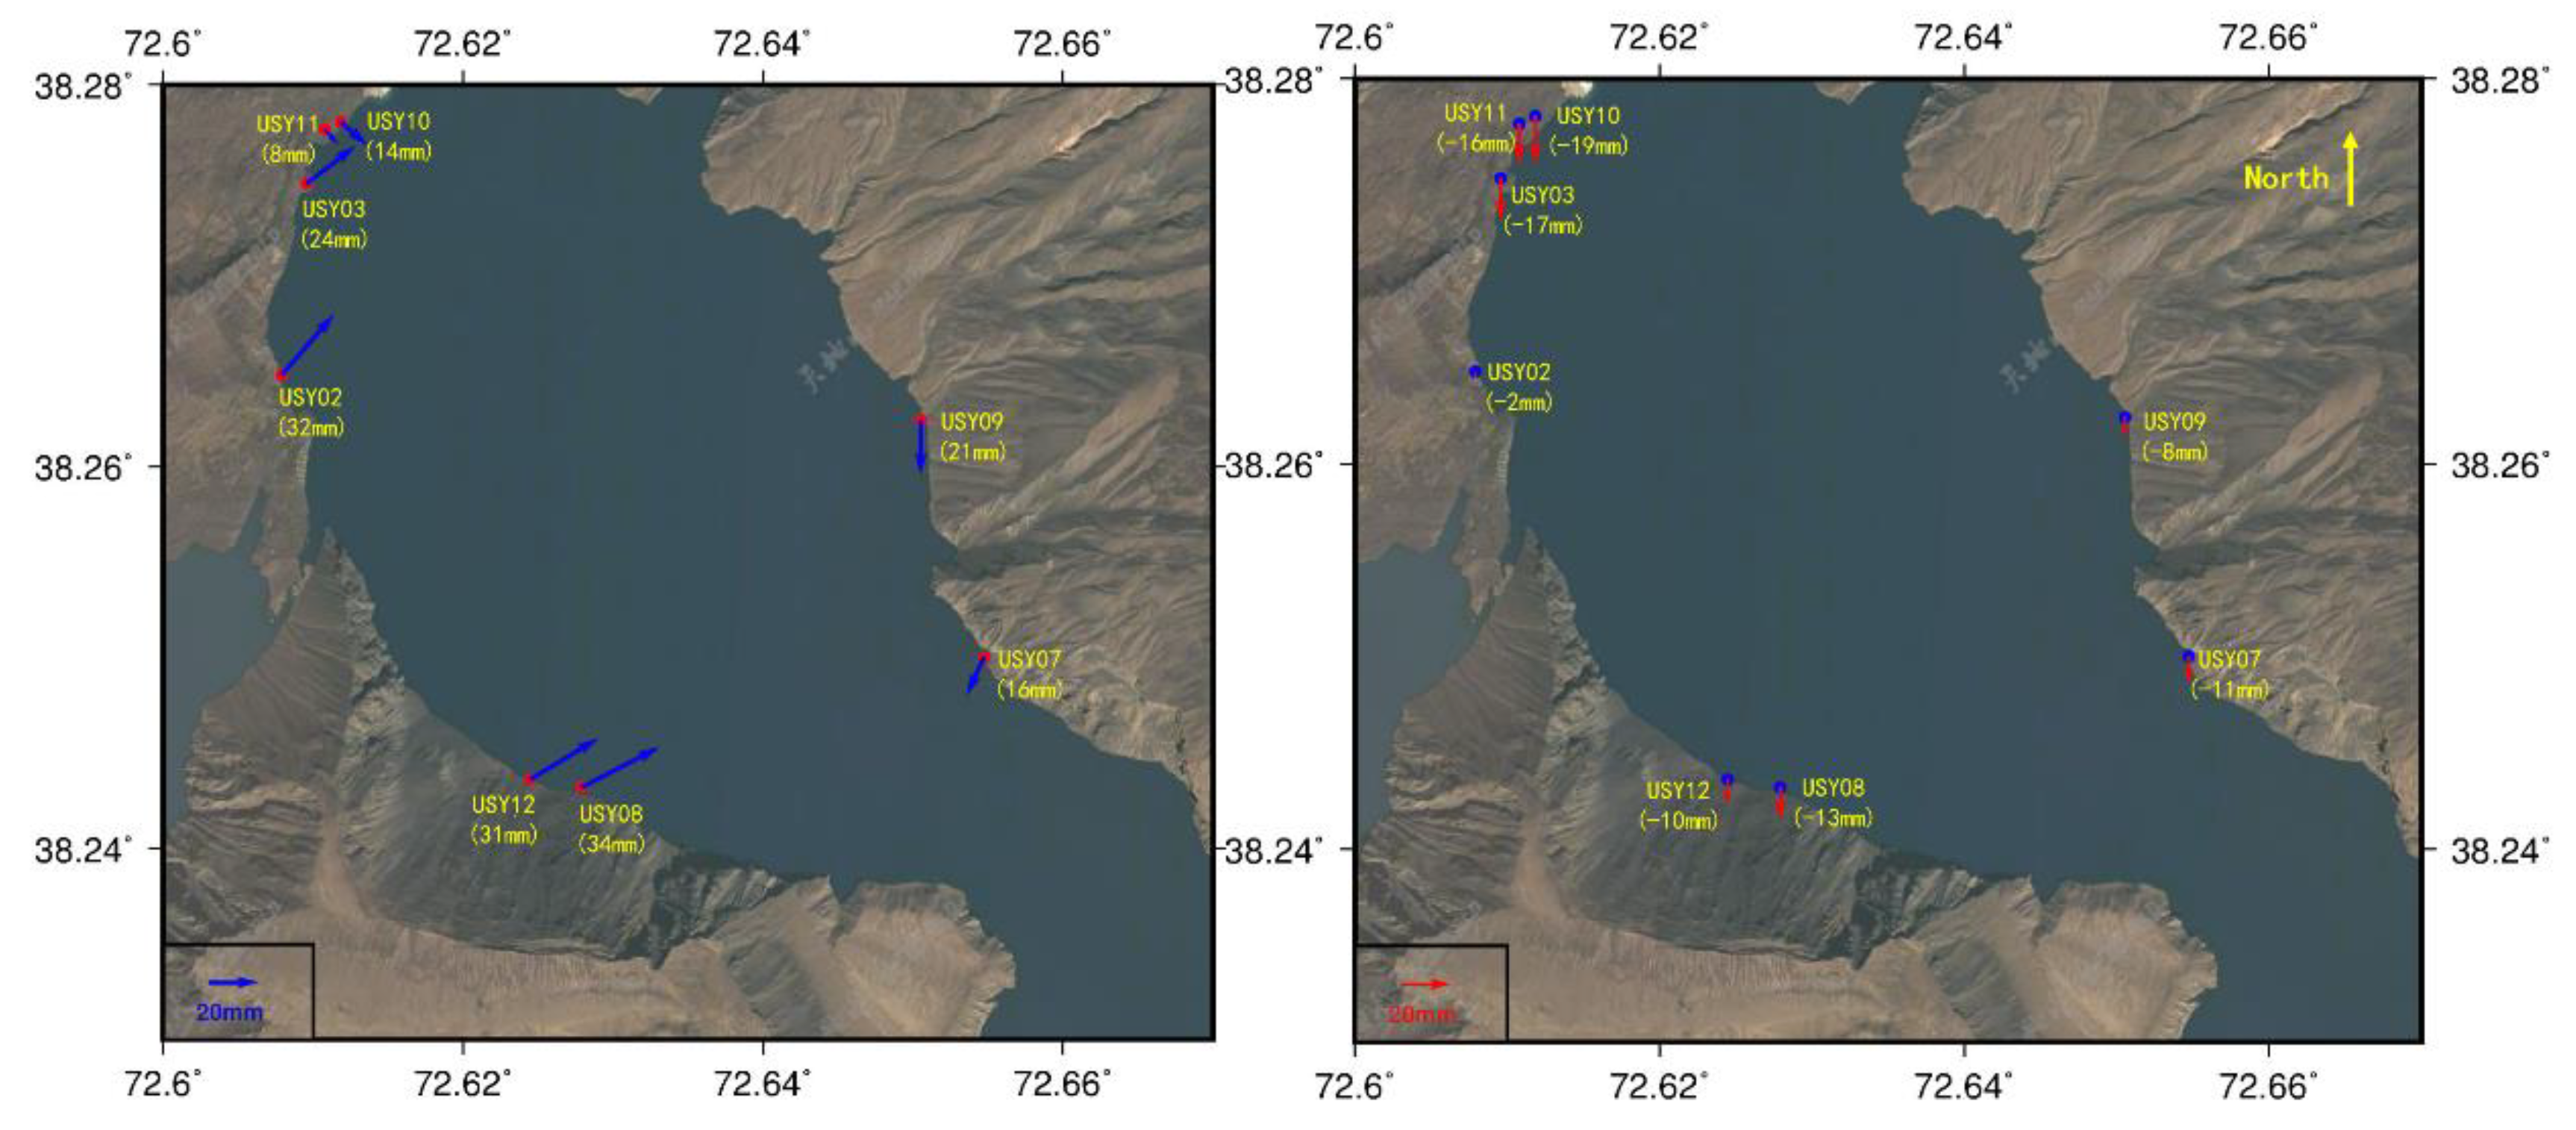
Figure 7.
Figure 7 shows pre- and post-earthquake displacement variations at different sites. Notably, considerable horizontal displacements occurred at all sites, with an average of 3.3 mm westward and 22.5 mm southward. This displacement direction remains consistent, exhibiting a deformation rate 20 times the monthly norm. Vertically, displacements are slightly smaller, averaging around 5.2 mm, with some sites rising while others sinking. The earthquake-induced substantial displacements across all sites, particularly in the southwest, are possibly linked to the stable positioning of the southeastern plate, where the lake is situated. Within a week, all sites experienced three-dimensional displacements exceeding 10 mm, greatly surpassing the usual sliding rate. Consequently, this seismic event likely significantly impacts the dam’s stability, with co-seismic displacements reaching as much as 20 mm.
4.3. Result of RTK
To obtain reliable deformation, RTK is also used in this study. The relatively stable USY02 is used as the base site to perform the double differenced RTK solution of other sites, thus obtaining the high-precision relative displacement of other sites. Additionally, the system periodically employs PPP daily solutions to correct USY02’s coordinates for acquiring absolute deformation.
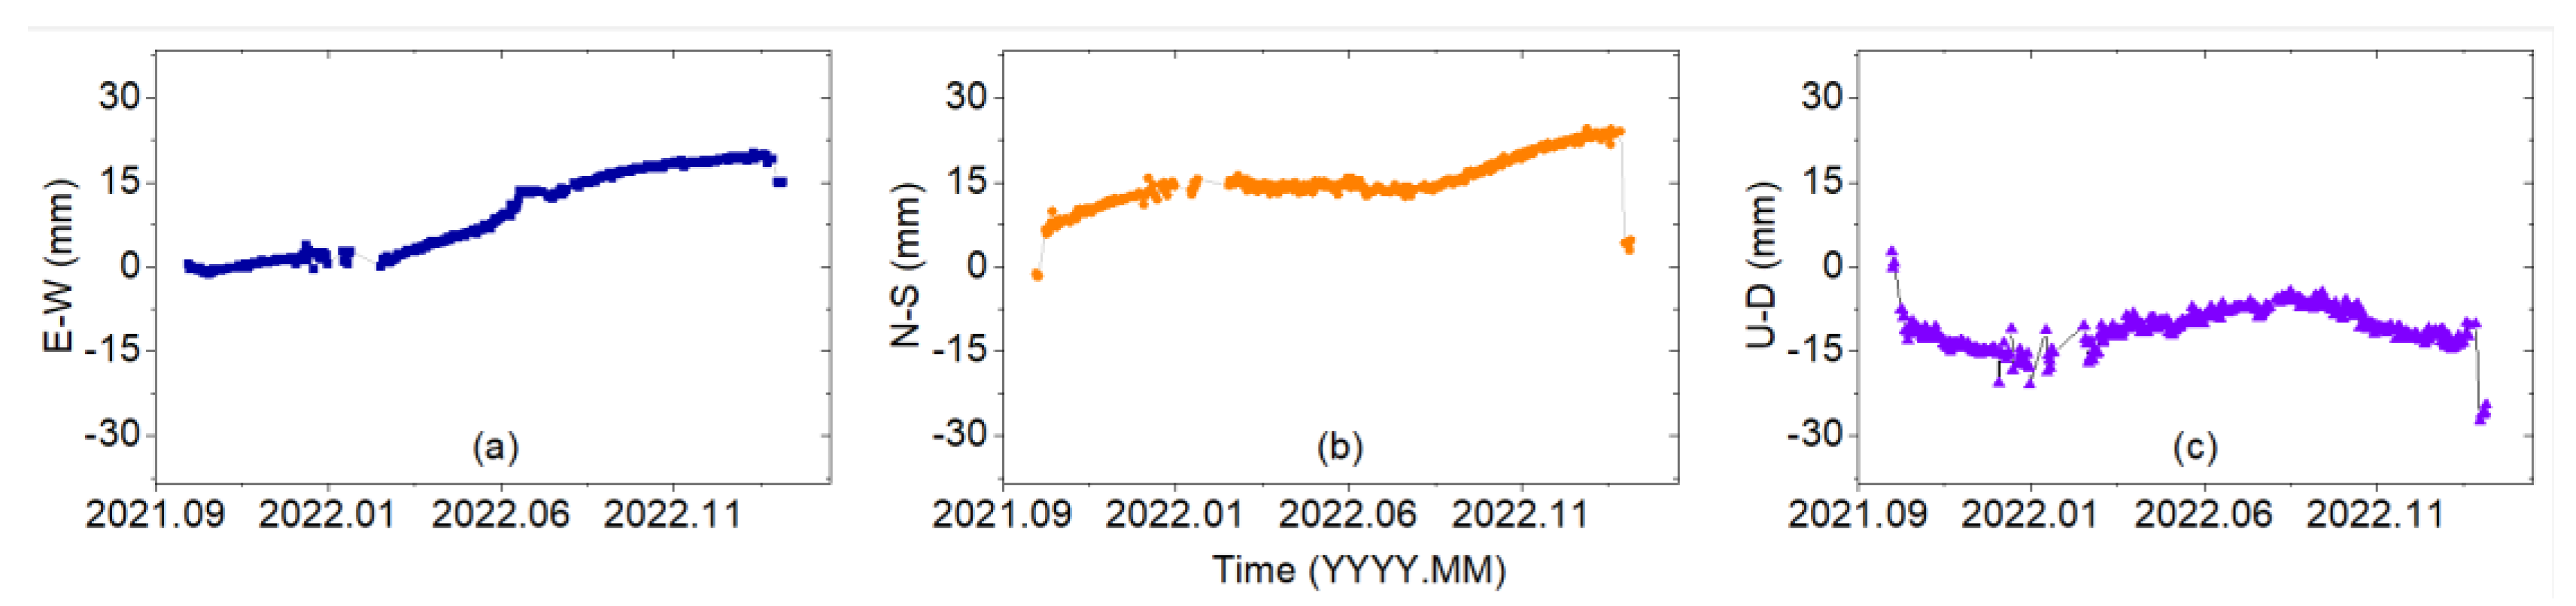
Figure 8 shows the displacement time series of the site USY03 for 516 days from 8 October 2021 to 28 February 2023, in which
Figure 8a–c shows the displacement time series in the E–W, N–S, and U–D directions, respectively.
As is shown in
Figure 8, the USY03’s displacement at the horizontal direction remained generally consistent before 23 February 2023, displaying a relatively stable trend. In the period from September 2021 to February 2022, the displacement in the vertical direction exhibited minor fluctuations, followed by an upward trend until September 2022, after which it decreased again until February 2023. This observed behavior is linked to the annual temperature decline from September to February, inducing mm-scale deformation and rebound in the dam due to thermal expansion and cold contraction. Consequently, there were seasonal displacement fluctuations within an approximate range of 5 mm. Notably, a substantial N–S displacement occurred on 23 February 2023, attributed to an abrupt earthquake event.
To comprehensively analyze and scientifically evaluate the coastal deformation,
Figure 9,
Figure 10 and
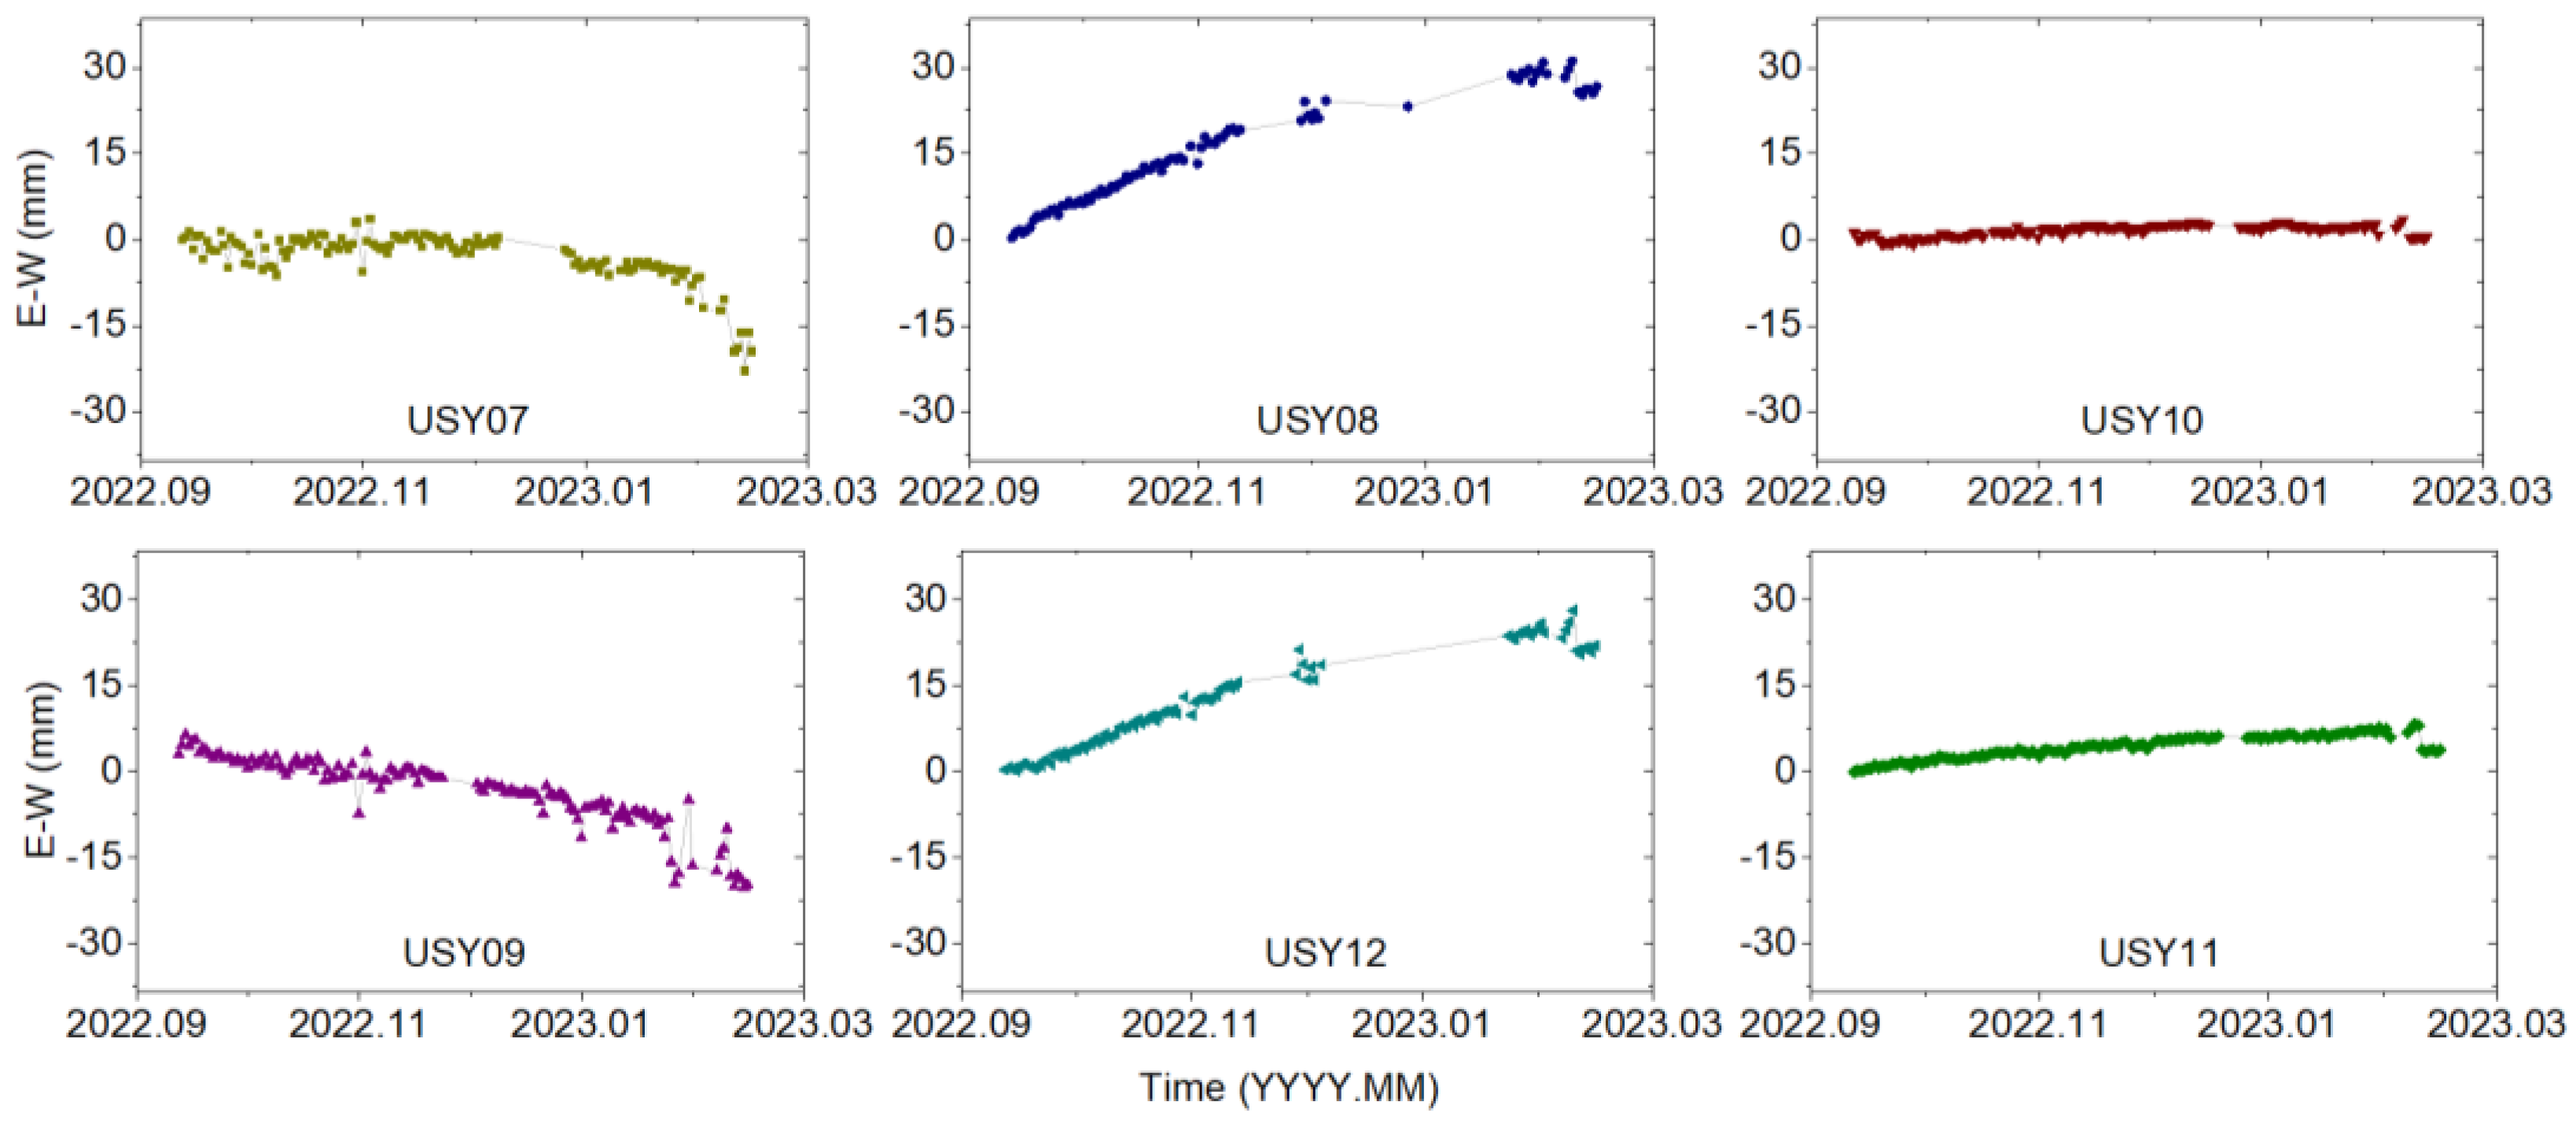
Figure 11 show the displacement time series of six sites in the E–W, N–S, and U–D directions in the second phase of USY07-USY12, with a period of 172 days from 17 September 2022 to 28 February 2023.
Figure 9 shows the displacement time series of USY07-USY12 in the E–W direction. As can be seen, before 23 February 2023, there were significant displacements of all sites in the E–W direction during the monitoring period, among which the displacements of four sites, USY07, USY09, USY10, and USY11, moved to the west, while USY08 and USY12 moved to the east, and the moving speed was relatively uniform.
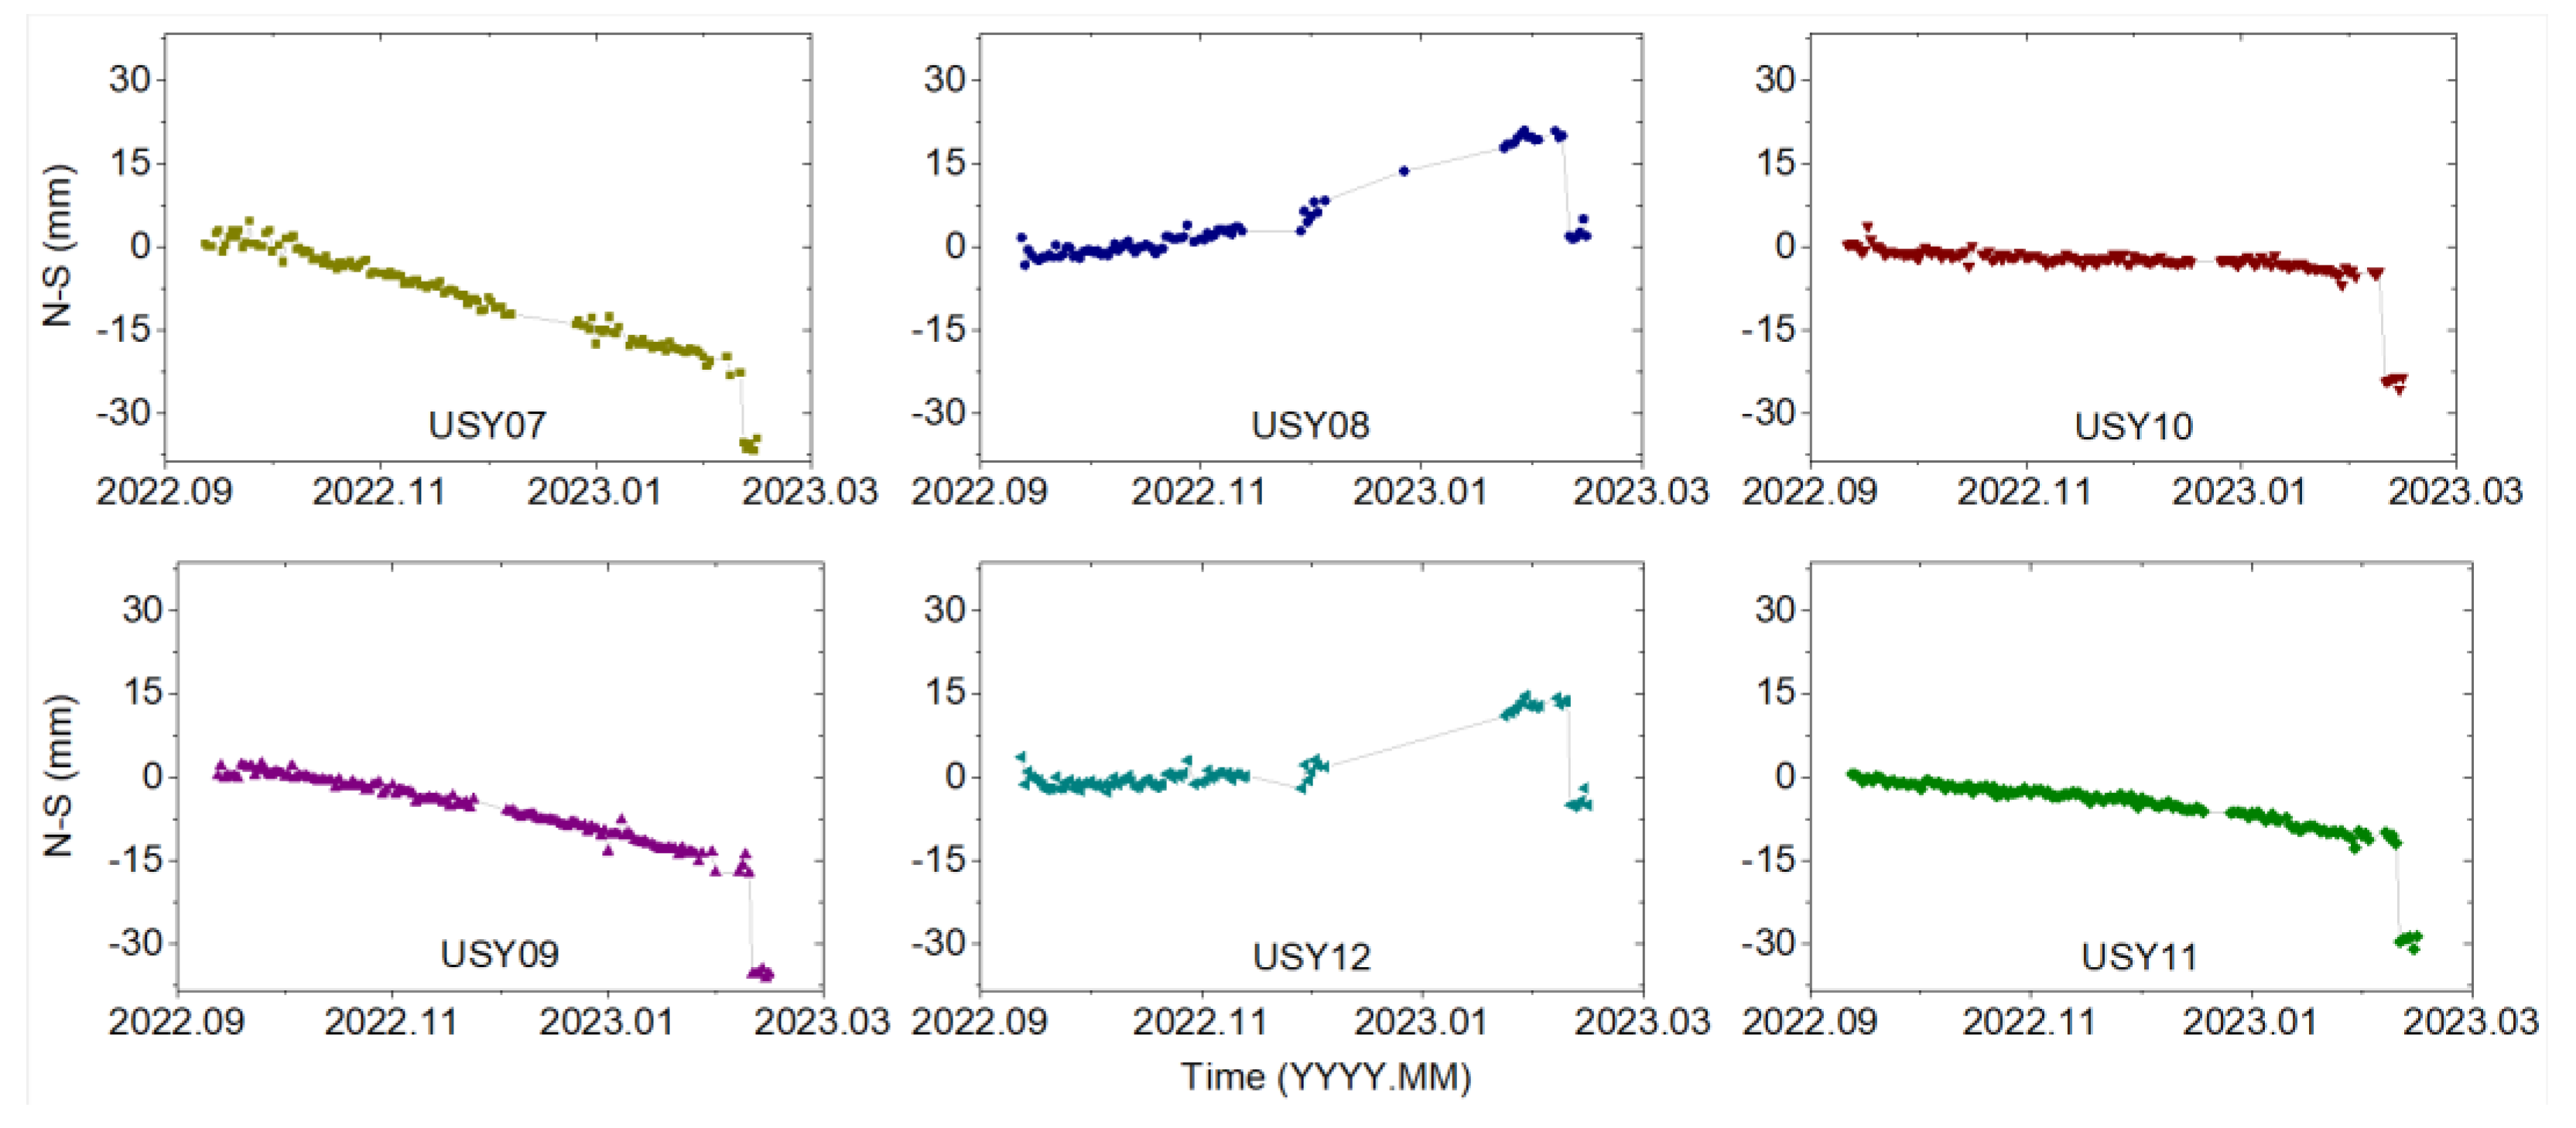
Figure 10 shows the displacement time series of monitoring points USY07- USY12 in the N–S direction. Following the occurrence of a sudden earthquake on 23 February 2023, a noticeable displacement sequence shift is evident. Analysis of
Figure 10 reveals that all sites except USY11 displayed significant N–S displacement throughout the monitoring period. Specifically, USY07 and USY09 exhibited southward movement, while both USY08 and USY10 displayed northward displacement with relatively uniform velocities.
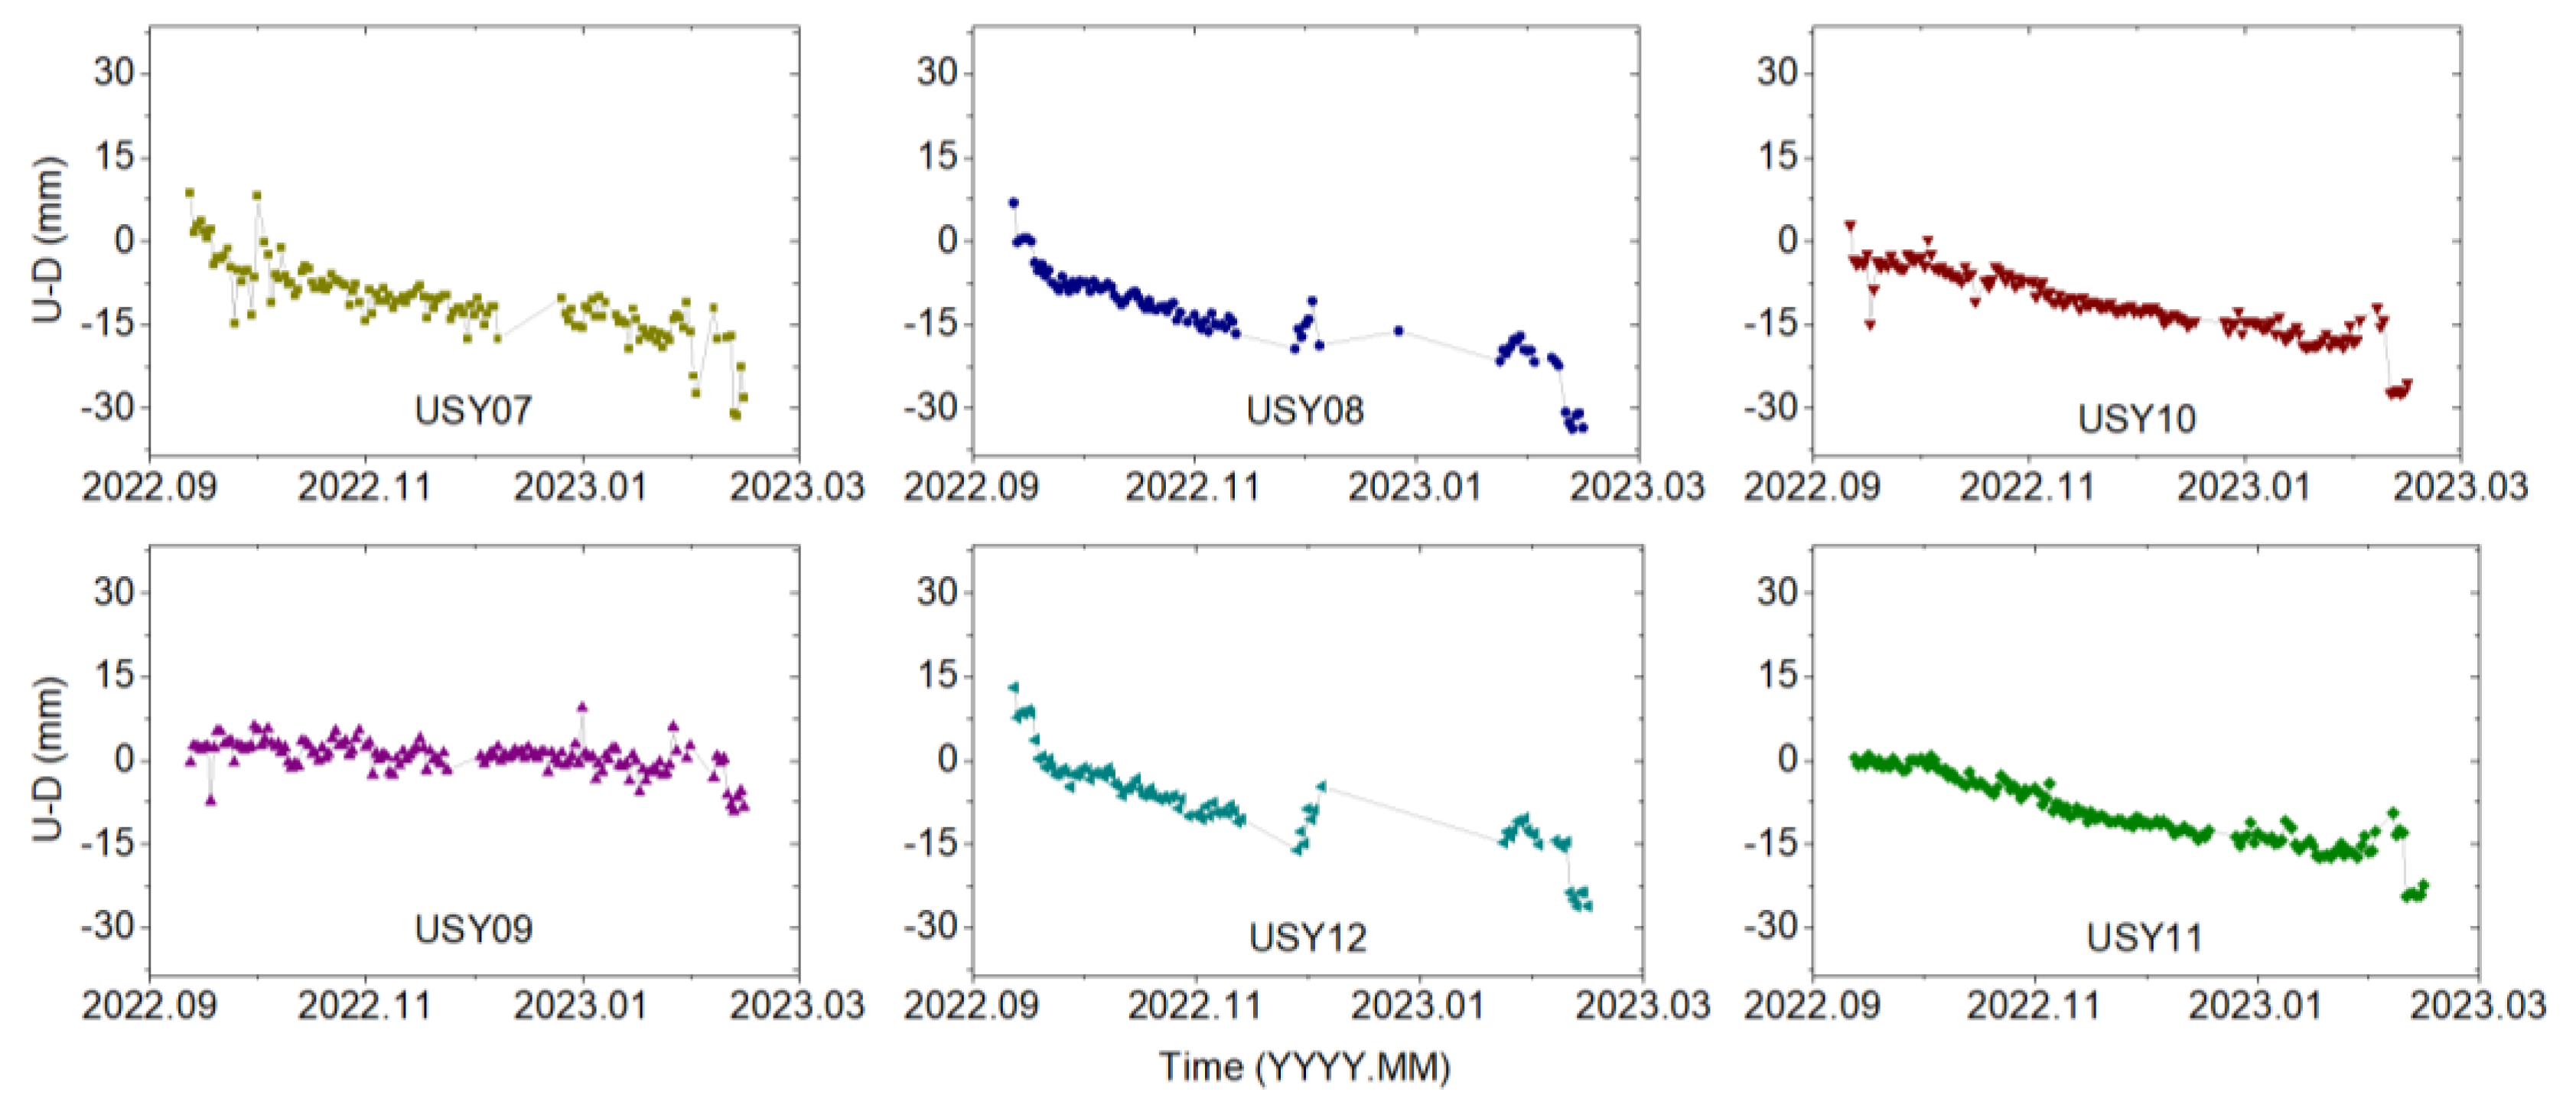
Figure 11 shows the displacement time series of USY07-USY12 in the U–D direction. As can be seen, before 23 February 2023, all sites showed a slight downward trend in the U–D direction, but the deformation was smaller than that in the horizontal direction. Following the seismic event on 23 February 2023, a discernible truncation is evident in the displacement sequence, indicating the seismic impact on the displacement.
Table 3 shows the cumulative displacement and change rate of each monitoring site by RTK before 23 February 2023.
As can be seen from
Table 3, the deformation of monitoring points that are close to each other has consistent performance in both horizontal and vertical directions. While most fractal variables are similar, there are some differences, which may be caused by the actual deformation of each monitoring point.
4.4. Discussions
The baseline network’s findings reveal that before February 2022, the N–S displacement of USY02 was less pronounced compared to USY03. However, after February 2022, both USY02 and USY03 exhibited increased N–S displacement. Before February 2022, the E–W displacement of USY03 was generally lower than that of USY02, but after May 2022, both sites displayed a heightened eastward motion. In terms of elevation, a declining trend was observed for both USY02 and USY03, but this trend ceased after June 2022. Sites USY07 to USY12 displayed varying levels of displacement and deformation without significant fluctuations in their motion trends. Following the substantial earthquake in Tajikistan on 23 February 2023, USY08 experienced accelerated northward displacement, while USY10 exhibited decelerating eastward displacement, potentially linked to the geological and tectonic context of these sites, although the impact of post-earthquake deformation cannot be completely dismissed.
The results of the PPP calculations reveal significant geodetic movements of the sites. Specifically, sites USY02 and USY03 exhibit slow eastward motion at a rate of approximately 1.25 mm per month while experiencing substantial northward displacement exceeding 15 mm. USY03 displays relative stability in the U–D direction, whereas USY02 has exhibited recent fluctuations of about 12 mm. Sites USY08, USY10, USY11, and USY12 demonstrate an eastward shift, with USY08 and USY12 showing a northward trend, whereas USY07 and USY09 manifest westward motion. Sites USY07, USY09, USY10, and USY11 indicate a southward trend. In terms of vertical displacement, all sites experience subsidence, averaging 13.15 mm with a monthly rate of 0.81 mm. The consistent long-term data exhibit uniform, shore-directed horizontal displacement at relatively constant rates. Notably, the seismic has resulted in significant alterations in site positions, suggesting a discernible impact on the dam’s stability. The cumulative displacement calculated by PPP of all sites as of 23 February 2023 is displayed on the plane, and the result is shown in
Figure 12.
Figure 12 reveals that over extended observational periods, all sites exhibit horizontal deformations surpassing the centimeter level, consistently converging towards the lake’s center. Notably, USY02, USY03, USY08, and USY12 share identical displacement directions, displaying substantial movement. Similarly, USY07 and USY09 share displacement directions, though with a slightly lower magnitude, while USY10 and USY11 also share displacement directions, yet with minimal movement. Except for USY02, which demonstrates minor subsidence, significant settlements in the vertical direction are evident across the other sites, averaging a total of 13.15 mm.
Based on the results of RTK, USY03 has displayed noticeable movements in three dimensions: eastward, northward, and vertical. The general trend in the E–W direction indicates a consistent uniform rate of movement. In the U–D direction, the displacement initially shifted downwards until the conclusion of February 2022, followed by an upward displacement until mid-September 2022, after which it reverted to a downward movement. Within the second phase, significant horizontal displacement was observed. In the E–W direction, average cumulative displacement in three dimensions is 27.5 mm for all sites, with USY07 and USY09 moving in a westward direction, and USY08 and USY12 moving eastward, and USY10 and USY11 moving eastward as well. In the N–S direction, significant displacement was observed for all sites except with USY10 and USY11, as well as USY07 and USY09 moving southward, and USY08 and USY12 moving northward at relatively uniform speeds. It cannot be seen from
Figure 9,
Figure 10 and
Figure 11 that the deformation velocity of all points is relatively consistent, and the velocity in the horizontal direction is significantly greater than that in the U–D direction. Comparatively, when contrasted with PPP results, the RTK solution demonstrates a higher level of precision in the measurements taken.
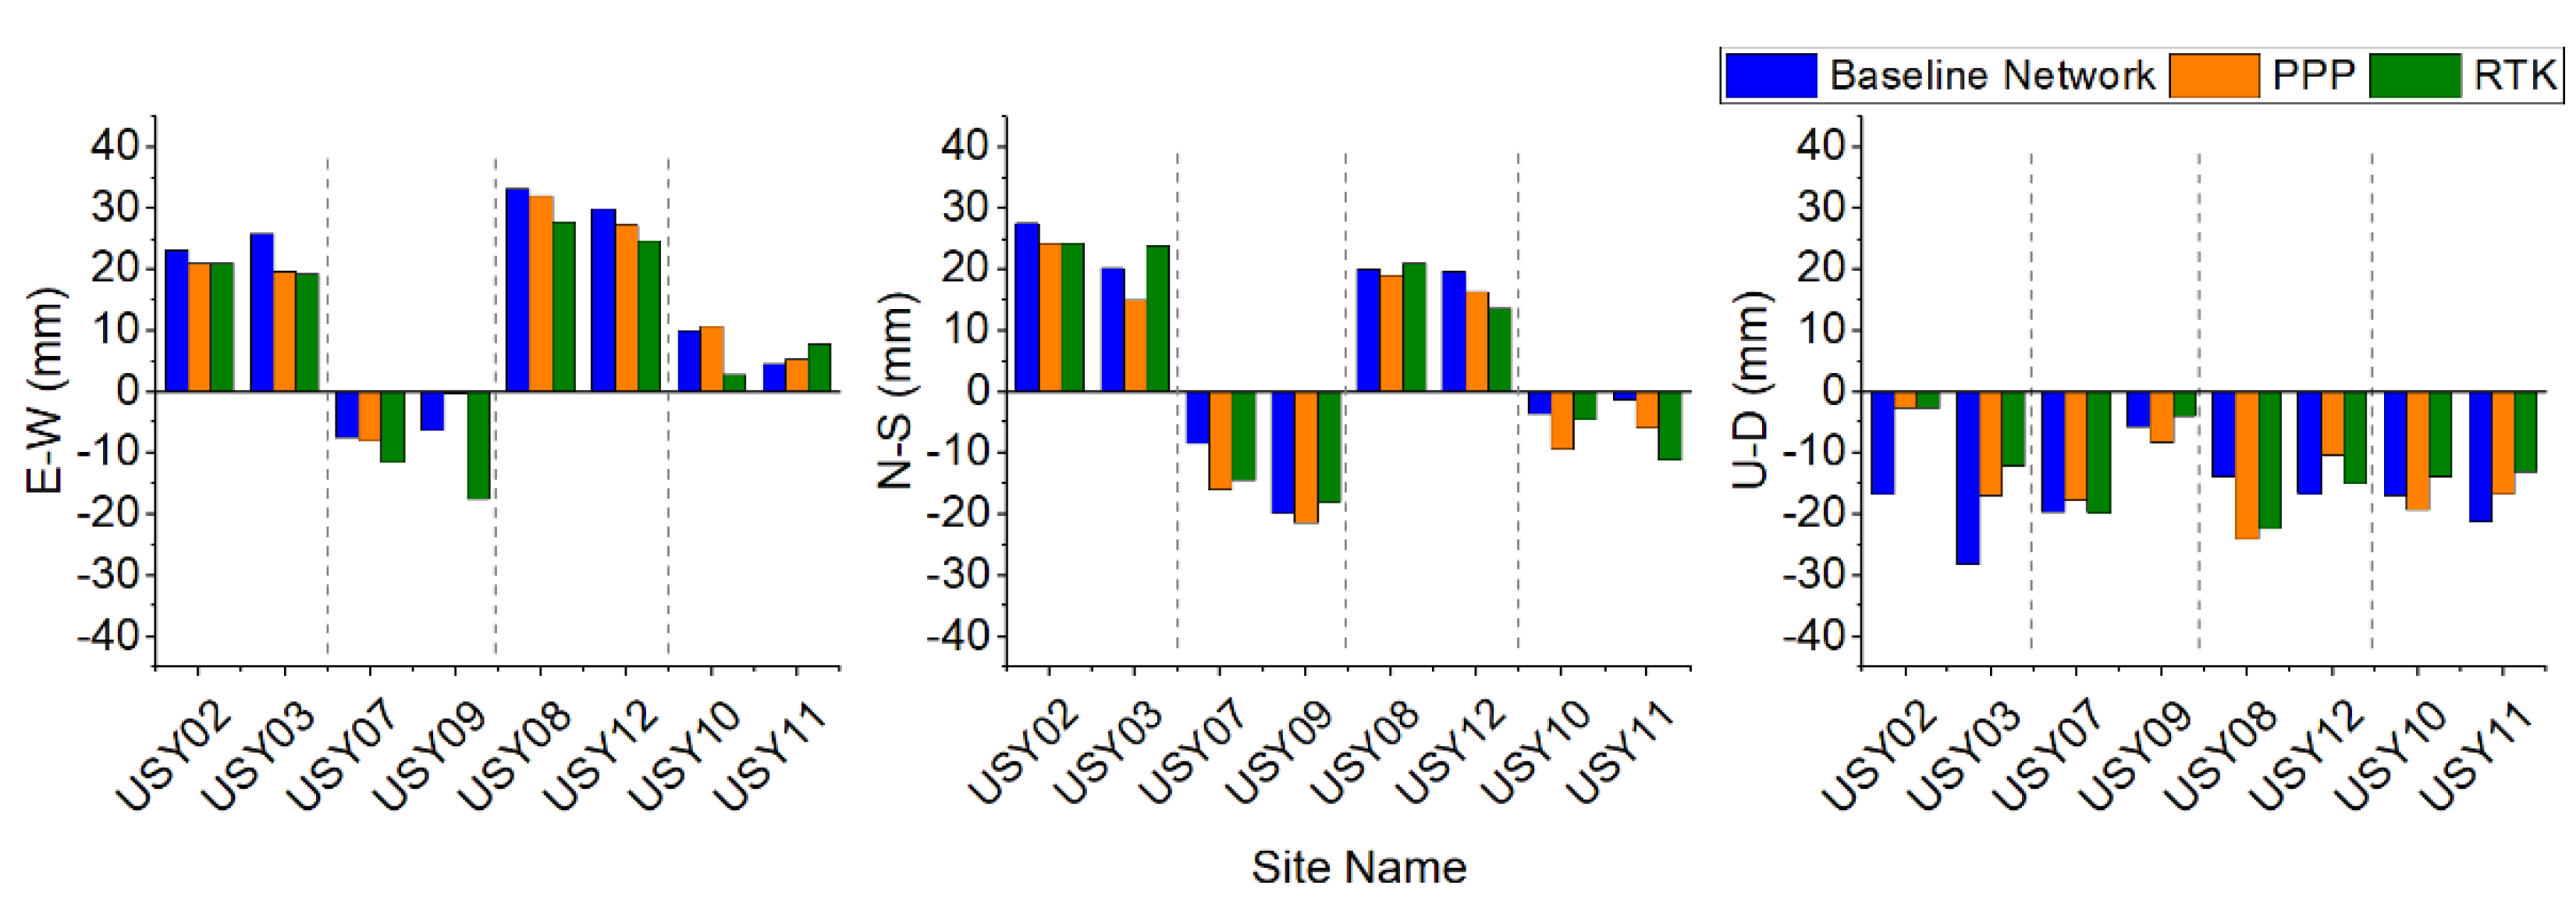
To further discuss the pros and cons of the three methods and the reliability of monitoring results, a comparison of the cumulative displacement before the earthquake is provided by using methods Baseline Network, PPP, and RTK, respectively, as is shown in
Figure 13.
From
Figure 13, it can be seen that the monitoring results of the three methods can consistently reflect the deformation of the dam sites in three dimensions, both in horizontal and vertical directions. The consistency is not only reflected in the direction of deformation but also in the size of the deformation. The reason for the individual inconsistency is that the initial displacement and the reference point displacement are not finely deducted. The next step will involve algorithmic enhancements to minimize differences among similar methods, thereby enhancing the reliability of monitoring results, which will provide robust support for dam monitoring and early warning.
5. Conclusions
To mitigate the potential dam breach risk of Lake Sarez and provide scientific support for its risk assessment, a collaborative effort between China and Tajikistan research institutions has led to the development of the Usoi Dam BDS/GPS Deformation Monitoring System. The joint team successfully established a total of one base site and seven sites in two batches during the years 2021 and 2022. These sites conducted continuous and round-the-clock monitoring of the dam, utilizing three positioning methods: baseline network solution, PPP, and RTK positioning for processing and analyzing the monitoring data. The calculation results reveal that, in the horizontal direction, the displacement of sites USY03, USY07, USY08, USY09, USY11, and USY12 towards the center of the lake, and the vertical direction of each site exhibits a gradual and slow subsidence pattern, potentially due to the gradual collapse of soil and rock towards the center of the lake. In terms of cumulative displacement, the horizontal accumulative displacement of USY07, USY08, USY09, and USY12 exceeds 20 mm. Furthermore, the earthquake that occurred in February 2023 also induced seismic deformation of 20 mm at various sites of the dam, emphasizing the need for increased attention to these significantly displaced sites and seismic events.
To enhance the deformation monitoring of the dam, several measures can be considered for implementation in the future. Firstly, for sites exhibiting significant cumulative displacement and monthly deformation rates exceeding 10 mm per month, an increase in the frequency of PPP solutions is necessary to promptly grasp the changing trends in absolute deformation. Secondly, the placement of new sites at locations farther from the shoreline can be contemplated to obtain a more comprehensive dataset on deformation, facilitating a better understanding of geological changes in the vicinity of the lake. Thirdly, a comprehensive analysis of deformation information from various sources, such as hydrological, geological, and geomorphological data, should be conducted at the sites. This holistic approach will aid in accurately determining the causes and developmental patterns of deformation, enabling the timely implementation of appropriate prevention and remediation measures.


 ,
, 


