
Formation and Hazard Analysis of Landslide Damming Based on Multi-Source Remote Sensing Data
by
 ,
,
Wei Shi
1,2,3,4,
Guan Chen
1,3,4,*,
Xingmin Meng
1,3,4,
Shiqiang Bian
1,2,3,4,
Jiacheng Jin
1,3,4,
Jie Wu
1,3,4,
Fengchun Huang
1,3,4 and
Yan Chong
1,2,3,4 1
MOE Key Laboratory of Westen China’s Environmental Systems, School of Earth Sciences, Lanzhou University, Lanzhou 730000, China
2
College of Earth and Environmental Sciences, Lanzhou University, Lanzhou 730000, China
3
Gansu Geohazards Field Observation and Research Station, Lanzhou University, Lanzhou 730000, China
4
Technology & Innovation Centre for Environmental Geology and Geohazards Prevention, Lanzhou University, Lanzhou 730000, China
*
Author to whom correspondence should be addressed.
Remote Sens. 2023, 15(19), 4691; https://doi.org/10.3390/rs15194691
Submission received: 29 August 2023
/
Revised: 15 September 2023
/
Accepted: 22 September 2023
/
Published: 25 September 2023
(This article belongs to the Section Remote Sensing in Geology, Geomorphology and Hydrology)
Abstract
:Remote sensing plays an increasingly important role in the investigation of natural hazards, not only by obtaining specific data related to hazards, but also by realizing targeted research by combining with other data and/or technologies. Small-scale landslide hazard chain events occur frequently in mountainous areas with fragile geological environments and have strong destructive effects, yet have been somewhat understudied. This paper analyzes the Zhoujiaba (ZJB) landslide hazard chain that occurred in Longnan City on 18 August 2020. On the basis of the comprehensive application of multi-source remote sensing data, combined with time-series InSAR technology, electrical resistivity tomography (ERT), and numerical simulations, we studied the formation mechanism, damming characteristics, and potential outburst scenarios of this event. Our research suggests that geological structure and strong natural weathering are the preconditions for landslide development, which is eventually induced by extreme rainfall. Specific topographic conditions determine the rapid sliding and accumulation of landslide materials, and ultimately result in river damming. Our simulation results showed that a flood, rather than a debris flow, will be the result of dam outburst. When the simulated upstream inflow is 1.5 times that when the landslide occurred, 68% of the downstream village area will be flooded. The artificial spillway can effectively reduce the scale of the potential outburst flood, but there remains a risk of dam failure owing to the shallow depth. Our study of the hazard chain of a small-scale landslide using a combination of methods will provide a valuable reference for the analysis and treatment of similar hazard chains.
1. Introduction
On 18 August 2020, after extreme rainfall of 107.6 mm/d, a rapid high-position landslide occurred in Zhoujiaba Town, Longnan City, in Western China (33°32′10″N, 105°28′56″E). The landslide slid rapidly to the slope bottom along the tectonic fracture trough, which was formed by the erosion of the structural joint, and then accumulated in the riverbed to form a dam, and completely blocked the river to form a barrier lake. The landslide volume was about 1.97 × 10⁶ m3, and the area of the barrier lake was about 9.3 × 10⁴ m2. Some farmland, roads, and houses were submerged. Fortunately, there were no casualties. This research analyzes the formation mechanism and potential risks of this landslide hazard chain.
A landslide hazard chain refers to a cascade of geological hazards in which landslides induced by rainfall or earthquakes block river channels, form barrier lakes, and provide a potential risk of dam rupture. Such chains often occur on and around the Tibetan Plateau; they not only cause damage directly, but also create potential danger for downstream communities [1,2]. Compared with a single hazard, a hazard chain has an evident cascade effect (i.e., material and energy are transferred step by step), often causing greater damage [3,4,5,6,7,8]. Such geohazard chains occur frequently in mountainous areas around the world, especially in the surrounding areas of the Tibetan Plateau, and often cause catastrophic consequences [9,10,11]. For example, the Yigong Landslide damming event in Chinese Tibet in April 2000 [12,13], the Xinmo catastrophic landslide damming event in Sichuan in June 2017 [14,15], the Baige landslide damming event in Tibet in October 2018 [2,16], and the Yahuokou landslide event in Gansu in July 2019 [17,18], all caused substantial damage to property or a large number of casualties. These were large-scale and influential events, which have received extensive attention and have been properly researched. However, relatively small-scale landslide hazard chains have a higher frequency of occurrence; despite causing specific damage and posing substantial potential threats, they have received relatively little attention within the scientific community.
The superposition of different disasters in the hazard chain prolongs the duration of hazards, expands the scope of impact, and enhances the destructive capacity, leading to a geometric increase in the scale and severity of disasters [19,20,21,22]. The study of landslide disaster chains includes the analysis of landslide-inducing mechanisms, movement characteristics, energy transformation, morphological characteristics, and material composition of the landslide dam. These studies also include discussions on the inundation range, backwater characteristics, and collapse risk of barrier lakes [2,23,24,25]. However, limitations caused by a lack of basic data mean that many studies analyze different disasters separately, and the interaction between different disasters remains unclear. Fortunately, new observation and measurement technologies are developing rapidly, and field investigations of geological disasters are gradually becoming more systematic [4,26]. Scholars can obtain rich data related to disasters through high-resolution remote sensing images, advanced unmanned aerial vehicles (UAVs), LiDAR, InSAR, and geophysical measurements such as ground penetrating radar and ERT [27,28,29,30].
Numerical simulation technology can quantitatively reproduce or invert the formation and evolution process of geological hazards, and predict the potential threat [2,8,31,32,33,34]. Many numerical models have been developed and applied to understand landslides. These models are mainly divided into continuum models and discontinuum models. The continuum models simulate mass movement from a macro perspective using Navier–Stokes equations [35]. Discontinuum models treat the mass flow as a collection of particles, meaning they can simulate both the macroscopic material movement and changes in energy dissipation in the block interaction, but have a higher time cost [36,37]. Engineers have developed simulation platforms such as MatDEN, PFC3D, Massflow, and Flow3D based on these models [38,39,40,41]. Although the reliability of these simulation methods has been verified to varying degrees, there are still some major limitations in general, such as the single scenario applicable to geological hazards, harsh simulation conditions, or large uncertainty of some models.
This study takes the ZJB landslide hazard chain as a case study; we use remote sensing data, such as satellite imagery, UAV data, and radar data, combined with field investigations, ERT, and InSAR technology, to establish a comprehensive analysis system and analyze its formation process and evolution mechanism. We also inversely analyze the landslide using the open-source numerical simulation platform R.avaflow and investigate the potential risks of the hazard chain. This study provides a valuable reference for the study of similar landslide hazard chains and potential risk prediction.
2. Study Area
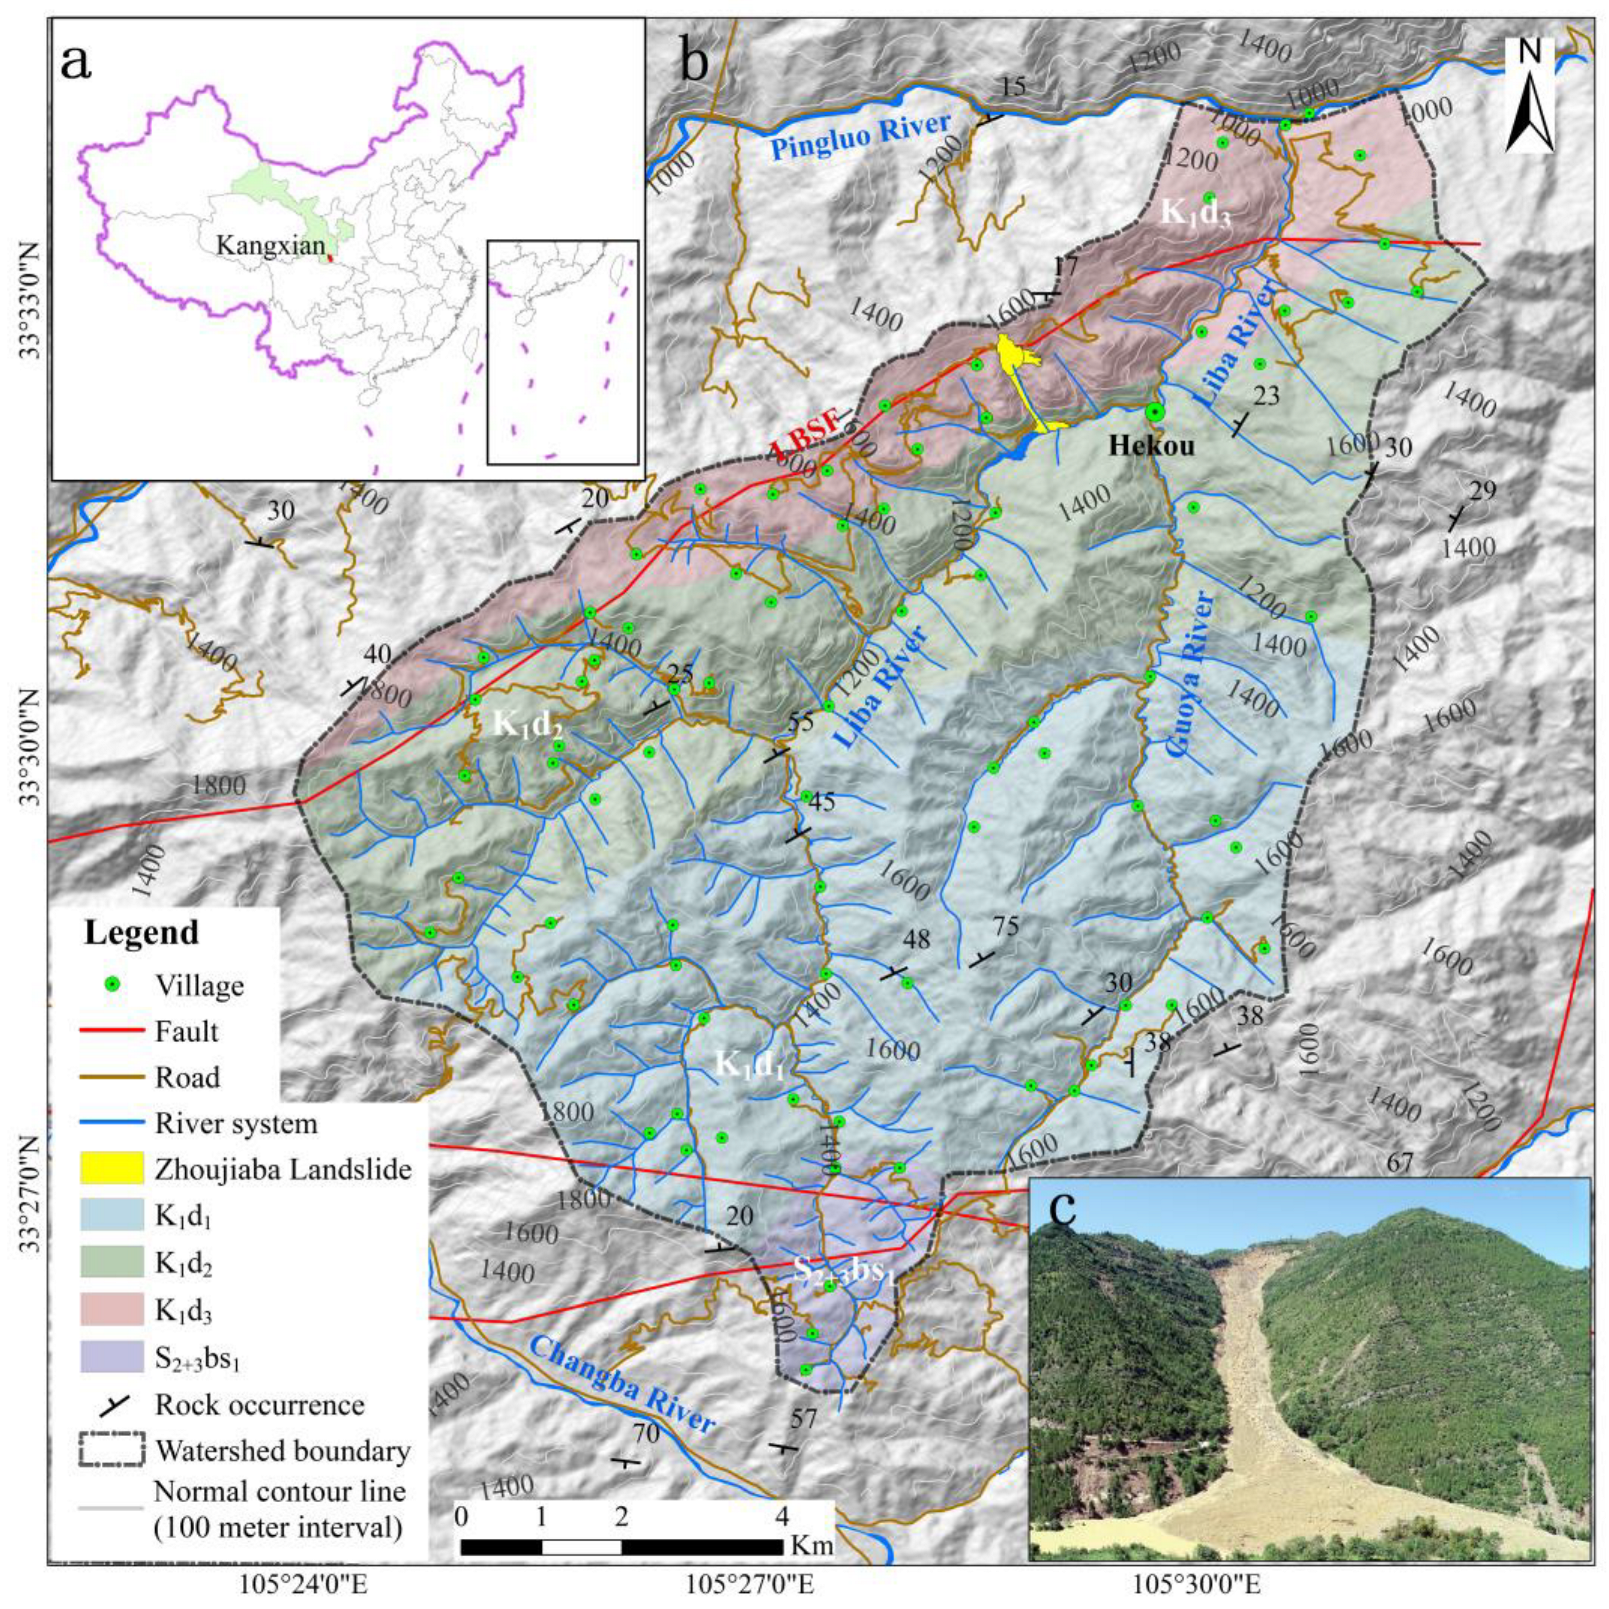
The ZJB landslide hazard chain occurred in the middle reaches of the Liba River, which is located in Longnan City in Northwest China. The basin is located at the intersection of the West Qinling Mountains and the eastern margin of the Tibetan Plateau, and the geology and geomorphology in the region are influenced by the Kunlun–Qinling tectonic fault and the South Qinling Caledonian fold belt. The average annual rainfall in the basin is 480.56 mm, of which the rainfall from May to September accounts for 76.6% and mostly falls during short-duration intense rainfall. The seismic activity is frequent, with a Ⅶ level intensity, and the seismic acceleration is between 0.2 and 0.4 g [42]. The terrain elevation difference of the Liba River basin is 1020 m, and the drainage area is about 85 km2. The water network is composed of rivers, and slope gullies are densely distributed in the basin, providing superior conditions for the confluence of surface runoff. The Liba River is narrow and tortuous, with a longitudinal slope of 29.4‰. Human activities are frequent in the basin, with numerous villages and roads widely distributed at different altitudes (Figure 1). Under the joint control of tectonic background, rainfall, and terrain, a large number of rock joints have developed in the study area, resulting in poor slope stability. Landslides often occur and block river channels, forming landslide hazard chains.
The strata in the study area are composed of the Lower Cretaceous Donghe sub-groups (K1d1, K1d2, and K1d3) and the lower lithologic section of the middle Upper Silurian Baishuijiang group (S2+3bs1) (Figure 1). The Cretaceous strata are mainly composed of purplish red conglomerate, glutenite, pebbly sandstone, sandstone, siltstone, and mudstone, mixed with thin layers of marlstone. These lithologies belong to the piedmont accumulation of inland basins, with the sedimentary characteristics of coarse to fine particles from bottom to top. The mechanical properties of the Silurian strata are poor, mainly including carbon phyllite, carbon slate mixed with metamorphic siltstone, and calcareous sandstone. Influenced by the Liba River small fault (LBSF) and the seismic activities of the adjacent areas, a series of joints and cracks developed in the hillslope, which led to the reduction in the structure integrity and shear strength of the rock mass. Therefore, landslides are extremely frequent in this area, and landslide deposition can easily block rivers and cause the formation of barrier lakes.
3. Materials and Methods
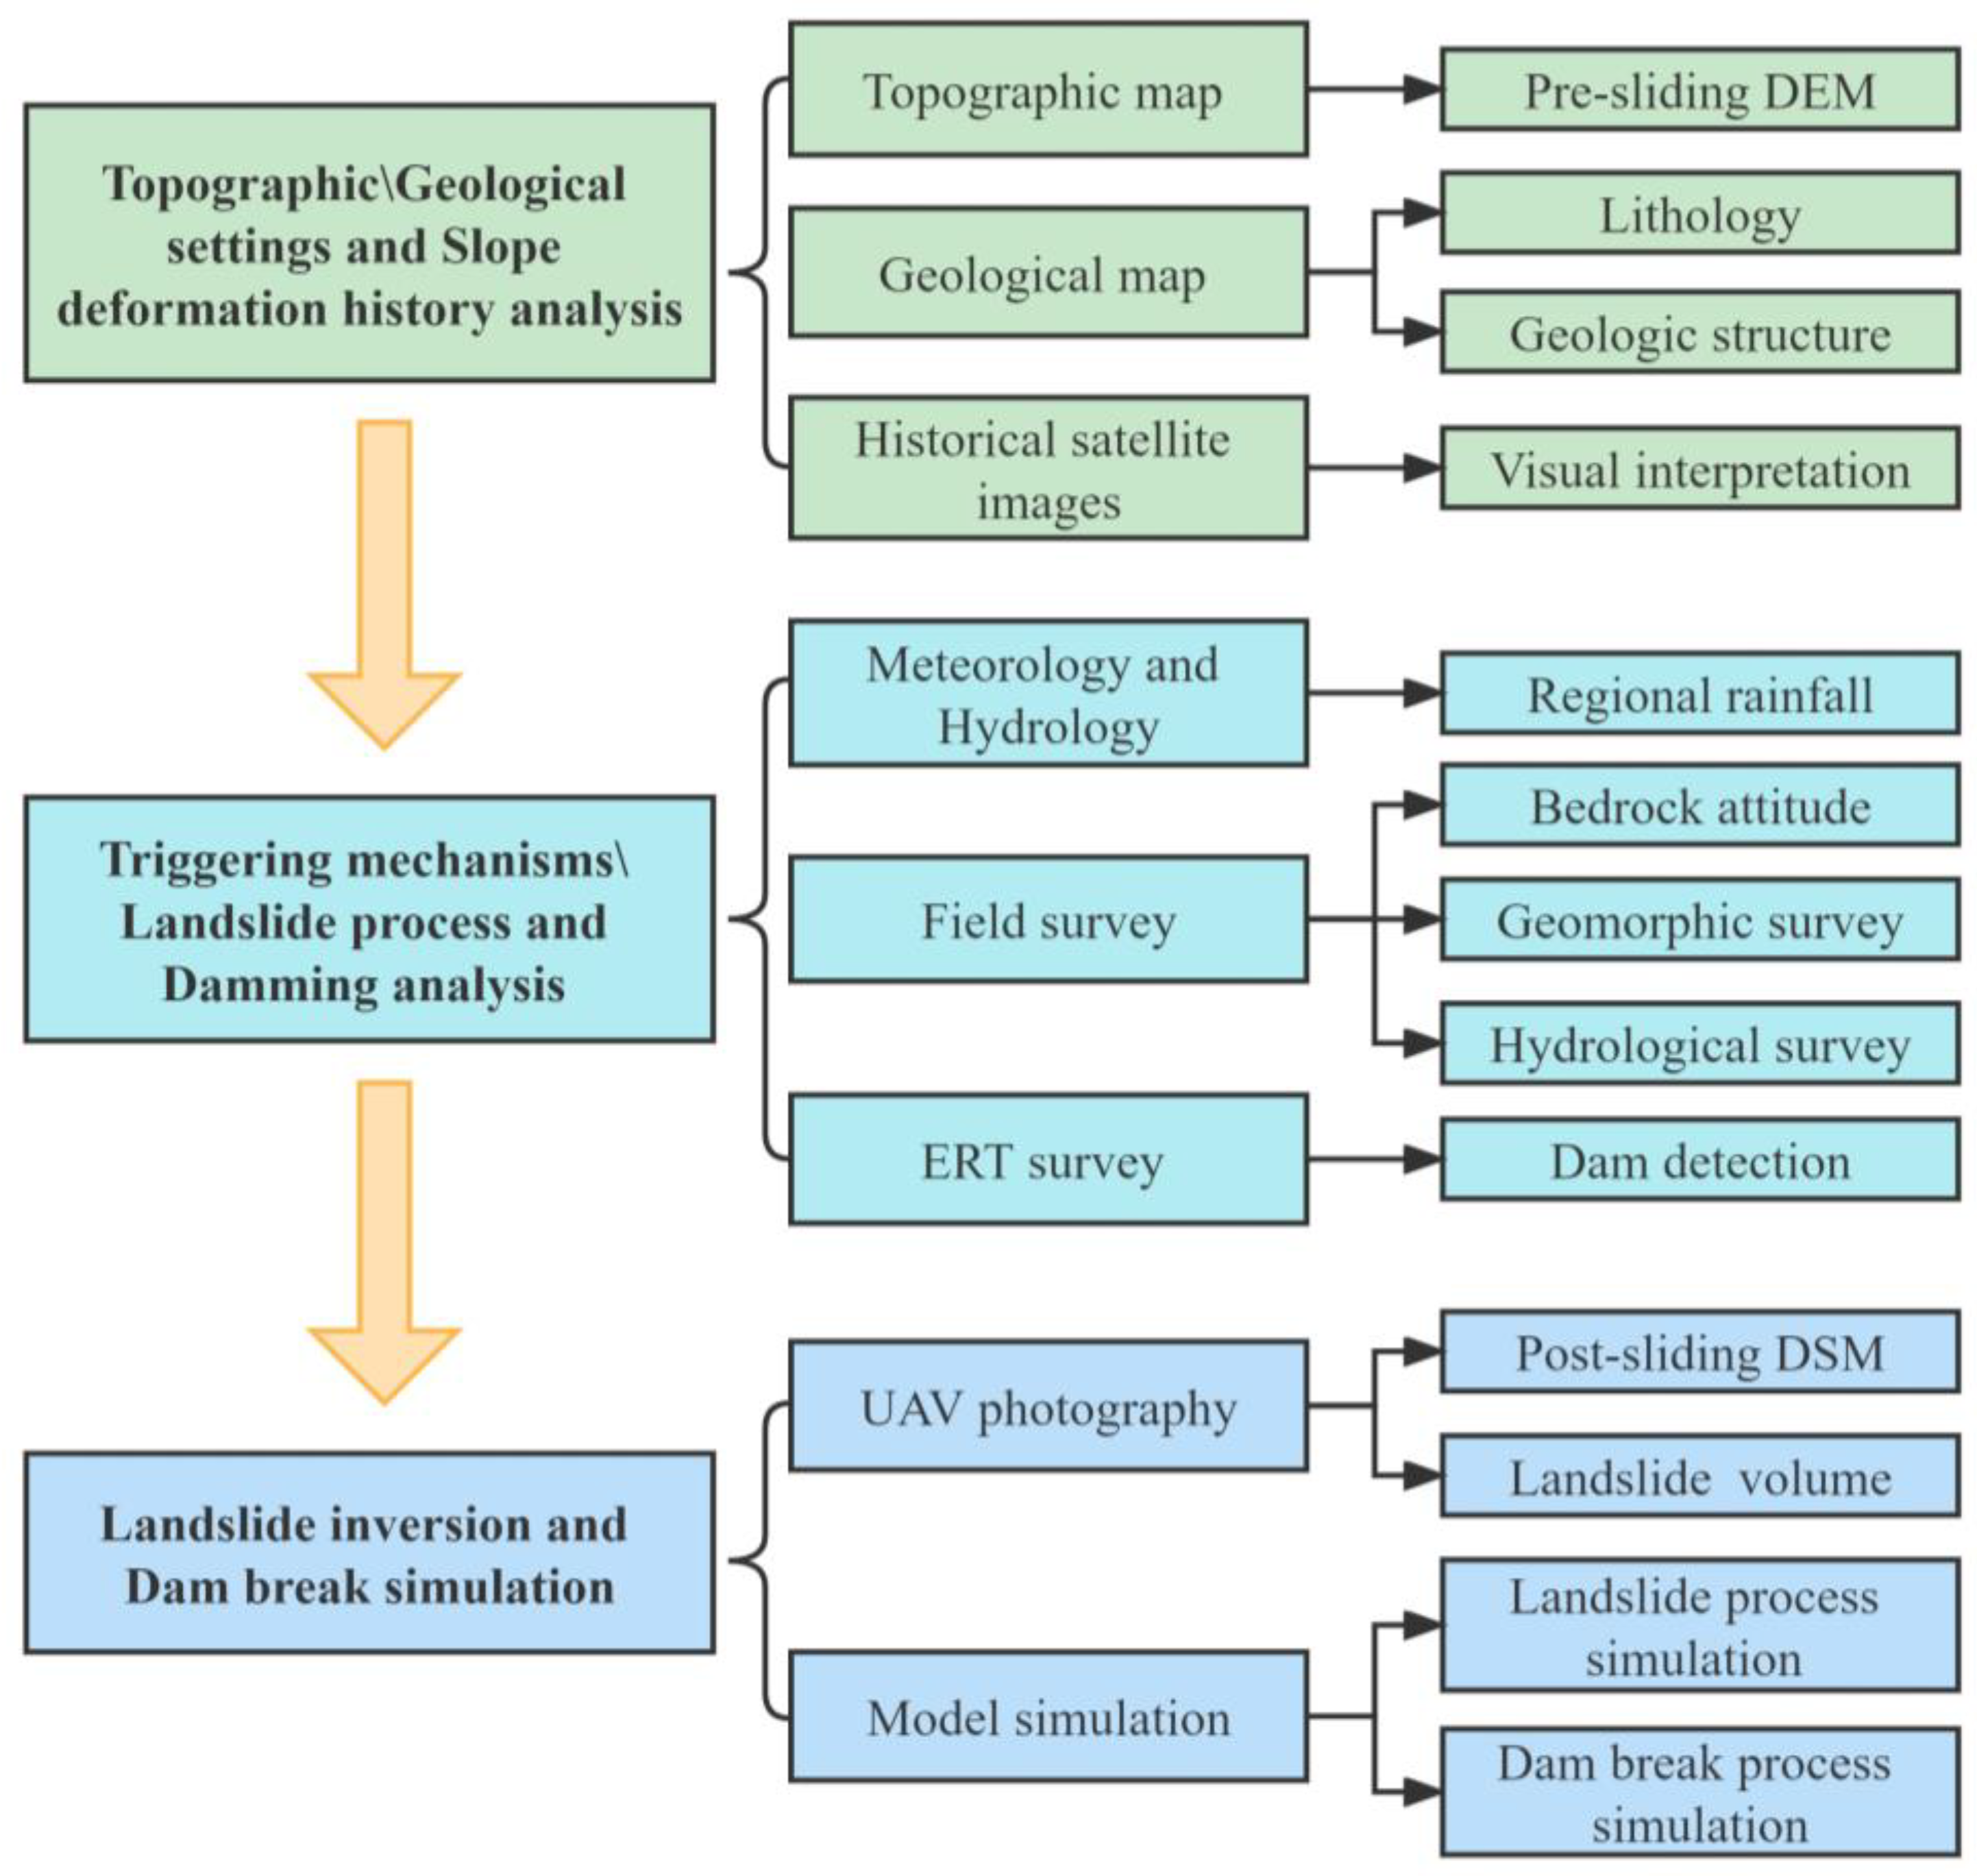
This study collected data related to the ZJB landslide damming event from diverse sources, including geological background data, historical images, UAV, meteorological and hydrological data, and sentinel satellite radar data. In addition, soil samples were obtained to test basic physical parameters such as particle size distribution. These data enable us to conduct a more in-depth study of the ZJB landslide, including the historical deformation characteristics of slope, induction and evolution of the landslide hazard chain, and simulation of the landslide dam failure risk (Figure 2).
Geological data of the study region at a 1:100,000 scale were used to analyze the geological conditions of the landslide hazard chain. Four sets of high-definition Google Earth satellite data from before the landslide were selected to compare the local deformation characteristics of the slope in different periods and analyze its stability. In total, 110 views of Sentinel-1A ascending track data from March 2017 to December 2020 were used to analyze slope deformation trends. We also acquired information about the depth of the landslide dam from ERT equipment and then analyzed the distribution of the stratum by calculating the resistivity value [43,44]. The equipment selected was the SuperSting Swift Automatic Resistivity and IP System (SuperSting R8/IP) geo-resistivity measurement system developed by AGI, Houston, TX, USA. For inversion of the apparent resistivity data, we used the EarthImager 2D (version 2.4.0) software that accompanies the geo-resistivity acquisition instrument. The root mean square (RMS) value of the data error (i.e., the difference between the data and the updated model response) was used to assess the endpoint of the inversion; the inversion was terminated when the RMS difference was less than 5%. The geophysical profile obtained from field measurements was used for the internal structure and stability analysis of the landslide dam (Table 1).
To further study the dynamic characteristics of the ZJB event, the R.avaflow simulation platform was selected to simulate the landslide and dam burst process under different scenarios. This model has excellent performance in cascade mass flow simulation, and has been widely verified and applied worldwide [45,46,47,48,49,50,51]. The model is mainly based on DEM data before the landslide, as well as the data on material release height and spatial distribution grids [45]. We collected the orthophoto images of the slope and the river after the landslide using a UAV. Combined with ground control points, DOM and DEM data with a resolution of 0.35 m were obtained by extracting high-density point clouds. The DEM data before the landslide was from the Alos satellite with a resolution of 12.5 m. Considering the loss of elevation accuracy, the resolution of DEM data before and after landslide was resampled to 5 m by the bilinear interpolation method, and spatial correction was carried out by the first-order polynomial method to simplify the calculation of landslide volume and subsequent simulation process. The landslide thickness was calculated by the terrain difference before and after the landslide [52]. In addition, the ring knife method was used to determine the density of landslide samples, with reference to American Society of Testing Materials (ASTM) standards [53]. The particle size of the materials at the top, front edge, and toe of the accumulation dam was analyzed with a screening method to obtain the median particle size of fine particles (D50 = 3 mm). The above data provide reliable support for numerical simulations of the landslide hazard chain.
4. Results
4.1. Characteristics of the ZJB Landslide Hazard Chain Breeding and Evolution
4.1.1. Deformation History of the Landslide
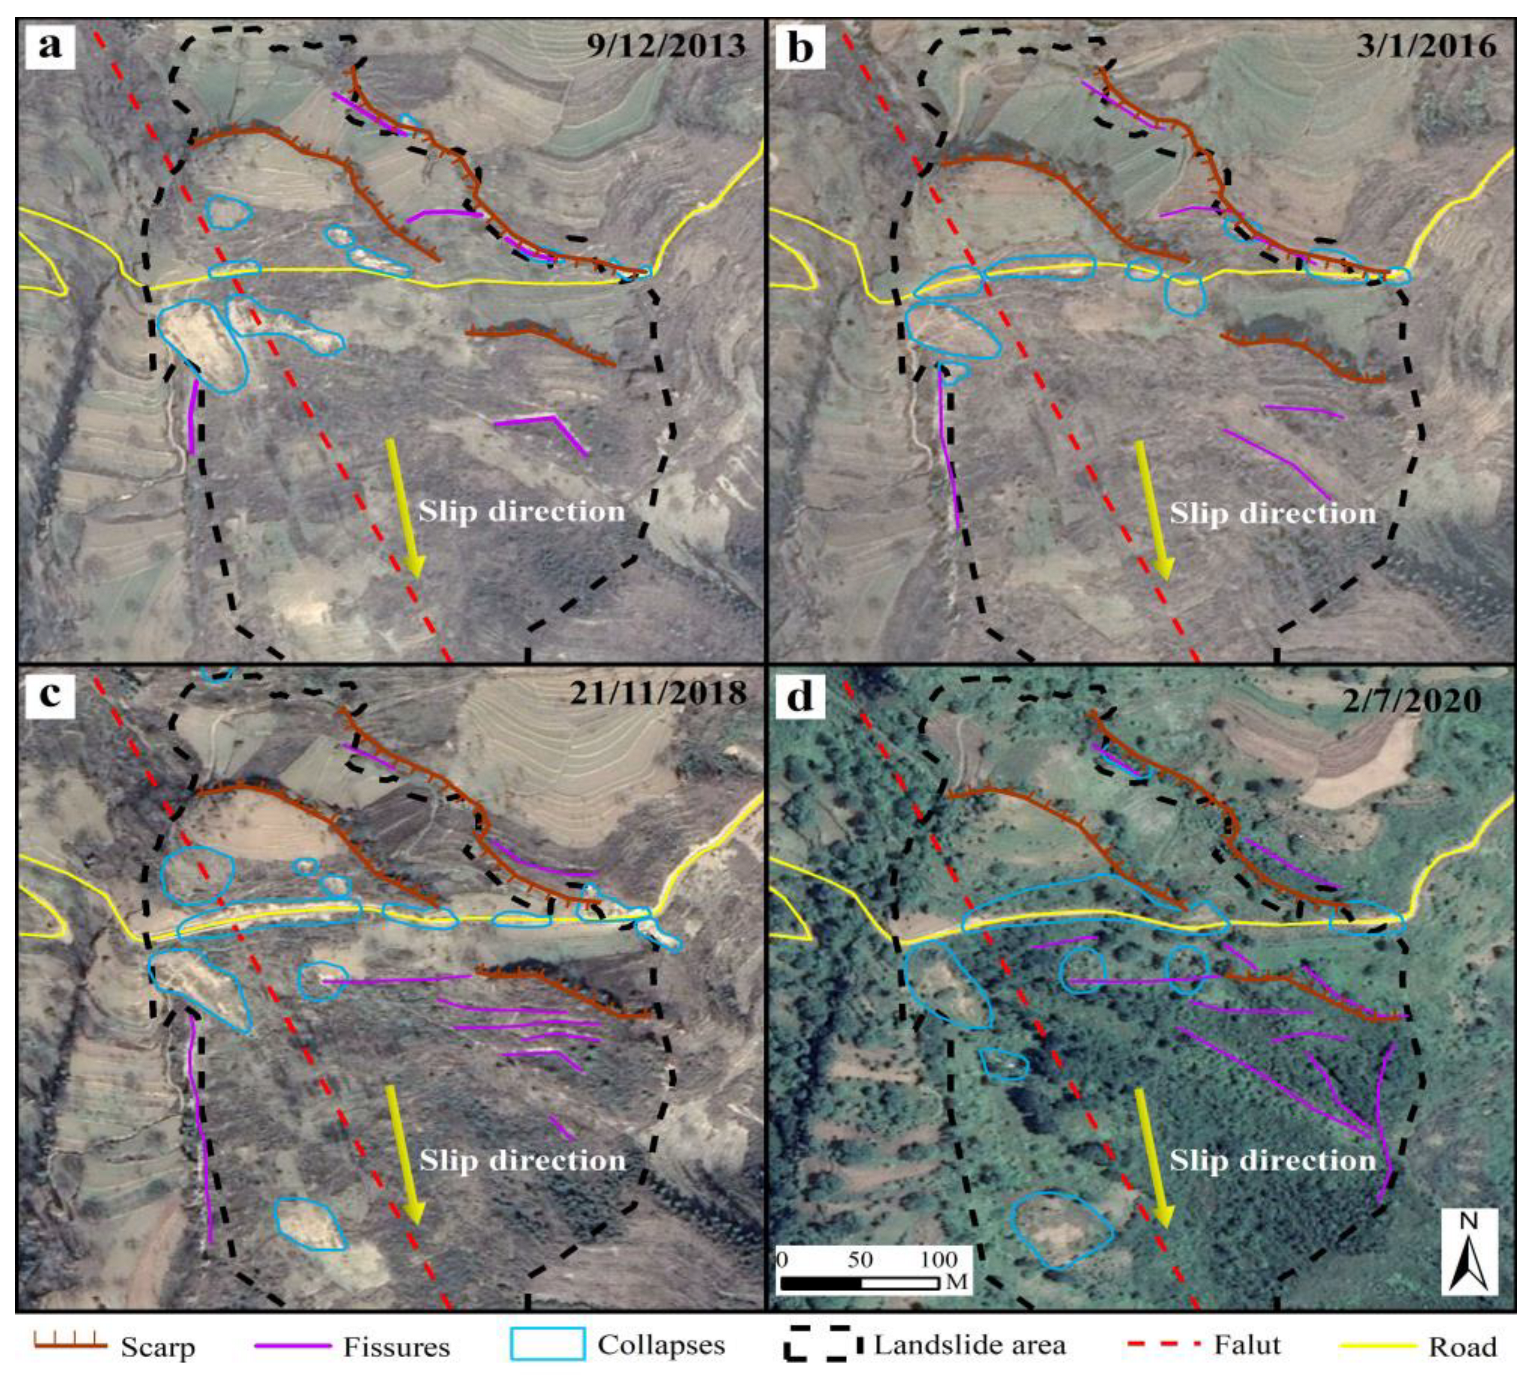
Early failure of slope structure is the premise of a landslide and is usually manifested as scarps, fissures, trenches, and partial collapse. Analysis of the evolution process of surface deformation is helpful in understanding the cause of a landslide. Therefore, we used satellite images from different periods before the landslide to analyze the early deformation characteristics of the ZJB landslide. This preliminary analysis showed that early deformation was concentrated in the landslide source area. In addition, we also used the InSAR method to analyze the slope surface deformation trend before and after the landslide (March 2017 to December 2020).
The optical remote sensing images show that on 9 December 2013, there were local collapses and fractures on the slope. The collapses were distributed in the steep area on the west side, and the fissures were distributed in the east along the 90°N or 138°N direction (Figure 3a). On 3 January 2016, the number of collapses and fissures did not change significantly. However, the collapses migrated to the middle of the slope, and the fissures extended (Figure 3b). On 21 November 2018, the slope deformation trend strengthened, the collapse areas expanded and correlated, and the fissures continued to expand (Figure 3c). On 2 July 2020, although the vegetation was relatively lush at this time and part of the deformation traces were covered, it could still be seen that the deformation trend of the slope was further enhanced. The collapses in the middle of the slope continued developing, and several collapses occurred under the road. Fissures on the east side continued to grow, and some new fractures appeared (Figure 3d). In addition, a tension groove with a width of 35–50 m and depth of 6–10 m formed along the top of the landslide as the material slid slowly over a long period of time. The above analysis and interpretation show that the slope materials had been in an unstable state for a long time. Local collapses and ground fissures were the main forms of deformation during the ZJB landslide. The formation and slow expansion of the tension groove also provide evidence of the continuous activity of material in the landslide source area.
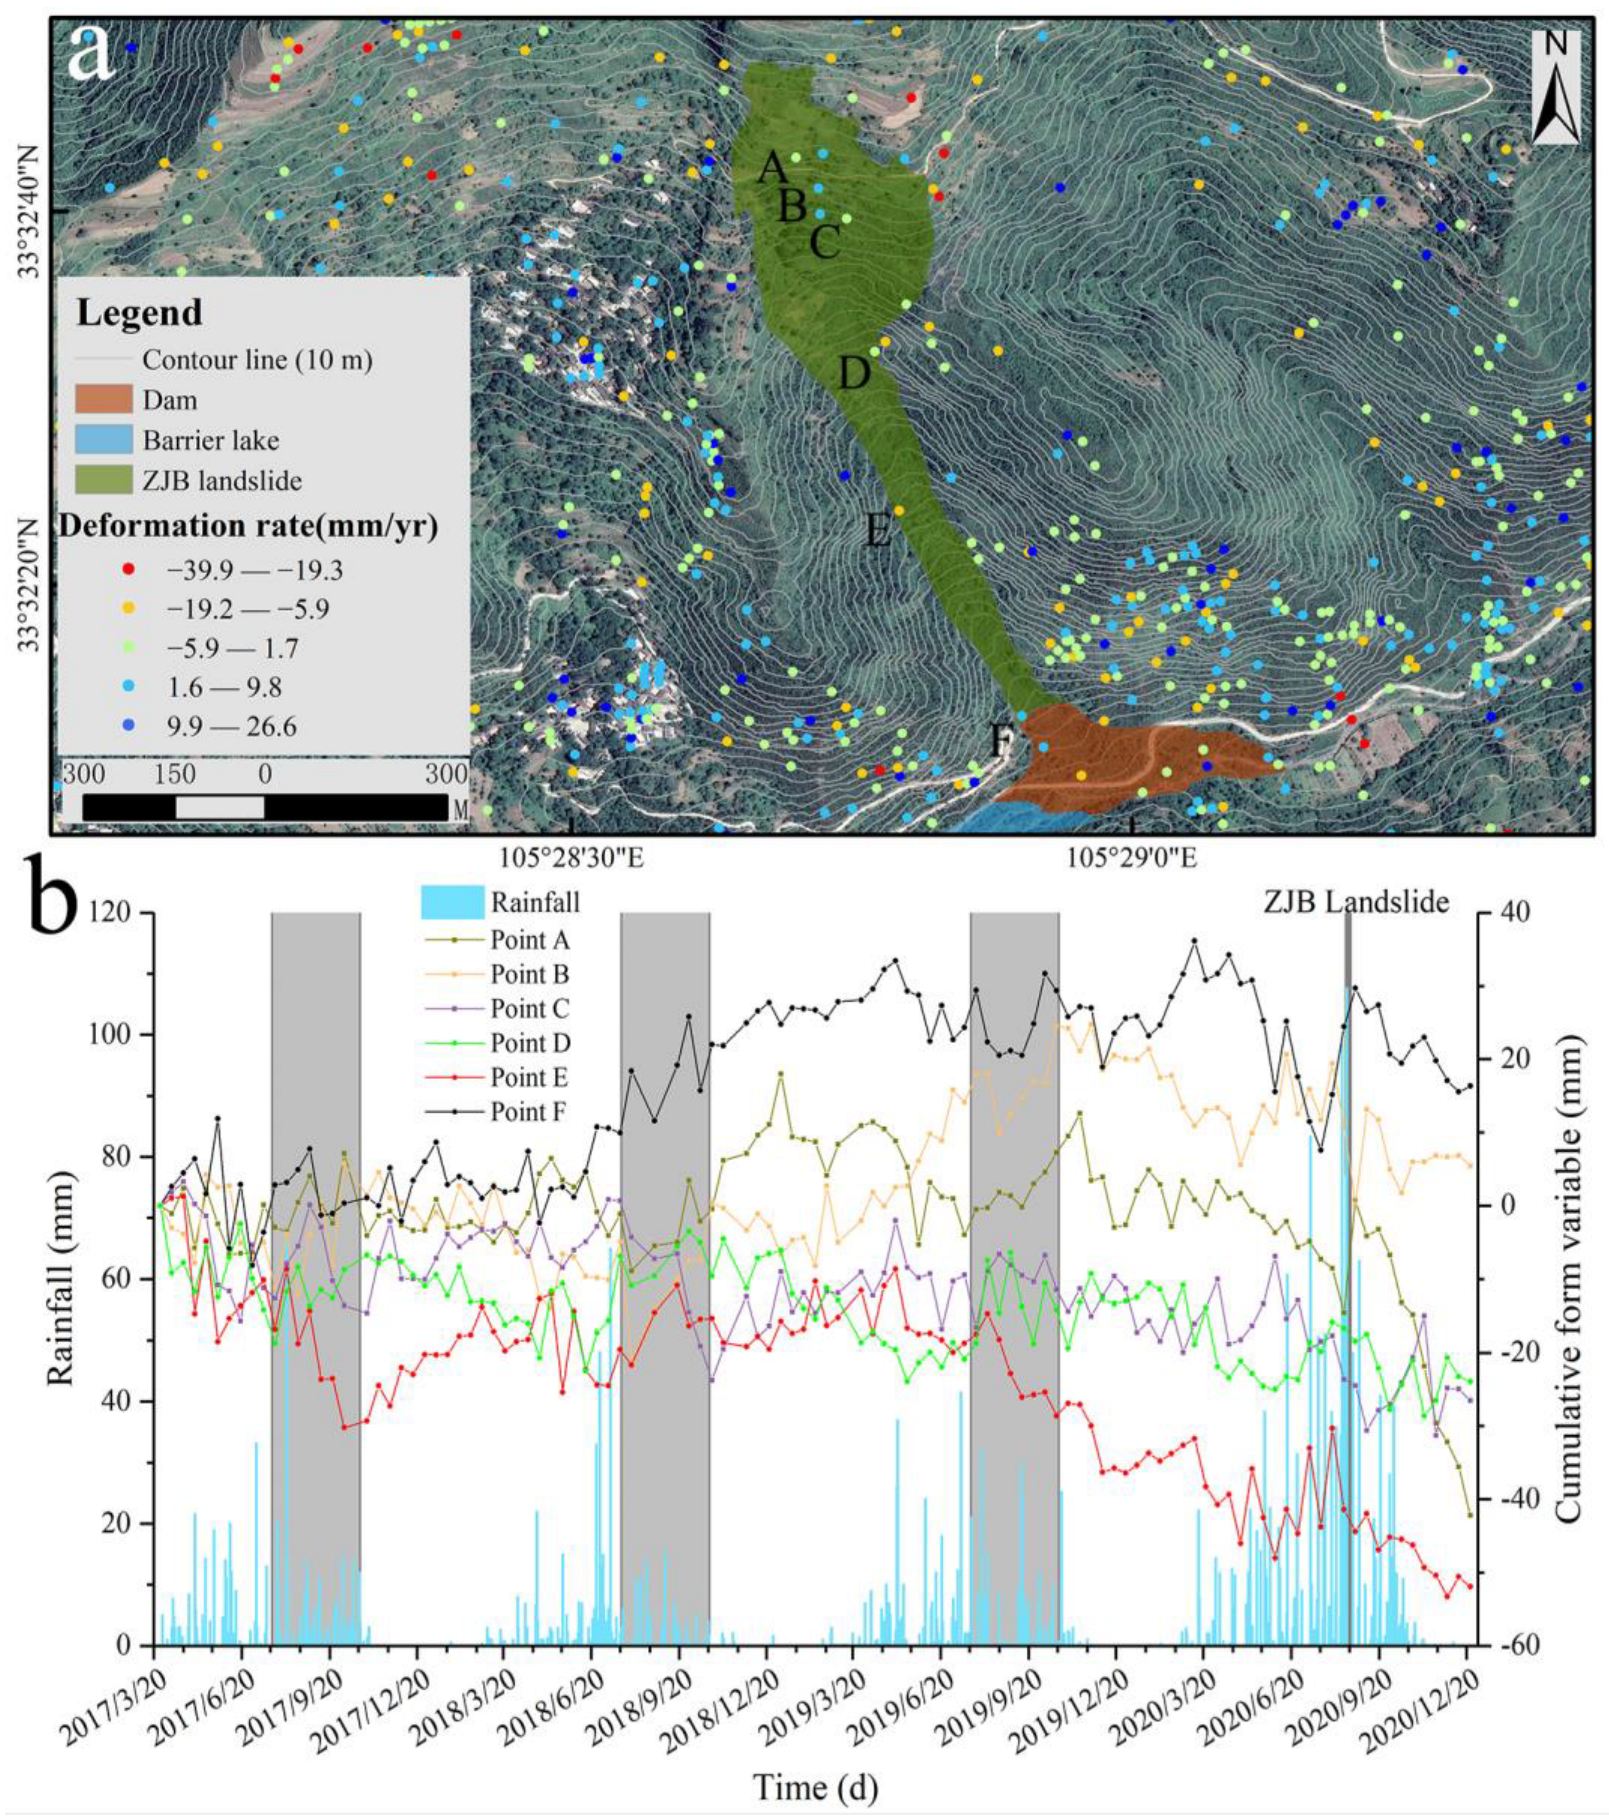
The InSAR results rendered using the natural discontinuity method show that, owing to the high vegetation coverage in the landslide area, few deformation points on the slope could be calculated. Seven interference points were extracted for deformation trend analysis, which were located to the upper right of each letter identifier in Figure 4a. We found that the deformation of the interference point located in the landslide source area was large, and the main deformation was falling; the deformation rate was largest before and after the ZJB landslide. The annual rainfall in the early rainy season was much greater than that in the late rainy season, but the deformation rate of the slope was greater in the late rainy season. Moreover, higher rainfall in the early rainy season equated to more severe deformation of the slope in the late rainy season (Figure 4b).
4.1.2. Characteristics of the Landslide Damming Hazard Chain
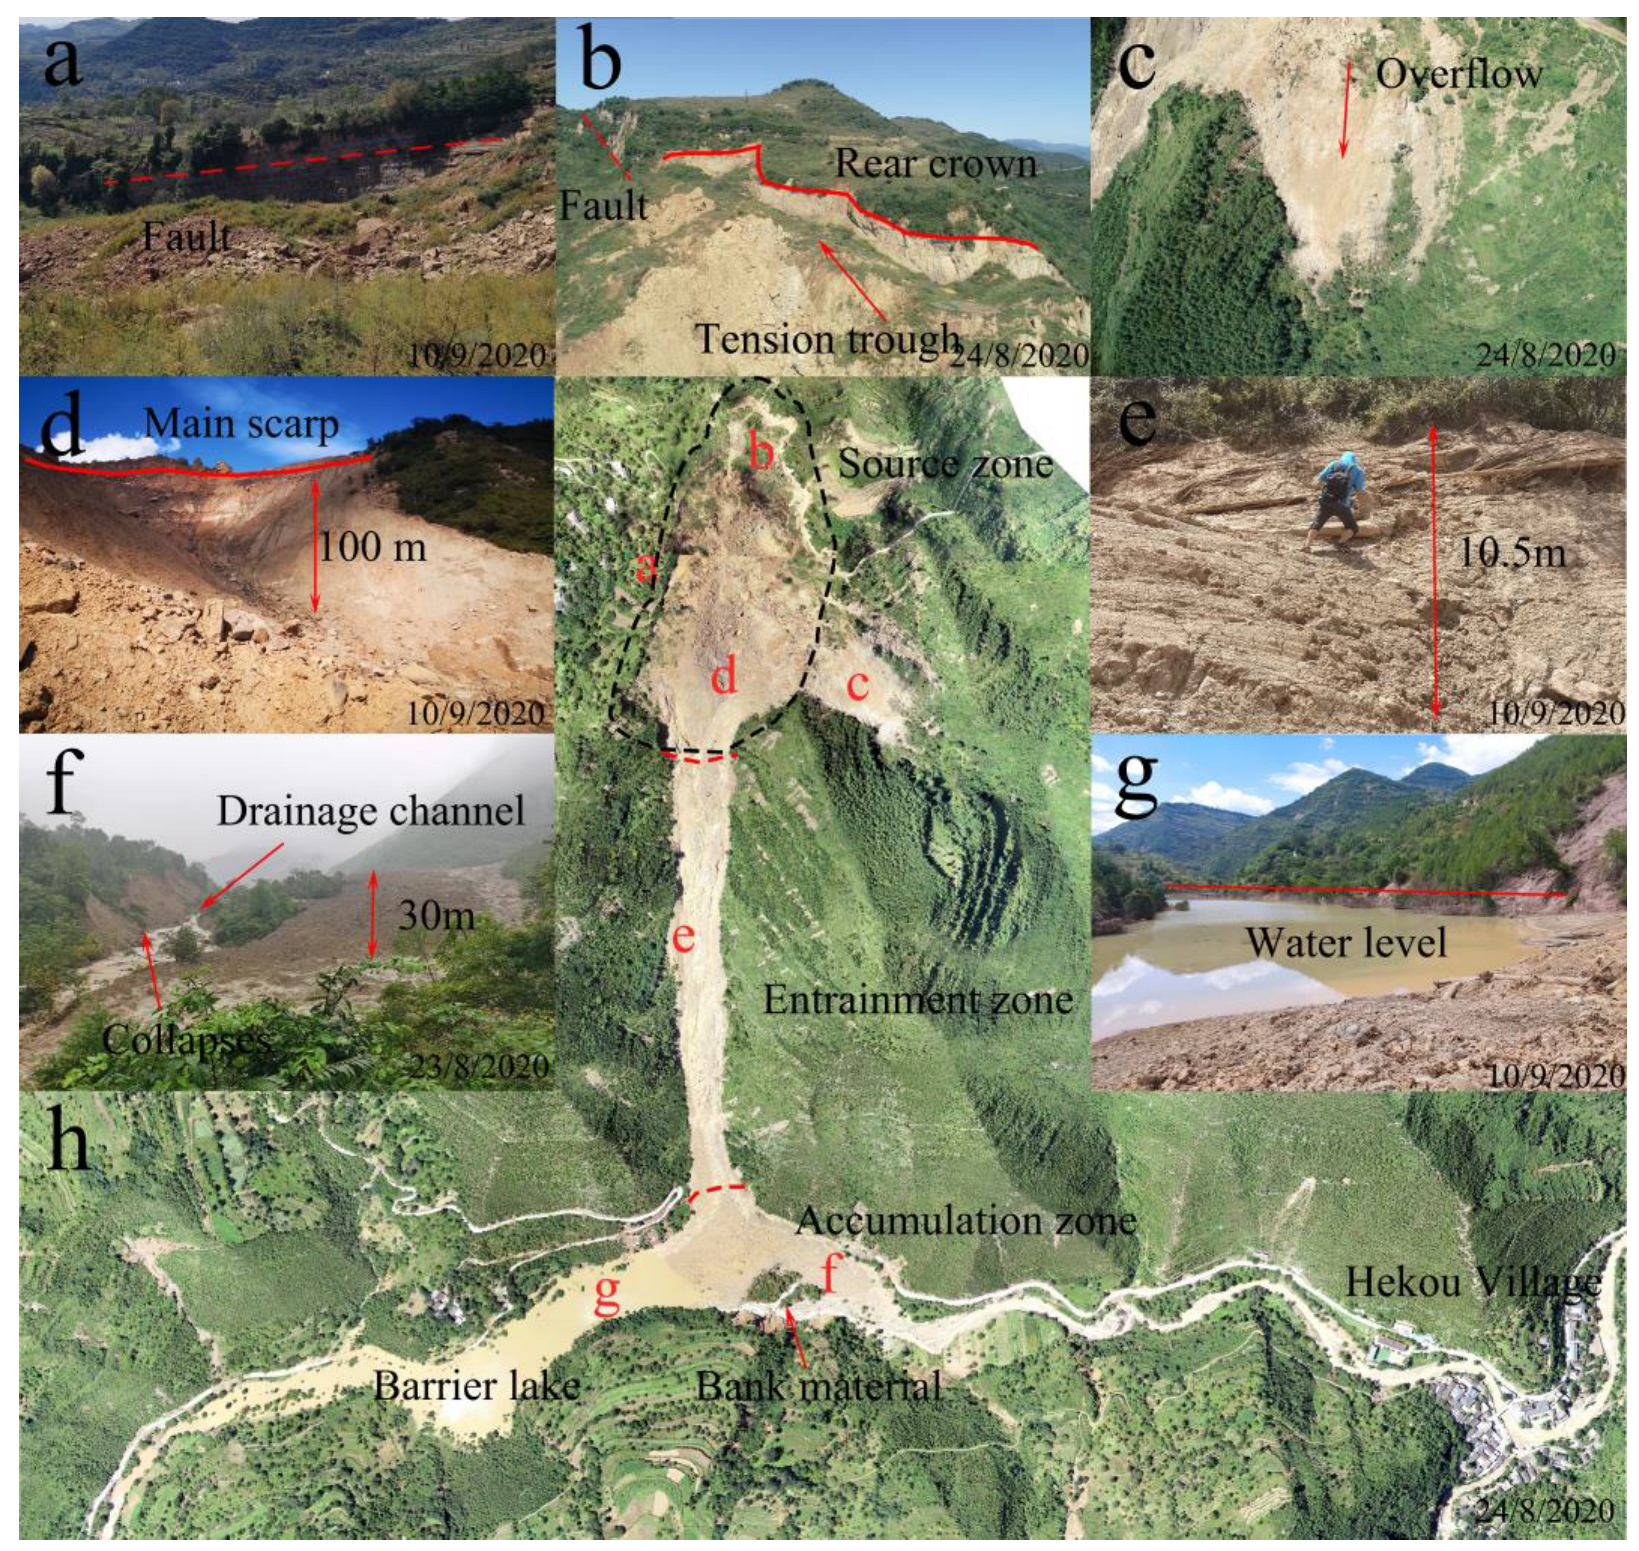
Previous studies have shown that the terrain and geological conditions have an important impact on the volume, movement speed, run-out distance, and accumulation characteristics of landslides [54,55,56]. The relative elevation difference of the slope where the ZJB landslide is located is 580 m. The top and bottom of the slope are flat with a gradient of about 14–23°, and the middle is steep with a gradient of 32–46°. The height difference between the landslide rear crown and the river was 512 m. During the landslide, sliding materials moved about 1200 m along the fault trough and reached the bottom of the valley, then blocked the river channel. According to the movement and accumulation characteristics of the landslide observed in the field, we divided the landslide area into source zone, entrainment zone and accumulation zone (Figure 5h).
In the source zone, the movement of the landslide consisted of two parts. First, the material slid a short distance of approximately 330 m along the direction of the fracture trough (Figure 5a) at a shallow angle of 20–24°, and then accumulated on a relatively flat area of fractured rock (FAFR). At this time, a rear crown (approximately 15–30 m high) formed at the top of the landslide, and part of the material overflowed from the right-hand side (Figure 5b,c). Immediately afterward, the FAFR collapsed violently owing to the sudden increase in weight caused by the accumulation and formed a steep cliff with a height of approximately 100 m and a slope of 40–70° (Figure 5d). In the entrainment zone, the landslide caused severe erosion of shallow material and left evident scraping and shovel marks at the boundary on both sides (Figure 5e). In the accumulation zone, the landslide covered and pushed part of the riparian material into the riverbed, forming a landslide dam with a length of 340 m, width of 145 m, and height of 12–25 m (Figure 5e). Then, as the rain continued, a barrier lake with an area of 9.3 × 10⁴ m2 was formed in the upstream area, and some houses, roads, and farmland were flooded (Figure 5g). Finally, on the side of the surface of the dam near the opposite bank, a shallow, narrow spillway was formed (Figure 5h).
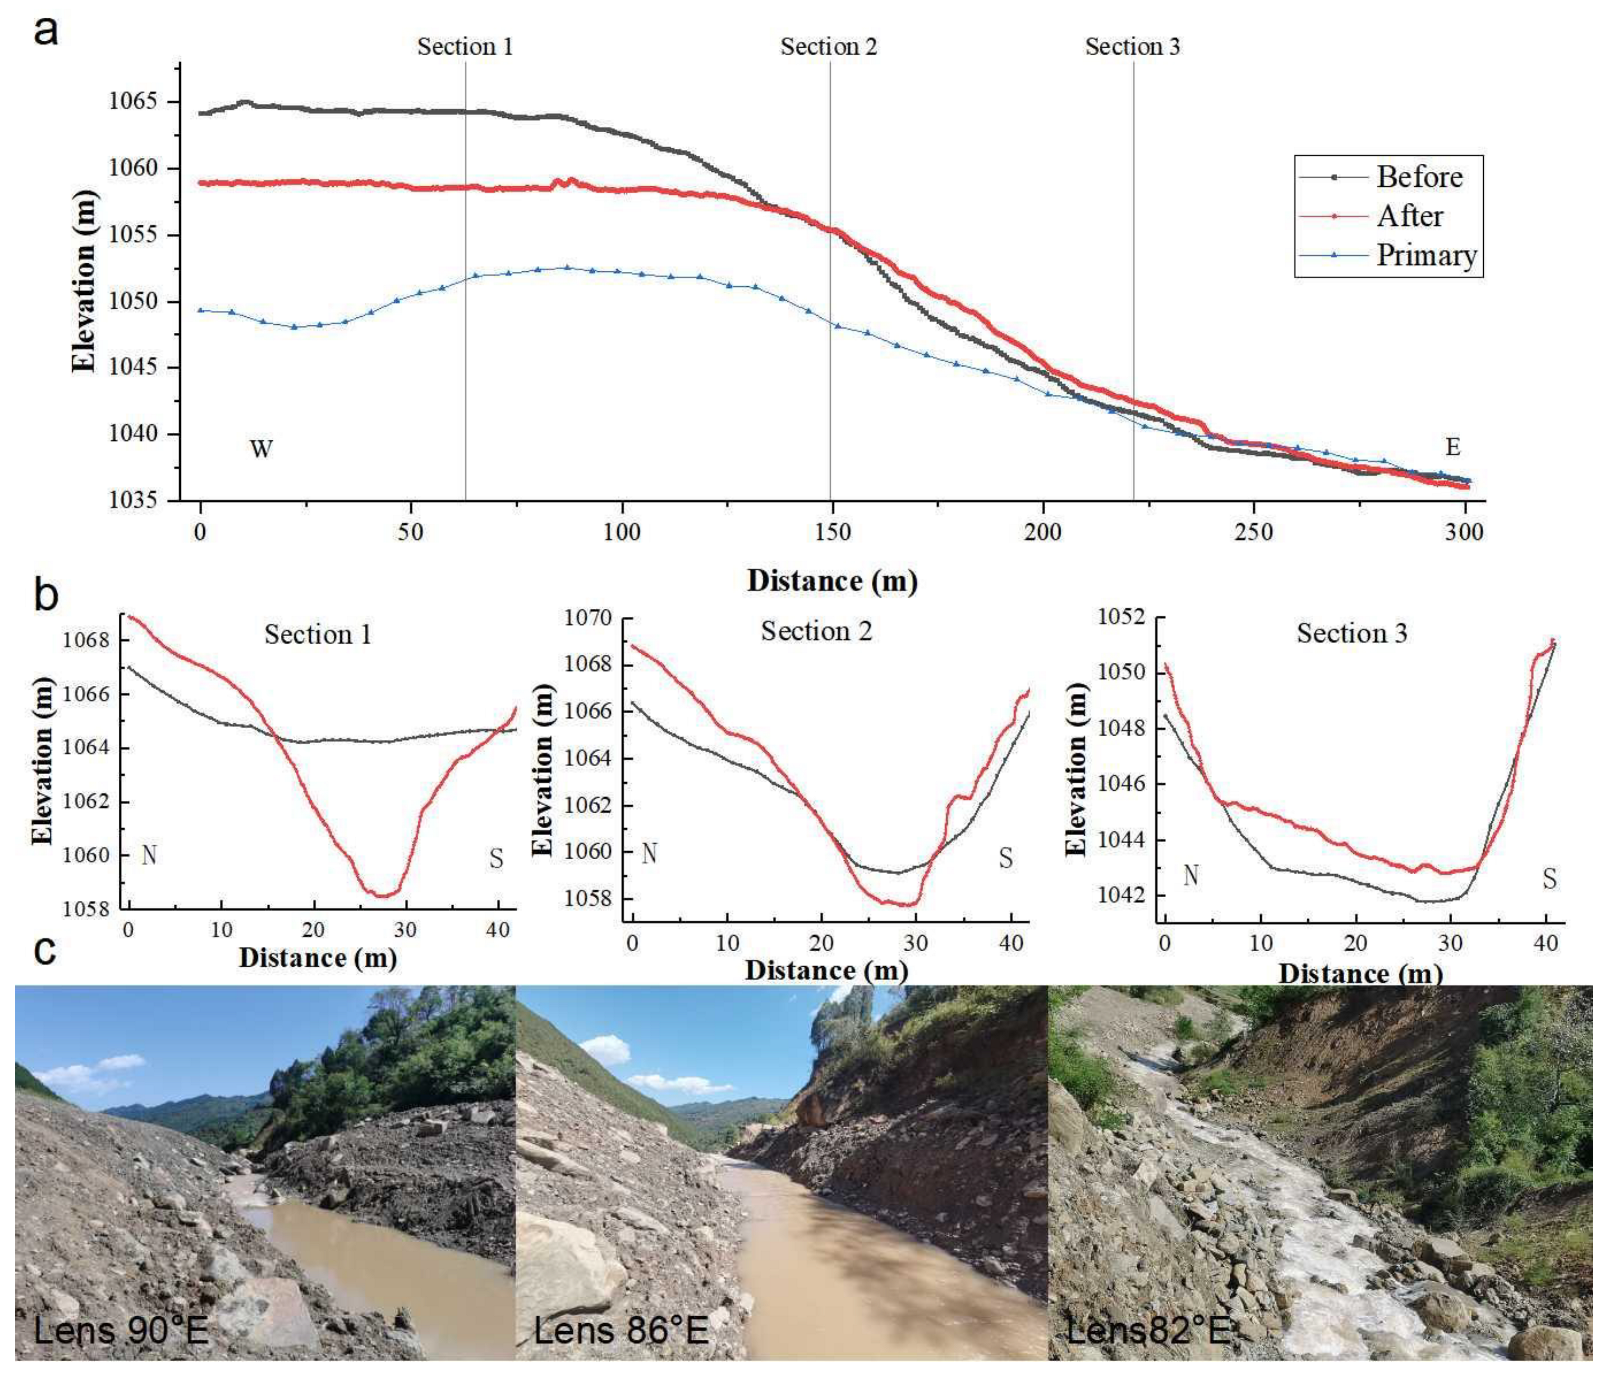
Considering the limited drainage capacity of the natural spillway, it was excavated by the local government after the rainy season. By comparing the topographic profiles before the landslide and before and after the artificial spillway excavation, it was shown that after the excavation of the flood channel, the water level of the barrier lake dropped by approximately 6.5 m, but the remaining water depth was approximately 10.5 m; thus, the risk of landslide dam failure was not completely eliminated (Figure 6a). Three sections were extracted along the channel; it can be observed that the channel excavation was mainly located in the upstream area near the barrier lake, and the depth of excavation was approximately 6 m. Only 1.6 m of natural erosion was excavated in the intermediate position; there was little excavation in the downstream area (Figure 6b,c).
4.2. Formation Mechanism of the Hazard Chain
4.2.1. Intrinsic Weak Geological Condition Analysis
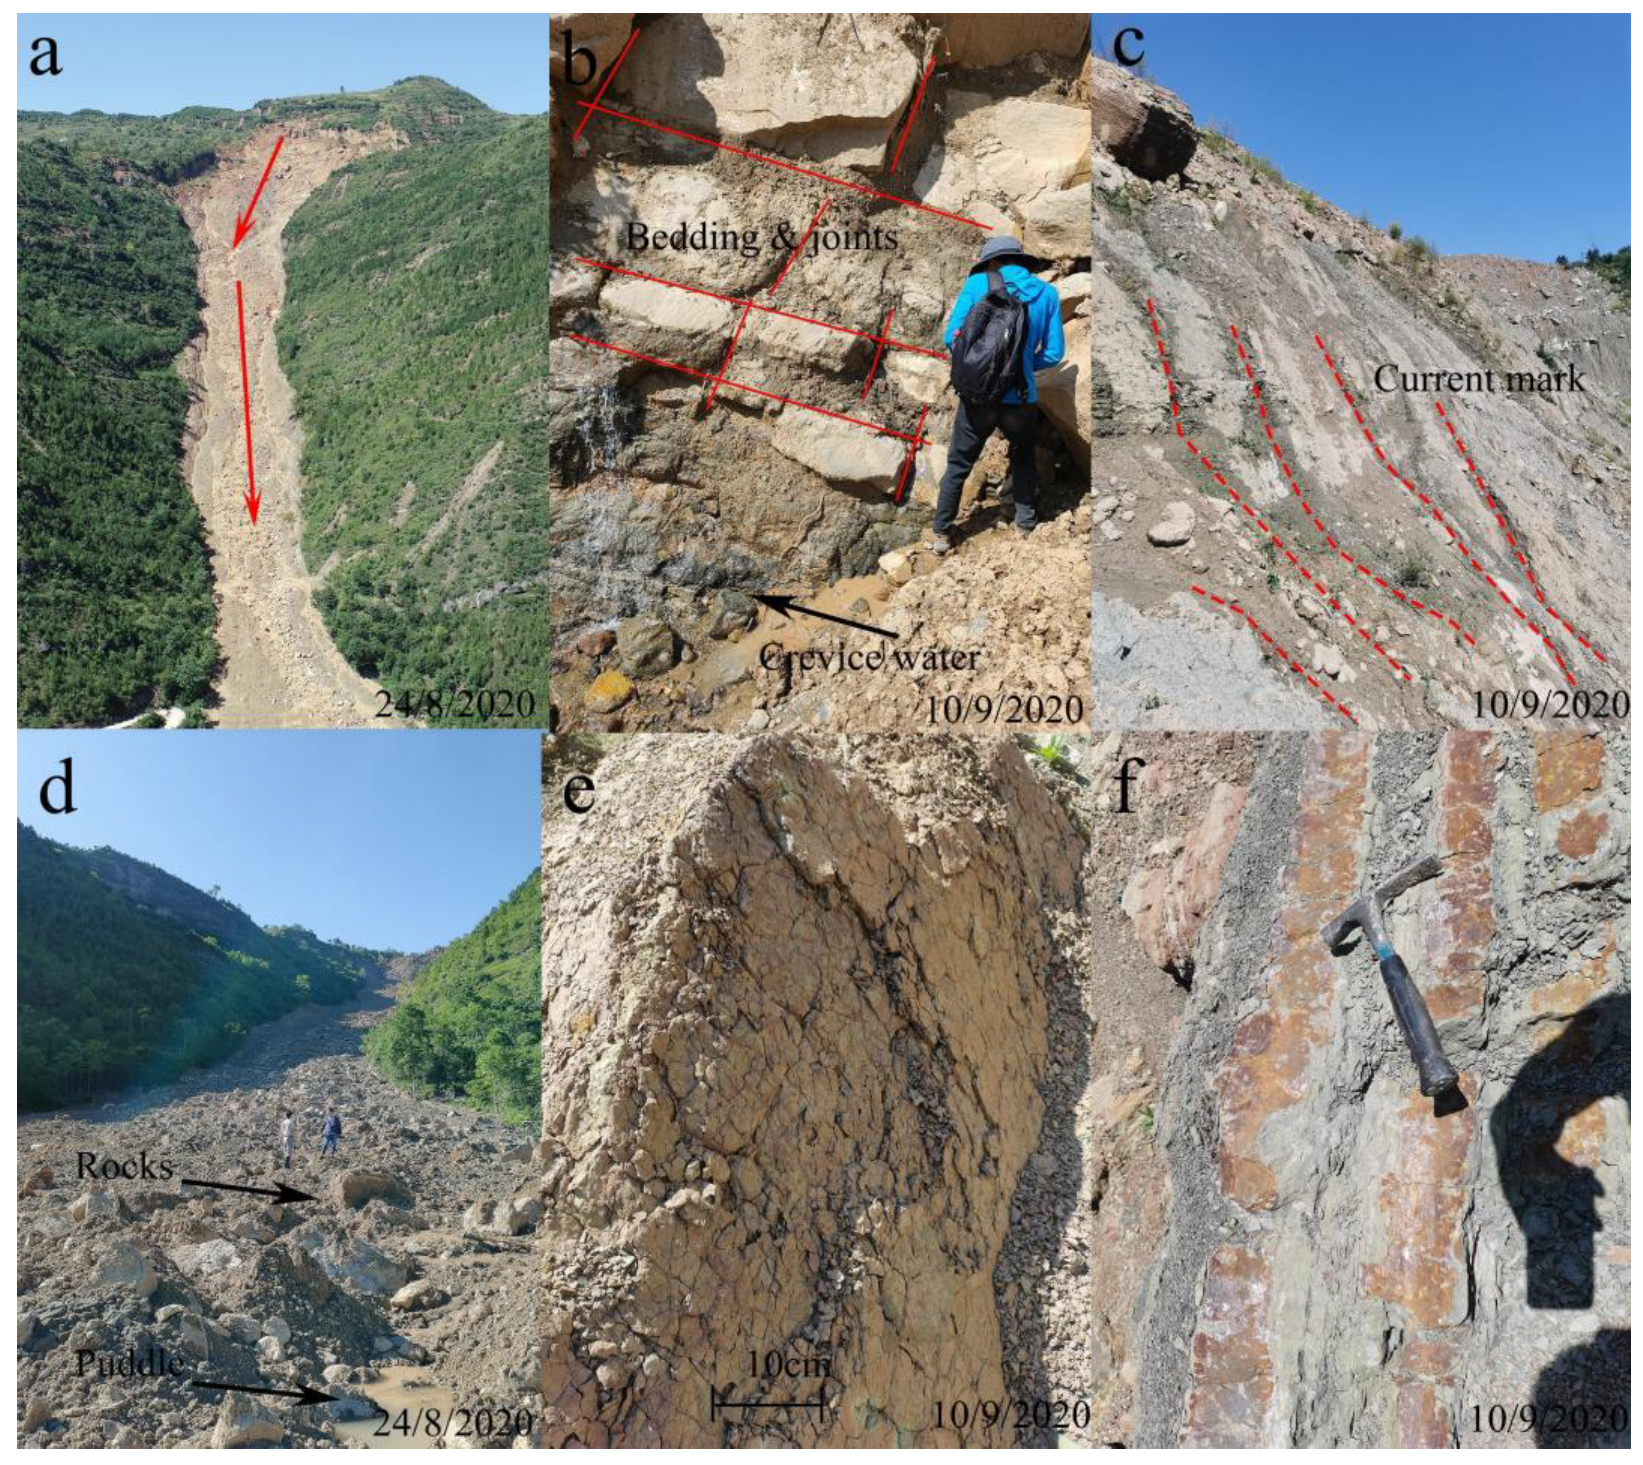
In the hazard chain of the ZJB landslide, rock damage caused by intense tectonic activity was the most important internal factor. The development location, scale, and movement direction of the ZJB landslide were controlled by the activity and strike of faults (Figure 7a). The LBSF passed through the source area of the landslide and controlled the formation and magnitude of the landslide. The fissures formed by tectonic activity also created favorable conditions for surface precipitation infiltration. There were two groups of major joints in the slope rock stratum that were affected by tectonic stress, a large amount of water was observed flowing out of these joints, and traces of running water were also observed on the walls of the formed cliffs (Figure 7b,c). The fractured rock formed by preceding tectonic activity becomes the main landslide material. In the accumulation area, the material composition was mainly sand with a grain size of <8 mm, conglomerate or sandstone with a diameter of 0.4–3.5 m, and densely scattered rock blocks (Figure 7d). In addition, intense weathering also affected the fragmentation of the landslide material and led to dense fissures and a loose internal structure (Figure 7e,f). This strongly weathered rock mass further disintegrated into smaller sizes during movement, which promoted the landslide process after mixing with water, and was the main source of fine particles within the landslide dam. Evidently, the large elevation difference and narrow riverbed formed in the aforementioned tectonic background also controlled the movement and accumulation of the landslide.
In summary, there are three main effects of fault on landslide: First, the existence of tectonic activities leads to the fragmentation of rock mass, which provides geological conditions and potential material sources for the development of landslide. Second, the fissure generated by the structure provides advantageous conditions for water infiltration. Thirdly, the activity and trend of fault control the location and scale of landslides in geographical space, and also have an important influence on the direction of landslide movement.
4.2.2. External Triggering Factor Analysis
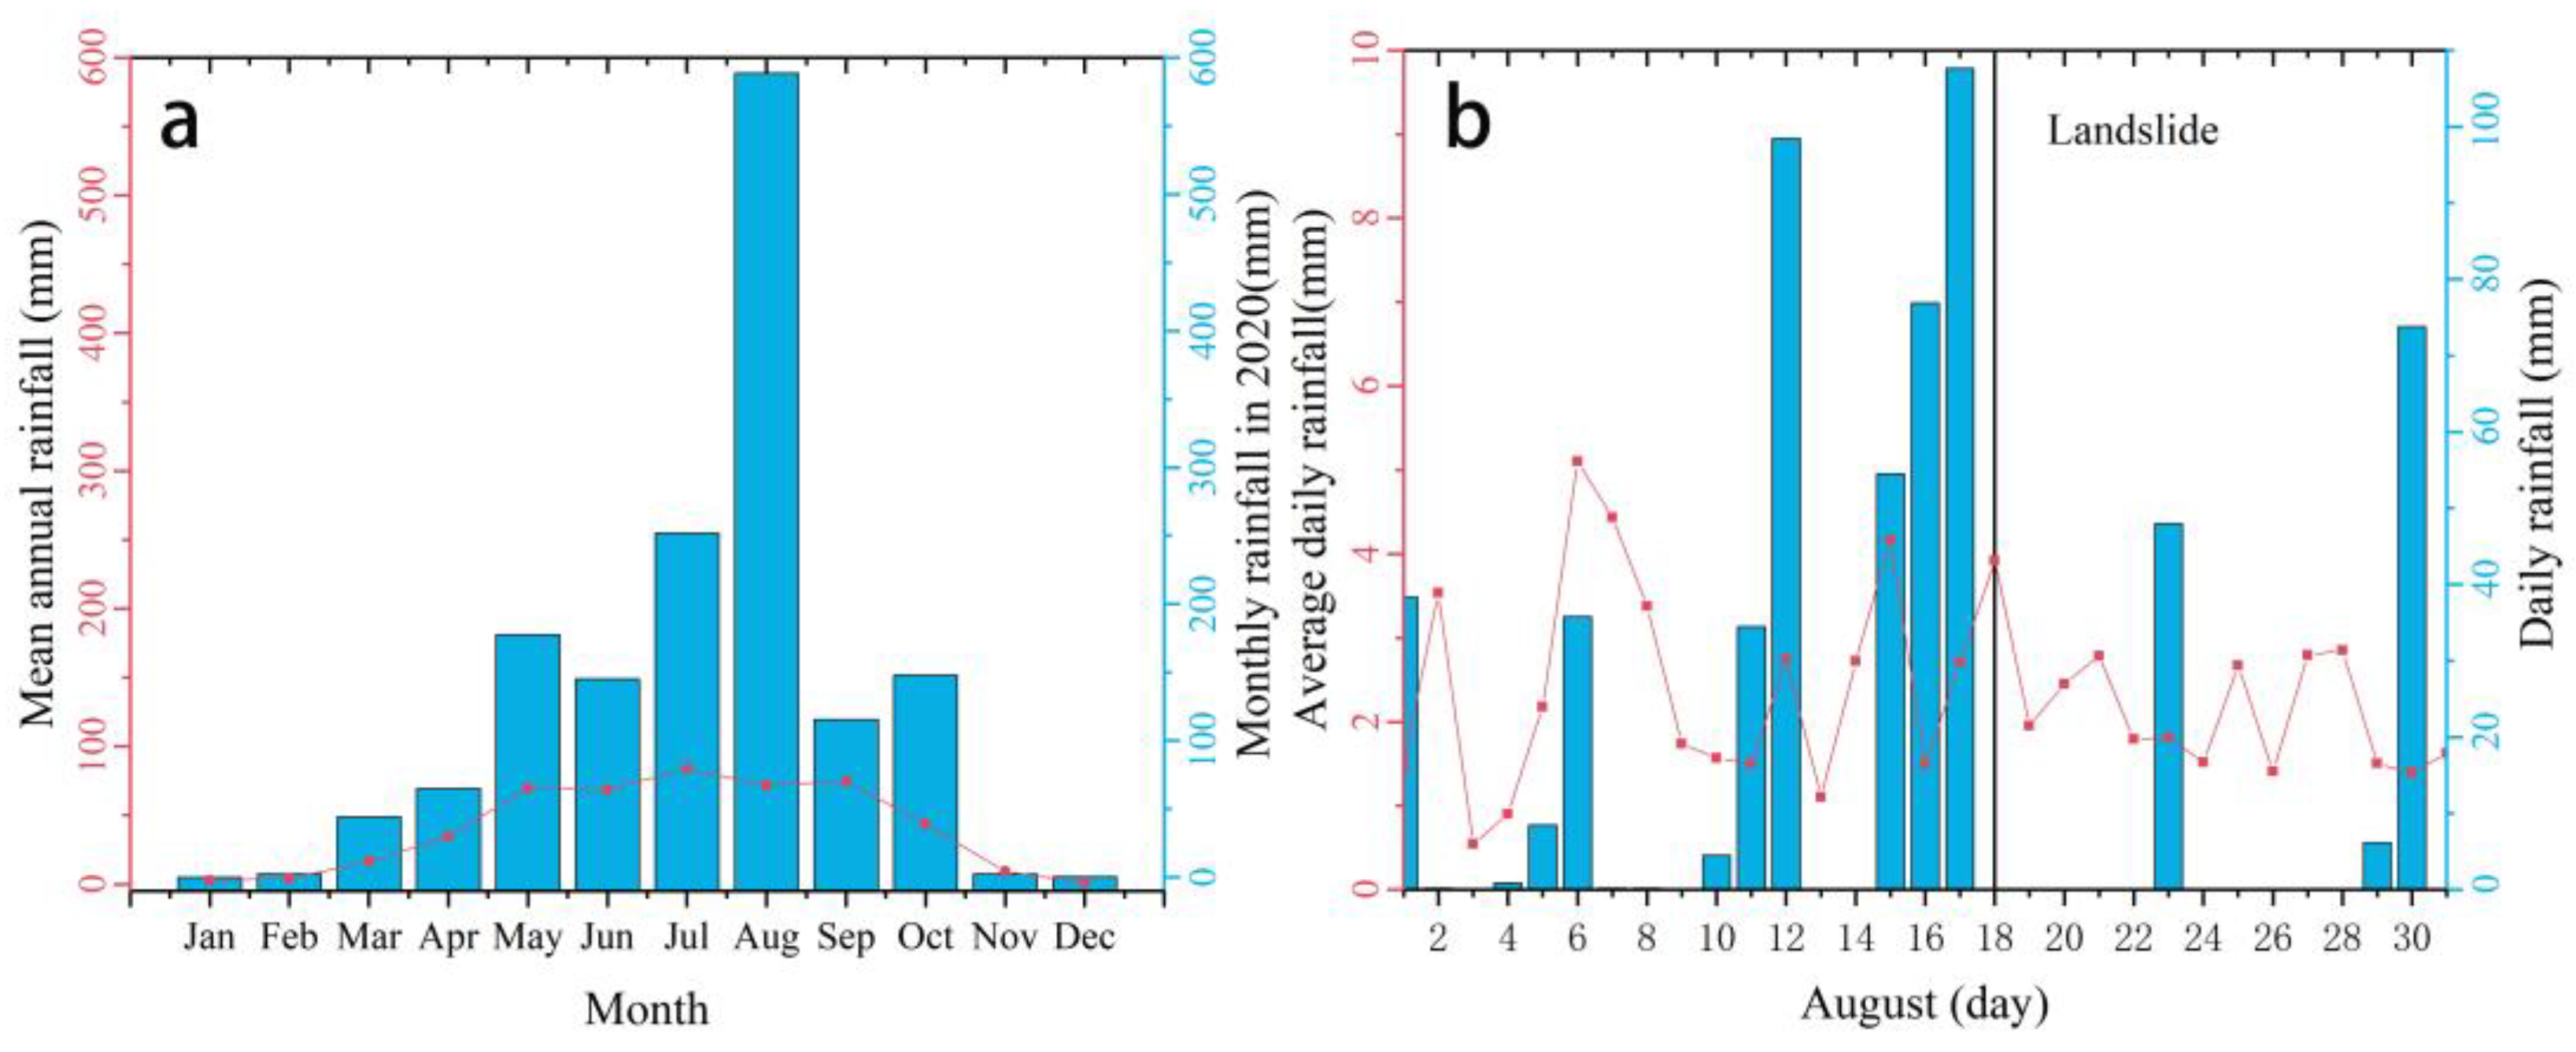
The main external triggering factor of the landslide was rainfall, including early continuous rainfall and extreme rainfall before the landslide. The rainfall in the study area from May to July 2020 was 574.8 mm, accounting for 37.3% of the mean annual rainfall and 2.6 times the average of the same period in the past 20 years (Figure 8a). There were two extreme rainfall events in the week before the landslide, with rainfall of 376.4 mm representing 24.4% of the annual rainfall, which is far more than the same period in previous years (Figure 8b).
Preceding rainfall seeped through the shallow layers of loose material and deep rock cracks, resulting in the slope attaining a saturated water content. This increased the pore water pressure, increased the weight of the potential landslide, reduced the shear strength and effective stress of the rock and soil mass, and greatly affected the stability of the slope [57,58,59]. When extreme rainfall occurred near the time before the landslide, most of the water accumulated in shallow material. Therefore, the formation of the sliding surface at the bottom of the unstable material was accelerated, causing the material in the source area to slide at a relatively gentle slope. In addition, the rain also played a lubricating role in the landslide process, and also provided the main water for the barrier lake. The channel below the landslide was narrow (approximately 12–20 m) and there was little river runoff (rarely exceeding 30 m3/s even during extreme rainfall). Although the erosion capacity of water flow was enhanced by the narrow terrain, it was still unable to cause effective erosion of the landslide dam.
4.3. Hazard Analysis of the Landslide-Barrier Lake-Outburst Flood Chain
4.3.1. Stability Analysis of the Landslide Dam
The stability of the landslide dam determines whether the barrier lake will cause disasters in the downstream area. The formation mechanism of the dam has an important impact on its stability. Although remote-sensing-based methods can quickly analyze the surface accumulation characteristics of dams, they cannot effectively obtain the internal structural features of dams. Therefore, by laying transverse and longitudinal survey lines on the dam surface, we obtained resistivity data reflecting the internal condition of the dam using ERT detection technology, and analyzed the internal structure of the landslide dam based on these data [60,61,62,63,64]. We also used the empirical dimensionless blockage index (DBI) method to analyze the stability of the dam, which has been widely used in similar dam stability analyses.
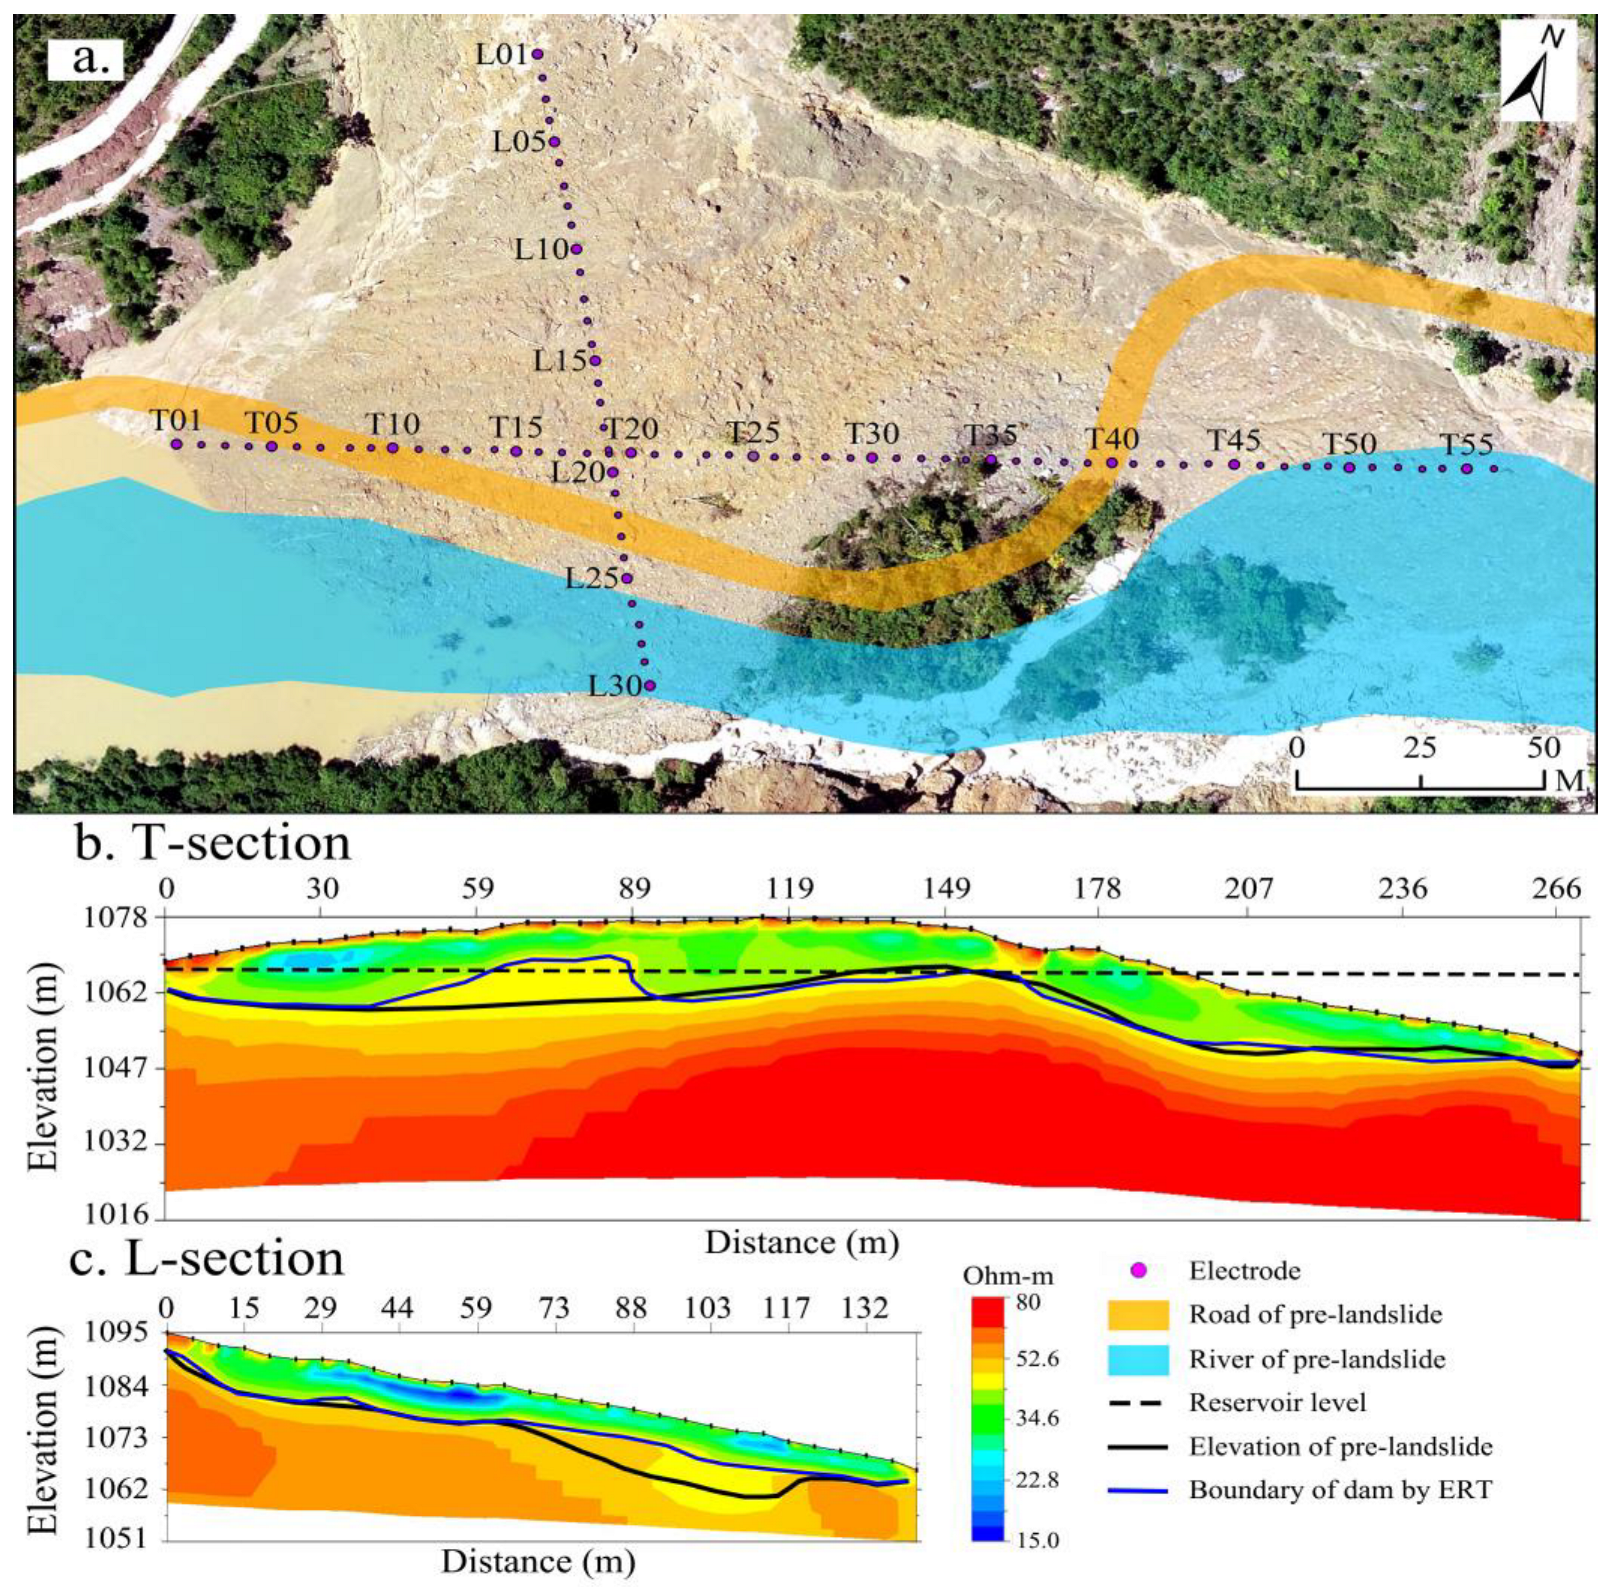
In the profile layout, the length of the transverse measuring line was 275 m, and a total of 56 electrodes were spaced at 5 m intervals. The longitudinal measuring line was 145 m long with a total of 30 electrodes placed along it at 5 m intervals (Figure 9a). In the ERT detection results, the layered characteristics of resistivity values can be observed. The layer exhibiting a higher resistivity value is the original layer, which is mainly composed of the underlying intact rock mass (e.g., sandstone and mudstone), while the layer exhibiting a lower resistivity value is the loose accumulation layer, which is composed of fractured rock and shallow slope deposits entrained by the landslide. After overlaying the original surface elevation, the bottom boundary of the landslide dam is consistent with the original elevation. The thickness of the dam is unevenly distributed in the transverse section (2–18 m) but evenly distributed in the longitudinal section (Figure 9b,c). This pattern shows that the landslide dam caused disturbance to the local bank slope during its formation. The maximum water level of the dammed lake is at the same level as the middle of the dam, which limits seepage and means a low risk of piping damage. However, the thickness of the dam varies greatly in the direction perpendicular to the river channel, and a small-scale gully has formed on the surface. The shallow layer of the dam is mainly composed of fine-grained material (D50 = 3 mm), which is easily eroded by water flow. Considering the frequent occurrence of extreme or heavy rainfall and the large catchment area upstream, we speculate that there is a risk of an overtopping failure of the dam.
The calculation of DBI is based on the effective dam height, dam volume, and watershed area of the upstream area. The calculation formula is:
where Hd represents the dam height, Vd is the landslide dam volume, and Ab is the catchment area. The upstream basin area reflects the energy of the river [65]. The change in volume reflects the stability of the dam. The dam height is an important variable to assess dam stability in relation to overtopping collapse or piping failure. Based on the analysis of many recorded landslide dams worldwide, Ermini L and Casagli N [60] determined the criteria for judging dam stability by DBI. The effectiveness of the method has been proven, and the approach is widely used to evaluate the stability of landslide dams [24,66]. The upstream catchment area of the landslide dam is 58.1 × 10⁶ m2, the effective dam height is 18 m, and the dam volume is about 446 × 103 m3. The calculated DBI value of the landslide dam is 3.37, which is classified as unstable (when DBI > 3.08, it is evaluated to be unstable). In conclusion, we believe that the ZJB landslide dam is at severe risk of overtopping dam failure, which will pose a huge threat to downstream villages and infrastructure.
4.3.2. Inversion Simulation of the Dynamic Process of the ZJB Landslide
The operation of the model is based on the DEM before the landslide and grid data of the materials release height and spatial distribution, as discussed in the data and methods section above. The model also requires inputs of corresponding flow parameters and other model parameters. The dichotomy method was used to calibrate the model using an appropriate range of the values of different parameters and by comparison with the actual observed results. A group of reliable parameters was selected for the simulation after multiple optimizations (Table 2). Due to the time interval and regional overlap of previous and subsequent sliding, as well as the long distance and large height difference of the landslide movement, the initial starting state has a limited influence on subsequent movement and accumulation. Therefore, in the landslide inversion simulation, we simplified the process of landslide initiation.
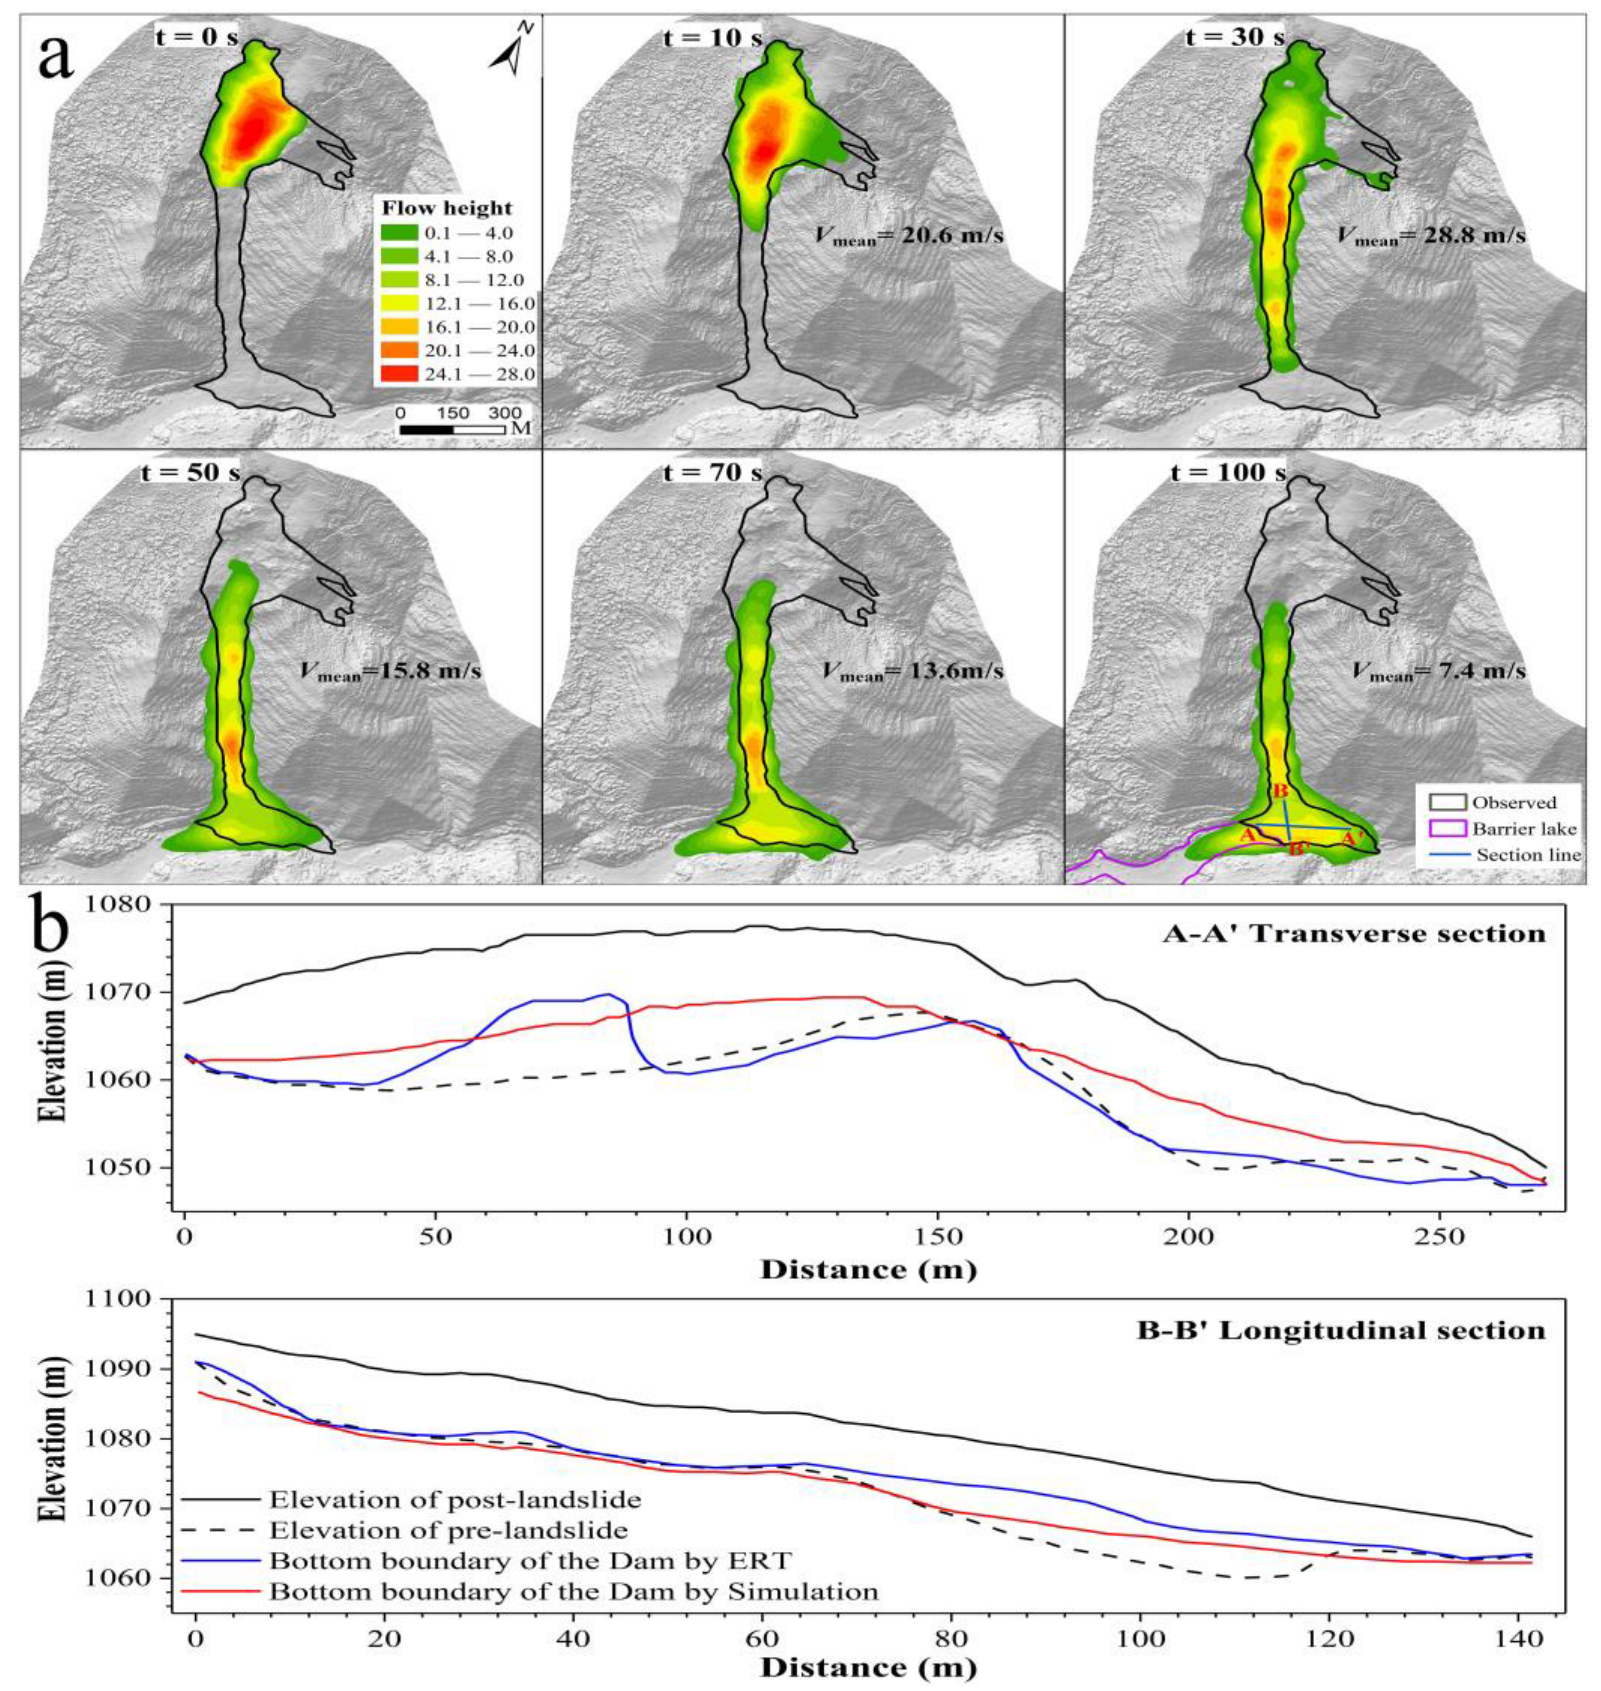
The landslide process of model inversion lasts for 100 s. When t = 10 s, the materials lose stability and accelerate sliding, with some materials overflowing from the right side. When t = 30 s, the materials move rapidly in the entrainment zone with an average speed of 28.8 m/s, and cause severe erosion before the head reaches the bottom of the slope. When t = 50 s, the material velocity slows down and gradually accumulates in the river to form a dam. When t = 70 s, the material velocity continues to decrease, and the materials on the slope gradually decrease and become stable. When t = 100 s, the dam body becomes stable, and the accumulation process gradually stops (Figure 10a). The landslide speed in the simulation first increases and then decreases. The phenomena of erosion and accumulation exist in the entrainment zone at the same time. The simulated and observed results are consistent in space and scale, as shown in Figure 10a. However, the underwater part is difficult to observe, and the scale of material accumulation on the upstream slope of the dam is difficult to quantify.
To verify the landslide inversion result and analyze the landslide accumulation, transverse (AA’) and longitudinal (BB’) sections were extracted (Figure 10a); these correspond to the ERT profiles laid out in Figure 9a. The thicknesses of the ZJB landslide dam obtained using inversion and ERT detection were each converted into elevation and compared with the topographic elevation before and after the landslide (Figure 10b). The results of inversion and ERT detection were consistent with the surface elevation before the landslide in the longitudinal section but differed in the transverse section. Our analysis shows that the thickness of the landslide dam obtained using these two methods is reliable, and the accumulation thickness of the landslide dam at different locations varied between 3.5 and 18 m. Owing to the low resolution of the topographic data used in the inversion, slight differences in the transverse section were evident.
4.3.3. Scenario Analysis of Potential Barrier Lake Outburst
It has been shown that the upstream inflow has an important effect on the stability of a dam and is one of the main control factors for the further extension of a landslide hazard chain [2,14]. Considering the previous analysis and the hydrological conditions when the landslide occurred, as well as high-resolution images and terrain data obtained based on UAV after the landslide, we set four different upstream rainfall inflow scenarios, including upstream inflow of the barrier lake of 20 m3/s (A), 24 m3/s (B), 30 m3/s (C) and 36 m3/s (D) to analyze the dam break risk under different conditions. Among them, scenario B represents the river flow measured on-site after the landslide occurred. Also, we extracted the profile OH1 from the simulation results at a downstream location close to the landslide to analyze the characteristics of the outburst flow under different scenarios.
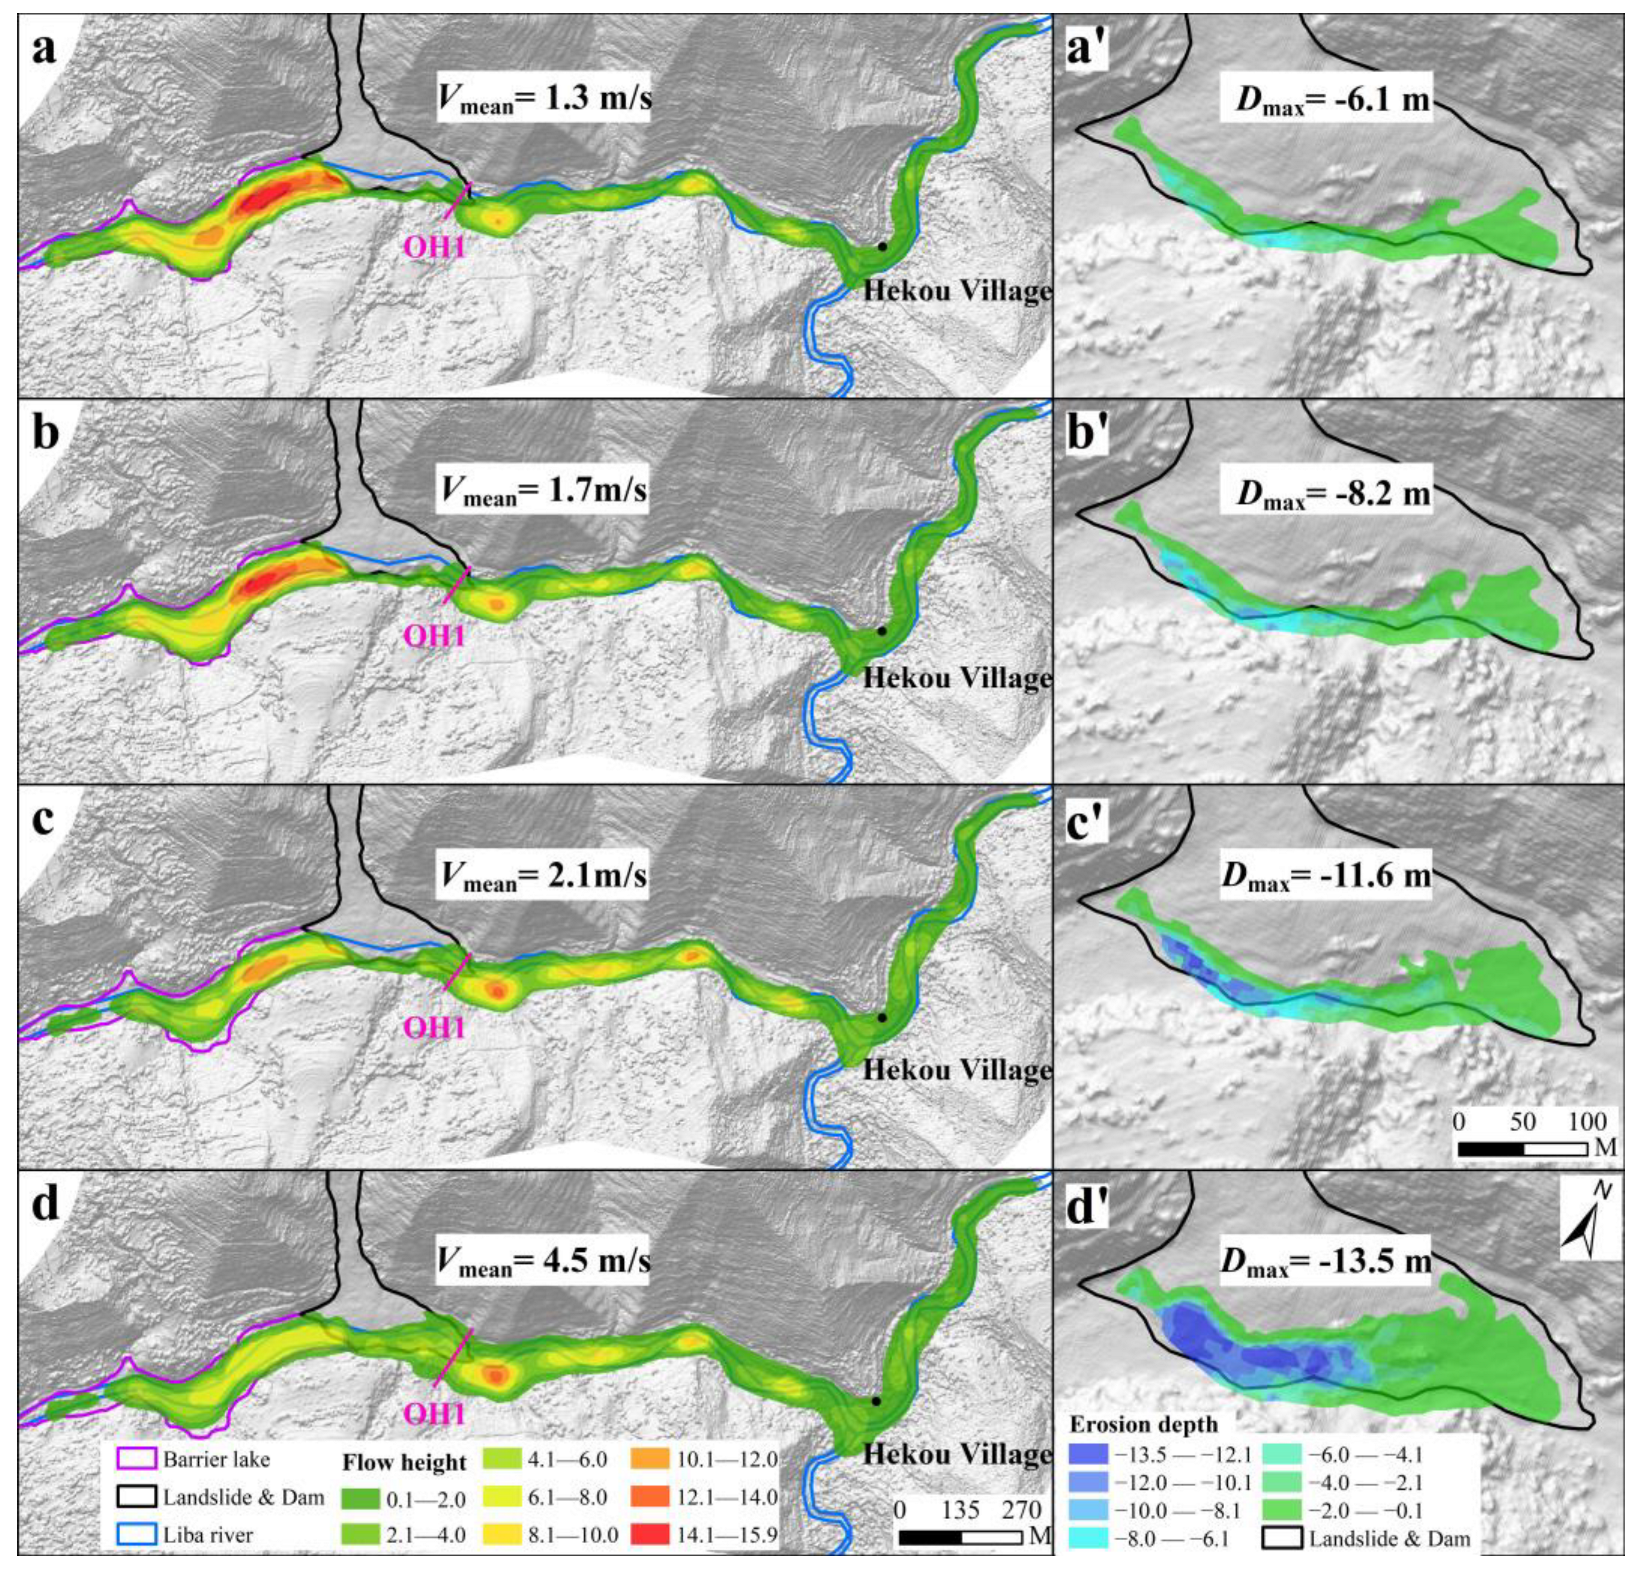
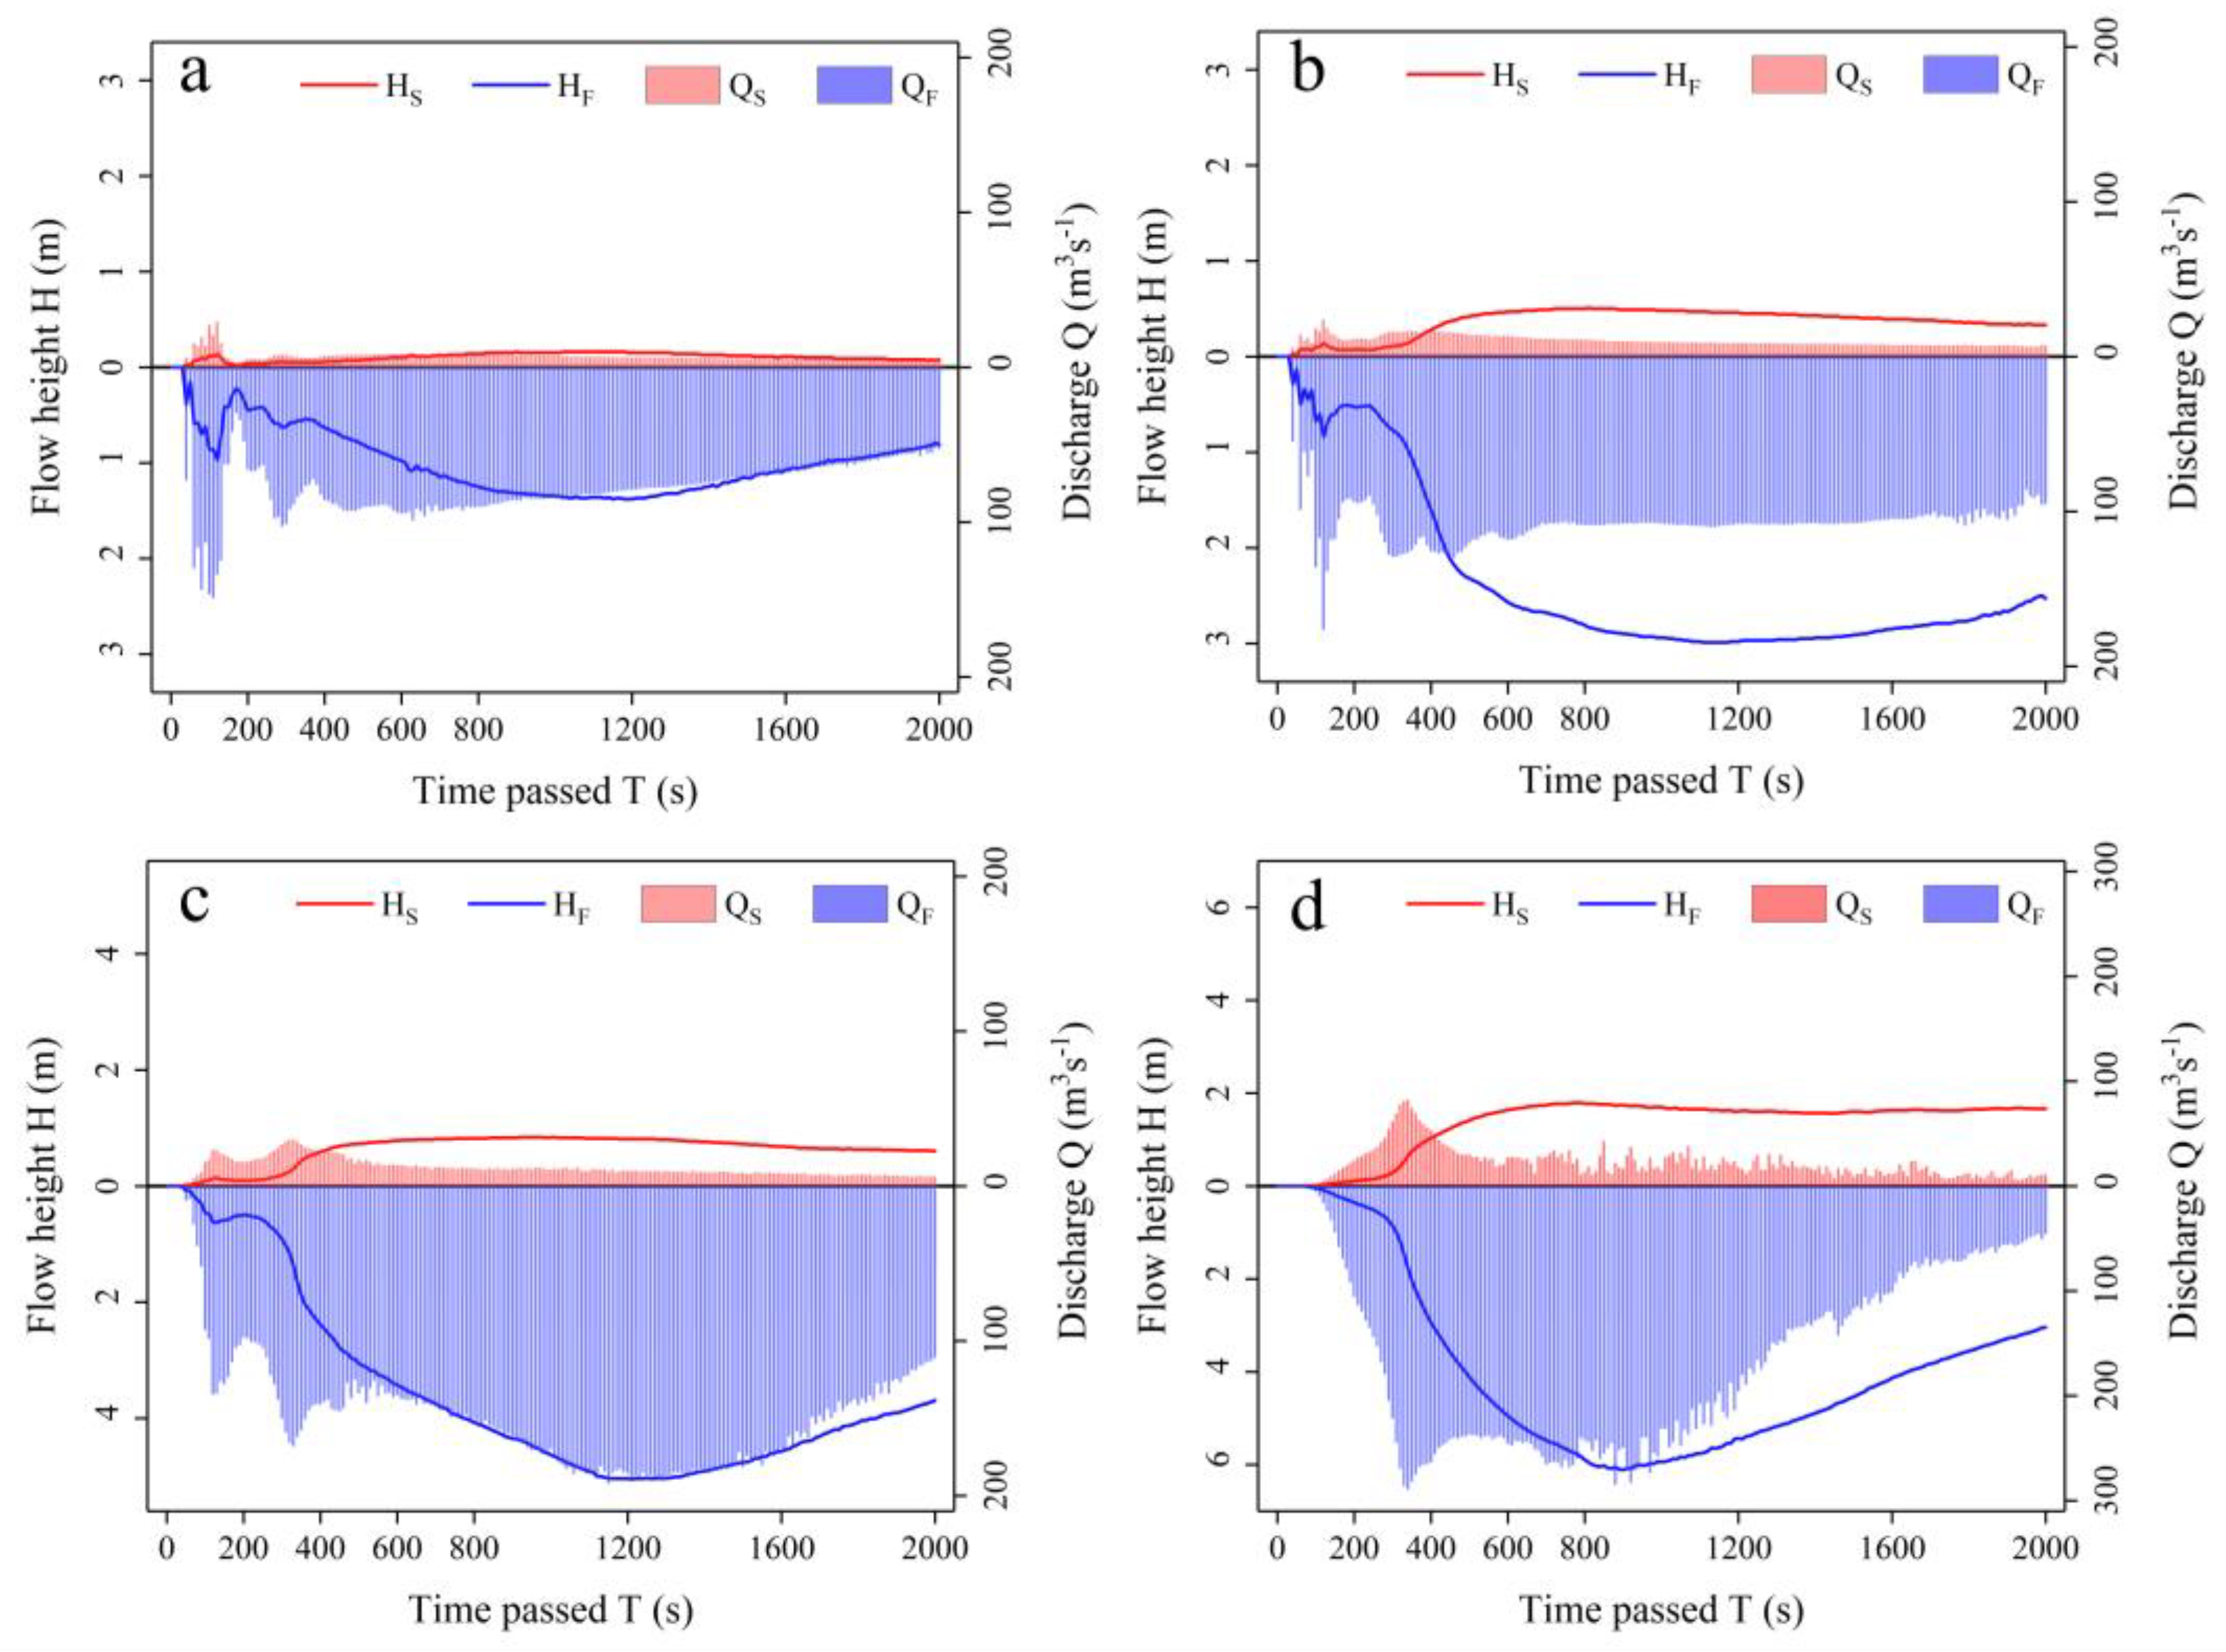
In the simulation of scenarios A and B, the dam was severely eroded along the natural spillway, but no breakage occurred (Figure 11a,b), and the flow and flow depth at the OH1 profile were small (Figure 12a,b). With an increase in upstream water, the rate and depth of erosion increased, and the area of erosion of the dam expanded (Figure 11a’,b’). When the upstream flow increased by 25% and 50% (i.e., scenarios C and D, respectively), the landslide dam ruptured. In scenario C, the outburst scale was small, the average erosion rate was 2.1 m/s, the maximum erosion depth was 11.6 m, and the impact on the downstream was slight, but the water level of the barrier lake substantially decreased (Figure 11c,c’). At this time, the maximum flow depth at the OH1 profile was approximately 4.7 m, the maximum flow was approximately 190 m3/s, and two flow peaks occurred in the early stage of the simulation (Figure 12c). In scenario D, the average erosion rate was 4.5 m/s and maximum erosion depth was 13.5 m. A large-scale outburst occurred from the barrier lake, and the landslide dam was severely eroded (Figure 11d,d’). The maximum flow depth at profile OH1 was 6 m, far exceeding the depth of the river bed; there was one flow peak during the simulation process, which was approximately 300 m3/s (Figure 12d).
5. Discussion
5.1. The Evolution Pattern of the Landslide Hazard Chain
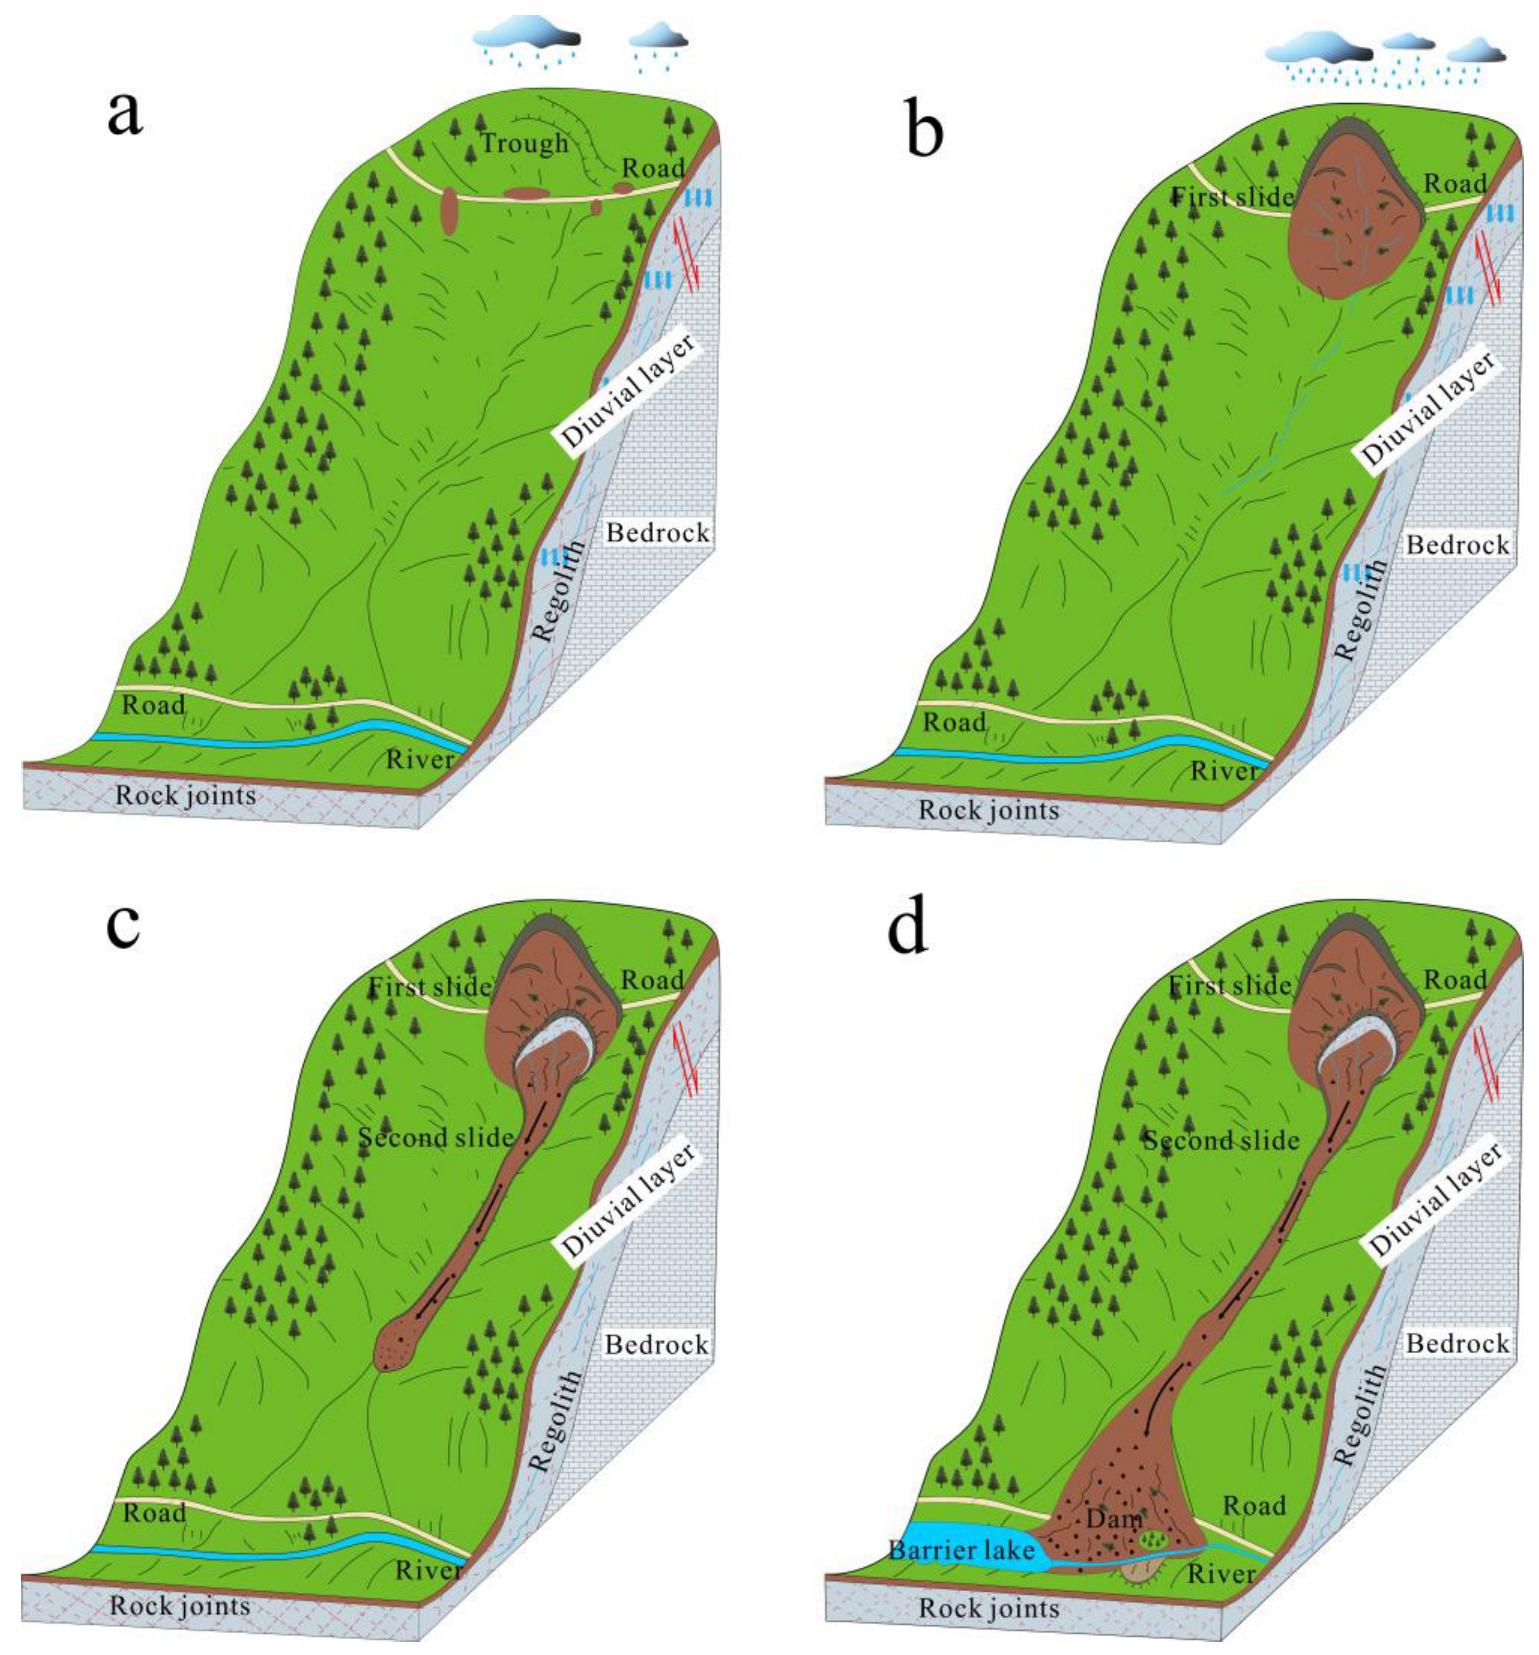
Based on this investigation and previous research, we divide the evolution of the ZJB landslide hazard chain into four stages. The first stage is incubation. Under the geological background, rainfall, and weathering, the rock mass of the slope was mainly composed of sandstone and conglomerate that had become gradually broken. Collapse, cracks, grooves, and other unfavorable geological phenomena occurred on the slope surface (Figure 13a). The slope became saturated due to continuous rainfall infiltration, and then further rainfall occurred, causing the groundwater to soften the material in the fracture zone and rapidly form a sliding surface. These conditions induced the landslide, which is the second stage of its evolution (Figure 13b). During this process, the landslide was controlled by the terrain, sliding along a relatively gentle angle; after a short distance, concentrated accumulation on the platform of broken rock occurred. In the third stage, the flat area composed of broken rock mass experienced severe collapse and sliding under the sudden increase in load (Figure 13c). The concentrated release of potential energy allowed the landslide mass to have a greater speed and stronger destructive force. Lubricated by water and fine particles, the landslide moved rapidly downwards along the fault trough. Owing to the erosional action of scraping, entailing, and pushing, the loose sediments in the trench were constantly disturbed, exchanged, and moved during the landslide. The last stage was the formation of the landslide dam and barrier lake. Owing to the narrow space between the river channel and the riverbank, the landslide mass accumulated to form a landslide dam after reaching the slope toe. The upstream water then pooled to form a barrier lake; when a maximum water level was reached, a natural spillway gradually formed on the dam’s surface (Figure 13d).
The geological structure, rainfall infiltration, and natural weathering were the main causes of rock mass breakage, providing material for the landslide. The steep terrain and fault trough provided a movement path with low resistance for the landslide mass. These factors enabled the material to move quickly to the bottom of the slope, which eroded a large amount of loose material. The narrow river channel and bank slope conditions caused concentrated accumulation of the landslide mass, while relatively weak river hydraulic conditions failed to effectively erode the material. Therefore, the landslide blocked the river and formed a barrier lake.
5.2. Flood Risk Prediction of Dam Rupture
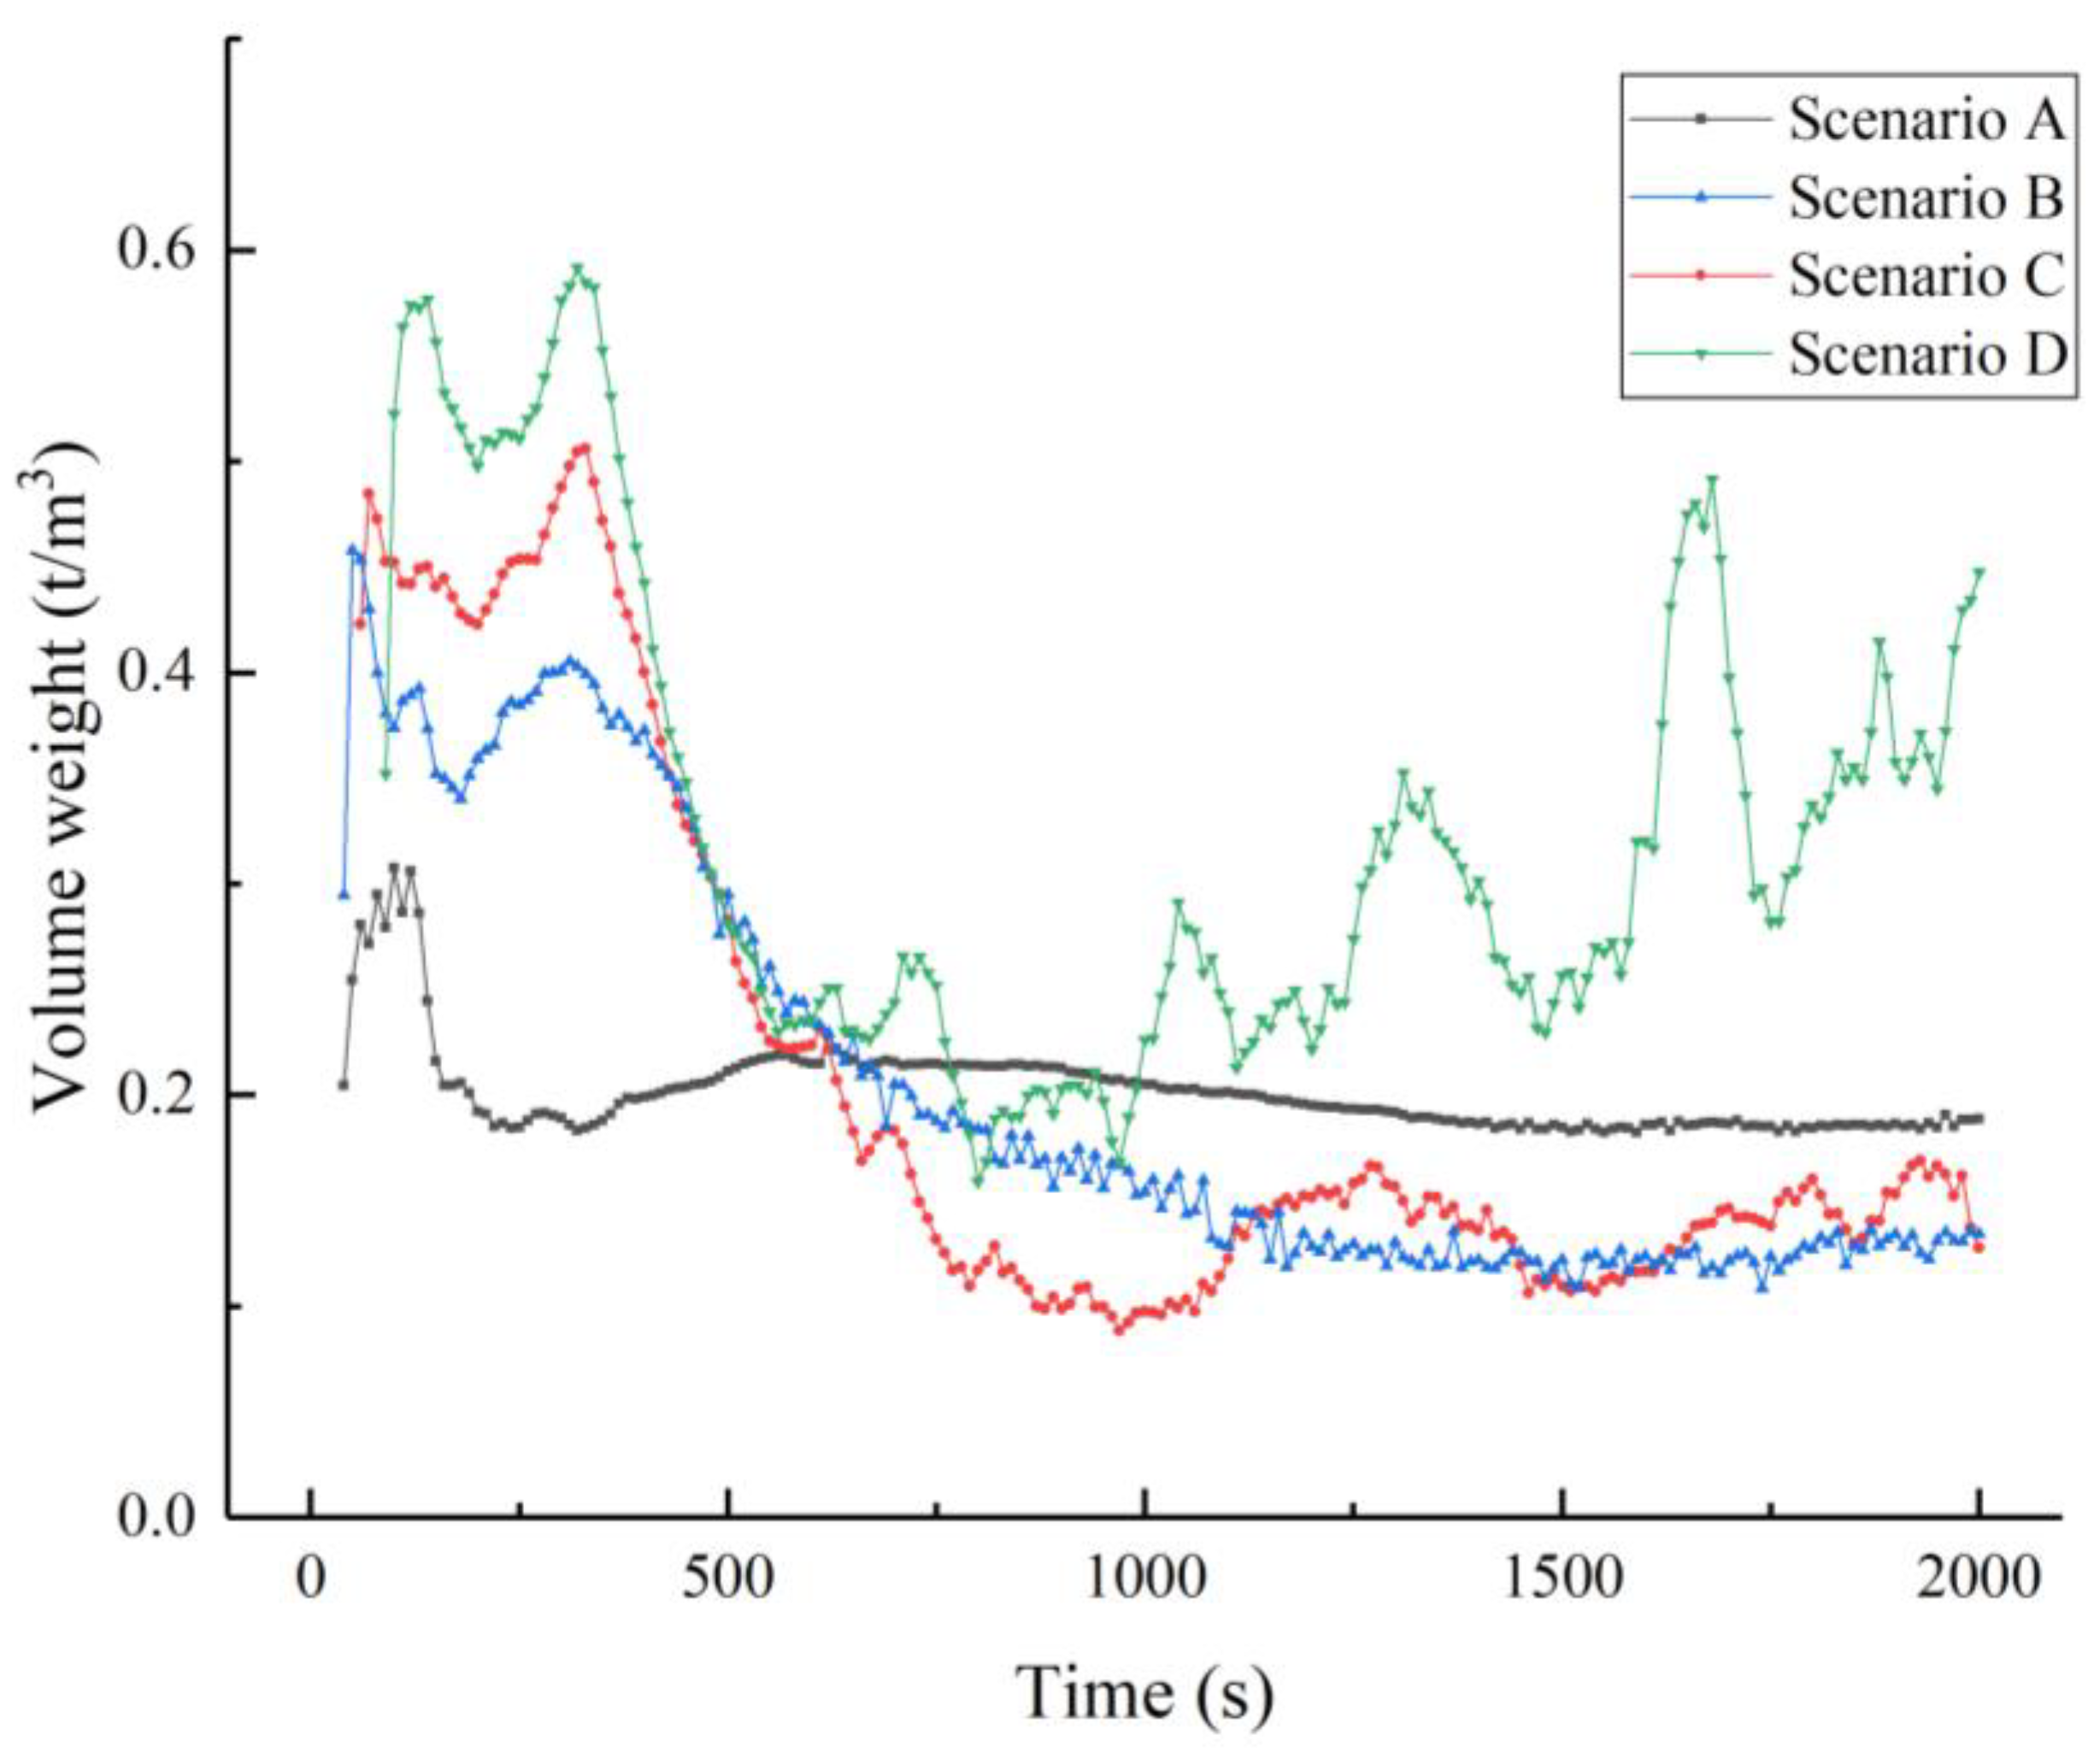
Volume density is an important indicator for judging outburst floods and debris flows. Empirically, the bulk density of a debris flow is generally >1.2 t/m3. In the OH1 profile of simulation scenarios A–D, we extracted and analyzed the volume weight changes over the duration of the simulation (Figure 14). In these four simulation scenarios, the volume weight of the mass flow changed dynamically over the duration of the simulation. However, their volume weights were much smaller than that of a typical debris flow; hence, we infer that the failure of the landslide dam will result in a flood rather than a debris flow. The dam was most severely eroded in the first 300 s of the simulations, corresponding to the stage of maximum volume density in each scenario. The volume density then decreased rapidly during the period 300–500 s, and the rate of decrease was faster in scenarios with higher upstream inflow, which also reflects the severity of the dam rupture process. In scenario D, controlled by the flow rate, the volume weight still fluctuated greatly in the latter stage of the simulation.
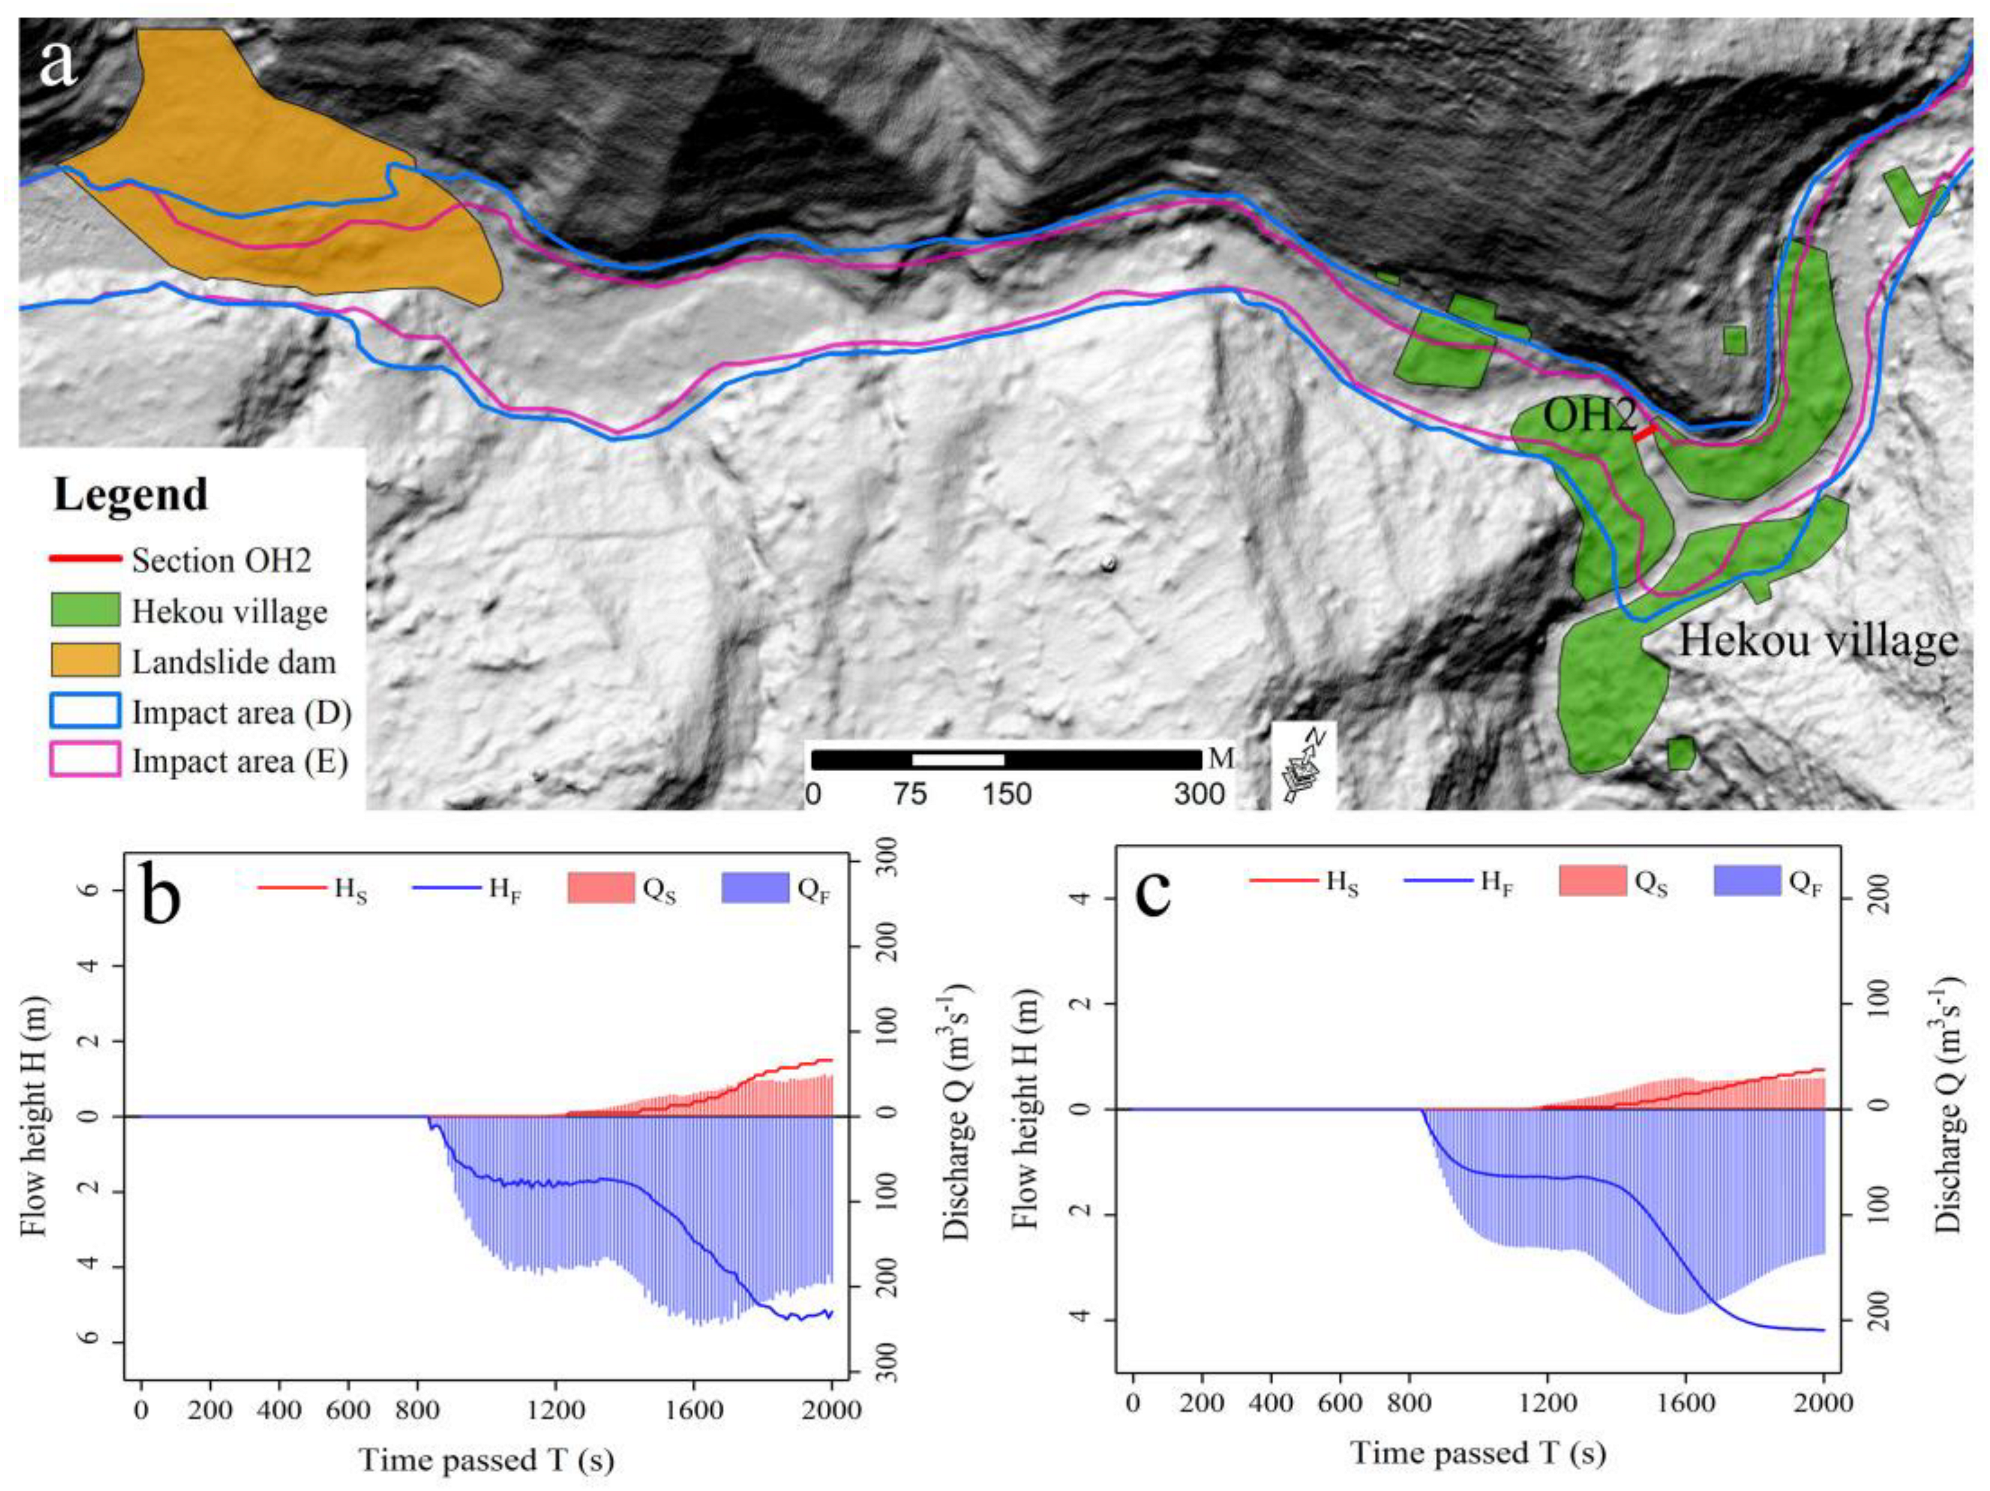
To study the possible risk caused by an outburst flood and analyze the possible impact of an outburst flood on Hekou Village, located downstream, we set up and simulated scenario E. The upstream inflow of scenario E was the same as that under scenario D, but the former was under the condition of an artificial spillway, while the latter was under the condition of a natural spillway. The results show that 68% of Hekou Village is likely to be affected by an outburst flood in scenario D, and 46% in scenario E (Figure 15a). We extracted the profile OH2 from the simulation results, which is located upstream of the village. The data show that at OH2, the maximum flow depths of scenarios D and E are 5.4 and 4.2 m, respectively, and the maximum flow is 320 and 220 m3/s, respectively (Figure 15b,c). Our analysis shows that when the upstream inflow is large, there is a high risk of a dam rupture flood, which poses a serious threat to the downstream Hekou Village. The excavation of an artificial spillway can effectively reduce the risk of a dam rupture flood, but because of the low degree of human intervention, the potential threat cannot be completely eliminated.
5.3. Application of Multiple Techniques in the Study of Small-Scale Landslide Hazard Chain
Under the control of structure, terrain, and rainfall, the scale of landslide hazard chains is variable, and their formation mechanisms are complex. Large-scale landslide hazard chains are often given sufficient attention and properly handled, while small-scale chains are not. Nevertheless, small-scale landslide barrier events can also cause unexpected damage and casualties, forming substantial potential threats. It remains challenging to achieve a comprehensive investigation of complex hazard chains and a scientific analysis of their potential risks. In addition, the comprehensive utilization of data remains limited owing to differences in data acquisition methods and data formats. Therefore, to effectively realize the comprehensive investigation and prediction analysis of geological hazards, it is necessary to establish corresponding research systems for different geological hazards or disaster chains according to existing technologies and methods. On the basis of remote sensing data and a variety of technologies, we here constructed a comprehensive analysis system to study the formation mechanism of a small-scale landslide disaster chain and predict potential risks. For example, the analysis of optical images can reveal the past slope state and its surface characteristics. UAVs can quickly obtain high-resolution terrain and geomorphic information immediately after a disaster occurs and provide support for the subsequent analysis of the disaster mechanism and its evolution. The evolution trend of slope deformation can be obtained through the InSAR method. The internal structure of a dam can be quickly obtained through ERT detection, and its stability can be analyzed. The potential subsequent evolution and threat range of a landslide dam and barrier lake can be predicted using numerical simulation, thus providing valuable information that can aid an effective emergency response.
6. Conclusions
Based on a comprehensive field investigation, the evolution and causes of the ZJB landslide hazard chain were analyzed. The dynamic process of the landslide dam failure was inverted through R.avaflow. The overtopping erosion and evolution characteristics of the dam under different rainfall inflow conditions were analyzed, and the potential risk of a dam break was predicted. The following conclusions are drawn:
- (1)
- The formation of the ZJB landslide hazard chain was affected by the geological structure, natural weathering, slope shape, valley terrain, continuous rainfall, and hydrology. The joint action of structure, weathering, and rainfall caused the breakage of the rock material and controlled the formation of the landslide mass. Rainfall far beyond the levels during the same period in previous years reduced the shear strength of the broken rock mass and induced landslides after infiltration. The high and steep slope shape and fault trough provided significant potential energy and a convenient movement channel for the sliding material. The narrow valley terrain controlled the concentrated accumulation of material. The upstream inflow controlled the speed of the dammed lake water storage. We divided the landslide hazard chain event into four stages: gestation, induction, violent movement, and formation of the landslide dam and barrier lake.
- (2)
- We used numerical models to accurately invert the stages in a landslide hazard chain that had already occurred; on this basis, we then simulated potential extension links and predicted the hazards that may form. These simulations showed that the potential collapse risk of the barrier lake from landslide dam overtopping is closely related to the upstream inflow. When the inflow reaches 36 m3/s, the barrier lake breaks down on a large scale and 68% of Hekou Village will be affected by an outburst flood. Under the same inflow scenario, the excavation of an artificial spillway can effectively reduce the risk of dam rupture. However, the existing artificial spillway cannot completely eliminate the risk of dam failure.
- (3)
- In this study, a comprehensive multi-technology research system for small-scale landslide disaster chains has been constructed; this is based on remote sensing data, such as satellite imagery, UAV data, and radar data, combined with field investigations, ERT, and InSAR technology. Through this system, a comprehensive investigation of the ZJB landslide disaster chain has been realized, the formation mechanism of the landslide barrier has been analyzed, and the risk of a potential outburst flood has been predicted. This study not only realizes the evaluation of the ZJB landslide dam, but also provides an important reference for the emergency treatment of similar geohazard chains and provides support for hazard prevention and mitigation in tectonically active mountainous areas.
Author Contributions
W.S. and G.C. designed this study, performed the main analysis, and wrote the paper; X.M. was mainly involved in supervision and discussion; S.B., J.J., J.W., F.H. and Y.C. contributed significantly to the revising of the manuscript and to the field investigation. All authors have read and agreed to the published version of the manuscript.
Funding
This research was funded by the Second Tibetan Plateau Scientific Expedition and Research Program (STEP) (2021QZKK0201), the National Natural Science Foundation of China (42377193; 42130709), National Key Research and Development Program of China (2017YFC1501005), Key Research and Development Program of Gansu Province (20YF8FA074), Important talent project of Gansu Province (Grant No. 2022RCXM033), and the Fundamental Research Funds for the Central Universities (lzujbky-2021-ey05; lzujbky-2021-16).
Data Availability Statement
The SRTM3 DEM data were provided by NASA. The 12.5 m DEM data was provided by Japan Aerospace Exploration Agency. We thank Gansu Geological Engineering Survey Institute and China Meteorological Data Network for providing the geologic map and meteorological data, respectively.
Acknowledgments
The authors express their sincere gratitude to Yunpeng Yang, Liu Yang, Chen Li for providing useful information during field investigation. The constructive comments of the editor and anonymous reviewers are gratefully acknowledged.
Conflicts of Interest
The authors declare no conflict of interest.
References
- Meng, X. Landslides & Debris Flows in Southern Gansu, China and Formation of the Catastrophic Zhouqu Debris Flow Disaster in August 2010. Quat. Int. 2012, 279-280, 322–323. [Google Scholar]
- Fan, X.; Yang, F.; Subramanian, S.S.; Xu, Q.; Feng, Z.; Mavrouli, O.; Peng, M.; Ouyang, C.; Jansen, J.D.; Huang, R. Prediction of a multi-hazard chain by an integrated numerical simulation approach: The Baige landslide, Jinsha River, China. Landslides 2020, 17, 147–164. [Google Scholar] [CrossRef]
- Evans, S.G.; Hermanns, R.L.; Strom, A.; Scarascia-Mugnozza, G. Natural and Artificial Rockslide Dams; Springer Science & Business Media: Berlin/Heidelberg, Germany, 2011. [Google Scholar]
- Peng, J.; Fan, Z.; Wu, D.; Zhuang, J.; Dai, F.; Chen, W.; Zhao, C. Heavy rainfall triggered loess-mudstone landslide and subsequent debris flflow in Tianshui, China. Eng. Geol. 2015, 186, 79–90. [Google Scholar] [CrossRef]
- Stefanelli, C.T.; Catani, F.; Casagli, N. Geomorphological investigations on landslide dams. Geoenviron. Disasters 2015, 2, 21. [Google Scholar] [CrossRef]
- Zhou, J.; Cui, P.; Hao, M. Comprehensive analyses of the initiation and entrainment processes of the 2000 Yigong catastrophic landslide in Tibet China. Landslides 2016, 13, 39–54. [Google Scholar] [CrossRef]
- Sharafi, S.; Ehteshami-Moinabadi, M.; Darvishi, S. Mechanism of landslide damming in Morzarrin Valley and its consequences, Lorestan Province, western Iran. Landslides 2021, 18, 1823–1832. [Google Scholar] [CrossRef]
- Chong, Y.; Chen, G.; Meng, X.; Yang, Y.; Shi, W.; Bian, S.; Zhang, Y.; Yue, D. Quantitative analysis of artificial dam failure effects on debris flows-A case study of the Zhouqu ’8.8’ debris flow in northwestern China. Sci. Total Environ. 2021, 792, 148439. [Google Scholar] [CrossRef]
- Kalantar, B.; Ueda, N.; Saeidi, V.; Ahmadi, K.; Halin, A.A.; Shabani, F. Landslide Susceptibility Mapping: Machine and Ensemble Learning Based on Remote Sensing Big Data. Remote Sens. 2020, 12, 1737. [Google Scholar] [CrossRef]
- Karagianni, A.; Lazos, I.; Chatzipetros, A. Remote Sensing Techniques in Disaster Management: Amynteon Mine Landslides, Greece. In Intelligent Systems for Crisis Management; Springer: Cham, Switzerland, 2018. [Google Scholar]
- Liu, P.; Wei, Y.; Wang, Q.; Chen, Y.; Xie, J. Research on Post-Earthquake Landslide Extraction Algorithm Based on Improved U-Net Model. Remote Sens. 2020, 12, 894. [Google Scholar] [CrossRef]
- Delaney, K.B.; Evans, S.G. The 2000 Yigong landslide (Tibetan Plateau), rockslide-dammed lake and outburst flood: Review, remote sensing analysis, and process modelling. Geomorphology 2015, 246, 377–393. [Google Scholar] [CrossRef]
- Guo, C.; Montgomery, D.R.; Zhang, Y.; Zhong, N.; Fan, C.; Wu, R.; Yang, Z.; Ding, Y.; Jin, J.; Yan, Y. Evidence for repeated failure of the giant Yigong landslide on the edge of the Tibetan Plateau. Sci. Rep. 2020, 10, 14371. [Google Scholar] [CrossRef] [PubMed]
- Fan, X.; Xu, Q.; Scaringi, G.; Dai, L.; Li, W.; Dong, X.; Zhu, X.; Pei, X.; Dai, K.; Havenith, H. Failure mechanism and kinematics of the deadly June 24th 2017 Xinmo landslide, Maoxian, Sichuan, China. Landslides 2017, 14, 2129–2146. [Google Scholar] [CrossRef]
- Hu, K.; Wu, C.; Tang, J.; Pasuto, A.; Li, Y.; Yan, S. New understandings of the June 24th 2017 Xinmo landslide, Maoxian, Sichuan, China. Landslides 2018, 15, 2465–2474. [Google Scholar] [CrossRef]
- Zhang, L.; Xiao, T.; He, J.; Chen, C. Erosion-based analysis of breaching of Baige landslide dams on the Jinsha River, China, in 2018. Landslides 2019, 16, 1965–1979. [Google Scholar] [CrossRef]
- Zhang, Z. Mechanism of the 2019 Yahuokou landslide reactivation in Gansu, China and its causes. Landslides 2020, 17, 1429–1440. [Google Scholar] [CrossRef]
- Zhang, Y.; Meng, X.; Novellino, A.; Dijkstra, T.; Chen, G.; Jordan, C.; Li, Y.; Su, X. Characterization of pre-failure deformation and evolution of a large earthflow using InSAR monitoring and optical image interpretation. Landslides 2022, 19, 35–50. [Google Scholar]
- Norio, O.; Ye, T.; Kajitani, Y.; Shi, P.; Tatano, H. The 2011 eastern Japan great earthquake disaster: Overview and comments. Int. J. Disaster Risk Sci. 2011, 2, 34–42. [Google Scholar] [CrossRef]
- Liu, W.; He, S. Dynamic simulation of a mountain disaster chain: Landslides, barrier lakes, and outburst floods. Nat. Hazards 2017, 90, 757–775. [Google Scholar] [CrossRef]
- Zhou, J.; Li, H.; Lu, G.; Zhou, Y.; Zhang, J.; Fan, G. Initia tion mechanism and quantitative mass movement analysis of the 2019 Shuicheng catastrophic landslide. Q. J. Eng. Geol. Hydrogeol. 2020, 54, qjegh2020–qjegh2052. [Google Scholar]
- Shen, D.; Shi, Z.; Peng, M.; Zhang, L.; Zhu, Y. Preliminary analysis of a rainfall-induced landslide hazard chain in Enshi City, Hubei Province, China in July 2020. Landslides 2021, 18, 509–512. [Google Scholar] [CrossRef]
- Nian, T.; Wu, H.; Chen, G.; Zheng, D.; Zhang, Y.; Li, D. Research process on stability evaluation method and disaster chain effect of landslide dam. Chin. J. Rock Mech. Eng. 2018, 37, 1796–1812. [Google Scholar]
- Wang, G.; Furuya, G.; Zhang, F.; Doi, I.; Watanabe, N.; Wakai, A.; Marui, H. Lyered internal structure and breaching risk assessment of the Higashi-Takezawa landslide dam in Niigata, Japan. Geomorphology 2016, 267, 48–58. [Google Scholar] [CrossRef]
- Yu, H.; Li, C.; Zhou, J.; Chen, W.; Long, J.; Wang, X.; Peng, T. Recent rainfall-and excavation-induced bedding rockslide occurring on 22 October 2018 along the Jian-En expressway, Hubei, China. Landslides 2020, 17, 2619–2629. [Google Scholar] [CrossRef]
- Dufresne, A.; Geertsema, M. Rock slide-debris avalanches: Flow transformation and hummo-ck formation, examples from British Columbia. Landslides 2019, 17, 15–22. [Google Scholar] [CrossRef]
- Xu, Q.; Li, W.; Ju, Y.; Dong, X.; Peng, D. Multitemporal UAV-based photogrammetry for landslide detection and monitoring in a large area: A case study in the Heifangtai terrace in the Loess Plateau of China. J. Mt. Sci. 2020, 17, 1826–1839. [Google Scholar] [CrossRef]
- Cheng, Z.; Gong, W.; Tang, H.; Juang, C.; Deng, Q.; Chen, J.; Ye, X. UAV photogrammetry based remote sensing and preliminary assessment of the behavior of a landslide in Guizhou, China. Eng. Geol. 2021, 289, 106172. [Google Scholar] [CrossRef]
- Zhang, Y.; Huang, C.; Huang, C.; Li, M. Spatio-temporal evolution characteristics of typical dibris flow sources after an earthquake. Landslides 2022, 19, 2263–2275. [Google Scholar] [CrossRef]
- Hu, X.; Zhang, L.; Hu, K.; Cui, L.; Wang, L.; Xia, Z.; Huang, Q. Modelling the evolution of propagation and runout from a gravel-silty clay landslide to a debris flow in Shaziba, southwestern Hubei Province, China. Landslides 2022, 19, 2199–2212. [Google Scholar] [CrossRef]
- Tommasi, P.; Campedel, P.; Consorti, C.; Ribacchi, R. A discontinuous approach to the numerical modelling of rock avalanches. Rock Mech. Rock Eng. 2008, 41, 37–58. [Google Scholar] [CrossRef]
- Sosio, R.; Crosta, G.B.; Hungr, O. Numerical modeling of debris avalanche propagation from collapse of volcanic edifices. Landslides 2012, 9, 315–334. [Google Scholar] [CrossRef]
- Huang, T.; Ding, M.; She, T.; Tian, S.; Yang, J. Numerical simulation of high-speed landslide in Chenjiaba, Beichuan, China. J. Mt. Sci. 2017, 14, 2137–2149. [Google Scholar] [CrossRef]
- Zhao, W.; Xia, X.; Su, X.; Liang, Q.; Liu, X.; Ju, N. Movement process analysis of the high-speed long-runout Shuicheng landslide over 3-D complex terrain using a depth-averaged numerical model. Landslides 2021, 18, 3213–3226. [Google Scholar] [CrossRef]
- Iverson, R.M.; Ouyang, C. Entrainment of bed material by Earth-surface mass flows: Review and reformulation of depth-integrated theory. Rev. Geophys. 2014, 53, 27–58. [Google Scholar] [CrossRef]
- McDougall, S. 2014 Canadian Geotechnical Colloquium: Landslide runout analysis—Current practice and challenges. Can. Geotech. J. 2017, 54, 605–620. [Google Scholar] [CrossRef]
- An, H.; Ouyang, C.; Zhou, S. Dynamic process analysis of the Baige landslide by the combination of DEM and long-period seismic waves. Landslides 2021, 18, 1625–1639. [Google Scholar] [CrossRef]
- Liu, C.; Pollard, D.D.; Shi, B. Analytical solutions and numerical tests of elastic and failure behaviors of close-packed lattice for brittle rocks and crystals. J. Geophys. Res. Solid Earth 2013, 118, 71–82. [Google Scholar] [CrossRef]
- Lin, C.; Lin, M. Evolution of the large landslide induced by Typhoon Morakot: A case study in the Butangbunasi River, southern Taiwan using the discrete element method. Eng. Geol. 2015, 197, 172–187. [Google Scholar] [CrossRef]
- Ouyang, C.; Zhao, W.; He, S.; Wang, D.; Zhou, S.; An, H.; Wang, Z.; Cheng, D. Numerical modeling and dynamic analysis of the 2017 Xinmo landslide in Maoxian County, China. J. Mt. Sci. 2017, 14, 1701–1711. [Google Scholar] [CrossRef]
- Hu, Y.; Yu, Z.; Zhou, J. Numerical simulation of landslide-generated waves during the 11 October 2018 Baige landslide at the Jinsha River. Landslides 2020, 17, 2317–2328. [Google Scholar] [CrossRef]
- Qiao, L. Development of Landslides Dominated by Neotectonics in Bailong River Corridor, Gansu Province, China. Ph.D. Dissertation, Lanzhou University, Lanzhou, China, 2017. [Google Scholar]
- Palis, E.; Lebourg, T.L.; Vidal, M.; Levy, C.; Tric, E.; Hernandez, M. Multiyear time-lapse ERT to study short and long-term landslide hydrological dynamics. Landslides 2017, 14, 1333–1343. [Google Scholar] [CrossRef]
- Whiteley, J.S.; Chambers, J.E.; Uhlemann, S.; Wilkinson, P.B.; Kendall, J.M. Geophysical monitoring of moisture-induced landslides: A review. Rev. Geophys. 2019, 57, 106–145. [Google Scholar] [CrossRef]
- Mergili, M.; Pudasaini, S.P. r.avaflow—The Mass Flow Simulation Tool. 2014–2023. Available online: https://www.avaflow.org (accessed on 7 June 2022).
- Pudasaini, S.P.; Mergili, M. A Multi-Phase Mass Flow Model. JGR Earth Surf. 2019, 124, 2920–2942. [Google Scholar] [CrossRef]
- Mergili, M.; Fischer, J.T.; Krenn, J.; Pudasaini, S.P.R. avaflow v1, an advanced open source computational framework for the propagation and interaction of two-phase mass flows. Geosci. Model Dev. 2017, 10, 553–569. [Google Scholar] [CrossRef]
- Pudasaini, S.P. A general two-phase debris flow model. J. Geophys. Res. Earth Surf. 2012, 117, 1–28. [Google Scholar] [CrossRef]
- Mergili, M.; Jaboyedoff, M.; Pullarello, J.; Pudasaini, S.P. Back-calculation of the 2017 Piz Cengalo-Bondo landslide cascade with r.avaflow. Nat. Hazards Earth Syst. Sci. 2020, 20, 505–520. [Google Scholar] [CrossRef]
- Shugar, D.H.; Jacquemart, M.; Shean, D.; Bhushan, S.; Upadhyay, K.; Sattar, A.; Schwanghart, W.; McBride, S.; de Vries, M.V.W.; Mergili, M.; et al. A massive rock, ice avalanche caused the 2021 disaster at Chamoli, Indian Himalaya. Science 2021, 373, 300–306. [Google Scholar] [CrossRef]
- Zheng, G.; Mergili, M.; Emmer, A.; Allen, S.; Bao, A.; Guo, H.; Stoffel, M. The 2020 glacial lake outburst flood at Jinwuco, Tibet: Causes, impacts, and implications for hazard and risk assessment. Cryosphere 2021, 15, 3159–3180. [Google Scholar] [CrossRef]
- Wang, D.; Li, Y.; Wang, Z.; Yang, W.; Ouyang, C.; Zhu, X.; Scaringi, G. Threat from above! Assessing the risk from the Tonghua high-locality landslide in Sichuan, China. Landslides 2022, 19, 731–746. [Google Scholar] [CrossRef]
- ASTM C29/C29M-09; Standard Test Method for Bulk Density (“Unit Weight”) and Voids in Aggregate. ASTM International: West Conshohocken, PA, USA, 2010.
- Chen, X.; Zhou, Q.; Liu, C. Distribution pattern of coseismic landslides triggered by the 2014 ludian, Yunnan, China Mw6.1 earthquake: Special controlling conditions of local topography. Landslides 2015, 12, 1159–1168. [Google Scholar]
- Shen, W.; Li, T.; Li, P.; Guo, J. A modified finite difference model for the modeling of flowslides. Landslides 2018, 15, 1577–1593. [Google Scholar] [CrossRef]
- Chen, H.; Qin, S.; Xue, L.; Xu, C. Why the Xintan landslide was not triggered by the heaviest historical rainfall: Mechanism and review. Eng. Geol. 2021, 294, 106379. [Google Scholar] [CrossRef]
- Lu, N.; Godt, J.W.; Wu, D. A closed-form equation for effective stress in unsaturated soil. Water Resour. Res. 2010, 46, 567–573. [Google Scholar] [CrossRef]
- Zhao, W.; Li, L.; Xiao, Y. Experimental research of matrix suction of the unsaturated red clay. Adv. Mater. Res. 2014, 919–921, 835–838. [Google Scholar] [CrossRef]
- Gao, Y.; Li, B.; Gao, H.; Chen, L.; Wang, Y. Dynamic characteristics of high-elevation and long-runout landslides in the Emeishan basalt area: A case study of the Shuicheng “7.23” landslide in Guizhou, China. Landslides 2020, 17, 1663–1677. [Google Scholar] [CrossRef]
- Ermini, L.; Casagli, N. Prediction of the behaviour of landslide dams using a geomorphological dimensionless index. Earth Surf. Process. Landforms 2003, 28, 31–47. [Google Scholar] [CrossRef]
- Susilo, A.; Suryo, E.A.; Fitriah, F.; Sutasoma, M. Preliminary study of landslide in Sri Mulyo, Malang, Indonesia using resistivity method and drilling core data. Int. J. Geomate 2018, 15, 161–168. [Google Scholar] [CrossRef]
- Bian, S.; Chen, G.; Zeng, R.; Meng, X.; Jin, J.; Lin, L.; Zhang, Y.; Shi, W. Post-failure evolution analysis of an irrigation-induced loess landslide using multiple remote sensing approaches integrated with time-lapse ERT imaging: Lessons from Heifangtai, China. Landslides 2022, 19, 1179–1197. [Google Scholar] [CrossRef]
- Tsai, W.N.; Chen, C.C.; Chiang, C.W.; Chen, P.Y.; Kuo, C.Y.; Wang, K.L.; Lin, M.L.; Chen, R.F. Electrical Resistivity Tomography (ERT) Monitoring for Landslides: Case Study in the Lantai Area, Yilan Taiping Mountain, Northeast Taiwan. Front. Earth Sci. 2021, 9, 737271. [Google Scholar] [CrossRef]
- El-Raouf, A.A.; Iqbal, I.; Meister, J.; Abdelrahman, K.; Alzahrani, H.; Badran, O.M. Earthflow reactivation assessment by multichannel analysis of surface waves and electrical resistivity tomography: A case study. Open Geosci. 2021, 13, 1328–1344. [Google Scholar] [CrossRef]
- Swanson, F.J.; Oyagi, N.; Tominaga, M. Landslide dams in Japan. In Landslide Dams: Process, Risk, and Mitigation; Special Publication No. 3; Schuster, R.L., Ed.; American Society of Civil Engineers: New York, NY, USA, 1986; pp. 273–278. [Google Scholar]
- Chen, S.; Hsu, C.; Wu, T.; Chou, H.; Cui, P. Landslide dams induced by typhoon morakot and risk assessment. Ital. J. Eng. Geol. Environ. 2011, 653–660. [Google Scholar] [CrossRef]
Figure 1.
Sketch map of regional geological structure and topography(from Geoprofessions & Geological engineering Survey Institute of Gansu Province). (a) Geographic location of the ZJB landslide. (b) The geological, stratigraphic, water system, transportation, and village distribution of the watershed where the ZJB landslide is located. LBSF is the Libahe secondary fault, which passes above the landslide and is relatively small in scale. (c) Overall photo of the landslide. K1d1 is the lower Cretaceous Donghe lower subgroup, K1d2 is the lower Cretaceous Donghe middle subgroup, K1d3 is the lower Cretaceous Donghe upper subgroup, S2+3bs1 lower lithologic member of Baishuijiang group of middle Upper Silurian system.

Figure 2.
Basic data and workflow. Based on multi-source data, the background and historical deformation characteristics of the study area are analyzed. The induced mechanism and evolution process of the ZJB landslide were analyzed by various investigation methods. Combined with UAV and numerical simulation method, the potential dam failure scenario and risk were evaluated.

Figure 3.
Analysis of historical deformation of slope. (a–d) The deformation characteristics distribution of the landslide source area on 9 December 2013, 3 January 2016, 21 November 2018 and 21 November 2018. All of the backgrounds are Google Earth images that correspond to time.
Figure 3.
Analysis of historical deformation of slope. (a–d) The deformation characteristics distribution of the landslide source area on 9 December 2013, 3 January 2016, 21 November 2018 and 21 November 2018. All of the backgrounds are Google Earth images that correspond to time.

Figure 4.
Slope deformation obtained by InSASR. (a) The surface deformation interference points of the ZJB landslide from March 2017 to December 2020 were obtained by InSAR method. (b) Comparison of time series of surface deformation with rainfall.
Figure 4.
Slope deformation obtained by InSASR. (a) The surface deformation interference points of the ZJB landslide from March 2017 to December 2020 were obtained by InSAR method. (b) Comparison of time series of surface deformation with rainfall.

Figure 5.
Characteristics of the ZJB landslide hazard chain. (a,b) The rear crown and fault scarp. (c) Part of the landslide material overflowed from the right side. (d) Steep cliff formed by the landslide. (e) Side wall formed by landslide erosion. (f) Landslide dam and the natural spillway. (g) The lake formed by the landslide. (h) Orthophotogram of landslide and barrier lake, and the area circled by the black dotted line is the source zone of the landslide.

Figure 6.
Features of the artificial spillway. (a) Section comparison before landslide, before the artificial spillway excavation and after the artificial spillway excavation. (b,c) The comparison of different sections of the artificial spillway before and after excavation, and the photos after excavation.

Figure 7.
Geological environment characteristics of landslide area. (a) The ZJB landslide movement path. (b) Broken rock formation by tectonic action. (c) Traces of fissure water outflow. (d) Material accumulated by the landslide. (e,f) Broken rock mass.
Figure 7.
Geological environment characteristics of landslide area. (a) The ZJB landslide movement path. (b) Broken rock formation by tectonic action. (c) Traces of fissure water outflow. (d) Material accumulated by the landslide. (e,f) Broken rock mass.

Figure 8.
Rainfall characteristics in the study area. (a) Hyetograph of historical rainfall data. (b) The heavy rainfall pre-landslide.
Figure 8.
Rainfall characteristics in the study area. (a) Hyetograph of historical rainfall data. (b) The heavy rainfall pre-landslide.

Figure 9.
Detection and analysis of dam structure. (a) The layout of ERT survey lines. (b,c) Profile of ERT detection results.
Figure 9.
Detection and analysis of dam structure. (a) The layout of ERT survey lines. (b,c) Profile of ERT detection results.

Figure 10.
Inversion results and analysis of landslide process. (a) Inversion of the ZJB landslide and accumulation process. (b) Comparison between inversion of landslide dam accumulation profile and ERT detection results.
Figure 10.
Inversion results and analysis of landslide process. (a) Inversion of the ZJB landslide and accumulation process. (b) Comparison between inversion of landslide dam accumulation profile and ERT detection results.

Figure 11.
Simulation results of dam break in different scenarios. (a–d) Simulation of the four scenarios of barrier lake outburst; (a’–d’) Corresponding to the dam erosion characteristics under each scenario.
Figure 11.
Simulation results of dam break in different scenarios. (a–d) Simulation of the four scenarios of barrier lake outburst; (a’–d’) Corresponding to the dam erosion characteristics under each scenario.

Figure 12.
Hydrological characteristic curve at OH1 profile. (a) Flow and depth characteristic curves at profile OH1 in scenario A. (b) Flow and depth characteristic curves at profile OH1 in scenario B. (c) Flow and depth characteristic curves at profile OH1 in scenario C. (d) Flow and depth characteristic curves at profile OH1 in scenario D.

Figure 13.
Evolution model of the ZJB landslide damming hazard chain. (a) Early breeding of the landslide. (b) The rain caused the first slide of the slope. (c) The sudden increase in load caused the second slide. (d) The landslide blocked the river and formed a barrier lake.
Figure 13.
Evolution model of the ZJB landslide damming hazard chain. (a) Early breeding of the landslide. (b) The rain caused the first slide of the slope. (c) The sudden increase in load caused the second slide. (d) The landslide blocked the river and formed a barrier lake.

Figure 14.
The volume weight of the dam-broken mixture at OH1 profile under different scenarios and variation over time.
Figure 14.
The volume weight of the dam-broken mixture at OH1 profile under different scenarios and variation over time.

Figure 15.
The Hekou Village threatened by outburst flood under different spillway conditions. (a) When the upstream inflow is 36 m3/s, the extent of the threat of outburst flood in the natural and artificial spillway scenarios, and the area where the Hekou village will be inundated. (b) Depth and discharge of outburst flood at OH2 profile in natural spillway scenario (scenario D). (c) Depth and discharge of outburst flood at OH2 profile in artificial spillway scenario (scenario E).


Table 1.
Summary of data considered in this study.
| Data | Resolution | Date | Source |
|---|---|---|---|
| Pre-sliding DEM | 12.5 m | / | Alos PalSAR |
| Geologic map | 1:100,000 | / | Gansu Geological Engineering Survey Institute |
| Sentinel-1A | VV | March 2017–December 2020 | European Space Agency |
| Historical satellite images | 0.5 m | 9 December 2013/3 January 2016/ 21 November 2018/2 July 2020 | Pleiades A/B |
| Rainfall data | 1 day | January 2020–December 2020 | Surface weather station |
| ERT data | 5 m | September 2021 | Field actual exploration |
| Post-sliding DSM | 0.35 m | August 2020 | Field aerial survey by UAV (DJI Phantom 4 RTK) |
Table 2.
Parameters used in the numerical simulation.
| Parameter | Symbol | Unit | Exp. Land Slide | Exp. Dam Break |
|---|---|---|---|---|
| Solid material density | pS | kg/m3 | 2850 | 2850 |
| Fluid material density | pF | kg/m3 | 1000 | 1000 |
| Internal friction angle | φ | degree | 35 | / |
| Basal friction angle | δ | degree | 22.5 | / |
| Parameter for combination of solid- and fluid-like contributions to drag resistance | P | / | 1 | 0.5 |
| Ambient drag coefficient | CAD | / | 0 | 0.05 |
| Entrainment coefficient | CE | kg−1 | 10−6.0 | 10−6.5 |
Disclaimer/Publisher’s Note: The statements, opinions and data contained in all publications are solely those of the individual author(s) and contributor(s) and not of MDPI and/or the editor(s). MDPI and/or the editor(s) disclaim responsibility for any injury to people or property resulting from any ideas, methods, instructions or products referred to in the content. |
© 2023 by the authors. Licensee MDPI, Basel, Switzerland. This article is an open access article distributed under the terms and conditions of the Creative Commons Attribution (CC BY) license (https://creativecommons.org/licenses/by/4.0/).
Share and Cite
MDPI and ACS Style
Shi, W.; Chen, G.; Meng, X.; Bian, S.; Jin, J.; Wu, J.; Huang, F.; Chong, Y. Formation and Hazard Analysis of Landslide Damming Based on Multi-Source Remote Sensing Data. Remote Sens. 2023, 15, 4691. https://doi.org/10.3390/rs15194691
AMA Style
Shi W, Chen G, Meng X, Bian S, Jin J, Wu J, Huang F, Chong Y. Formation and Hazard Analysis of Landslide Damming Based on Multi-Source Remote Sensing Data. Remote Sensing. 2023; 15(19):4691. https://doi.org/10.3390/rs15194691
Chicago/Turabian StyleShi, Wei, Guan Chen, Xingmin Meng, Shiqiang Bian, Jiacheng Jin, Jie Wu, Fengchun Huang, and Yan Chong. 2023. "Formation and Hazard Analysis of Landslide Damming Based on Multi-Source Remote Sensing Data" Remote Sensing 15, no. 19: 4691. https://doi.org/10.3390/rs15194691
Note that from the first issue of 2016, this journal uses article numbers instead of page numbers. See further details here.