
Ecological Water Requirement of Vegetation and Water Stress Assessment in the Middle Reaches of the Keriya River Basin
Abstract
:
1. Introduction
2. Materials and Methods
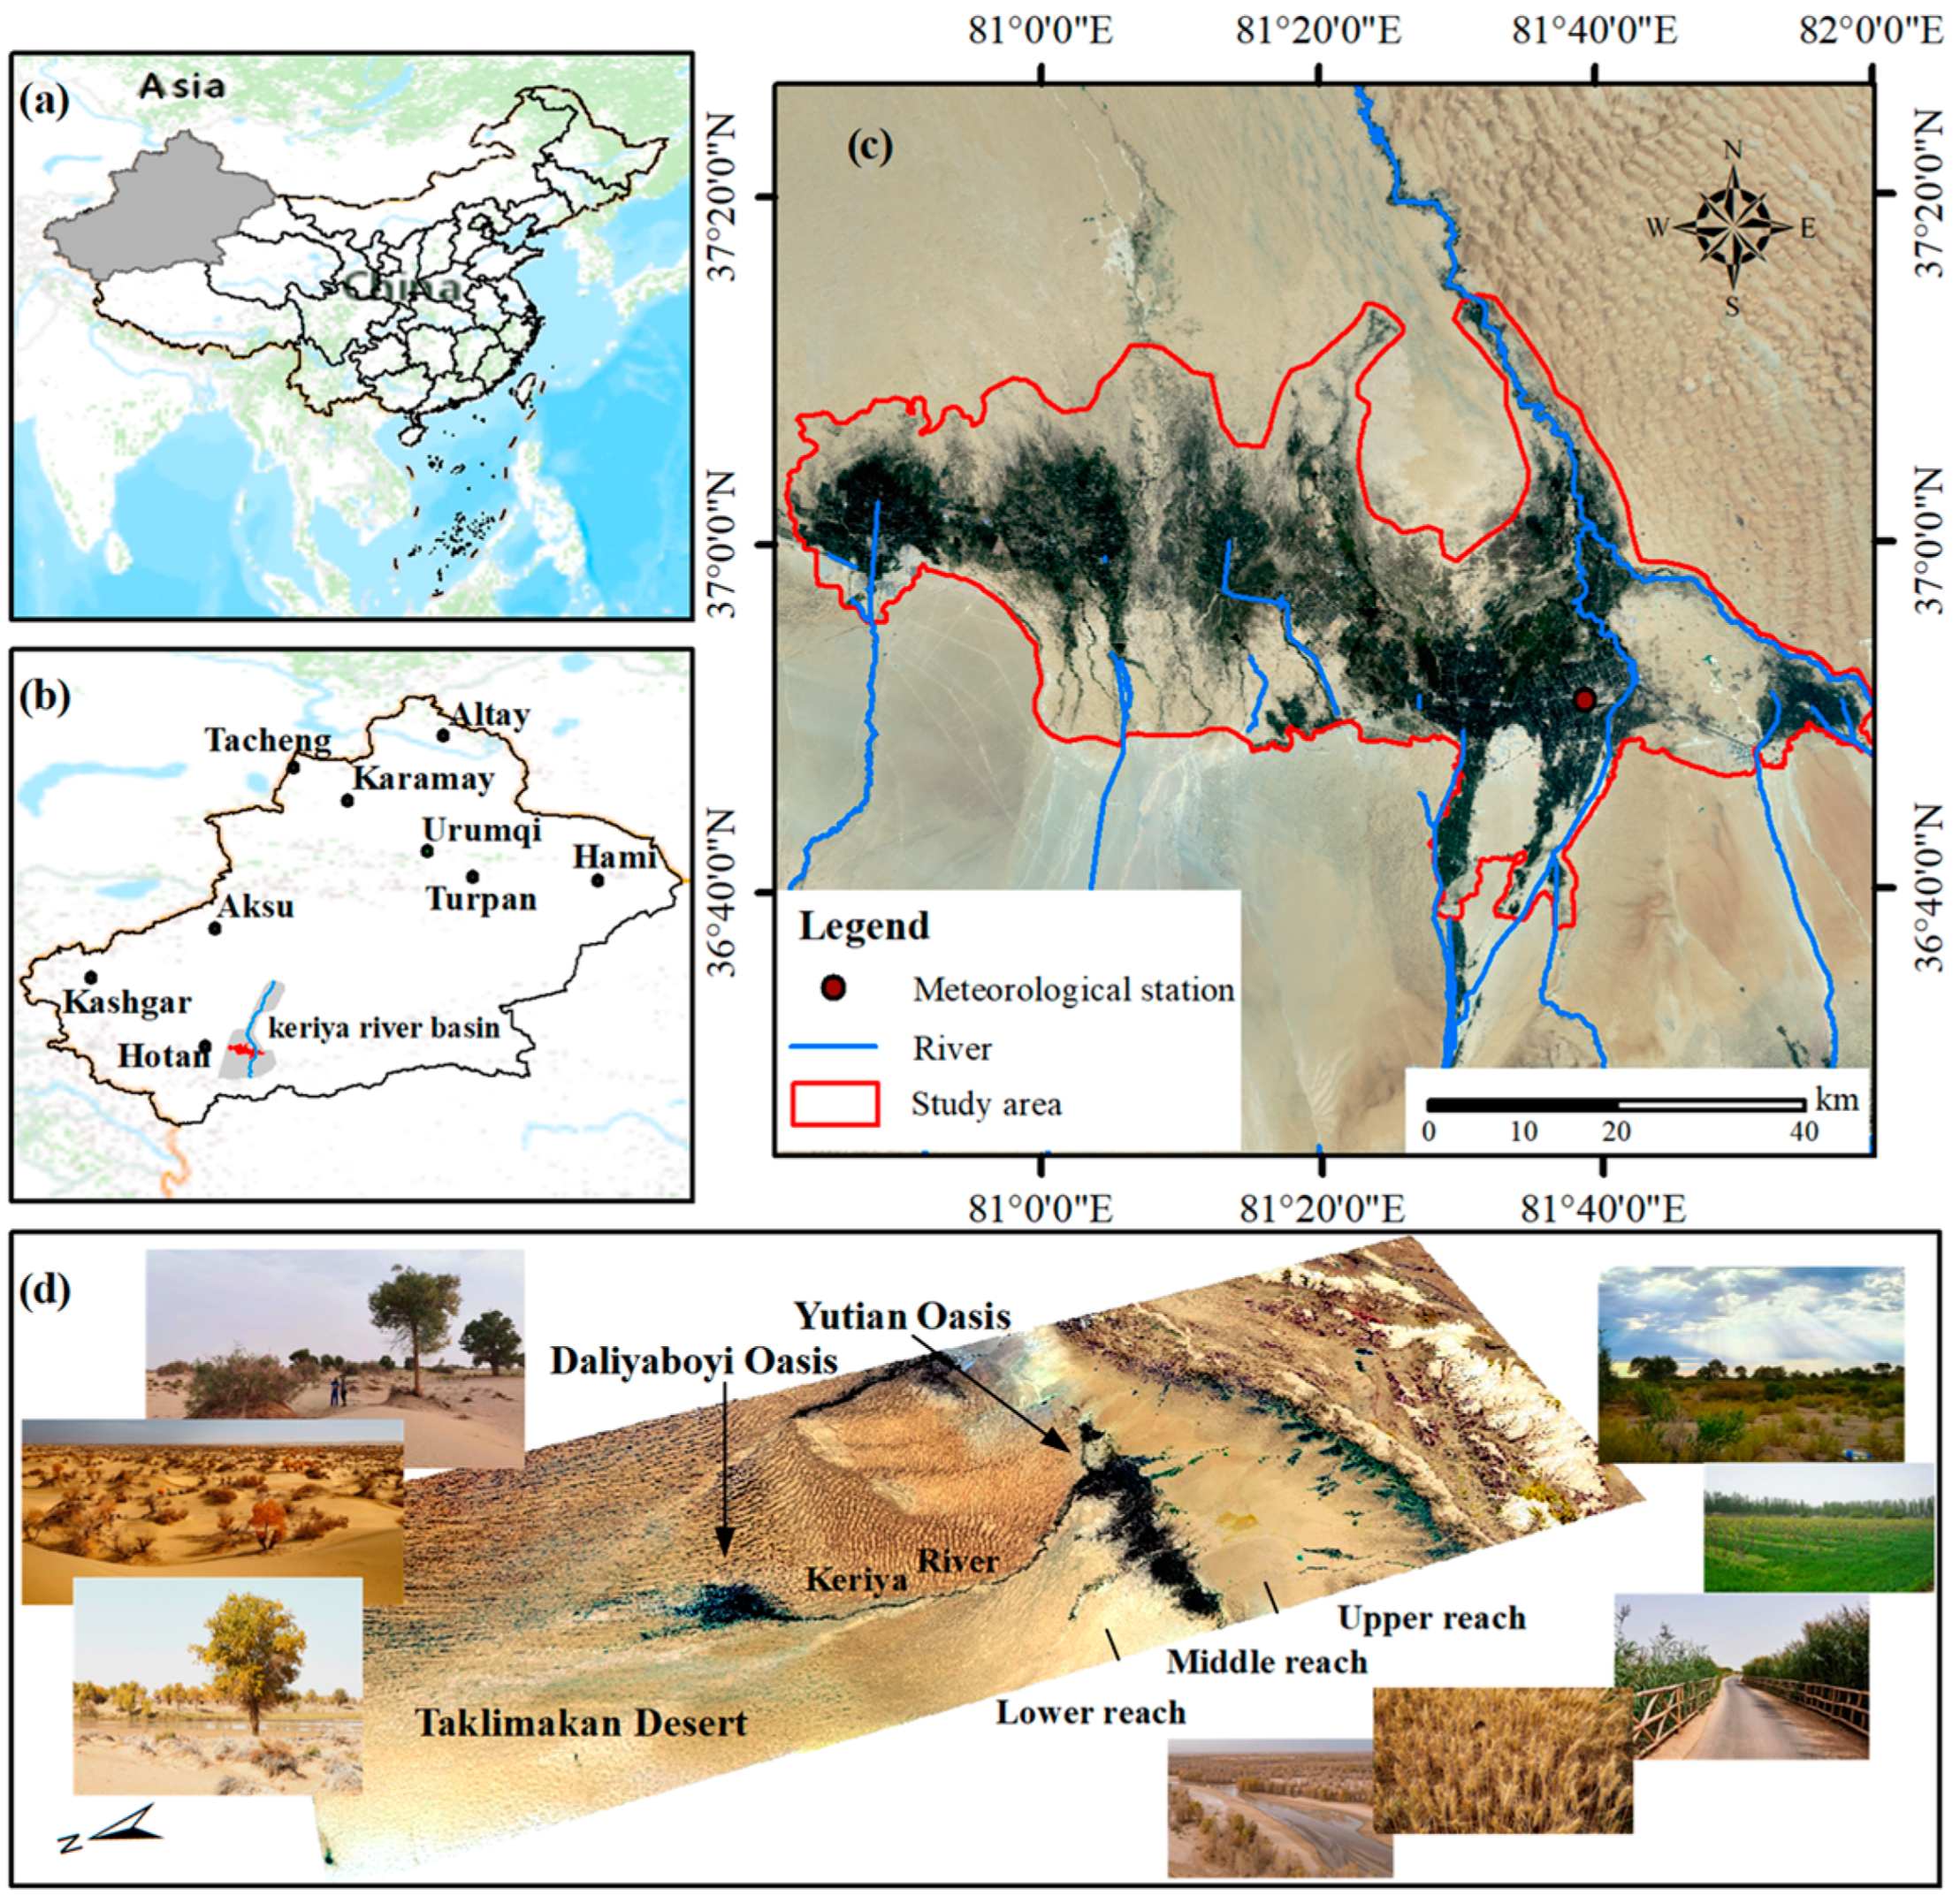
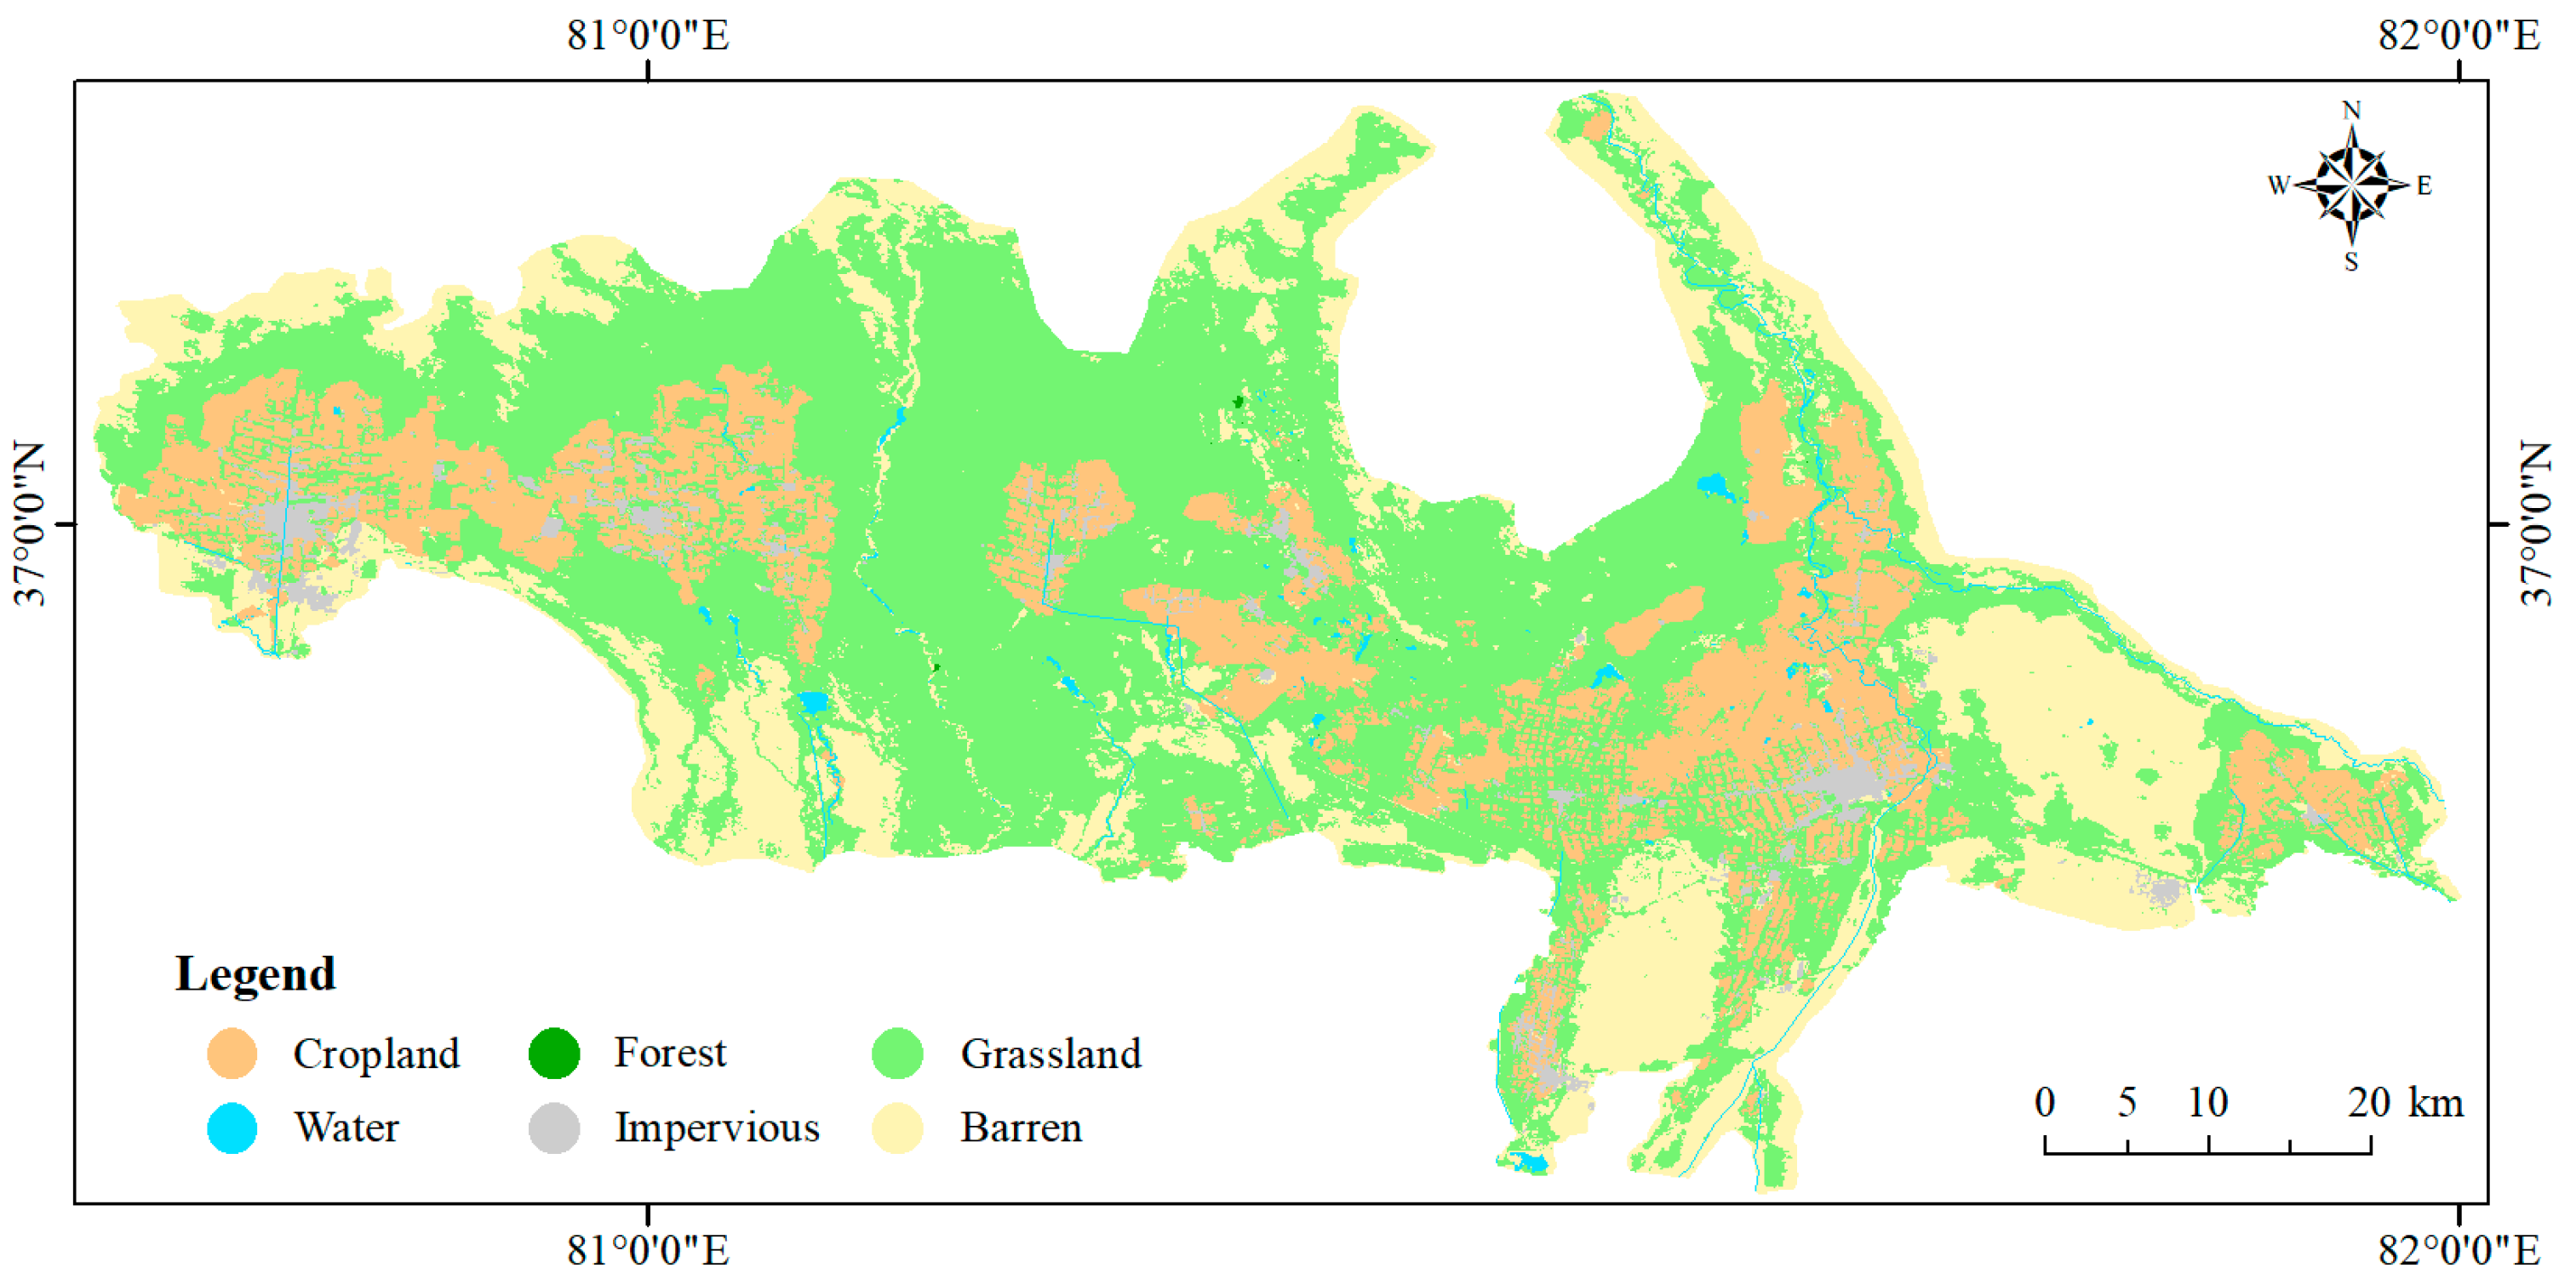
2.1. Study Area
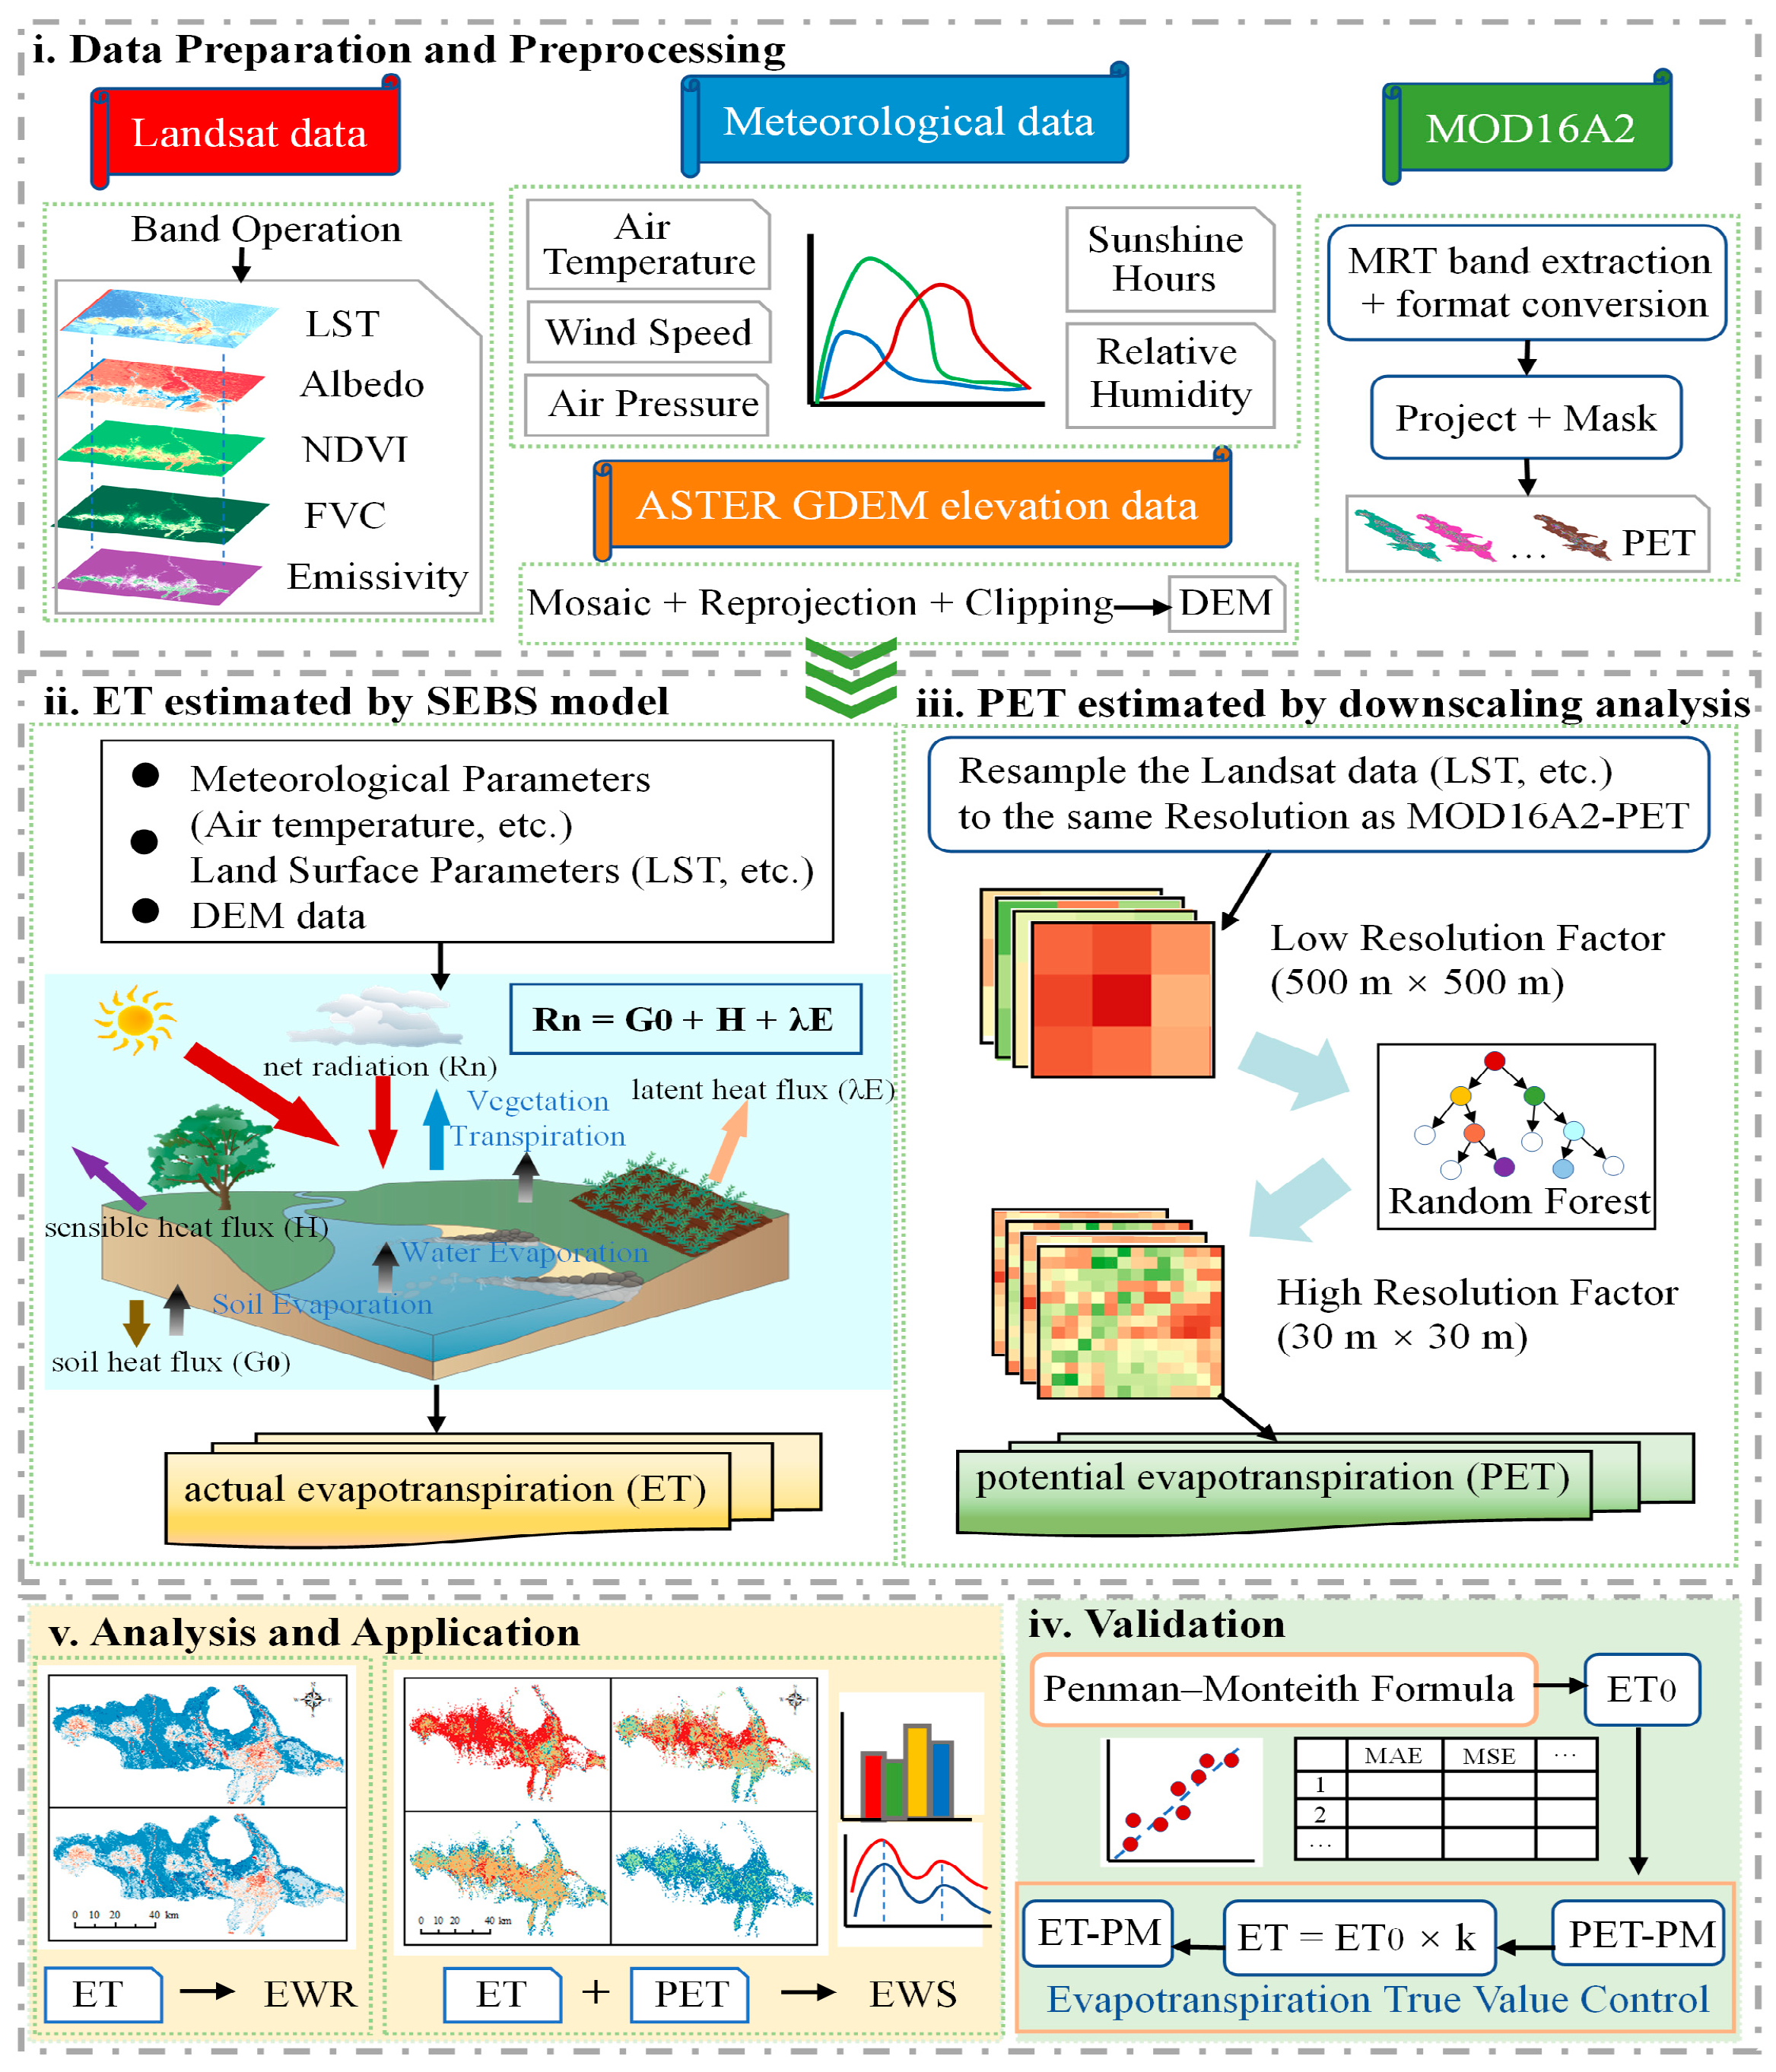
2.2. Data
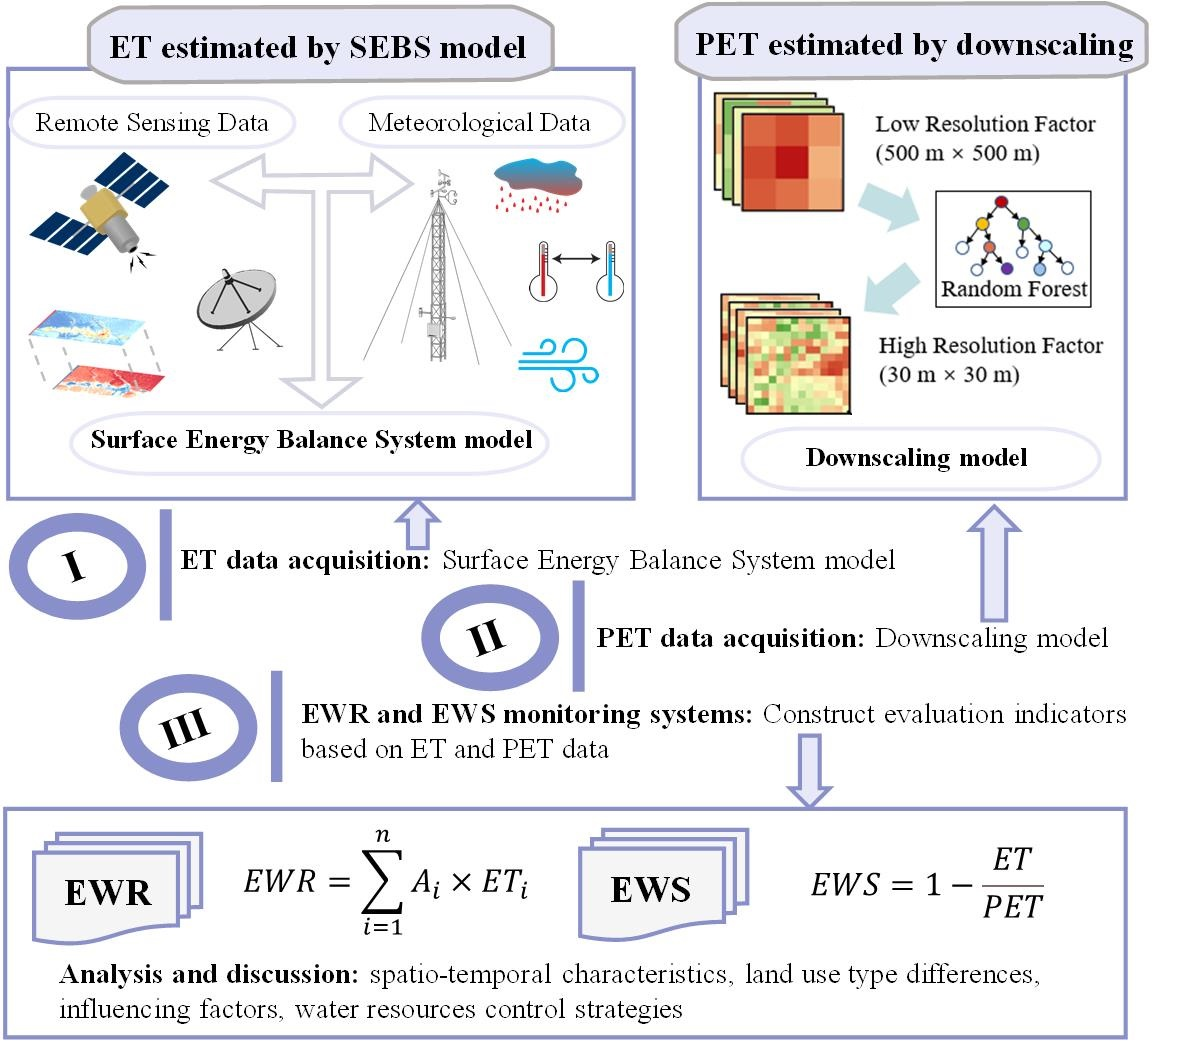
2.3. Methods
2.3.1. The SBES Model
2.3.2. Downscaling Analysis of PET
2.3.3. Calculation of Vegetation EWR
2.3.4. Calculation of EWS
3. Results
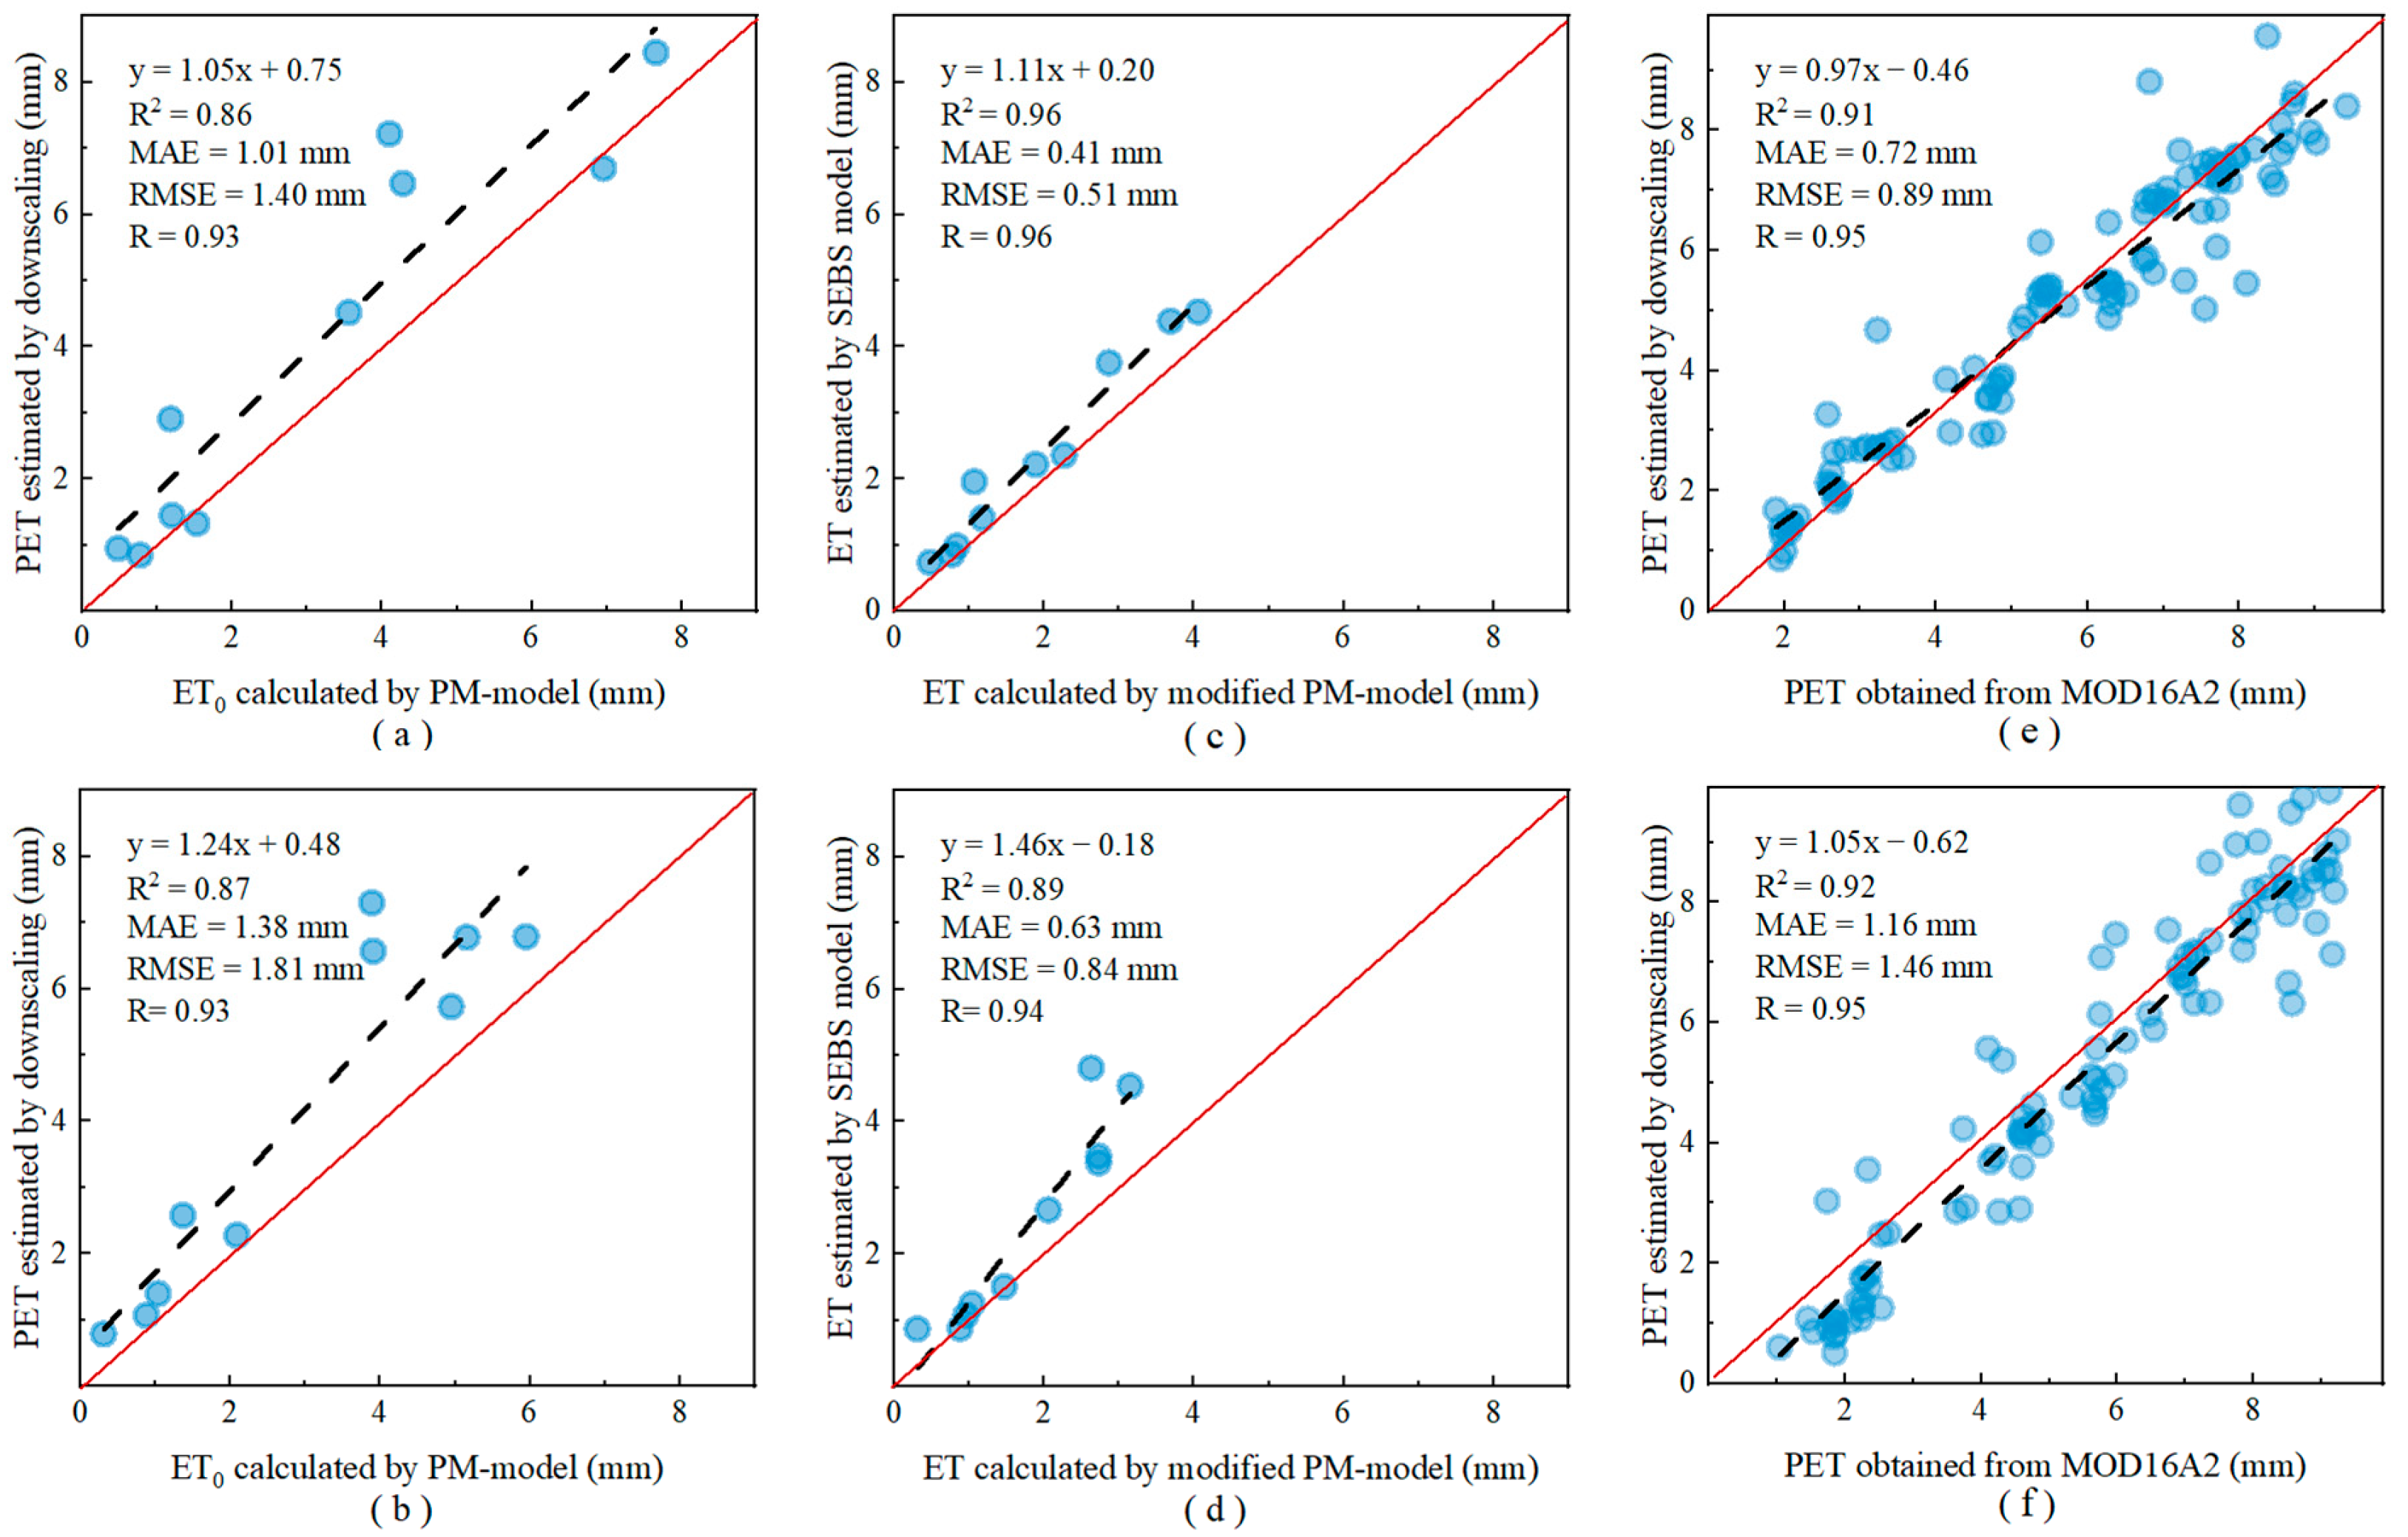
3.1. Verification of the Rationality of the Results
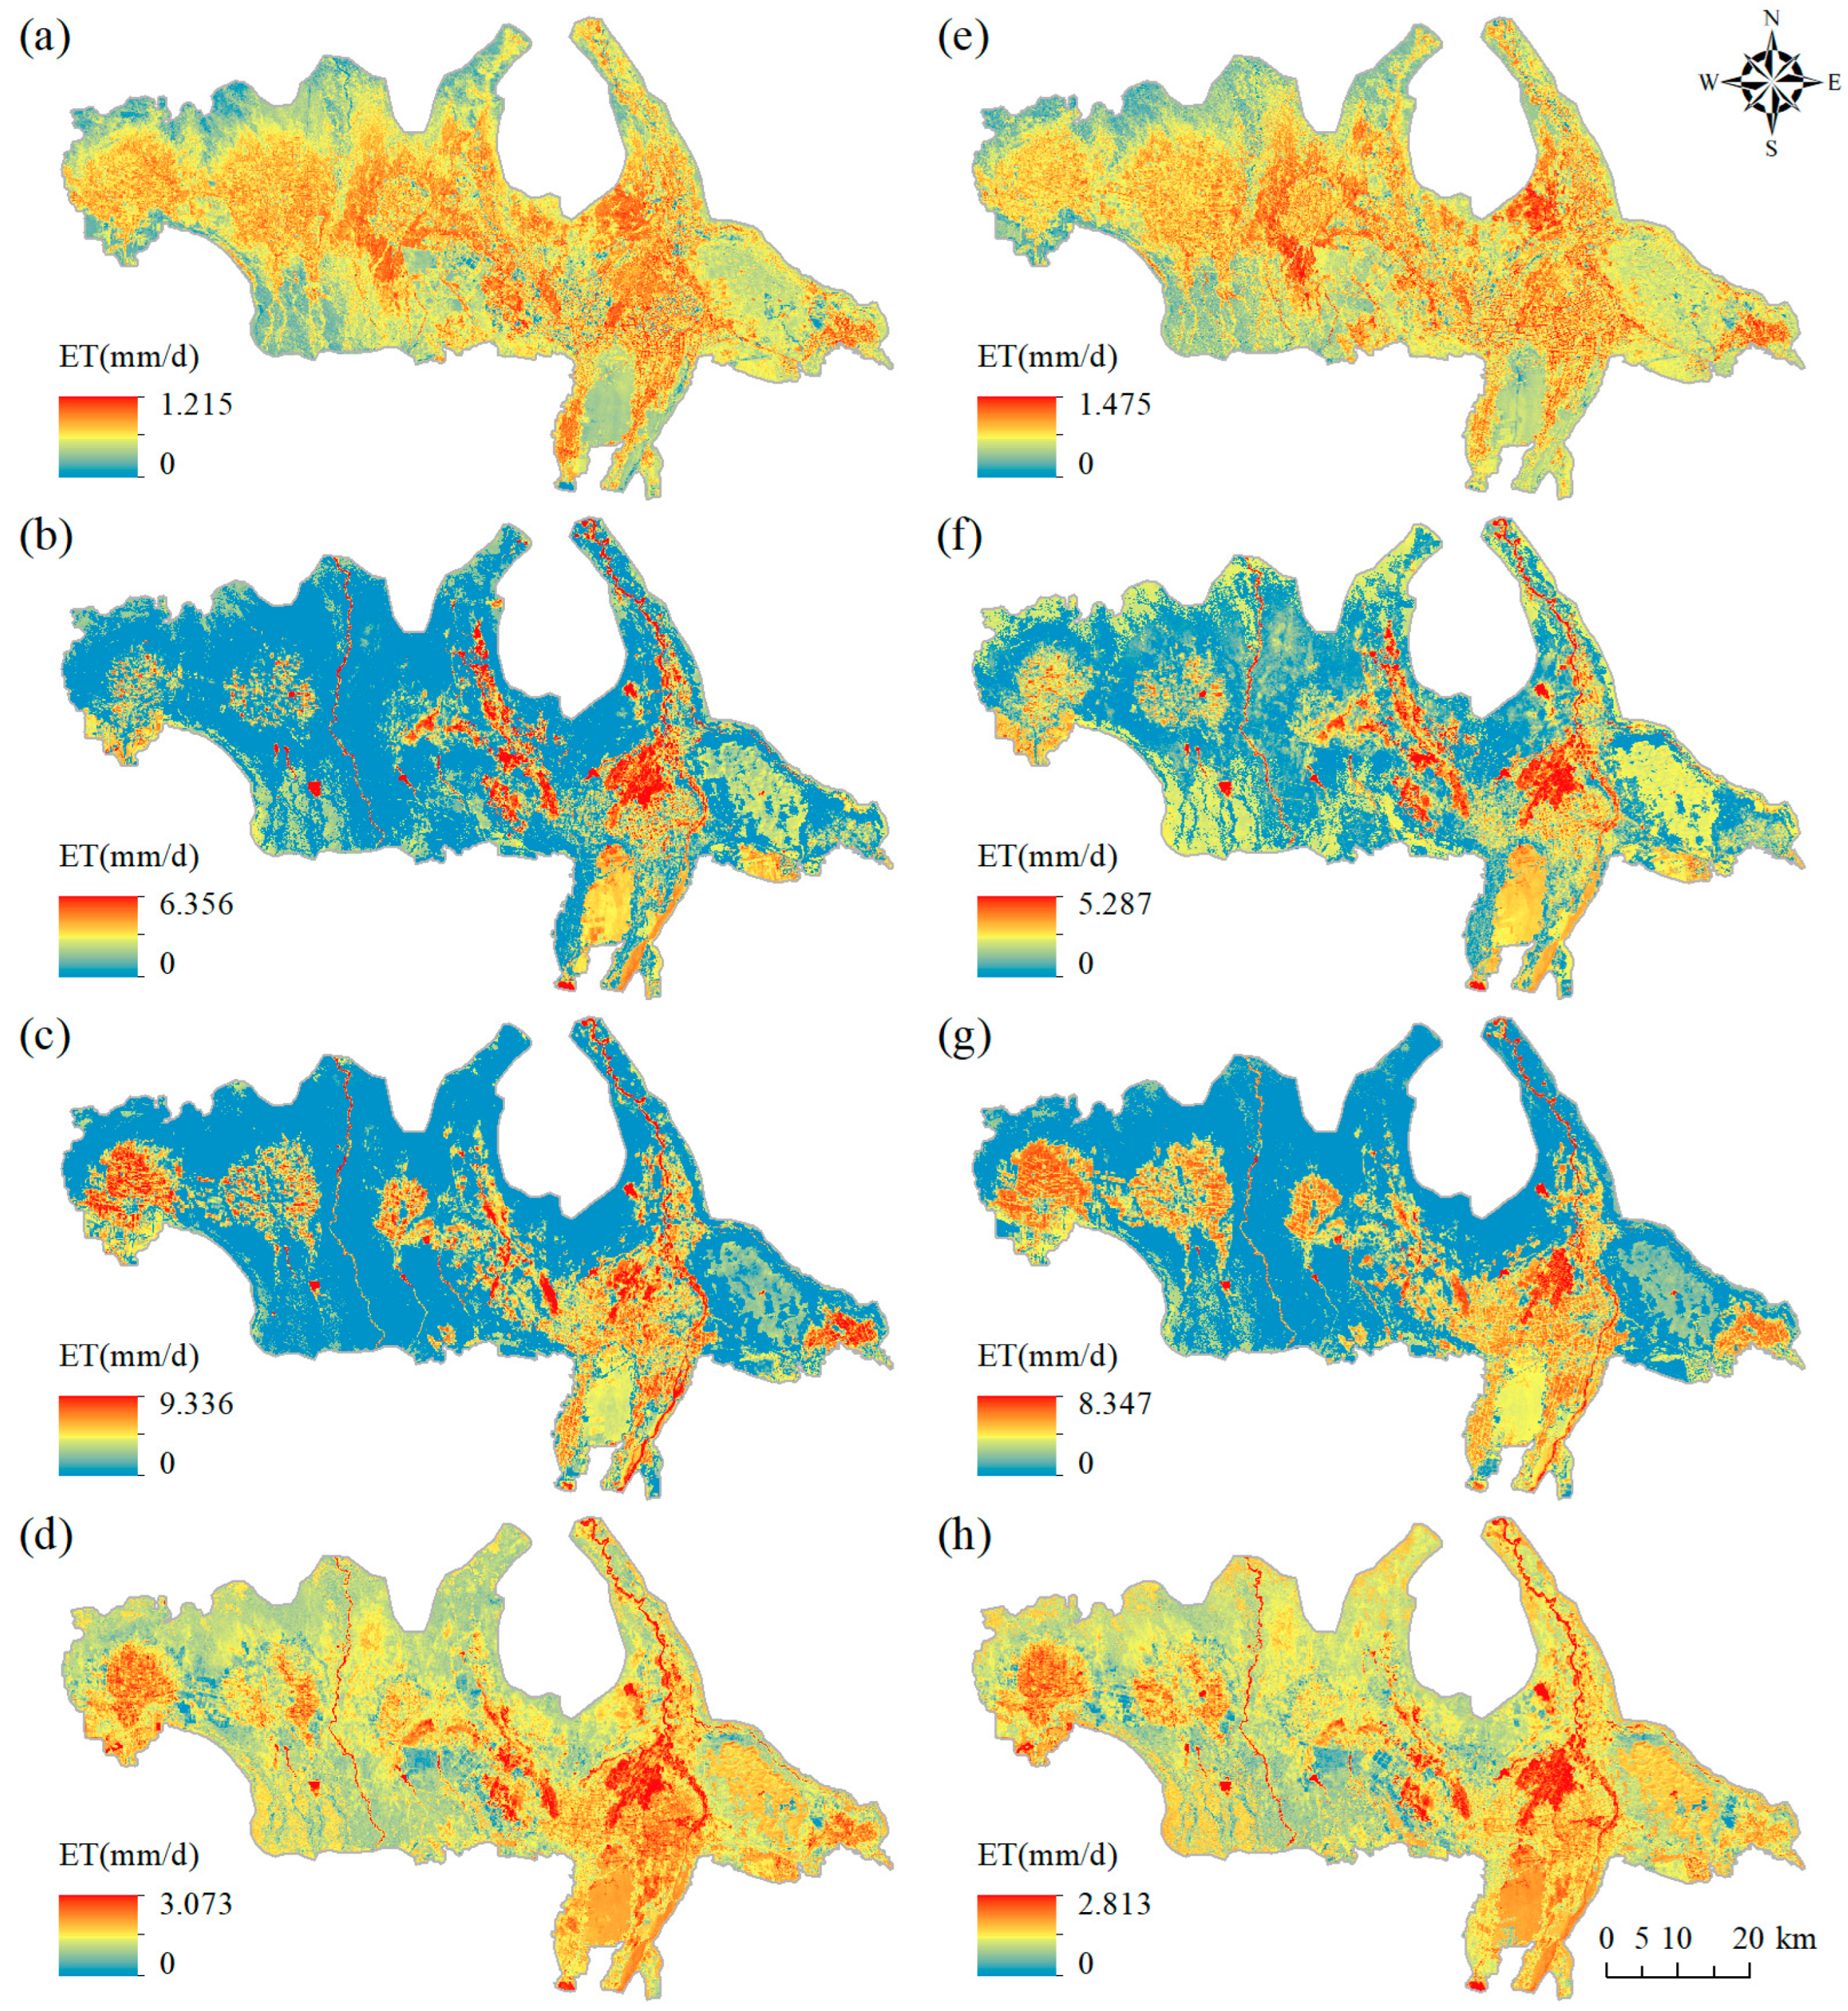
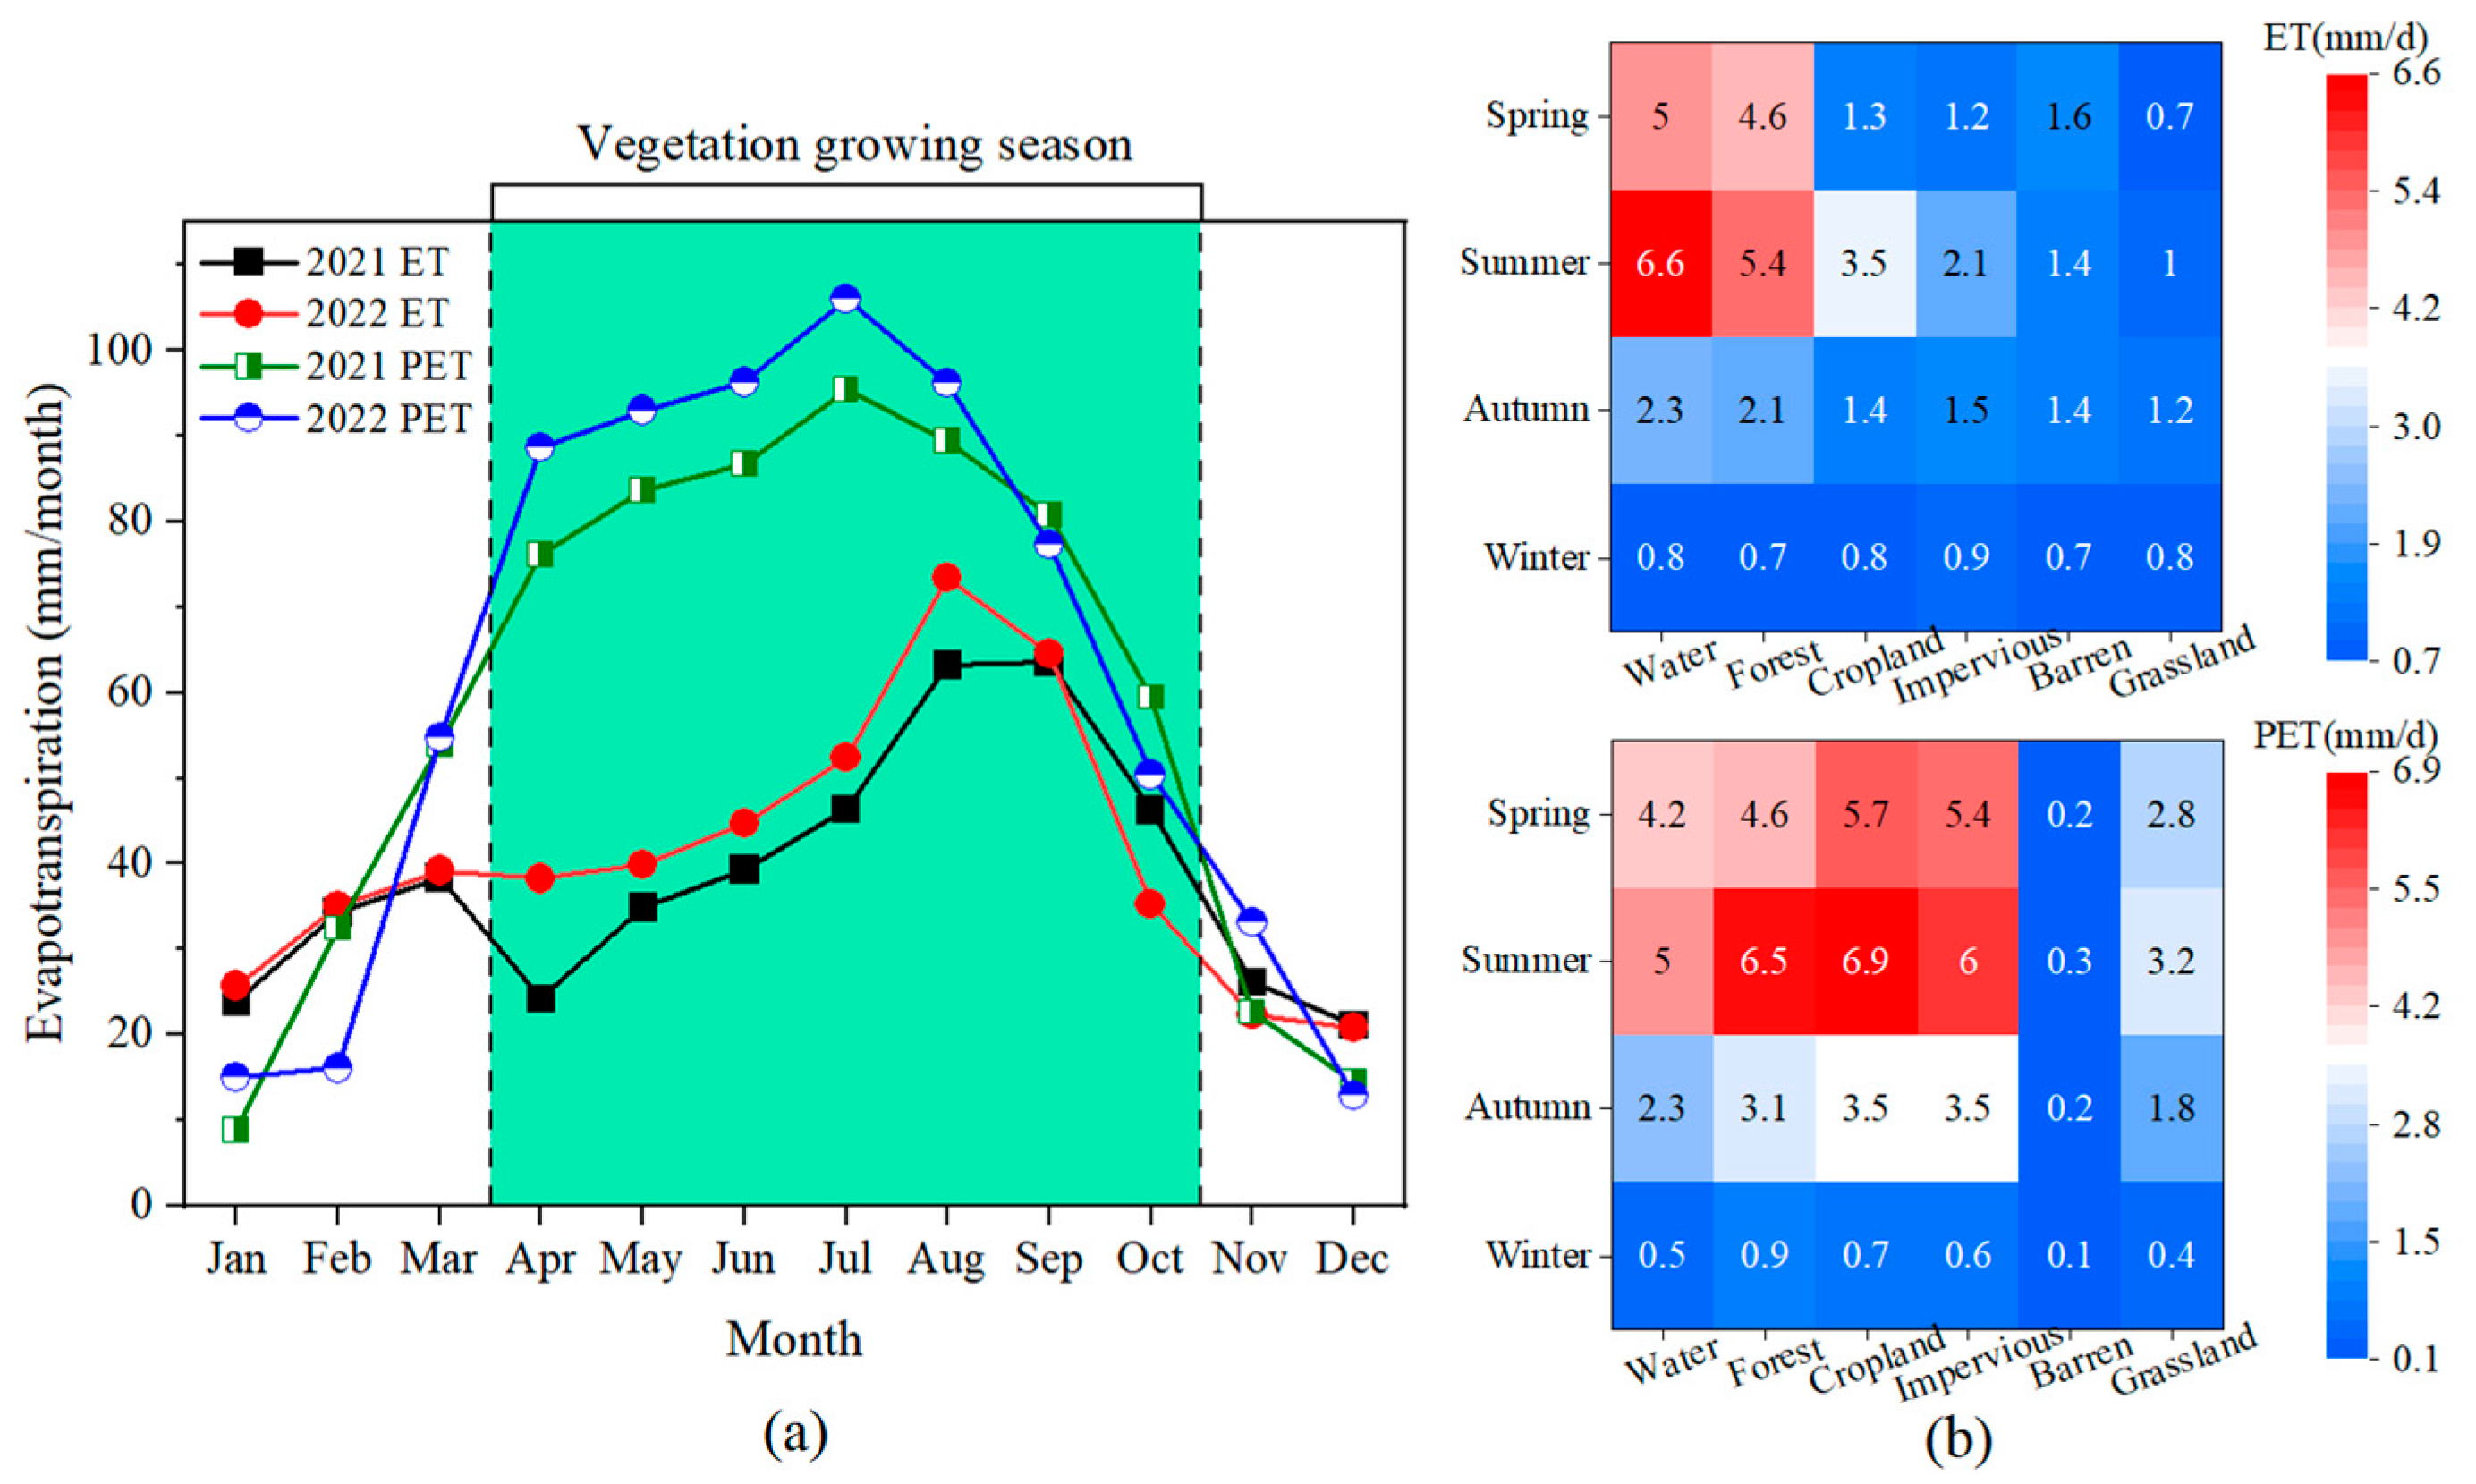
3.2. Spatiotemporal Characteristics of Evapotranspiation (ET and PET)
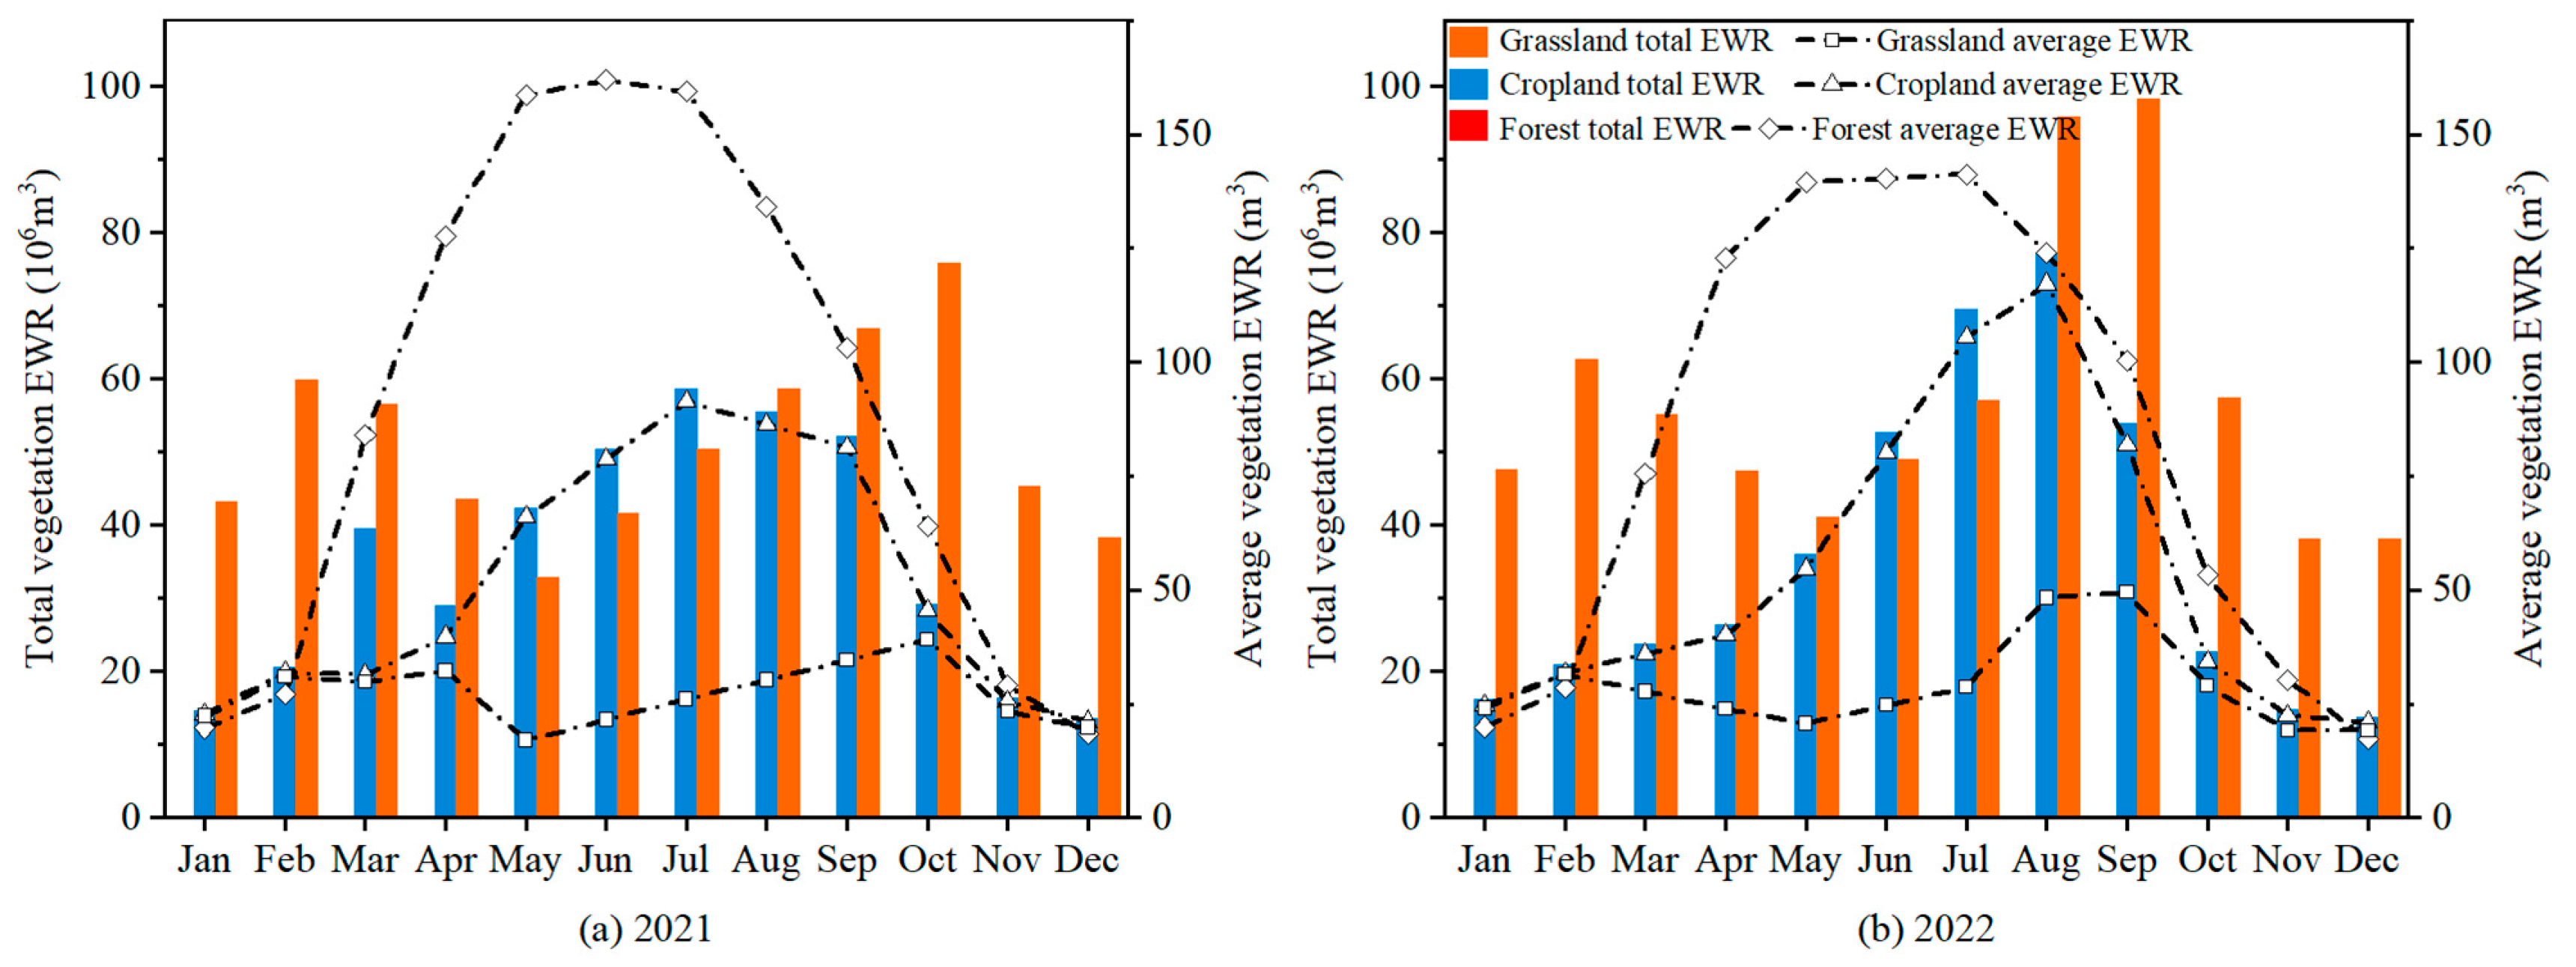
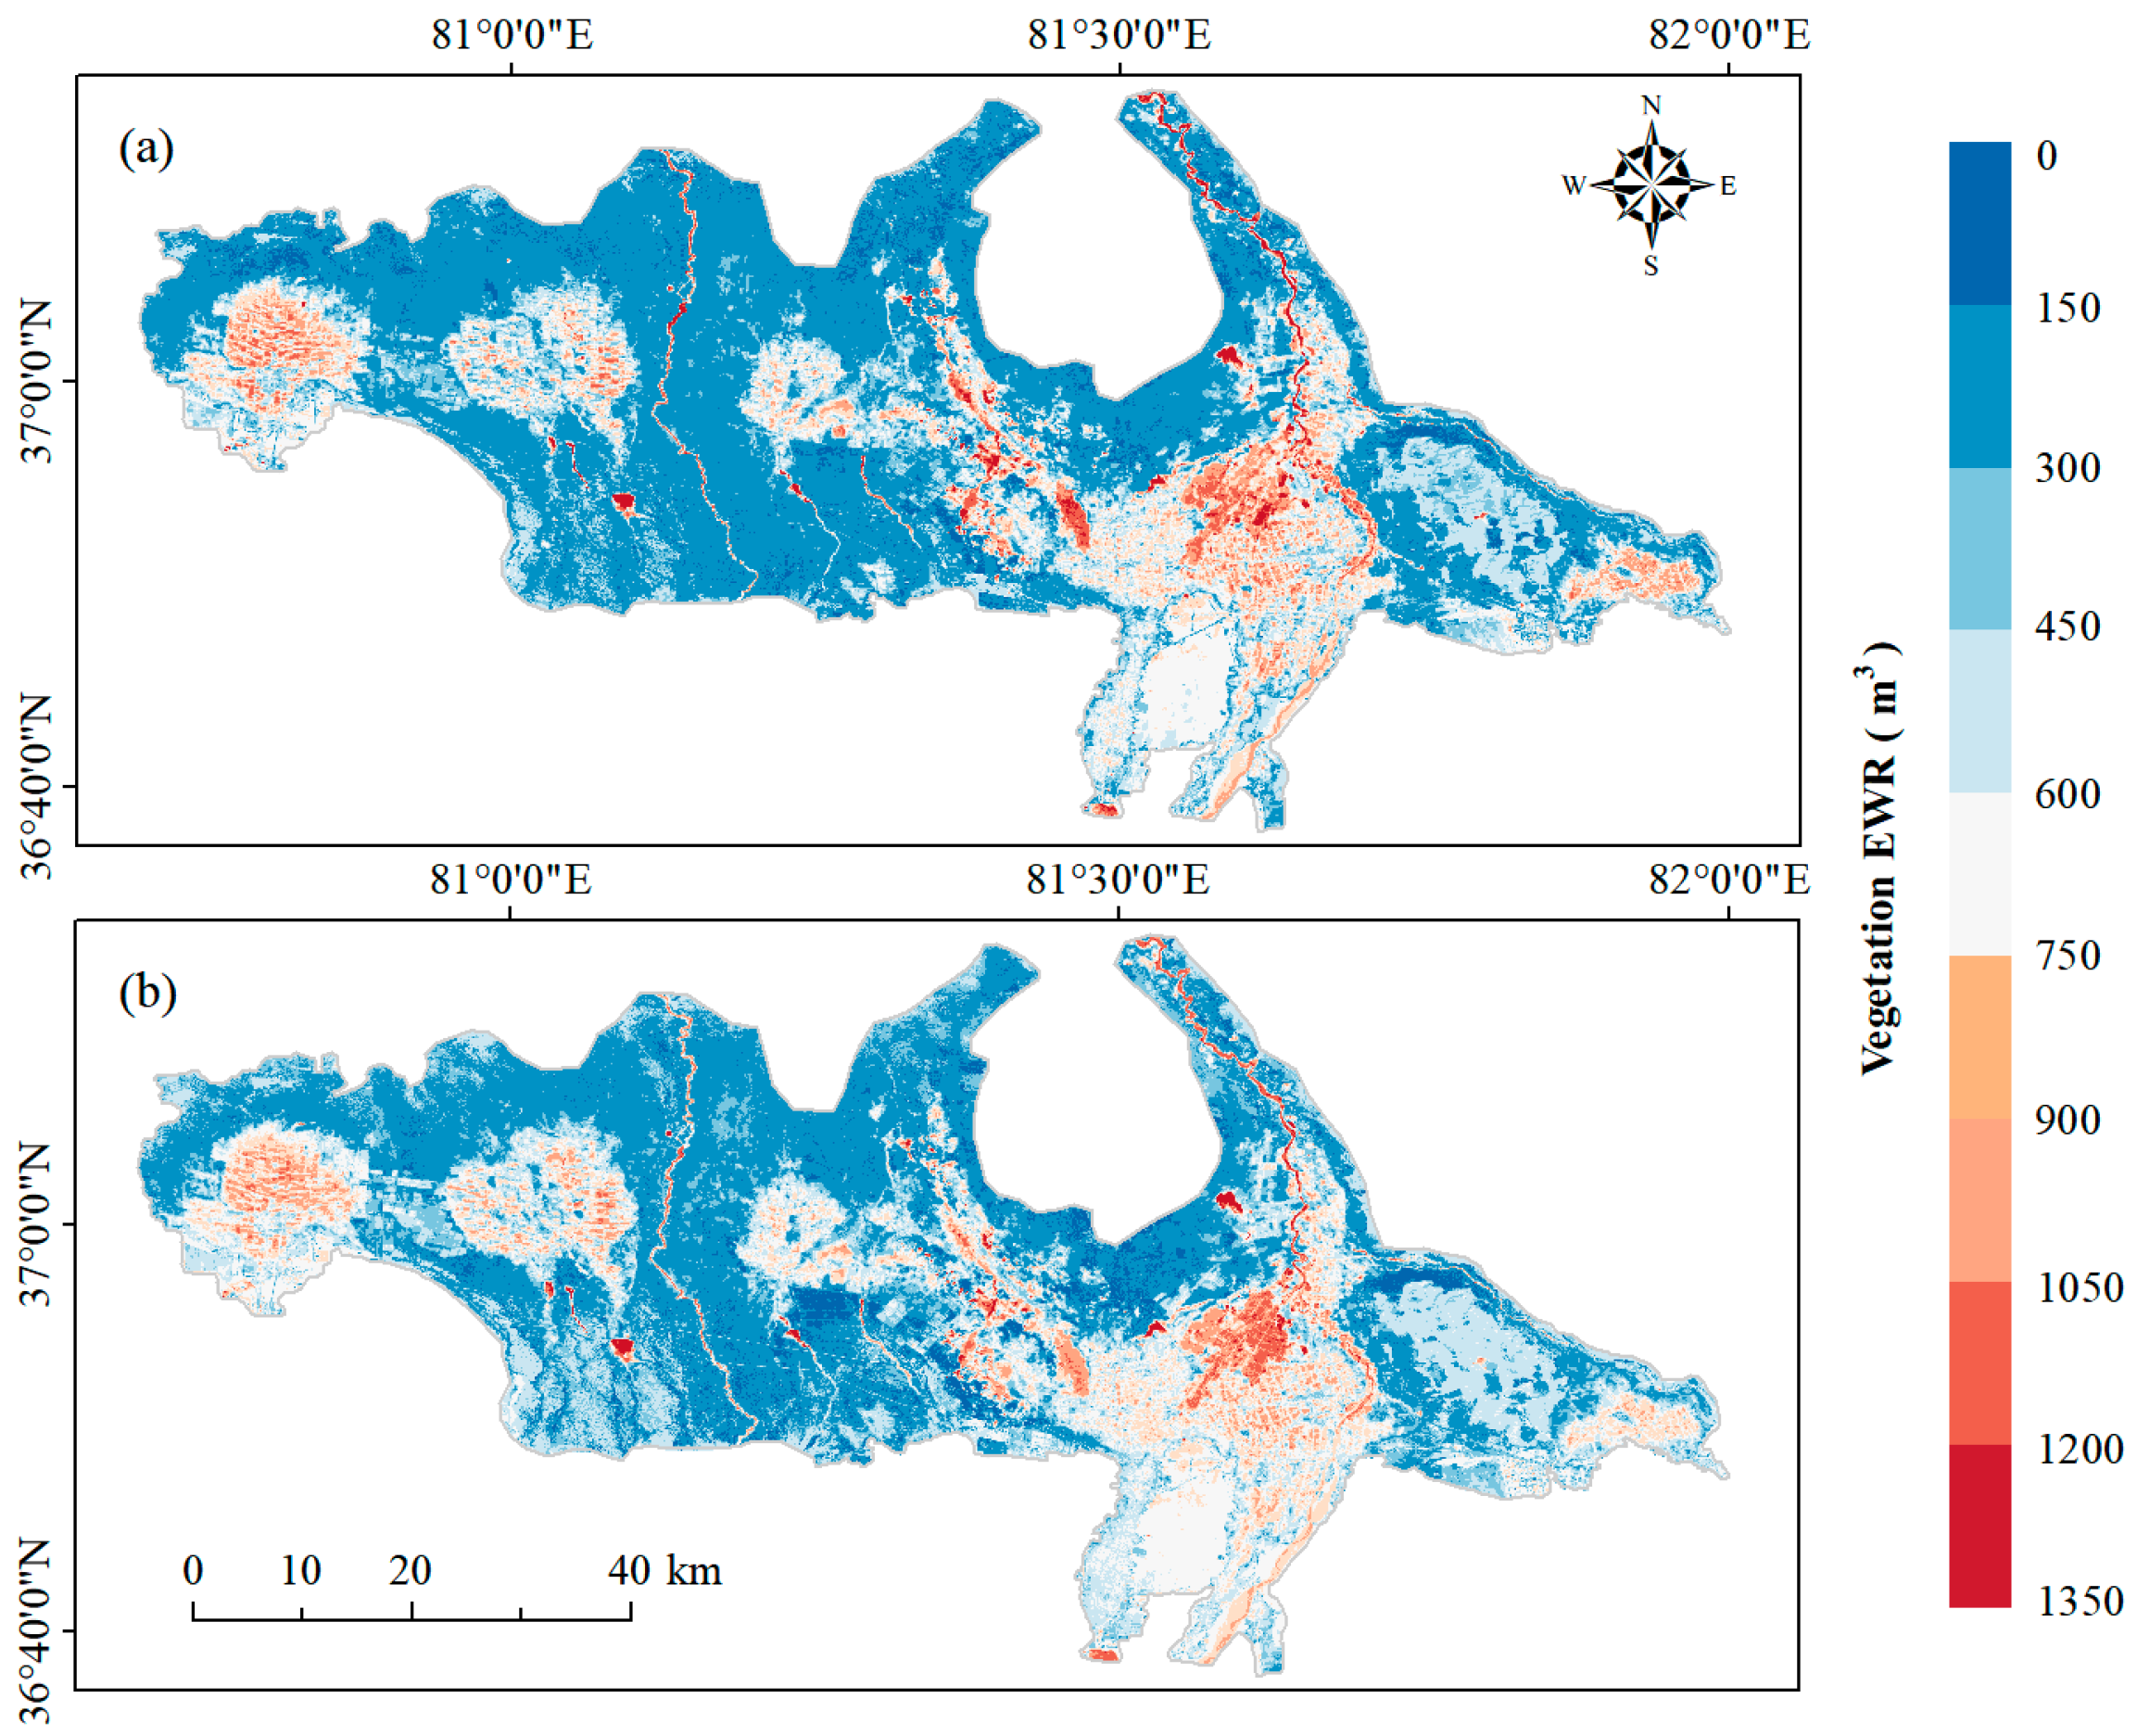
3.3. Spatiotemporal Characteristics of Vegetation EWR
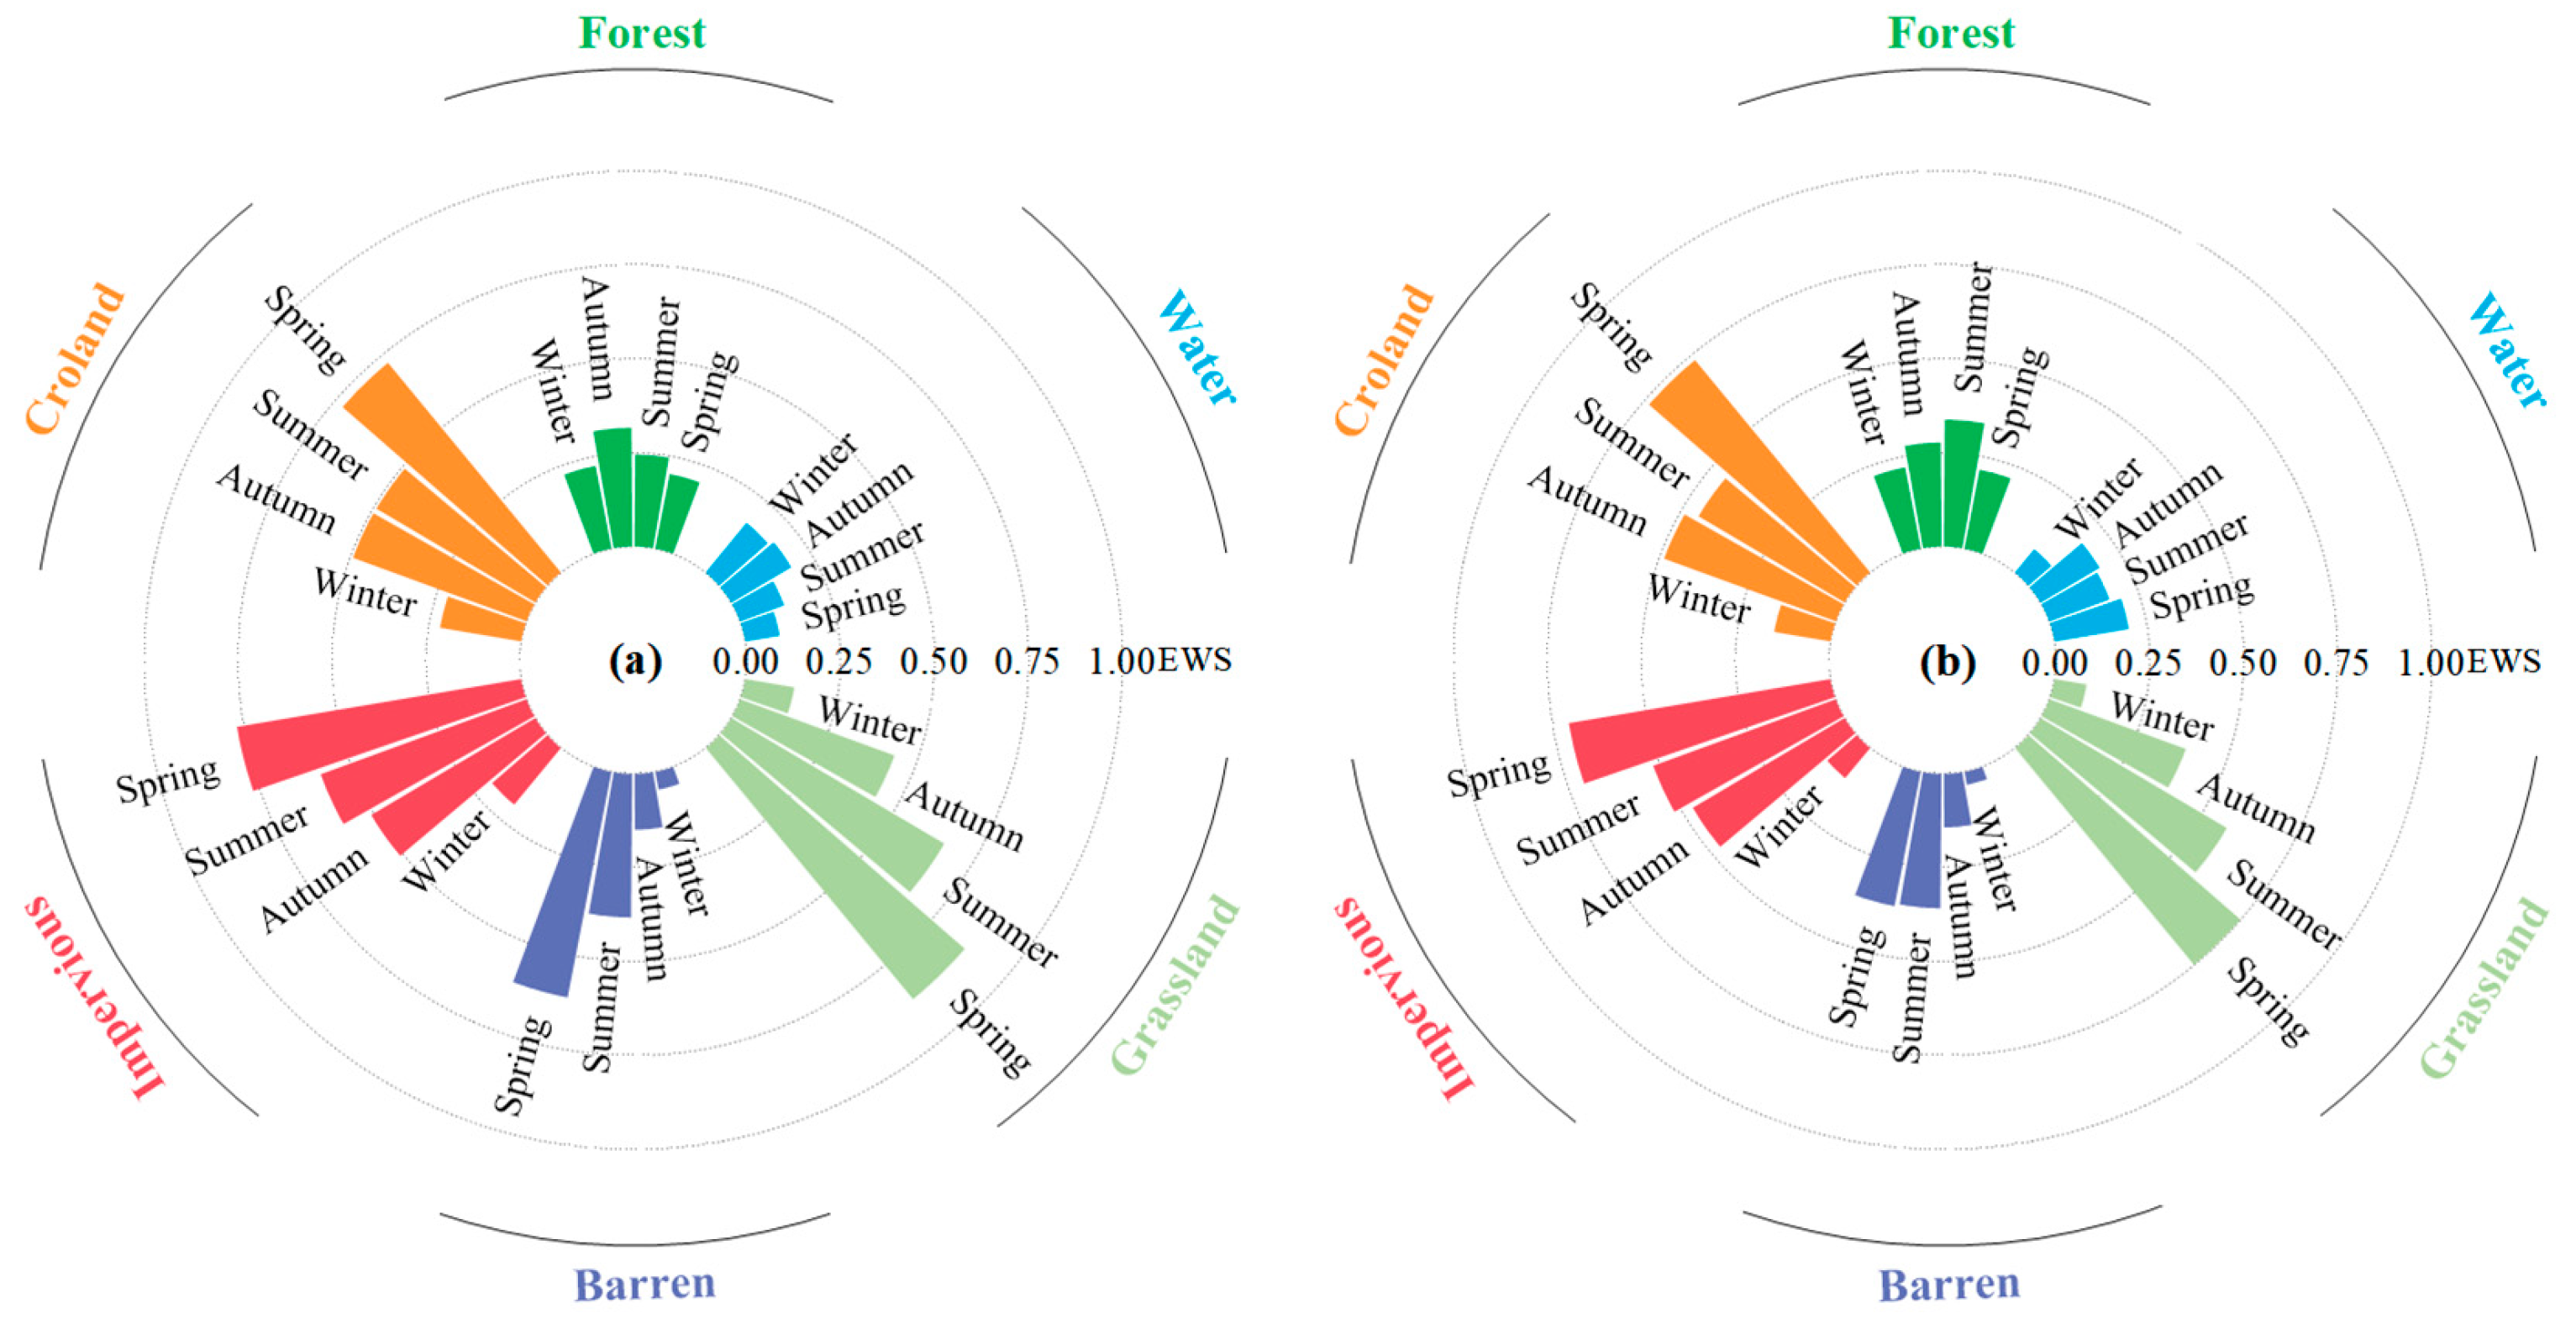
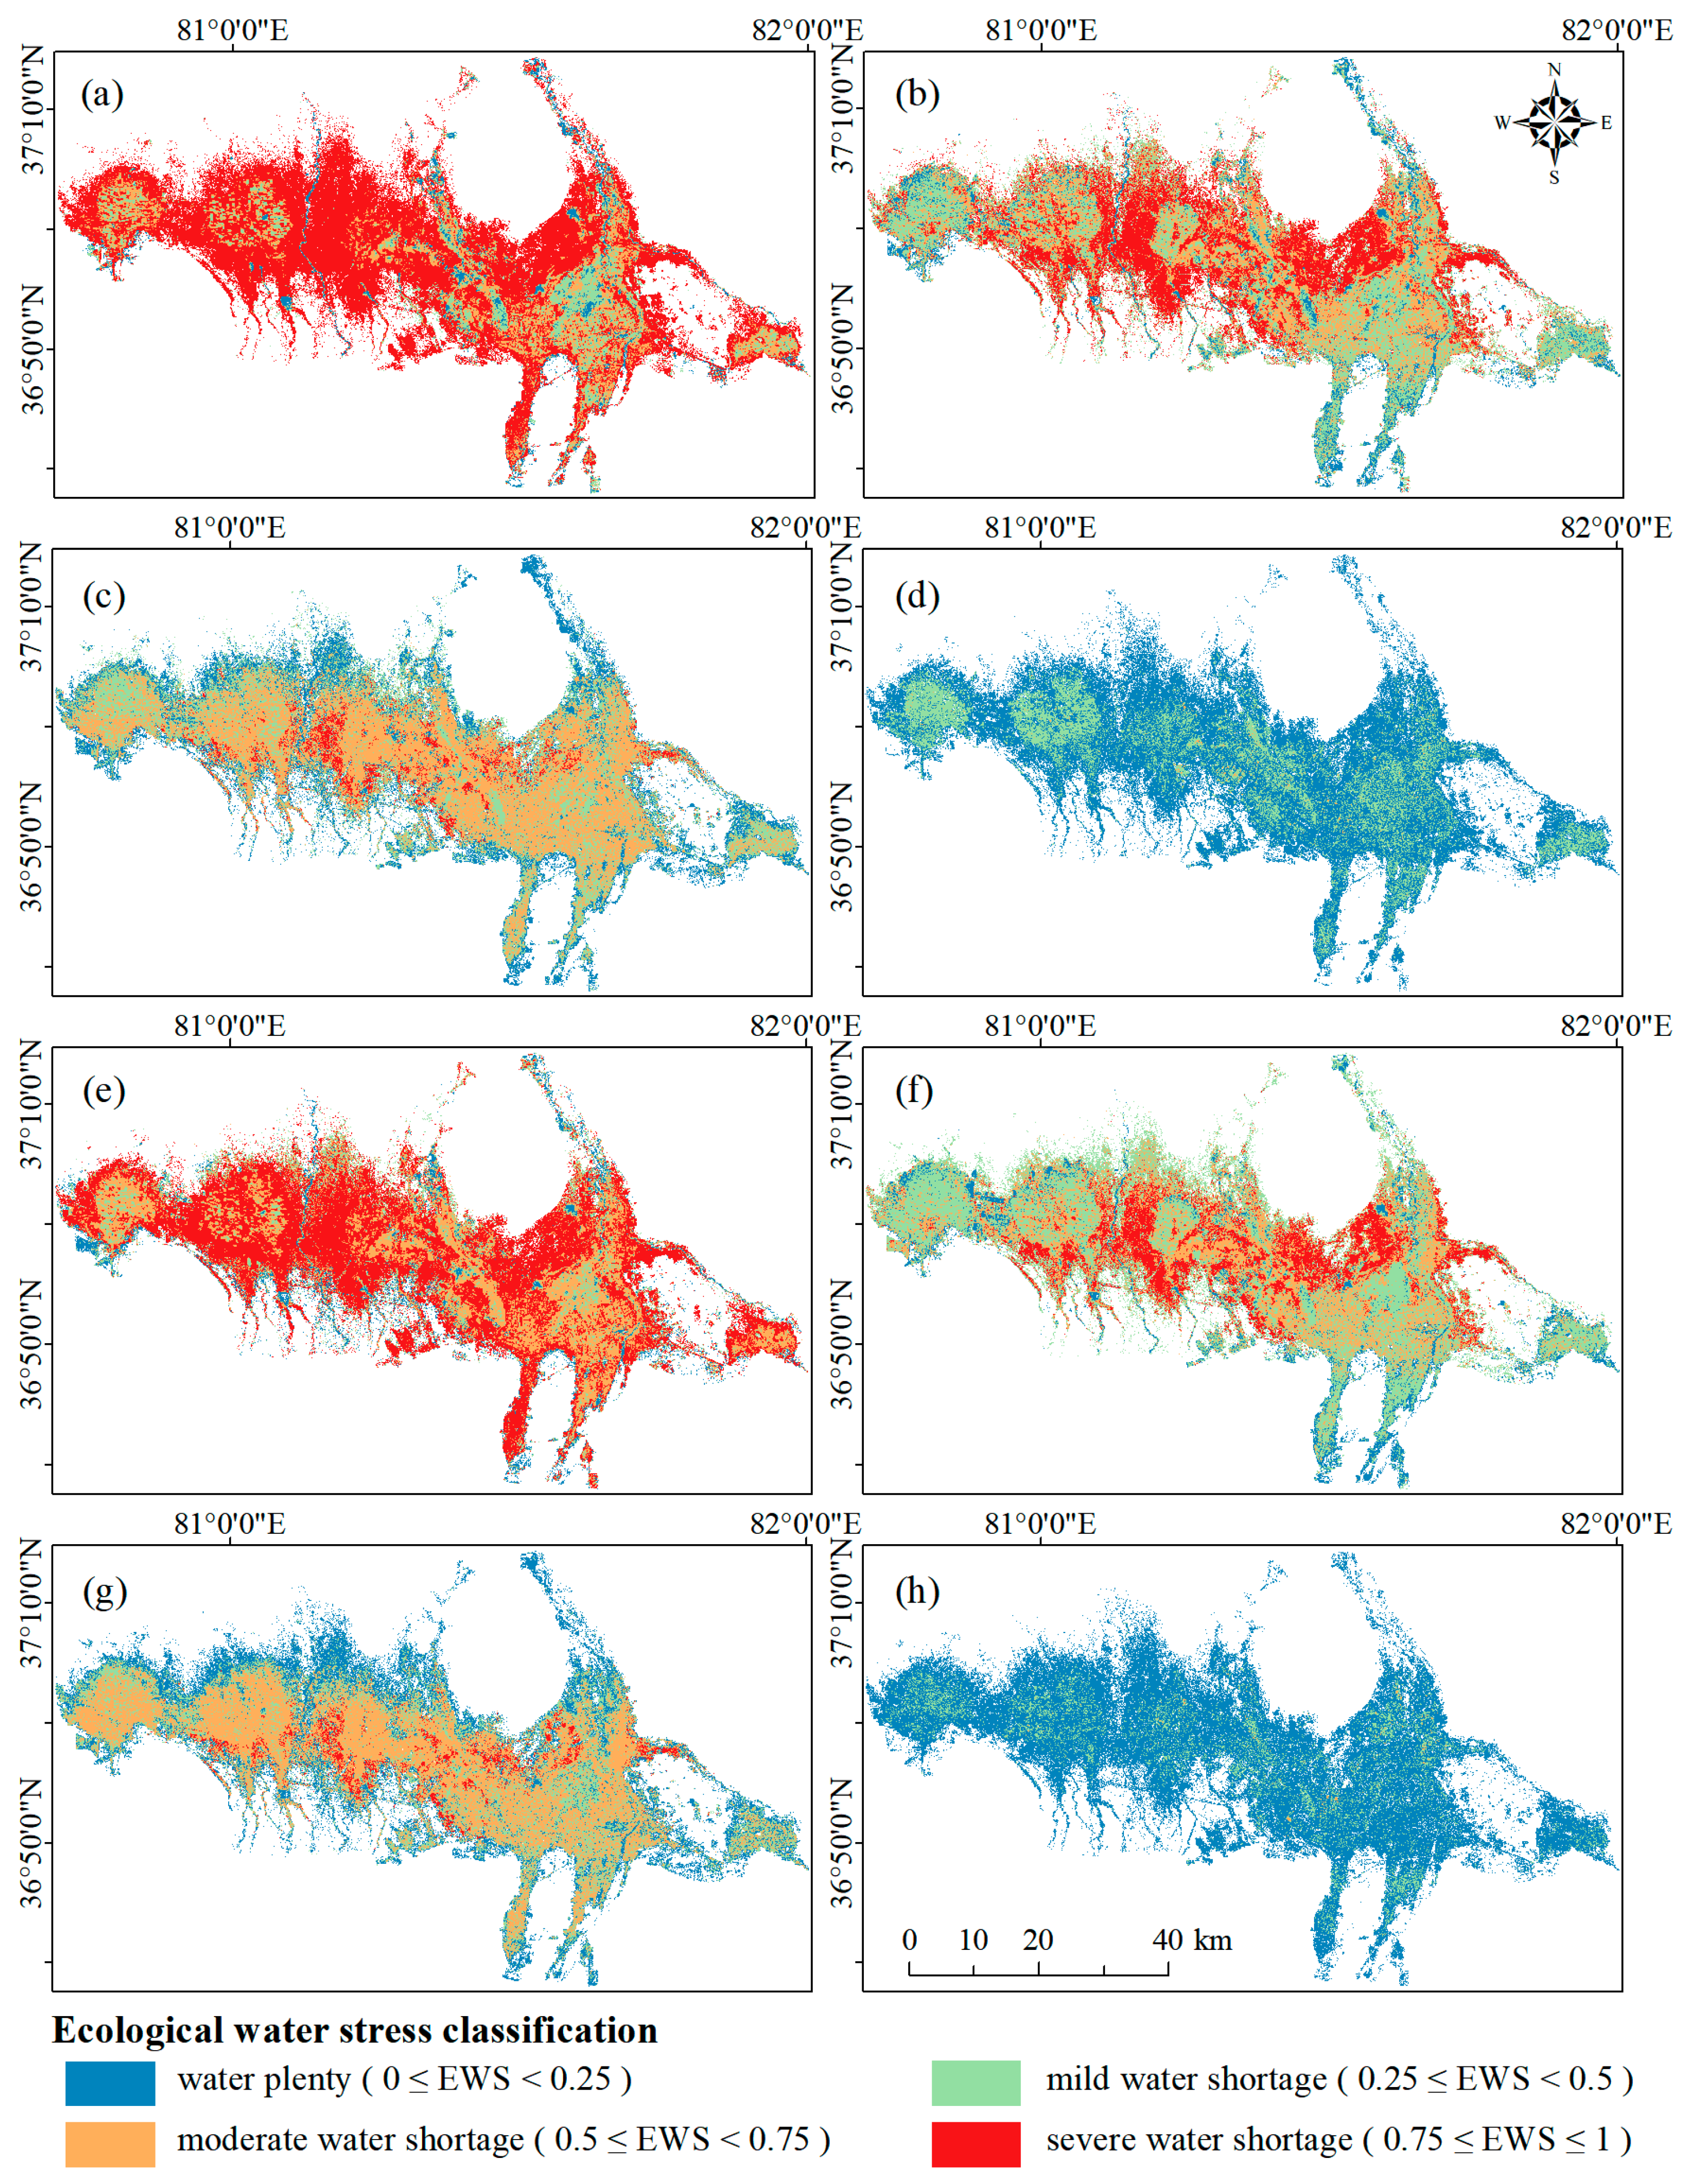
3.4. Spatiotemporal Characteristics of EWS
4. Discussion
4.1. Comprehensive Effects of Vegetation and Water on ET, EWR, and EWS
4.2. Analysis of Driving Factors on ET, EWR, and EWS
4.3. Suggestions for Water Resource Regulation
- Delineate water ecological protection zones and protect the ecological pattern of vegetation. The results of the study showed that grasslands closer to the river experience lower water stress, while those farther away endure higher water stress, particularly in spring. Therefore, it is necessary to designate grassland areas with high vulnerability as no-grazing areas and implement protection rather than restoration for areas with severe water shortages [49]. Additionally, controlling the expansion of cultivated land and the encroachment of deserts is essential to preserve grassland ecological spaces. Delineate the red line for grassland protection and return farmland to grassland in due course. Furthermore, promoting salt and desertification prevention, such as shelterbelt construction to minimize wind erosion and sand flow into oases, is important for preserving water and soil quality within the watershed and ensuring sustainable water resources.
- Optimize the agriculture, forestry, and animal husbandry structure of the basin while promoting water-saving irrigation technology. The ecological water requirement in the Keriya River Basin follows the order of grassland > cropland > forest land. Therefore, it is necessary to limit the scale of arable land and breeding activities while encouraging the development of forestry, orchards, and other planting industries. Planting perennial pastures also can enhance the ecological carrying capacity of animal husbandry [50]. To alleviate water pressure, the adoption of high-efficiency water-saving irrigation technologies such as sprinkler irrigation and drip irrigation should be promoted. Conservation tillage practices such as using crop straw or plastic film to cover farmland during fallow periods can prevent water loss [49].
- Adjust water use strategies and optimize water distribution plans. Tailored water resource management and allocation strategies should be formulated based on the spatiotemporal variations of water scarcity observed in desert oases. For example, measures should be taken to protect the ecological environment of rivers, prevent excessive production and domestic water use from compromising ecological water availability, and guarantee sufficient river water capacity. When allocating irrigation water, more emphasis should be placed on ecological benefits, while the remaining water can be allocated for socio-economic development. Strengthening the linkages between surface water and groundwater is necessary, with priority given to fulfilling ecological water demand during critical vegetation growth periods. In cases of acute water shortages, measures such as reservoir adjustments and inter-regional water transfers should be considered.
4.4. Strengths and Limitations of This Study
5. Conclusions
Author Contributions
Funding
Data Availability Statement
Acknowledgments
Conflicts of Interest
References
- Yuan, G.F.; Zhu, X.C.; Tang, X.Z.; Du, T.; Yi, X.B. A Species-Specific and spatially-Explicit Model for Estimating Vegetation Water Requirements in Desert Riparian Forest Zones. Water Resour. Manag. 2016, 30, 3915–3933. [Google Scholar] [CrossRef]
- Yu, J.; Yu, S.; Zhang, H.; Wang, Z.; Zhou, C.; Chen, X. Determination of ecological flow thresholds for rainfall-recharging rivers based on multiple hydrological methods. Front. Environ. Sci. 2023, 11, 255. [Google Scholar] [CrossRef]
- Wang, N.; Guo, Y.; Wei, X.; Zhou, M.; Wang, H.; Bai, Y. UAV-based remote sensing using visible and multispectral indices for the estimation of vegetation cover in an oasis of a desert. Ecol. Indic. 2022, 141, 109155. [Google Scholar] [CrossRef]
- Liu, K.; Cao, W.; Zhao, D.; Liu, S.; Liu, J. Assessment of ecological water scarcity in China. Environ. Res. Lett. 2022, 17, 104056. [Google Scholar] [CrossRef]
- Xiang, M.; Zhang, S.; Ruan, Q.; Tang, C.; Zhao, Y. Definition and calculation of hierarchical ecological water requirement in areas with substantial human activity-A case study of the Beijing-Tianjin-Hebei region. Ecol. Indic. 2022, 138, 108740. [Google Scholar] [CrossRef]
- Cui, Y.; Zhang, Q.; Chen, X.; Jiang, T. Advances in the theories and calculation methods of ecological water requirement. J. Lake Sci. 2010, 22, 465–480. [Google Scholar]
- Han, Y.; Xia, F.; Huang, H.; Mu, W.; Jia, D. Impact of the Grain for Green Project on water resources and ecological water stress in the Yanhe River Basin. PLoS ONE 2022, 17, e0259611. [Google Scholar] [CrossRef]
- Huang, F.; Ochoa, C.G.; Chen, X. Assessing environmental water requirement for groundwater-dependent vegetation in arid inland basins by combining the copula joint distribution function and the dual objective optimization: An application to the Turpan Basin, China. Sci. Total Environ. 2021, 799, 149323. [Google Scholar] [CrossRef]
- Pan, Q.; Zhang, C.; Guo, S.; Sun, H.; Du, J.; Guo, P. An interval multi-objective fuzzy-interval credibility-constrained nonlinear programming model for balancing agricultural and ecological water management. J. Contam. Hydrol. 2022, 245, 103958. [Google Scholar] [CrossRef]
- Zhao, W.; Chang, X.; He, Z.; Zhang, Z. Study on vegetation ecological water requirement in Ejina Oasis. Sci. China Ser. D Earth Sci 2007, 50, 121–129. [Google Scholar] [CrossRef]
- Yang, Y.; Xu, C.; Luo, Y.; Yang, Q.; Chen, L. Estimation of Ecological Water Requirement for the Natural Vegetation in the Kongque River Basin based on Vegetation Evapotranspiration. J. Irrig. Drain. Eng. 2020, 39, 106–115. [Google Scholar]
- Ling, H.; Guo, B.; Xu, H.; Fu, J. Configuration of water resources for a typical river basin in an arid region of China based on the ecological water requirements (EWRs) of desert riparian vegetation. Glob. Planet. Chang. 2014, 122, 292–304. [Google Scholar] [CrossRef]
- Chi, D.; Wang, H.; Li, X.; Liu, H.; Li, X. Estimation of the ecological water requirement for natural vegetation in the Ergune River basin in Northeastern China from 2001 to 2014. Ecol. Indic. 2018, 92, 141–150. [Google Scholar] [CrossRef]
- Hao, X.; Zhao, Z.; Fan, X.; Zhang, J.; Zhang, S. Evaluation method of ecological water demand threshold of natural vegetation in arid-region inland river basin based on satellite data. Ecol. Indic. 2023, 146, 109811. [Google Scholar] [CrossRef]
- Zhang, A.; Hao, T.; Zhou, H.; Ma, Z.; Cui, S. Analysis on characteristics of Baiyang River Basin and water requirement of ecological vegetation in Xinjiang. Acta Ecol. Sin. 2021, 41, 1921–1930. [Google Scholar]
- Zhang, R.; Ma, J.; Seki, K.; Wang, D.; Wang, L. Comparison of water consumption for the conversion of croplands to orchards in dryland ecosystems. Soil Sci. Soc. Am. J. 2022, 86, 946–963. [Google Scholar] [CrossRef]
- Fan, Y.; Guo, Y.; Lu, G.; Chen, L.; Zhang, X.; He, X.; Yang, J. Vegetation Ecological Water Requirement of Ebinur Lake Watershed. J. Desert Res. 2018, 38, 865–871. [Google Scholar]
- Gao, G.; Shen, Q.; Zhang, Y.; Pan, N.; Ma, Y.; Jiang, X.; Fu, B. Determining spatio-temporal variations of ecological water consumption by natural oases for sustainable water resources allocation in a hyper-arid endorheic basin. J. Clean. Prod. 2018, 185, 1–13. [Google Scholar] [CrossRef]
- Su, Z. The Surface Energy Balance System (SEBS) for estimation of turbulent heat fluxes. Hydrol. Earth Syst. Sci. 2002, 6, 85–99. [Google Scholar] [CrossRef]
- Jin, X.; Guo, R.; Xia, W. Distribution of Actual Evapotranspiration over Qaidam Basin, an Arid Area in China. Remote Sens. 2013, 5, 6976–6996. [Google Scholar] [CrossRef]
- Su, H.B.; McCabe, M.F.; Wood, E.F.; Su, Z.; Prueger, J.H. Modeling evapotranspiration during SMACEX: Comparing two approaches for local- and regional-scale prediction. J. Hydrol. 2005, 6, 910–922. [Google Scholar] [CrossRef]
- Ma, Y.; Liu, S.; Song, L.; Xu, Z.; Liu, Y.; Xu, T.; Zhu, Z. Estimation of daily evapotranspiration and irrigation water efficiency at a Landsat-like scale for an arid irrigation area using multi-source remote sensing data. Remote Sens. Environ. 2018, 216, 715–734. [Google Scholar] [CrossRef]
- Cai, J.; Zhao, D.; Varis, O.; Wang, Y. Match words with deeds: Curbing water risk with the Sustainable Development Goal 6 index. J. Clean. Prod. 2021, 318, 128509. [Google Scholar] [CrossRef]
- Skrimizea, E.; Parra, C. Social-ecological dynamics and water stress in tourist islands: The case of Rhodes, Greece. J. Sustain. Tour. 2019, 27, 1438–1456. [Google Scholar] [CrossRef]
- Liu, X.; Tang, Q.; Liu, W.; Veldkamp, T.I.E.; Boulange, J.; Liu, J.; Wada, Y.; Huang, Z.; Yang, H. A Spatially Explicit Assessment of Growing Water Stress in China from the Past to the Future. Earth’s Future 2019, 7, 1027–1043. [Google Scholar] [CrossRef]
- Fang, W.; Huang, S.; Huang, Q.; Huang, G.; Wang, H.; Leng, G.; Wang, L.; Guo, Y. Probabilistic assessment of remote sensing-based terrestrial vegetation vulnerability to drought stress of the Loess Plateau in China. Remote Sens. Environ. 2019, 232, 111290. [Google Scholar] [CrossRef]
- Alvarez-Garreton, C.; Boisier, J.P.; Billi, M.; Lefort, I.; Marinao, R.; Barria, P. Protecting environmental flows to achieve long-term water security. J. Environ. Manag. 2023, 328, 116914. [Google Scholar] [CrossRef]
- Cao, X.; Wu, M.; Guo, X.; Zheng, Y.; Gong, Y.; Wu, N.; Wang, W. Assessing water scarcity in agricultural production system based on the generalized water resources and water footprint framework. Sci. Total Environ. 2017, 609, 587–597. [Google Scholar]
- Wang, D.; Hubacek, K.; Shan, Y.; Gerbens-Leenes, W.; Liu, J. A Review of Water Stress and Water Footprint Accounting. Water 2021, 13, 201. [Google Scholar] [CrossRef]
- Jahangir, M.H.; Arast, M. Remote sensing products for predicting actual evapotranspiration and water stress footprints under different land cover. J. Clean. Prod. 2020, 266, 121818. [Google Scholar] [CrossRef]
- Zhang, W.; Li, D.; Shi, Q.; Guo, Y.; Bi Lali·Yi, M.; Li, H. Analysis of Temporal and Spatial Changes in Vegetation Phenology and Its Influencing Factors in Keriya River Basin. Bull. Soil Conserv. 2020, 40, 291–298+309. [Google Scholar]
- Zubaida, M.; Xia, J.; Polat·Muhtar; Zhang, R. Land use and landscape pattern changes in the middle reaches of the Keriya River. Acta Ecol. Sin. 2019, 39, 2322–2330. [Google Scholar]
- Wang, Z.; Erb, A.M.; Schaaf, C.B.; Sun, Q.; Liu, Y.; Yang, Y.; Shuai, Y.; Casey, K.A.; Roman, M.O. Early spring post-fire snow albedo dynamics in high latitude boreal forests using Landsat-8 OLI data. Remote Sens. Environ. 2016, 185, 71–83. [Google Scholar] [CrossRef] [PubMed]
- Agam, N.; Kustas, W.P.; Anderson, M.C.; Li, F.; Neale, C.M.U. A vegetation index based technique for spatial sharpening of thermal imagery. Remote Sens. Environ. 2007, 107, 545–558. [Google Scholar] [CrossRef]
- Qiao, C.; Sun, R.; Xu, Z.; Zhang, L.; Liu, L.; Hao, L.; Jiang, G. A Study of Shelterbelt Transpiration and Cropland Evapotranspiration in an Irrigated Area in the Middle Reaches of the Heihe River in Northwestern China. IEEE Geosci. Remote Sens. Lett. 2015, 12, 369–373. [Google Scholar] [CrossRef]
- Hou, X.; Fan, J.; Zhang, F.; Hu, W.; Yan, F.; Xiao, C.; Li, Y.; Cheng, H. Determining water use and crop coefficients of drip-irrigated cotton in south Xinjiang of China under various irrigation amounts. Ind. Crops Prod. 2022, 176, 114376. [Google Scholar] [CrossRef]
- Hao, X.; Chen, Y.; Xu, C.; Li, W. Impacts of climate change and human activities on the surface runoff in the Tarim River basin over the last fifty years. Water Resour. Manag. 2008, 22, 1159–1171. [Google Scholar] [CrossRef]
- Yang, L.S.; Feng, Q.; Zhu, M.; Wang, L.M.; Alizadeh, M.R.; Adamowski, J.F.; Wen, X.H.; Yin, Z.L. Variation in actual evapotranspiration and its ties to climate change and vegetation dynamics in northwest China. J. Hydrol. 2022, 607, 127533. [Google Scholar] [CrossRef]
- Zhang, D.; Liu, X.; Zhang, L.; Zhang, Q.; Gan, R.; Li, X. Attribution of Evapotranspiration Changes in Humid Regions of China from 1982 to 2016. J. Geophys. Res. Atmos. 2020, 125, e2020JD032404. [Google Scholar] [CrossRef]
- Shen, Y.-J.; Shen, Y.; Guo, Y.; Zhang, Y.; Pei, H.; Brenning, A. Review of historical and projected future climatic and hydrological changes in mountainous semiarid Xinjiang (northwestern China), central Asia. Catena 2020, 187, 104343. [Google Scholar] [CrossRef]
- Talaee, P.H.; Some’e, B.S.; Ardakani, S.S. Time trend and change point of reference evapotranspiration over Iran. Theor. Appl. Clim. 2014, 116, 639–647. [Google Scholar] [CrossRef]
- Fan, J.; Wu, L.; Zhang, F.; Xiang, Y.; Zheng, J. Climate change effects on reference crop evapotranspiration across different climatic zones of China during 1956–2015. J. Hydrol. 2016, 542, 923–937. [Google Scholar] [CrossRef]
- Wang, L.; Li, M.; Wang, J.; Li, X.; Wang, L. An analytical reductionist framework to separate the effects of climate change and human activities on variation in water use efficiency. Sci. Total Environ. 2020, 727, 138306. [Google Scholar] [CrossRef] [PubMed]
- Hu, S.; Mo, X. Attribution of Long-Term Evapotranspiration Trends in the Mekong River Basin with a Remote Sensing-Based Process Model. Remote Sens. 2021, 13, 303. [Google Scholar] [CrossRef]
- Hu, G.; Jia, L. Monitoring of Evapotranspiration in a Semi-Arid Inland River Basin by Combining Microwave and Optical Remote Sensing Observations. Remote Sens. 2015, 7, 3056–3087. [Google Scholar] [CrossRef]
- Donohue, R.J.; McVicar, T.R.; Roderick, M.L. Assessing the ability of potential evaporation formulations to capture the dynamics in evaporative demand within a changing climate. J. Hydrol. 2010, 386, 186–197. [Google Scholar] [CrossRef]
- Li, X.; Lu, L.; Yang, W.; Cheng, G. Estimation of evapotranspiration in an arid region by remote sensing-A case study in the middle reaches of the Heihe River Basin. Int. J. Appl. Earth Obs. Geoinf. 2012, 17, 85–93. [Google Scholar] [CrossRef]
- Liang, S.L. Narrowband to broadband conversions of land surface albedo I Algorithms. Remote Sens. Environ. 2001, 76, 213–238. [Google Scholar] [CrossRef]
- Zhu, Y.H.; Chen, Y.N.; Ren, L.L.; Lu, H.S.; Zhao, W.Z.; Yuan, F.; Xu, M. Ecosystem restoration and conservation in the arid inland river basins of Northwest China: Problems and strategies. Ecol. Eng. 2016, 94, 629–637. [Google Scholar] [CrossRef]
- Alejandro Distel, R. Grazing ecology and the conservation of the Caldenal rangelands, Argentina. J. Arid Environ. 2016, 134, 49–55. [Google Scholar] [CrossRef]
- Schyns, J.F.; Hoekstra, A.Y.; Booij, M.J. Review and classification of indicators of green water availability and scarcity. Hydrol. Earth Syst. Sci. 2015, 19, 4581–4608. [Google Scholar] [CrossRef]
- Wang, J.; Wu, Y.; Hu, Z.; Zhang, J. Remote Sensing of Watershed: Towards a New Research Paradigm. Remote Sens. 2023, 15, 2569. [Google Scholar] [CrossRef]
- Dong, Q.; Wang, W.; Shao, Q.; Xing, W.; Ding, Y.; Fu, J. The response of reference evapotranspiration to climate change in Xinjiang, China: Historical changes, driving forces, and future projections. Int. J. Climatol. 2020, 40, 235–254. [Google Scholar] [CrossRef]
- Wang, J.; Zhen, J.; Hu, W.; Chen, S.; Lizaga, I.; Zeraatpisheh, M.; Yang, X. Remote sensing of soil degradation: Progress and perspective. Int. Soil Water Conserv. Res. 2023, 11, 429–454. [Google Scholar] [CrossRef]
- Pace, G.; Gutierrez-Canovas, C.; Henriques, R.; Boeing, F.; Cassio, F.; Pascoal, C. Remote sensing depicts riparian vegetation responses to water stress in a humid Atlantic region. Sci. Total Environ. 2021, 772, 145526. [Google Scholar] [CrossRef] [PubMed]


| Data Set | Date | Data Set | Date (Julian Day) | ||
|---|---|---|---|---|---|
| 2021 | 2022 | 2021 | 2022 | ||
| Landsat 8-9 OLI/TIRS C2 L2 | 04 January | 15 January | MOD16A2 | 1 | 17 |
| Path/Row: 145/34 | 05 February | 08 February | Tiles: h24v05 | 33 | 41 |
| Resolution: 30 m | 09 March | 05 April | Resolution: 500 m | 65 | 97 |
| Data source: | 10 April | 29 April | Data source: | 105 | 121 |
| https://earthexplorer.usgs.gov | 28 May | 18 July | https://ladsweb.modaps.eosdis.nasa.gov | 145 | 201 |
| 15 July | 19 August | 193 | 233 | ||
| 17 September | 20 September | 265 | 265 | ||
| 19 October | 22 October | 289 | 297 | ||
| 20 November | 23 November | 321 | 321 | ||
| 22 December | 25 December | 353 | 361 | ||
| Severity | Type | EWS Value |
|---|---|---|
| 0 | Water plentitude | 0.00 ≤ EWS < 0.25 |
| 1 | Mild water shortage | 0.25 ≤ EWS < 0.50 |
| 2 | Moderate water shortage | 0.50 ≤ EWS < 0.75 |
| 3 | Severe water shortage | 0.75 ≤ EWS ≤ 1.00 |
| DOY (2021) | MAE (mm) | RMSE (mm) | R2 | DOY (2022) | MAE (mm) | RMSE (mm) | R2 |
|---|---|---|---|---|---|---|---|
| 1 | 0.06 | 0.15 | 0.89 | 17 | 0.11 | 0.25 | 0.89 |
| 33 | 0.17 | 0.41 | 0.92 | 41 | 0.12 | 0.34 | 0.89 |
| 65 | 0.22 | 0.53 | 0.93 | 97 | 0.25 | 0.64 | 0.96 |
| 105 | 0.20 | 0.54 | 0.95 | 121 | 0.25 | 0.65 | 0.96 |
| 145 | 0.20 | 0.55 | 0.96 | 201 | 0.28 | 0.74 | 0.95 |
| 193 | 0.25 | 0.67 | 0.95 | 233 | 0.28 | 0.65 | 0.92 |
| 265 | 0.21 | 0.56 | 0.96 | 265 | 0.22 | 0.57 | 0.95 |
| 289 | 0.16 | 0.42 | 0.95 | 297 | 0.22 | 0.50 | 0.93 |
| 321 | 0.13 | 0.30 | 0.90 | 321 | 0.19 | 0.43 | 0.91 |
| 353 | 0.09 | 0.23 | 0.90 | 361 | 0.08 | 0.19 | 0.90 |
| Mean | 0.17 | 0.44 | 0.93 | Mean | 0.20 | 0.50 | 0.93 |
| Year | Ecological Water Requirement | Cropland | Forest | Grassland | Sum |
|---|---|---|---|---|---|
| 2021 | Total EWR (108 m3) | 4.123 | 0.004 | 6.328 | 10.445 |
| Average EWR (103 m3) | 0.642 | 1.067 | 0.327 | 2.036 | |
| 2022 | Total EWR (108 m3) | 4.221 | 0.004 | 6.770 | 10.995 |
| Average EWR (103 m3) | 0.650 | 0.997 | 0.346 | 1.993 |
| Driving Factors | Index | ET | PET |
|---|---|---|---|
| Meteorological Parameters | Air temperature | 0.953 ** | 0.906 ** |
| Air Pressure | −0.751 ** | −0.599 ** | |
| Relative Humidity | −0.057 ** | −0.263 | |
| Wind Speed | 0.387 | 0.534 * | |
| Sunshine Hours | 0.840 ** | 0.925 ** | |
| Surface Parameters | LST | 0.930 ** | 0.900 ** |
| Emissivity | 0.830 ** | 0.858 ** | |
| Albedo | −0.106 | 0.021 | |
| NDVI | 0.839 ** | 0.822 ** | |
| FVC | 0.839 ** | 0.826 ** |
Disclaimer/Publisher’s Note: The statements, opinions and data contained in all publications are solely those of the individual author(s) and contributor(s) and not of MDPI and/or the editor(s). MDPI and/or the editor(s) disclaim responsibility for any injury to people or property resulting from any ideas, methods, instructions or products referred to in the content. |
© 2023 by the authors. Licensee MDPI, Basel, Switzerland. This article is an open access article distributed under the terms and conditions of the Creative Commons Attribution (CC BY) license (https://creativecommons.org/licenses/by/4.0/).
Share and Cite
Wang, R.; Zayit, A.; He, X.; Han, D.; Yang, G.; Lv, G. Ecological Water Requirement of Vegetation and Water Stress Assessment in the Middle Reaches of the Keriya River Basin. Remote Sens. 2023, 15, 4638. https://doi.org/10.3390/rs15184638
Wang R, Zayit A, He X, Han D, Yang G, Lv G. Ecological Water Requirement of Vegetation and Water Stress Assessment in the Middle Reaches of the Keriya River Basin. Remote Sensing. 2023; 15(18):4638. https://doi.org/10.3390/rs15184638
Chicago/Turabian StyleWang, Ranran, Abudoukeremujiang Zayit, Xuemin He, Dongyang Han, Guang Yang, and Guanghui Lv. 2023. "Ecological Water Requirement of Vegetation and Water Stress Assessment in the Middle Reaches of the Keriya River Basin" Remote Sensing 15, no. 18: 4638. https://doi.org/10.3390/rs15184638