

Extracting and Evaluating Urban Entities in China from 2000 to 2020 Based on SNPP-VIIRS-like Data


1
School of Geographical Sciences, Southwest University, Chongqing 400715, China
2
Department of Geography, Faculty of Humanities and Social Sciences, University of Ruhuna, Matara 81000, Sri Lanka
3
Key Laboratory of Earth Surface Processes and Regional Response in the Yangtze-Huaihe River Basin, Anhui Normal University, Wuhu 241002, China
*
Author to whom correspondence should be addressed.
Remote Sens. 2023, 15(18), 4632; https://doi.org/10.3390/rs15184632
Submission received: 6 August 2023
/
Revised: 18 September 2023
/
Accepted: 20 September 2023
/
Published: 21 September 2023
(This article belongs to the Special Issue Urban Resilience with Remote Sensing - Observation, Measurement, Evaluation and Applications)
Abstract
:It is crucial to evaluate the expansion of urban entities to implement sustainable urban planning strategies in China. Thus, this study attempted to extract and evaluate the growth of urban entities 270 prefecture cities in mainland China (2000–2020) using a novel approach based on consistent night light images. After the urban entities were extracted, a rationality assessment was carried out to compare the derived urban entities with the LandScan population product, Landsat, and road network results. Additionally, the results were compared with other physical extent products, such as the Moderate Resolution Imaging Spectrometer (MODIS) and urban built-up area products (HE) products. According to the findings, the urban entities were basically consistent with the LandScan, road network, and HE and MODIS products. However, the urban entities more accurately reflected the concentration of human activities than did the impervious extents of the MODIS and HE products. At the prefecture levels, the area of urban entities increased from 8082 km2 to 74,417 km2 between 2000 and 2020, showing an average growth rate of 10.8% over those twenty years. As a reliable supplementary resource and guide for urban mapping, this research will inform new research on the K-means algorithm and on variations in NTL data brightness threshold dynamics at regional and global scales.
1. Introduction
In recent years, urbanization has expanded and become a significant spatial phenomenon on a global scale. In 1950, 25% of the world’s population lived in cities [1], and currently, urban areas are home to 50% of the world’s population [2]. Especially in less developed countries, the urban population will increase to 56.4% by 2030 [3]. Urbanization and its evolution have been studied at a range of spatiotemporal scales, with remote sensing techniques as the primary sources of consistent and continuous data [4,5,6]. Urban expansion needs to be continuously monitored due to worsening overcrowding conditions, housing shortages, inadequate infrastructure, and growing ecological issues [2]. Multi-temporal and multi-spectral data are especially well suited for projecting urban expansion.
Major cities in China have been rapidly urbanizing during the last two decades. Thus, sustainable urban development requires the maintenance of a balance between human activities, the environment, the population, and urbanization [7]. Major changes brought about by urbanization in China include population shifts and an economic transition from the countryside to urban areas. In 2010, the population census in China showed that approximately 50% of the country’s population was categorized as urban. The turning point came after 2011 when, for the first time in its history, the majority of the country’s settlements were classified as urban. Now, the second stage of China’s urbanization, the stage of steady expansion, has been reached, according to the theory of urbanization development [8].
An urban entity is a predefined area based on a particular demographic and/or socioeconomic characteristic such as the population or the percentage of urban dwellers employed in secondary and tertiary sectors. An urban area is a continuously built-up and densely settled area. Urban impermeability refers to the high coverage of built-up/impermeable surfaces. Urban areas are frequently thought of as impervious areas that are covered by roads, buildings, and other constructed structures [4,9]. Typically, the qualities of man-made structures are used to demarcate urban entities [10]. However, it is ineffective to use those structures alone in evaluating how human activities are concentrated together [11]. Additionally, it is essential to illustrate the other socioeconomic functions of urban dwellers using various urban structures [12]. Applying economic-based variables to characterize urban entities will increase the accuracy of their definition. Thus, several researchers [13,14] have advocated using an integrated definition for urban entities including socioeconomic factors and physical structures. The two most popular datasets utilized for the identification of urban entities are the LandScan, and WorldPop datasets [15]. Currently, Landsat, Sentinel, and Moderate Resolution Imaging Spectrometer (MODIS) data are typically used to produce urban entity maps. However, prevailing urban laws, suggest that urban expansion is a complicated process and that urban entities should not be primarily identified based on their impervious surfaces [16]. Although daylight satellite imagery could be used to track land use changes, their spectrally varied nature makes them difficult to use in studying urbanization dynamics [17,18]. However, the nighttime light (NTL) images of the Defense Meteorological Satellite Program’s Operational Line-scan System (DMSP/OLS) and the Suomi National Polar Partnership Visible Infrared Imaging Radiometer Suite (SNPP-VIIRS) onboard instrument offer a unique proxy for measuring urban growth and other dynamics [17,18,19,20]. The SNPP-VIIRS has a significantly enhanced spatial resolution and calibration [21]. There are two advantages to using NTL images to detect urban entities: the capability to map urban areas on large spatial-temporal scales, and the ability to precisely pinpoint where human activities are concentrated with a low spatial resolution [22].
Given that China is a rapidly urbanizing country, numerous studies have been conducted to extract urban entities from NTL data in that country. A few researchers have tried to introduce correcting techniques for multisatellite, stable NTL data to identify urban expansion in China, and other researchers [21,22] have quantified the dynamics of urban entities. However, most researchers have used new methods and new-generation NTL data for urban entity extraction and compared their findings with DMSP-OLS data and other high spatial resolution orbital data products from international space stations (ISSs) and Luojia 1-01 satellite data [7,17,23,24]. Urban extraction using DMSP/OLS data and NTL intensity were also key areas of focus in previous research [25,26]. Other researchers have also used neighborhood statistics, the normalized difference vegetation index (NDVI), and local-optimized threshold analysis using nighttime stable light data and VIIRS data to trace urban growth in China [27,28,29,30]. A few researchers have explored the characteristics and trends of urban development in urban agglomerations using DMSP/OLS data [31]. Predicting and quantifying urban growth in coastal cities using DMSP-OLS was another focus of previous research [32,33,34,35]. A few researchers have used the K-means algorithm [35] in more recent studies to pinpoint suburbanization patterns using SNPP-VIIRS data comparing the findings with LandScan population, road network, and impervious extent data products [36,37,38]. Although DMSP-OLS and SNPP-VIIRS are valuable resources for urban growth monitoring, those sources do not consider prefecture-level cities in China. Additionally, urban mapping in China uses NTL solely on short temporal scales based on DMSP and SNPP-VIIRS data, except for in a few studies [39,40,41].
Thus, our study aimed to extract and evaluate urban entities in prefecture cities during 2000–2020 from an urban entity perspective using SNPP-VIIRS data from the Harvard Dataverse while comparing the extracted urban entities with data from the Moderate Resolution Imaging Spectrometer (MODIS) and the urban area products (HE) data proposed by He et al. (2019) [39] This research was organized into five sections as listed below. Section 1 explains the research background and literature search, and Section 2 describes the study area, materials, and methods. The results and findings are thoroughly explained in Section 3, where a comparison is made between NTL data and other data products such as LandScan and HE. In the discussion section, the similarities and differences in the key findings are compared with those of similar studies. Section 5 provides the conclusion and emphasizes the study limitations and future research directions.
2. Materials and Methods
2.1. Study Area
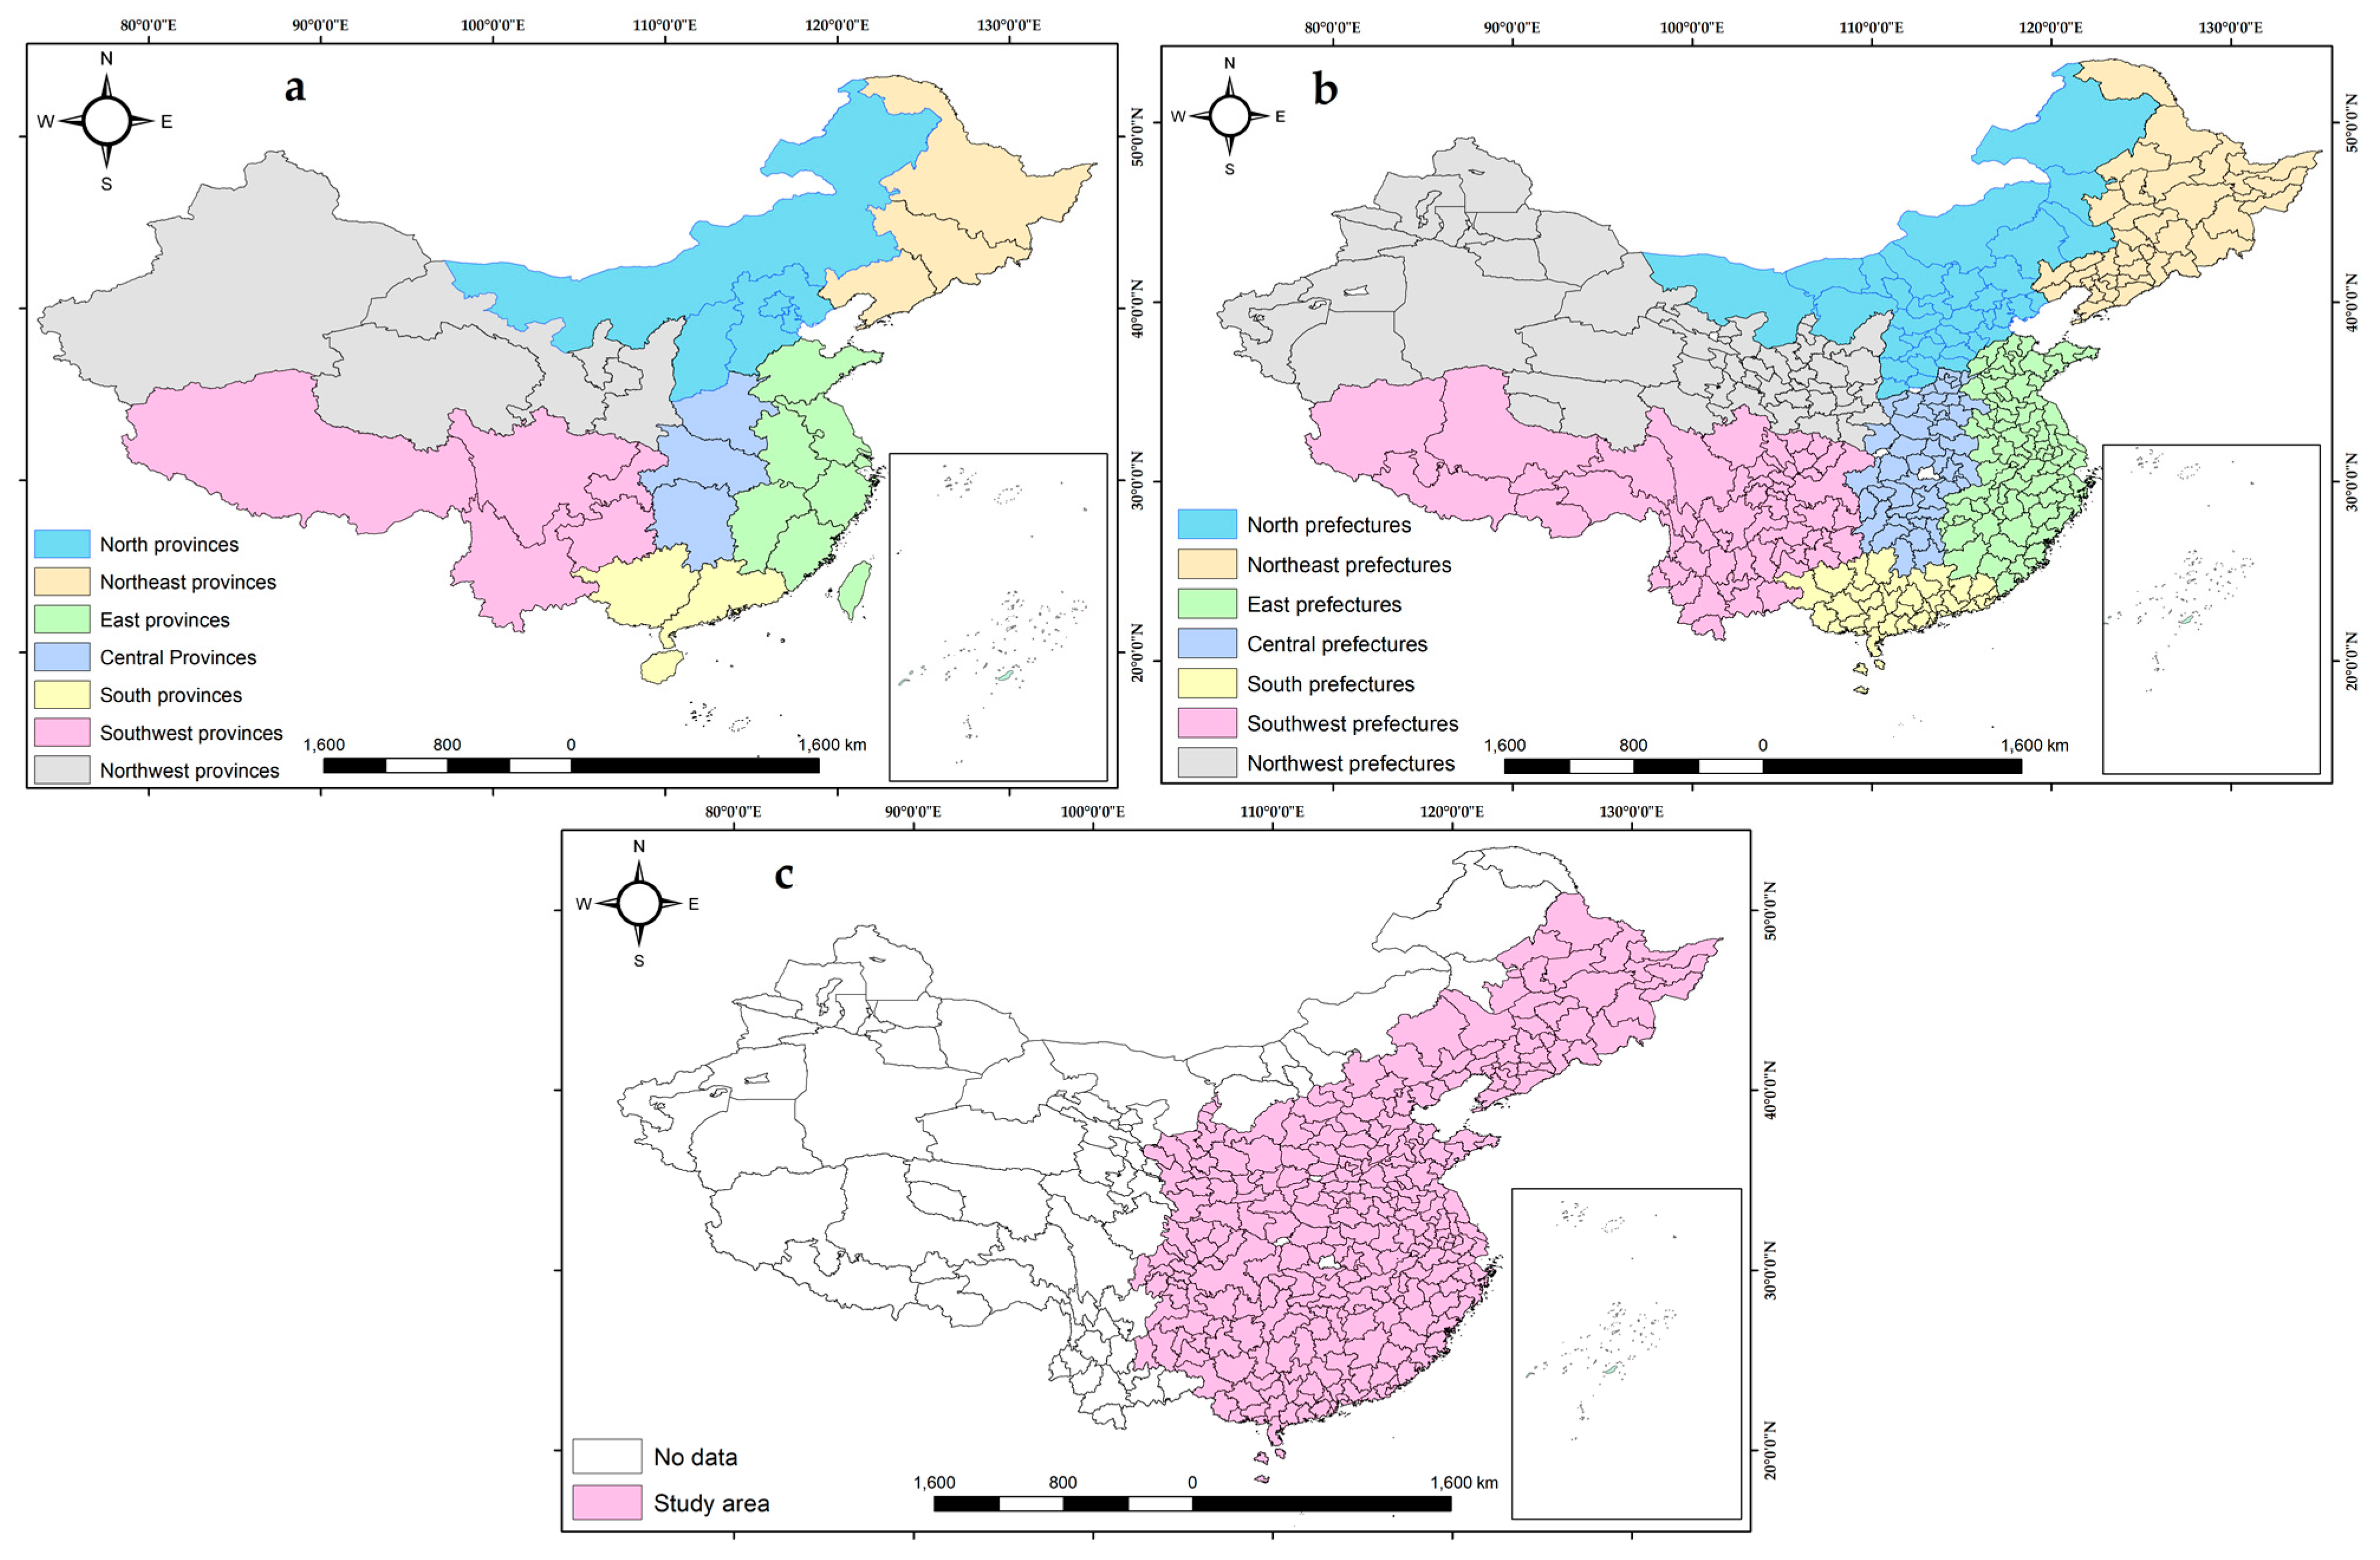
There are 336 prefecture-level divisions (Figure 1) in China, including 7 prefectures, 299 prefecture-level cities (including four major municipalities), and 30 autonomous prefectures [42,43]. However, only 270 prefecture cities (Figure 1c) were selected based on the availability of urban entity records derived from the NTL data and urban GDP statistics for 2000 (the base year) [44]. Thus, the prefectures in the western and northeastern areas were omitted from the survey. For analysis purposes, the selected prefecture cities were categorized into seven groups based on their coverage: north, northeast, northwest, east, central, south, and southwest.
2.2. Materials
Newly generated SNPP-VIIRS-like data from 2000 to 2020 were primarily used as the major data source to extract urban entities in the prefecture cities; these open-source data are available from the Harvard Dataverse [45]. This dataset was derived by using the SNPP-VIIRS and DMSP-OLS data that could provide temporally consistent and extended data compared with the previous versions of DMSP-OLS or DMSP-OLS-like data [38]. These data are also corrected for saturation and overflow effects. The ground footprints of the two data products, DMSP-OLS (5 km × 5 km) and SNPP (742 m × 742 m), differed even though the DMSP and SNPP have similar orbits (850 km) and swaths (3000 km). However, a review of the VIIRS DNB data showed that even at midnight, there was still a lot of brightness present. Additionally, while cloud and high-albedo terrain features could not be detected in the OLS data, weaker lighting could be detected using VIIRS [46]. However, newer VIIRS-DNB satellite data also had the issue of scattered light. Those data contained the glow near cities, which is a direct effect of real light. Sanchez de Miguel et al. (2020) demonstrated how scattered light can be attributed to an incorrect location [47].
The rationality assessment of the extracted urban entities was performed using the LandScan population data available from the Oak Ridge National Laboratory, which were developed using multisource data. The justification for using those data for the study was that LandScan provides a more accurate assessment of daytime and nighttime populations as well as the population distribution on different impervious surfaces [48]. LandScan has also been extensively used for urban area verification at various spatial scales [36,38].
To compare the urban entities with artificial impervious extents, the MODIS Land Cover Type version 6 (MODIS) data products were used as a primary reference. Since MODIS is a frequently used dataset for urban mapping that was developed from supervised classifications and postprocessing [49], the data were used as one of the references for verifying the urban areas that had been produced from the SNPP-VIIRS-like data [38].
As a second reference, the urban built-up area (HE) data products proposed by He et al. [39] were used. These data have a 90.9% overall accuracy and a 0.47% kappa value (this is an accuracy indicator with values ranging from 0–1 that measures how the classification results compare to values assigned by chance). These data are freely available from the National Tibetan Plateau Data Center, and the datasets have been developed through a fully convolutional network by using multisource remote sensing data and effectively represent built-up areas with their long time series.
Additional remote sensing data from Landsat and Globeland were downloaded from the USGS earth explorer and Globeland data servers. The open street map (OSM) platform was used to extract the road networks. Spatial data on national, provincial, and prefecture administrative boundaries were obtained from the National Geomatics Center of China. Details on the spatial data sources of the study are presented in Table 1. The China City Statistical Yearbook was used to collect statistical data on urban GDP values in prefecture cities for several years (2000, 2005, 2010, 2015, and 2020) [44].
2.3. Methods
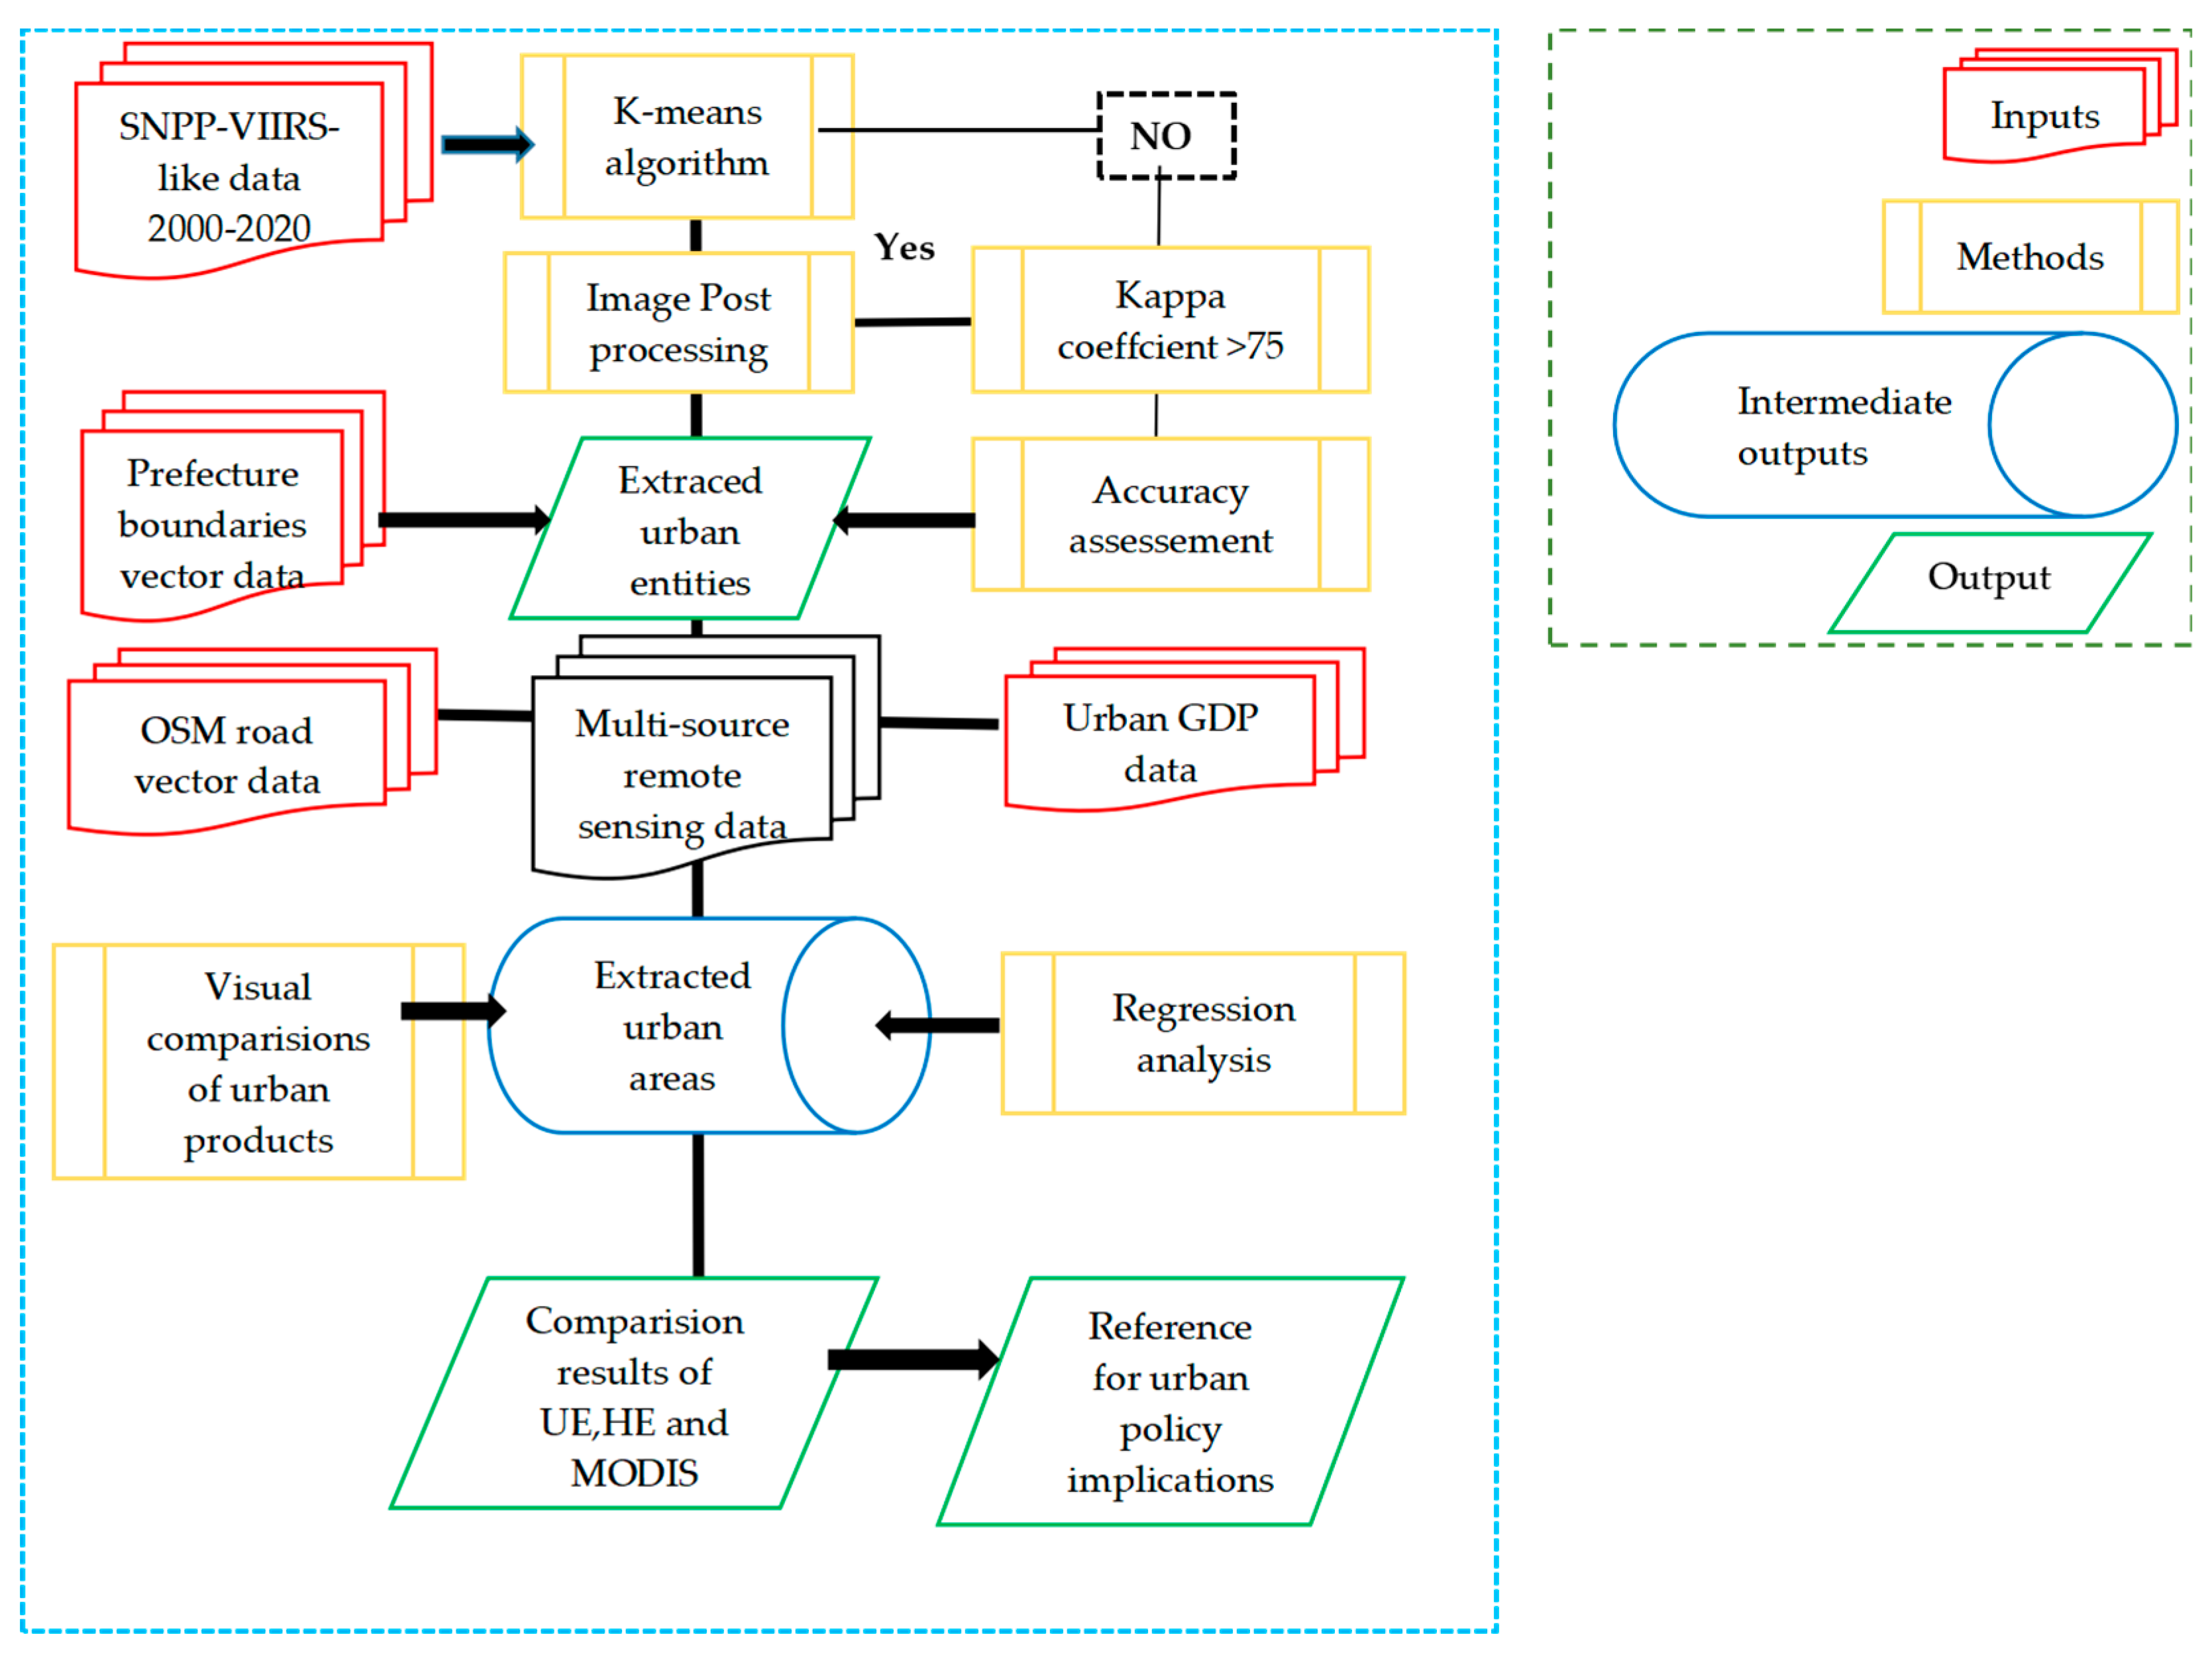
The study was conducted using the various methods depicted in Figure 2. To extract urban entities between 2000 and 2020, K-means unsupervised classification was used after downloading the SNPP-VIIRS-like data. Second, image post-processing was performed to increase the accuracy of the retrieved urban entity products. After the accuracy assessments were conducted by verifying the level of overall accuracy (OA), a kappa coefficient rationality assessment was conducted to compare urban entities with other urban products and socioeconomic data. Further details on the K-means classification and image post-processing methods are described below.
2.3.1. Extracting Urban Entities Using the K-means Classification
There are various techniques for clustering spatial data, including threshold, mutation detection, ordering points to identify the clustering structure (OPTICS), Density-Based Spatial Clustering of Applications with Noise (DBSCAN)), and K-means. OPTICS permits a fluctuating cluster density, while DBSCAN assumes a constant cluster density. DBSCAN cannot cluster datasets with significant differences in densities, although it handles clusters of various sizes and structures and is not strongly influenced by outliers. Additionally, it is sensitive to the parameter selection. OPTICS is sensitive to parameters and also fails if there are no density declines between clusters. The mutation detection method also has several requirements to extract different urban areas and boundaries [49]. Due to the different brightness values for various urban structures, the threshold method effectively extracts the boundaries of urban entities. However, K-means clustering is one of the most widely used clustering approaches when working with large datasets due to its simplicity, ease of implementation, and computationally efficient and quick procedure compared to those of other algorithms. Further, K-means can be applied to high-dimensional, sparse data. Compared to other methods, the extracted results using the K-means algorithm have less uncertainty. The K-means method has also been used by several researchers in previous studies [38,50,51].
The algorithm divided the datasets into two parts (n = 2) because we considered only two classes (urban and non-urban areas) within the NTL value ranges. Thus, the number of items was divided into k clusters based on the distance from the urban centers to the rural peripheries. The method was developed to extract urban and non-urban pixels automatically with reasonable accuracy. The calculation formulas are as follows [38].
where E is the minimum square error of Cluster C = {Cl, C2, C3, … Ck} for the Sample x cluster from the SNPP-VIIRS-like data. The smaller the E value is, the higher the similarity of the samples in the cluster is. is the center of cluster Ci in the j + 1 iteration. The sum of the error square criterion function is applied in the research for the clustering criteria function [38].
where P represents all pixels in cluster Ci, and Mi is the arithmetic mean of all pixels in cluster Ci. JC is a mapping between data objects and cluster centers. Since JC can reflect the error of clustering results of classification, it is essential to identify the clustering results that can reduce the JC. The feature types of each pixel in an image were identified using cluster analysis. After the K-means clustering iteration, built-up and non-built-up areas were separated from the SNPP-VIIRS-like data based on color variations.
2.3.2. Post-Processing
We made an effort to maintain the logical consistency of the spatiotemporal dynamics of urban entities extracted from long-term SNPP-VIIRS-like data using the K-means algorithm during image post-processing. The post-processing procedure followed three main steps. The first step was to perform iterative temporal filtering for urban entities that were founded on the theory put forth by He et al. [44] that an urban region that emerges one year will remain in the next year. Isolated noise pixels in the urban entities of consecutive years were decreased by changing labels with a poor temporal consistency probability [38]. Although misclassification noise could be reduced using temporal filtering, the resulting sequence which alternates between urban and nonurban segments might be illogical. Thus, as the second step, logical reasoning was conducted to check the conversion between urban and non-urban areas [52]. This was supported by the idea that the amount of human activity aggregation does not vanish suddenly unless irreversible events such as war and natural disasters occur [52]. Independent urban entities with an extent of less than 2 km2 were eliminated in the last step. The justification for deleting the urban entities that were less than 2 km2 was because their small sizes did not satisfy the requirements of urban area [15,44]. With the addition of spatial temporal data, the particular size threshold can be a locally determined refining process that could vary in other areas [53]. Through these steps, we tried to obtain more precise and reliable urban entity results over the past 20-year period with high spatial and temporal consistency.
3. Results
3.1. Evaluating the Expansion of Urban Entities from 2000 to 2020
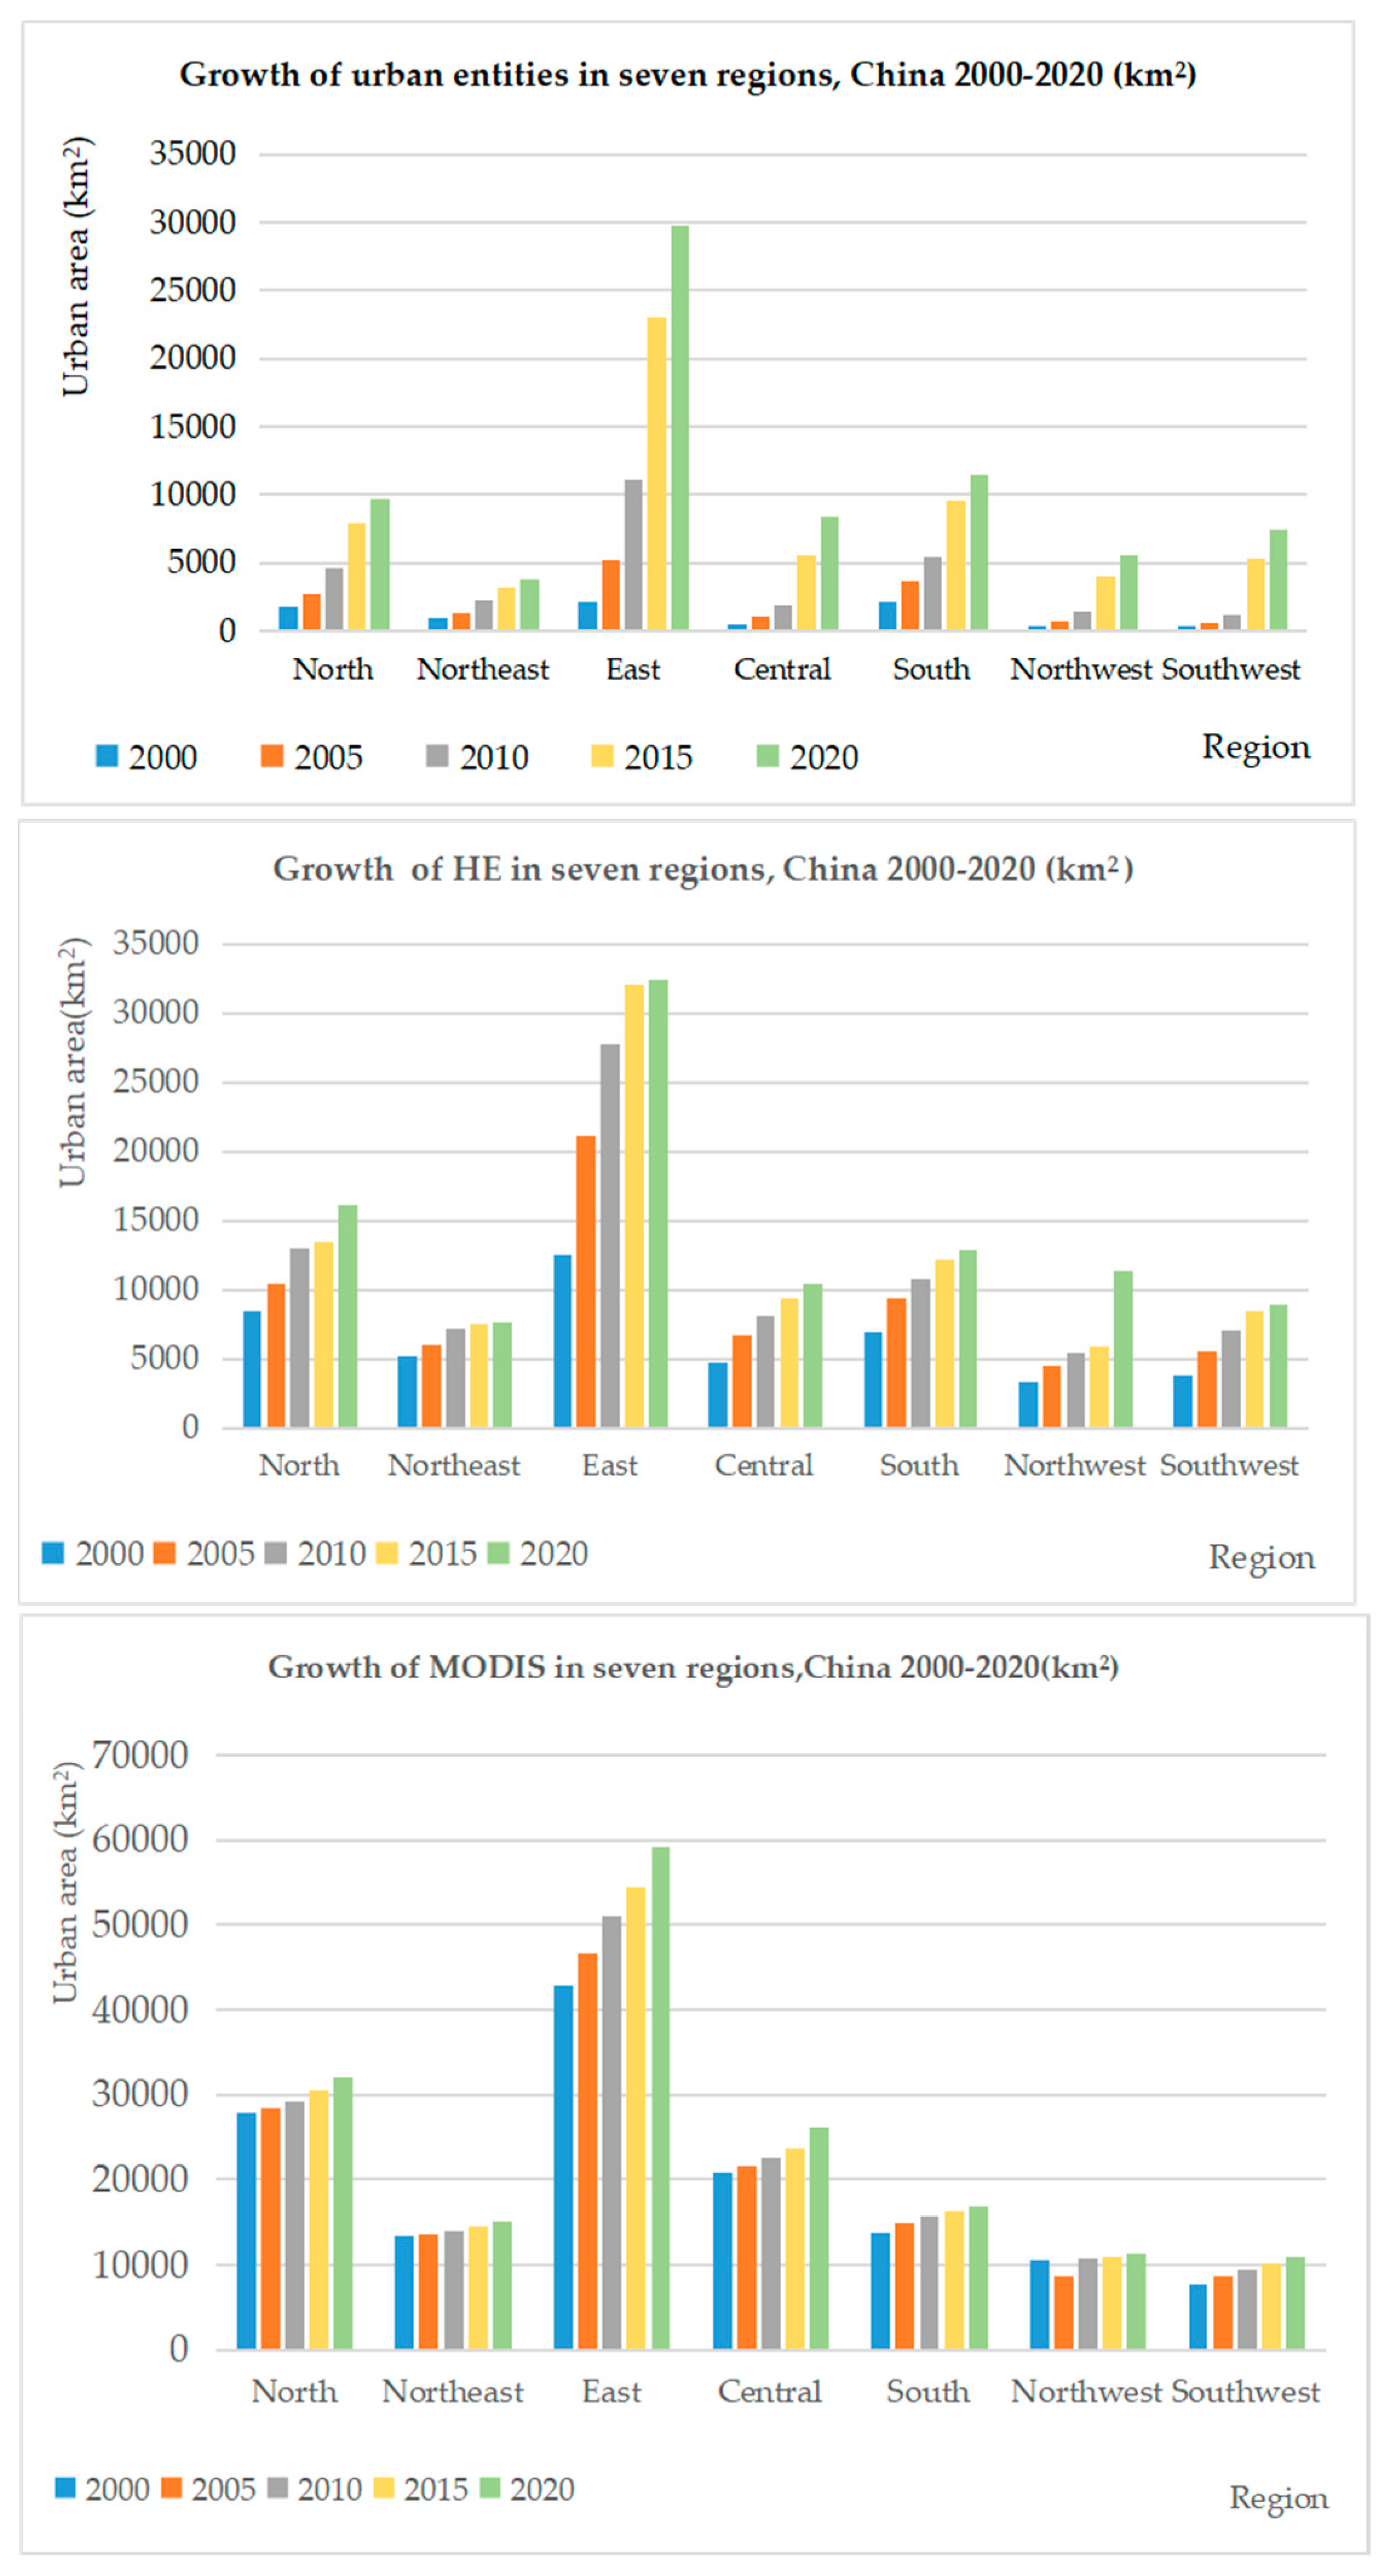
According to the results, the total urban entities in China’s prefectures increased from 8082 km2 to 74,417 km2, showing a 10.8% growth rate over the 20 years. However, urban entity (UE) expansion rates and patterns showed noticeable variations over seven regions that were undergoing different socioeconomic and urban development phases (Figure 3). As seen in the figure, the urban area sizes of the three urban products varied and were inconsistent with one another, exhibiting different numbers and patterns. The urban area size of the MODIS dataset was the highest, followed by the products of the HE and urban entities datasets. The area difference maintained a comparatively stable trend with HE and UE. The highest UE growth was observed in eastern and southern prefectures at 27,640 km2 and 9340 km2, respectively. The lowest growth could be observed in northeastern (2897 km2) and northwestern (5207 km2) prefectures. In eastern prefectures, Shanghai reported the highest growth from 660 km2 in 2000 to 2852 km2 in 2020 (Figure S1y). Guangzhou is a rapidly growing prefecture in the south (Figure S1v). According to the results, it expanded from 375 km2 to 1635 km2 during the period 2000–2020. In northern prefectures, rapid urban entity expansion was observed in Beijing, as it grew from 783 km2 to 2150 km2 during the examined period (Figure S1q). From a temporal perspective, some of the capitals such as Chongqing and Chengdu (Figure S1m,n) showed a rapid upwards expansion starting in 2015. In contrast, small provincial capitals such as Xining, Lhasa, Haikou, and Hohhot (Figure S1h,l,x,u) exhibited slow urban entity expansion during the entire time period.
3.2. Comparing Results with the LandScan Population and Road Network Products
The majority of research findings relating to urban area identification differ in terms of urban definitions [53,54]. Thus, quantitative and visual evaluations were carried out to validate the results derived from the SNPP-VIIRS data. Because urban entities reflect the concentration of human activities in cities, the findings were contrasted with the LandScan population and road network products. The extracted results of urban entities with existing built-up areas were compared to find parallels and discrepancies. This essentially helps the reader comprehend how various urban definitions of the urban entity in China were depicted. By using all these approaches, we tried to verify the rationality of the extracted urban entity results of the prefecture cities.
A rationality assessment was conducted using the 2015 LandScan data product of Shanghai, Beijing, Shenzhen, and Guangzhou, which were used as case studies. It was presumed that by that year, the majority of prefecture cities were notably more developed than they were in 2000. Although certain variations were noted, spatial consistency was revealed between extracted urban entities with areas having a population density of at least >500 person/km2 from the LandScan population product within these cities. Urban entities effectively reflect the human activity concentration in urban areas. Additionally, as shown in (Figure S2i,k), the built-up areas in the Landsat product basically overlay the urban entities and LandScan population density. Even though the population density was less than 500 person/km2 and there were non-built-up areas in the Landsat images, those areas were classified as urban entities in Beijing (Figure S2b,f,j). In Guangzhou, some detected areas of urban entities with population density >1500 person/km2 were non-built-up areas in Landsat (Figure S2h,l). Even though there were no built up areas in some places, they were nonetheless regarded as urban entities based on their population size, density, and concentration of human activity. These results showed that both urban entities and population density were consistent with human activities as a whole.
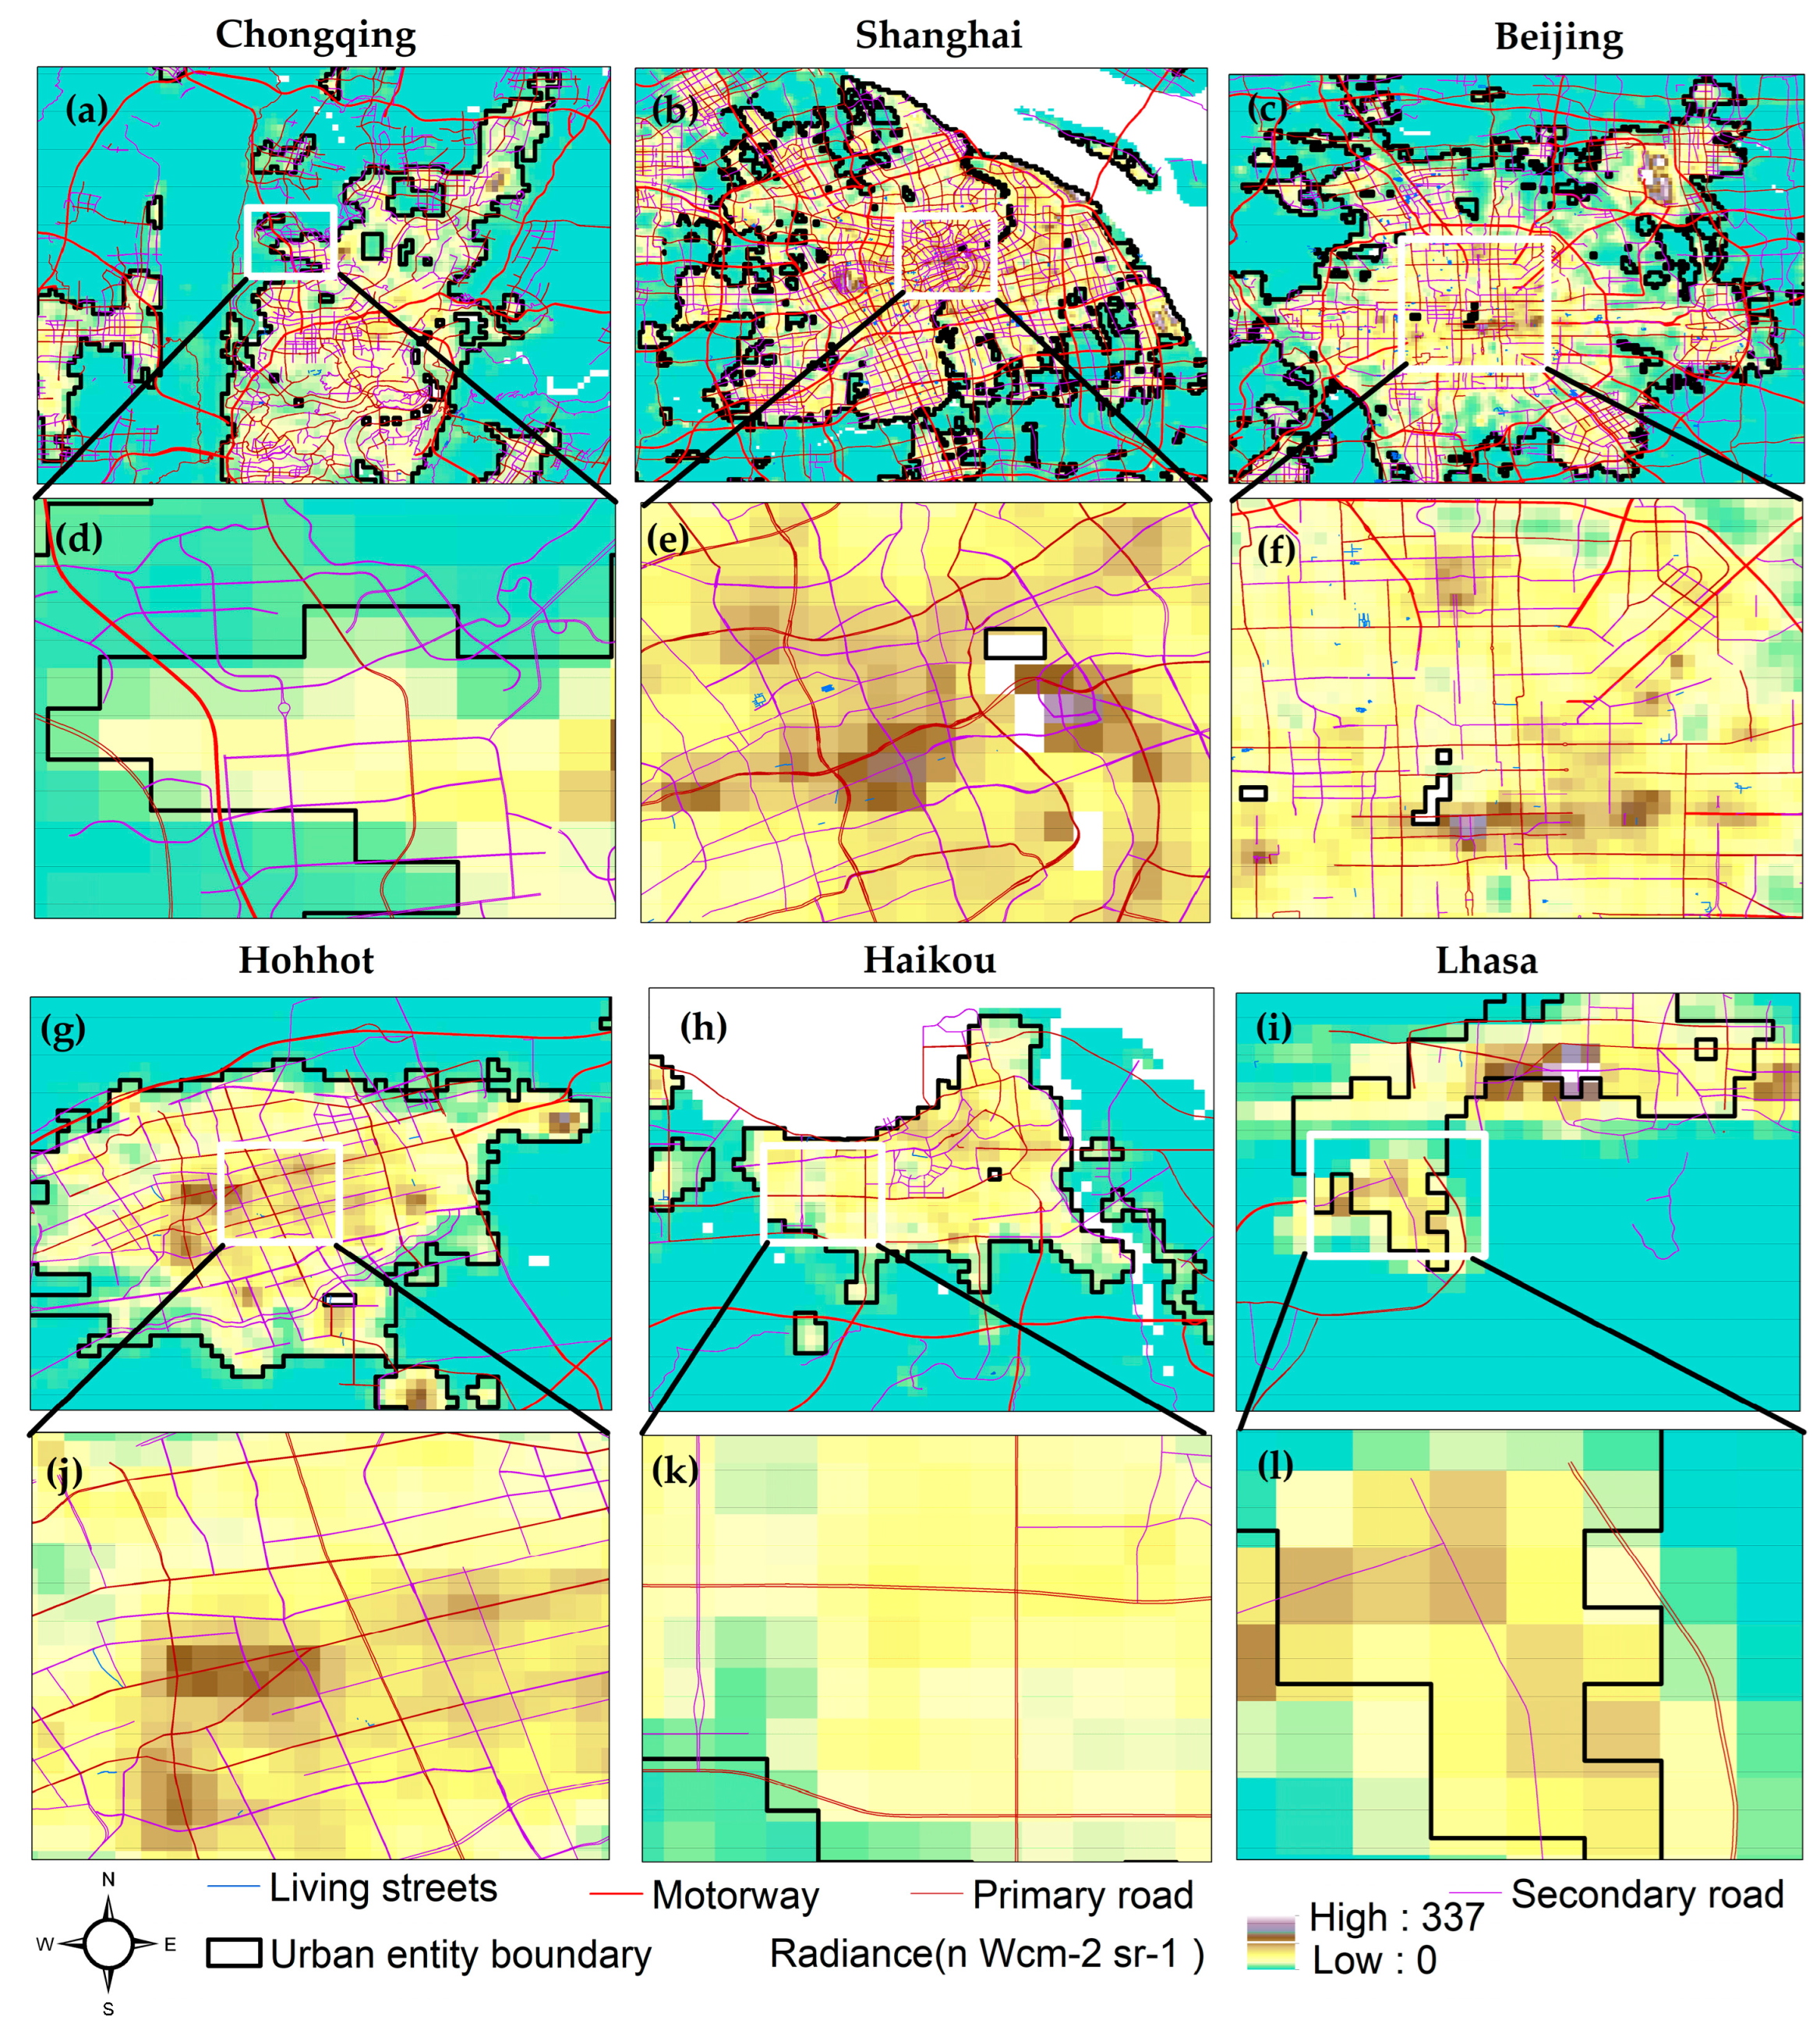
The concentration of human activities is associated with the travel patterns of the community. For the rationality assessment, a visual comparison between the OSM road network and the urban entities was made using six capital cities. In this context, the road network of the six provincial capitals was overlaid with the boundaries of the extracted urban entities. It was revealed that road networks were spatially consistent with the extracted urban entities. This result showed that with increasing road network density, the NTL intensity also increased (Figure 4a–c,g–i).
Motorways and primary roads are the interaction pathways among urban entities, while secondary and living streets (the streets running through residential areas) are the main interaction pathways within the urban entities. At the fringe as well as within urban entities, there is a good spatial consistency among the entity boundaries and secondary roads, especially in Chongqing, Shanghai, Beijing, and Hohhot (Figure 4d–f,j). However, as small provincial capitals with smaller population sizes and fewer human activities, it was difficult to identify similar spatial consistencies among urban boundaries and secondary and other roads in Haikou and Lhasa (Figure 4k,l). However, on the whole, spatial consistency was prevalent, since the SNPP-VIIRS-like data can reflect the development of road networks in cities as commuting pathways.
3.3. Comparison of Results with the HE and MODIS Products
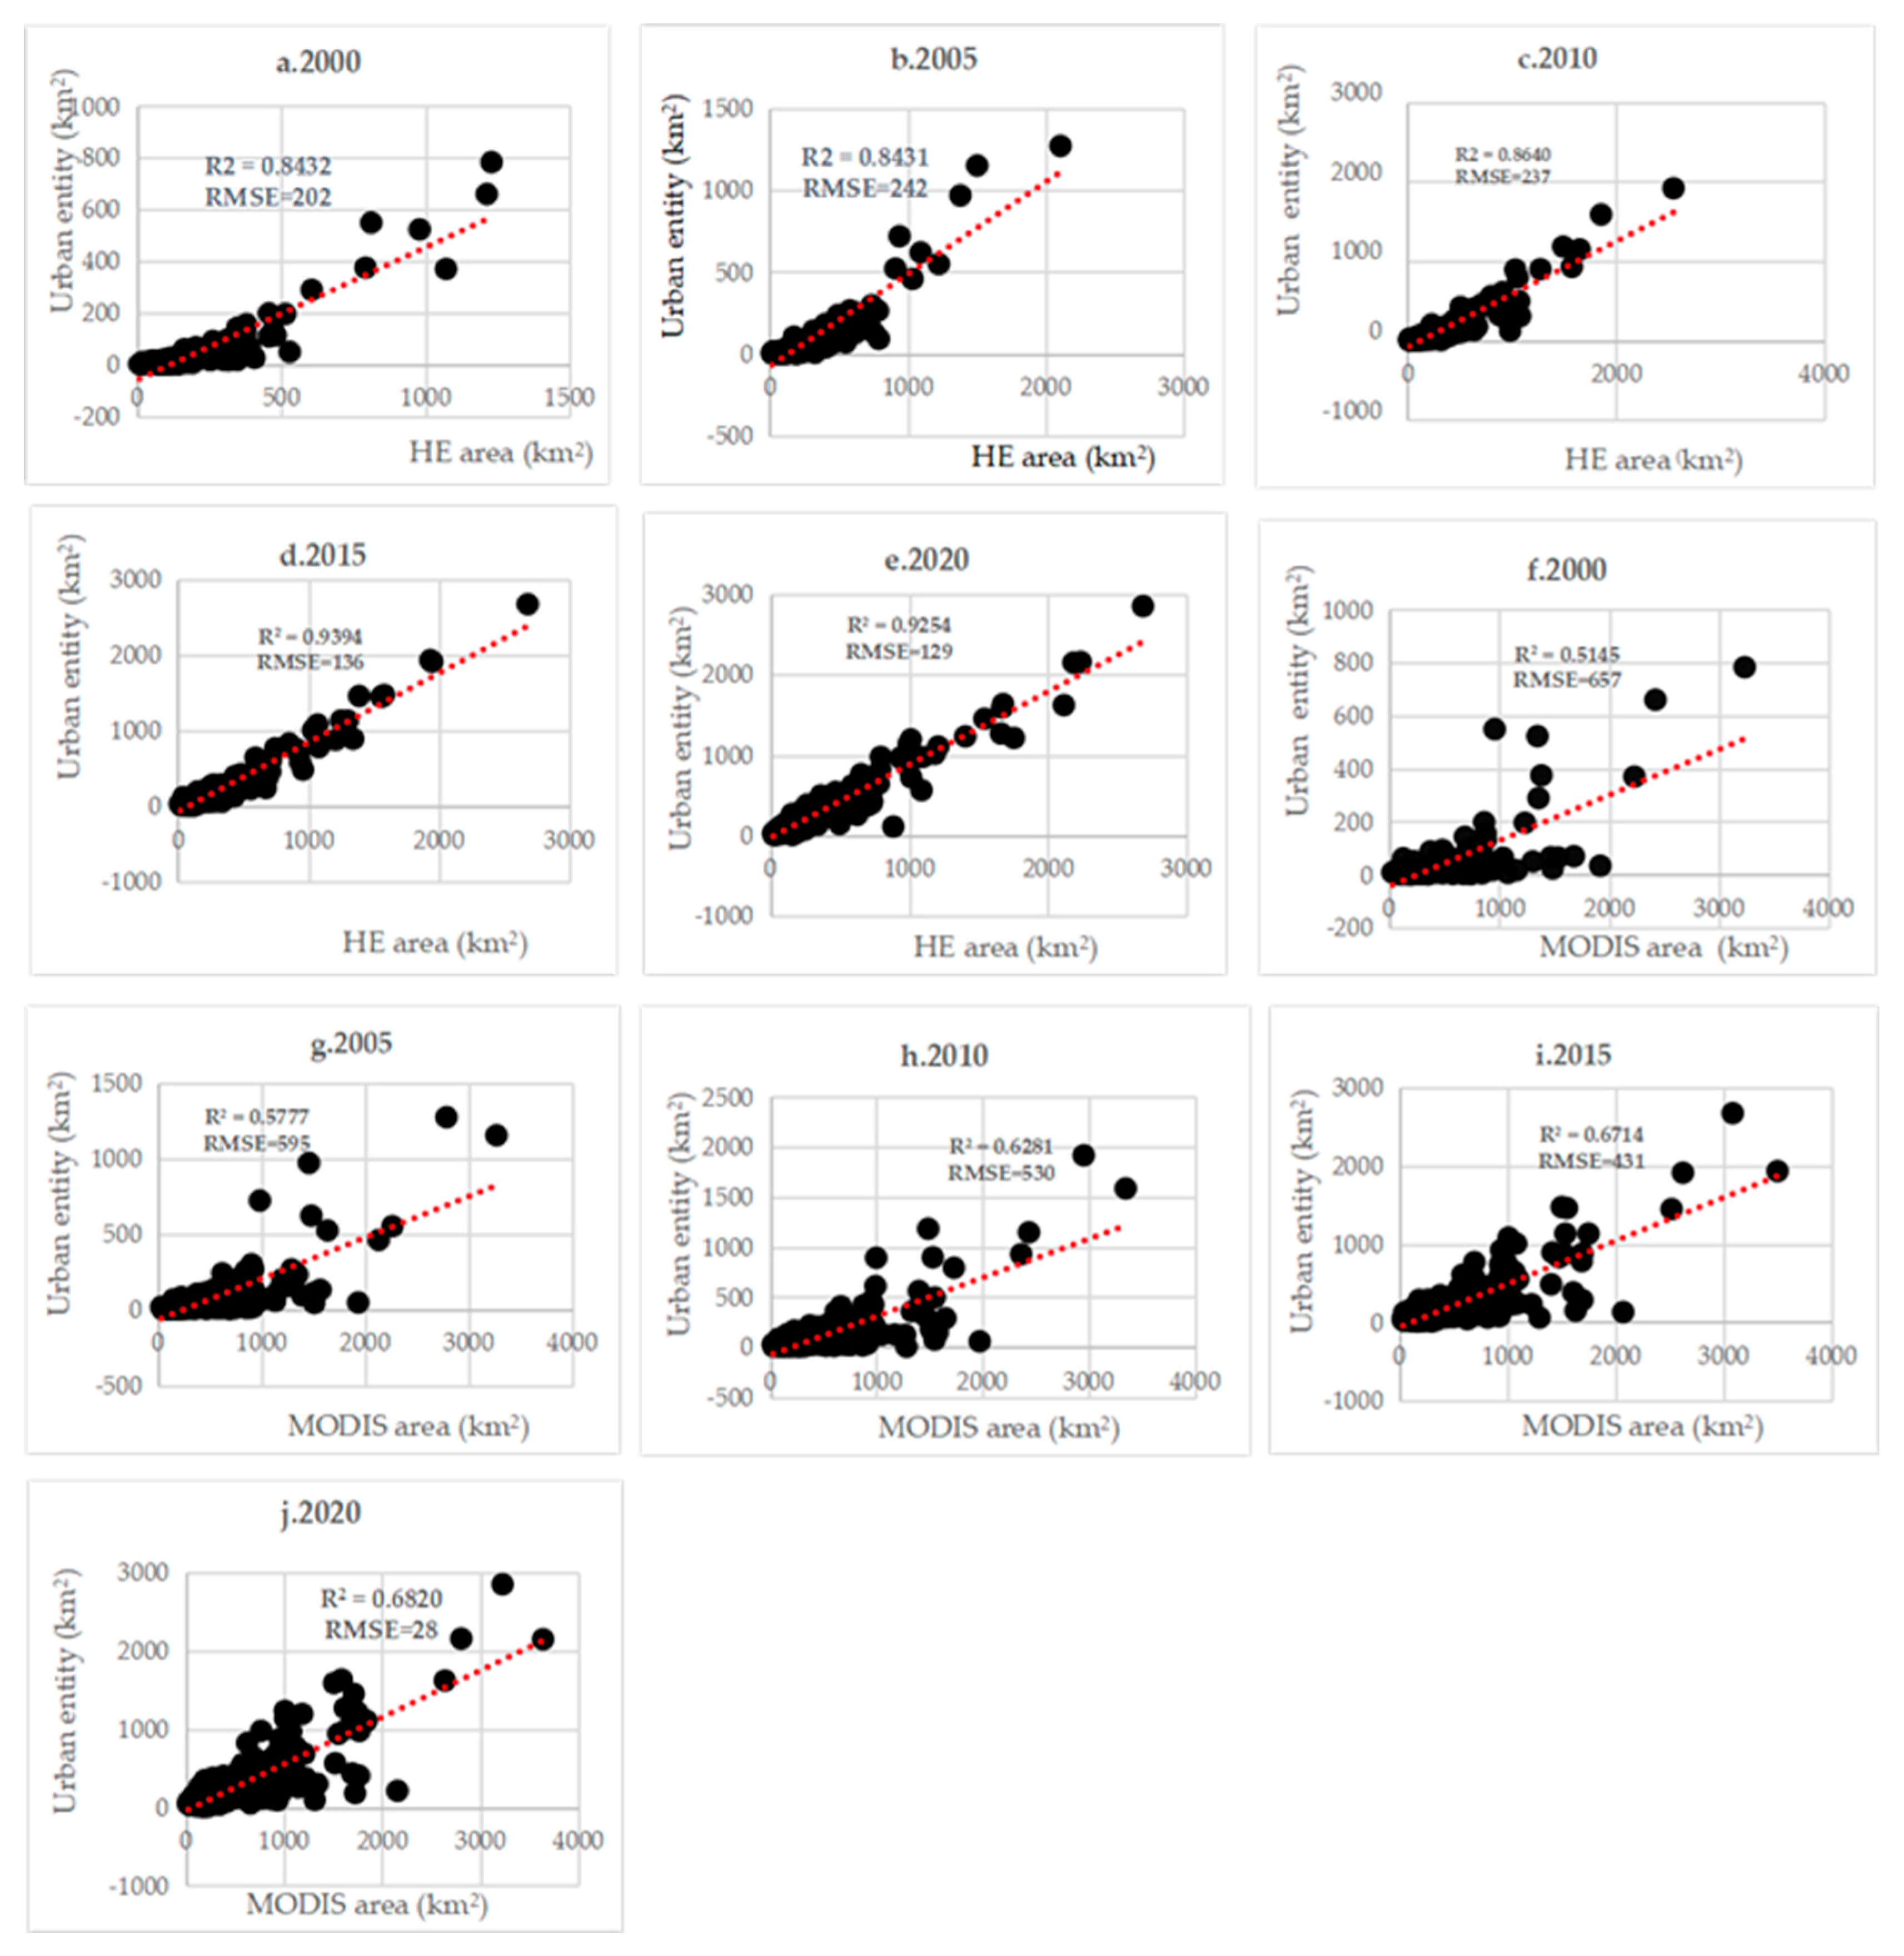
As remote sensing products, MODIS and HE are commonly used global urban products for urban area evaluation and analysis, especially for post-evaluations. Extracted urban entities (UE) were overlaid with two global urban products that reflected impervious surfaces (MODIS) or urban built-up areas (HE) to verify the rationality of the extracted results from the NTL data. As shown in Figure 5, the extracted outputs from urban entities were basically consistent with the total areas of the HE and MODIS in prefecture cities.
The R2 value was not below 0.5145. Furthermore, it was found that root-mean-square errors (RMSE) did not exceed 657. However, most prefecture cities were positioned at the bottom right, showing that the total urban entities were generally lower than those in the HE and MODIS. Furthermore, to verify the results, total urban areas from UE, HE, and MODIS were calculated at regional and national levels (Figure S3).
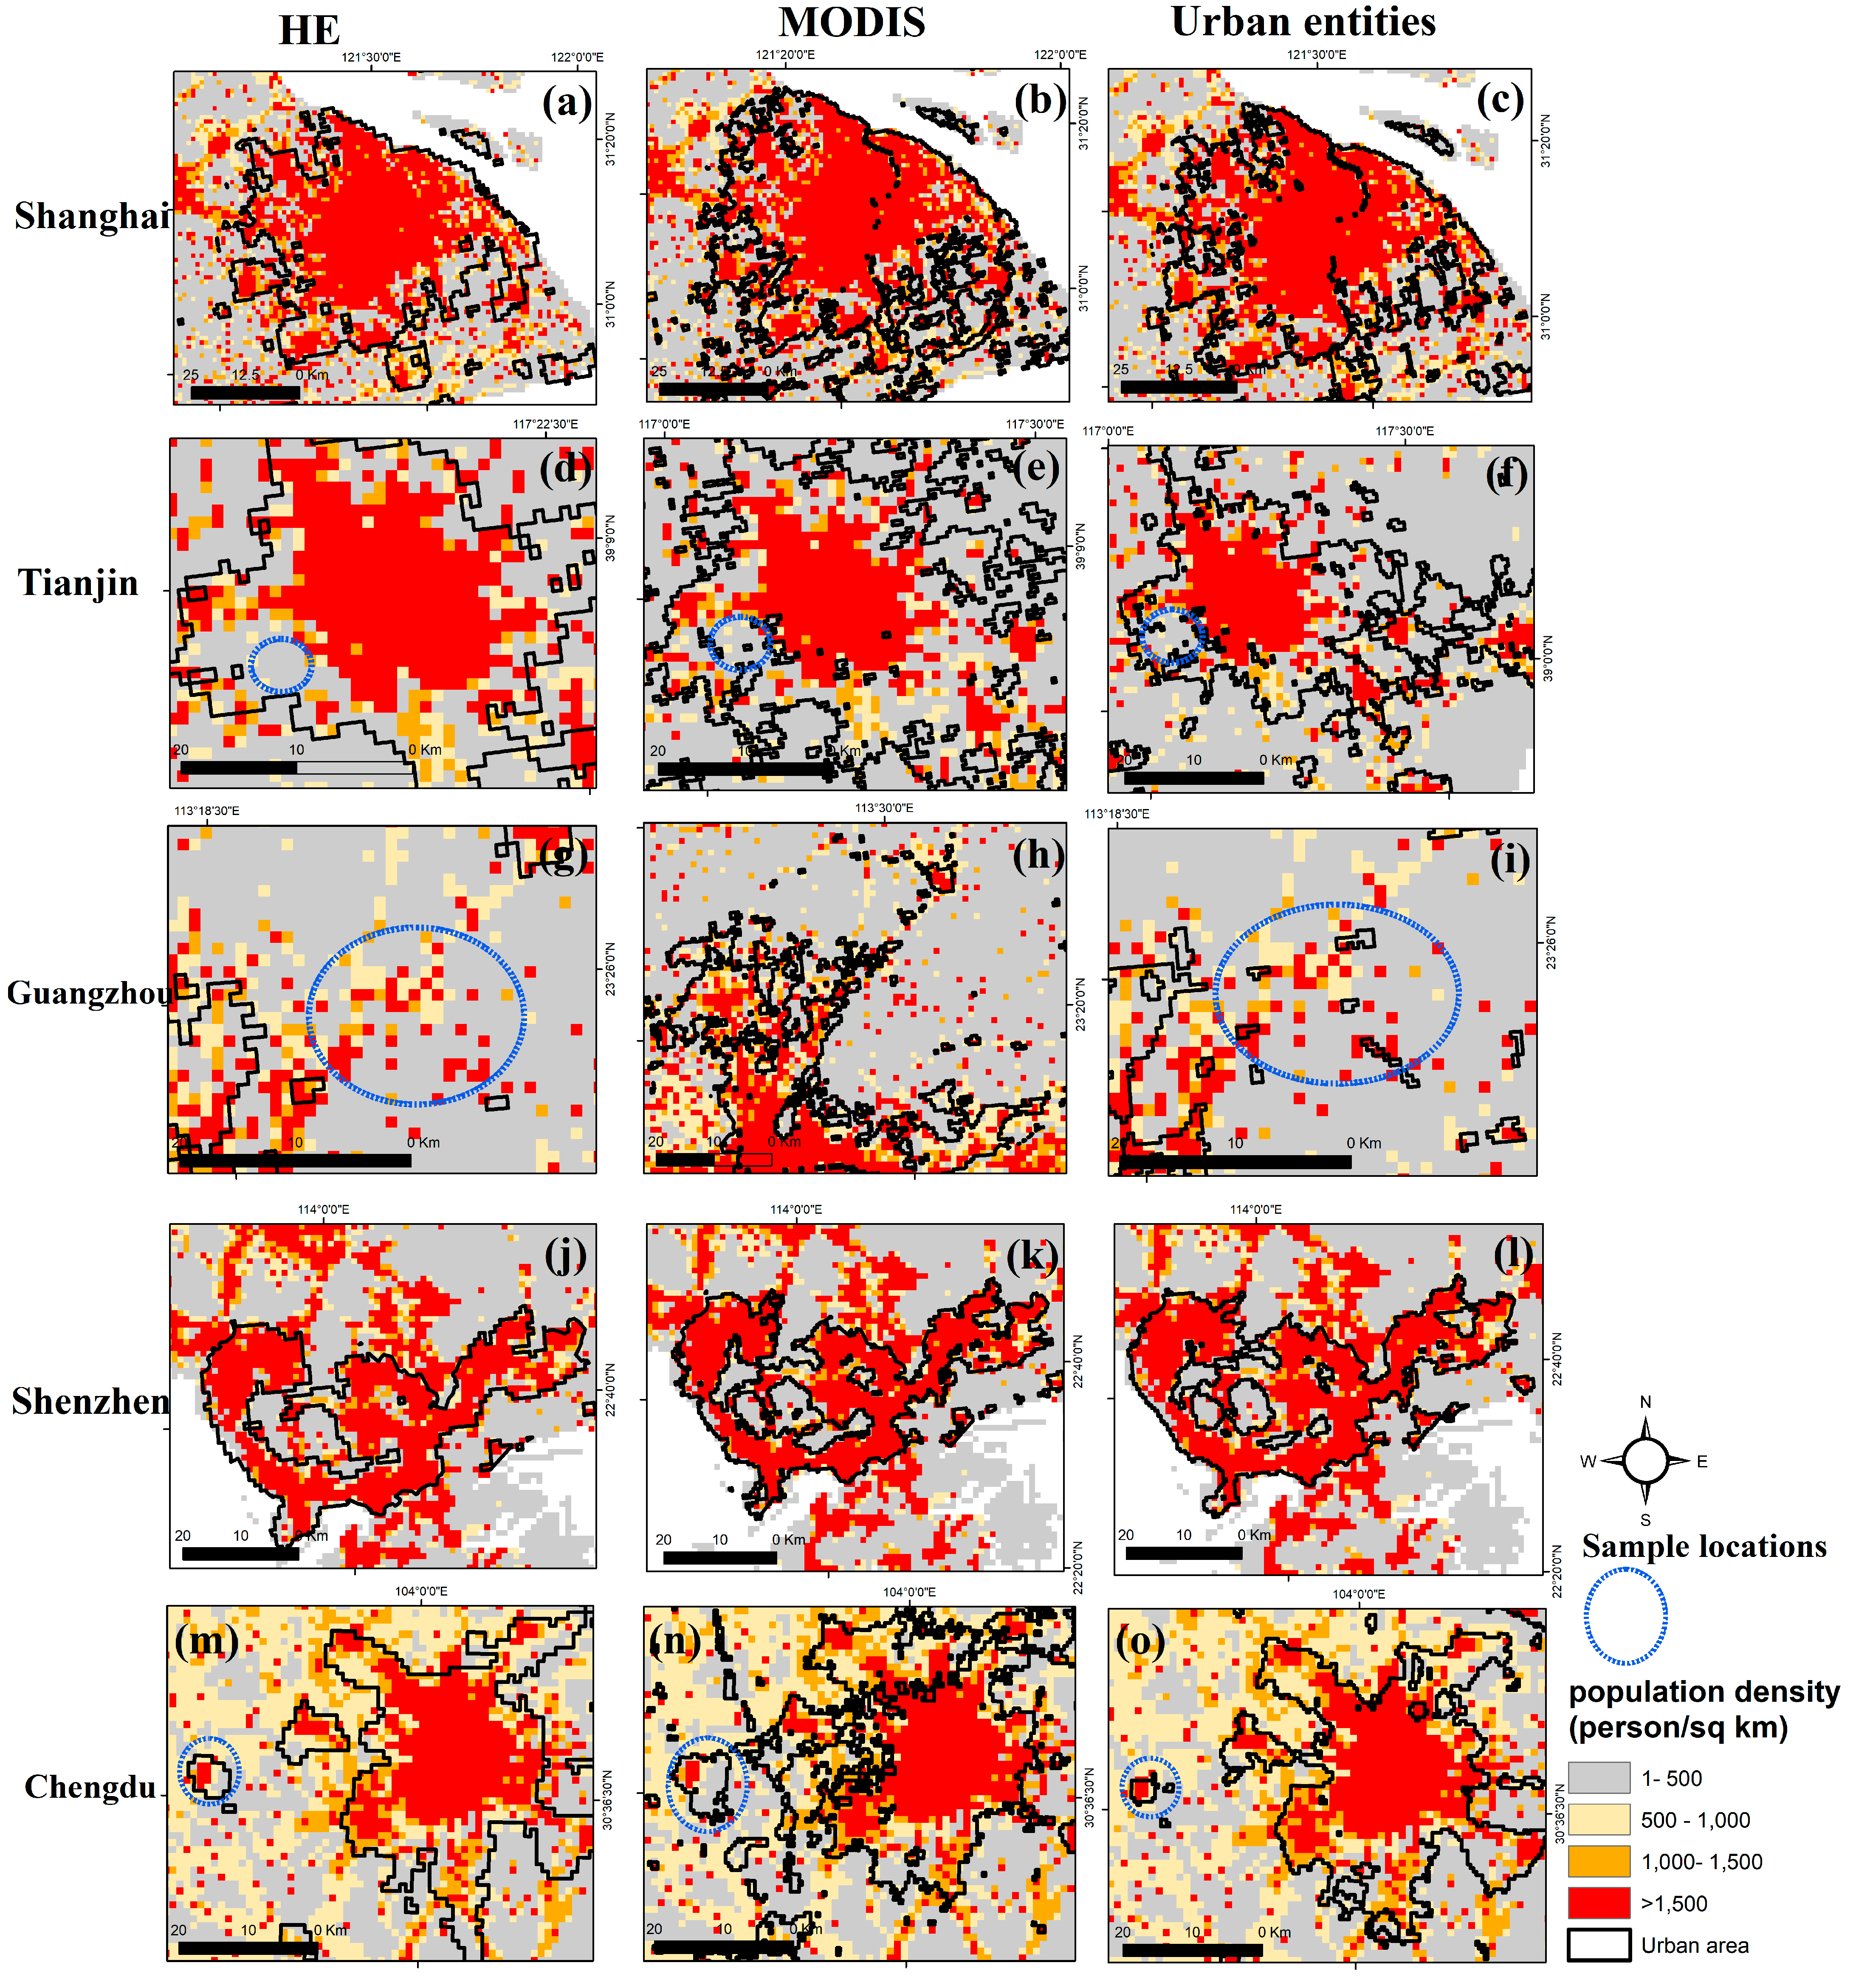
Overall, it was observed that the total areas of urban entities were normally lower than the total areas detected via MODIS and HE as urban areas. However, a relatively unstable trend of urban areas was observed for all three products, UE, HE, and MODIS, within the concerned time period. MODIS and HE appeared to be more consistent over the study period compared to the UE. However, the UE seems to be changing faster than either the MODIS or HE, especially after 2010. This inconsistency could occur as a result of excluding some impervious or built-up areas within large patches and the urban periphery from SNPP-VIIRS-like data, as urban entities were detected not only in built-up areas but also in the concentration of human activities. The situation is also consistent with the findings of Zhao et al. [40], who indicated that urban entities are approximately 20–45% different due to the impervious surfaces. Urban entities demonstrated relative agreement with the LandScan population product with a population density of at least >500/person/km2 in the selected prefecture cities of Shanghai, Guangzhou, Shenzhen, and Chengdu (Figure 6). However, there are also some spatial differences that are shown as blue circles in the figure. In the city of Tianjin, some areas with a population density <500 person/km2 were detected as urban areas in three urban products: HE, MODIS, and UE (Figure 6d–f). However, HE and MODIS urban entities had a good spatial consistency with LandScan population density.
As evident in Guangzhou, HE did not identify some urban patches with population densities > 500 person/km2 or even >1500 person/km2 as urban areas. However, SNPP-VIIRS-like data also extracted those small patches as urban entities (Figure 6g,i)). HE and MODIS also identified non-populated extents in urban areas as in the case of Chengdu (Figure 6m–o). However, in urban entities, those unpopulated areas were excluded from urban areas. The comparison proved that the impervious surfaces are normally greater than the urban entities due to the differences in urban object attributes that could be identified by the SNPP-VIIRS-like data. The urban entities had higher spatial consistency than did the HE and MODIS results, according to the comparisons. The overall accuracy (OA) and Kappa of the urban entities were 74.29–99.34% and 0.22–0.75, respectively. The OA and kappa of HE were 76.05–97.88% and 0.22–0.59, respectively. For MODIS, the OA and kappa were 78.69–97.85% and 0.21–0.65, respectively. According to the comparison with other urban references of the LandScan population products, urban entities could be considered a more effective product for delineating urban extents when considering the socioeconomic background of urban areas.
4. Discussion
4.1. Efficiency of SNPP-VIIRS-like Data for Urban Mapping
As complex and dynamic landscapes, urban areas consist of different spatial features and characteristics. Thus, clear-cut urban boundaries are very difficult to see in reality. When only physical features or human activity surfaces are used, it is very difficult to demarcate urban areas. Therefore, an efficient method is one that integrates both aspects. Spatial variations could be observed after comparing the NTL data, Globeland 30 product, and LandSat8 images for 2020 in five provincial capitals. Shi et al. [38] also used the same data products to assess the applicability of NTL data for urban mapping.
We attempted to differentiate the color variations in the same area derived from these three products from different satellites. In the Globeland and Landsat8 images, the concrete structures and impermeable surfaces are displayed in red or purple (Figure S4a–j) in urban and nonurban areas. However, in the NTL images, the same land cover type is displayed in different NTL intensities (Figure S4k–o). This variation occurred in the different perceptions of urban entities. Ma et al. and Zhou et al. [26,55] emphasized that human perceptions should also be considered when identifying urban areas along with other physical impervious constructions such as road networks and buildings. Shi et al. [38] further indicated that other sensing data should also be integrated for accurate urban entity extraction. The lack of long-time series data also affects urban entity extraction. However, NTL data could be used to capture and identify both the geographical extent of human activities and the differences in impervious surfaces [41,51]. Thus, characteristics of urban surfaces such as size, shape, and activities can be effectively detected by using SNPP-VIIRS-like data compared to DMSP-OLS data. Thus, it is better to combine two sources to produce more accurate and reliable long-time series data products.
However, in practice, there is a limitation in the uncertainty of NTL data when using them for mapping and extracting urban areas. Even though the intensity of urban lights is reflected in nighttime light images, the distribution of characteristics of urban entities is not always adequately represented for a variety of reasons. To improve the results in future studies, it may therefore be more efficient and beneficial to combine NTL images with high-resolution remote sensing data. Most of the previous studies were mainly focused on physical surface extraction rather than human activity surfaces and socioeconomic information [24,56,57]. However, in a few previous studies, the capability of NTL data to capture human activity was highlighted. However, those studies also used the built-up area as a boundary demarcation parameter [46,55]. Similar findings were observed by Shi et al. [38] in their global urban entity extraction research performed using SNPP-VIIRS-like data. Additionally, it is crucial to take into account that the switch from Blue LED to White LED lighting technology has had a significant impact on urban areas and streets over the past ten years when conducting NTL-based research in the future [58].
4.2. Relationship between Urban Growth and Urban Economic Development
Urban GDP data were utilized to examine the consistency between urban expansion and economic growth because it is one of the main urban socioeconomic indicators. Although the best estimate of urban economic growth in prefecture cities is the combined district GDP, the city-level GDP data were used for regression analysis. Previous researchers have also sought to determine how well NTL data could evaluate urban expansion and urban economic development. The correlation between the urban entity and urban GDP was evaluated by Shi et al. [38]. The study compared the relationship between UE, HE, and MODIS extent with urban GDP data for 270 cities during the period 2000–2020. All regressions had significant correlation coefficient (R2) values of total urban areas and urban GDP.
During the examined period, the R2 values for UE and GDP ranged from 0.6189 to 0.7543 (Figure S5a–e). The correlation coefficient between HE and GDP ranged from 0.5553 to 0.8532 (Figure S5f–j). The R2 values for MODIS and GDP ranged from 0.4467 to 0.5840 (Figure S5k–o). Thus, a comparatively high relationship could be identified between the urban entity and urban GDP compared to MODIS. Although the R2 value of HE and GDP was slightly higher than that of UE, these results could present a similar relationship between urban growth and socioeconomic growth, especially in terms of urban GDP. Shi et al. [38] observed that there was a higher correlation between urban entities and GDP than HE and MODIS when they measured the correlation between the urban area and urban GDP growth.
4.3. Applicability of K-Means Classification for Urban Mapping
The main difference between the previous studies and our study was the urban entity definition approach. In most previous studies, NTL data were transformed into impervious surfaces/built-up areas using the threshold method and mutation detection [47,59,60]. Threshold methods have omitted some highly populated areas as urban patches in most prefecture cities. Mutation detection is also a common method that detects urban areas with supporting data. Considerable misidentifications of urban areas could be observed in most cities from HE and MODIS products. However, the urban entities extracted using K-means classification in this study could be considered impervious surfaces that take into consideration the optimal thresholds of socioeconomic activities since the SNPP-VIIRS-like data can reflect the actual distribution of human activities [61,62].
The advantage of the K-means is that it extracts urban areas in a rapid and efficient manner using the NTL intensity with additional remote sensing data. Shi et al. [38,63] also proved that considering pixel characteristics K-means classification could be used for comparative analysis in any spatiotemporal dimension. However, utilizing K-means classification for urban mapping has a number of limitations. It is difficult to choose the initial cluster centers and determine how many clusters there should be. Furthermore, too many or too few clusters may yield unreliable results. Since the K-means algorithm assumes that clusters have a spherical shape, it is impossible to handle non-spherical shapes. However, in reality, urban entities may have complex non-spherical shapes. Additionally, outlier effects may lead to inaccurate classification results since outliers can alter how the algorithm divides clusters. Therefore, it would be more efficient to use more sophisticated algorithms and additional data sources for more accurate results in future studies.
5. Conclusions
This study tested the effectiveness of SNPP-VIIRS-like data for the extraction of urban entities from 270 prefecture cities in China during the period 2000–2020. The rationality assessment proved that extracted urban entities were spatially consistent with the LandScan population product and road networks. This further confirmed the notion of urban entities and reflects the spatial distribution of human activity surfaces. The study compared the extracted urban entities with conventional impervious surface and built-up area data such as those of the MODIS and HE products to delineate their similarities and differences. It also confirmed that urban entities are basically consistent with these data products. Regression results also derived a positive relationship between urban entities and socioeconomic development variables such as urban GDP. Urban areas in China increased from 8082 km2 to 74,417 km2 indicating a 10.8% growth rate during the past 20 years. Most provincial capitals including Shanghai, Beijing, and Chongqing showed considerable growth except for a few small provincial capitals such as Lhasa and Haikou. Since NTL data brightness thresholds have greater variations in the global context, new clustering methods superior to the K-means should be applied to derive more realistic results integrating high-resolution remote sensing data in future urban mapping research, integrating high-resolution remote sensing data in future urban mapping research. In that way, urban areas would be evaluated more accurately and effectively since brightness variations could reflect the different human activity zones in urban areas.
Supplementary Materials
The following supporting information can be downloaded at: https://www.mdpi.com/article/10.3390/rs15184632/s1, Figure S1: Expansion of urban entities of 31 provincial capitals in China 2000–2020; Figure S2: Extracted urban entities (a) Shanghai; (b) Beijing; (c) Shenzhen; (d) Guangzhou with LandScan product and Landsat8 images, 2015; Figure S3: Comparison results of urban areas for UE, HE, MODIS on provincial, and, national levels, 2000–2020; Figure S4: Visual differences of urban entities of five capitals in Globeland, Landsat8, and SNPP-VIIRS-like images in 2020; Figure S5: Regression results of total urban areas for UE, HE, MODIS, and urban GDP 2000–2020.
Author Contributions
Conceptualization, K.S. and J.S.; methodology, N.C.W.; software, N.C.W.; validation, N.C.W.; formal analysis, N.C.W.; resources, K.S.; writing—original draft preparation, N.C.W.; review and editing, J.S.; visualization, N.C.W.; supervision, J.S.; funding acquisition, J.S. All authors have read and agreed to the published version of the manuscript.
Funding
This research was funded by the Chongqing Social Science Planning Project (No. 2020PY28) and the Natural Science Foundation of Chongqing (No. CSTB2022NSCQ-MSX0336).
Data Availability Statement
Not Applicable.
Acknowledgments
The authors express gratitude to the anonymous reviewers and editors for their valuable comments provided on improving the quality of the manuscript. The authors are grateful to the Earth Observation Group, National Tibetan Plateau Data Center, U.S. Geological Survey (USGS), and Oak Ridge National Laboratory for providing DMSP, HE, Landsat, MODIS, Globeland, and LandScan data relevant to the study.
Conflicts of Interest
No potential conflict of interest were reported by the authors.
References
- Habitat, U.N. ANNOTATION of the Concept of the United Nations Human Settlements Program (UN-HABITAT) Project; Russian State Scientific Research and Design Institute of Urbanistics: Moscow, Russia, 2006; pp. 1–14. Available online: http://hdl.handle.net/11374/681 (accessed on 5 March 2023).
- Thapa, R.B.; Murayama, Y. Examining spatiotemporal urbanization patterns in Katmandu valley, Nepal: Remote sensing and spatial metrics approach. Remote Sens. 2009, 1, 534–556. [Google Scholar] [CrossRef]
- United Nations, Department of Economic, and Population Division Social Affairs. World Urbanization Prospects; The 2018 revision; Department of Economic and Social Affairs PD: New York, NY, USA, 2018; pp. 1–126. Available online: https://population.un.org/wup/publications/Files/WUP2018-Report.pdf (accessed on 3 March 2023).
- Zhou, Y.; Smith, S.J.; Elvidge, C.D.; Zhao, K.; Thomson, A.; Imhoff, M.A. Cluster-based method to map urban area from DMSP/OLS nightlights. Remote Sens. Environ. 2014, 147, 173–185. [Google Scholar] [CrossRef]
- Schneider, A.; Mark, A.F.; Potere, D. Mapping global urban areas using MODIS 500-m data: New methods and datasets based on urban ecoregions. Remote Sens. Environ. 2010, 114, 1733–1746. [Google Scholar] [CrossRef]
- Zhang, Q.; Seto, K.C. Mapping urbanization dynamics at regional and global scales using multi-temporal DMSP/OLS nighttime light data. Remote Sens. Environ. 2011, 115, 2320–2329. [Google Scholar] [CrossRef]
- Fan, J.; Ma, T.; Zhou, C.; Zhou, Y.; Xu, T. Comparative estimation of urban development in China’s cities using socioeconomic and DMSP/OLS night light data. Remote Sens. 2014, 6, 7840–7856. [Google Scholar] [CrossRef]
- Lu, L.; Zhang, Y.; Luo, T.T. Difficulties and Strategies in the Process of Population Urbanization: A Case Study in Chongqing of China. Open J. Soc. Sci. 2014, 2, 90–95. [Google Scholar] [CrossRef]
- Zhang, X.; Liu, L.; Wu, C.; Chen, X.; Gao, Y.; Xie, S.; Zhang, B. Development of a global 30 m impervious surface map using multi-source and multi-temporal remote sensing datasets with the Google Earth Engine platform. Earth Syst. Sci. Data 2020, 12, 1625–1648. [Google Scholar] [CrossRef]
- Gong, P.; Li, X.; Wang, J.; Chen, B.; Hu, T.; Liu, X.; Xu, B.; Yang, J.; Wei, Z. Annual maps of global artificial impervious area (GAIA) between 1985 and 2018. Remote Sens. Environ. 2020, 236, 111510. [Google Scholar] [CrossRef]
- Ellison, G.; Edward, L.G.; William, R.K. What causes industry agglomeration? Evidence from coagglomeration patterns. Am. Econ. Rev. 2010, 100, 1195–1213. [Google Scholar] [CrossRef]
- Keuschnigg, M. Scaling trajectories of cities. Proc. Natl. Acad. Sci. USA 2019, 116, 13759–13761. [Google Scholar] [CrossRef]
- Lv, Y.; Lin, Z.; Guobiao, Y.; Xinqi, Z. Detecting the true urban polycentric pattern of Chinese cities in morphological dimensions: A multi-scale analysis based on geospatial big data. Cities 2021, 116, 103298. [Google Scholar] [CrossRef]
- Chen, Z.; Bailang, Y.; Yingjie, H.; Chang, H.; Shi, K.; Jianping, W. Estimating house vacancy rate in metropolitan areas using NPP-VIIRS nighttime light composite data. IEEE J. Sel. Top. Appl. Earth Obs. Remote Sens. 2015, 8, 2188–2197. [Google Scholar] [CrossRef]
- Henderson, J.V.; Dzhamilya, N.; Sebastian, K. Measuring urban economic density. J. Urban Econ. 2019, 125, 103188. [Google Scholar] [CrossRef]
- Grove, J.; Morgan, M.; Cadenasso, L.; Steward, T.P. The Baltimore School of Urban Ecology; Yale University Press: London, UK, 2015. [Google Scholar]
- Xu, T.; Ma, T.; Zhou, C.; Zhou, Y. Characterizing Spatio-Temporal Dynamics of Urbanization in China Using Time Series of DMSP/OLS Night Light Data. Remote Sens. 2014, 6, 7708–7731. [Google Scholar] [CrossRef]
- Imhoff, M.L.; Lawrence, W.T.; Stutzer, D.C.; Elvidge, C.D. A technique for using composite DMSP/OLS city lights satellite data to map urban area. Remote Sens. Environ. 1997, 61, 361–370. [Google Scholar] [CrossRef]
- Elvidge, C.D.; Baugh, K.E.; Kihn, E.A.; Kroehl, H.W.; Davis, E.R. Mapping city lights with nighttime data from the DMSP operational line scan system. Photogramm. Eng. Remote Sens. 1997, 63, 727–734. [Google Scholar]
- Small, C.; Francesca, P.; Elvidge, C.D. Spatial analysis of global urban extent from DMSP-OLS night lights. Remote Sens. Environ. 2005, 96, 277–291. [Google Scholar] [CrossRef]
- Zheng, Y.; Tang, L.; Wang, H. An improved approach for monitoring urban built-up areas by combining NPP-VIIRS nighttime light, NDVI, NDWI, and NDBI. J. Clean. Prod. 2021, 328, 129488. [Google Scholar] [CrossRef]
- Elvidge, C.D.; Sutton, P.C.; Ghosh, T.; Tuttle, B.T.; Baugh, K.E.; Bright, E. A Global Poverty Map Derived from Satellite Data. Comput. Geosci. 2009, 35, 1652–1660. [Google Scholar] [CrossRef]
- Liu, Z.; He, C.; Zhang, Q.; Huang, Q.; Yang, Y. Extracting the dynamics of urban expansion in China using DMSP-OLS nighttime light data from 1992 to 2008. Landsc. Urban Plan. 2012, 106, 62–72. [Google Scholar] [CrossRef]
- Ma, T.; Zhou, C.; Tao, P.; Haynie, S.; Fan, J. Quantitative estimation of urbanization dynamics using time series of DMSP/OLS nighttime light data: A comparative case study from China’s cities. Remote Sens. Environ. 2012, 124, 99–107. [Google Scholar] [CrossRef]
- Shi, K.; Huang, C.; Yu, B.; Yin, B.; Huang, Y.; Wu, J. Evaluation of NPP-VIIRS night-time light composite data for extracting built-up urban areas. Remote Sens. Lett. 2014, 5, 358–366. [Google Scholar] [CrossRef]
- Ma, Q.; He, C.; Wu, J.; Liu, Z.; Zhang, Q.; Sun, Z. quantifying spatiotemporal patterns of urban impervious surfaces in China: An improved assessment using nighttime light data. Landsc. Urban Plan. 2014, 130, 36–49. [Google Scholar] [CrossRef]
- Xiao, P.; Wang, X.; Feng, X.; Zhang, X.; Yang, Y. Detecting China’s Urban Expansion over the Past Three Decades Using Nighttime Light Data. IEEE J. Sel. Top. Appl. Earth Obs. Remote Sens. 2014, 7, 4095–4106. [Google Scholar] [CrossRef]
- Ma, T.; Zhou, Y.; Zhou, C.; Haynie, S.; Pei, T.; Xu, T. Night-time light derived estimation of spatiotemporal characteristics of urbanization dynamics using DMSP/OLS satellite data. Remote Sens. Environ. 2015, 158, 453–464. [Google Scholar] [CrossRef]
- Su, Y.; Chen, X.; Wang, C.; Zhang, H.; Liao, J.; Ye, Y.; Wang, C. A new method for extracting built-up urban areas using DMSP-OLS nighttime stable lights: A case study in the Pearl River Delta, southern China. GIScience Remote Sens. 2015, 52, 218–238. [Google Scholar] [CrossRef]
- Shi, K.; Chen, Y.; Yu, B.; Xu, T.; Li, L.; Huang, C.; Liu, R.; Chen, Z.; Wu, J. Urban Expansion and Agricultural Land Loss in China: A Multi-scale Perspective. Sustainability 2016, 8, 790. [Google Scholar] [CrossRef]
- Ju, Y.; Dronova, I.; Ma, Q.; Zhang, X. Analysis of urbanization dynamics in mainland China using pixel-based night-time light trajectories from 1992 to 2013. Int. J. Remote Sens. 2017, 38, 6047–6072. [Google Scholar] [CrossRef]
- Dou, Y.; Zhifeng, L.; He, C.; Yue, H. Urban Land Extraction Using VIIRS Nighttime Light Data: An Evaluation of Three Popular Methods. Remote Sens. 2017, 9, 175. [Google Scholar] [CrossRef]
- Liu, Y.; Delahunty, T.; Zhao, N.; Cao, G. These lit areas are undeveloped: Delimiting China’s urban extents from threshold nighttime light imagery. Int. J. Appl. Earth Obs. Geoinf. 2016, 50, 39–50. [Google Scholar] [CrossRef]
- Chen, Z.; Yu, B.; Song, W.; Liu, H.; Wu, Q.; Shi, K.; Wu, J. A New Approach for Detecting Urban Centers and Their Spatial Structure with Nighttime Light Remote Sensing. IEEE Trans. Geosci. Remote Sens. 2017, 55, 6305–6319. [Google Scholar] [CrossRef]
- Lin, Z.; Xu, H.S. Monitoring of the Urban Expansion Dynamics in China’s East Coast Using DMSP/OLS Nighttime Light Imagery. J. Geo-Inf. Sci. 2019, 21, 1074–1085. [Google Scholar] [CrossRef]
- Ma, M.; Lang, Q.; Yang, H.; Shi, K.; Ge, W. Identification of Polycentric Cities in China Based on NPP-VIIRS Nighttime Light Data. Remote Sens. 2020, 12, 3248. [Google Scholar] [CrossRef]
- Zheng, Y.; Zhou, Q.; He, Y.; Wang, C.; Wang, X.; Wang, H. An Optimized Approach for Extracting Urban Land Based on log-Transformed DMSP-OLS Nighttime Light, NDVI, and NDWI. Remote Sens. 2021, 13, 766. [Google Scholar] [CrossRef]
- Shi, K.; Wu, Y.; Liu, S.; Chen, Z.; Huang, C.; Cui, Y. Mapping and evaluating global urban entities (2000–2020): A novel perspective to delineate urban entities based on consistent nighttime light data. GIScience Remote Sens. 2023, 60, 2161199. [Google Scholar] [CrossRef]
- He, C.; Liu, Z.; Gou, S.; Zhang, Q.; Zhang, J.; Xu, L. Detecting global urban expansion over the last three decades using a fully convolutional network. Environ. Res. Lett. 2019, 14, 034008. [Google Scholar] [CrossRef]
- Zhao, M.; Zhou, Y.; Li, X.; Cheng, W.; Zhou, C.; Ma, T.; Li, M.; Huang, K. Mapping Urban Dynamics (1992–2018) in Southeast Asia Using Consistent Nighttime Light Data from DMSP and VIIRS. Remote Sens. Environ. 2020, 248, 111980. [Google Scholar] [CrossRef]
- Liu, S.; Shi, K.; Wu, Y. Identifying and evaluating suburbs in China from 2012 to 2020 based on SNPP–VIIRS nighttime light remotely sensed data. Int. J. Appl. Earth Obs. Geoinf. 2022, 114, 103041. [Google Scholar] [CrossRef]
- National Bureau of Statistics. China. Statistical Yearbook; China Statistical Press: Beijing, China, 2021. Available online: http://www.stats.gov.cn/tjsj/ndsj/2021/indexeh.htm (accessed on 23 March 2023).
- Chien, S.S. Prefectures and prefecture-level cities: The political economy of administrative restructuring in China local administration In Tradition and Changes of Sub-National Hierarchy; Chung, J.H., Tao-Chiu, L., Eds.; Routledge: Oxford, UK, 2010; pp. 127–143. [Google Scholar]
- National Bureau of Statistics. China. City Statistical Yearbook; China Statistics Press: Beijing, China, 2000–2020; Available online: https://data.cnki.net/yearBook/single?id=N2022040095 (accessed on 4 April 2023).
- Chen, Z.; Yu, B.; Yang, C.; Zhou, Y.; Yao, S.; Qian, X.; Wang, C.; Wu, B.; Wu, J. An extended time series (2000–2018) of global NPP-VIIRS-like nighttime light data from a cross-sensor calibration. Earth Syst. Sci. Data 2021, 13, 889–906. [Google Scholar] [CrossRef]
- Elvidge, C.D.; Baugh, K.E.; Zhizhin, M.; Hsu, F. Why VIIRS data are superior to DMSP for mapping nighttime lights. Proc. Asia-Pac. Adv. Netw. 2013, 35, 62–69. [Google Scholar] [CrossRef]
- Sanchez de Miguel, A.; Kyba, C.C.M.; Zamorano, J.; Gallego, J.; Gastou, K.J. The nature of the diffuse light near cities detected in nighttime satellite imagery. Sci. Rep. 2020, 10, 7829. [Google Scholar] [CrossRef] [PubMed]
- Rose, A.N.; Bright, E. The LandScan Global Population Distribution Project: Current state of the art and prospective innovation. In Technical Report; Oak Ridge National Lab (ORNL): Oak Ridge, TN, USA, 2014. [Google Scholar]
- Sulla-Menashe, D.; Friedl, M.A. User Guide to Collection 6 MODIS Land Cover (MCD12Q1 and MCD12C1) Product; USGS: Reston, VA, USA, 2018; pp. 1–18. [Google Scholar]
- Yang, M.; Tan, C.; Li, W. Spatial Recognition of the Urban-Rural Fringe of Beijing Using DMSP/OLS Nighttime Light Data. Remote Sens. 2017, 9, 1141. [Google Scholar] [CrossRef]
- Delmelle, E.C. Five Decades of Neighborhood Classifications and Their Transitions: A Comparison of Four US Cities, 1970–2010. Appl. Geogr. 2015, 57, 1–11. [Google Scholar] [CrossRef]
- Li, X.; Gong, P.; Liang, L.A. 30-year (1984–2013) record of annual urban dynamics of Beijing City derived from Landsat data. Remote Sens. Environ. 2015, 166, 78–90. [Google Scholar] [CrossRef]
- Hu, X.; Qian, Y.; Pickett, S.T.; Zhou, W. Urban mapping needs up-to-date approaches to provide diverse perspectives of current urbanization: A novel attempt to map urban areas with nighttime light data. Landsc. Urban Plan. 2020, 195, 103709. [Google Scholar] [CrossRef]
- Feng, Z.; Peng, J.; Wu, J. Using DMSP/OLS Nighttime Light Data and K–Means Method to Identify Urban–Rural Fringe of Megacities. Habitat Int. 2020, 103, 102227. [Google Scholar] [CrossRef]
- Zhou, Y.; Li, X.; Asrar, G.R.; Smith, S.J.; Imhoff, M. A global record of annual urban dynamics (1992–2013) from nighttime lights. Remote Sens. Environ. 2018, 219, 206–220. [Google Scholar] [CrossRef]
- Xie, Y.; Weng, Q.; Fu, P. Temporal variations of artificial nighttime lights and their implications for urbanization in the conterminous United States, 2013–2017. Remote Sens. Environ. 2019, 225, 160–174. [Google Scholar] [CrossRef]
- Xu, Z.; Jiao, L.; Lan, T.; Zhou, Z.; Cui, H.; Li, C.; Xu, G.; Liu, Y. Mapping Hierarchical Urban Boundaries for Global Urban Settlements. Int. J. Appl. Earth Obs. Geoinf. 2021, 103, 102480. [Google Scholar] [CrossRef]
- Schulte-Römer, N.; Meier, J.; Söding, M.; Dannemann, E. The LED Paradox: How Light Pollution Challenges Experts to Reconsider Sustainable Lighting. Sustainability 2019, 11, 6160. [Google Scholar] [CrossRef]
- Zheng, Y.; He, Y.; Zhou, Q.; Wang, H. Quantitative Evaluation of Urban Expansion using NPP-VIIRS Nighttime Light and Landsat Spectral Data. Sustain. Cities Soc. 2022, 76, 103338. [Google Scholar] [CrossRef]
- Chen, Z.; Yu, B.; Zhou, Y.; Liu, H.; Yang, C.; Shi, K.; Wu, J. Mapping global urban areas from 2000 to 2012 using time-series nighttime light data and MODIS products. IEEE J. Sel. Top. Appl. Earth Obs. Remote Sens. 2019, 12, 1143–1153. [Google Scholar] [CrossRef]
- Zhao, M.; Zhou, Y.; Li, X.; Cao, W.; He, C.; Yu, B.; Li, X.; Elvidge, C.D.; Cheng, W.; Zhou, C. Applications of satellite remote sensing of nighttime light observations: Advances, challenges, and perspectives. Remote Sens. 2019, 11, 1971. [Google Scholar] [CrossRef]
- Wang, Y.; Wang, J. Does industrial agglomeration facilitate environmental performance: New evidence from urban China? J. Environ. Manag. 2019, 248, 109244. [Google Scholar] [CrossRef] [PubMed]
- Levin, N.; Kyba, C.; Zhang, Q.; Miguel, A.S.D.; Román, M.O.; Li, X.; Portnov, B.A.; Molthan, A.L.; Jechow, A.; Miller, S.D. Remote sensing of night lights: A review and an outlook for the future. Remote Sens. Environ. 2020, 237, 111443. [Google Scholar] [CrossRef]
Figure 1.
(a) Provinces in the PR of China; (b) prefecture divisions; (c) selected prefecture divisions.
Figure 1.
(a) Provinces in the PR of China; (b) prefecture divisions; (c) selected prefecture divisions.

Figure 2.
Methodological flowchart of the study.

Figure 3.
Differences between UE, HE, and MODIS urban areas during the period 2000–2020.

Figure 4.
Extracted urban entities of six provincial capitals with OSM road networks (2015); (a,d) Chongqing, (b,e) Shanghai, (c,f) Beijing, (g,j) Hohhot, (h,k) Haikou, (i,l) Lhasa.
Figure 4.
Extracted urban entities of six provincial capitals with OSM road networks (2015); (a,d) Chongqing, (b,e) Shanghai, (c,f) Beijing, (g,j) Hohhot, (h,k) Haikou, (i,l) Lhasa.

Figure 5.
Regression results of the total urban areas of UE, HE, and MODIS from 2000 to 2020.

Figure 6.
Extracted urban entities of selected prefectures with HE, MODIS, and LandScan population products (2015); (a–c) Shanghai, (d–f) Tianjin, (g–i) Guangzhou, (j–l) Shenzhen, (m–o) Chengdu.
Figure 6.
Extracted urban entities of selected prefectures with HE, MODIS, and LandScan population products (2015); (a–c) Shanghai, (d–f) Tianjin, (g–i) Guangzhou, (j–l) Shenzhen, (m–o) Chengdu.


Table 1.
Spatial data sources of the study.
| Data | Year | Format | Resolution/Scale | Source |
|---|---|---|---|---|
| SNPP-VIIRS-like | 2000–2020 | Raster | 742 × 742 m ground footprint | https://dataverse.harvard.edu/dataset.xhtml (accessed on 12 February 2022) |
| LandScan | 2015 | Raster | 1000 m | https://www.un-spider.org/links-and-resources/data-sources/landscan (accessed on 24 March 2023) |
| HE | 2015 | Raster | 1000 m | http://data.tpdc.ac.cn/zh-hans/data/3100de5c-ac8d-4091-9bbf-6a02de100c88/ (accessed on 28 March 2023) |
| MODIS | 2015 | Raster | 500 m | https://ladsweb.modaps.eosdis.nasa.gov/search/order/1/MCD12Q1--6 (accessed on 3 April 2023) |
| GlobeLand30 | 2020 | Raster | 30 m | http://www.globallandcover.com/defaults_en.html?(accessed on 6 April 2023) |
| OSM | 2015 | Vector | 1:5000 | https://www.openstreetmap.org (accessed on 12 April 2023) |
| LandSat8 | 2015 | Raster | 30 m | https://earthexplorer.usgs.gov/(accessed on 28 April 2023) |
| Prefecture boundaries | 2019 | Vector | 1:50,000,000 | http://ngcc.sbsm.gov.cn/article/en/(accessed on 3 May 2023) |
Disclaimer/Publisher’s Note: The statements, opinions and data contained in all publications are solely those of the individual author(s) and contributor(s) and not of MDPI and/or the editor(s). MDPI and/or the editor(s) disclaim responsibility for any injury to people or property resulting from any ideas, methods, instructions or products referred to in the content. |
© 2023 by the authors. Licensee MDPI, Basel, Switzerland. This article is an open access article distributed under the terms and conditions of the Creative Commons Attribution (CC BY) license (https://creativecommons.org/licenses/by/4.0/).
Share and Cite
MDPI and ACS Style
Withanage, N.C.; Shi, K.; Shen, J. Extracting and Evaluating Urban Entities in China from 2000 to 2020 Based on SNPP-VIIRS-like Data. Remote Sens. 2023, 15, 4632. https://doi.org/10.3390/rs15184632
AMA Style
Withanage NC, Shi K, Shen J. Extracting and Evaluating Urban Entities in China from 2000 to 2020 Based on SNPP-VIIRS-like Data. Remote Sensing. 2023; 15(18):4632. https://doi.org/10.3390/rs15184632
Chicago/Turabian StyleWithanage, Neel Chaminda, Kaifang Shi, and Jingwei Shen. 2023. "Extracting and Evaluating Urban Entities in China from 2000 to 2020 Based on SNPP-VIIRS-like Data" Remote Sensing 15, no. 18: 4632. https://doi.org/10.3390/rs15184632
Note that from the first issue of 2016, this journal uses article numbers instead of page numbers. See further details here.