

Multi-Scale Engineering Geological Zonation for Linear Projects in Mountainous Regions: A Case Study of National Highway 318 Chengdu-Shigatse Section
 , and
, and
Abstract
:1. Introduction
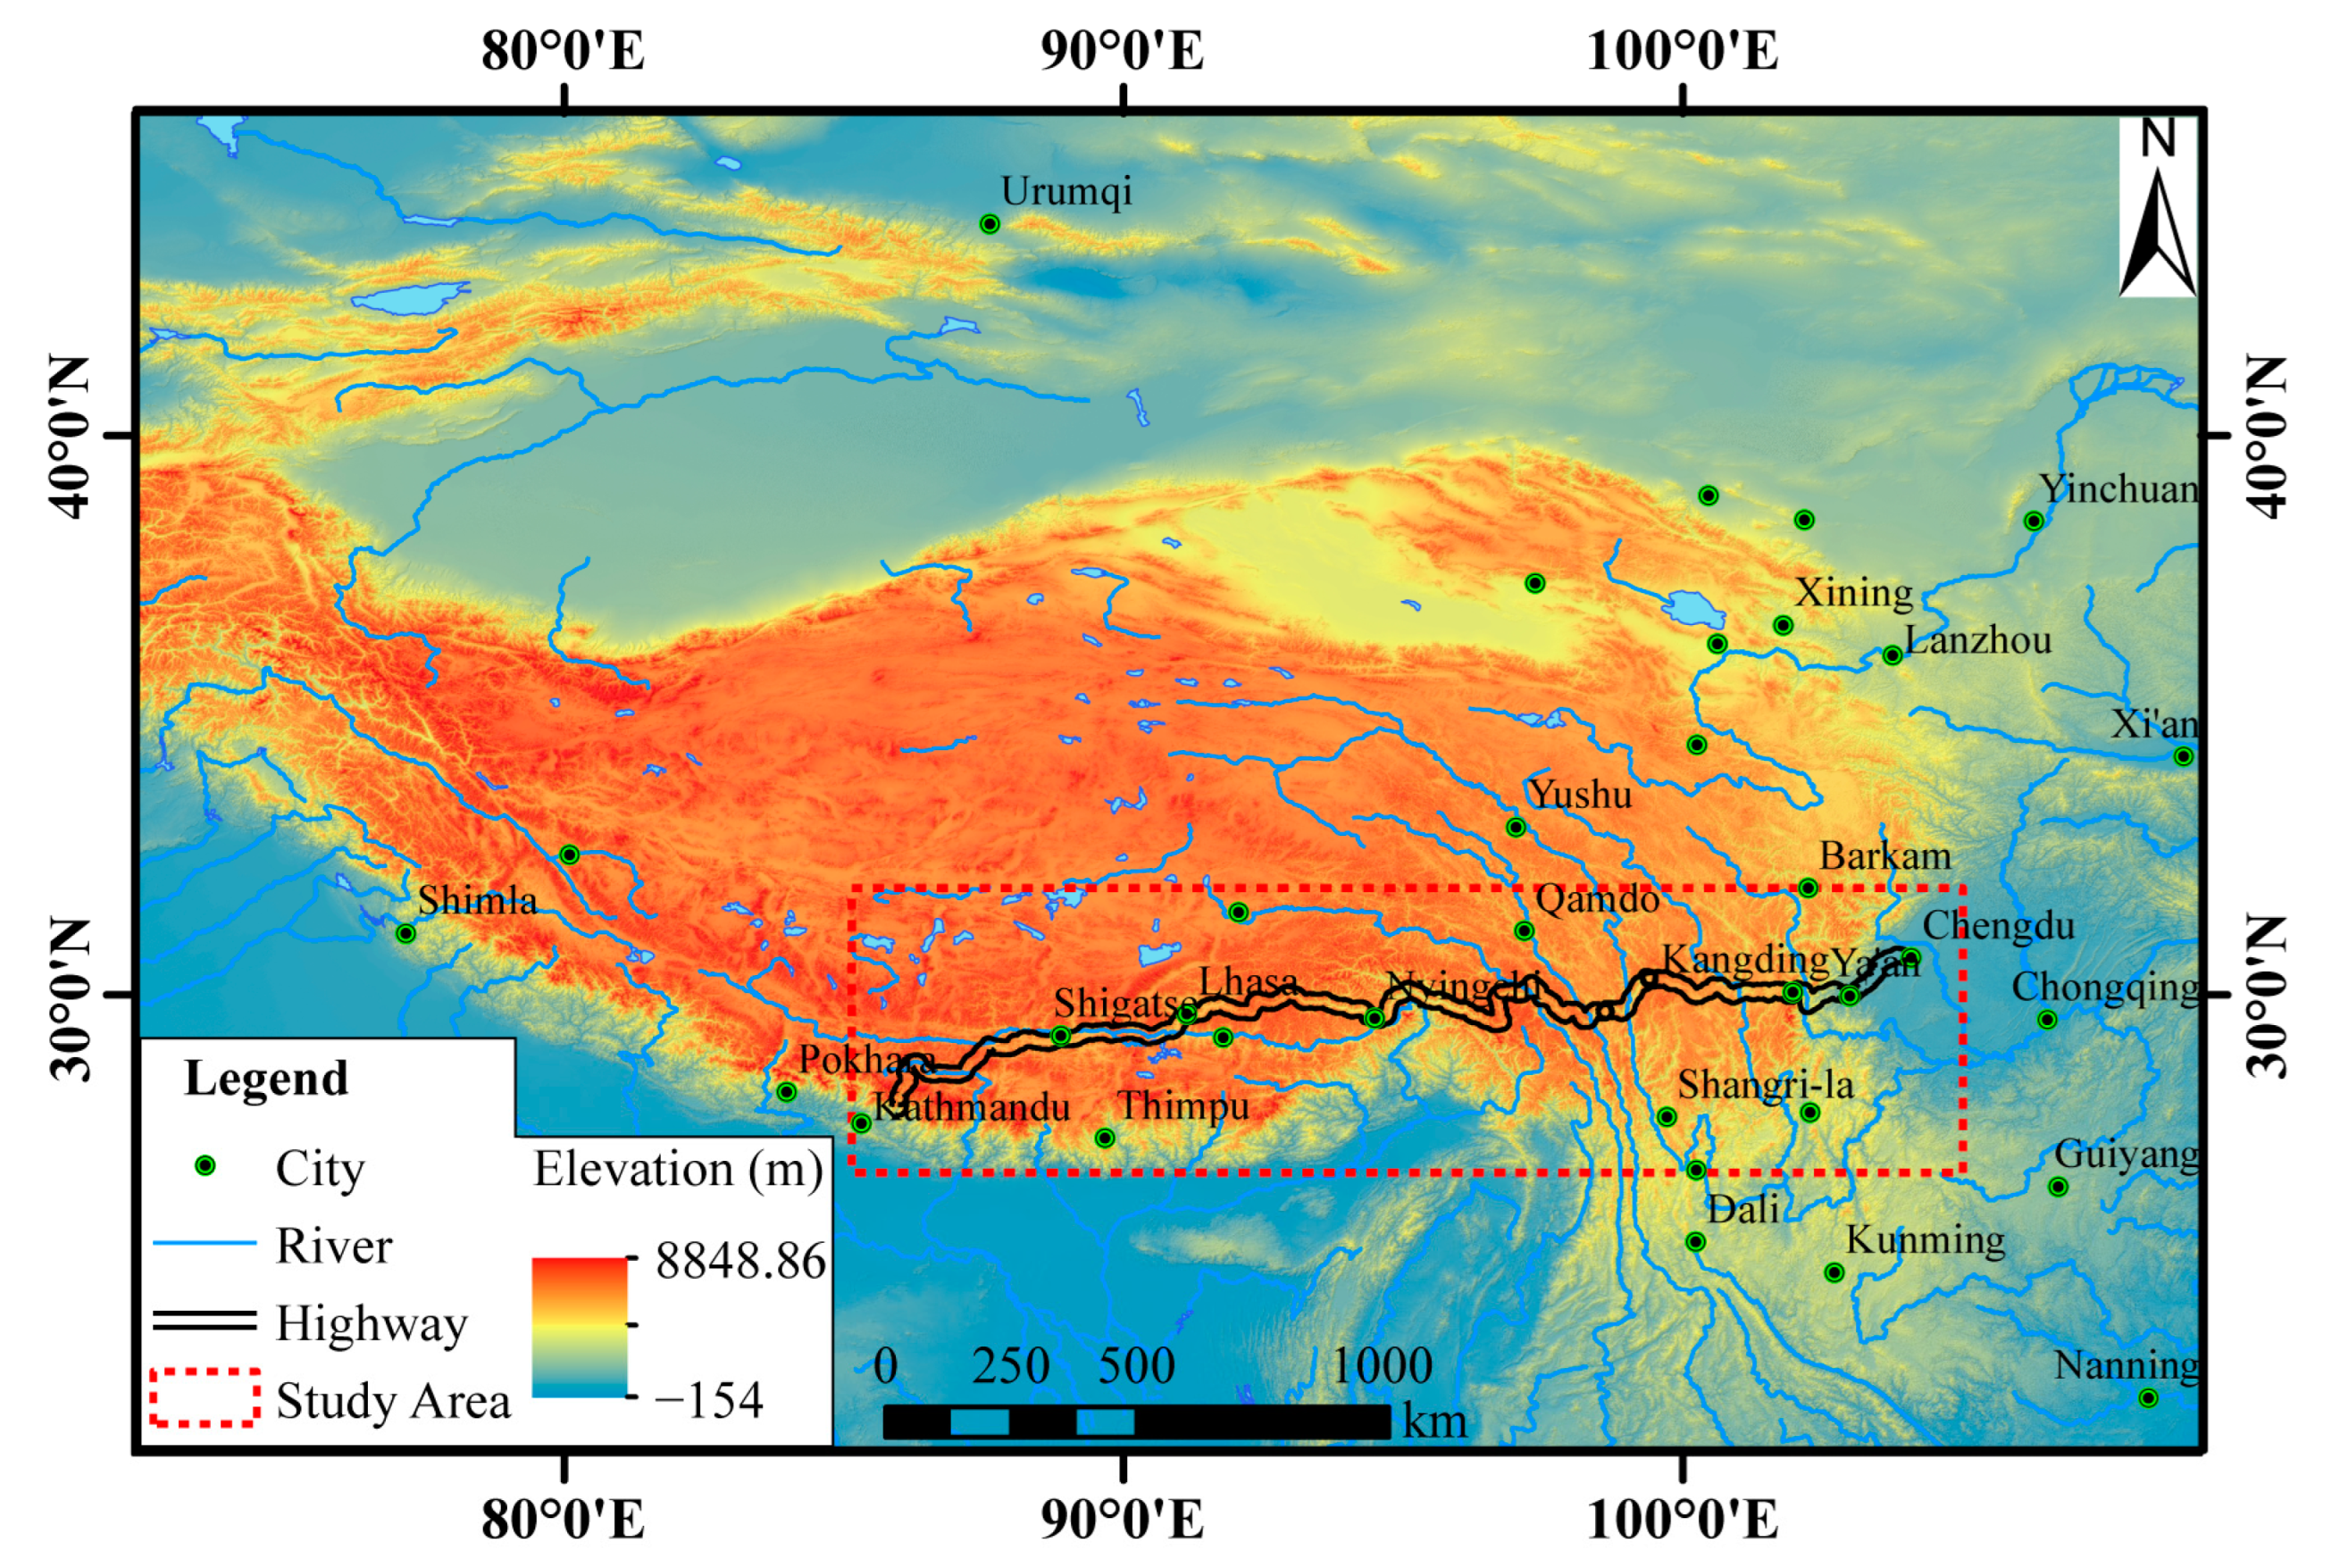
2. Study Area
3. Methods and Data
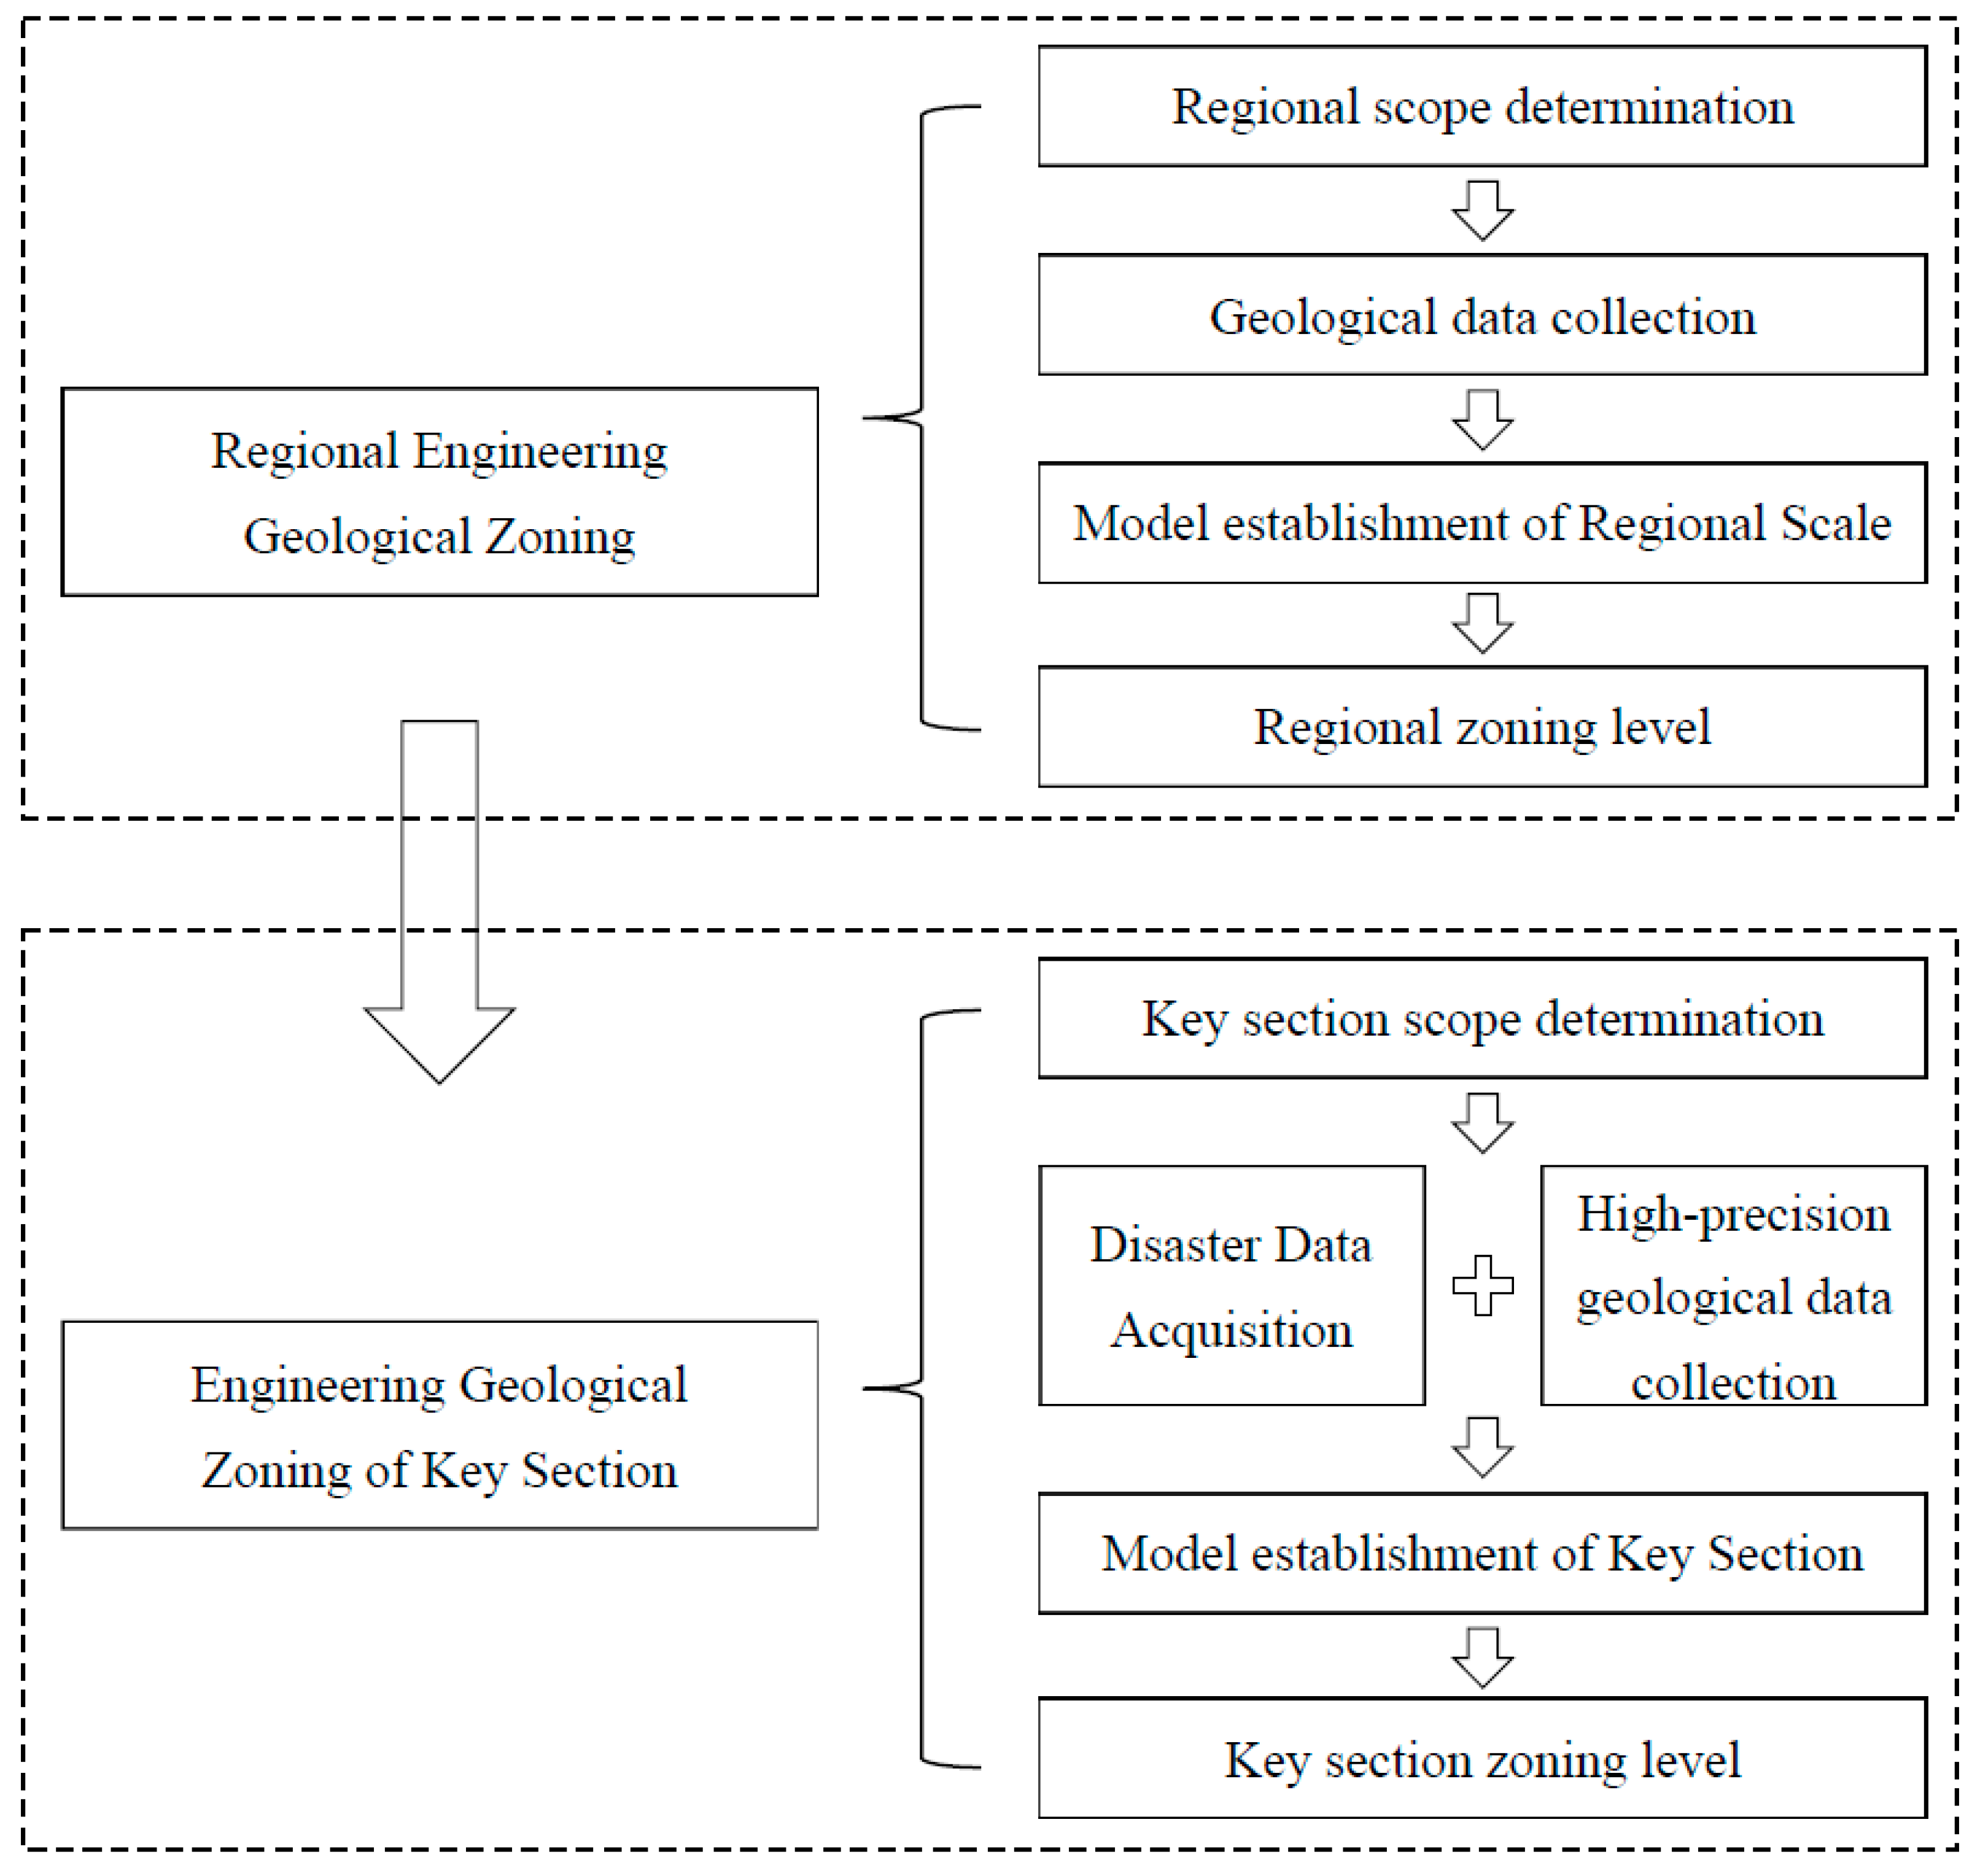
3.1. Methods
3.1.1. Regional Engineering Geological Zoning
3.1.2. Key Section Engineering Geological Zoning
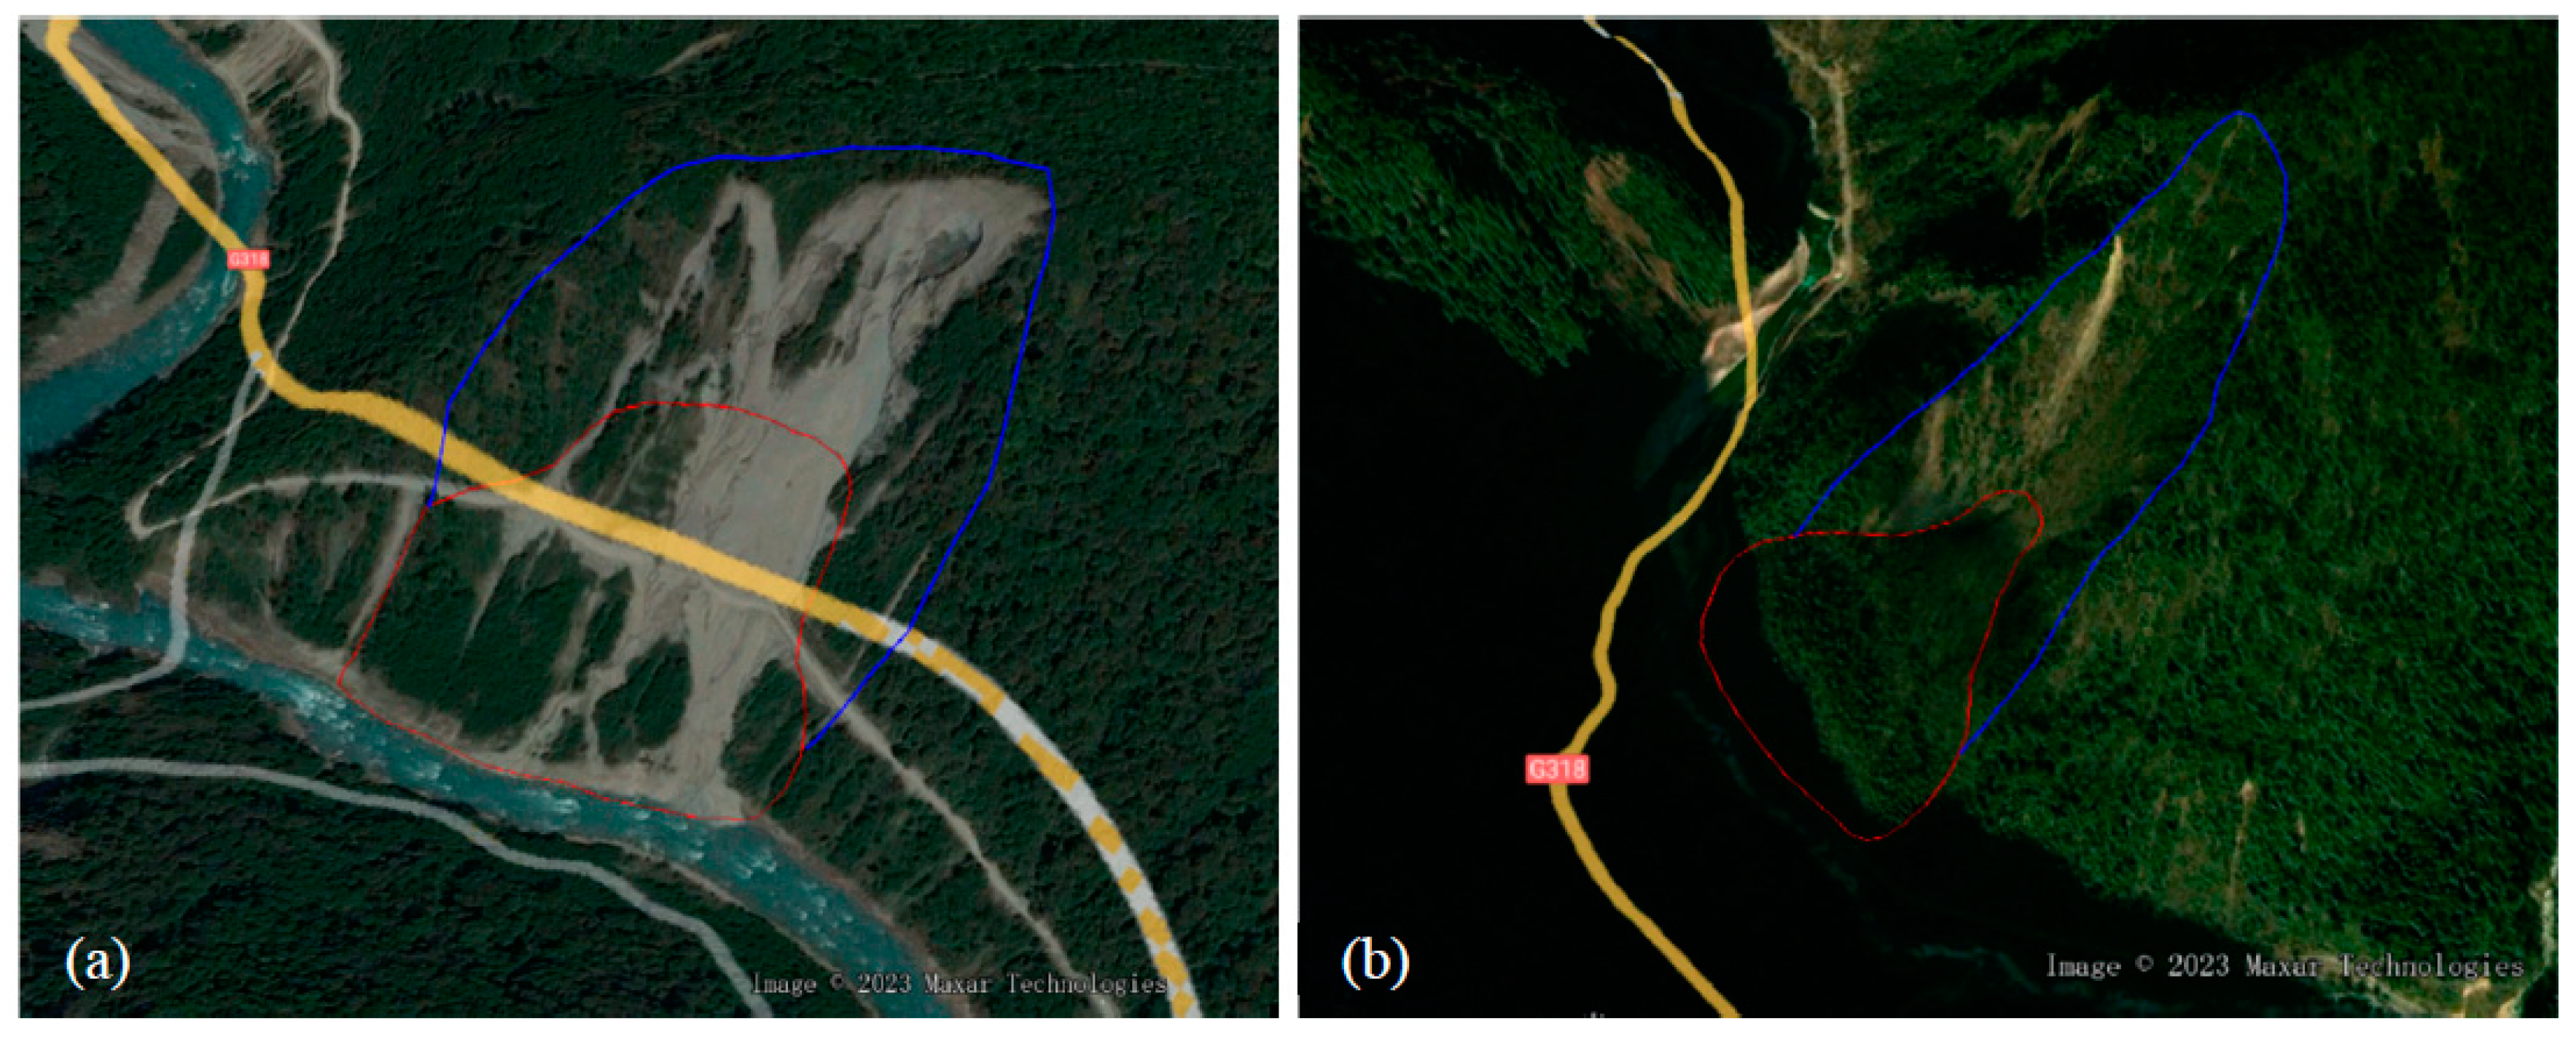
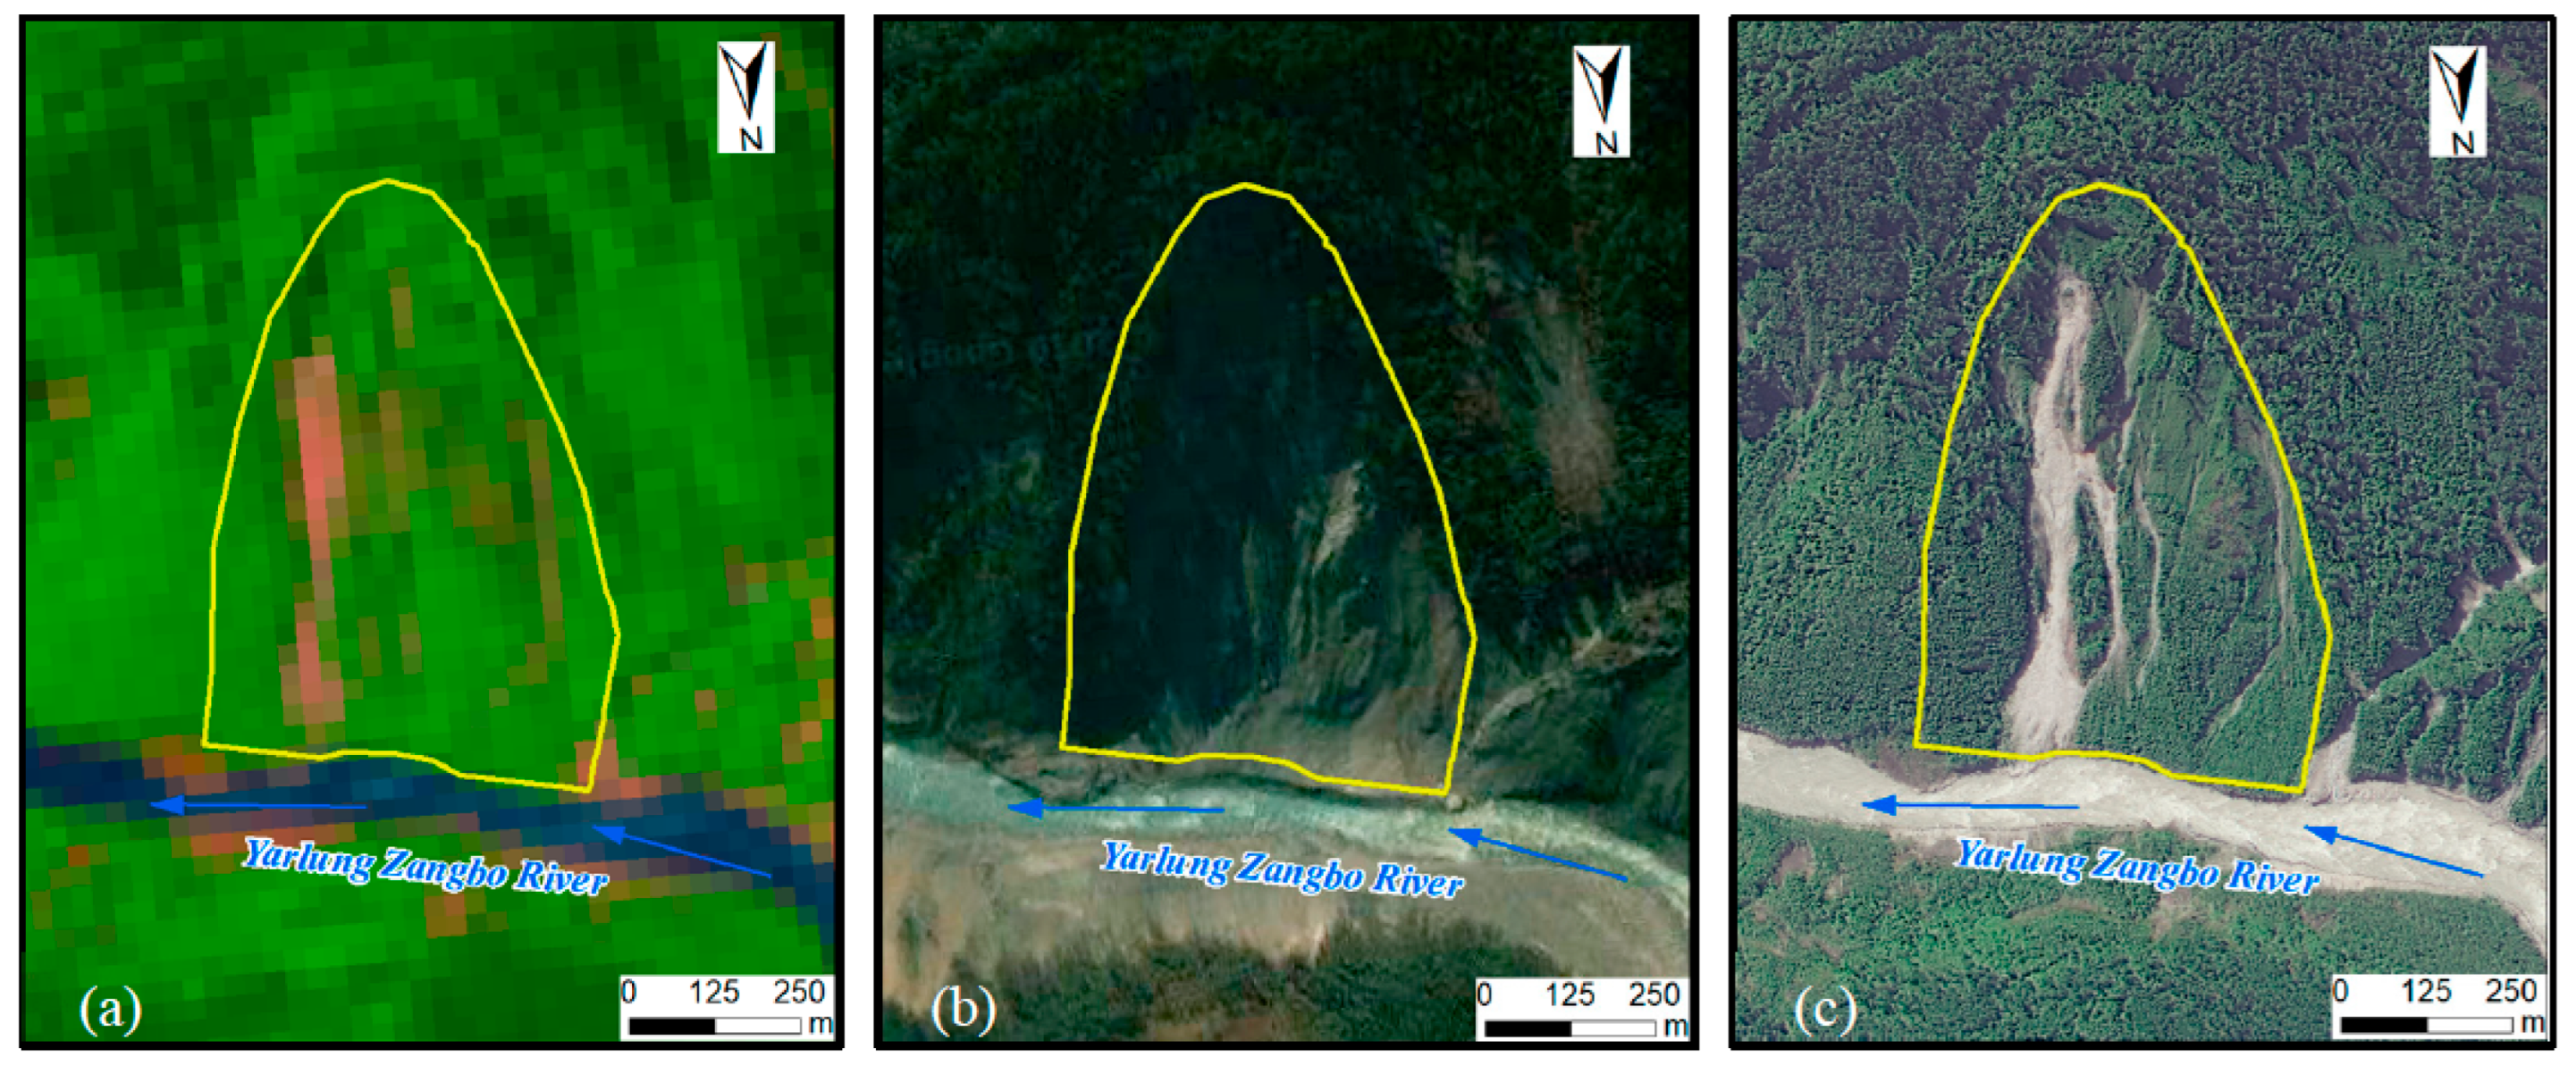
3.1.3. Remote Sensing Interpretation of Disasters
3.2. Data
4. Results
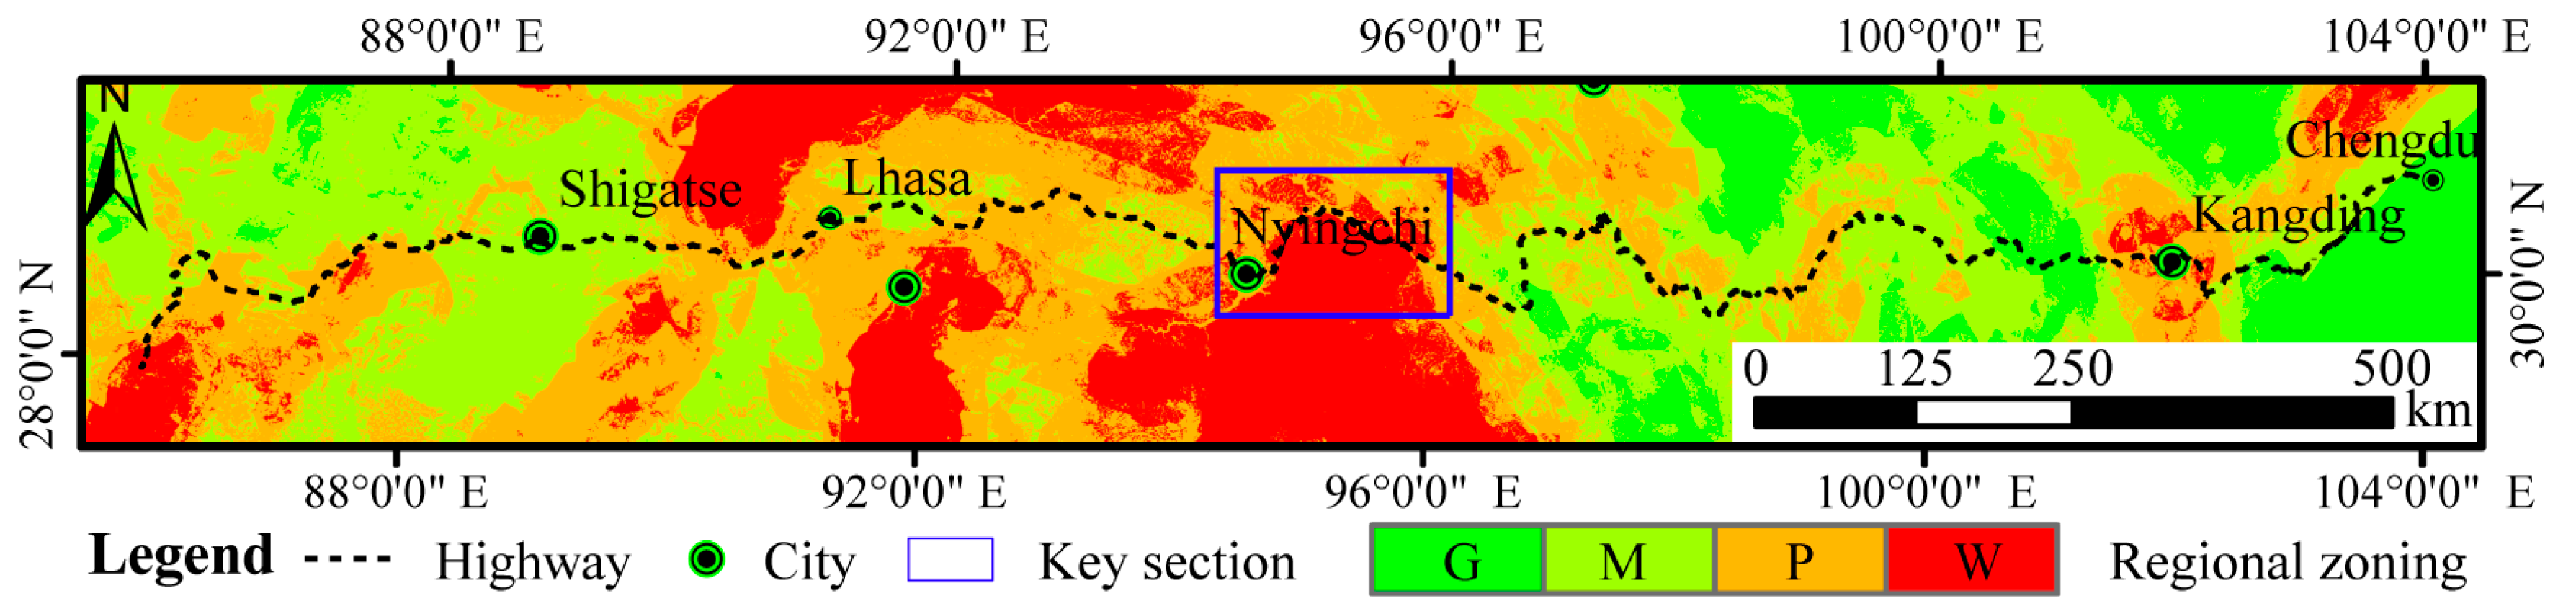
4.1. Regional Engineering Geological Zoning
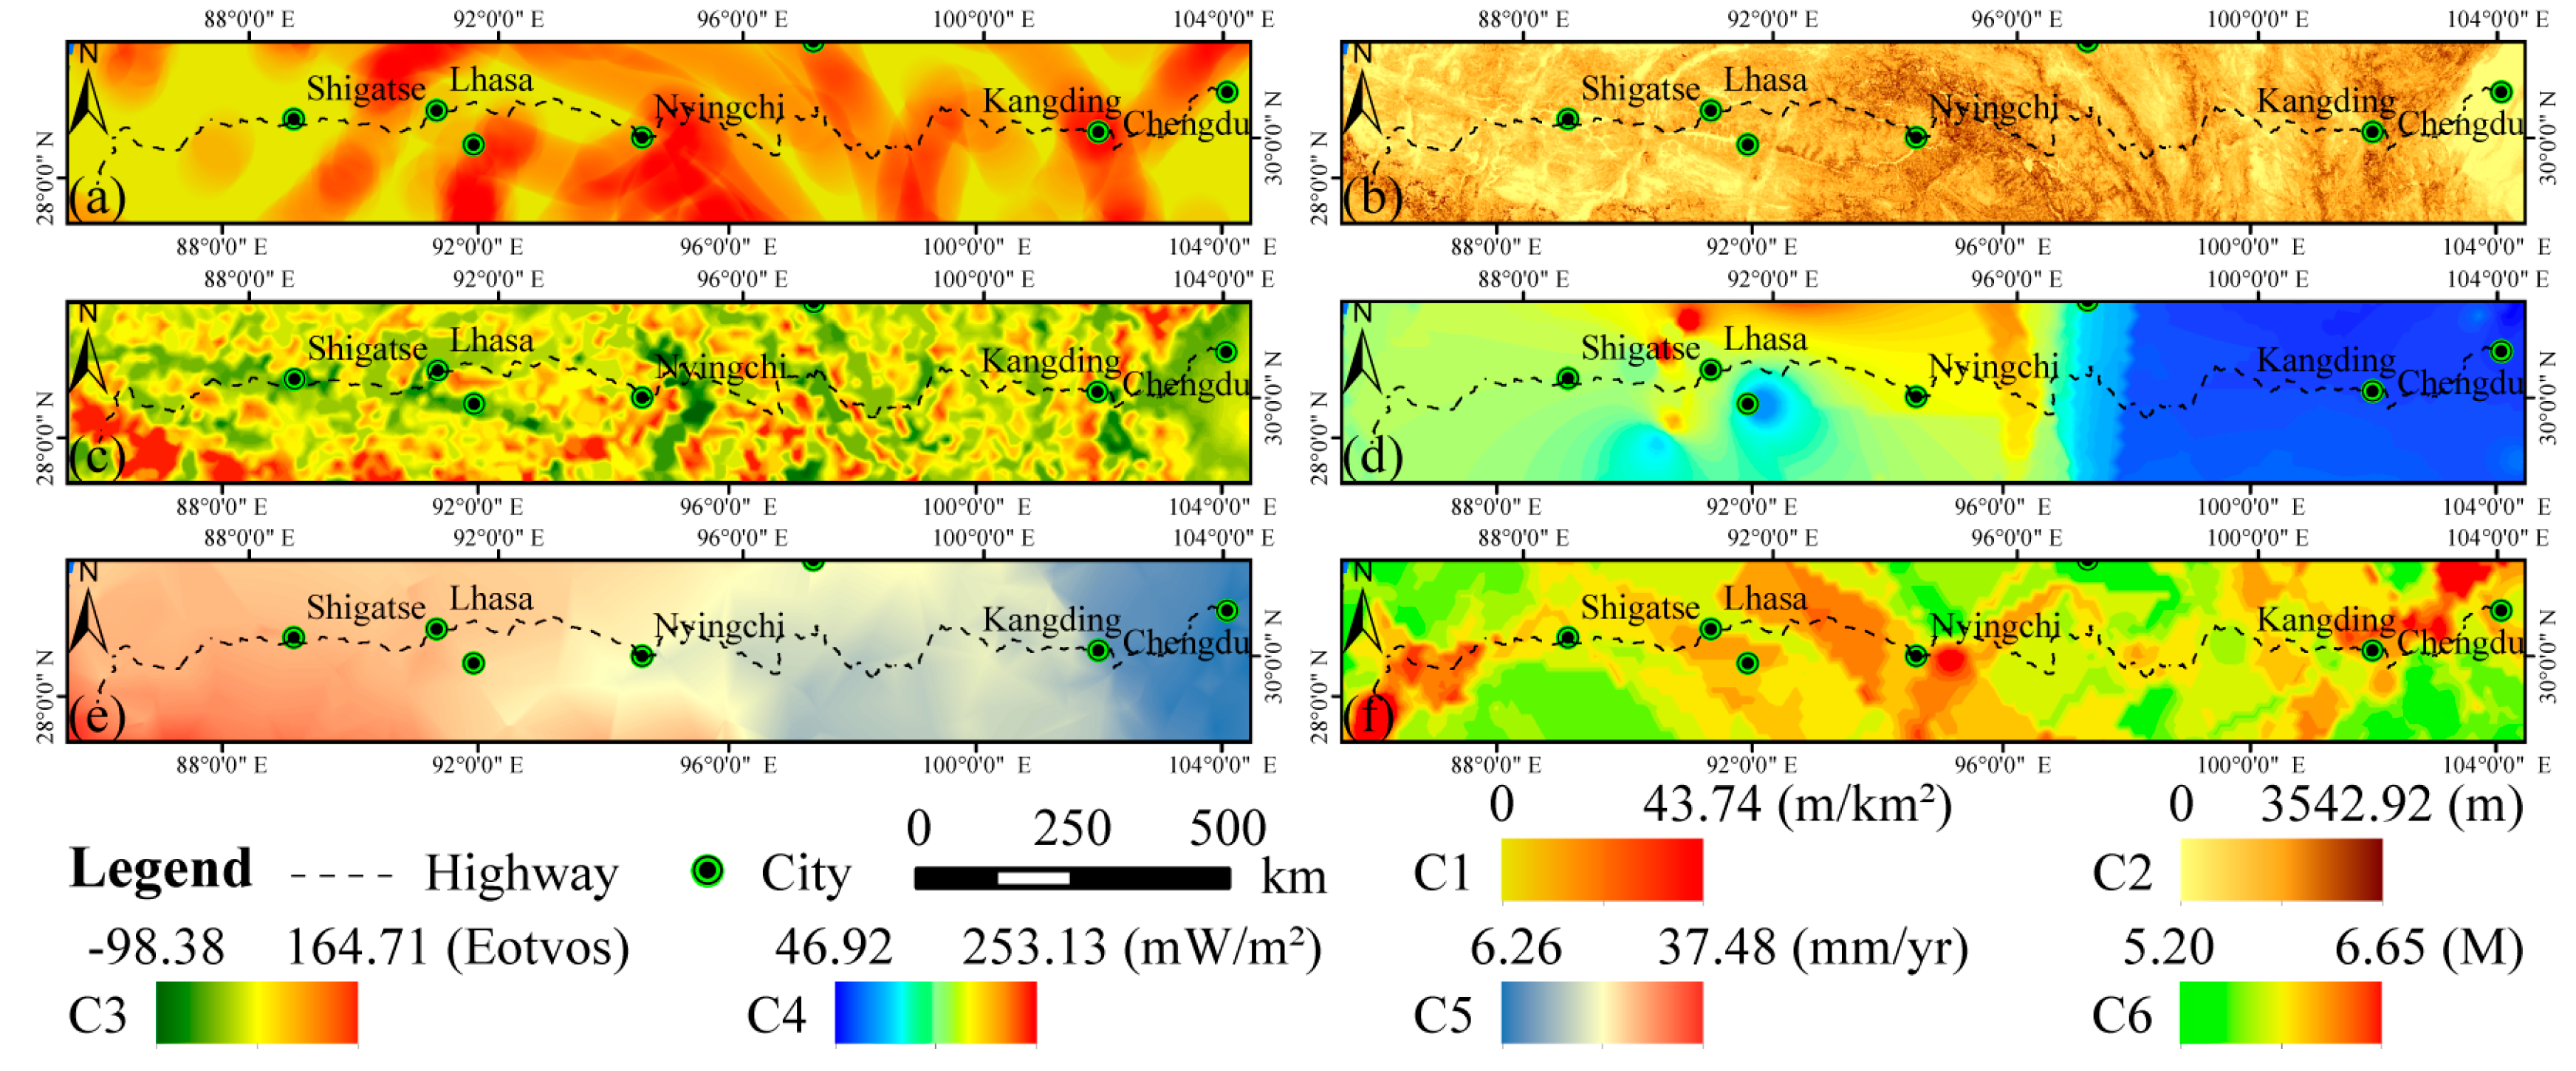
4.1.1. Evaluation Factors
- Fracture density (m/km2) (C1) refers to the length of fractures per unit area. The activities of faults disrupt the crustal rock layers, resulting in differential movement of adjacent blocks, thus affecting the stability of the crust [55,56]. The larger the value of C1, the more serious and adverse effects it will have on the region’s stability.
- Relief (C2) (m) is the difference in altitude between the highest and lowest points in a certain area. It can represent the depth of tectonic cutting and the degree of surface erosion and can characterize the intensity of tectonic activities in a region [57].
- Bouguer gravity anomaly gradient (Eotvos) (C3) is the derivative of Bouguer gravity anomaly. Differences in the density of underground rocks and changes in the nature and morphology of geological formations cause Bouguer gravity anomalies. Regions with high Bouguer gravity anomaly gradient values are mostly located in deep fault zones with poor crustal stability [58].
- Geothermal heat flow (mW/m2) (C4) is a phenomenon in which heat energy is transmitted from the earth’s interior to the surface. Its distribution has good correspondence with the distribution and magnitude of earthquakes. The stability of the crust is better in areas with low heat flow values and poorer in areas with high heat flow values [58].
- Surface deformation (mm/yr) (C5) reflects the movement of the crust. The larger the value of the surface deformation, the more active the crustal movement and the worst the stability of the crust.
- Degree of seismic impact (M) (C6) indicates the degree of earthquake influence in the area. The closer the distance to the earthquake epicenter, the more obvious the crustal movement and deformation, and the more unstable the region. The degree of the seismic impact on the project corridor has been obtained by overlying the historical earthquake epicenters data. Each evaluation factor is shown in Figure 7.
4.1.2. Construction of Evaluation Model
4.1.3. Evaluation Results
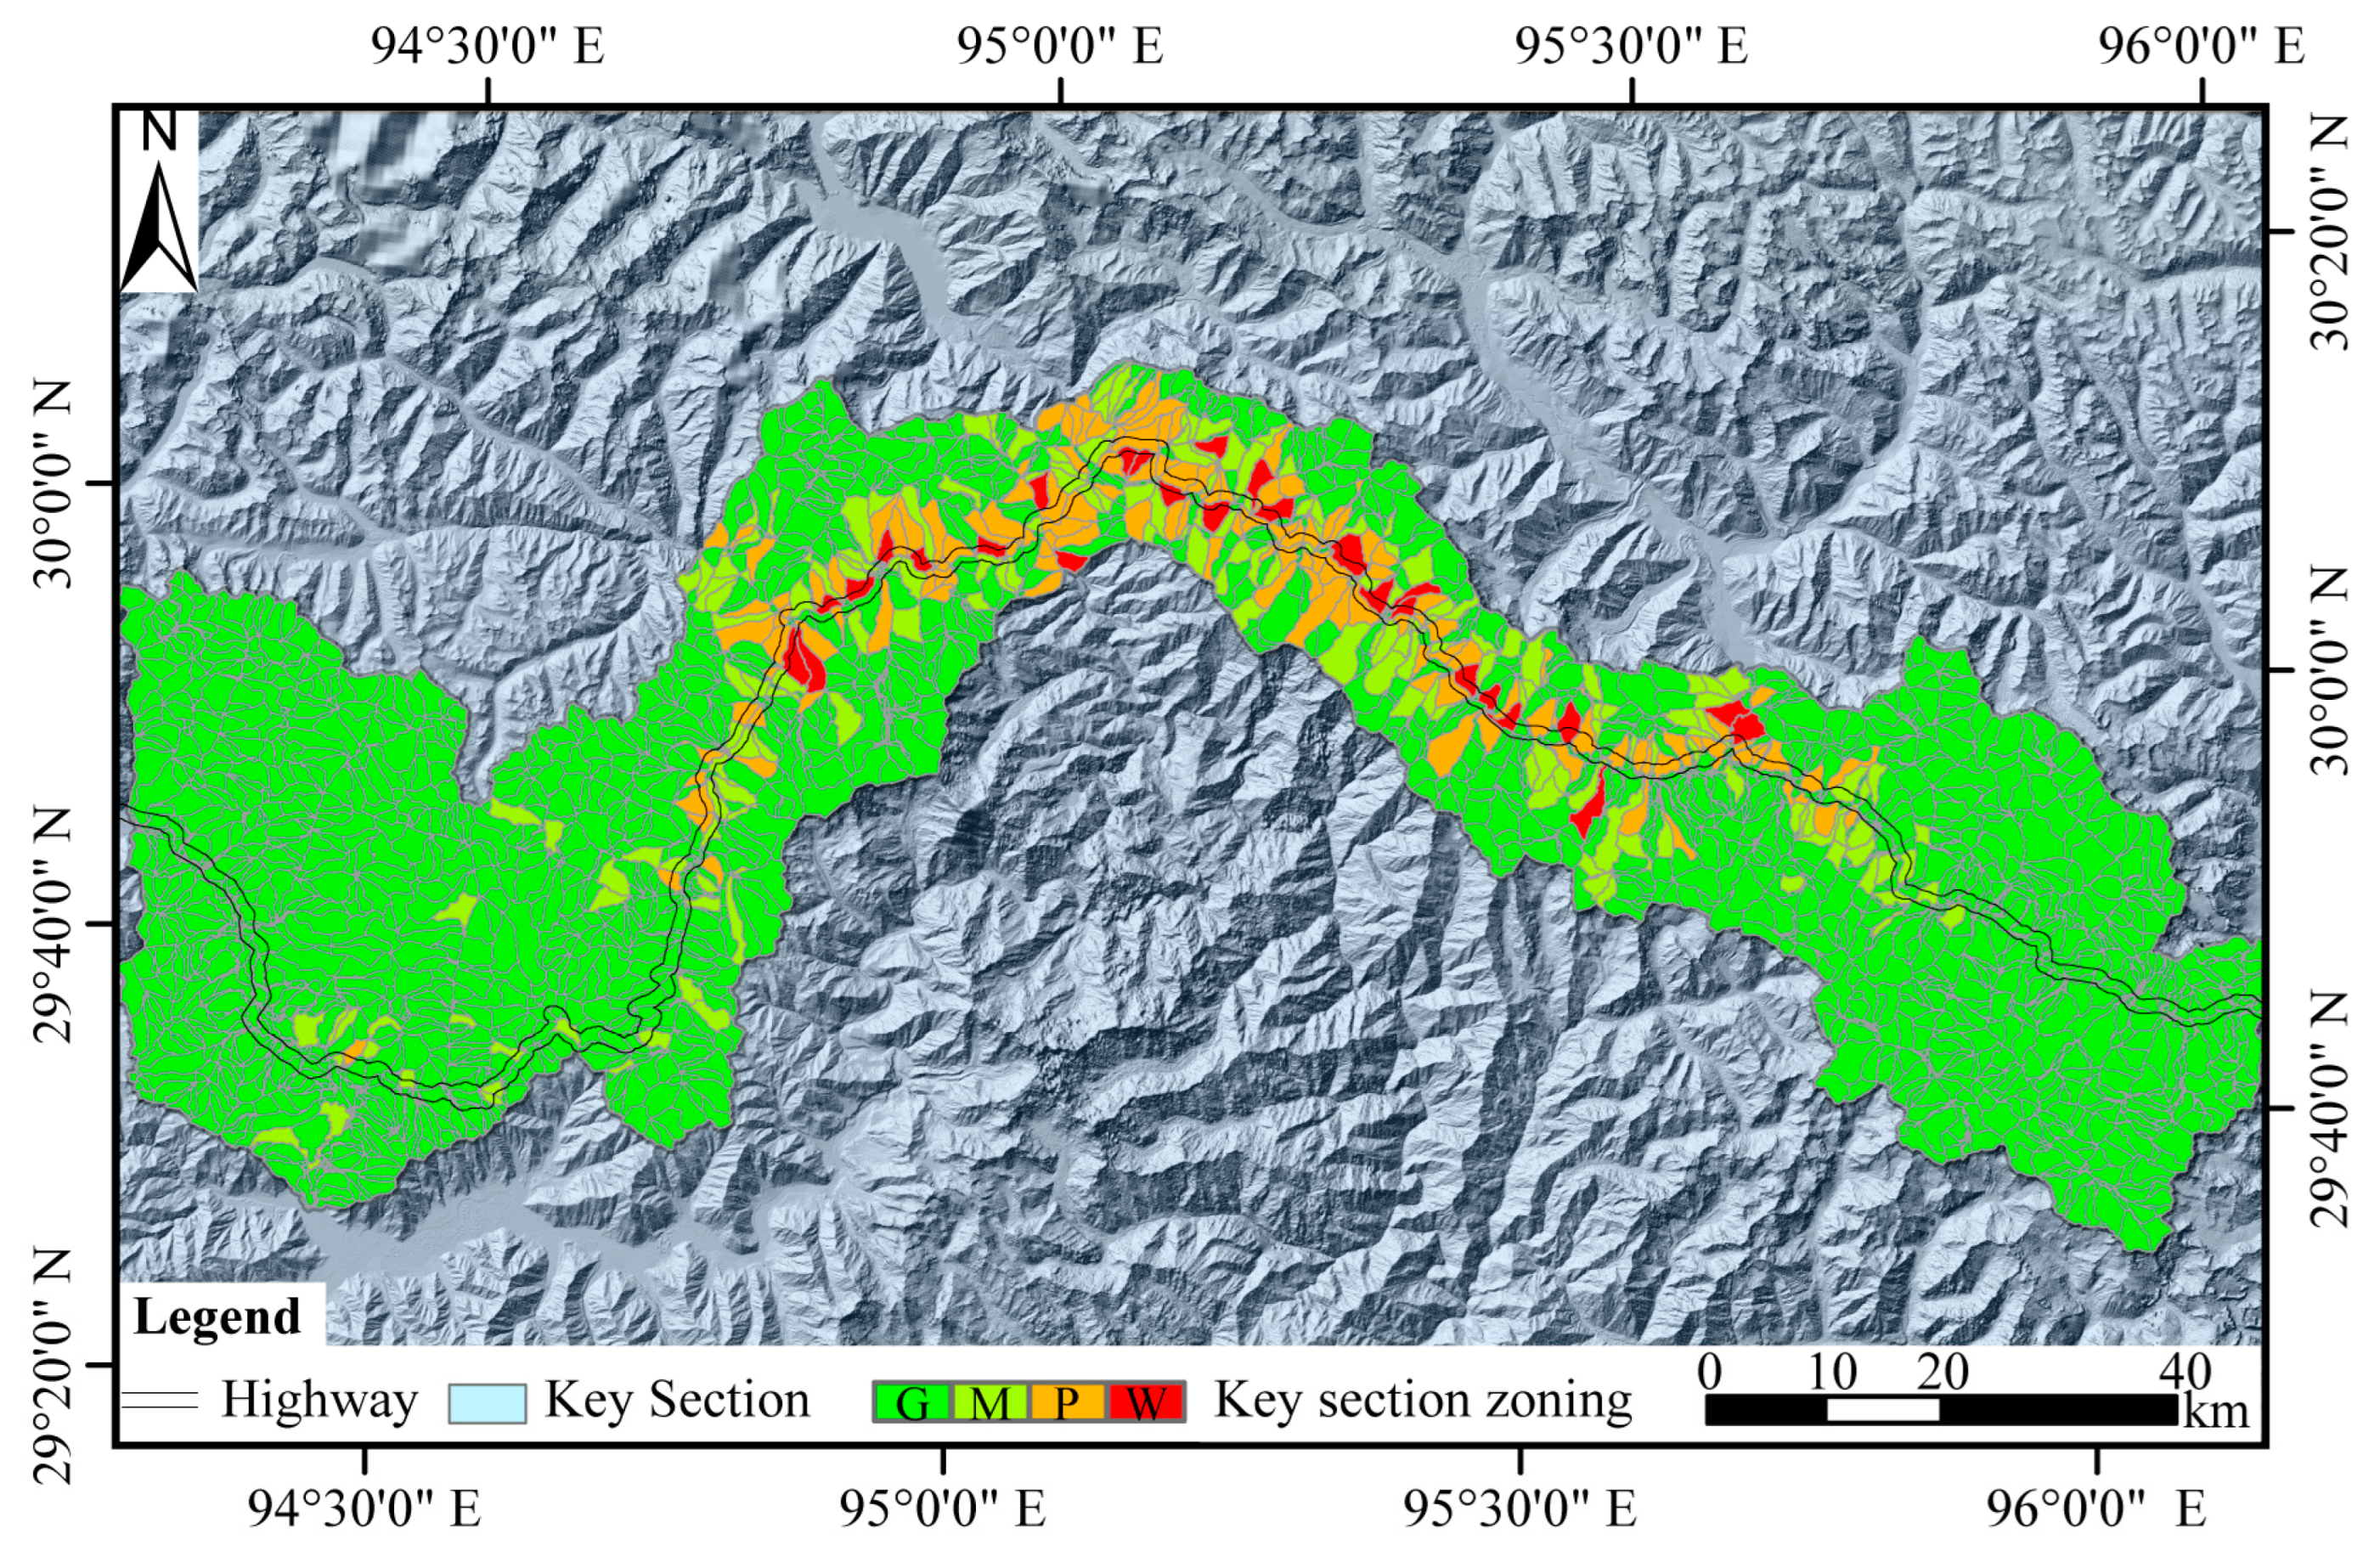
4.2. Engineering Geological Zoning of Key Sections
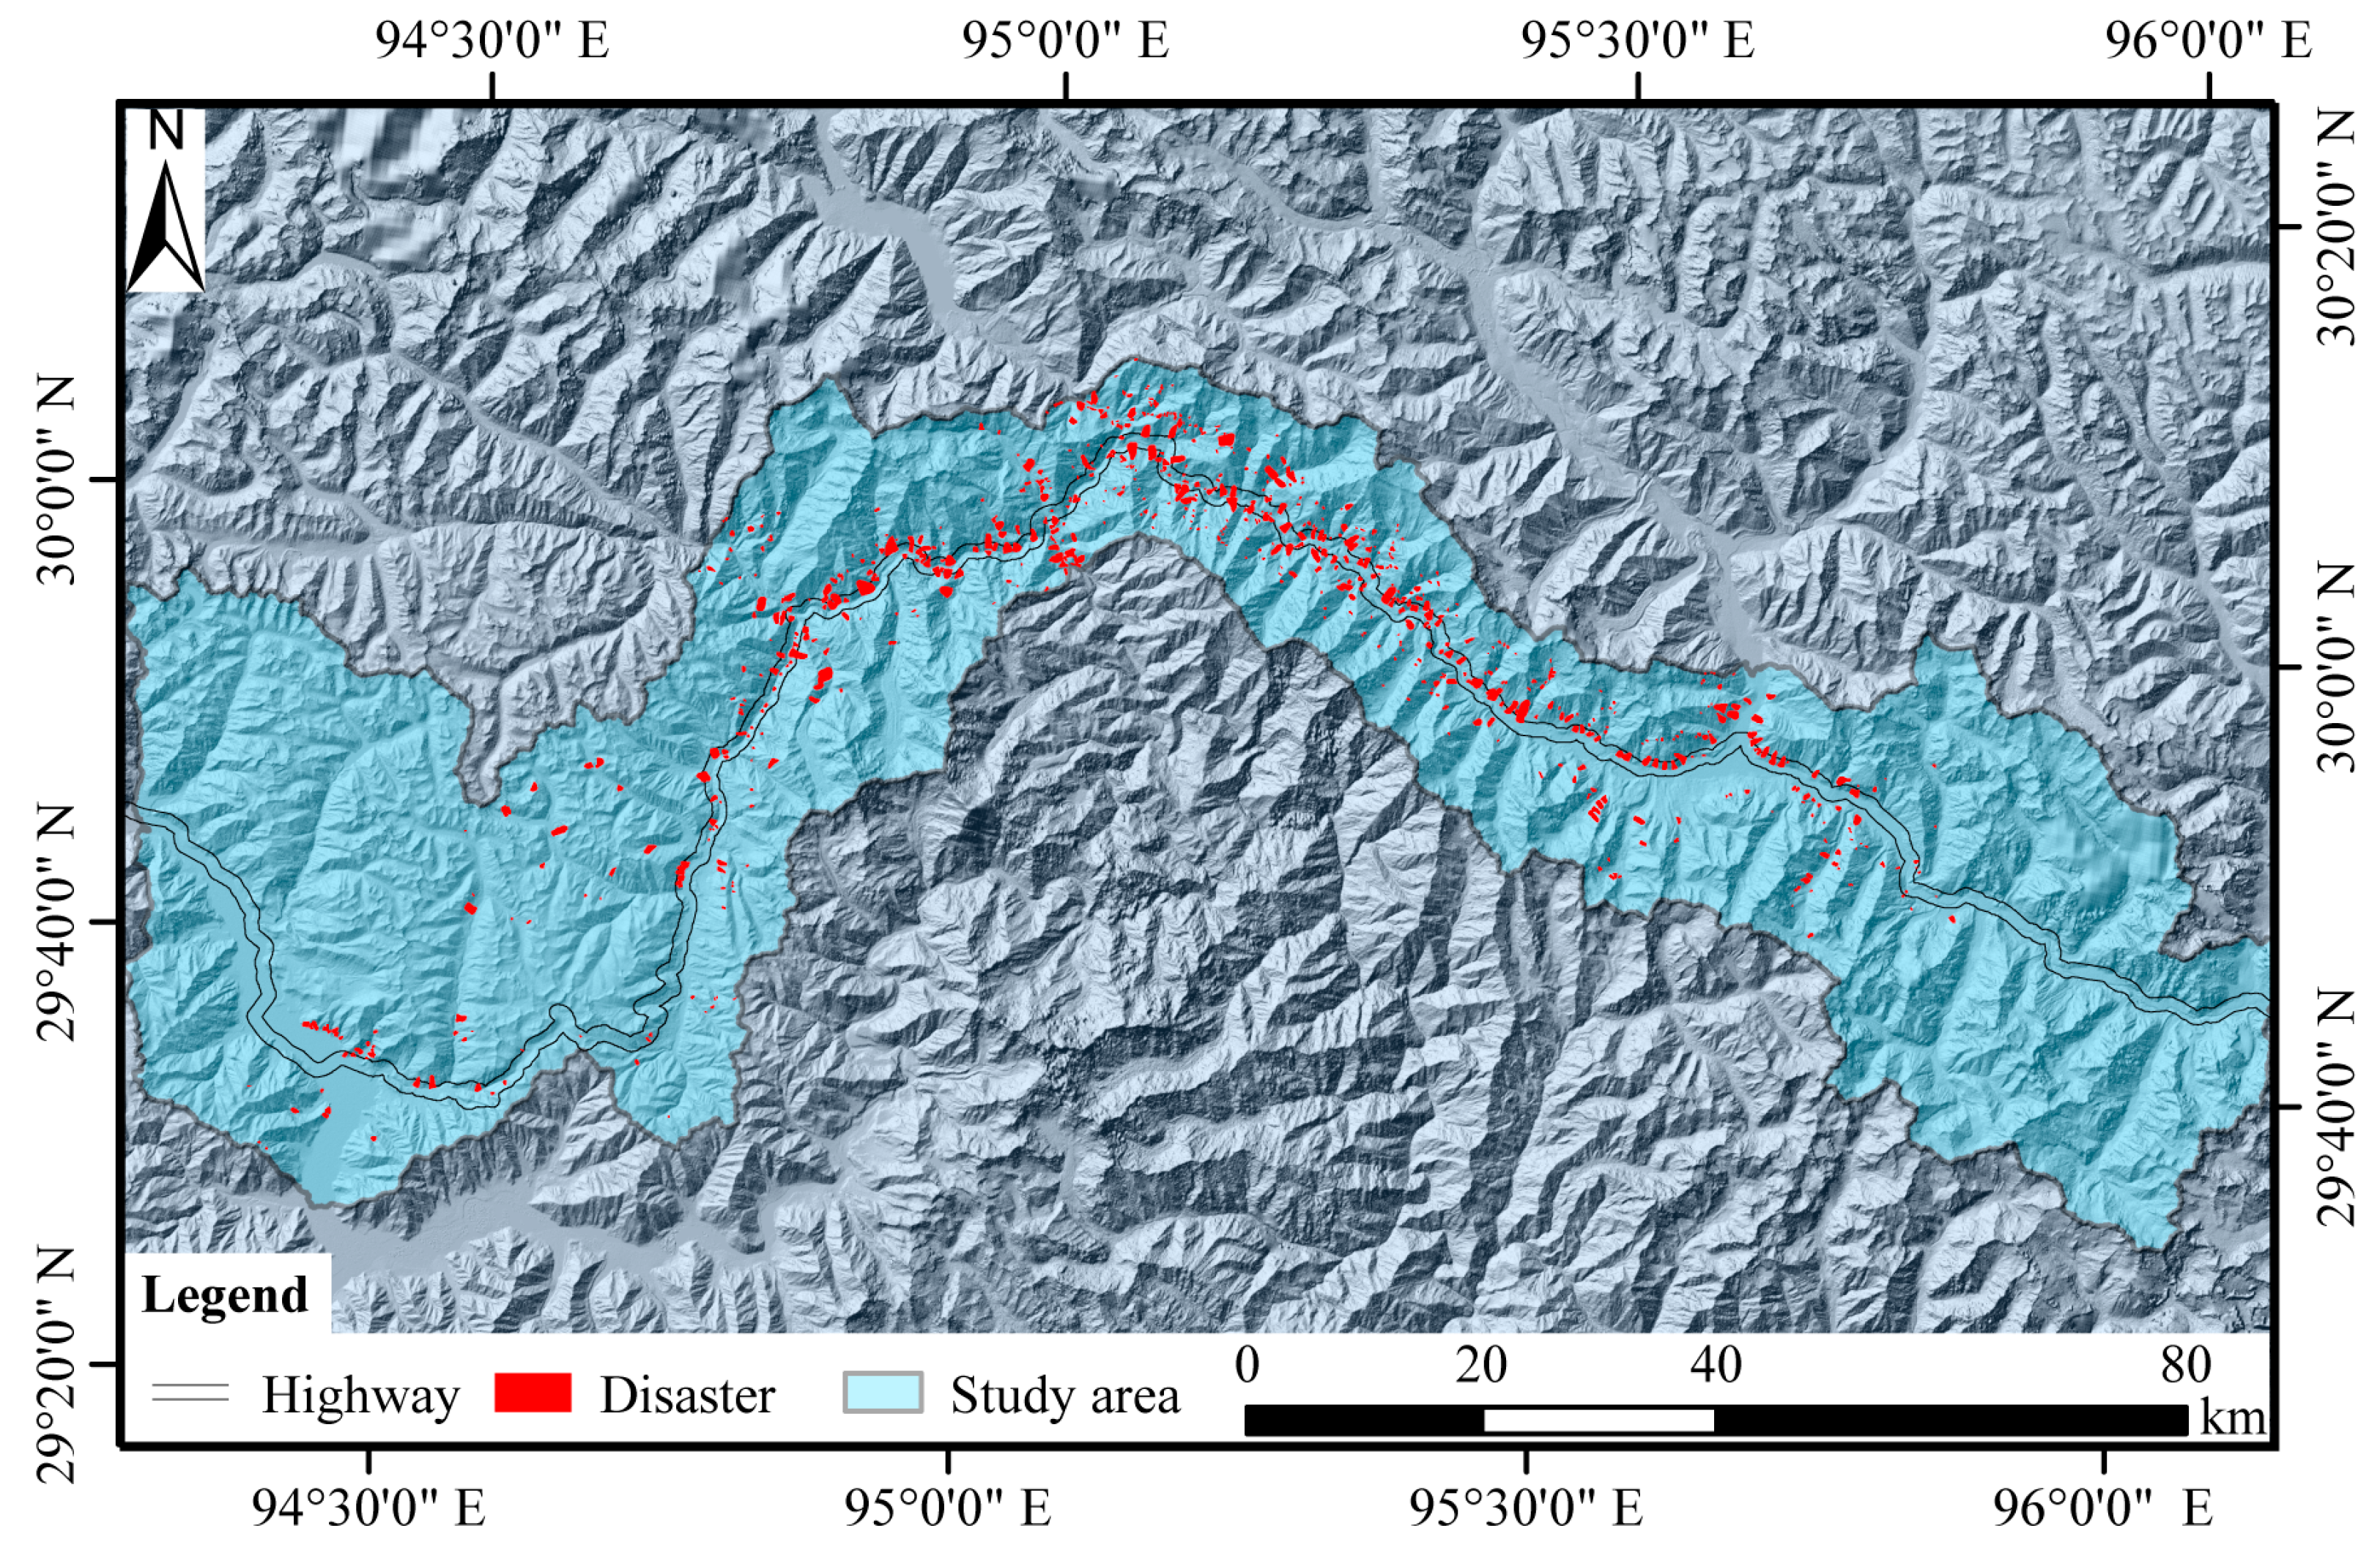
4.2.1. Disaster Inventory
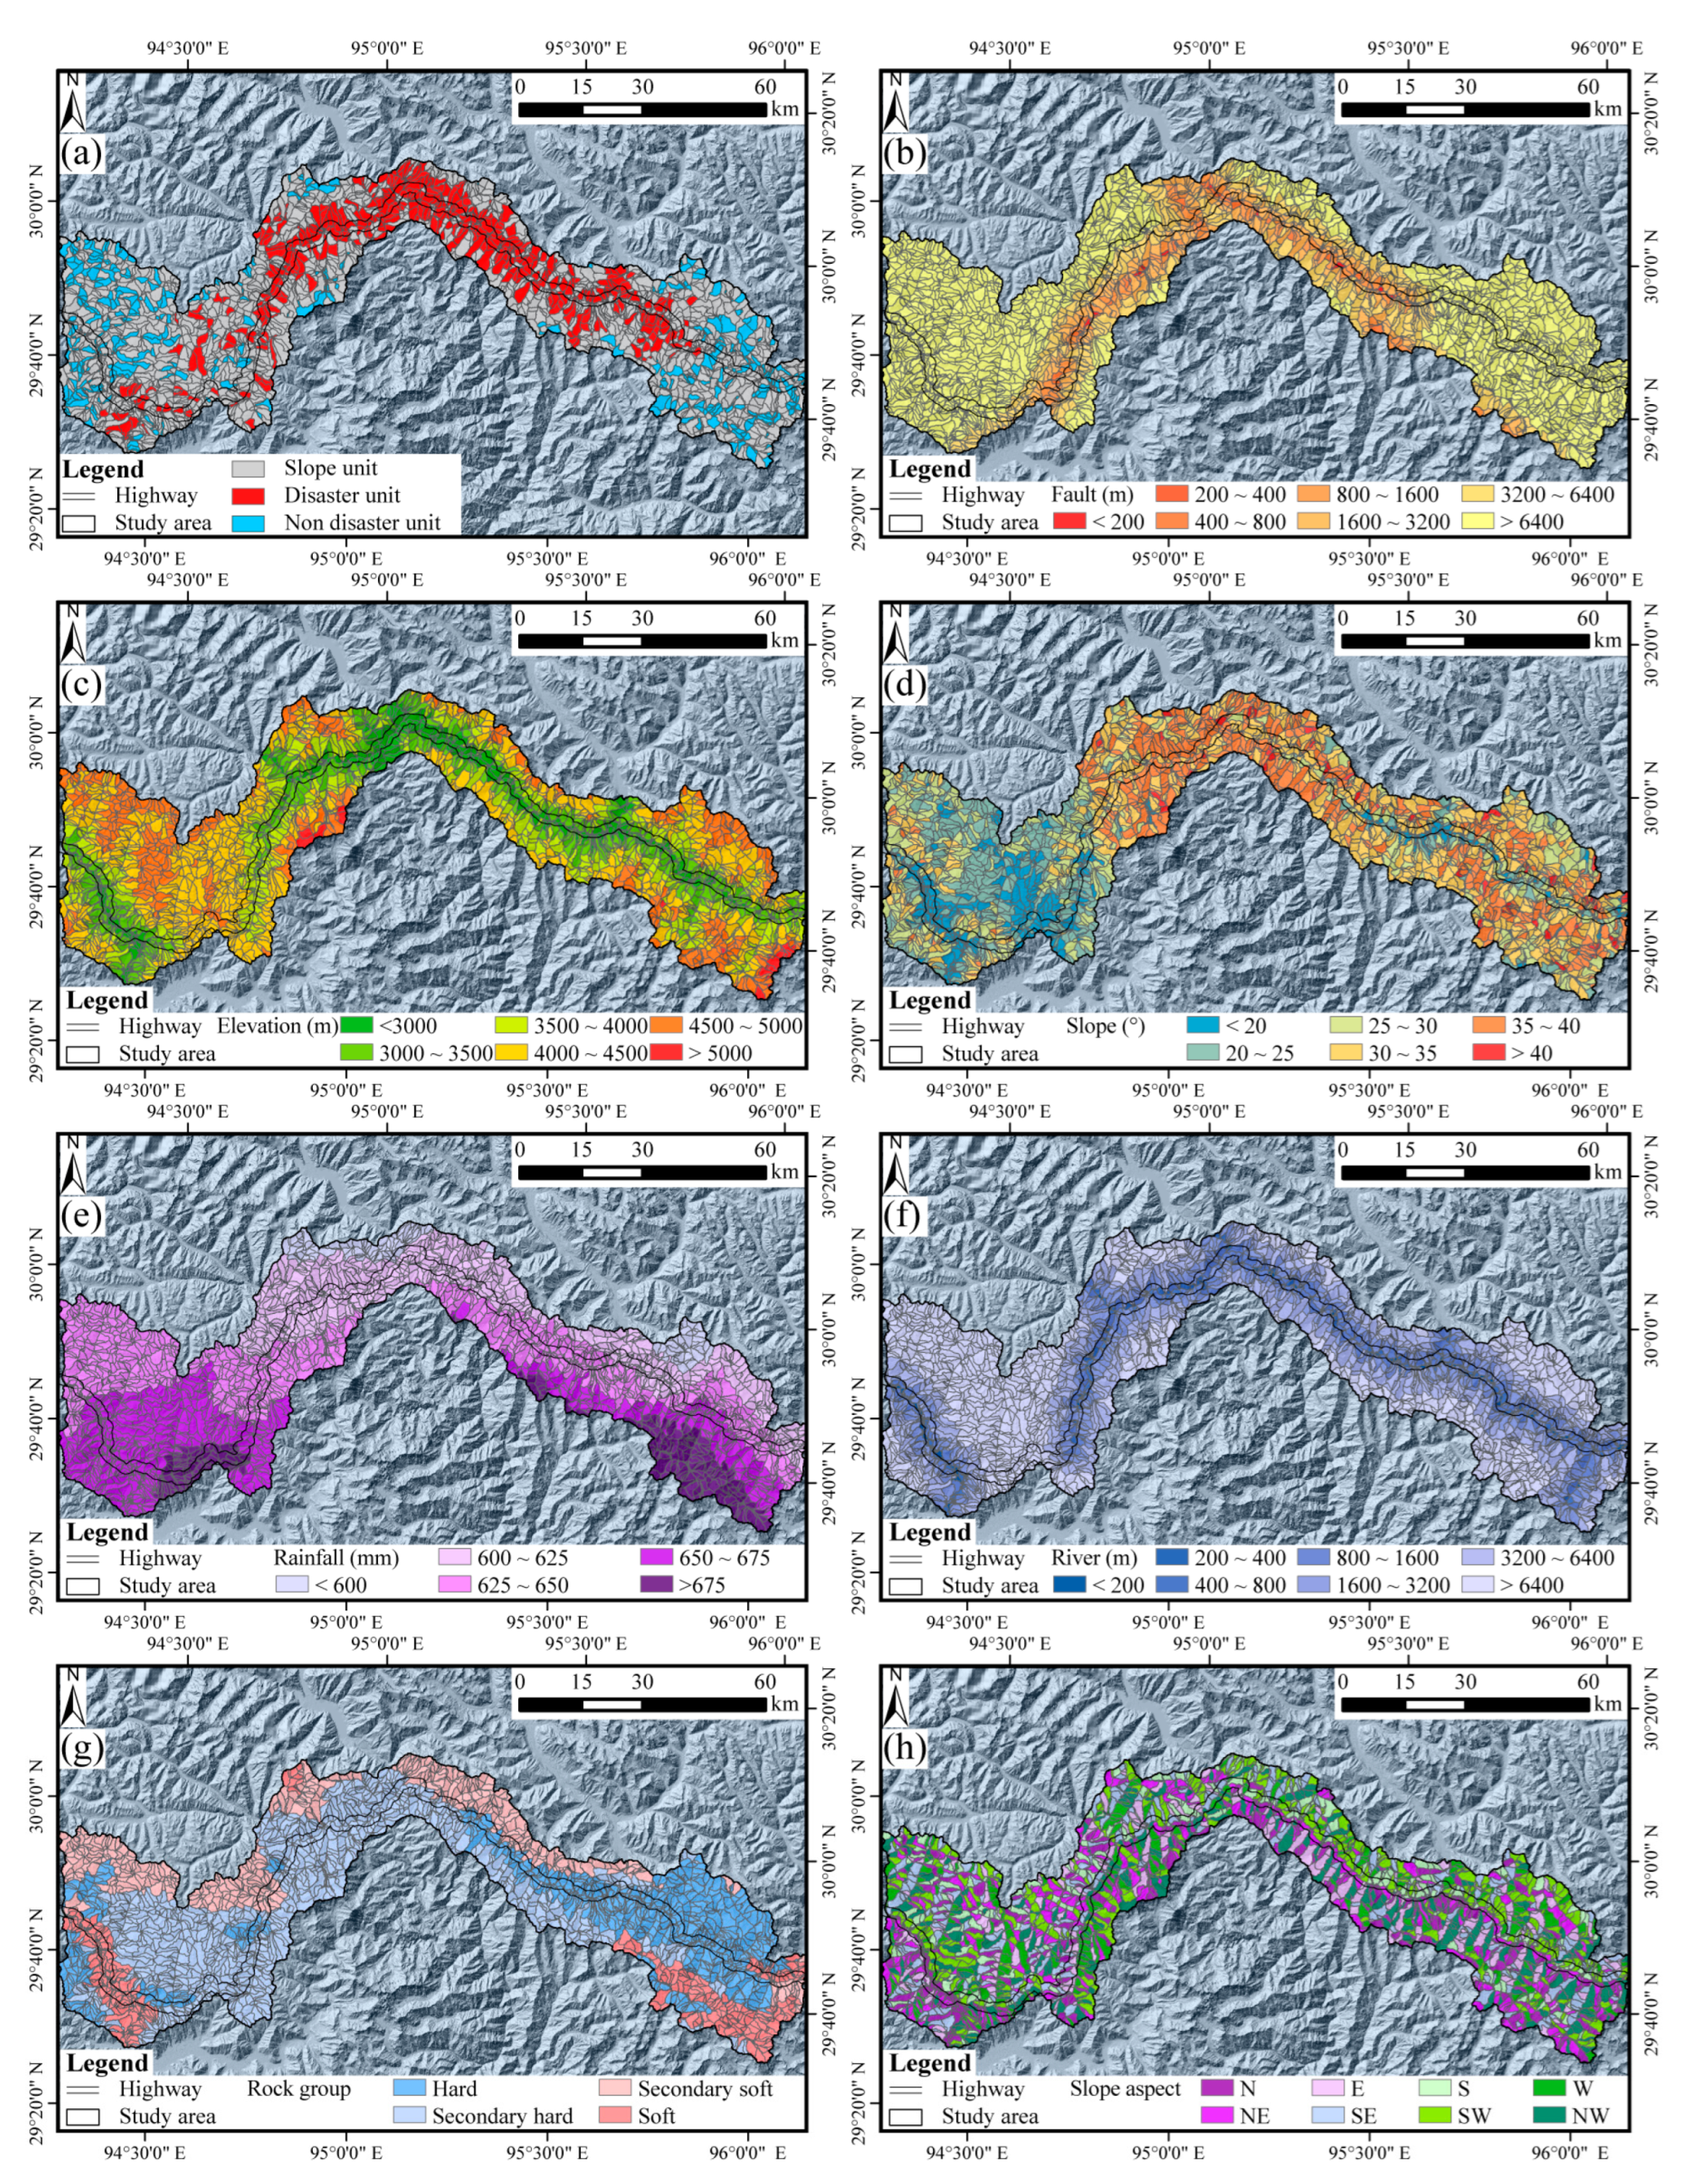
4.2.2. Evaluation Factors
4.2.3. Construction of Evaluation Model
4.2.4. Evaluation Results
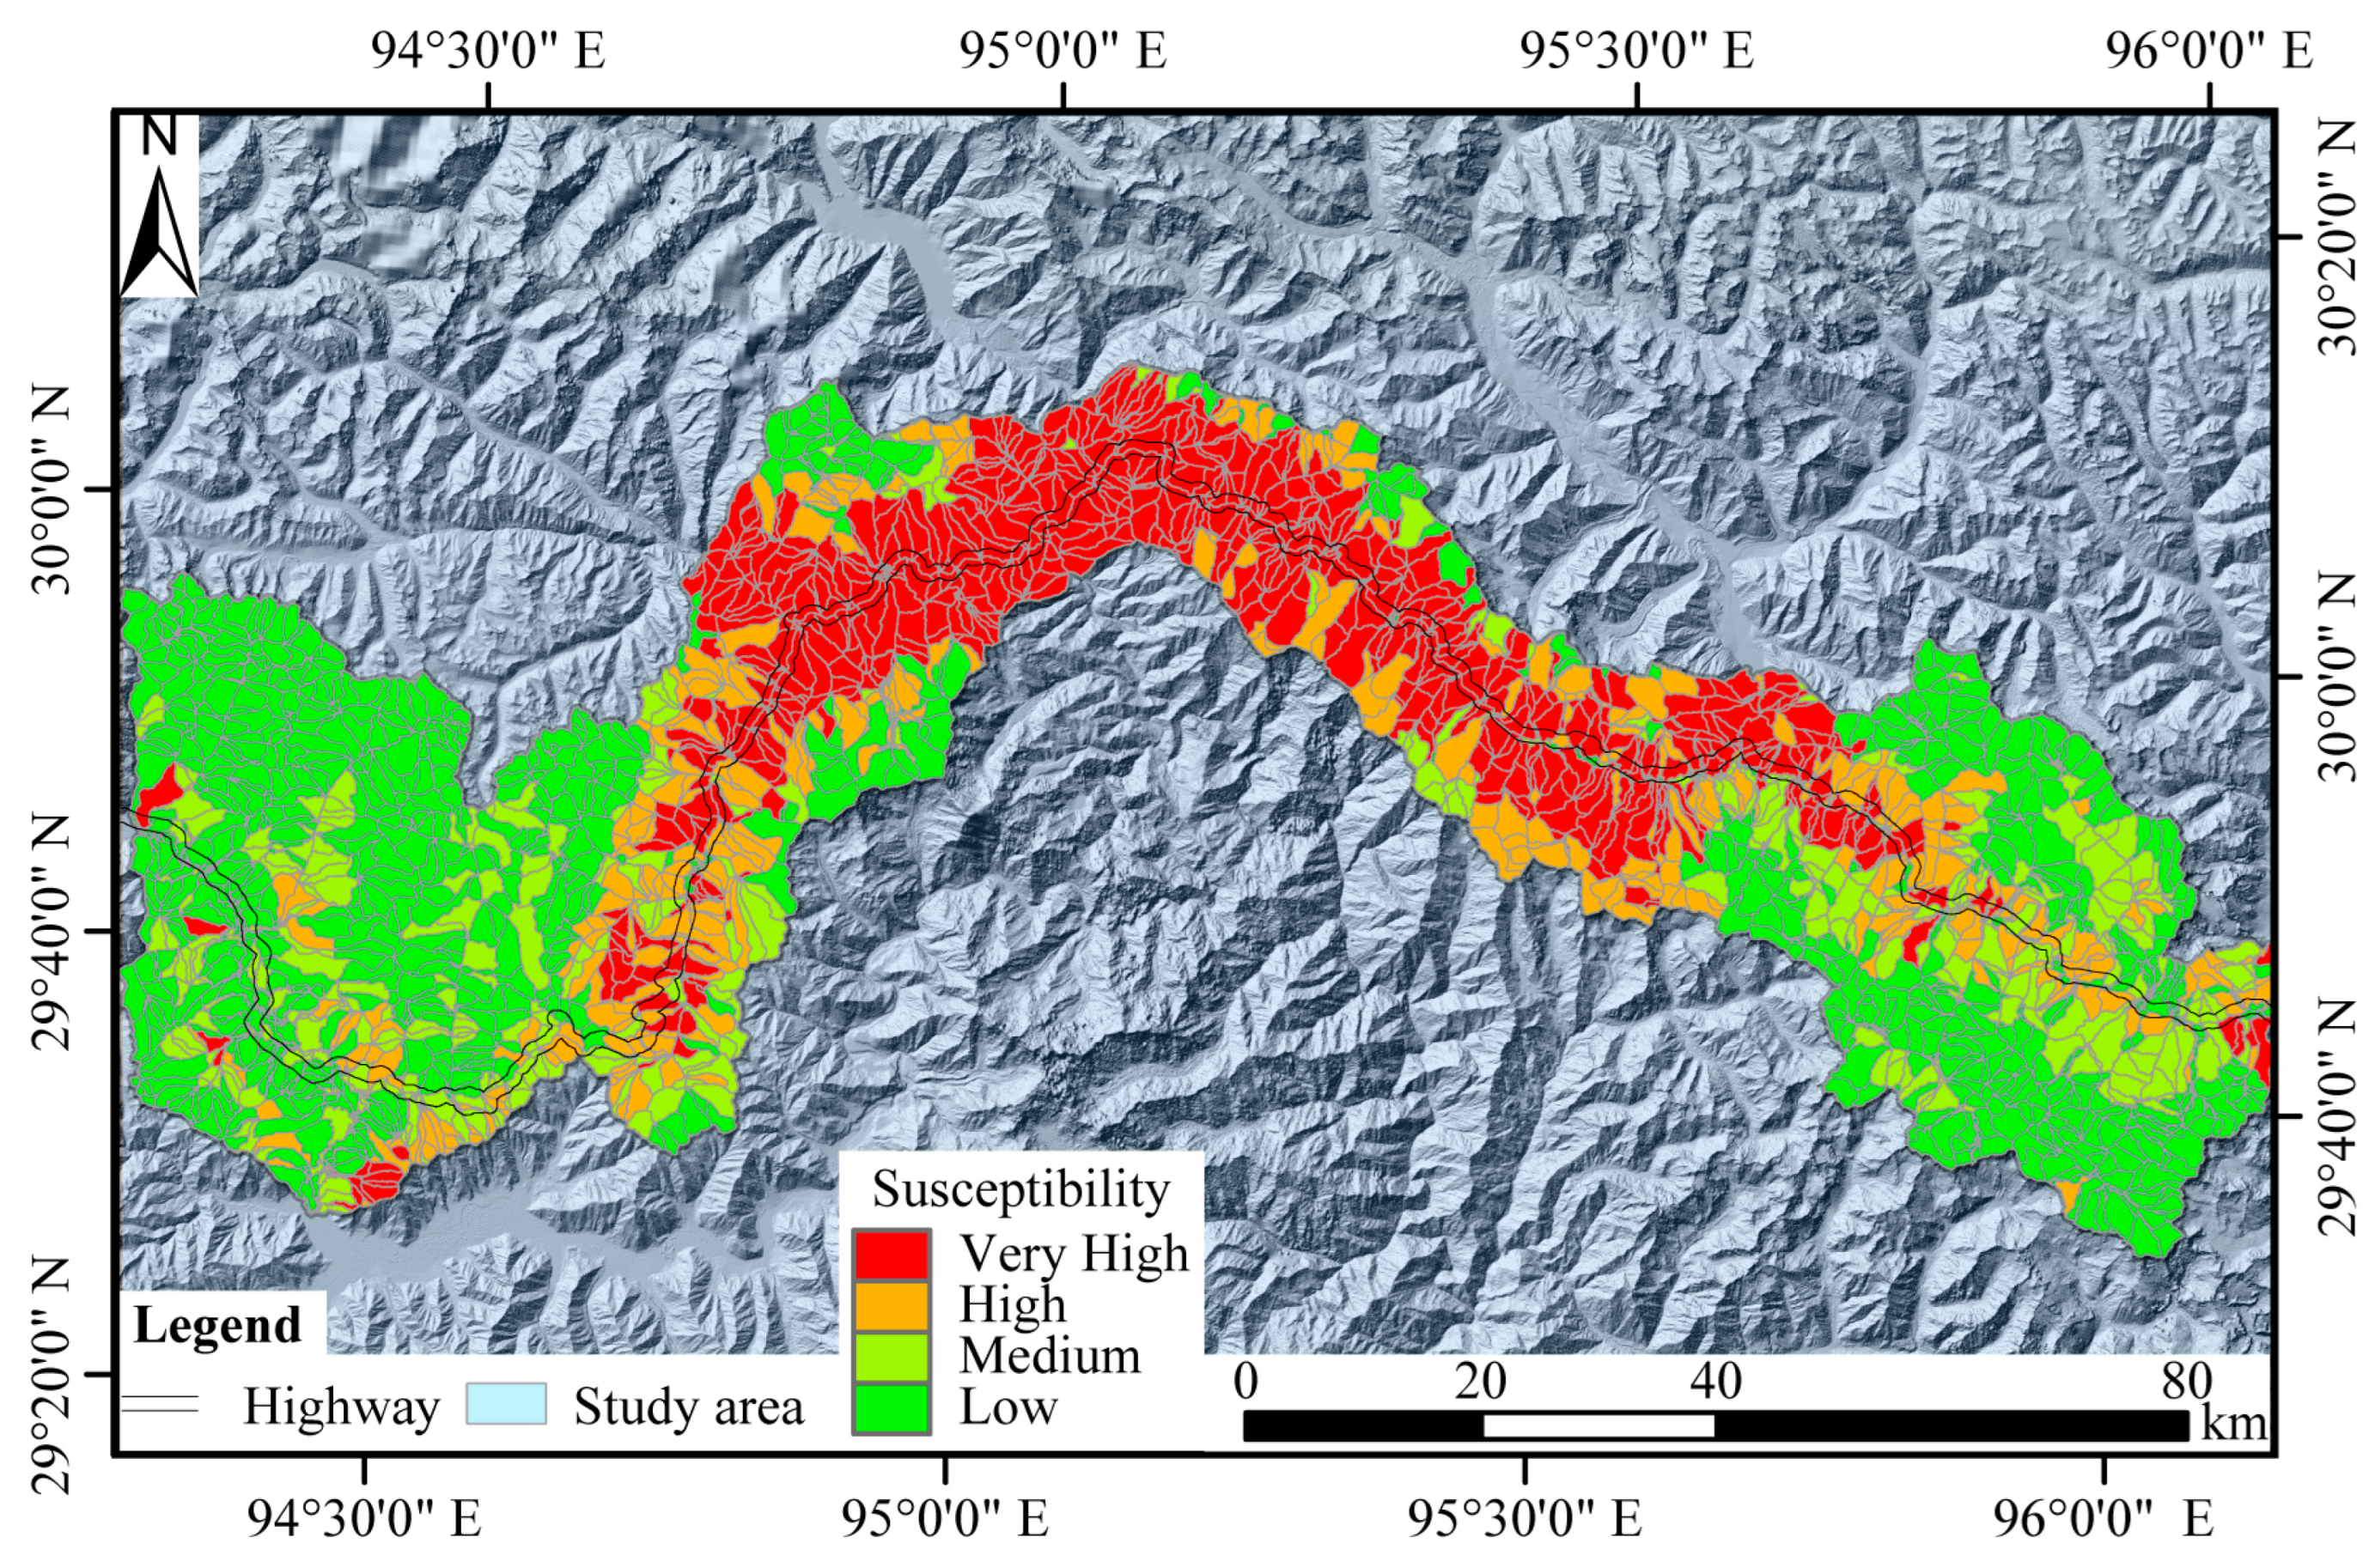
Spatial Probability
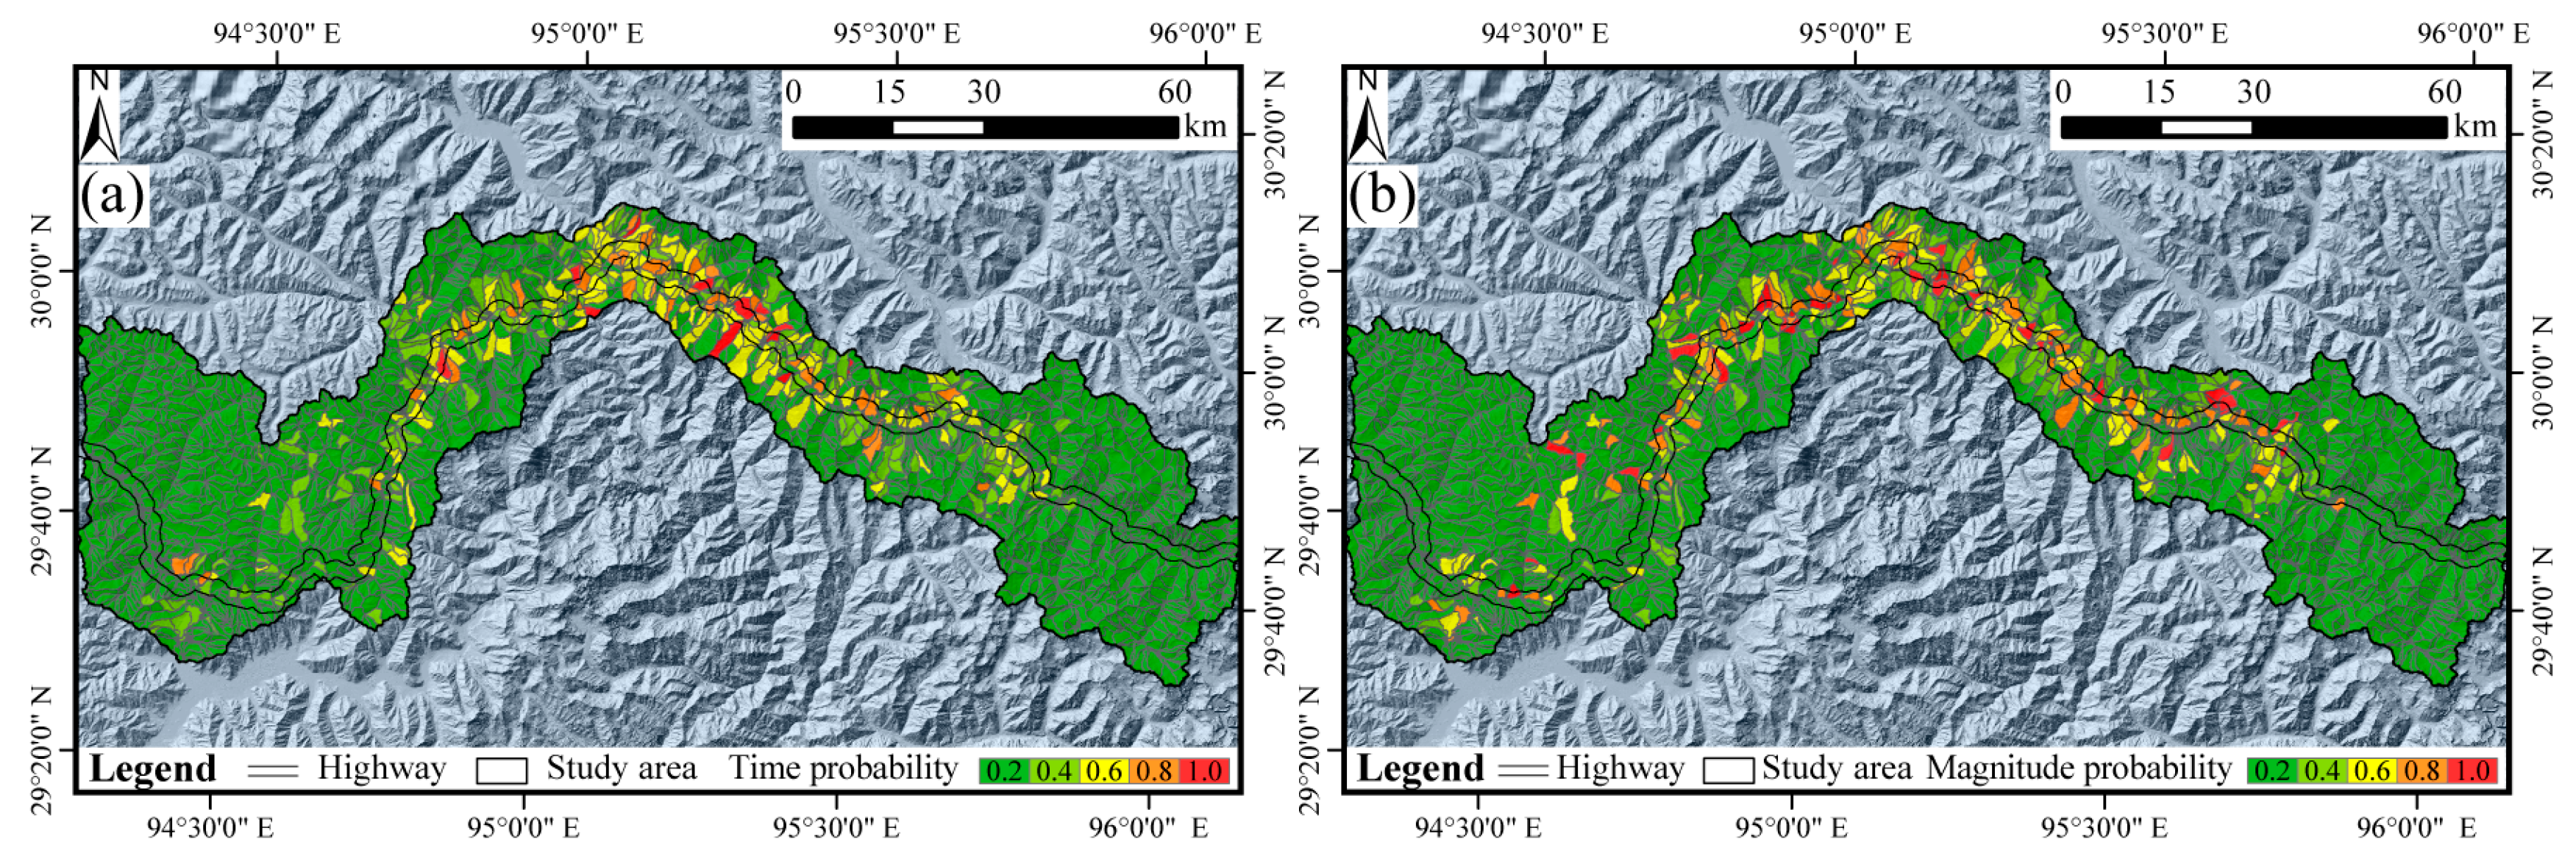
Time and Magnitude Probability
Zoning Results
5. Discussion
5.1. Zoning Ideas
5.2. Zoning Units
5.3. Zoning Indicators
5.4. Limitation Analysis
5.5. Future Prospects
6. Conclusions
Author Contributions
Funding
Data Availability Statement
Acknowledgments
Conflicts of Interest
References
- Zhang, Y.S.; Wu, R.A.; Guo, C.B.; Li, X.Q.; Li, X.; Ren, S.S.; Li, J.Q. Geological safety evaluation of railway engineering construction in plateau mountainous region: Ideas and methods. Acta Geol. Sin. 2022, 96, 1736–1751. [Google Scholar]
- Peng, J.B.; Cui, P.; Zhuang, J.Q. Challenges to engineering geology of Sichuan—Tibet railway. Chin. J. Rock Mech. Eng. 2020, 39, 2377–2389. [Google Scholar]
- Yi, S.J. Engineering Geological Partition Research Based on GIS for the Section of across Suture Zone in Sichuan-Tibet Railway. Master’s Dissertation, Chengdu University of Technology, Chengdu, China, 2018. [Google Scholar]
- Paul, T.; Xu, Z.; Francoise, R.; Bertrand, M.; Nicolas, A.; Gerard, W.; Yang, J. Oblique stepwise rise and growth of the Tibet Plateau. Science 2001, 294, 1671–1677. [Google Scholar] [CrossRef]
- Wang, H.; Li, K.; Chen, L.; Chen, X.; Li, A. Evidence for Holocene activity on the Jiali Fault, an active block boundary in the Southeastern Tibetan Plateau. Seismol. Res. Lett. 2020, 91, 1776–1780. [Google Scholar] [CrossRef]
- Yin, A. Cenozoic tectonic evolution of Asia: A preliminary synthesis. Tectonophysics 2010, 488, 293–325. [Google Scholar] [CrossRef]
- Tie, Y.B.; Ge, H.; Gao, Y.C.; Bai, Y.J.; Xu, W.; Gong, L.F.; Wang, J.Z.; Tian, K.; Xiong, X.H.; Fan, W.L.; et al. The research progress and prospect of geological hazards in Southwest China since the 20th Century. Sediment. Geol. Tethyan Geol. 2022, 42, 653–665. [Google Scholar] [CrossRef]
- Peng, J.B.; Xu, N.X.; Zhang, Y.S.; Xia, K.W.; Xue, Y.G.; Zhang, B.; Yang, G.X.; Chen, J.; Wang, F.Y.; Zang, M.D.; et al. The framework system for geosafety research. J. Eng. Geol. 2022, 30, 1798–1810. [Google Scholar]
- Qi, S.W.; Li, X.X.; Guo, S.F.; Liao, H.J. Landslide-risk zonation along mountainous highway considering rock mass classification. Environ. Earth Sci. 2015, 74, 4493–4505. [Google Scholar] [CrossRef]
- Shang, Y.; Park, H.D.; Yang, Z. Engineering geological zonation using interaction matrix of geological factors: An example from one section of Sichuan-Tibet Highway. Geosci. J. 2005, 9, 375–387. [Google Scholar] [CrossRef]
- Ondrasik, R.; Matys, M.; Viskup, J. Engineering geological zoning and seismic microzoning. Bull. Int. Assoc. Eng. Geol. 1992, 46, 89–92. [Google Scholar] [CrossRef]
- Shang, Y.J.; Yue, Z.Q.; Yang, Z.F.; Wang, Y.C.; Liu, D.A. Addressing severe slope failure hazards along Sichuan-Tibet Highway in Southwestern China. Episodes 2003, 26, 94–104. [Google Scholar]
- Qi, S.W.; Li, Y.C.; Song, S.H.; Lan, H.X.; Ma, F.S.; Li, Z.Q.; Chen, X.Q.; Cui, Z.D.; Zhang, L.Q.; Liu, C.L.; et al. Regionalization of engineering geological stability and distribution of engineering disturbance disasters in Tibetan Plateau. J. Eng. Geol. 2022, 30, 599–608. [Google Scholar]
- Zuquette, L.V.; Pejon, O.J.; dos Santos Collares, J.Q. Engineering geological mapping developed in the Fortaleza Metropolitan Re-gion, State of Ceara, Brazil. Eng. Geol. 2004, 71, 227–253. [Google Scholar] [CrossRef]
- Osipov, V.I.; Burova, V.N.; Zaikanov, V.G.; Molodykh, I.I.; Pyrchenko, V.A.; Savis’ko, I.S. A map of large-scale (detail) engineering geological zoning of Moscow territory. Water Resour. 2012, 39, 737–746. [Google Scholar] [CrossRef]
- Xiao, L.; Zhang, Y.; Peng, G. Landslide susceptibility assessment using integrated deep learning algorithm along the China-Nepal Highway. Sensors 2018, 18, 4436. [Google Scholar] [CrossRef]
- Ali, S.; Haider, R.; Abbas, W.; Basharat, M.; Reicherter, K. Empirical assessment of rockfall and debris flow risk along the Karakoram Highway, Pakistan. Nat. Hazards 2021, 106, 2437–2460. [Google Scholar] [CrossRef]
- Yang, N.; Wang, C.; Fu, Y. Research on construction of industrial environment system of cross-border e-commerce in free trade zone based on geological environment assessment method. IOP Conf. Ser. Earth Environ. Sci. 2021, 632, 022031. [Google Scholar] [CrossRef]
- Cui, J.H. Pondering upon the geological environment along the Sichuan-Tibet highway and plan of hazards controlling. J. Eng. Geol. 2003, 11, 100–104. [Google Scholar]
- Shang, Y.J.; Park, H.D.; Yang, Z.F.; Zhang, L.Q. Debris formation due to weathering, avalanching and rock falling, landsliding in SE Tibet. Int. J. Rock Mech. Min. Sci. 2004, 41, 839–845. [Google Scholar] [CrossRef]
- Zou, Q.; Cui, P.; Yang, W. Hazard assessment of debris flows along G318 Sichuan-Tibet highway. J. Mt. Sci. Engl. 2013, 31, 342–348. [Google Scholar]
- Liu, S.J. The Risk Disaster Assessment of Geologic Disaster in Sichuan-Tibet Highway. Master’s Thesis, Chongqing Jiaotong University, Chongqing, China, 2011. [Google Scholar]
- Zhang, Y.S.; Ren, S.S.; Guo, C.B.; Yao, X.; Zhou, N.J. Research on engineering geology related with active fault zone. Acta Geol. Sin. 2019, 93, 7775. [Google Scholar]
- Hu, H.T.; Liu, C.Z. Review and prospect on regional crustal stability of engineering sites. J. Eng. Geol. 1993, 1, 7–13. [Google Scholar]
- Zhao, Y.; Liu, H.; Qu, W.; Luan, P.; Sun, J. Research on geological safety evaluation index systems and methods for assessing underground space in coastal bedrock cities based on a back-propagation neural network comprehensive evaluation–analytic hierarchy process (BPCE-AHP). Sustainability 2023, 15, 8055. [Google Scholar] [CrossRef]
- Alexakis, D.; Agapiou, A.; Tzouvaras, M.; Themistocleous, K.; Neocleous, K.; Michaelides, S.; Hadjimitsis, D.G. Integrated use of GIS and remote sensing for monitoring landslides in transportation pavements: The case study of Paphos area in Cyprus. Nat. Hazards 2014, 72, 119–141. [Google Scholar] [CrossRef]
- Saaty, T.L. The Analytical Hierarchy Process; McGraw Hill: New York, NY, USA, 1980; p. 287. [Google Scholar]
- Zhang, G.; Cai, Y.; Zheng, Z.; Zhen, J.; Liu, Y.; Huang, K. Integration of the statistical index method and the analytic hierarchy process technique for the assessment of landslide susceptibility in Huizhou, China. Catena 2016, 142, 233–244. [Google Scholar] [CrossRef]
- Wang, Q.; Li, W. A GIS-based comparative evaluation of analytical hierarchy process and frequency ratio models for landslide susceptibility mapping. Phys. Geogr. 2017, 38, 318–337. [Google Scholar] [CrossRef]
- Bahrami, S.; Rahimzadeh, B.; Khaleghi, S. Analyzing the effects of tectonic and lithology on the occurrence of landslide along Zagros ophiolitic suture: A case study of Sarv-Abad, Kurdistan, Iran. Bull. Eng. Geol. Environ. 2020, 79, 1619–1637. [Google Scholar] [CrossRef]
- Guzzetti, F.; Reichenbach, P.; Cardinali, M.; Galli, M.; Ardizzone, F. Probabilistic landslide hazard assessment at the basin scale. Geomorphology 2005, 72, 272–299. [Google Scholar] [CrossRef]
- Guzzetti, F.; Galli, M.; Reichenbach, P.; Ardizzone, F.; Cardinali, M. Landslide hazard assessment in the Collazzone area, Umbria, Central Italy. Nat. Hazards Earth Syst. Sci. 2006, 6, 115–131. [Google Scholar] [CrossRef]
- Li, Y.; Chen, J.; Zhang, Y.; Song, S.; Han, X.; Ammar, M. Debris flow susceptibility assessment and runout prediction: A case study in Shiyang Gully, Beijing, China. Int. J. Environ. Res. 2020, 14, 365–383. [Google Scholar] [CrossRef]
- Li, Y.C.; Chen, J.P.; Tan, C.; Li, Y.; Gu, F.F.; Zhang, Y.W.; Mehmood, Q. Application of the borderline-SMOTE method in susceptibility assessments of debris flows in Pinggu District, Beijing, China. Nat. Hazards 2021, 105, 2499–2522. [Google Scholar] [CrossRef]
- Carrara, A.; Cardinali, M.; Detti, R.; Guzzetti, F.; Pasqui, V.; Reichenbach, P. GIS techniques and statistical models in evaluating landslide hazard. Earth Surf. Process. Landf. 1991, 16, 427–445. [Google Scholar] [CrossRef]
- Mauro, R.; Fausto, G.; Paola, R.; Alessandro, C.M.; Silvia, P. Optimal landslide susceptibility zonation based on multiple forecasts. Geomorphology 2010, 114, 129–142. [Google Scholar] [CrossRef]
- ArcGIS 10.2; [Computer software]. ESRI: Redlands, CA, USA, 2013.
- Hosmer, D.W.; Lemeshow, S. Applied Logistic Regression, Wiley Series in Probability and Statistics; Wiley: New York, NY, USA, 2000; p. 375. [Google Scholar]
- Yalcin, A.; Reis, S.; Aydinoglu, A.C.; Yomralioglu, T. A GIS-based comparative study of frequency ratio, analytical hierarchy process, bivariate statistics and logistics regression methods for landslide susceptibility mapping in Trabzon, NE Turkey. Catena 2011, 85, 274–287. [Google Scholar] [CrossRef]
- Costanzo, D.; Chacón, J.; Conoscenti, C.; Irigaray, C.; Rotigliano, E. Forward logistic regression for earth-flow landslide susceptibility assessment in the Platani river basin (southern Sicily, Italy). Landslides 2014, 11, 639–653. [Google Scholar] [CrossRef]
- Conoscenti, C.; Ciaccio, M.; Caraballo-Arias, N.A.; Gómez-Gutiérrez, Á.; Rotigliano, E.; Agnesi, V. Assessment of susceptibility to earth-flow landslide using logistic regression and multivariate adaptive regression splines: A case of the Belice River basin (western Sicily, Italy). Geomorphology 2015, 242, 49–64. [Google Scholar] [CrossRef]
- Crovelli, R.A. Probability Models for Estimation of Number and Costs of Landslides; US Geological Survey: Denver, CO, USA, 2000. [Google Scholar]
- Fu, S.; Chen, L.; Woldai, T.; Yin, K.; Gui, L.; Li, D.; Du, J.; Zhou, C.; Xu, Y.; Lian, Z. Landslide hazard probability and risk assessment at the community level: A case of western Hubei, China. Nat. Hazards Earth Syst. Sci. 2020, 20, 581–601. [Google Scholar] [CrossRef]
- Nichol, J.; Wong, M.S. Detection and interpretation of landslides using satellite images. Land Degrand. Dev. 2005, 16, 243–255. [Google Scholar] [CrossRef]
- Singhroy, V. Satellite remote sensing applications for landslide detection and monitoring. In Landslides—Disaster Risk Reduction; Sassa, K., Canuti, P., Eds.; Springer: Berlin/Heidelberg, Germany, 2009; pp. 143–158. [Google Scholar] [CrossRef]
- Yao, X.L. Study on the Mechanism and Susceptibility Model of the Endogenetic and Exogenetic Dynamic Coupling of the Landslide in Southeast Tibet. Doctor’s Dissertation, Institute of Geology and Geophysics, Chinese Academy of Sciences, Beijing, China, 2021. [Google Scholar]
- Ince, E.S.; Barthelmes, F.; Reiland, S.; Elger, K.; Förste, C.; Flechtner, F.; Schuh, H. ICGEM—15 years of successful collection and distribution of global gravitational models, associated services and future plans. Earth Syst. Sci. Data 2019, 11, 647–674. [Google Scholar] [CrossRef]
- Jiang, G.; Hu, S.; Shi, Y.; Zhang, C.; Wang, Z.; Hu, D. Terrestrial heat flow of continental China: Updated dataset and tectonic implications. Tectonophysics 2019, 753, 36–48. [Google Scholar] [CrossRef]
- Wang, M.; Shen, Z.K. Present-day crustal deformation of continental China derived from GPS and its tectonic implications. J. Geophys. Res. Solid Earth 2020, 125, e2019JB018774. [Google Scholar] [CrossRef]
- Zhang, Y.S.; Yao, X.; Hu, D.G.; Guo, C.B.; Xiong, T.Y. Quantitative zoning assessment of crustal stability along the Yunnan- Tibet railway line, western China. Acta Geol. Sin. (Chin. Ed.) 2012, 86, 1004–1012. [Google Scholar]
- Zhang, C.S.; Zhang, S.X.; Yang, W.M.; Meng, H.J.; Lv, J.J.; Zhang, T.T.; Wu, J.H.; Guo, H. Assessment of regional crustal stability in Shenfu New Area of Liaoning Province, China. J. Geomech. 2021, 27, 453–462. [Google Scholar] [CrossRef]
- Yao, X.; Li, L.J.; Zhang, Y.S.; Guo, C.B.; Zhou, N.J. Regional crustal stability assessment of the eastern margin of Tibetan Plateau. Geol. Bull. China 2015, 34, 32–44. [Google Scholar]
- Cheng, H.C.; Wei, Y.X.; Li, Z.G. Estimation of regional crustal stability in Anhui Province. Shanghai Land Resour. 2018, 39, 7–12. [Google Scholar]
- Meng, H.; Zhang, R.L.; Shi, J.S.; Li, C.Y. Geological environment safety evaluation. Earth Sci. 2021, 46, 3764–3776. [Google Scholar]
- Du, J.J.; Ma, Y.S.; Tan, C.X.; Chen, Q.C.; Shi, W. New generation 1:5,000,000 map of region stability evaluation in China. J. Geomech. 2015, 21, 309–317. [Google Scholar]
- He, A.N. Assessment on the Structural Stability of Xi’an Region and Its Adjacent Area. Master’s Dissertation, Chang’an University, Xi’an, China, 2012. [Google Scholar]
- Chen, J.; Li, Y.; Zhou, W.; Iqbal, J.; Cui, Z. Debris-flow susceptibility assessment model and its application in semiarid mountainous areas of the Southeastern Tibetan Plateau. Nat. Hazards Rev. 2017, 18, 05016005. [Google Scholar] [CrossRef]
- Wu, C.F. Quantitative Assessment and Zonation of Regional Crustal Stability in Northwest YUNNAN. Master’s Dissertation, Kunming University of Science and Technology, Kunming, China, 2001. [Google Scholar]
- Peng, J.B. Zoning and evaluation of neural network of regional stability. J. Eng. Geol. 2002, 10, 118–123. [Google Scholar]
- Zêzere, J.L.; Pereira, S.; Melo, R.; Oliveira, S.C.; Garcia, R.A. Mapping landslide susceptibility using data-driven methods. Sci. Total Environ. 2017, 589, 250–267. [Google Scholar] [CrossRef]
- Lima, P.; Steger, S.; Glade, T. Counteracting flawed landslide data in statistically based landslide susceptibility modelling for very large areas: A national-scale assessment for Austria. Landslides 2021, 18, 3531–3546. [Google Scholar] [CrossRef]
- Martinello, C.; Cappadonia, C.; Conoscenti, C.; Rotigliano, E. Landform Classification: A High-Performing Mapping Unit Partitioning Tool for Landslide Susceptibility Assessment—A Test in the Imera River Basin (Northern Sicily, Italy). Landslides 2022, 19, 539–553. [Google Scholar] [CrossRef]
- Liu, S.; Yin, K.; Zhou, C.; Gui, L.; Liang, X.; Lin, W.; Zhao, B. Susceptibility Assessment for Landslide Initiated along Power Transmission Lines. Remote Sens. 2021, 13, 5068. [Google Scholar] [CrossRef]
- Sun, X.H. Study on Landslide Susceptibility and Risk Mapping along the Rapidly Uplifting Section of the Upper Jinsha River: A Case of Xulong to Benzilan Reach. Doctor’s Dissertation, Jilin University, Jilin, China, 2020. [Google Scholar]


| C1 | C2 | C3 | C4 | C5 | C6 | Weights | |
|---|---|---|---|---|---|---|---|
| C1 | 1 | 2 | 3 | 2 | 3/2 | 5/4 | 0.260 |
| C2 | 1/2 | 1 | 3/2 | 1 | 3/4 | 1/2 | 0.125 |
| C3 | 1/3 | 2/3 | 1 | 3/4 | 1/2 | 1/3 | 0.085 |
| C4 | 1/2 | 1 | 4/3 | 1 | 2/3 | 1/2 | 0.120 |
| C5 | 2/3 | 4/3 | 2 | 3/2 | 1 | 5/6 | 0.177 |
| C6 | 4/5 | 2 | 3 | 2 | 6/5 | 1 | 0.233 |
| Level | C1 | C2 | C3 | C4 | C5 | C6 | Value |
|---|---|---|---|---|---|---|---|
| First | [0, 3.59) | [0, 166.07) | [0.23, 12.01) | [46.92, 78.42) | [6.26, 12.97) | [5.2, 5.50) | 1 |
| Second | [3.59, 9.91) | [166.07, 332.15) | [12.01, 27.79) | [78.42, 115.66) | [12.97, 19.07) | [5.50, 5.63) | 2 |
| Third | [9.91, 17.25) | [332.15, 498.22) | [27.79, 50.69) | [115.66, 147.16) | [19.07, 23.46) | [5.63, 5.80) | 3 |
| Fourth | [17.25, 26.48) | [498.23, 691.98) | [50.69, 82.53) | [147.16, 170.07) | [23.46, 27.61) | [5.80, 6.10) | 4 |
| Fifth | [26.48, 43.74] | [691.98, 3542.92] | [82.53, 164.71] | [170.07, 253.13] | [27.61, 37.48] | [6.10, 6.65] | 5 |
| Model | Category | Unit Type | Evaluation Result | Accuracy | Overall Accuracy | |
|---|---|---|---|---|---|---|
| Non-Disaster Unit | Disaster Unit | |||||
| Model # 1 | Training | Non-Disaster Unit | 280 | 32 | 89.74% | 88.62% |
| Disaster Unit | 39 | 273 | 87.50% | |||
| Prediction | Non-Disaster Unit | 74 | 4 | 94.87% | 89.10% | |
| Disaster Unit | 13 | 65 | 83.33% | |||
| Model # 2 | Training | Non-Disaster Unit | 281 | 31 | 90.06% | 88.78% |
| Disaster Unit | 39 | 273 | 87.50% | |||
| Prediction | Non-Disaster Unit | 69 | 9 | 88.46% | 87.82% | |
| Disaster Unit | 10 | 68 | 87.18% | |||
| Model # 3 | Training | Non-Disaster Unit | 285 | 27 | 91.35% | 89.90% |
| Disaster Unit | 36 | 276 | 88.46% | |||
| Prediction | Non-Disaster Unit | 69 | 9 | 88.46% | 85.26% | |
| Disaster Unit | 14 | 64 | 82.05% | |||
| Model # 4 | Training | Non-Disaster Unit | 286 | 26 | 91.67% | 89.90% |
| Disaster Unit | 37 | 275 | 88.14% | |||
| Prediction | Non-Disaster Unit | 62 | 16 | 79.49% | 84.62% | |
| Disaster Unit | 8 | 70 | 89.74% | |||
| Model # 5 | Training | Non-Disaster Unit | 275 | 37 | 88.14% | 88.62% |
| Disaster Unit | 34 | 278 | 89.10% | |||
| Prediction | Non-Disaster Unit | 69 | 9 | 88.46% | 87.18% | |
| Disaster Unit | 11 | 67 | 85.90% | |||
| Level | Number | Time Probability | Average Area (km2) | Magnitude Probability |
|---|---|---|---|---|
| First | 0 | 0.2 | 0 | 0.2 |
| Second | 1 | 0.4 | 0~0.05 | 0.4 |
| Third | 2~3 | 0.6 | 0.05~0.15 | 0.6 |
| Fourth | 4~5 | 0.8 | 0.15~0.35 | 0.8 |
| Fifth | ≥6 | 1 | ≥0.35 | 1 |
Disclaimer/Publisher’s Note: The statements, opinions and data contained in all publications are solely those of the individual author(s) and contributor(s) and not of MDPI and/or the editor(s). MDPI and/or the editor(s) disclaim responsibility for any injury to people or property resulting from any ideas, methods, instructions or products referred to in the content. |
© 2023 by the authors. Licensee MDPI, Basel, Switzerland. This article is an open access article distributed under the terms and conditions of the Creative Commons Attribution (CC BY) license (https://creativecommons.org/licenses/by/4.0/).
Share and Cite
Li, Y.; Qi, S.; Zheng, B.; Yao, X.; Guo, S.; Zou, Y.; Lu, X.; Tang, F.; Guo, X.; Waqar, M.F.; et al. Multi-Scale Engineering Geological Zonation for Linear Projects in Mountainous Regions: A Case Study of National Highway 318 Chengdu-Shigatse Section. Remote Sens. 2023, 15, 4619. https://doi.org/10.3390/rs15184619
Li Y, Qi S, Zheng B, Yao X, Guo S, Zou Y, Lu X, Tang F, Guo X, Waqar MF, et al. Multi-Scale Engineering Geological Zonation for Linear Projects in Mountainous Regions: A Case Study of National Highway 318 Chengdu-Shigatse Section. Remote Sensing. 2023; 15(18):4619. https://doi.org/10.3390/rs15184619
Chicago/Turabian StyleLi, Yongchao, Shengwen Qi, Bowen Zheng, Xianglong Yao, Songfeng Guo, Yu Zou, Xiao Lu, Fengjiao Tang, Xinyi Guo, Muhammad Faisal Waqar, and et al. 2023. "Multi-Scale Engineering Geological Zonation for Linear Projects in Mountainous Regions: A Case Study of National Highway 318 Chengdu-Shigatse Section" Remote Sensing 15, no. 18: 4619. https://doi.org/10.3390/rs15184619