Article

Estimation of Total Phosphorus Concentration in Lakes in the Yangtze-Huaihe Region Based on Sentinel-3/OLCI Images

1
College of Geomatics, Xi’an University of Science and Technology, Xi’an 710054, China
2
Key Laboratory of Watershed Geographic Sciences, Nanjing Institute of Geography and Limnology, Chinese Academy of Sciences, Nanjing 210008, China
3
International Research Center of Big Data for Sustainable Development Goals, Beijing 100094, China
4
University of Chinese Academy of Sciences, Nanjing 211135, China
5
Jiangsu Collaborative Innovation Center of Regional Modern Agriculture and Environmental Protection, Huaiyin Normal University, Huaian 223001, China
*
Author to whom correspondence should be addressed.
Remote Sens. 2023, 15(18), 4487; https://doi.org/10.3390/rs15184487
Submission received: 23 July 2023 / Revised: 3 September 2023 / Accepted: 10 September 2023 / Published: 12 September 2023

Abstract

:
Total phosphorus (TP) concentration is a crucial parameter to assess eutrophication in lakes. As one of the most concentrated regions for freshwater lakes, the Yangtze-Huaihe region plays a significant role in monitoring TP concentrations for the sustainable utilisation of China’s water resources. In this study, a TP concentration estimation model suitable for large-sized lake groups was developed using a combination of measured and remote sensing data powered by advanced machine learning algorithms. Compared to traditional empirical models, the model developed in this study demonstrates significant accuracy in fitting (R2 = 0.53, RMSE = 0.08 mg/L, MAPE = 34.20%). Moreover, the application of this model to lakes in the Yangtze-Huaihe region from 2017 to 2022 has been conducted. The multi-year average TP concentration was 0.18 mg/L. Spatial distribution analyses showed that total phosphorus concentrations were higher in small lakes. In terms of temporal changes, the interannual decreases in total phosphorus concentrations were 0.02 mg/L, 0.01 mg/L, and 0.01 mg/L for small, medium, and large lakes, respectively. We also found that large lakes typically exhibited a “high in spring and summer, low in autumn and winter” pattern until 2020, but transitioned to a “high in summer and autumn, low in spring and winter” pattern after 2020 due to the removal of closed fish nets, which were having a significant impact on the lake ecosystem. Other lakes in the area consistently showed a pattern of “high in spring and summer, low in autumn and winter” during the six-year period. These findings may provide useful references and suggestions for the environmental protection and management of lakes in China.

1. Introduction

The ongoing increase in lake eutrophication has emerged as one of the most significant issues in aquatic environments due to global warming, industrialisation, and intensive agriculture. Approximately 40% of the world’s lakes experience severe issues, such as ecosystem and biodiversity deterioration, because of severe eutrophication [1]. Consequently, long-term and extensive monitoring of lake nutrient content is crucial for regulating lake eutrophication.
Currently, various techniques are used to retrieve water quality parameters, including analytical [2], semi-empirical [3], and empirical methods [4]. However, machine learning algorithms have demonstrated unmatched advantages over conventional approaches thanks to the quick development of artificial intelligence technology. By leveraging large datasets, these algorithms can establish complex relationships between water quality parameters and multiple variables, enabling the estimation of crucial parameters, such as the Secchi disk depth (SDD) [5], chlorophyll-a (Chl-a) [6], total suspended matter (TSM) [7], and chromophoric dissolved organic matter (CDOM) [8], and they have been successfully applied to the long-term monitoring of multiple lakes on a large spatial scale [9,10,11]. Nonetheless, it is crucial to note that, in addition to these optical characteristic parameters, other non-optical parameters are also closely related to lake eutrophication and play a crucial role in assessing the safety of the water environment, such as total nitrogen (TN), total phosphorus (TP), ammonia nitrogen (NH3-N), and the permanganate index (CODMn) [12,13]; however, there are some difficulties in estimating these indices in turbid inland water bodies.
Among these parameters, TP is one of the primary nutrients contributing to lake eutrophication [14]. Extensive research has used remote sensing techniques to construct models for estimating TP concentrations in water bodies. For instance, Baban et al. [15] employed Landsat 5 TM satellite data to establish a regression relationship between remote sensing and in-situ measurements for TP concentration estimation. Wang et al. [16] utilized MODIS images to develop a regression model to estimate TP concentration in Hulun Lake. Additionally, researchers have explored indirect TP estimation by leveraging the relationships between TP and optical water quality parameters, such as TSM, Chl-a, and CDOM [17,18,19]. In recent years, machine learning algorithms have gained prominence in TP concentration estimation, surpassing traditional methods. For instance, García Nieto et al. [20] employed Support Vector Machines (SVM) to construct a TP estimation model for Englishmen Lake in Spain and achieved an impressive coefficient of determination (R2) of 0.90. Lee et al. [21] applied four different machine learning algorithms to estimate TP concentrations in Euiam Lake, Korea, yielding R2 values above 0.70. Xiong et al. [22] developed the eXtreme Gradient Boosting (XGBoost) algorithm specifically tailored for TP concentration estimation in Taihu Lake, achieving an R2 of 0.60 and an RMSE of 0.07 mg/L. Among the various machine-learning techniques, XGBoost, an optimized gradient boosting algorithm, has demonstrated superior performance, self-learning capabilities, and predictive power [23]. Cui et al. [24] identified XGBoost as the optimal choice for estimating Chl-a concentration in Nansi Lake using hyperspectral data. Similarly, Hu et al. [25] compared six machine learning methods and concluded that XGBoost was the most effective model for predicting TP concentration in Taihu Lake. The traditional direct inversion method is simple and has good results, but it is not suitable for lakes with complex relationships, while the indirect inversion is detrimental to the model accuracy, so currently these two inversion methods are only applied to a single lake. In contrast, machine learning has higher application ability on a large regional scale, which is not only well proven in parameters with optical characteristics, such as chlorophyll-a [6] and Secchi disk depth [26], but also shows good robustness in the inversion of non-optical parameters, such as dissolved CO2 [27,28]. Although some scholars believe that machine learning has the potential for application in the remote sensing estimation of TP for lakes at a large regional scale [22], a complete proof and application have not been given.
In conclusion, there is a lack of machine learning models that are widely applicable to the estimation of TP concentrations in lake populations. The Yangtze-Huaihe region is recognised as one of the most densely populated freshwater lakes areas in China and represents a prominent region with respect to lake eutrophication issues [29]. Monitoring TP concentrations in the Yangtze-Huaihe region is crucial for effective water management within the region. Therefore, this study aimed to utilise remote sensing techniques and synchronous satellite observations to establish a machine learning-based algorithm for estimating TP concentrations in the Yangtze-Huaihe Lake group. This study further aims to analyze the spatiotemporal variations in the TP and investigate the underlying driving mechanisms, thus providing scientific references for the monitoring and management of lake pollution and eutrophication in the Yangtze-Huaihe region. The objectives of this study were as follows: (1) to develop a machine learning model for estimating TP concentrations in the lakes of the Yangtze-Huaihe region and (2) to analyse the spatiotemporal distribution patterns of TP concentrations in the lakes of the Yangtze-Huaihe region and explore the associated driving mechanisms.

2. Materials and Methods
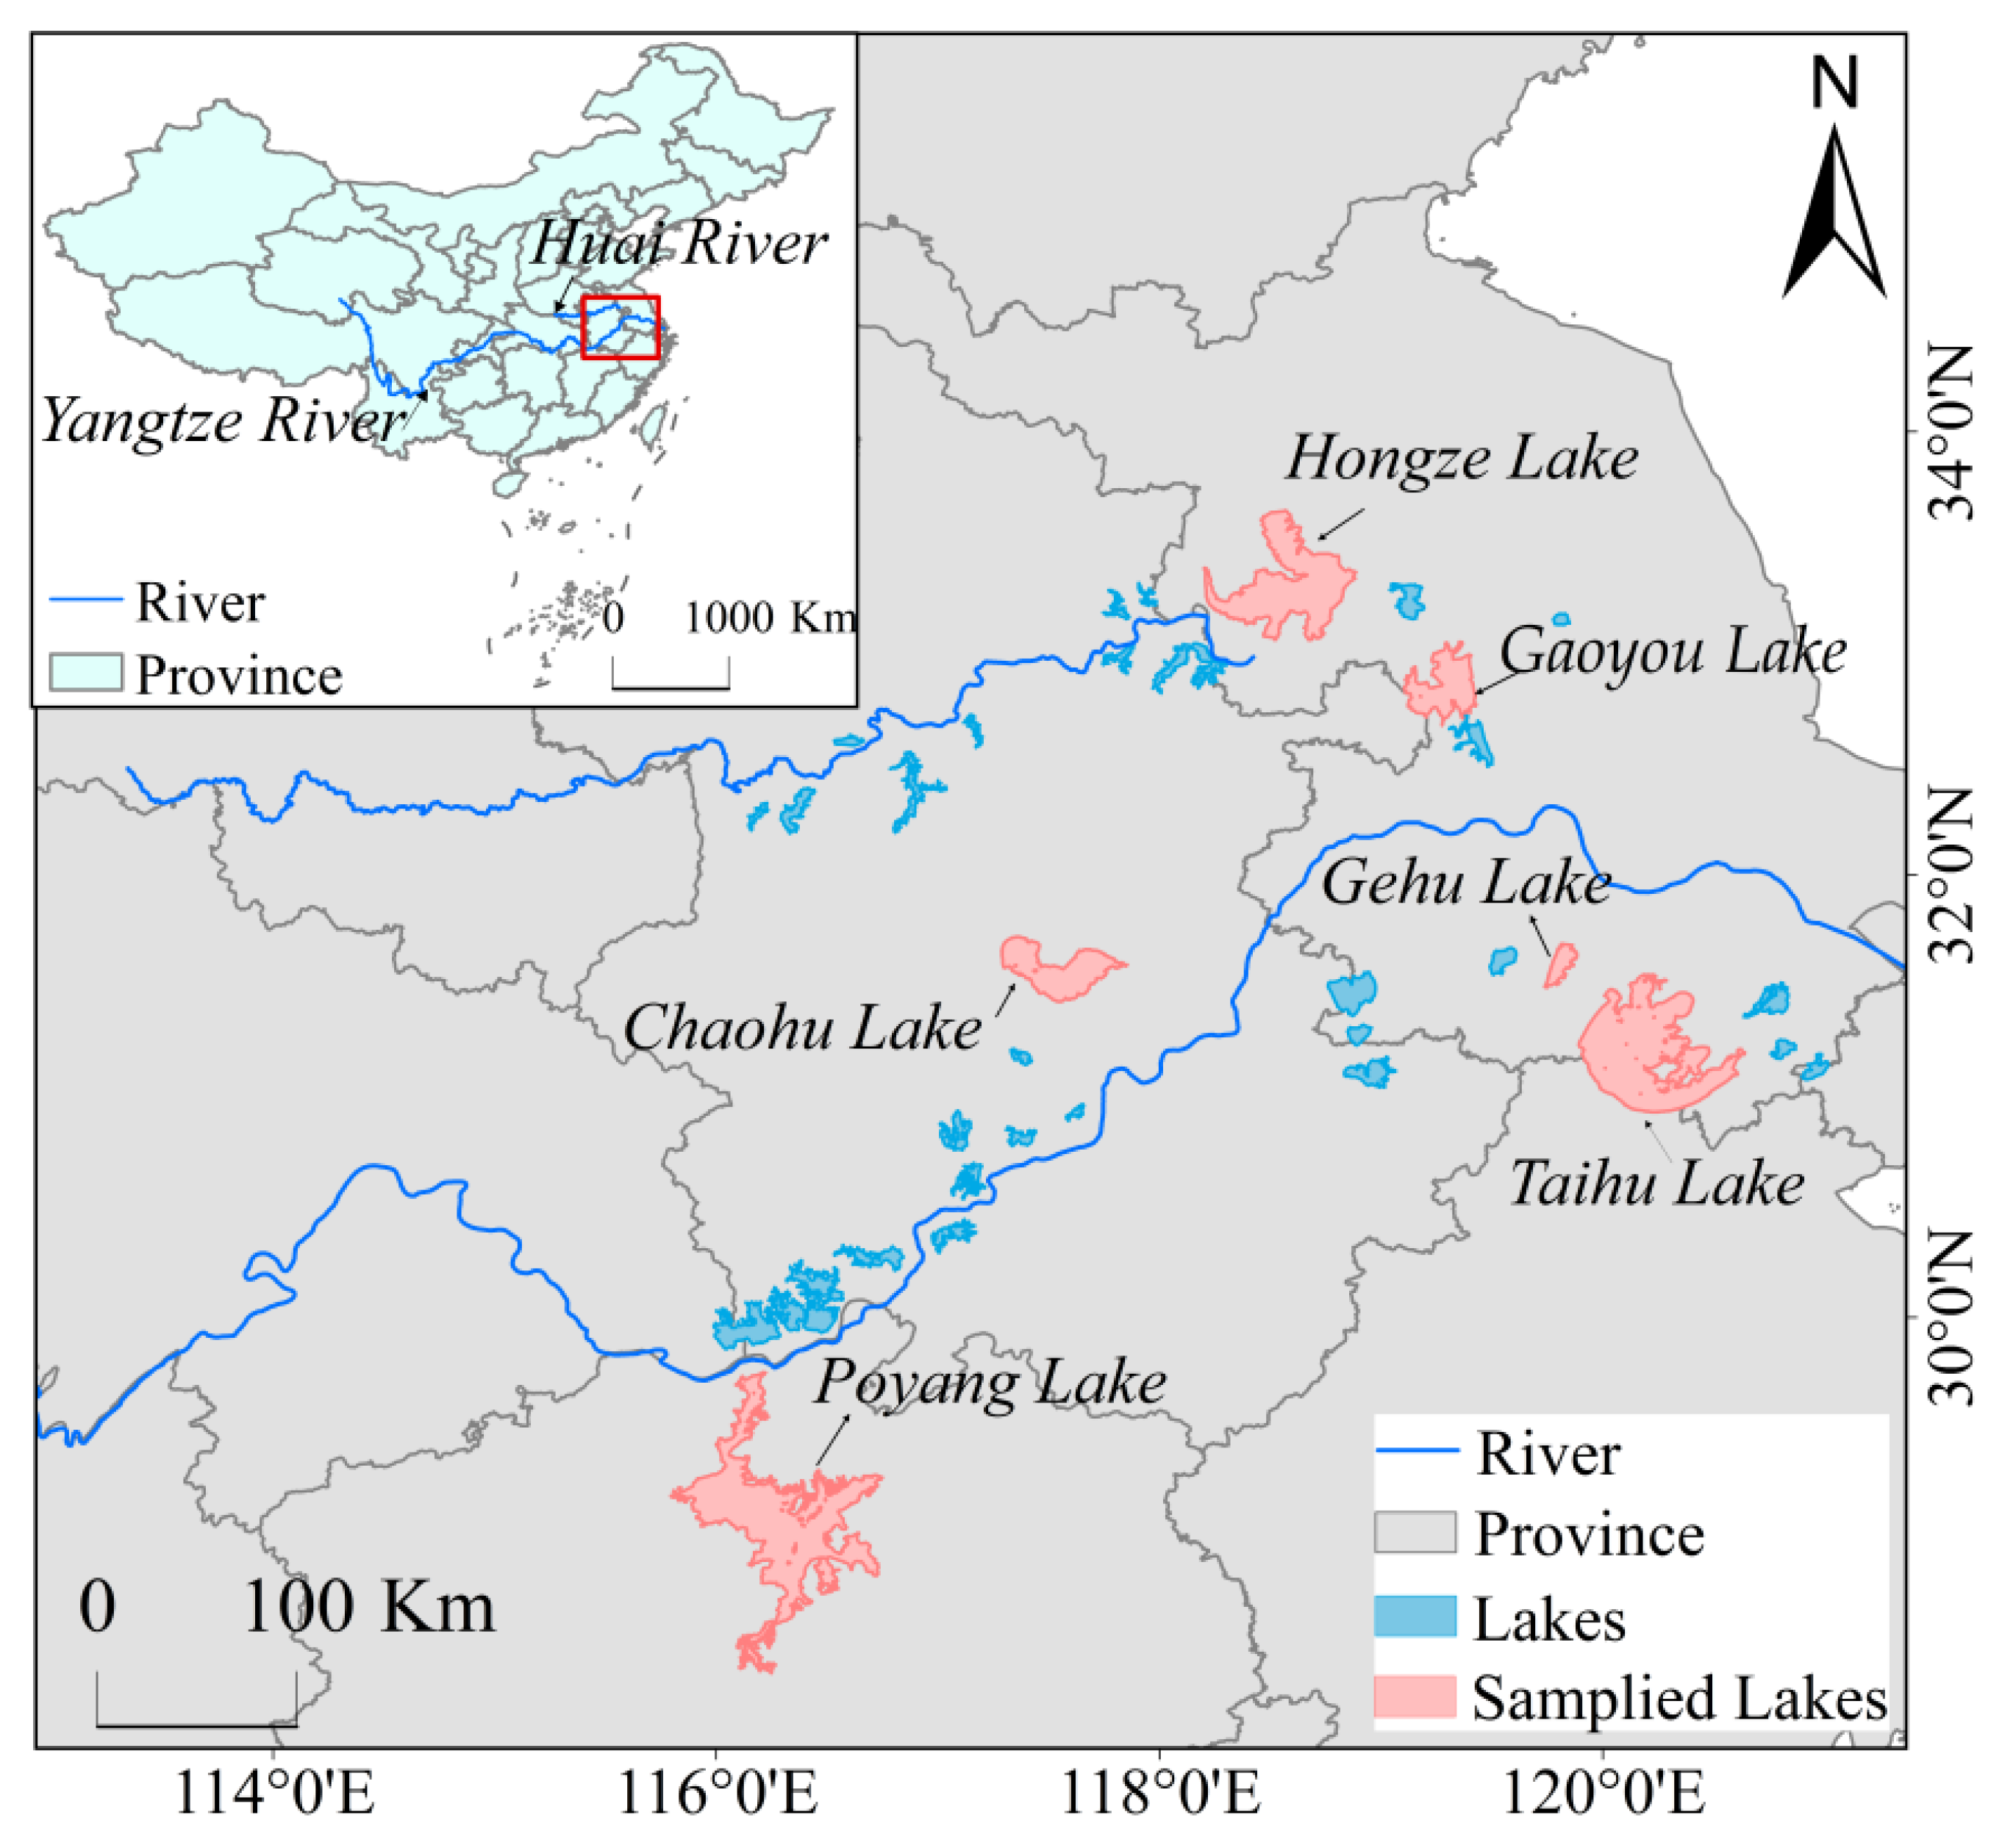
2.1. Study Area

The study area encompasses the Yangtze-Huaihe region, which lies between the lower reaches of the Yangtze River and the Huai River. It is located at approximately 28°21′–33°40′N, 115°42′–121°1′E and is characterized by a subtropical monsoon climate with mild seasons and significant interannual variations in rainfall. The geographical features of the region are predominantly formed by the sedimentation of the Huai River and the Yangtze River, with higher elevations surrounding the lower-lying central area, where the altitude is less than 10 m. The Yangtze-Huaihe region is one of the areas in China with the highest density of lakes, which is closely associated with the scarcity of water resources in the country [30]. Moreover, the region has a high population density, well-developed freshwater fisheries, and a substantial amount of wastewater discharge. The intensive developmental activities, such as land reclamation and enclosed aquaculture, in the lakes have directly or indirectly contributed to increased nutrient loading [31,32], water quality deterioration, frequent occurrences of cyanobacterial blooms, and severe eutrophication, which pose significant challenges to the sustainable development of the Yangtze-Huaihe region. Therefore, for this study, we have selected shallow lakes within the Yangtze-Huaihe region, with an area larger than 20 km2, as representative lakes for long-term analysis of TP concentrations, as seen in Figure 1. (Please refer to the area of the lake Supplementary Material Table S1 for details).

2.2. Data

2.2.1. In Situ Data

The research team conducted field surveys in six medium to large-sized lakes in the Yangtze-Huaihe region between 2017 and 2022. The sampling points were evenly distributed across the lakes, and specific information is presented in Table 1. 500 mL brown bottles were used to collect surface mixed water samples, which were then immediately transported to the lab with ice packs in light-protected coolers. Filtration experiments were conducted on the same day, followed by refrigeration for chemical analysis. Global positioning system (GPS) devices were used to record the coordinates of the sampling points, and measurement time and weather conditions. TP concentrations were determined using the acid digestion–molybdenum antimony anti-colorimetric method.

2.2.2. Satellite Data and Preprocessing

The imagery used in this study is obtained from Sentinel-3 images. The Ocean and Land Color Instrument (OLCI) is a multispectral radiometer carried by Sentinel-3A (launched in 2016) and Sentinel-3B (launched in 2018). It has 21 spectral channels in the range of 400–1020 nm, including 16 hydro-chromatic bands and a high signal-to-noise ratio, with a spatial resolution of about 300 m. The data were downloaded from the European Space Agency website (https://scihub.copernicus.eu/dhus/#/home, accessed on 28 June 2022).
Currently, there are various methods for atmospheric correction of water bodies. Among them, the dark spectrum fitting (DSF) atmospheric correction algorithm of Acolite has been proven suitable for the use of Sentinel-3 OLCI imagery in turbid water bodies [33]. Therefore, in this study, the Acolite atmospheric correction algorithm was employed. Subsequently, masking of algal blooms, clouds, and cloud shadows was performed, and terrain correction was conducted using SNAP 8.0.0 software. Spectral reflectance of the sampling points was extracted based on their latitude and longitude coordinates using ENVI 5.3. These data were used for the construction and validation of the TP concentration inversion model.

2.2.3. Auxiliary Data

Meteorological data was incorporated to investigate the influence of natural factors on TP concentration in the Yangtze-Huaihe region. Rainfall data utilized the daily global precipitation dataset provided by NASA (GPM_3IMERGHH_06, https://disc.gsfc.nasa.gov, accessed on 15 February 2023). The spatial resolution of this dataset is 0.1° × 0.1°. Temperature data was obtained from the ERA5-Land dataset (https://cds.climate.copernicus.eu/cdsapp#!/dataset/reanalysis-era5-land-monthly-means?tab=overview, accessed on 15 February 2023) and expressed in Kelvin (K). In this study, the temperature values were converted from Kelvin to Celsius (°C) by subtracting 273.15 from the original data.

2.3. Model Development

2.3.1. Modeling Set Construction

The variable set comprises OLCI image bands and remote sensing indices.
(1) OLCI Image Bands: After performing Acolite atmospheric correction on the OLCI images, 17 bands are generated at wavelengths of 400 nm, 412 nm, 443 nm, 490 nm, 510 nm, 560 nm, 620 nm, 665 nm, 674 nm, 685 nm, 709 nm, 754 nm, 768 nm, 779 nm, 865 nm, 884 nm, and 1016 nm. These bands are denoted as b1 to b17, and transformations such as reciprocal, exponential, square, and square root are applied to each of the 17 bands.
(2) Remote Sensing Indices: Hu et al. [34] developed the Floating Algae Index (FAI) for monitoring algal blooms in water bodies, which have a close relationship with nutrient concentrations [22]. Due to the absence of the Short-Wave Infrared (SWIR) band in OLCI, the Near-Infrared (NIR) band is used as a substitute, resulting in the creation of the Adjusted FAI (AFAI) [35]. Additionally, the Cyanobacteria and Macrophytes Index (CMI) is employed to differentiate cyanobacterial bloom areas and aquatic vegetation areas, while the Turbid Water Index (TWI) is used to assess turbid water bodies [36]. The formulas for calculating these indices are as follows:
A F A I = R N I R [ R R E D + ( R N I R 2 R R E D ) × ( λ N I R 1 λ R E D ) / ( λ N I R 2 λ R E D ) ]
C M I = R G R E E N [ R B L U E + ( R S W I R R B I L E ) × ( λ G R E E N λ B L U E ) / ( λ S W I R λ B L U E ) ]
T W I = R R E D R S W I R
Among these, λBLUE, λGREEN, λRED, λNIR1, λNIR2, λSWIR correspond to the center wavelengths of 430 nm, 560 nm, 665 nm, 754 nm, 865 nm, and 1016 nm in OLCI, respectively.
Based on the above, five approaches are constructed using the original bands and transformations, such as reciprocal, exponential, square, and square root, in Table 2. In addition, the AFAI, CMI, and TWI indices are included as variables. In total, each scheme consists of 20 variables, and XGBoost models are built for each approach. Each approach’s input variables are marked with an ID (please refer to Supplementary Material Table S2 for details).

2.3.2. Algorithm

The XGBoost algorithm was employed to establish a remote sensing algorithm for inversing estimation of phosphorus concentration in the Yangtze-Huaihe region. XGBoost, proposed by Chen et al. [37] in 2016, is an algorithm based on gradient boosting decision trees optimization. The core idea of this algorithm is to utilize gradient information to progressively improve the predictive capability of the model by constructing decision trees. In each iteration, the XGBoost algorithm calculates residuals based on the model’s predictions from the previous round and then fits new decision trees to these residuals. Through continuous iterations, new decision trees are added, and their prediction results accumulate. In addition, it controls the model’s complexity and prevents overfitting, while improving model runtime speed by introducing regularization terms. In this study, the XGBoost algorithm was implemented using the Scipy library in Python 3.9. To determine the structure of the XGBoost model, multiple hyperparameters need to be adjusted, including learning rate, maximum tree depth, subsample, and regularization. After debugging, the final parameters were set as learning rate of 0.02, max tree depth of 7 layers, subsample of 0.8, and regularization of 0.01, with other parameters set to default values.
Before constructing the algorithm, the importance index of input variables, referred to as IncMSE (increase in mean squared error), needs to be calculated. A higher IncMSE value indicates greater importance of the variable. The accuracy of IncMSE increases with a larger number of random iterations, but at the cost of longer computation time. In this study, 300 iterations were selected. For each scheme, the variables were sorted in descending order based on the calculated IncMSE scores, and then sequentially inputted into the algorithm. The approach with higher accuracy was selected based on model evaluation metrics through cross-validation.

2.4. Model Evaluation

2.4.1. K-Fold Cross-Validation

K-fold cross-validation is widely regarded as a common method for assessing the performance and reliability of machine learning models [38]. It effectively addresses the issue of parameter tuning and prevents information leakage from influencing the model’s hyperparameters. The entire dataset is divided into K equally sized subsets, and in each iteration, one subset is used as the validation set while the remaining K-1 subsets are used for training. This process is repeated K times, allowing for model training and evaluation. The average of the evaluation metrics obtained from the K iterations is considered as the final evaluation metric.

2.4.2. Algorithm Accuracy Evaluation

The model accuracy is evaluated using the following metrics: coefficient of determination (R2), root mean squared error (RMSE), and mean absolute percentage error (MAPE). These metrics provide a comprehensive assessment of the model’s performance.
R 2 = ( ( x i x ¯ ) ( y i y ¯ ) ) 2 ( ( x i x ¯ ) 2 ( y i y ¯ ) 2
R M S E = 1 n 1 i 1 n ( x i y i ) 2
M A P E ( % ) = 1 n i 1 n y i x i y i × 100 %

2.5. Spatial-Temporal Distribution Analysis

A total of 882 cloud-free or partially cloud-free OLCI images were selected from 2017 to 2022 in the Yangtze-Huaihe region (Table 3). The machine learning algorithm was applied to estimate the TP concentration in each lake based on the Yangtze-Huaihe region dataset. Firstly, monthly TP concentrations were calculated for each lake per year and per month. Secondly, the average TP concentrations were determined for each lake across seasons (Spring: from March to May, Summer: from June to August, Autumn: from September to November, Winter: from December to February). Additionally, the mean TP concentration was calculated for each 12’ latitude and longitude grid cell, and the results were visualized. The lakes were classified into four categories based on their surface area: large lakes (>500 km2), medium lakes (100–500 km2), medium-small lakes (50–100 km2), and small lakes (20–50 km2). The spatial–temporal variations of TP concentration in the Yangtze-Huaihe region were analyzed accordingly.

3. Results

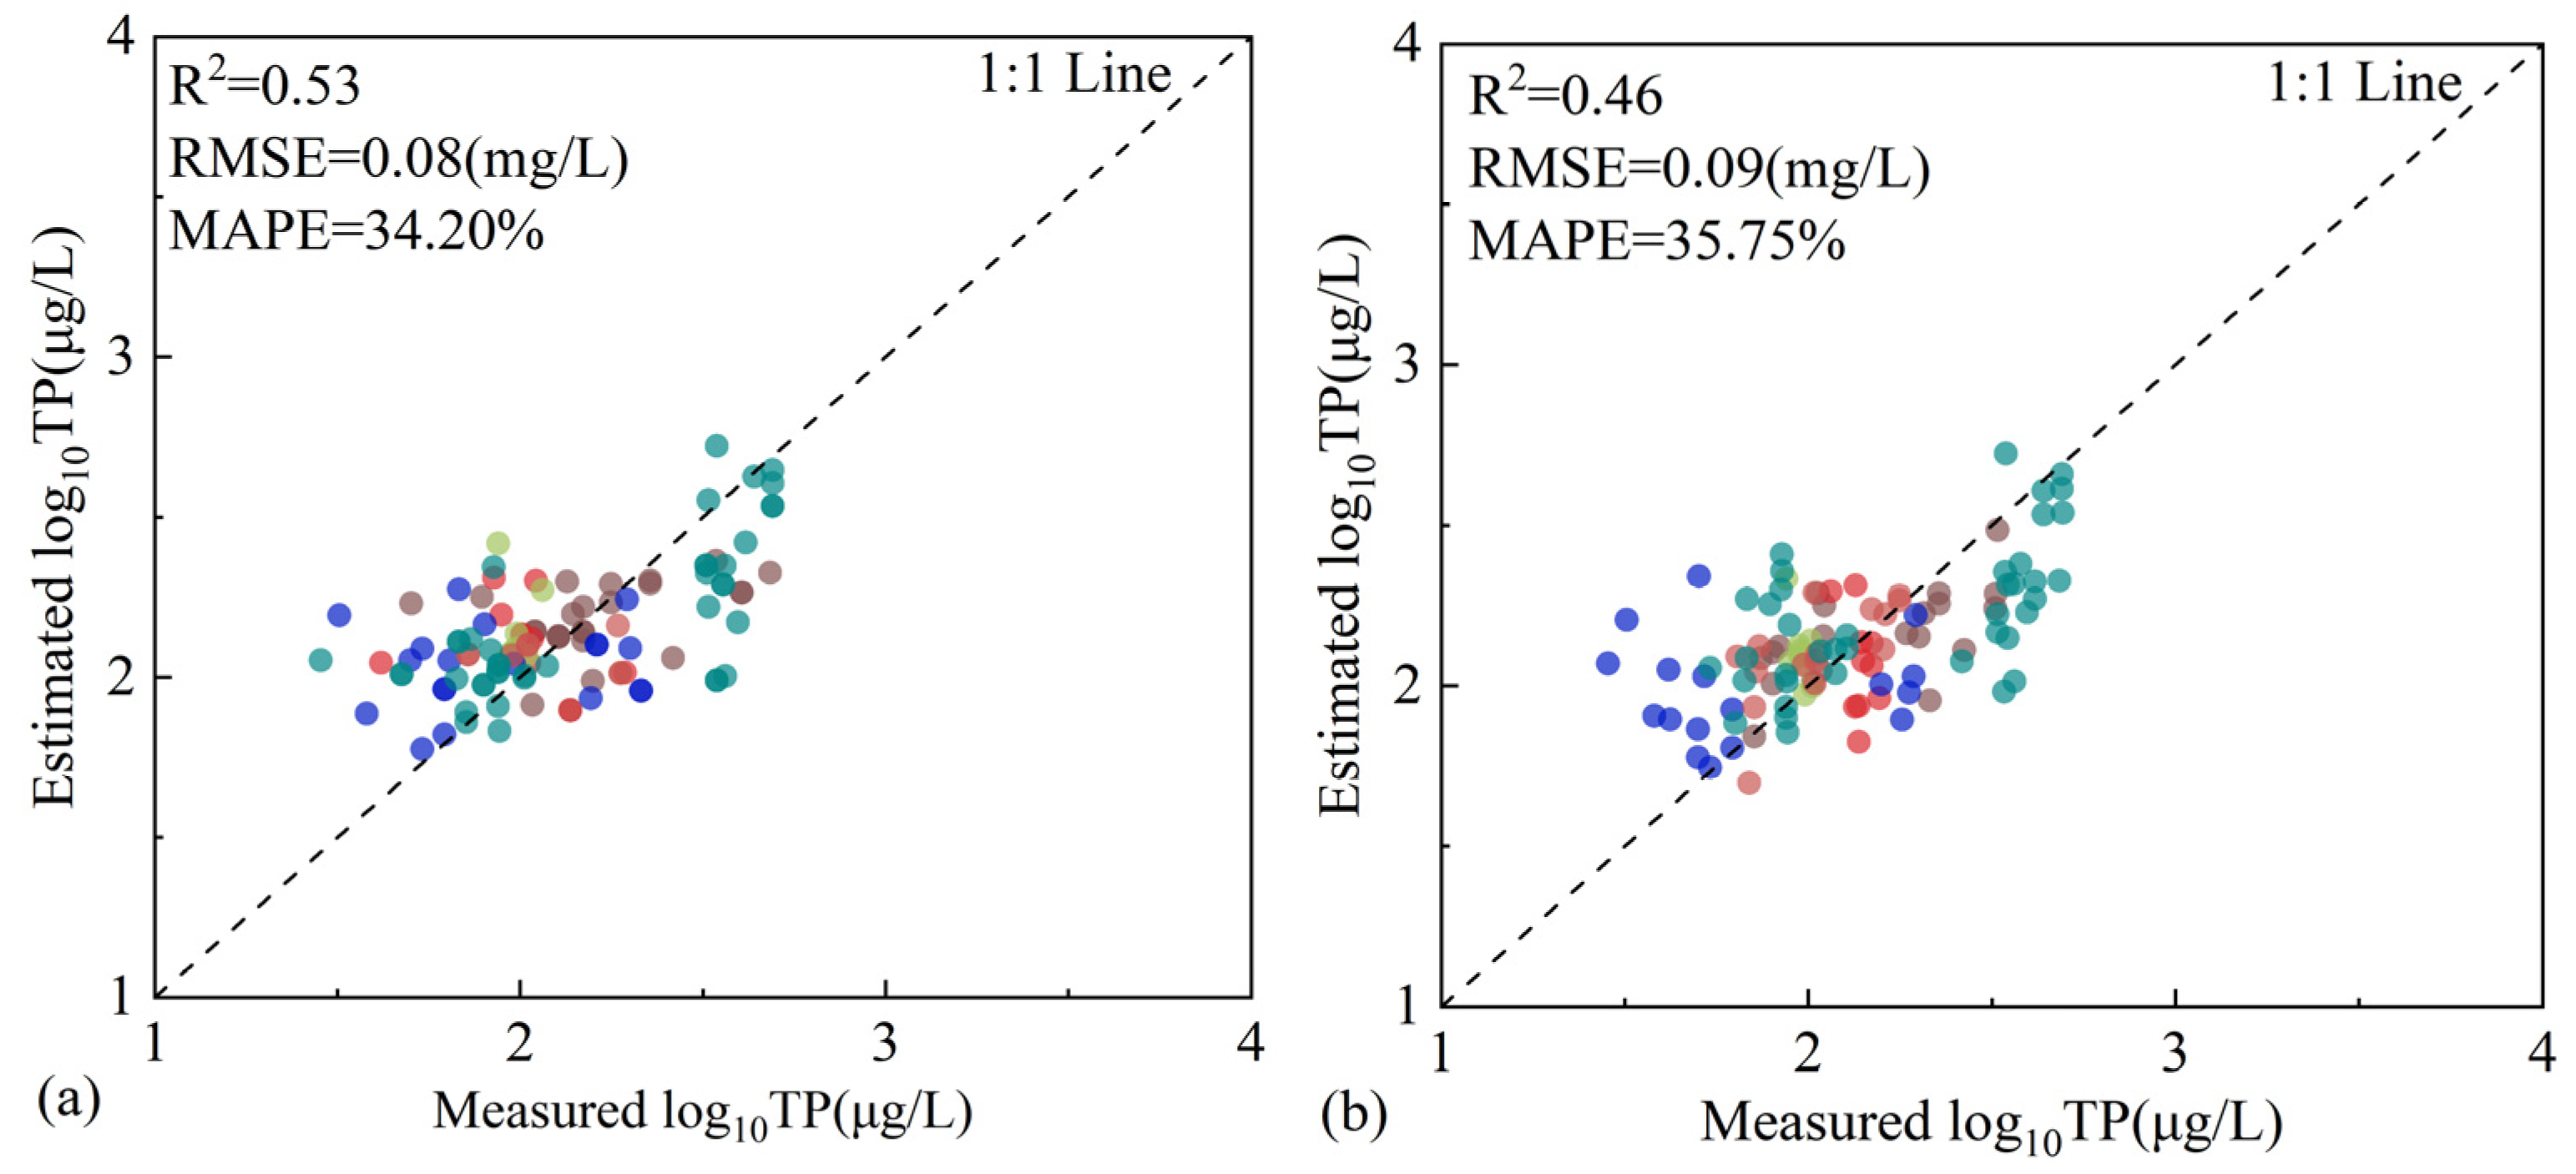
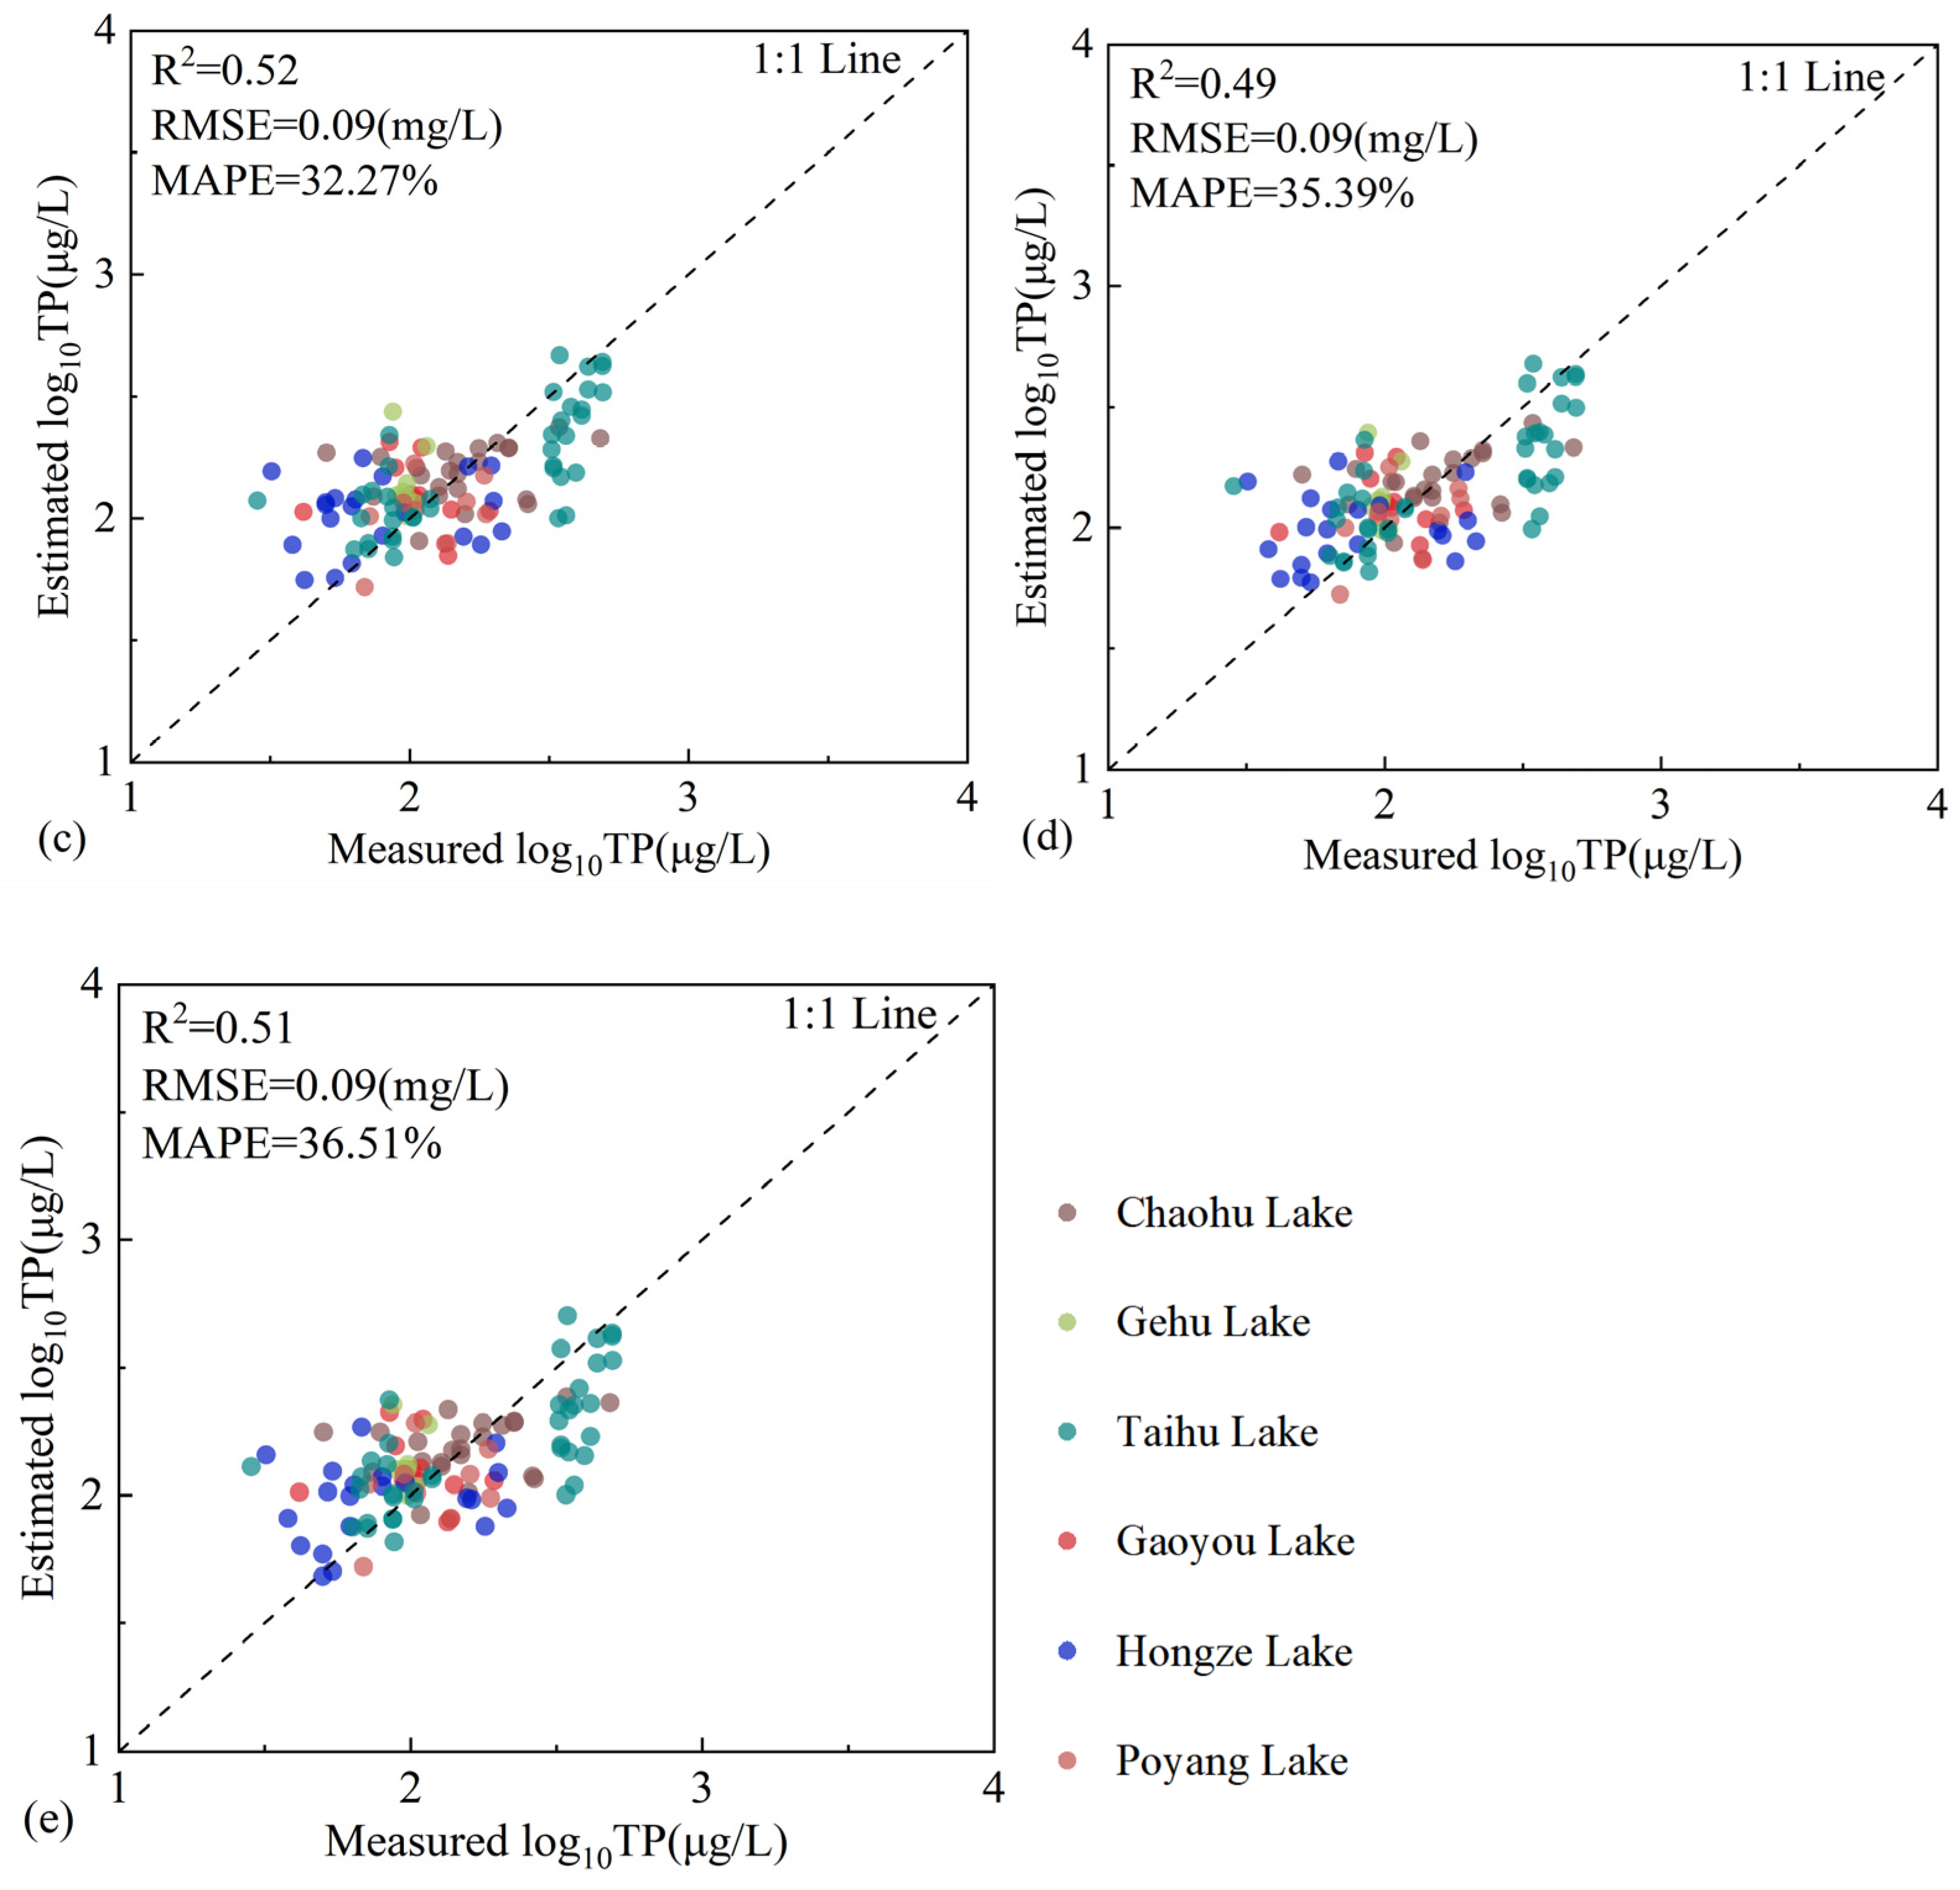
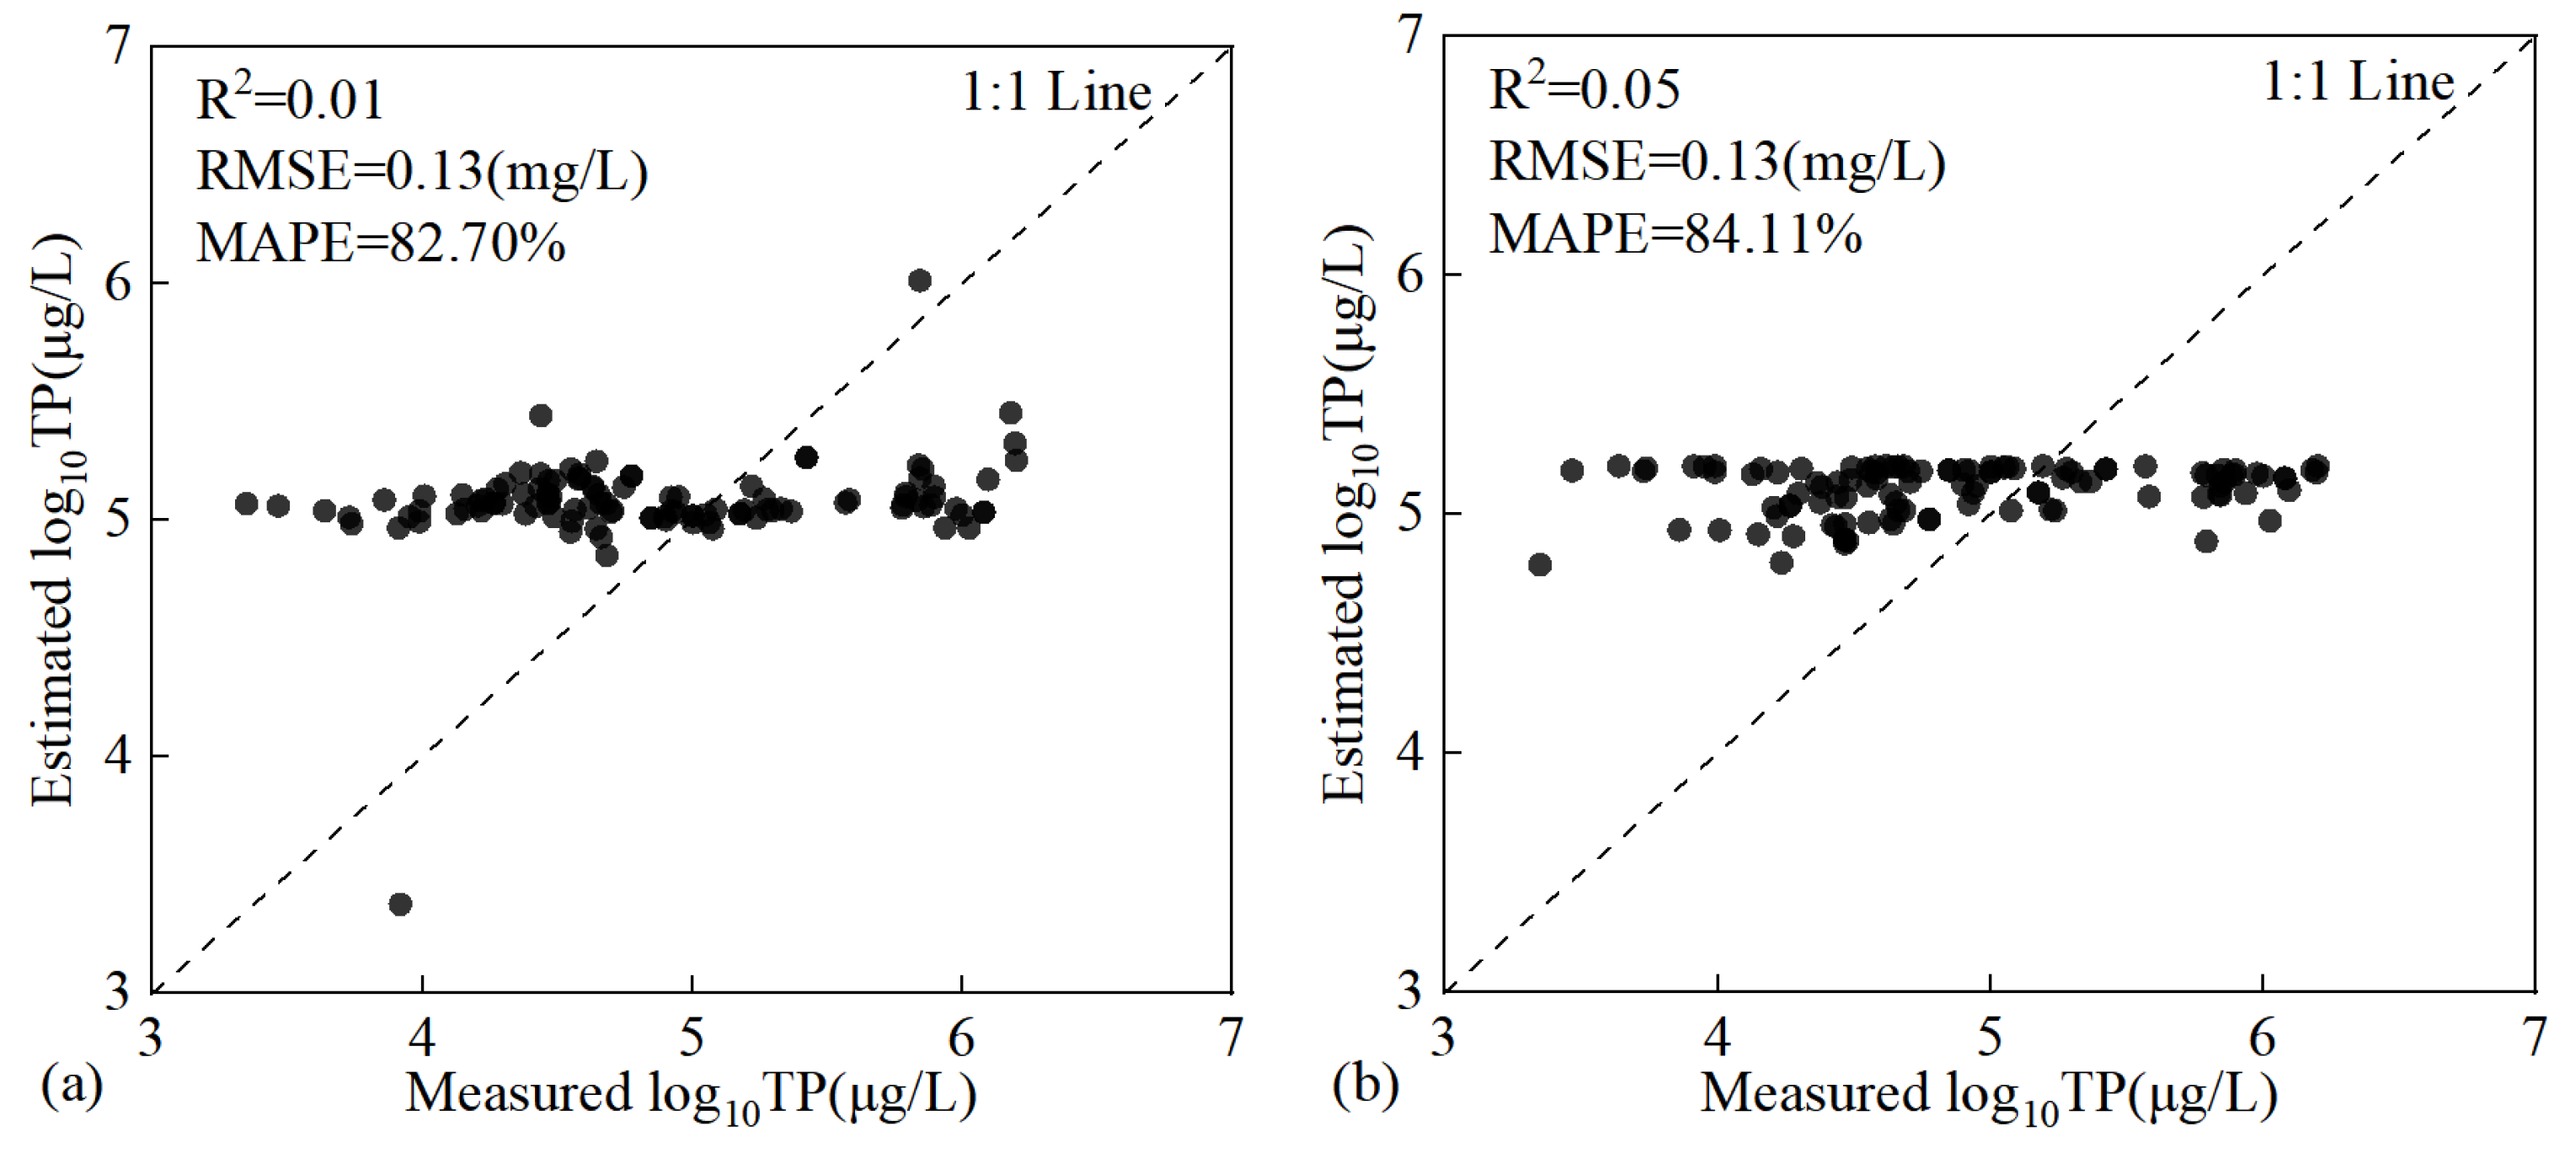
3.1. Model Accuracy Evaluation

The results of the variable importance index calculations for the five schemes are provided (Supplementary Material Figure S1). Based on the variable importance index, the variables were input into the algorithm in descending order of importance. The training sets of the machine learning algorithms exhibited high fitting accuracy, considering only the accuracy of the validation set. The fitting results were similar for the five scenarios and AFAI, b8, b4, b6, and b11 were selected for all of them, indicating that these five variables are important factors in estimating TP concentrations.
Based on the results of 5-fold cross-validation and scatter plot distributions, as seen in Figure 2, Approach 1 demonstrated higher accuracy and smaller errors (R2 = 0.53, RMSE = 0.08, MAPE = 34.20%). The scatter plot distribution of approach 1 was more concentrated. Therefore, the AFAI, b8, b4, b6, b11, b17, b14, b2, and CMI were selected as input variables to construct the model for TP concentration estimation.

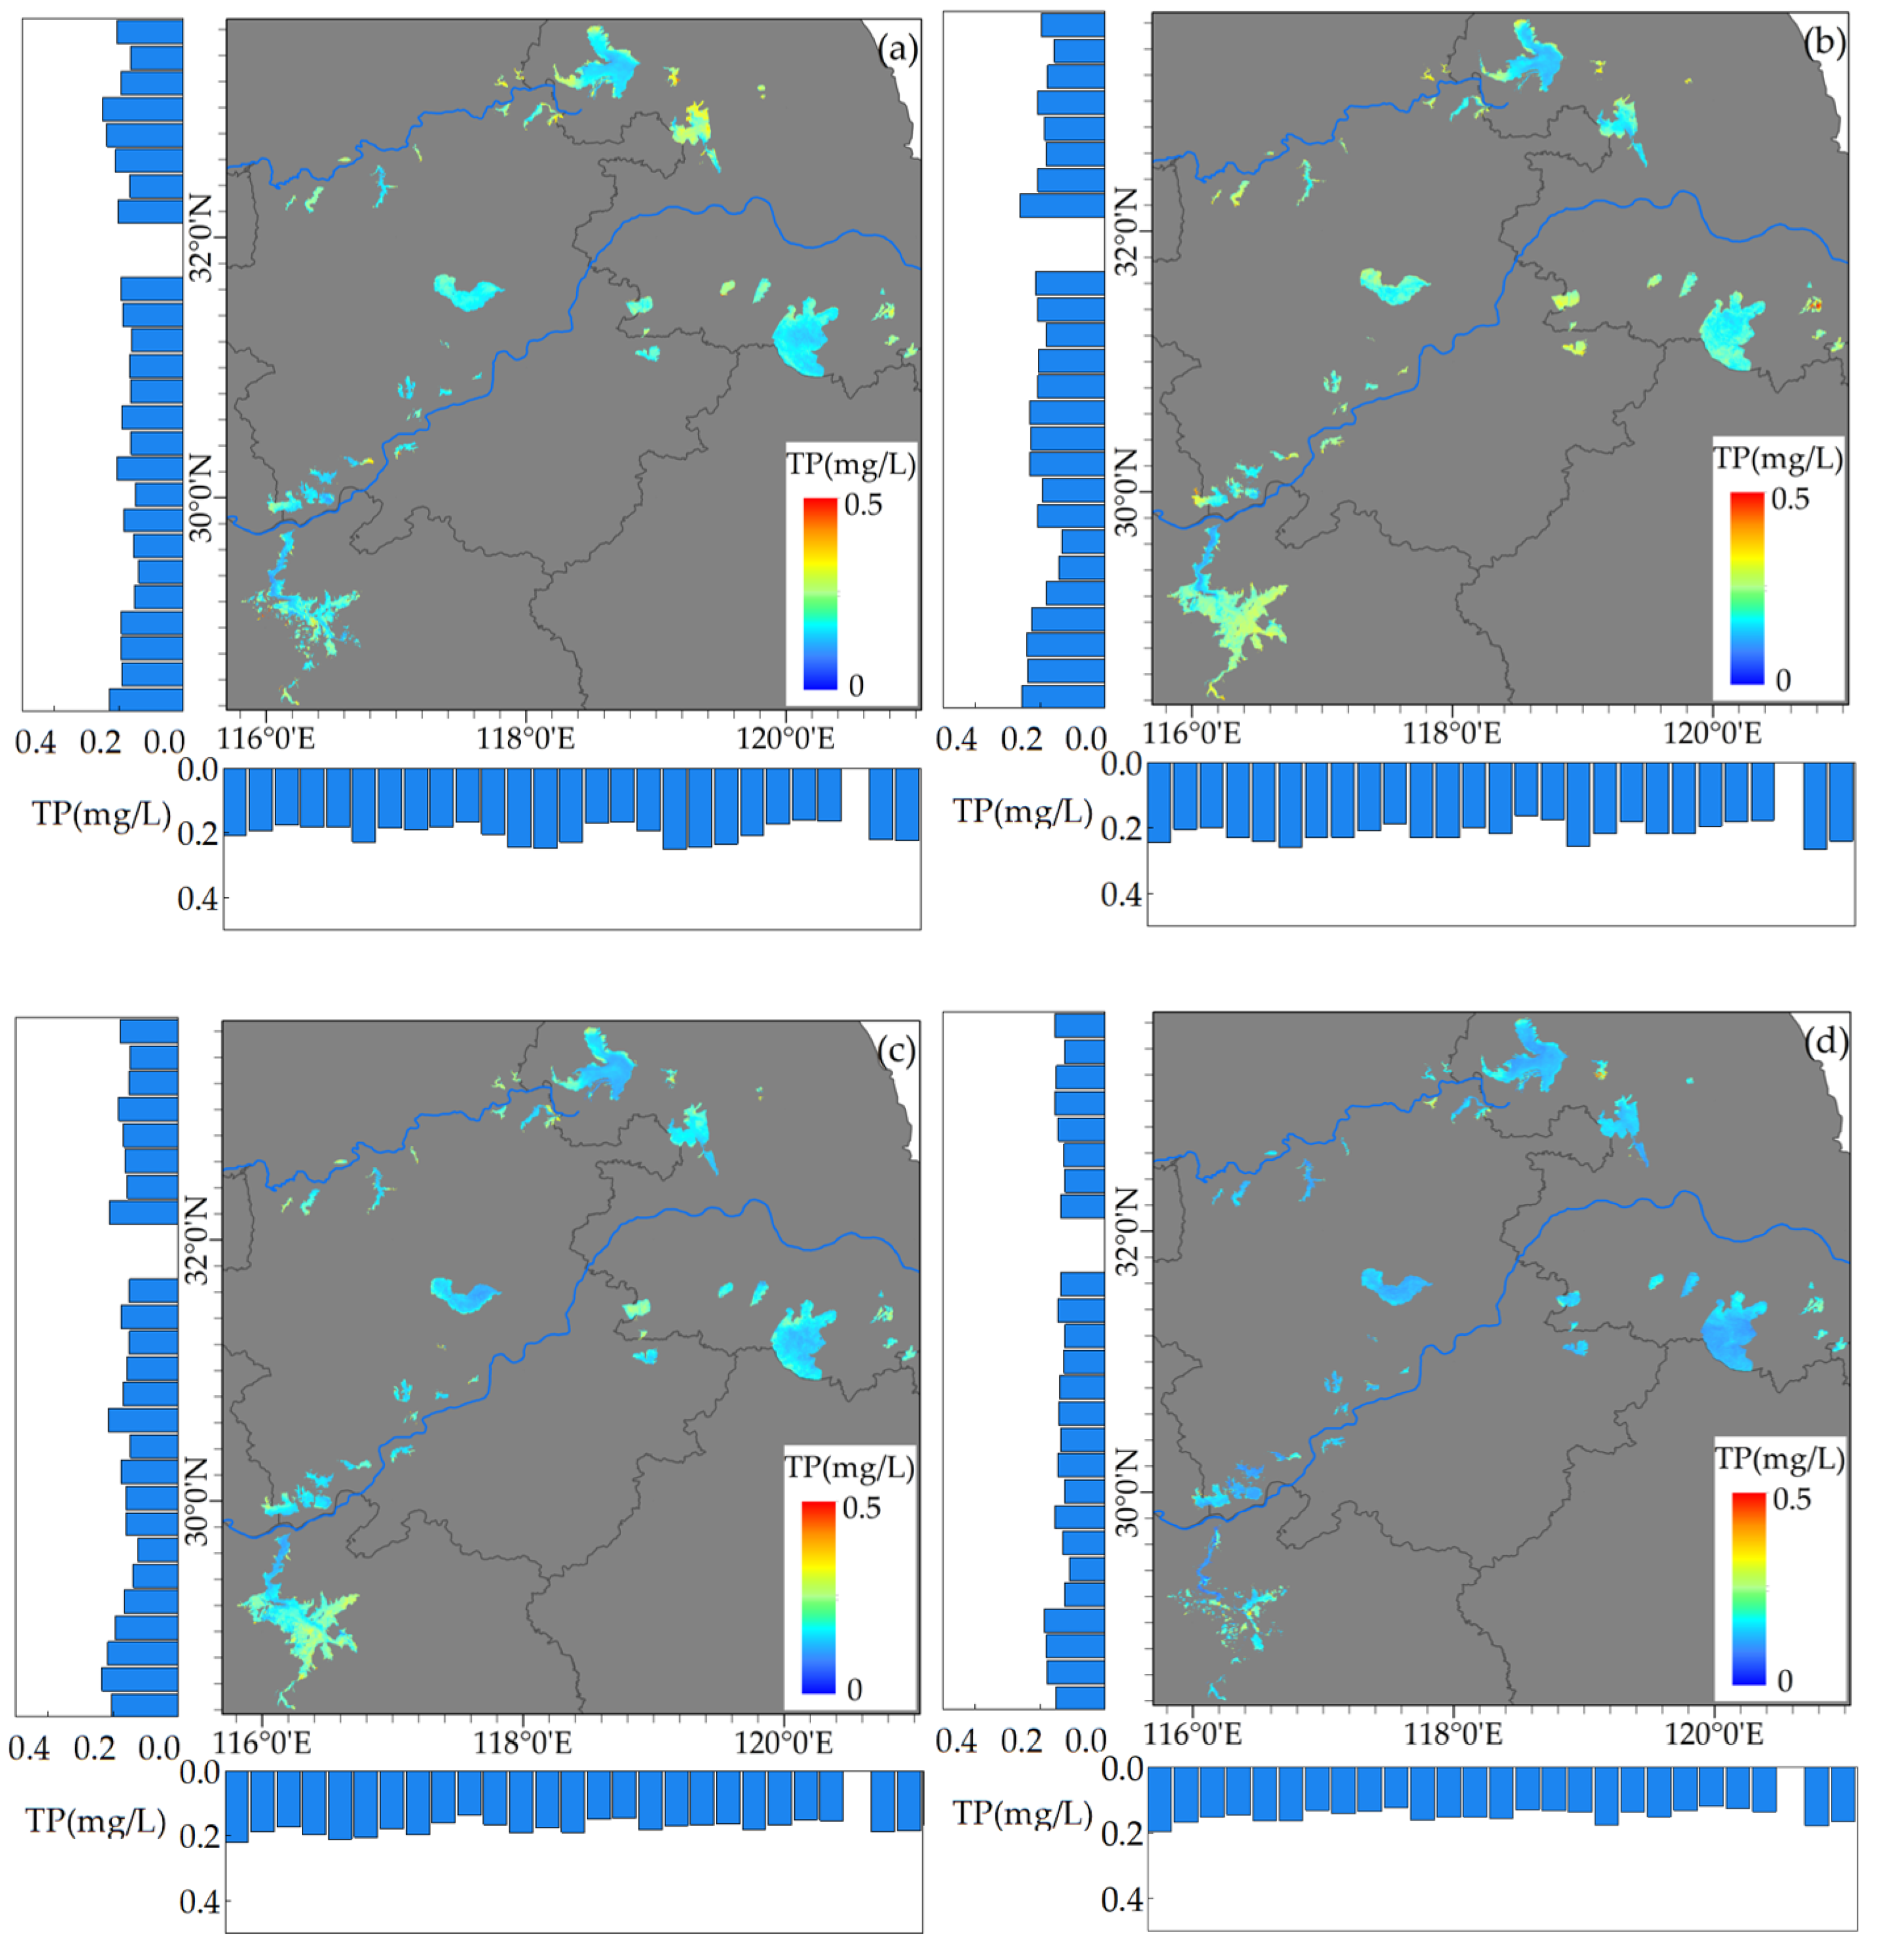
3.2. Spatial Distribution of TP Concentration in the Yangtze-Huaihe Region

The seasonal variations in TP concentration in the lakes of the Yangtze-Huaihe region during the period 2017–2022 are depicted (Figure 3). The average TP concentrations were relatively higher during the spring (0.21 mg/L) and summer (0.23 mg/L) seasons, while they are lower during autumn (0.19 mg/L) and winter (0.15 mg/L), surpassing the threshold for algal bloom occurrence (0.08 mg/L) [39].
In terms of spatial distribution, smaller lakes near Taihu Lake, Hongze Lake, and Poyang Lake exhibited comparatively higher TP concentrations. The average TP concentration near the lake shore was significantly higher than that in the centre of the lake. Regarding the longitude, the fluctuation trends remained consistent throughout the four seasons. Within the longitude ranges of 117°0′–117°48′E, 118°36′–119°0′E, and 120°0′–120°36′E, which include the western part of Poyang Lake, the smaller lakes between Poyang Lake and Chaohu Lake, and Taihu Lake, the average TP concentrations are relatively lower.
Analyzing the distribution based on latitude, the southern part of Poyang Lake at 29°24′N exhibited higher TP concentrations during spring and summer. Conversely, the northern part of Poyang Lake between 29°36′ and 30°0′N showed lower TP concentrations. Additionally, the northern part of Hongze Lake at 33°48′N consistently displayed higher TP concentrations in all four seasons.

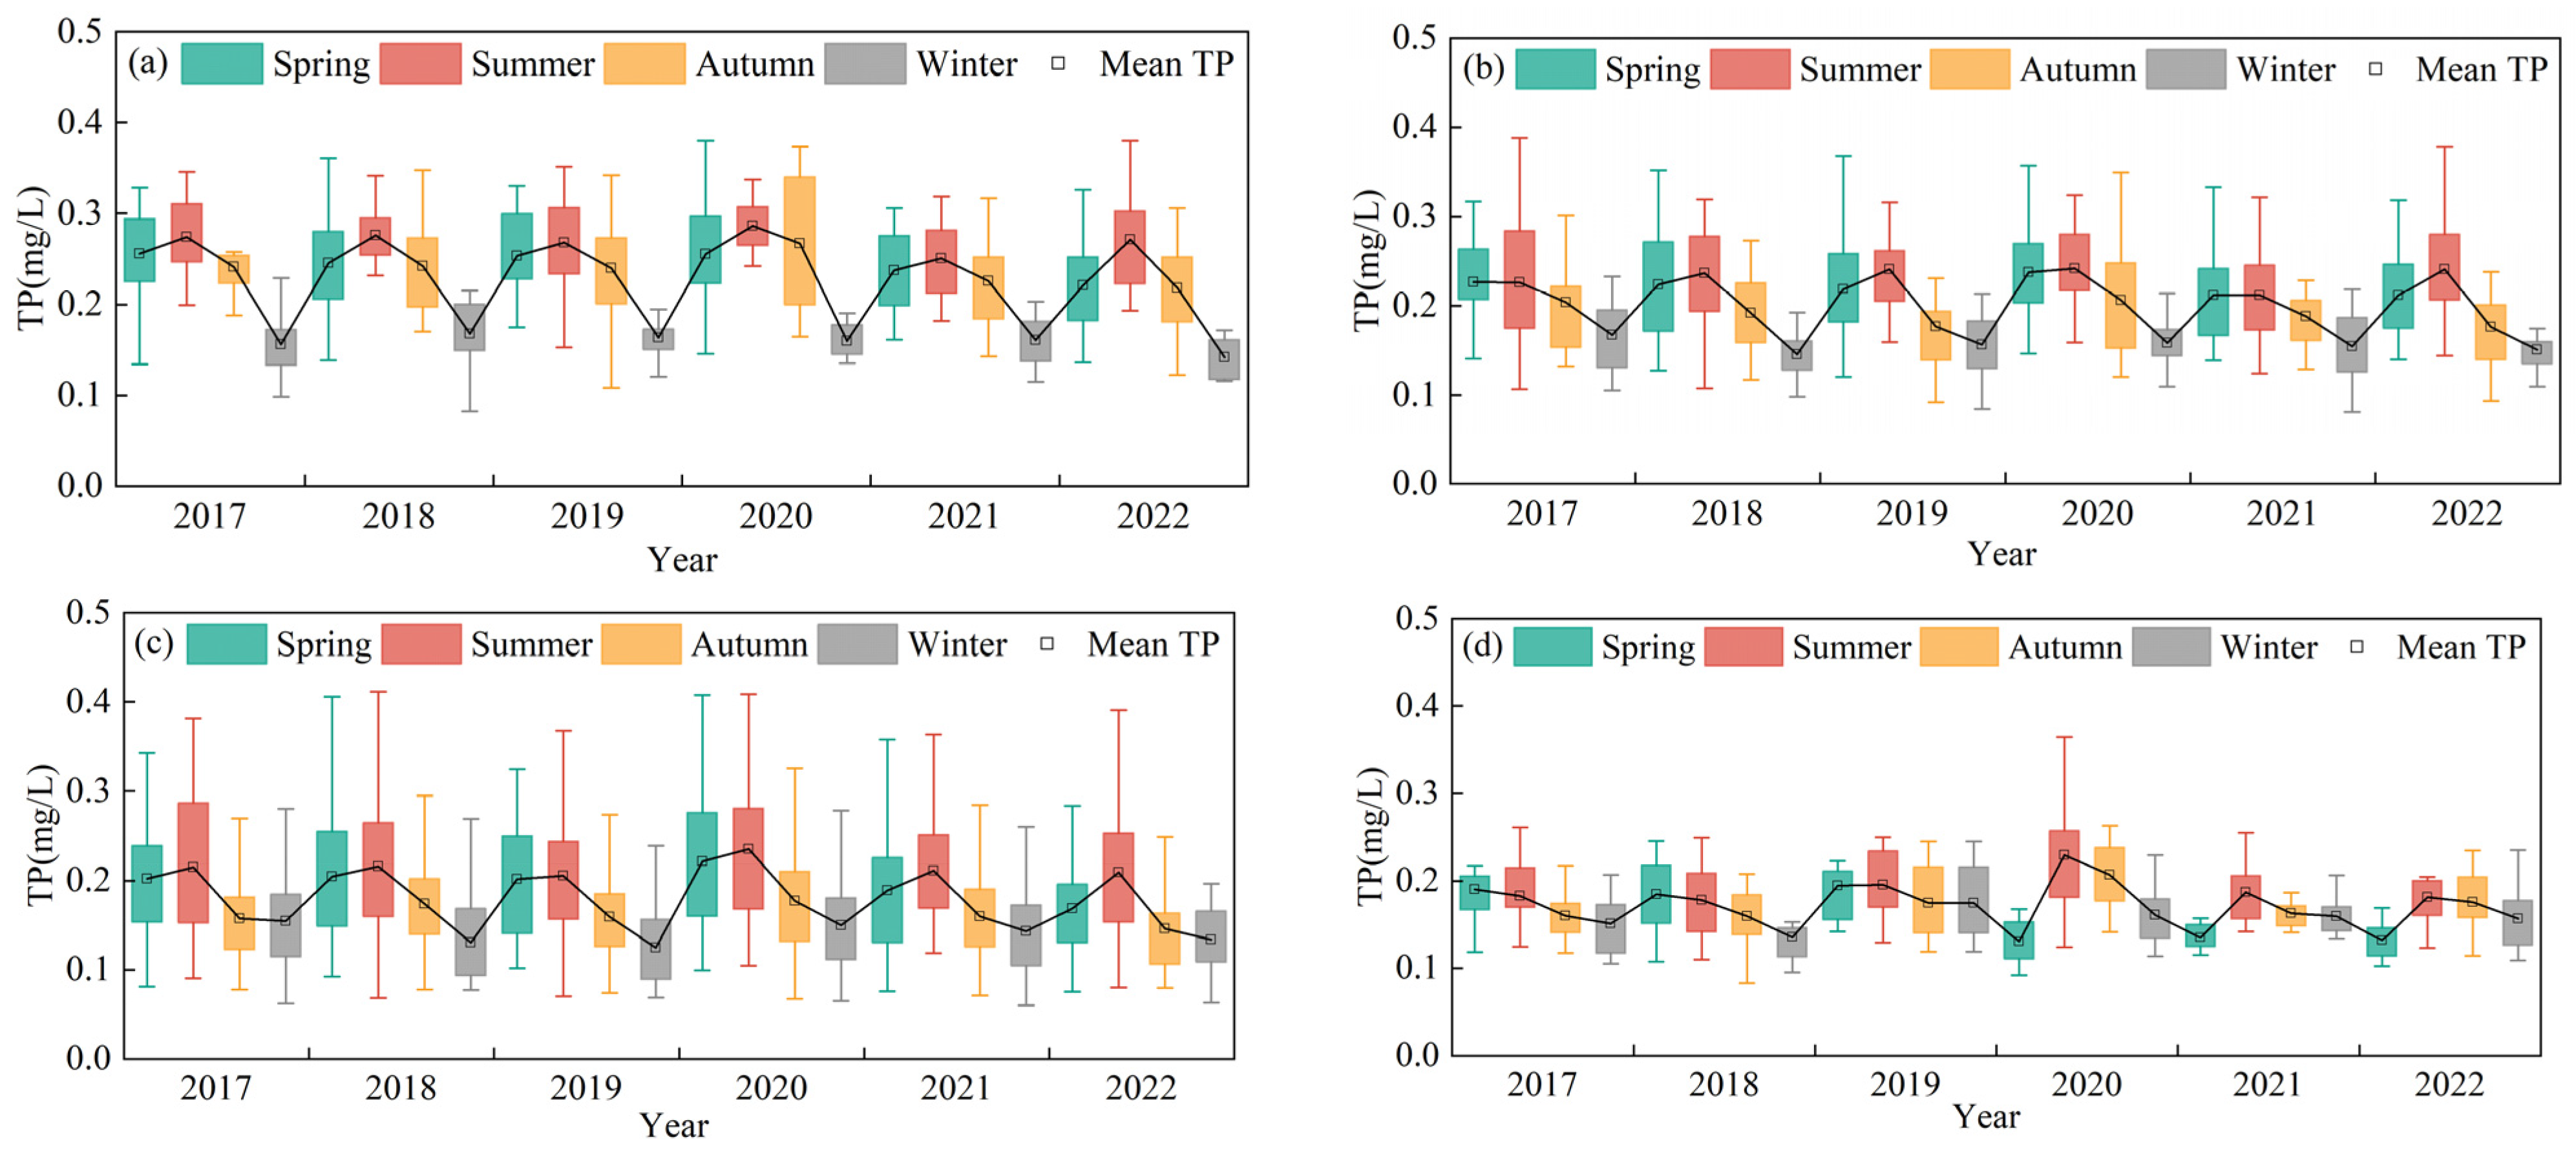
3.3. Temporal Variation of TP Concentration in Lakes of Different Sizes

Figure 4 shows the temporal variation in TP concentrations in lakes of different sizes across the Yangtze-Huaihe region from 2017 to 2022. The large lakes exhibited a distinct pattern, with higher TP concentrations during spring and summer and lower concentrations during autumn and winter from 2017 to 2019. However, from 2020 to 2022, the TP concentrations in large lakes increased during summer and autumn and decreased during spring and winter. Other lake types displayed a consistent pattern over the six-year period, with higher TP concentrations during spring and summer and lower concentrations during autumn and winter.
Large lakes showed relatively weak and stable seasonal variations, with average TP concentrations ranging from 0.13 to 0.23 mg/L. The highest TP concentration of 0.23 mg/L was recorded during the summer of 2020. Medium and medium-small lakes exhibited larger variation amplitudes than large lakes, and their average TP concentrations during spring and summer were generally higher than 0.20 mg/L. For medium-sized lakes, the highest TP concentration of 0.18 mg/L was observed during autumn 2020, and during winter, TP concentrations remained below 0.15 mg/L. Medium-small lakes showed average TP concentrations ranging from 0.18 to 0.21 mg/L during the autumn and between 0.15 and 0.17 mg/L during the winter. Small lakes displayed the most significant seasonal variation and had higher average TP concentrations, with concentrations above 0.20 mg/L during the spring, summer, and autumn, and between 0.15 and 0.17 mg/L in winter.
Across lakes of different sizes, TP concentrations peaked during the summer of 2020, and TP concentrations during autumn were also higher than those in other years in the same season.

4. Discussion

4.1. Comparison with Other Algorithms

To compare the accuracy of the XGBoost model developed in this study, which is based on both field measurements and OLCI images, we selected two existing empirical models [40,41] that have shown good performance in turbid inland waters, as shown in Table 4. While the existing algorithms achieved high accuracy in specific lakes, with R2 values above 0.80, their effectiveness in large-sized regions was not satisfactory, with R2 values below 0.10, RMSE of 0.13 mg/L, and MAPE exceeding 50% (Figure 5). Therefore, these models are unsuitable for TP concentration retrieval in large-sized regions.
However, machine learning also has certain limitations when it comes to estimating TP concentration. Insufficient sample size in the training dataset can affect the accuracy and generalization ability of the model [42]; additionally, different types of lakes can also influence the model’s accuracy [43]. Therefore, cross-validation is employed to divide the dataset into different training and validation sets to minimize the impact of sample size on model performance and enhance its generalization ability [44,45]. Li et al. [46] utilized 67 samples to construct a machine learning model for estimating the concentration of TP in water bodies, while Ding et al. [47] constructed an XGBoost model for estimating TP concentration in Nanyi Lake using 78 samples, both achieving good results. This suggests that, by selecting suitable algorithms and employing appropriate processing methods, machine learning can still yield good validation results even with a limited number of samples. Although the R2 value of the XGBoost model in this study reached above 0.50, it exhibited differences in estimating results for different types of lakes. Specifically, there was a tendency for overestimation of TP concentration in Gaoyou, Hongze, and Gehu Lake when TP concentrations were low, while there was noticeable underestimation of high TP concentration in Taihu Lake. When comparing the water quality of these lakes, it was found that TSM concentrations were higher in Gaoyou, Hongze and Gehu Lake, while Chl-a concentrations were higher in Taihu Lake (Figure 6), which illustrates that the model in this study tended to overestimate in lakes dominated by non-algal particles, such as Gaoyou, Hongze and Gehu Lake [48], while it underestimated in lakes dominated by phytoplankton, such as Taihu Lake [43]. Currently, few researchers use machine learning to estimate the properties of lakes with different optical characteristics. The number of sampling sites used in this study is limited, so this model has some limitations.
Based on the above findings, no machine-learning model has been specifically developed for TP concentration estimation in lake groups. To enhance the accuracy of the model, future research should focus on increasing the number of sampling points and classifying water bodies based on their optical properties.

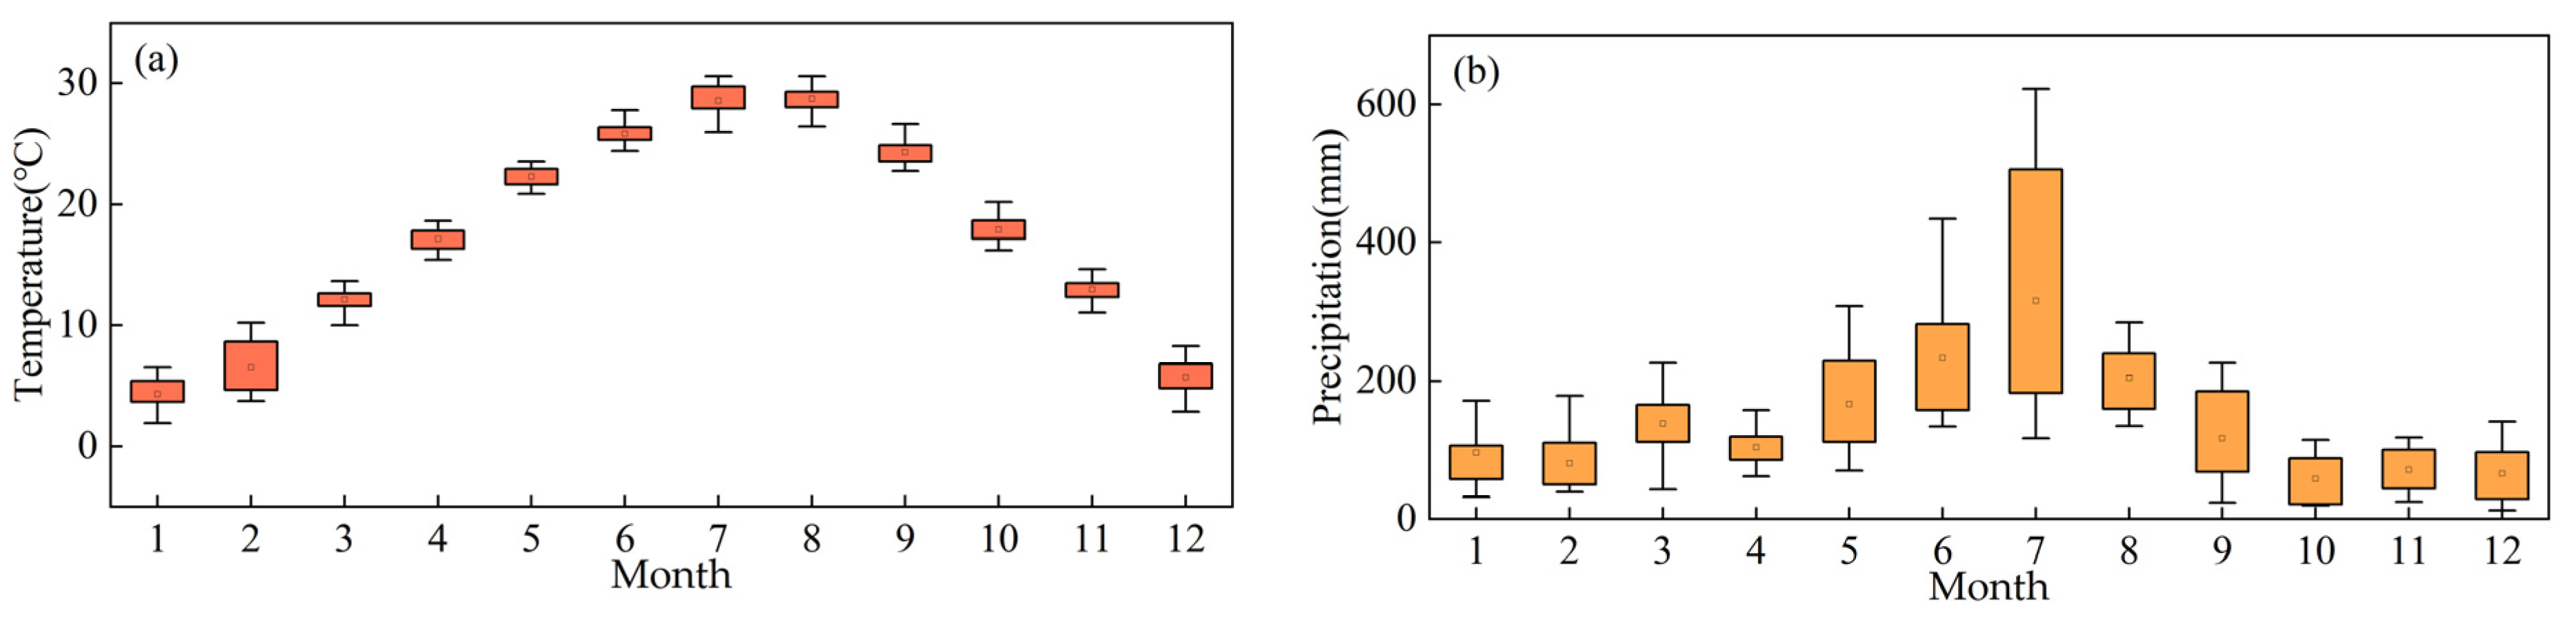
4.2. Drivers Analysis

From the perspective of climate change (Figure 7), meteorological factors such as temperature and precipitation directly or indirectly influence nutrient concentrations [49,50]. As the temperature increases, the release rate of nutrients from lake sediments accelerates, leading to an increase in TP concentration in the water. Furthermore, despite the dilution effect of rainfall on lake TP concentration, extreme rainfall events can generate significant external phosphorus loading [51]. During summer, floods are more frequent in the middle and lower reaches of the Yangtze River, while spring experiences higher rainfall and more rainy days compared to autumn [52], indicating that TP concentrations in lakes may be higher during spring and summer. In addition, it should be noted that the TP concentrations in different types of lakes were relatively high during the summer and autumn of 2020. This is attributed to the flooding that occurred in the Yangtze-Huaihe region in July, which resulted in the influx of excessive phosphorus loads into the lakes, directly causing an overall increase in TP concentrations and the accumulation of phosphorus in the sediments, thereby impacting subsequent water quality conditions [53].
Agricultural pollution can also contribute to the elevated TP concentrations in lakes. In the Yangtze-Huaihe region, the TP concentrations in lakes exhibited a trend of being higher in spring and summer and lower in autumn and winter. This pattern may be related to the double-cropping rice planting system in which fertilisers are applied to the soil during both the spring and summer seasons [54], resulting in a significant inflow of nutrients into lakes [55]. For large lakes, the changing trend in TP concentrations after 2020, characterised by higher levels in summer and autumn and lower levels in spring and winter, is mainly attributed to the time required for the ecological water quality recovery process after the removal of enclosure aquaculture in 2019 [56]. The ecosystem gradually improved after 2020, and a large number of planktonic organisms absorbed phosphorus and organic matter from the water during reproductive growth, leading to a significant decrease in TP concentrations during spring in large lakes. However, although medium- and small-sized lakes have responded positively to the effects of enclosure removal, the presence of large agricultural areas and dense human populations results in a significant discharge of domestic and industrial wastewater [57,58]. The decreasing trend in TP concentrations was not evident in medium and small lakes, highlighting the importance of pollution control and management in the inflow areas of these lakes.
In conclusion, both natural factors and human activities have distinct effects on seasonal and interannual variations in TP concentrations in lakes in the Yangtze-Huaihe region.

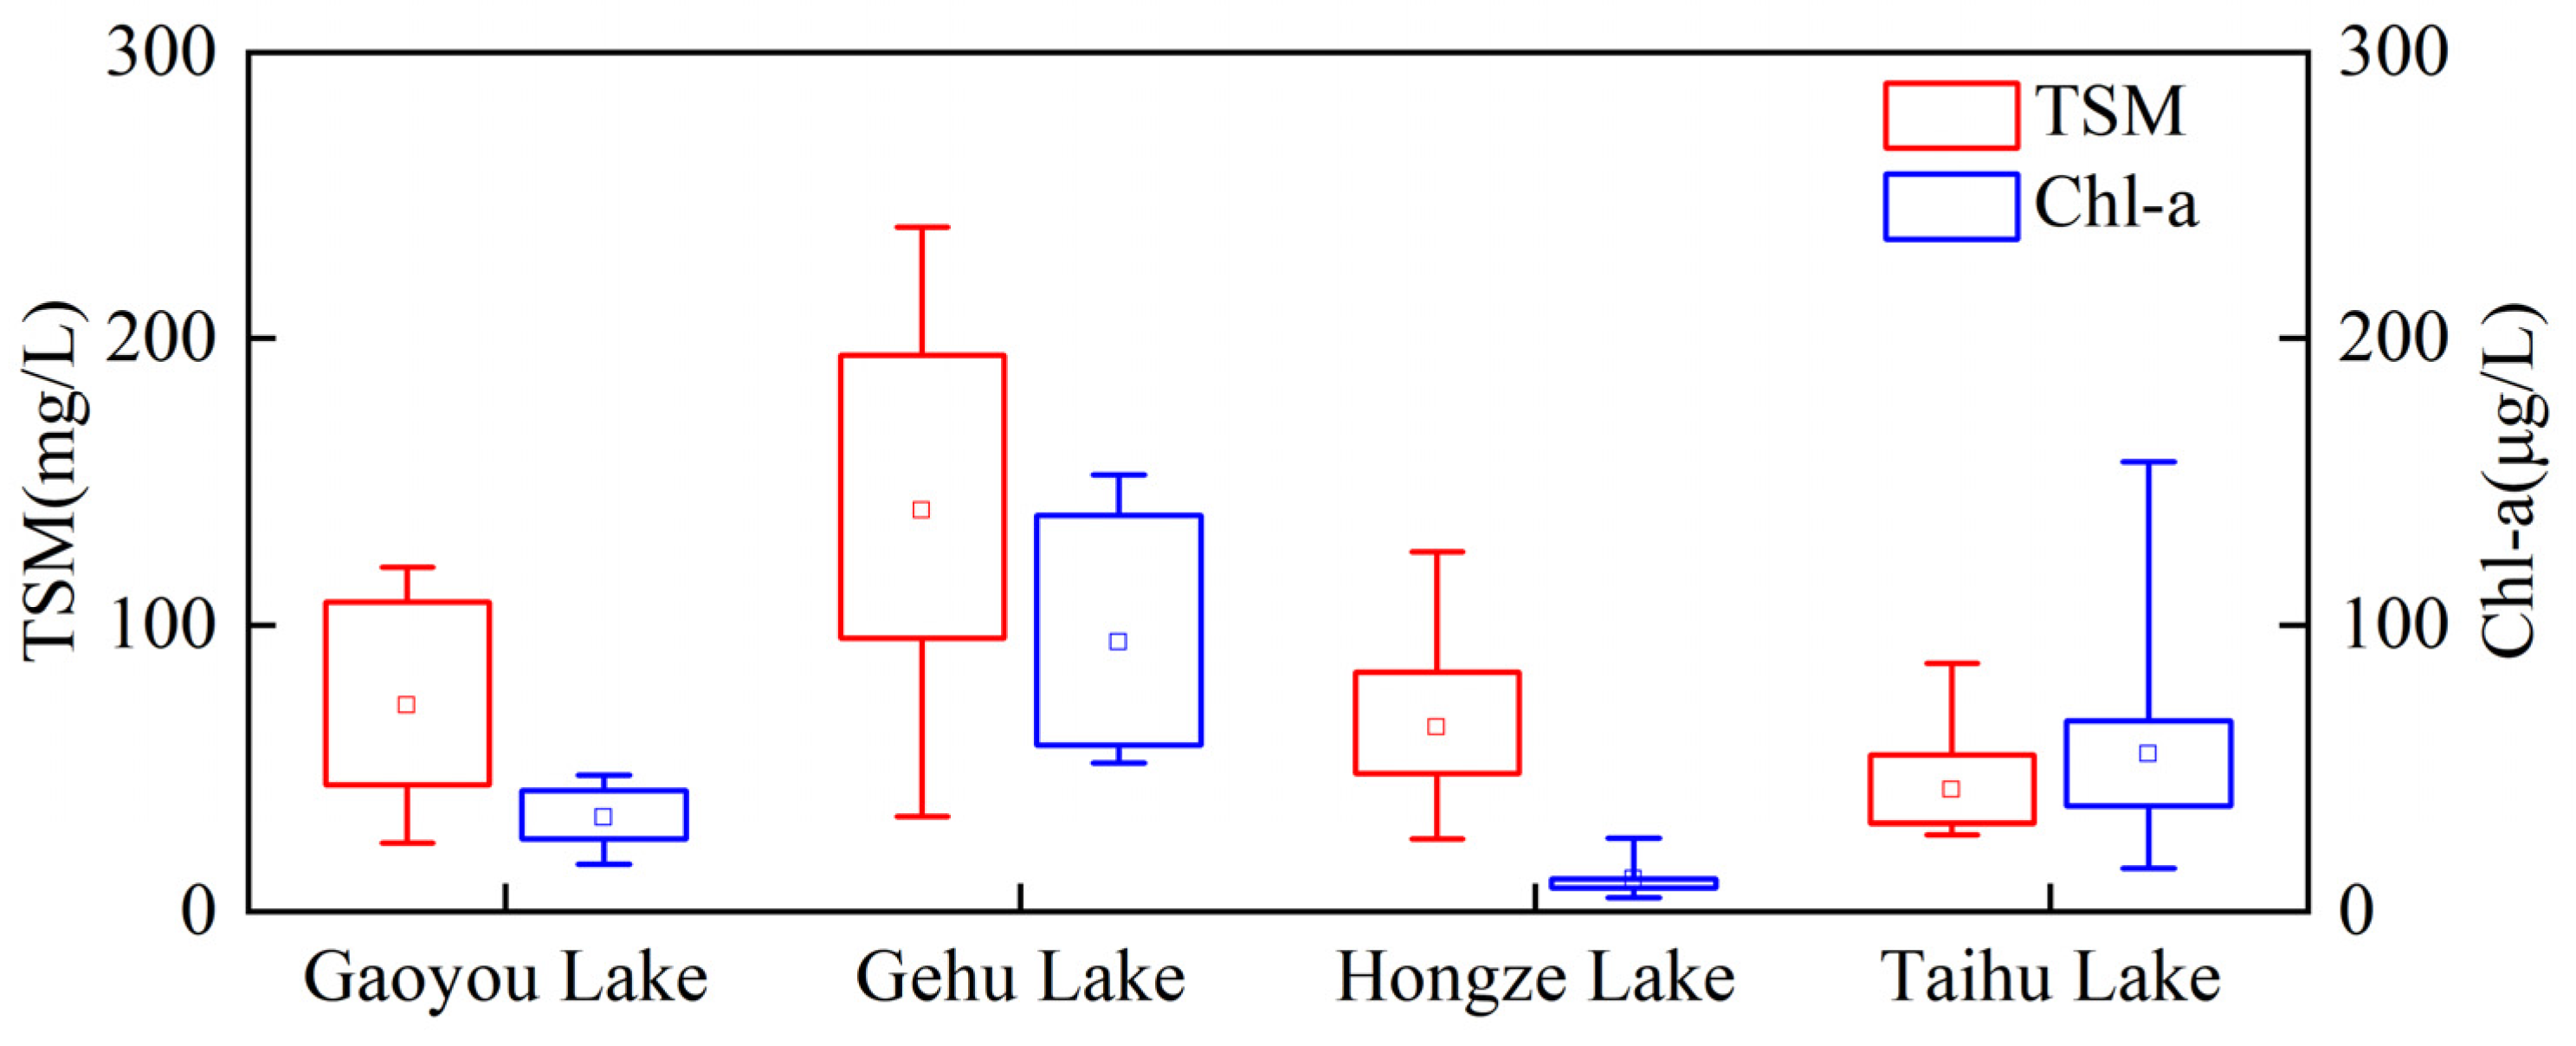
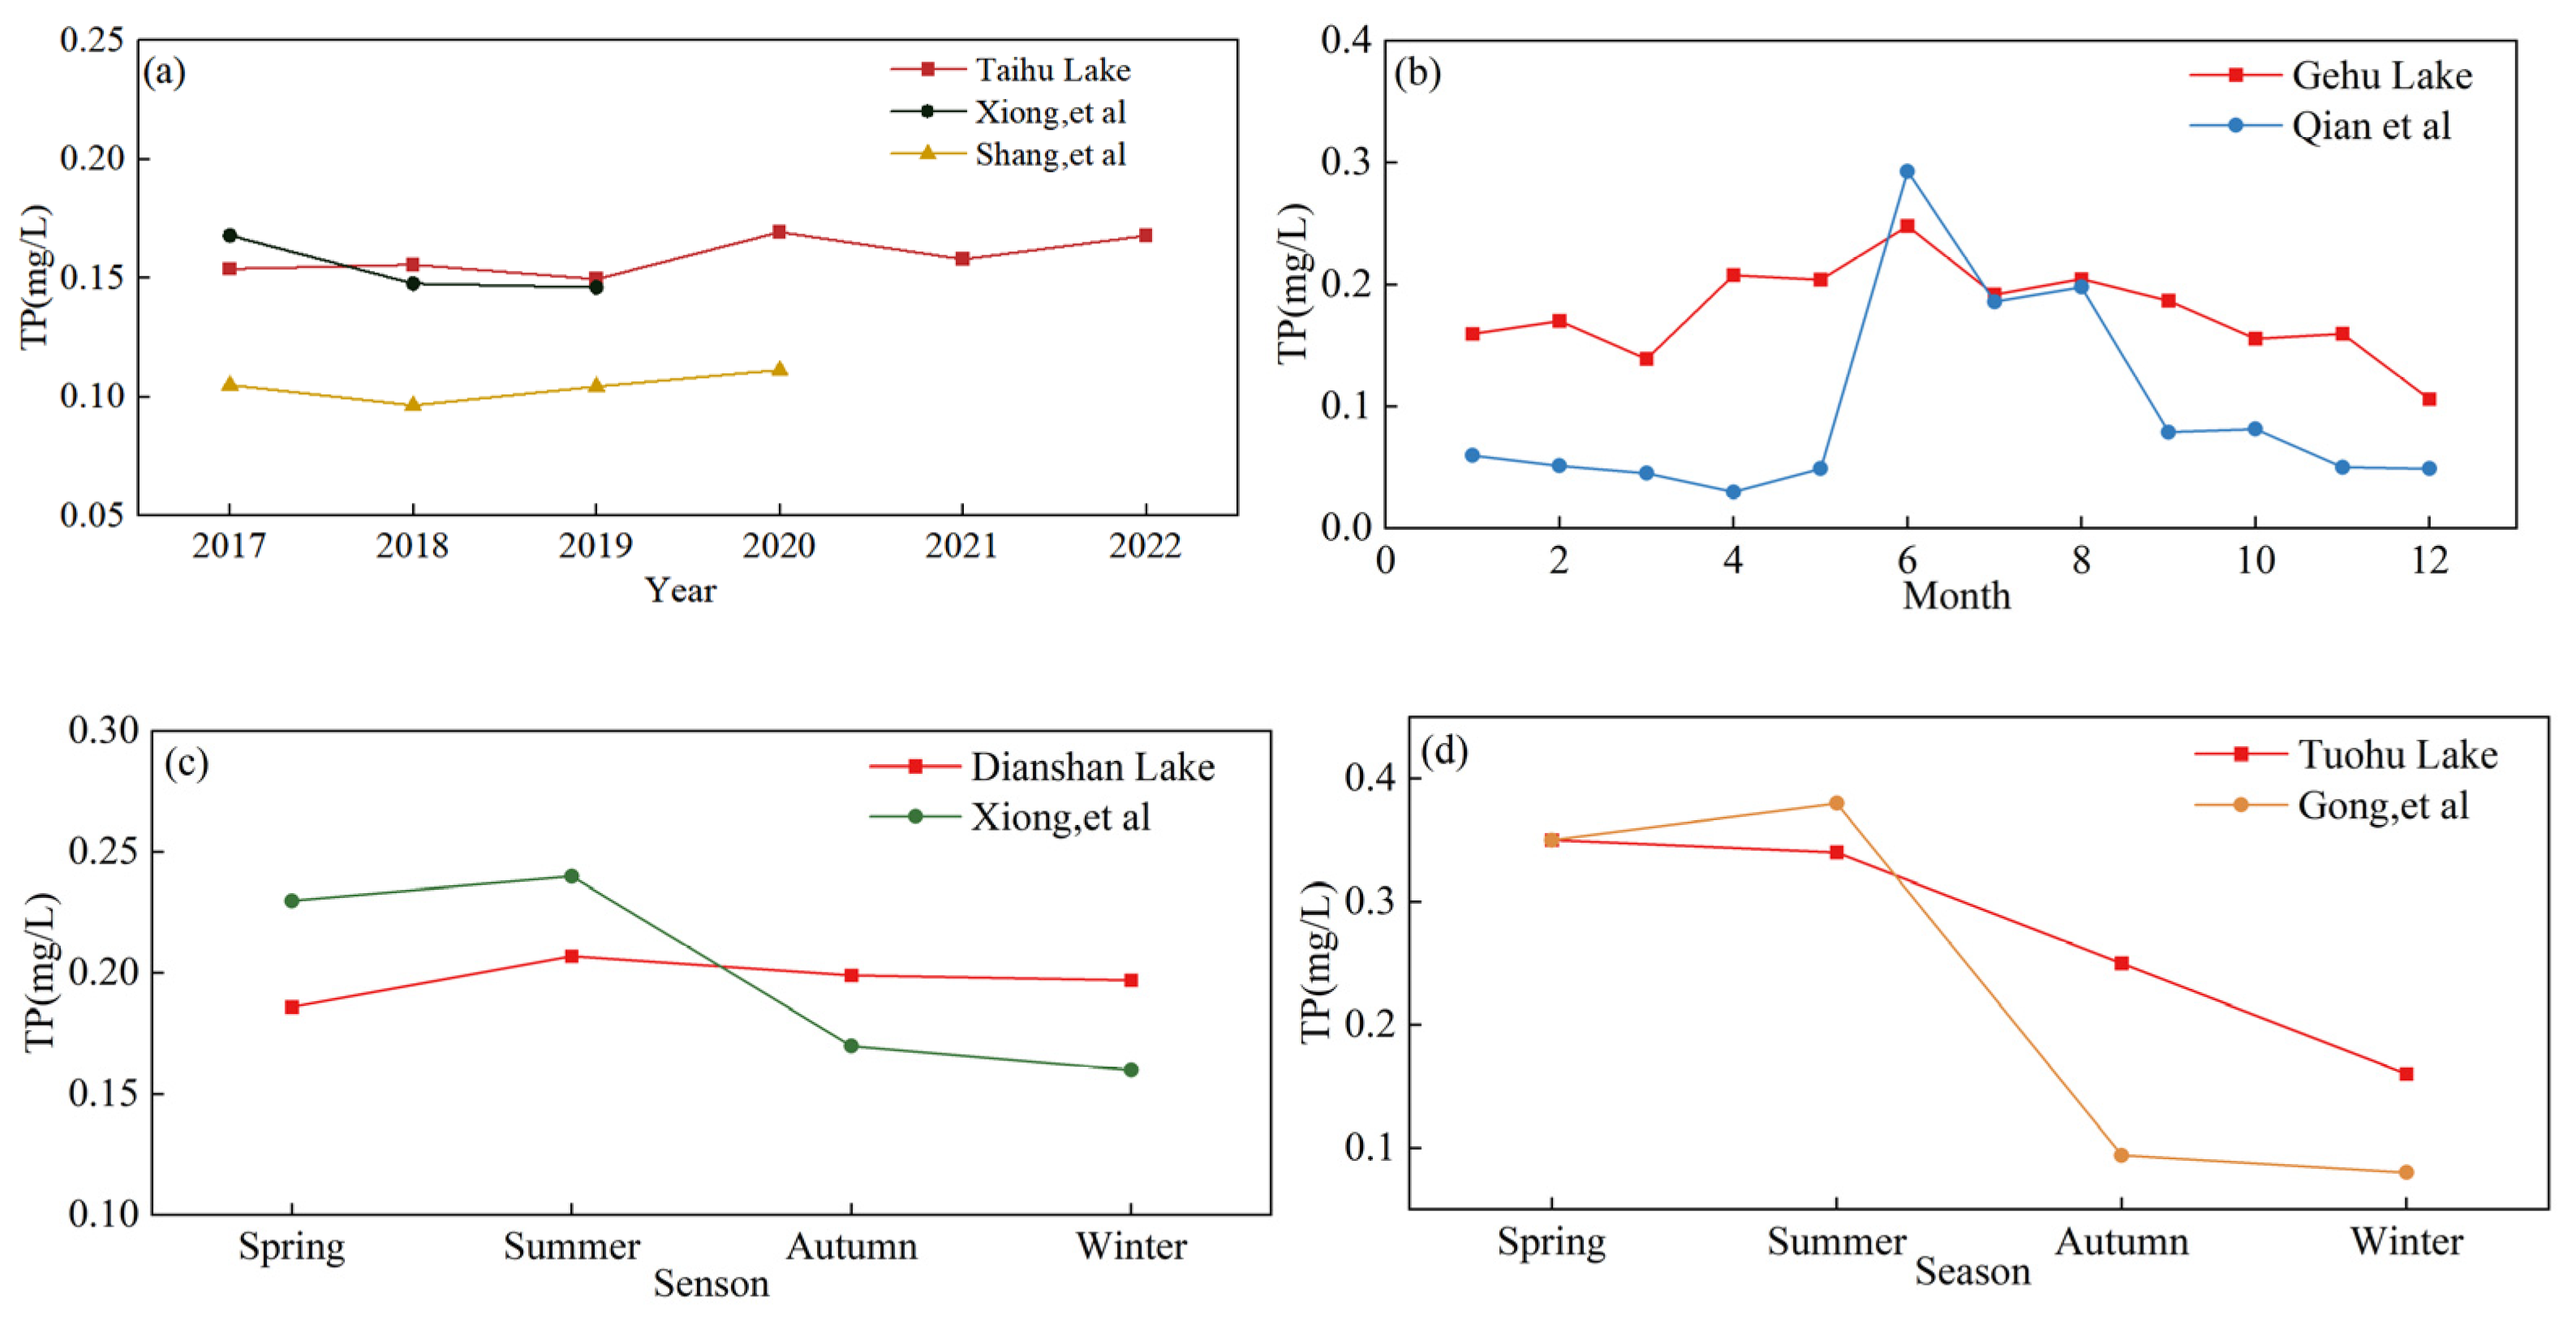
4.3. Comparison of TP Concentration Estimation in Typical Lakes

Based on the results of this study, the lakes were categorized into four classes according to their area size, and one representative lake is selected from each category to compare with previously published research results (Figure 8 and Table 5). (1) Xiong et al. [59] analyzed total phosphorus (TP) concentrations in Lake Taihu ranging from 0.14 to 0.17 mg/L in 2017–2019, with an error of only 5% from the average TP concentration during the same period of this study. Shang et al. [60] estimated TP concentrations in Taihu Lake from 2017 to 2020, showing a similar trend to our study, the lower values are due to the fact that TP concentrations are highest in summer, but the Landsat-8 images used by Shang et al. had a longer temporal resolution, possibly not covering periods of high TP concentration, leading to a lower annual average estimation. (2) Qian et al. [61] conducted monthly surveys of TP concentration in Gehu Lake, achieving a correlation of 0.65 with this study. The reasons for the local variations are as follows: (a) There is a discrepancy between the monthly monitoring values and the average values within the monthly interval of the image; (b) Qian et al. used interpolation to calculate TP concentrations in Gehu Lake, and their results may have been influenced by the uneven distribution of sampling data. In contrast, this study employed remote sensing imagery, providing broader continuous spatial coverage. Due to the limitation of spatial resolution, it may be difficult to capture the detailed information for specific localized areas in this study, which leads to local discrepancies compared to the results of Qian et al. (3) The seasonal variation trend for TP concentration in Dianshan Lake observed in the study of Xiong et al. [62] is similar to the trend in this study, but the discrepancies in results are due to: (a) the distribution of sampling points: Xiong et al. analyzed seasonal variations using data from 13 monitoring points in Dianshan Lake, most of which were located near the lakeshore, with high rainfall intensity in spring and summer and a high external phosphorus load [52], possibly leading to overestimations in spring and summer—when the external phosphorus load is lower in autumn and winter, it is likely to be underestimated; (b) the time series of the studies: the time series of this study (2017–2022) differed from that of Xiong et al. (1996–2015). The relevant research indicates that local farmers around Dianshan Lake have extensively converted farmland into orchards in pursuit of higher economic returns. These orchards have a higher application rate of fertilizers [63], resulting in an exacerbation of pollution in Dianshan Lake. Therefore, the differences in water quality during different time periods in the study have led to variations in the estimated values of TP concentration. (4) Gong et al. [64] conducted a water quality survey in Tuohu Lake in 2019, with a TP concentration of 0.35 mg/L in spring, consistent with this study. The inconsistency in autumn and winter is due to Gong et al. conducting only four surveys in select months in 2018. Field surveys can be affected by sudden water quality events, and uneven distribution of remote sensing imagery within seasons can also result in inconsistent statistical results. In addition, Gong et al. established a total of eight sampling points in Taihu Lake, with five of them located near the lake shore. During autumn and winter, the TP concentration is generally lower due to the reduction in external phosphorus loading [65].
In summary, the TP concentration estimated in this study is generally consistent with the trends observed in previous studies, confirming its scientific validity and reliability. These findings offer invaluable guidance for the monitoring of TP concentration in lakes within the Yangtze-Huaihe region.

5. Conclusions

In this study, a TP concentration estimation model applicable to large-sized regions, using synchronous satellite observations and the XGBoost algorithm, was developed with a focus on the lake group in the Yangtze-Huaihe region. The model utilised nine input variables: AFAI, b8, b4, b6, b11, b17, b14, b2, and CMI. Through cross-validation, the model achieved satisfactory fitting accuracy (R2 = 0.53, RMSE = 0.08 mg/L, MAPE = 34.20%), outperforming traditional empirical models. The model was applied to OLCI images of lakes in the Yangtze-Huaihe region from 2017 to 2022. The results indicated an interannual decrease in TP concentrations for small, medium, and large lakes, with reductions of 0.02 mg/L, 0.01 mg/L, and 0.01 mg/L, respectively. Furthermore, regarding seasonal variations, the TP concentration in large lakes exhibited two distinct phases: from 2017 to 2019, “high in spring/summer and low in autumn/winter” and “high in summer/autumn and low in spring/winter” during 2020–2022. Other-sized lakes showed a consistent pattern of “high in spring/summer and low in autumn/winter” variations. Additionally, the smaller lakes had higher TP concentrations. The removal of enclosed nets was found to be beneficial for improving water quality in large lakes. However, for medium and small lakes, the discharge of domestic and industrial wastewater in the vicinity resulted in insignificant changes in the TP concentrations. Therefore, when focusing on the ecological environment of large lakes, it is essential to focus on the governance and improvement of water quality in medium and small lakes.
This study demonstrates the potential application of machine learning algorithms for estimating TP concentrations in lakes of the Yangtze-Huaihe region using remote sensing satellite data and in situ measurements. In future research, the establishment of a virtual constellation combining satellites, such as Landsat-TM/ETM/OLI and MODIS, can be considered, in order to further expand the research scale in terms of time and space, enabling comprehensive monitoring and analysis of the global nutrient status of lakes.

Supplementary Materials

The following supporting information can be downloaded at: https://www.mdpi.com/article/10.3390/rs15184487/s1, Figure S1: Importance rank: (a) Original; (b) Inverse; (c) Exponential; (d) Square; (e) Square root; Table S1: Lakes larger than 20 km2 in the Yangtze-Huaihe region; Table S2: Variables.

Author Contributions

Conceptualization, X.W., Y.J., M.J., Z.C., R.M. and J.X.; Methodology, X.W., Y.J., M.J., Z.C., X.L., L.X. and J.X.; Data curation, X.W., M.J., Z.C. and J.X.; Writing—original draft, X.W., Y.J. and J.X.; Writing—review & editing, X.W., Y.J., M.J., Z.C., X.L., R.M., L.X. and J.X.; Supervision, Y.J., X.L., R.M. and J.X.; Funding acquisition, J.X. All authors have read and agreed to the published version of the manuscript.

Funding

This work was funded by the National Key R&D Program of China (Grant No. 2021YFD1700600), the Natural Science Foundation of Jiangsu Province for Youths (Grant No. BK20221158), the National Natural Science Foundation of China (Grant No. 42201400), the Key Laboratory of Land Satellite Remote Sensing Application, Ministry of Natural Resources of the People’s Republic of China (Grant No. KLSMNR-G202215). Data were supported by Lake-Watershed Science Data Center, National Earth System Science Data Center, National Science & Technology Infrastructure of China (http://lake.geodata.cn).

Conflicts of Interest

The authors declare no conflict of interest.

References

  1. Ho, L.T.; Goethals, P.L.M. Opportunities and Challenges for the Sustainability of Lakes and Reservoirs in Relation to the Sustainable Development Goals (SDGs). Water 2019, 11, 1462, Erratum in Water 2021, 13, 3207. [Google Scholar] [CrossRef]
  2. Roy, S.; Ojha, S.R.; Reddy, N.N.; Samal, R.N.; Das, B.S. Suspended particulate matter and secchi disk depth in the Chilika Lagoon from in situ and remote sensing data: A modified semi-analytical approach. Int. J. Remote Sens. 2022, 43, 3628–3654. [Google Scholar] [CrossRef]
  3. Hu, Z.F.; Li, D.S.; Guan, D.T. Water quality retrieval and algae inhibition from eutrophic freshwaters with iron-rich substrate based ecological floating beds treatment. Sci. Total Environ. 2020, 712, 135584. [Google Scholar] [CrossRef] [PubMed]
  4. Dona, C.; Sanchez, J.M.; Caselles, V.; Dominguez, J.A.; Camacho, A. Empirical Relationships for Monitoring Water Quality of Lakes and Reservoirs Through Multispectral Images. IEEE J. Sel. Top. Appl. Earth Obs. Remote Sens. 2014, 7, 1632–1641. [Google Scholar] [CrossRef]
  5. Maciel, D.A.; Barbosa, C.C.F.; Novo, E.; Flores, R.; Begliomini, F.N. Water clarity in Brazilian water assessed using Sentinel-2 and machine learning methods. Isprs J. Photogramm. Remote Sens. 2021, 182, 134–152. [Google Scholar] [CrossRef]
  6. Cao, Z.G.; Ma, R.H.; Melack, J.M.; Duan, H.T.; Liu, M.; Kutser, T.; Xue, K.; Shen, M.; Qi, T.C.; Yuan, H.L. Landsat observations of chlorophyll-a variations in Lake Taihu from 1984 to 2019. Int. J. Appl. Earth Obs. Geoinf. 2022, 106, 102642. [Google Scholar] [CrossRef]
  7. Liu, X.Y.; Zhang, Z.; Jiang, T.; Li, X.H.; Li, Y.Y. Evaluation of the Effectiveness of Multiple Machine Learning Methods in Remote Sensing Quantitative Retrieval of Suspended Matter Concentrations: A Case Study of Nansi Lake in North China. J. Spectrosc. 2021, 2021, 5957376. [Google Scholar] [CrossRef]
  8. Ruescas, A.B.; Hieronymi, M.; Mateo-Garcia, G.; Koponen, S.; Kallio, K.; Camps-Valls, G. Machine Learning Regression Approaches for Colored Dissolved Organic Matter (CDOM) Retrieval with S2-MSI and S3-OLCI Simulated Data. Remote Sens. 2018, 10, 786. [Google Scholar] [CrossRef]
  9. Somasundaram, D.; Zhang, F.F.; Ediriweera, S.; Wang, S.L.; Yin, Z.Y.; Li, J.S.; Zhang, B. Patterns, Trends and Drivers of Water Transparency in Sri Lanka Using Landsat 8 Observations and Google Earth Engine. Remote Sens. 2021, 13, 2193. [Google Scholar] [CrossRef]
  10. Balasubramanian, S.V.; Pahlevan, N.; Smith, B.; Binding, C.; Schalles, J.; Loisel, H.; Gurlin, D.; Greb, S.; Alikas, K.; Randla, M.; et al. Robust algorithm for estimating total suspended solids (TSS) in inland and nearshore coastal waters. Remote Sens. Environ. 2020, 246, 111768. [Google Scholar] [CrossRef]
  11. Sun, X.; Zhang, Y.L.; Zhang, Y.B.; Shi, K.; Zhou, Y.Q.; Li, N. Machine Learning Algorithms for Chromophoric Dissolved Organic Matter (CDOM) Estimation Based on Landsat 8 Images. Remote Sens. 2021, 13, 3560. [Google Scholar] [CrossRef]
  12. Niu, C.; Tan, K.; Jia, X.P.; Wang, X. Deep learning based regression for optically inactive inland water quality parameter estimation using airborne hyperspectral imagery. Environ. Pollut. 2021, 286, 117534. [Google Scholar] [CrossRef] [PubMed]
  13. Sagan, V.; Peterson, K.T.; Maimaitijiang, M.; Sidike, P.; Sloan, J.; Greeling, B.A.; Maalouf, S.; Adams, C. Monitoring inland water quality using remote sensing: Potential and limitations of spectral indices, bio-optical simulations, machine learning, and cloud computing. Earth-Sci. Rev. 2020, 205, 103187. [Google Scholar] [CrossRef]
  14. Hecky, R.E.; Kilham, P. Nutrient limitation of phytoplankton in fresh-water and marine environments—A review of recent-evidence on the effects of enrichment. Limnol. Oceanogr. 1988, 33, 796–822. [Google Scholar] [CrossRef]
  15. Baban, S.M.J. Detecting water-quality parameters in the norfolk broads, uk, using landsat imagery. Int. J. Remote Sens. 1993, 14, 1247–1267. [Google Scholar] [CrossRef]
  16. Wang, L.Y.; Li, C.Y.; Sun, B. Determination total phosphorus concentration and evaluation eutrophication of Hulun Lake with MODIS data. Chin. J. Environ. Eng. 2014, 8, 5527–5534. [Google Scholar]
  17. Chen, J.; Quan, W.T. Using Landsat/TM Imagery to Estimate Nitrogen and Phosphorus Concentration in Taihu Lake, China. IEEE J. Sel. Top. Appl. Earth Obs. Remote Sens. 2012, 5, 273–280. [Google Scholar] [CrossRef]
  18. Zhang, L.S.; Zhang, L.F.; Cen, Y.; Wang, S.; Zhang, Y.; Huang, Y.; Sultan, M.; Tong, Q.X. Prediction of Total Phosphorus Concentration in Macrophytic Lakes Using Chlorophyll-Sensitive Bands: A Case Study of Lake Baiyangdian. Remote Sens. 2022, 14, 3077. [Google Scholar] [CrossRef]
  19. Liu, Y.; Jiang, H. Retrieval of Total Phosphorus Concentration in the Surface Waters of Poyang Lake Based on Remote Sensing and Analysis of Its Spatial-Temporal Characteristics. J. Nat. Resour. 2013, 28, 2169–2177. [Google Scholar] [CrossRef]
  20. Nieto, P.J.G.; Garcia-Gonzalo, E.; Fernandez, J.R.A.; Muinz, C.D. Water eutrophication assessment relied on various machine learning techniques: A case study in the Englishmen Lake (Northern Spain). Ecol. Model. 2019, 404, 91–102. [Google Scholar] [CrossRef]
  21. Lee, H.W.; Kim, M.; Son, H.W.; Min, B.; Choi, J.H. Machine-learning-based water quality management of river with serial impoundments in the Republic of Korea. J. Hydrol. -Reg. Stud. 2022, 41, 101069. [Google Scholar] [CrossRef]
  22. Xiong, J.F.; Lin, C.; Cao, Z.G.; Hu, M.Q.; Xue, K.; Chen, X.; Ma, R.H. Development of remote sensing algorithm for total phosphorus concentration in eutrophic lakes: Conventional or machine learning? Water Res. 2022, 215, 118213. [Google Scholar] [CrossRef] [PubMed]
  23. Lundberg, S.M.; Erion, G.; Chen, H.; DeGrave, A.; Prutkin, J.M.; Nair, B.; Katz, R.; Himmelfarb, J.; Bansal, N.; Lee, S.-I. From local explanations to global understanding with explainable AI for trees. Nat. Mach. Intell. 2020, 2, 56–67. [Google Scholar] [CrossRef] [PubMed]
  24. Cui, Y.; Meng, F.; Fu, P.J.; Yang, X.Y.; Zhang, Y.X.; Liu, P.D. Application of hyperspectral analysis of chlorophyll a concentration inversion in Nansi Lake. Ecol. Inform. 2021, 64, 101360. [Google Scholar] [CrossRef]
  25. Hu, Y.R.; Du, W.J.; Yang, C.; Wang, Y.; Huang, T.Y.; Xu, X.Y.; Li, W.W. Source identification and prediction of nitrogen and phosphorus pollution of Lake Taihu by an ensemble machine learning technique. Front. Environ. Sci. Eng. 2023, 17, 55. [Google Scholar] [CrossRef]
  26. Zhang, Y.B.; Shi, K.; Sun, X.; Zhang, Y.L.; Li, N.; Wang, W.J.; Zhou, Y.Q.; Zhi, W.; Liu, M.L.; Li, Y.; et al. Improving remote sensing estimation of Secchi disk depth for global lakes and reservoirs using machine learning methods. Giscience Remote Sens. 2022, 59, 1367–1383. [Google Scholar] [CrossRef]
  27. Chen, S.; Hu, C.; Barnes, B.B.; Wanninkhof, R.; Cai, W.-J.; Barbero, L.; Pierrot, D. A machine learning approach to estimate surface ocean pCO(2) from satellite measurements. Remote Sens. Environ. 2019, 228, 203–226. [Google Scholar] [CrossRef]
  28. Jang, E.; Im, J.; Park, G.H.; Park, Y.G. Estimation of Fugacity of Carbon Dioxide in the East Sea Using In Situ Measurements and Geostationary Ocean Color Imager Satellite Data. Remote Sens. 2017, 9, 821. [Google Scholar] [CrossRef]
  29. Qin, B.Q.; Gao, G.; Zhu, G.W.; Zhang, Y.L.; Song, Y.Z.; Tang, X.M.; Xu, H.; Deng, J.M. Eutrophication of lakes and their ecosystem response. Chin. Sci. Bull. 2013, 58, 855–864. [Google Scholar] [CrossRef]
  30. Hu, M.; Ma, R.; Xiong, J.; Wang, M.; Cao, Z.; Xue, K. Eutrophication state in the Eastern China based on Landsat 35-year observations. Remote Sens. Environ. 2022, 277, 113057. [Google Scholar] [CrossRef]
  31. Zhao, Y.; Li, T.; Huang, B.; Feng, Y.; Lei, M.; Zhuo, H.; Wu, L. Evolution characteristics and driving factors of water quality and eutrophication of typical lakes in the middle reaches of the Yangtze River from 2016 to 2020. J. Lake Sci. 2022, 34, 1441–1451. [Google Scholar]
  32. Yang, G.; Ma, R.; Zhang, L.; Jiang, J.; Yao, S.; Zhang, M.; Zeng, H. Lake status major problems and protection strategy in China. J. Lake Sci. 2010, 22, 799–810. [Google Scholar]
  33. Vanhellemont, Q.; Ruddick, K. Atmospheric correction of Sentinel-3/OLCI data for mapping of suspended particulate matter and chlorophyll-a concentration in Belgian turbid coastal waters. Remote Sens. Environ. 2021, 256, 112284. [Google Scholar] [CrossRef]
  34. Hu, C.; Lee, Z.; Ma, R.; Yu, K.; Li, D.; Shang, S. Moderate Resolution Imaging Spectroradiometer (MODIS) observations of cyanobacteria blooms in Taihu Lake, China. J. Geophys. Res.-Ocean. 2010, 115, 5511. [Google Scholar] [CrossRef]
  35. Qi, L.; Hu, C.M.; Visser, P.M.; Ma, R.H. Diurnal changes of cyanobacteria blooms in Taihu Lake as derived from GOCI observations. Limnol. Oceanogr. 2018, 63, 1711–1726. [Google Scholar] [CrossRef]
  36. Liang, Q.C.; Zhang, Y.C.; Ma, R.H.; Loiselle, S.; Li, J.; Hu, M.Q. A MODIS-Based Novel Method to Distinguish Surface Cyanobacterial Scums and Aquatic Macrophytes in Lake Taihu. Remote Sens. 2017, 9, 133. [Google Scholar] [CrossRef]
  37. Chen, T.; Guestrin, C.; Assoc Comp, M. XGBoost: A Scalable Tree Boosting System. In Proceedings of the 22nd ACM SIGKDD International Conference on Knowledge Discovery and Data Mining (KDD), San Francisco, CA, USA, 13–17 August 2016; pp. 785–794. [Google Scholar]
  38. Brooks, W.; Corsi, S.; Fienen, M.; Carvin, R. Predicting recreational water quality advisories: A comparison of statistical methods. Environ. Model. Softw. 2016, 76, 81–94. [Google Scholar] [CrossRef]
  39. Xu, H.; Paerl, H.W.; Zhu, G.W.; Qin, B.Q.; Hall, N.S.; Zhu, M.Y. Long-term nutrient trends and harmful cyanobacterial bloom potential in hypertrophic Lake Taihu, China. Hydrobiologia 2017, 787, 229–242. [Google Scholar] [CrossRef]
  40. Hossen, H.; Mahmod, W.E.; Negm, A.; Nakamura, T. Assessing Water Quality Parameters in Burullus Lake Using Sentinel-2 Satellite Images. Water Resour. 2022, 49, 321–331. [Google Scholar] [CrossRef]
  41. Xu, L.J.; Huang, C.C.; Li, Y.M.; Chen, X. Deriving Concentration of TN,TP based on Hyper Spectral Reflectivity. Remote Sens. Technol. Appl. 2013, 28, 681–688. [Google Scholar]
  42. Holloway, J.; Mengersen, K. Statistical Machine Learning Methods and Remote Sensing for Sustainable Development Goals: A Review. Remote Sens. 2018, 10, 1365. [Google Scholar] [CrossRef]
  43. Du, C.G.; Wang, Q.; Li, Y.M.; Lyu, H.; Zhu, L.; Zheng, Z.B.; Wen, S.; Liu, G.; Guo, Y.L. Estimation of total phosphorus concentration using a water classification method in inland water. Int. J. Appl. Earth Obs. Geoinf. 2018, 71, 29–42. [Google Scholar] [CrossRef]
  44. Vu, H.L.; Ng, K.T.W.; Richer, A.; An, C. Analysis of input set characteristics and variances on k-fold cross validation for a Recurrent Neural Network model on waste disposal rate estimation. J. Environ. Manag. 2022, 311, 114869. [Google Scholar] [CrossRef]
  45. Hadjisolomou, E.; Stefanidis, K.; Herodotou, H.; Michaelides, M.; Papatheodorou, G.; Papastergiadou, E. Modelling Freshwater Eutrophication with Limited Limnological Data Using Artificial Neural Networks. Water 2021, 13, 1590. [Google Scholar] [CrossRef]
  46. Li, N.; Zhang, Y.L.; Shi, K.; Zhang, Y.B.; Sun, X.; Wang, W.J.; Qian, H.M.; Yang, H.Y.; Niu, Y.K. Real-Time and Continuous Tracking of Total Phosphorus Using a Ground-Based Hyperspectral Proximal Sensing System. Remote Sens. 2023, 15, 507. [Google Scholar] [CrossRef]
  47. Ding, L.; Qi, C.C.; Li, G.; Zhang, W.Q. TP Concentration Inversion and Pollution Sources in Nanyi Lake Based on Landsat 8 Data and InVEST Model. Sustainability 2023, 15, 9678. [Google Scholar] [CrossRef]
  48. Lei, S.H.; Xu, J.; Li, Y.M.; Li, L.; Lyu, H.; Liu, G.; Chen, Y.; Lu, C.Y.; Tian, C.; Jiao, W.Z. A semi-analytical algorithm for deriving the particle size distribution slope of turbid inland water based on OLCI data: A case study in Lake Hongze. Environ. Pollut. 2021, 270, 116288. [Google Scholar] [CrossRef]
  49. Janatian, N.; Olli, K.; Cremona, F.; Laas, A.; Noges, P. Atmospheric stilling offsets the benefits from reduced nutrient loading in a large shallow lake. Limnol. Oceanogr. 2020, 65, 717–731. [Google Scholar] [CrossRef]
  50. Xiong, J.; Xue, K.; Li, J.; Hu, M.; Li, J.; Wang, X.; Lin, C.; Ma, R.; Chen, L. Vertical distribution analysis and total mass estimation of nitrogen and phosphorus in large shallow lakes. J. Environ. Manag. 2023, 344, 118465. [Google Scholar] [CrossRef]
  51. Huang, J.C.; Zhang, Y.J.; Bing, H.J.; Peng, J.; Dong, F.F.; Gao, J.F.; Arhonditsis, G.B. Characterizing the river water quality in China: Recent progress and on-going challenges. Water Res. 2021, 201, 117309. [Google Scholar] [CrossRef]
  52. Zhang, Y.X.; Hu, Z.H. Variation Characteristics of Rainstorms in Middle-Lower Reaches of the Yangtze River in Recent 60 Years. Clim. Environ. Res. 2019, 24, 755–768. [Google Scholar] [CrossRef]
  53. Zhu, W.; Hu, S.; Feng, G.; Zhang, Y.; Zhai, S.; Xue, Z.; Zhao, S.; Chen, H.; Wang, R. Effects of great floods on phosphorus in shallow lakes: A case study of Lake Taihu in 2016. J. Lake Sci. 2020, 32, 325–336. [Google Scholar] [CrossRef]
  54. Wang, L.C.; Hoang, D.V.; Liou, Y.A. Quantifying the Impacts of the 2020 Flood on Crop Production and Food Security in the Middle Reaches of the Yangtze River, China. Remote Sens. 2022, 14, 3140. [Google Scholar] [CrossRef]
  55. Tong, S.T.Y.; Chen, W.L. Modeling the relationship between land use and surface water quality. J. Environ. Manag. 2002, 66, 377–393. [Google Scholar] [CrossRef]
  56. Luo, J.H.; Pu, R.L.; Ma, R.H.; Wang, X.L.; Lai, X.J.; Mao, Z.G.; Zhang, L.; Peng, Z.L.; Sun, Z. Mapping Long-Term Spatiotemporal Dynamics of Pen Aquaculture in a Shallow Lake: Less Aquaculture Coming along Better Water Quality. Remote Sens. 2020, 12, 1866. [Google Scholar] [CrossRef]
  57. Liao, R.; Wu, X.; Wang, Z.; Wang, B.; Ke, F.; Han, C.; Zhou, Q.; Ren, J. Spatial distribution and pollution assessment on the main nutrients and heavy metals in sediments of Lake Gehu, Taihu Basin after removing the aquaculture net. J. Lake Sci. 2021, 33, 1436–1447. [Google Scholar] [CrossRef]
  58. Zeng, S.; Du, C.G.; Li, Y.M.; Lyu, H.; Dong, X.Z.; Lei, S.H.; Li, J.D.; Wang, H.J. Monitoring the particulate phosphorus concentration of inland waters on the Yangtze Plain and understanding its relationship with driving factors based on OLCI data. Sci. Total Environ. 2022, 809, 151992. [Google Scholar] [CrossRef]
  59. Xiong, J.F. Remote Sensing Estimation of Phosphorus Concentration in Lake Taihu and Its Response to Non-Point Source Phosphorus Load. Nanjing Institute of Geography and Limnology; Chinese Academy of Sciences: Beijing, China, 2021. [Google Scholar]
  60. Shang, W.; Jin, S.G.; He, Y.; Zhang, Y.Y.; Li, J. Spatial-Temporal Variations of Total Nitrogen and Phosphorus in Poyang, Dongting and Taihu Lakes from Landsat-8 Data. Water 2021, 13, 1704. [Google Scholar] [CrossRef]
  61. Qian, W.H.; Gao, Y.X.; Zhang, Y.M.; Yang, F.; Zhang, Z.W.; Zhao, Y.; Liu, Y.; Xu, D.J. Analysis of characteristics and reasons of temporal and spatial changes of Gehu Lake water quality based on multivariate statistical analysis. Water Resour. Hydropower Eng. 2021, 52, 116–128. [Google Scholar] [CrossRef]
  62. Xiong, G.H.; Wang, G.C.; Wang, D.Q.; Yang, W.L.; Chen, Y.Y.; Chen, Z.L. Spatio-Temporal Distribution of Total Nitrogen and Phosphorus in Dianshan Lake, China: The External Loading and Self-Purification Capability. Sustainability 2017, 9, 500. [Google Scholar] [CrossRef]
  63. Zhang, M.S.; Li, W.; Zhang, W.G.; Li, Y.T.; Li, J.Y.; Gao, Y. Agricultural land-use change exacerbates the dissemination of antibiotic resistance genes via surface runoffs in Lake Tai Basin, China. Ecotoxicol. Environ. Saf. 2021, 220, 112328. [Google Scholar] [CrossRef] [PubMed]
  64. Gong, W.J. Evaluation of water quality and eutrophication status of Tuo Lake in Wuhe County, Anhui Province. Anhui Archit. 2021, 28, 101–103. [Google Scholar] [CrossRef]
  65. Li, X.F.; Xu, W.Z.; Song, S.; Sun, J. Sources and spatiotemporal distribution characteristics of nitrogen and phosphorus loads in the Haihe River Basin, China. Mar. Pollut. Bull. 2023, 189, 114756. [Google Scholar] [CrossRef] [PubMed]
Figure 1. Spatial distribution of 36 lakes (>20 km2) in Yangtze-Huaihe region (The red box is the Yangtze-Huaihe region).
Remotesensing 15 04487 g001
Figure 2. Five-fold cross-validation Results: (a) Approach 1, (b) Approach 2, (c) Approach 3, (d) Approach 4 and (e) Approach 5.
Remotesensing 15 04487 g002aRemotesensing 15 04487 g002b
Figure 3. Seasonal mean TP Concentration in Lakes of the Yangtze-Huaihe Region: (a) Spring; (b) Summer; (c) Autumn; (d) Winter.
Remotesensing 15 04487 g003
Figure 4. The variation of TP concentration in lakes under different sizes: (a) Small-sized lakes (<50 km2), (b) Medium-small sized lakes (50–100 km2), (c) Medium-sized lakes (100–500 km2), and (d) Large-sized lakes (>500 km2).
Remotesensing 15 04487 g004
Figure 5. Comparison of algorithms:(a) Hossen et al., 2022 [40] (b) Xu et al., 2013 [41].
Remotesensing 15 04487 g005
Figure 6. Lake TSM and Chl-a concentrations.
Remotesensing 15 04487 g006
Figure 7. Monthly Scale Climate Variations: (a) Temperature; (b) Precipitation.
Remotesensing 15 04487 g007
Figure 8. Comparison of Typical Lakes: (a) Taihu Lake [59,60]; (b) Gehu Lake [61]; (c) Dianshan Lake [62]; (d) Tuohu Lake [64].
Remotesensing 15 04487 g008
Table 1. Summary of Sampling Point Information.
LakeSampling Points TP (mg/L)
Mean ± STD
Sampling Time
Taihu Lake410.23 ± 0.1629 April 2017/30 April 2017/14 November 2019/7 November 2020
Chaohu Lake240.18 ± 0.1023 August 2017/16 July 2018
Gaoyou Lake120.11 ± 0.0412 November 2021
Hongze Lake180.10 ± 0.0614 October 2022
Gehu Lake80.10 ± 0.0118 July 2018
Poyang Lake100.11 ± 0.0514 April 2017/12 July 2018
Table 2. Approach of input variables.
ApproachesInput Variables
1AFAI, CMI, TWI, b1~b17
2AFAI, CMI, TWI, 1/b1~1/b17
3AFAI, CMI, TWI, eb1~eb17
4AFAI, CMI, TWI, (b1)2~(b17)2
5AFAI, CMI, TWI, b 1 ~ b 17
Table 3. Statistics of OLCI images in the Yangtze-Huaihe region from 2017 to 2022 (unit: scenes).
YearJanFebMarAprMayJunJulAugSepOctNovDecTotal
2017161514171781034122115152
201810121718711201417131214165
201912111742122327182828173
2020715616137139101613116
2021161612111175416131114136
20226811151065181920418140
Table 4. Algorithm Comparison.
Algorithm TypeReferenceLakeFactors UsedOLCI BandsFitted Model Equation
Empirical ModelHossen, et al. [40]Burullus Lake842/560 nmb15/b6y = 36.201x2 + 92.078x + 230.74
Xu, et al. [41]Taihu Lake671/680 nmb9/b10y = 12.8265x2 − 26.86x + 14.0727
Table 5. Comparison of TP Concentrations in Typical Lakes.
Lake AreaLakeReferencesSampled TimeNumber of Samples
>500 km2Taihu Lake(Xiong, et al., 2021 [59])8 March 2017/29 April 2017/ 30 April 2017/30 April 201755
(Shang, et al., 2021 [60])April 2018/July 201828
100–500 km2Gehu Lake(Qian, et al., 2021 [61])2019 monthly20
50–100 km2Dianshan Lake(Xiong, et al., 2017 [62])2005–2015 monthly13
20–50 km2Tuohu Lake(Gong, et al., 2021 [64])April 2018/August 2018/November 2018 /February 20198
Disclaimer/Publisher’s Note: The statements, opinions and data contained in all publications are solely those of the individual author(s) and contributor(s) and not of MDPI and/or the editor(s). MDPI and/or the editor(s) disclaim responsibility for any injury to people or property resulting from any ideas, methods, instructions or products referred to in the content.

