
Two-Level Feature-Fusion Ship Recognition Strategy Combining HOG Features with Dual-Polarized Data in SAR Images
1
School of Electronics and Communication Engineering, Shenzhen Campus of Sun Yat-sen University, Shenzhen 518107, China
2
Institute of Remote Sensing Satellite, China Academy of Space Technology, Beijing 100094, China
*
Author to whom correspondence should be addressed.
Remote Sens. 2023, 15(18), 4393; https://doi.org/10.3390/rs15184393
Submission received: 10 July 2023
/
Revised: 29 August 2023
/
Accepted: 31 August 2023
/
Published: 7 September 2023
(This article belongs to the Special Issue Radar Signal Processing and Imaging for Ocean Remote Sensing)
Abstract
:Due to the inherent characteristics of synthetic aperture radar (SAR) imaging, SAR ship features are not obvious and the category distribution is unbalanced, which makes the task of ship recognition in SAR images quite challenging. To address the above problems, a two-level feature-fusion ship recognition strategy combining the histogram of oriented gradients (HOG) features with the dual-polarized data in the SAR images is proposed. The proposed strategy comprehensively utilizes the features extracted by the HOG operator and the shallow and deep features extracted by the Siamese network in the dual-polarized SAR ship images, which can increase the amount of information for the model learning. First, the Siamese network is used to extract the shallow and deep features from the dual-polarized SAR images, and then the HOG feature of the dual-polarized SAR images is also extracted. Furthermore, the bilinear transformation layer is used for fusing the HOG features from dual-polarized SAR images, and the grouping bilinear pooling process is used for fusing the dual-polarized shallow feature and deep feature extracted by the Siamese network, respectively. Finally, the catenation operation is used for fusing the dual-polarized HOG features and dual-polarized shallow feature and deep feature, respectively, which are used for the recognition of the SAR ship targets. Experimental results tested on the OpenSARShip2.0 dataset demonstrate the correctness and effectiveness of the proposed strategy, which can effectively improve the recognition performance of the ship targets by fusing the different level features of the dual-polarized SAR images.
1. Introduction
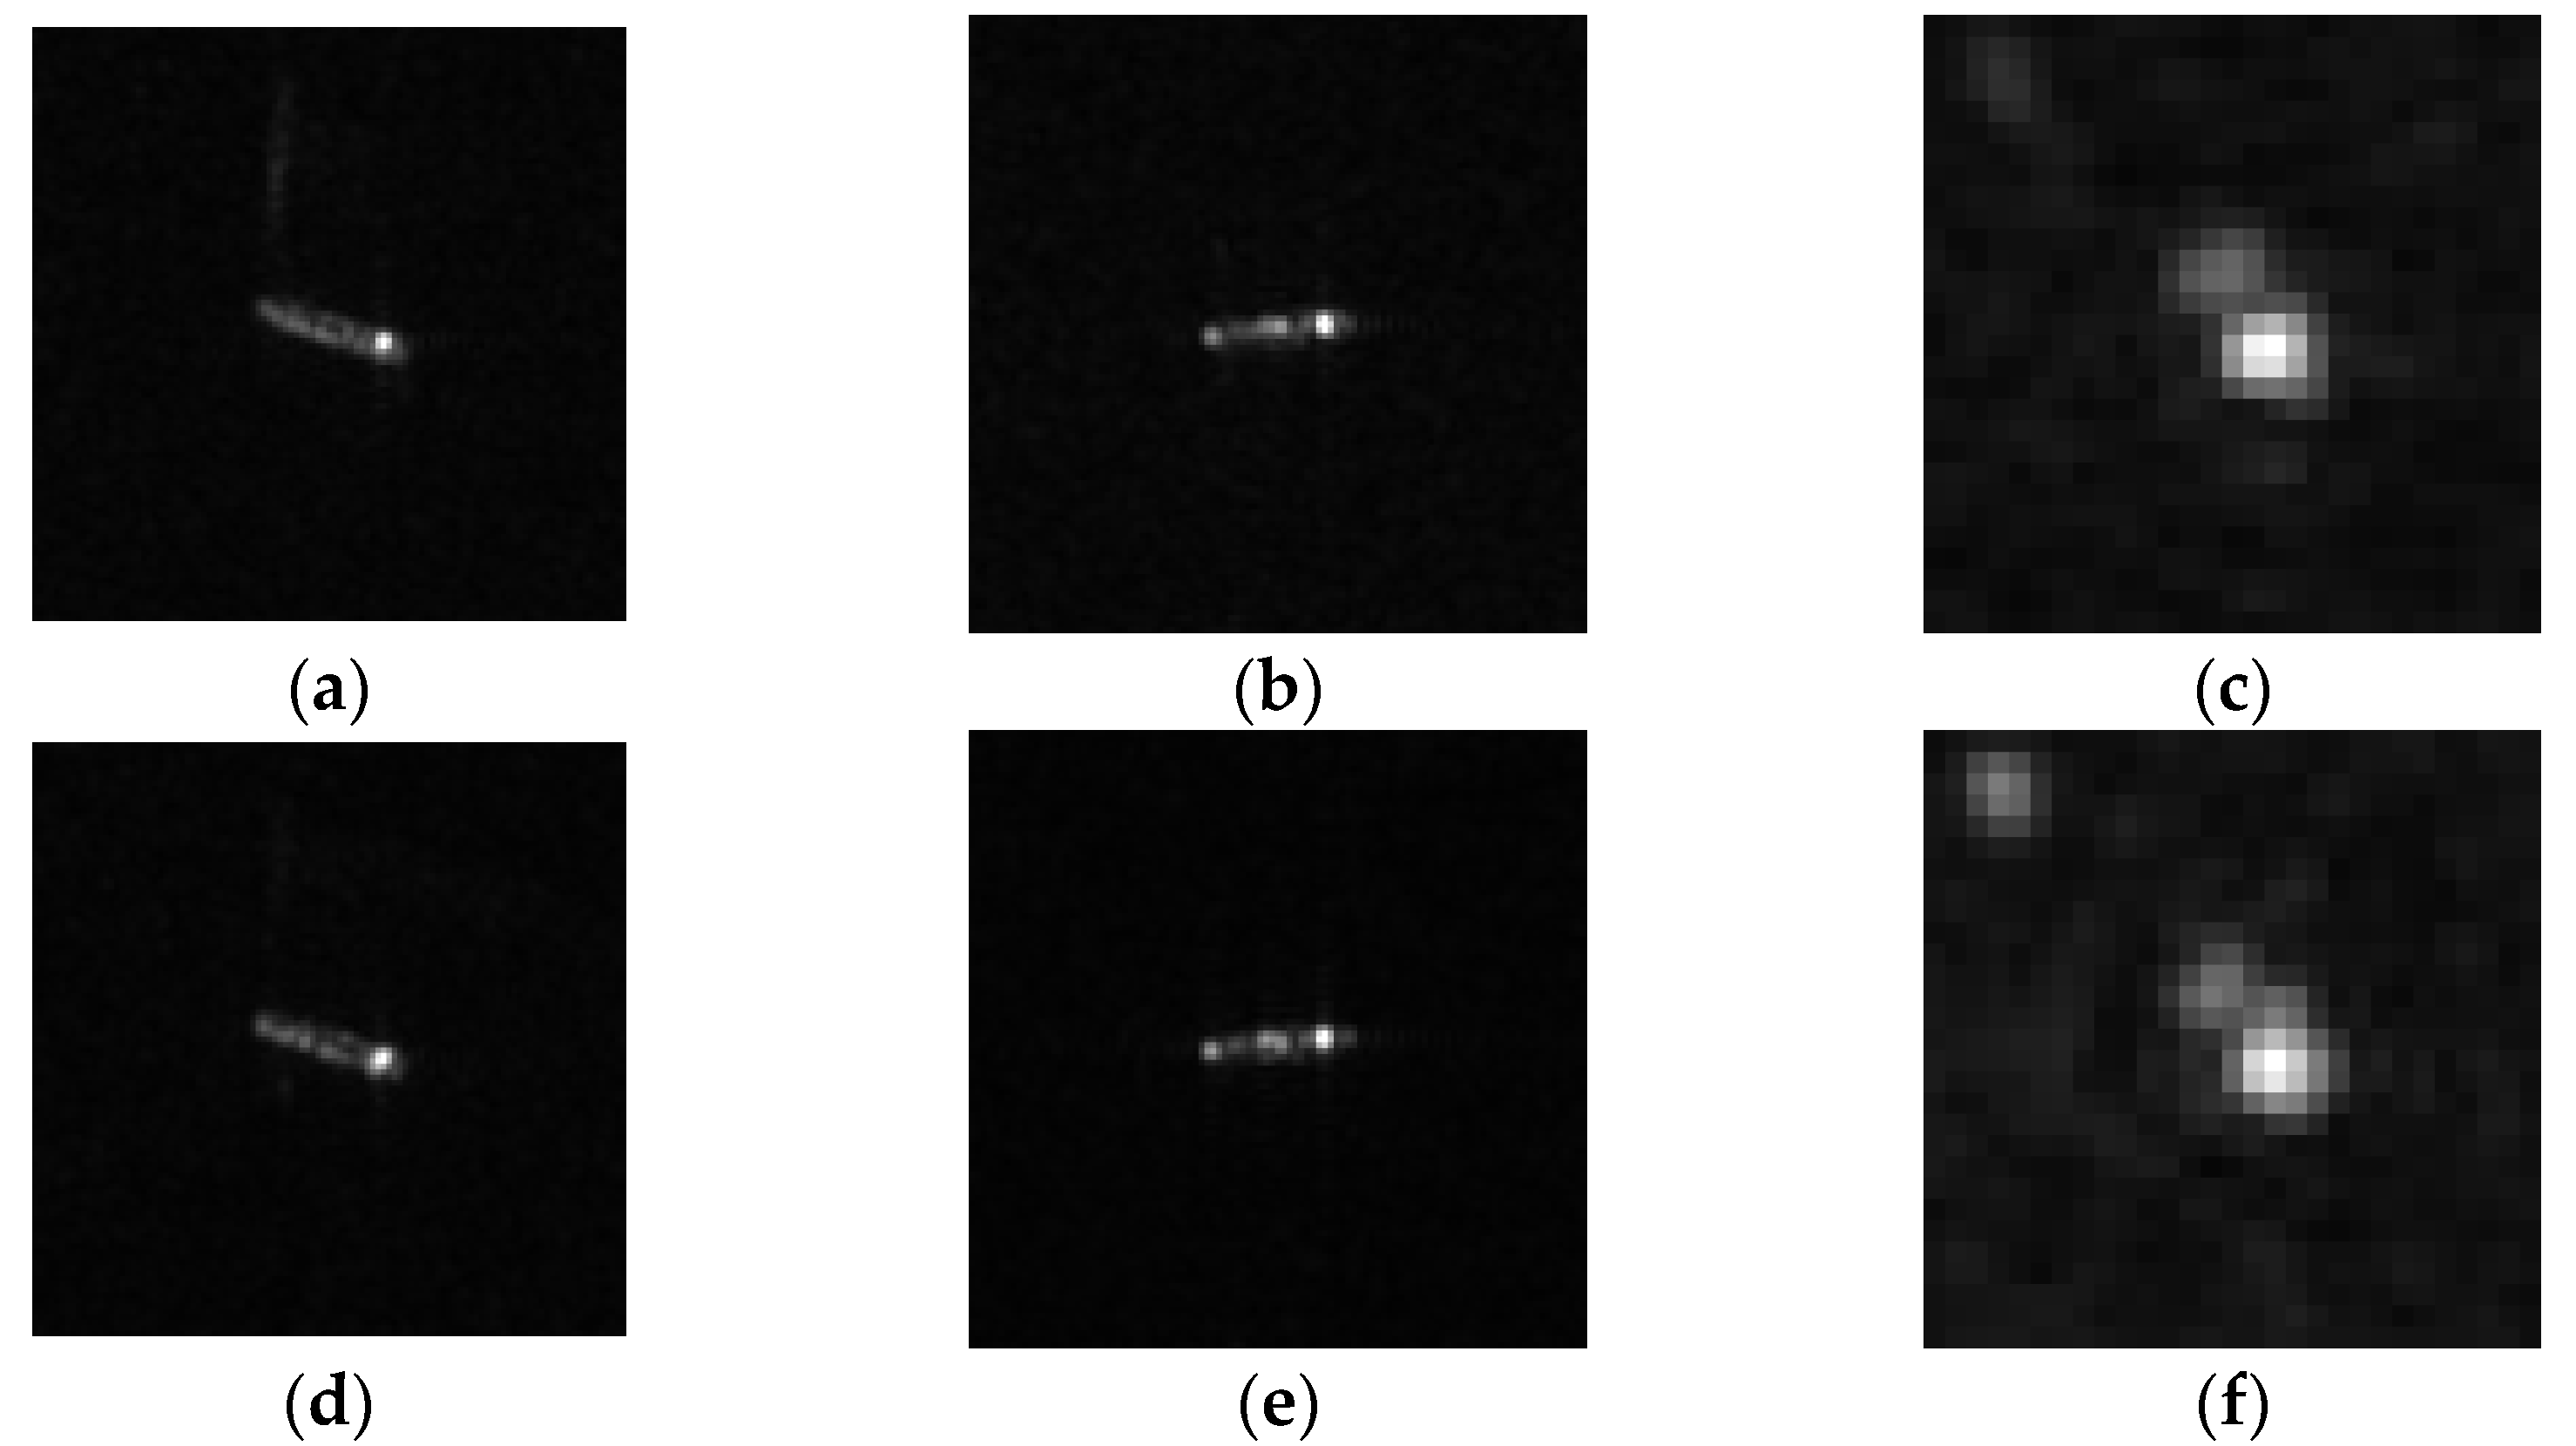
The synthetic aperture radar (SAR) plays a significant role in remote sensing, geosciences, reconnaissance, and surveillance applications, which has gained wider attention in recent years [1,2,3]. Ship target recognition based on SAR images has important value in the field of ocean remote sensing because it can assist military and civilian departments in monitoring and managing marine vessels, as well as managing marine resource extraction [4,5]. However, due to the working principle of the SAR system, the imaging effect of the ship targets is affected by many factors, such as the imaging distance, imaging environment, imaging algorithm, etc., which makes the differences between the categories of the ship target in the acquired SAR images small, thus rendering SAR ship recognition difficult and challenging [5]. Figure 1 shows the examples of the SAR images of the several ship targets in the publicly released SAR image dataset, i.e., the OpenSARShip 2.0 dataset [6].
Traditional ship target recognition in the SAR image usually includes three steps: image preprocessing, feature extraction and selection, and classification [7]. The feature extraction and selection are key steps in traditional SAR ship target recognition. The traditional methods typically require manual analysis of the target features and the use of various operators designed manually to extract them. Generally speaking, the geometric structure features, electromagnetic scattering features, transform domain features, and local invariant features of the target are the key features that traditional target recognition methods will focus on [7]. For example, the geometric mechanism features of the SAR ship targets, such as the area, perimeter, integral optical density, Euler numbers, length, main axis bearing angle, slenderness, etc., have been extracted for recognition [8]. Reference [9] gives a method of fitting the electromagnetic scattering peak characteristics using the two-dimensional Gaussian function, and then uses the peak detection algorithm to extract its position, width, amplitude and other parameters, which can be used to identify the target categories. The commonly used transform domain methods include wavelet transform, principal component analysis, independent component analysis, Radon transform, etc. By analyzing the SAR image data features from another perspective through these transformations, the relevant feature extraction methods are designed for subsequent recognition. The scale invariant feature transform (SIFT) is a commonly used feature description operator, which is often used to extract the features of SAR image targets. Therefore, the traditional ship target recognition in SAR images usually achieves the goal of recognizing the SAR ship targets by manually designing the features (such as geometric structure features, electromagnetic scattering features, transform domain features, local invariant features, etc.); however, the generalization capability is usually weak.
The powerful feature extraction ability of deep learning technology has gradually made the SAR ship target recognition methods based on deep learning a mainstream choice in this field. The research experience accumulated in the optical image classification technology based on deep learning provides rich reference experience for the ship target recognition tasks in the SAR image. However, due to a lack of significant feature differences between the SAR ship target classes, a small number of the SAR ship images, and severe class imbalance, SAR ship recognition remains very challenging. With the public release of the relevant SAR image datasets, research on SAR ship recognition based on deep learning has developed rapidly. The relevant research can usually be divided into methods based on the convolutional neural network (CNN) and the combination of the CNN and traditional algorithms. Based on the CNN methods, the improvements are usually made from two aspects: improving the network structure and integrating multi-source information. As shown in references [10,11,12,13], the Siamese network architecture is used for the information fusion of the multi-polarized SAR ship images to improve the network performance. Reference [10] adopts an information fusion method of element-by-element multiplication, while references [11,12] respectively propose the Bernoulli pooling and grouping Bernoulli pooling methods to fuse the information in the SAR images with different polarization methods. Reference [13] proposes the use of the cross-attention mechanism to fuse the multi-polarized information and enhance the network’s attention to the key features.
The SAR ship recognition method, which combines traditional methods and a CNN, aims to integrate and utilize both advantages of them. This type of SAR ship recognition method generally uses traditional feature extraction operators to enhance the features of the SAR ships, and then integrates and utilizes the feature learning ability of the neural networks to achieve better performance. According to reference [14], even though the neural networks have strong feature extraction capabilities, the traditional manually designed features should be utilized to improve the recognition accuracy. The HOG-ShipCLSNet model has been proposed [14], which includes four mechanisms: the multi-scale classification mechanism, global self-attention mechanism, fully connected equilibrium mechanism, and the HOG feature fusion mechanism. This model performs the global attention mechanism operations on the features at different levels, and then feeds each level of the feature into the classifier, averaging the results of each classifier. At the same time, the features extracted by the HOG operator are subjected to principal component analysis, and finally sent to the final classifier to obtain the final classification result. Based on the same idea, the MSHOG operator has been proposed in [15], which can extract the SAR ship features and integrate them into neural networks. As the transformer enters the field of the visual images, there is great exploration and research value in applying the transformer to SAR ship target recognition. However, there is currently no release of the relevant representative research results. With the development of deep learning technology, the CNN gradually replaces the traditional ship recognition method and becomes the mainstream choice. However, ship recognition based on deep learning is also faced with great challenges, due to a lack of clear details of the SAR ship targets and unbalanced distribution of the categories. The SAR images have different polarization modes and data forms in the different domains; therefore, researchers are gradually shifting their perspective to integrating the SAR image data from different sources in order to improve the performance of the ship target recognition, such as integrating the SAR image data with the different polarization modes, fusing the complex domain SAR image data, fusing the manual features and neural network features, etc.
To address the above problems, a two-level feature-fusion ship recognition strategy combining the HOG features with the dual-polarized data in SAR images is proposed. The proposed strategy comprehensively utilizes the features extracted by the HOG operator and the shallow and deep features extracted by the Siamese network in the dual-polarized SAR ship images, which can increase the amount of information for the model learning. First, the Siamese network is used to extract the shallow and deep features from the dual-polarized SAR images, and then the HOG feature of the dual-polarized SAR images is also extracted. Furthermore, the bilinear transformation layer is used for fusing the HOG features from dual-polarized SAR images, and the grouping bilinear pooling process is used for fusing the dual-polarized shallow feature and deep feature extracted by the Siamese network, respectively. Finally, the catenation operation is used for fusing the dual-polarized HOG features and dual-polarized shallow feature and deep feature, respectively, which are used for the recognition of the SAR ships. The content of this paper is organized as follows. In Section 2, the two-level feature-fusion ship recognition strategy is proposed. First, the HOG features of the dual-polarized SAR ship images are extracted, and then the Siamese network is used to extract the deep and shallow features from the dual-polarized SAR ship images. Then, the HOG features of the dual-polarized SAR ship images are fused respectively with the deep and shallow features through a feature fusion module. Finally, the fused features are used for the classification and recognition of the SAR ship targets. In Section 3, the experiment is conducted on the OpenSARShip2.0 dataset. Finally, a conclusion is presented in Section 4.
2. Two-Level Feature-Fusion Ship Recognition Strategy
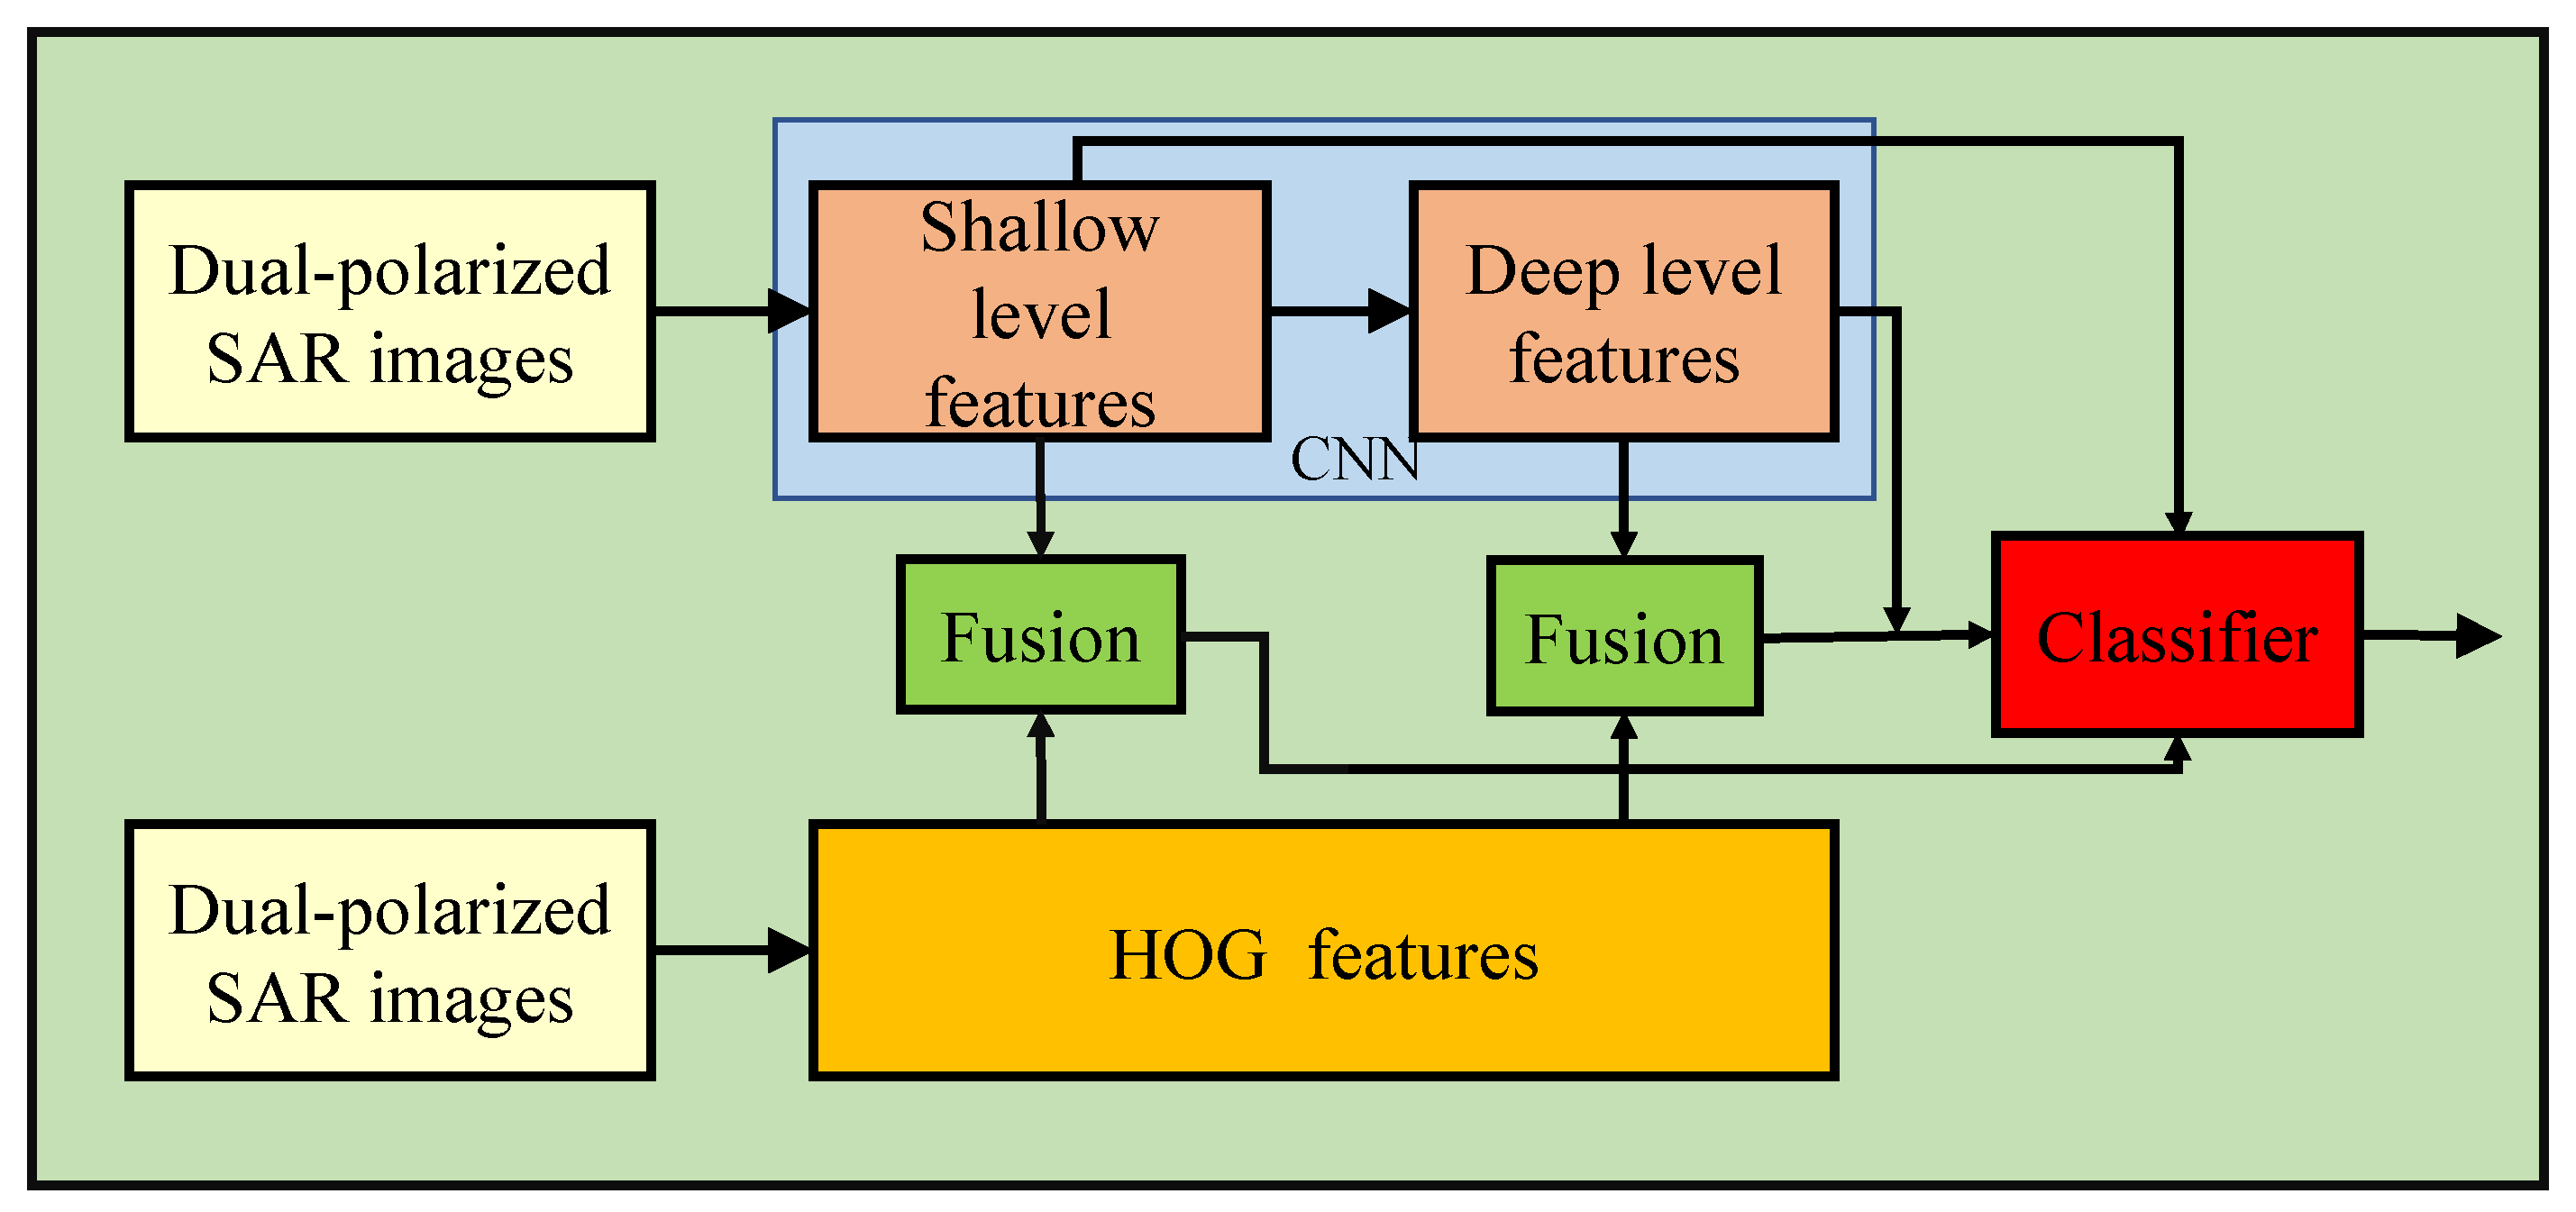
SAR ship target recognition has become a challenging task due to the unbalanced distribution of the data categories and unclear differences in the ship targets between the different categories. It can be said that the characteristics of the information and images are one of the important foundations for ensuring the effective recognition of SAR ship targets. Therefore, to improve recognition performance it is necessary to use the multiple sources of information as much as possible. Inspired by [14], this paper presents a recognition method based on the Siamese network architecture that integrates the HOG features with dual-polarized SAR ship images, which can be referred to as the HOG-SiamShipCLSNet. The overall process of this algorithm is shown in Figure 2.
The main idea of the proposed model is to fuse the features extracted by the HOG operator with the deep-level features and shallow-level features extracted by the CNN, respectively. Furthermore, it also fuses the deep-level features extracted by the CNN for the dual-polarized SAR images, and then fuses the shallow-level features extracted by the CNN for the dual-polarized SAR images. Then, several sets of the fused data are all fed into the classifier for the predictive classification, and the average value is used as the final output result. This is equivalent to providing multiple decision criteria for the classifier, enabling it to better avoid producing incorrect classification results and then improve the model performance.
2.1. HOG Feature Extraction
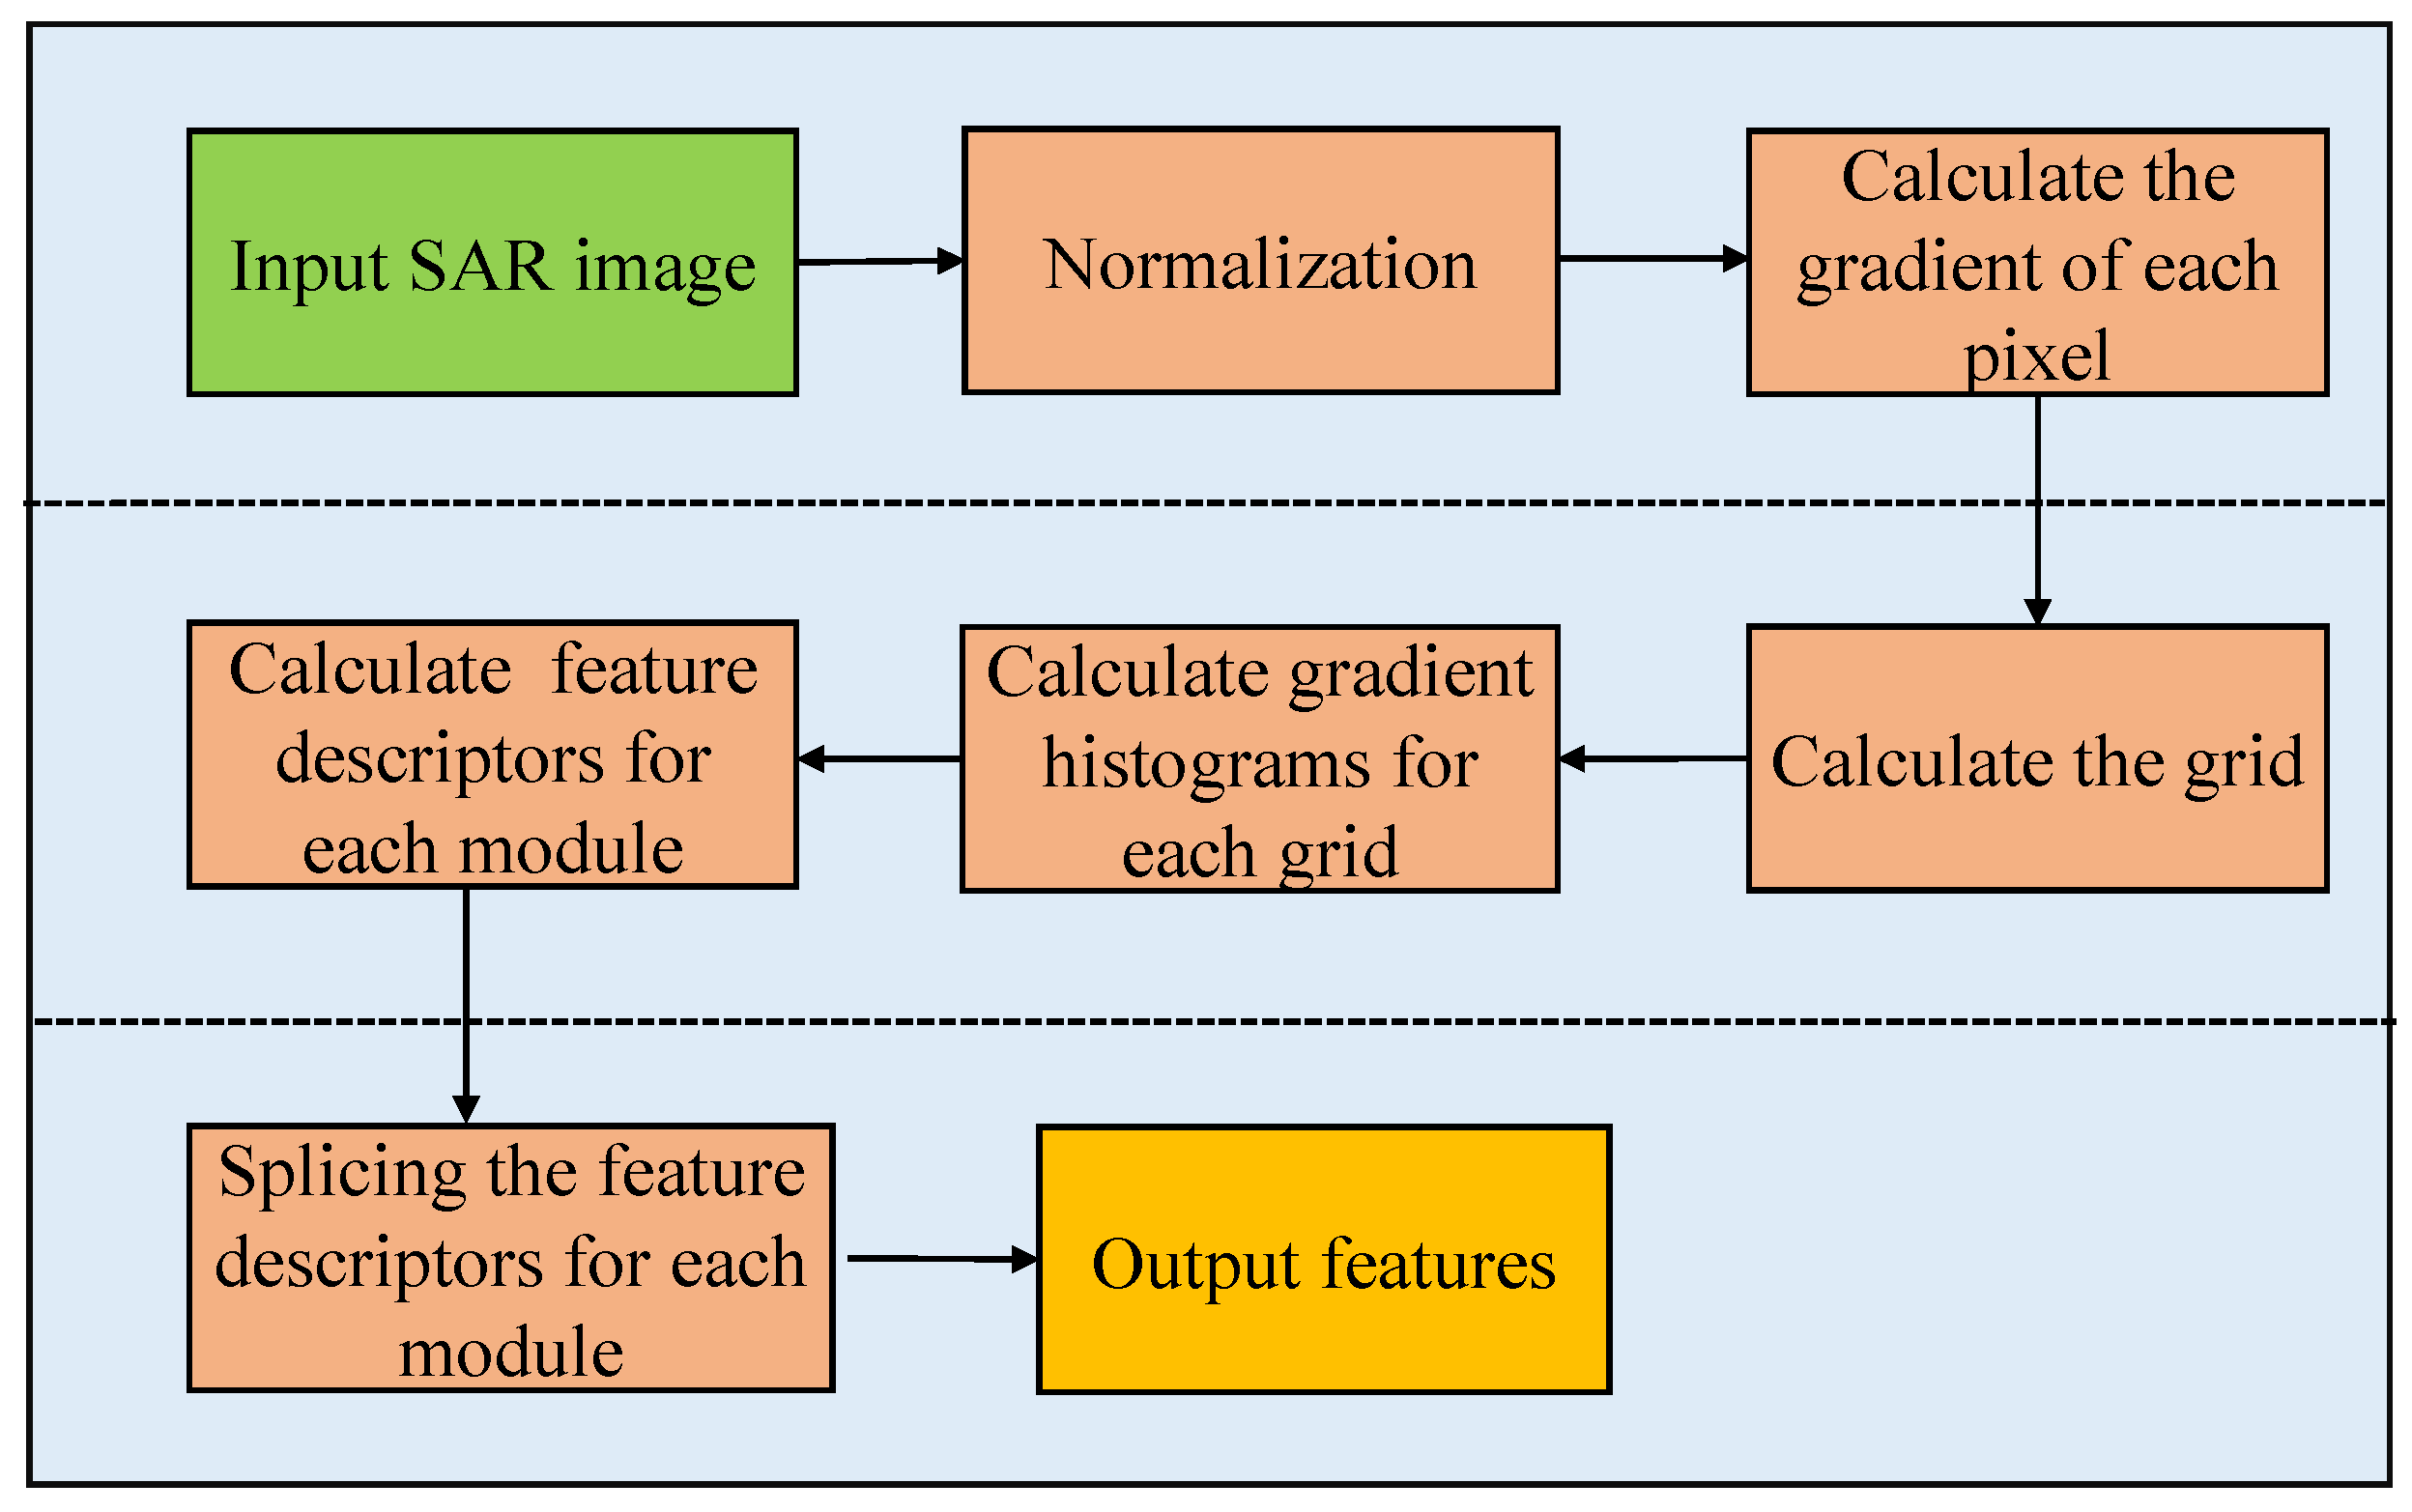
The proposed model aims to integrate the image features from the multiple sources to enhance the model ability of SAR ship recognition. Inspired by the reference [14], the manual features obtained by the HOG operator are also utilized. The HOG features are the extraction of the gradient statistical information from the images, which can describe the contour and local changes of the targets and are widely used in the field of images. Thus far, some scholars [15] from the SAR automatic target recognition community have applied the HOG feature to perform ship recognition, which has achieved reasonably fair results (although their methods were all traditional hand-crafted feature-based techniques) [14]. Thus, we will fuse the HOG features into abstract CNN-based features to further improve the SAR ship recognition performance by realizing the mutual complementarity of tradition and modernity. The brief process of the HOG feature extraction algorithm is shown in Figure 3.
First, the input SAR image is converted to a grayscale image, and then the normalization processing is conducted. The input SAR image size in this paper is set to 64 × 64. Then, the gradient of the pixel point is calculated using the pixel by pixel, including the amplitude and direction, which is given by
where, and represent the final calculated gradient amplitude and direction of the point, and represent the gradient amplitude in the horizontal and vertical directions, and represents the pixel grayscale value of the point. Besides, the image is divided into the multiple grids, and then the gradient histograms within each grid is counted. In this paper, the grid size is set to 16 × 16 (i.e., containing 64 pixels), where 16 × 16 is an experimental optimal value for the optimal performance. The number of the angles for the gradient histograms within each grid is set to 6 bins, that is, each bin is 60° (i.e., 360°/6). Besides, 2 × 2 grid sliding window is used to form the multiple modules on the image from top to bottom and from left to right, with a grid length as a step size. Within each module, the grayscale histograms of each cell are normalized to reduce the noise interference. Then, the grayscale histograms of each grid are concatenated to obtain the feature descriptors of the module. Finally, the feature descriptors of each module are concatenated to form the HOG features of the entire image. On the entire image with the size of 64 × 64, 16 cells and 9 modules are set, and the number of the gradient directions of each cell is 6, then the final output HOG feature length is 216. From the reference [14], the HOG features obtained in this paper have a shorter length, which it is a near-optimal value to achieve the best recognition performance of the SAR ship target, thus the principal component analysis step used to reduce the data dimension can be omitted.
2.2. Network Structure
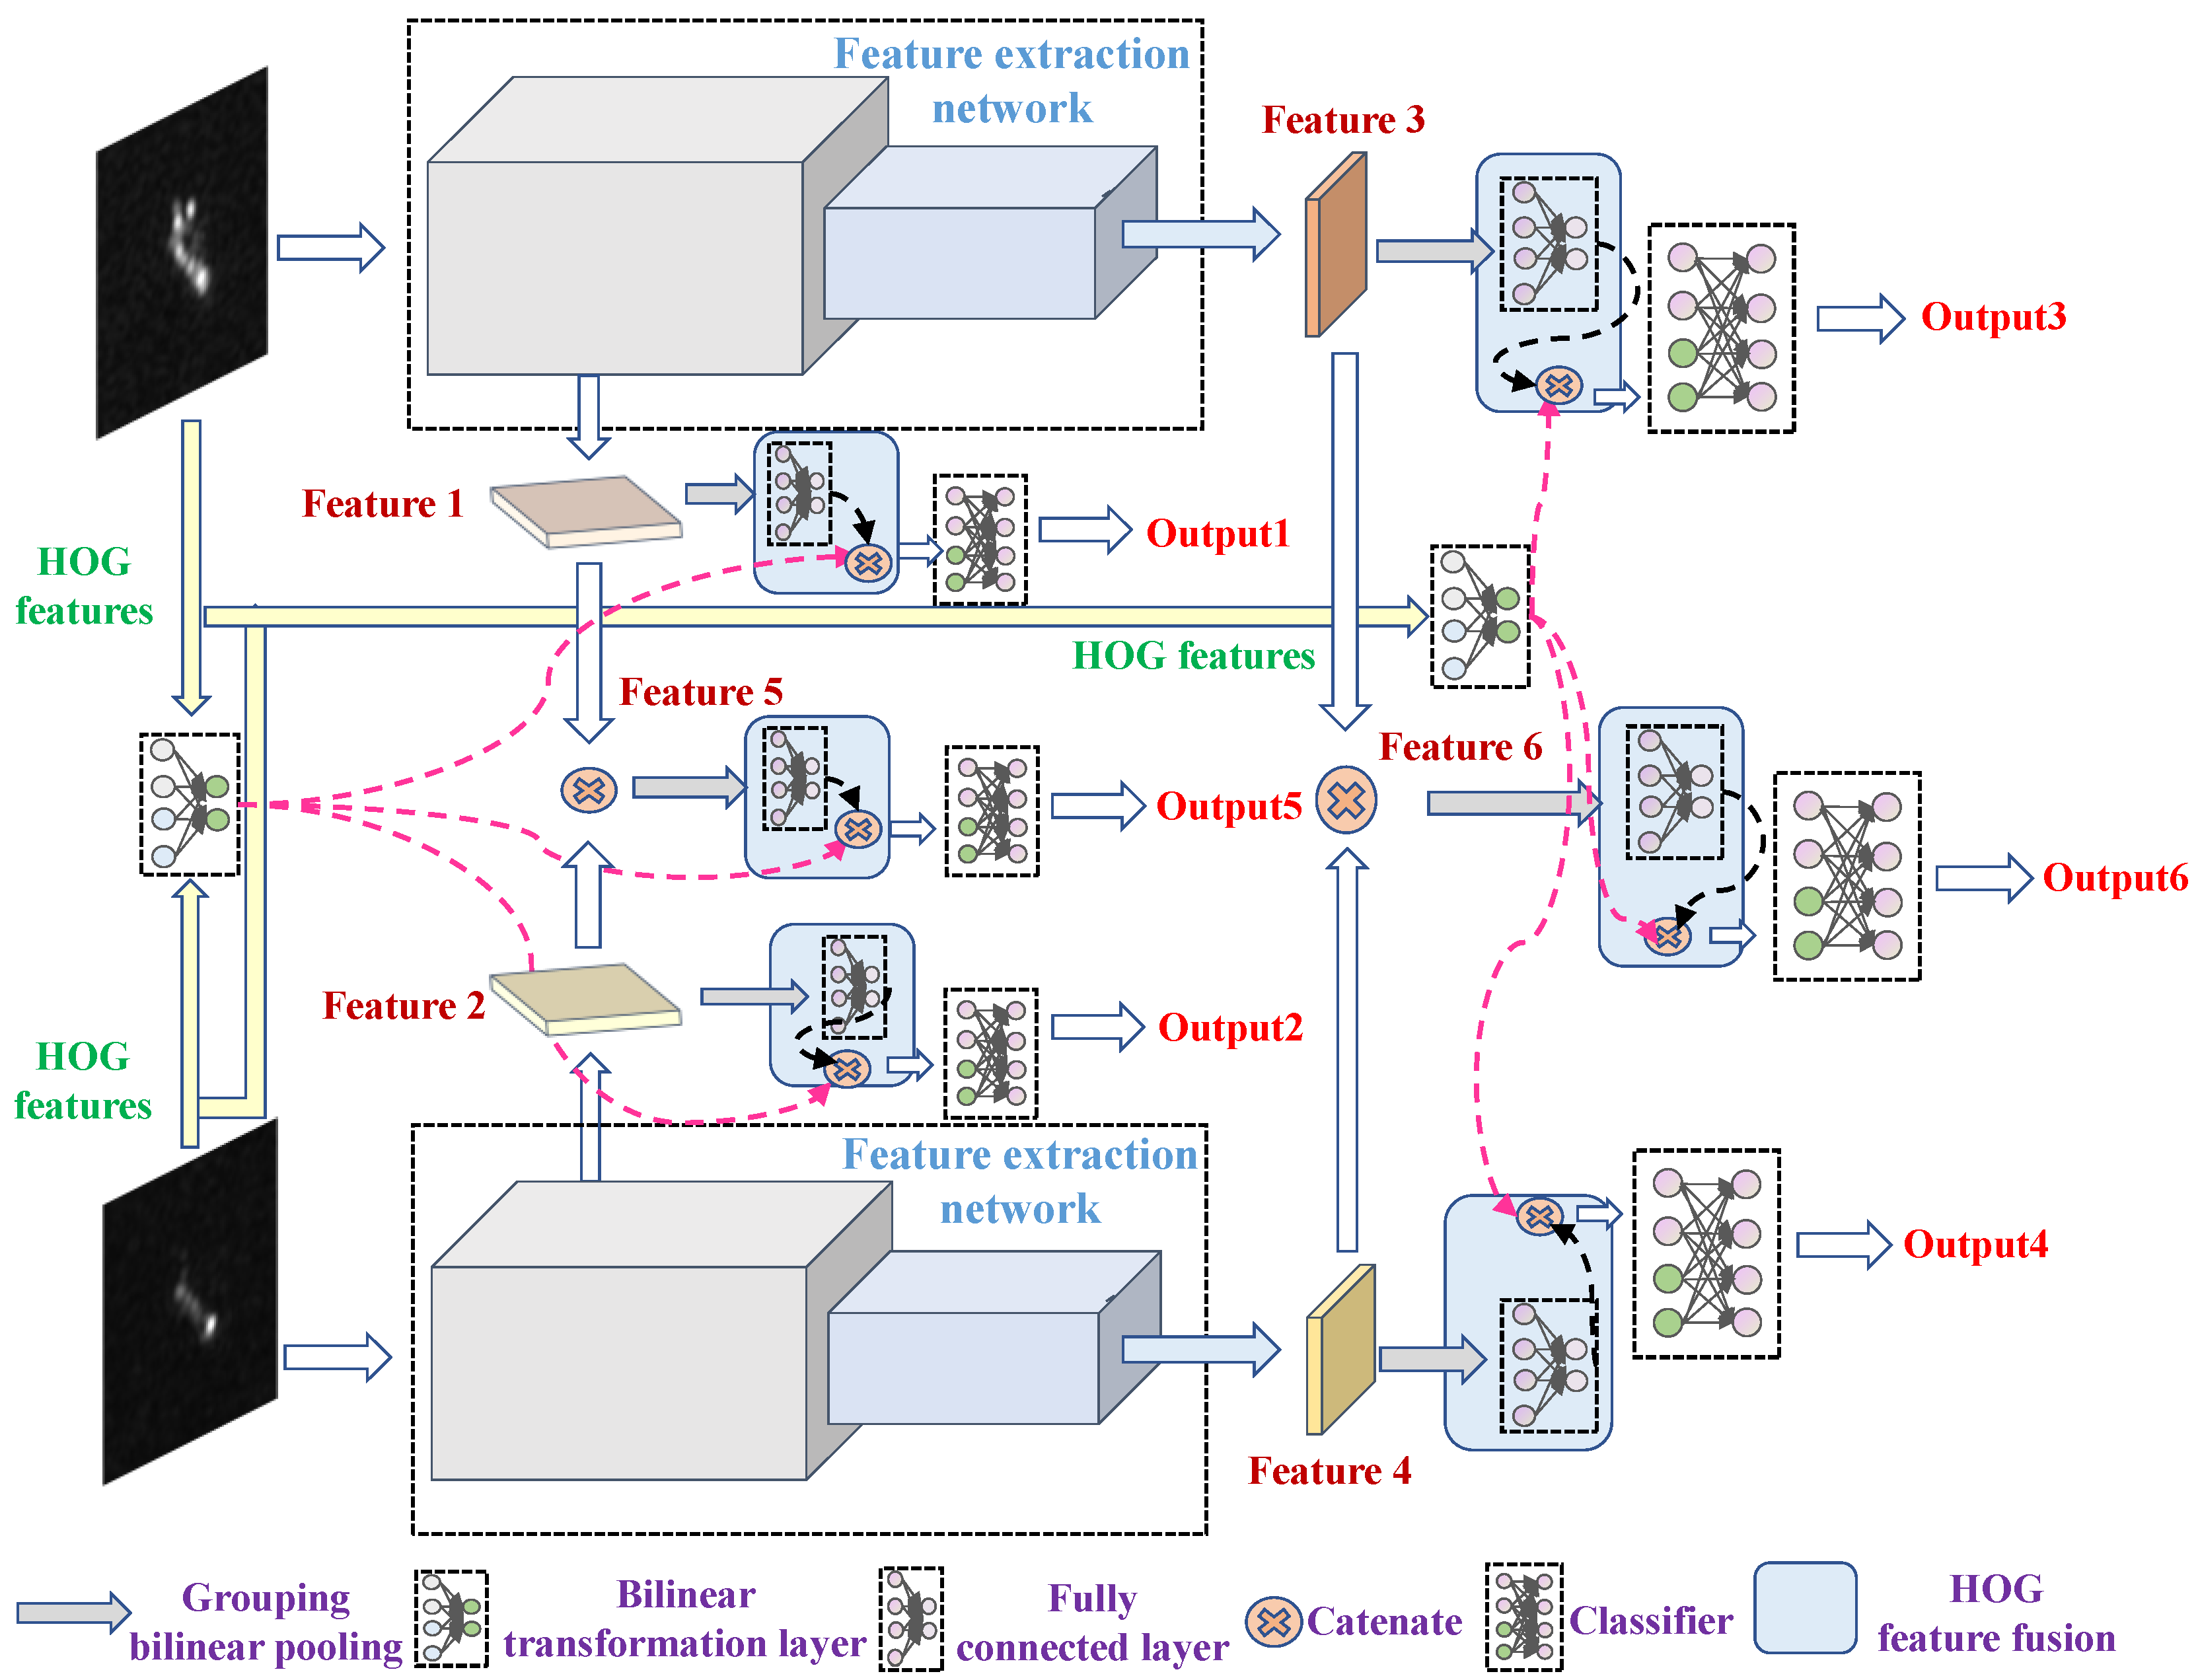
The structure of the proposed HOG-SiamShipCLSNet model for ship recognition is shown in Figure 4. The specific data processing flow of the model is as follows. Step 1: The Siamese network is used to extract the features of the paired SAR ship images in two polarization modes, and then the features at the depth of the backbone network are extracted for subsequent use. Step 2: For the image features of the two polarization modes, grouping bilinear pooling processing is used separately and crosswise to obtain six sets of the features. On the one hand, the goal is to reduce the data dimension, and on the other hand, the effect of fusing the two-polarization data is achieved. Step 3: Six sets of the features extracted in Step 2 are passed through a fully connected layer to obtain six sets of features with a length of 64. Step 4: The HOG operator is also used to extract the features from two-polarization images, and then the bilinear transform layer is used to preliminarily fuse the dual-polarization HOG features to obtain the features with a length of 64. Step 5: The HOG features obtained in Step 4 with the six sets of the features obtained in Step 3 have been catenated; this means they can obtain the final six sets of the fused features with a length of 128. Step 6: The fused features are fed into the same classifier to obtain six sets of the outputs. In the test stage, the average value of the six groups of the outputs is taken as the overall output of the model, while in the training stage, the six groups of the outputs are used to calculate the loss values, respectively, and then add them together to obtain the overall loss function value, which is used to supervise the model training.
2.2.1. Backbone Network
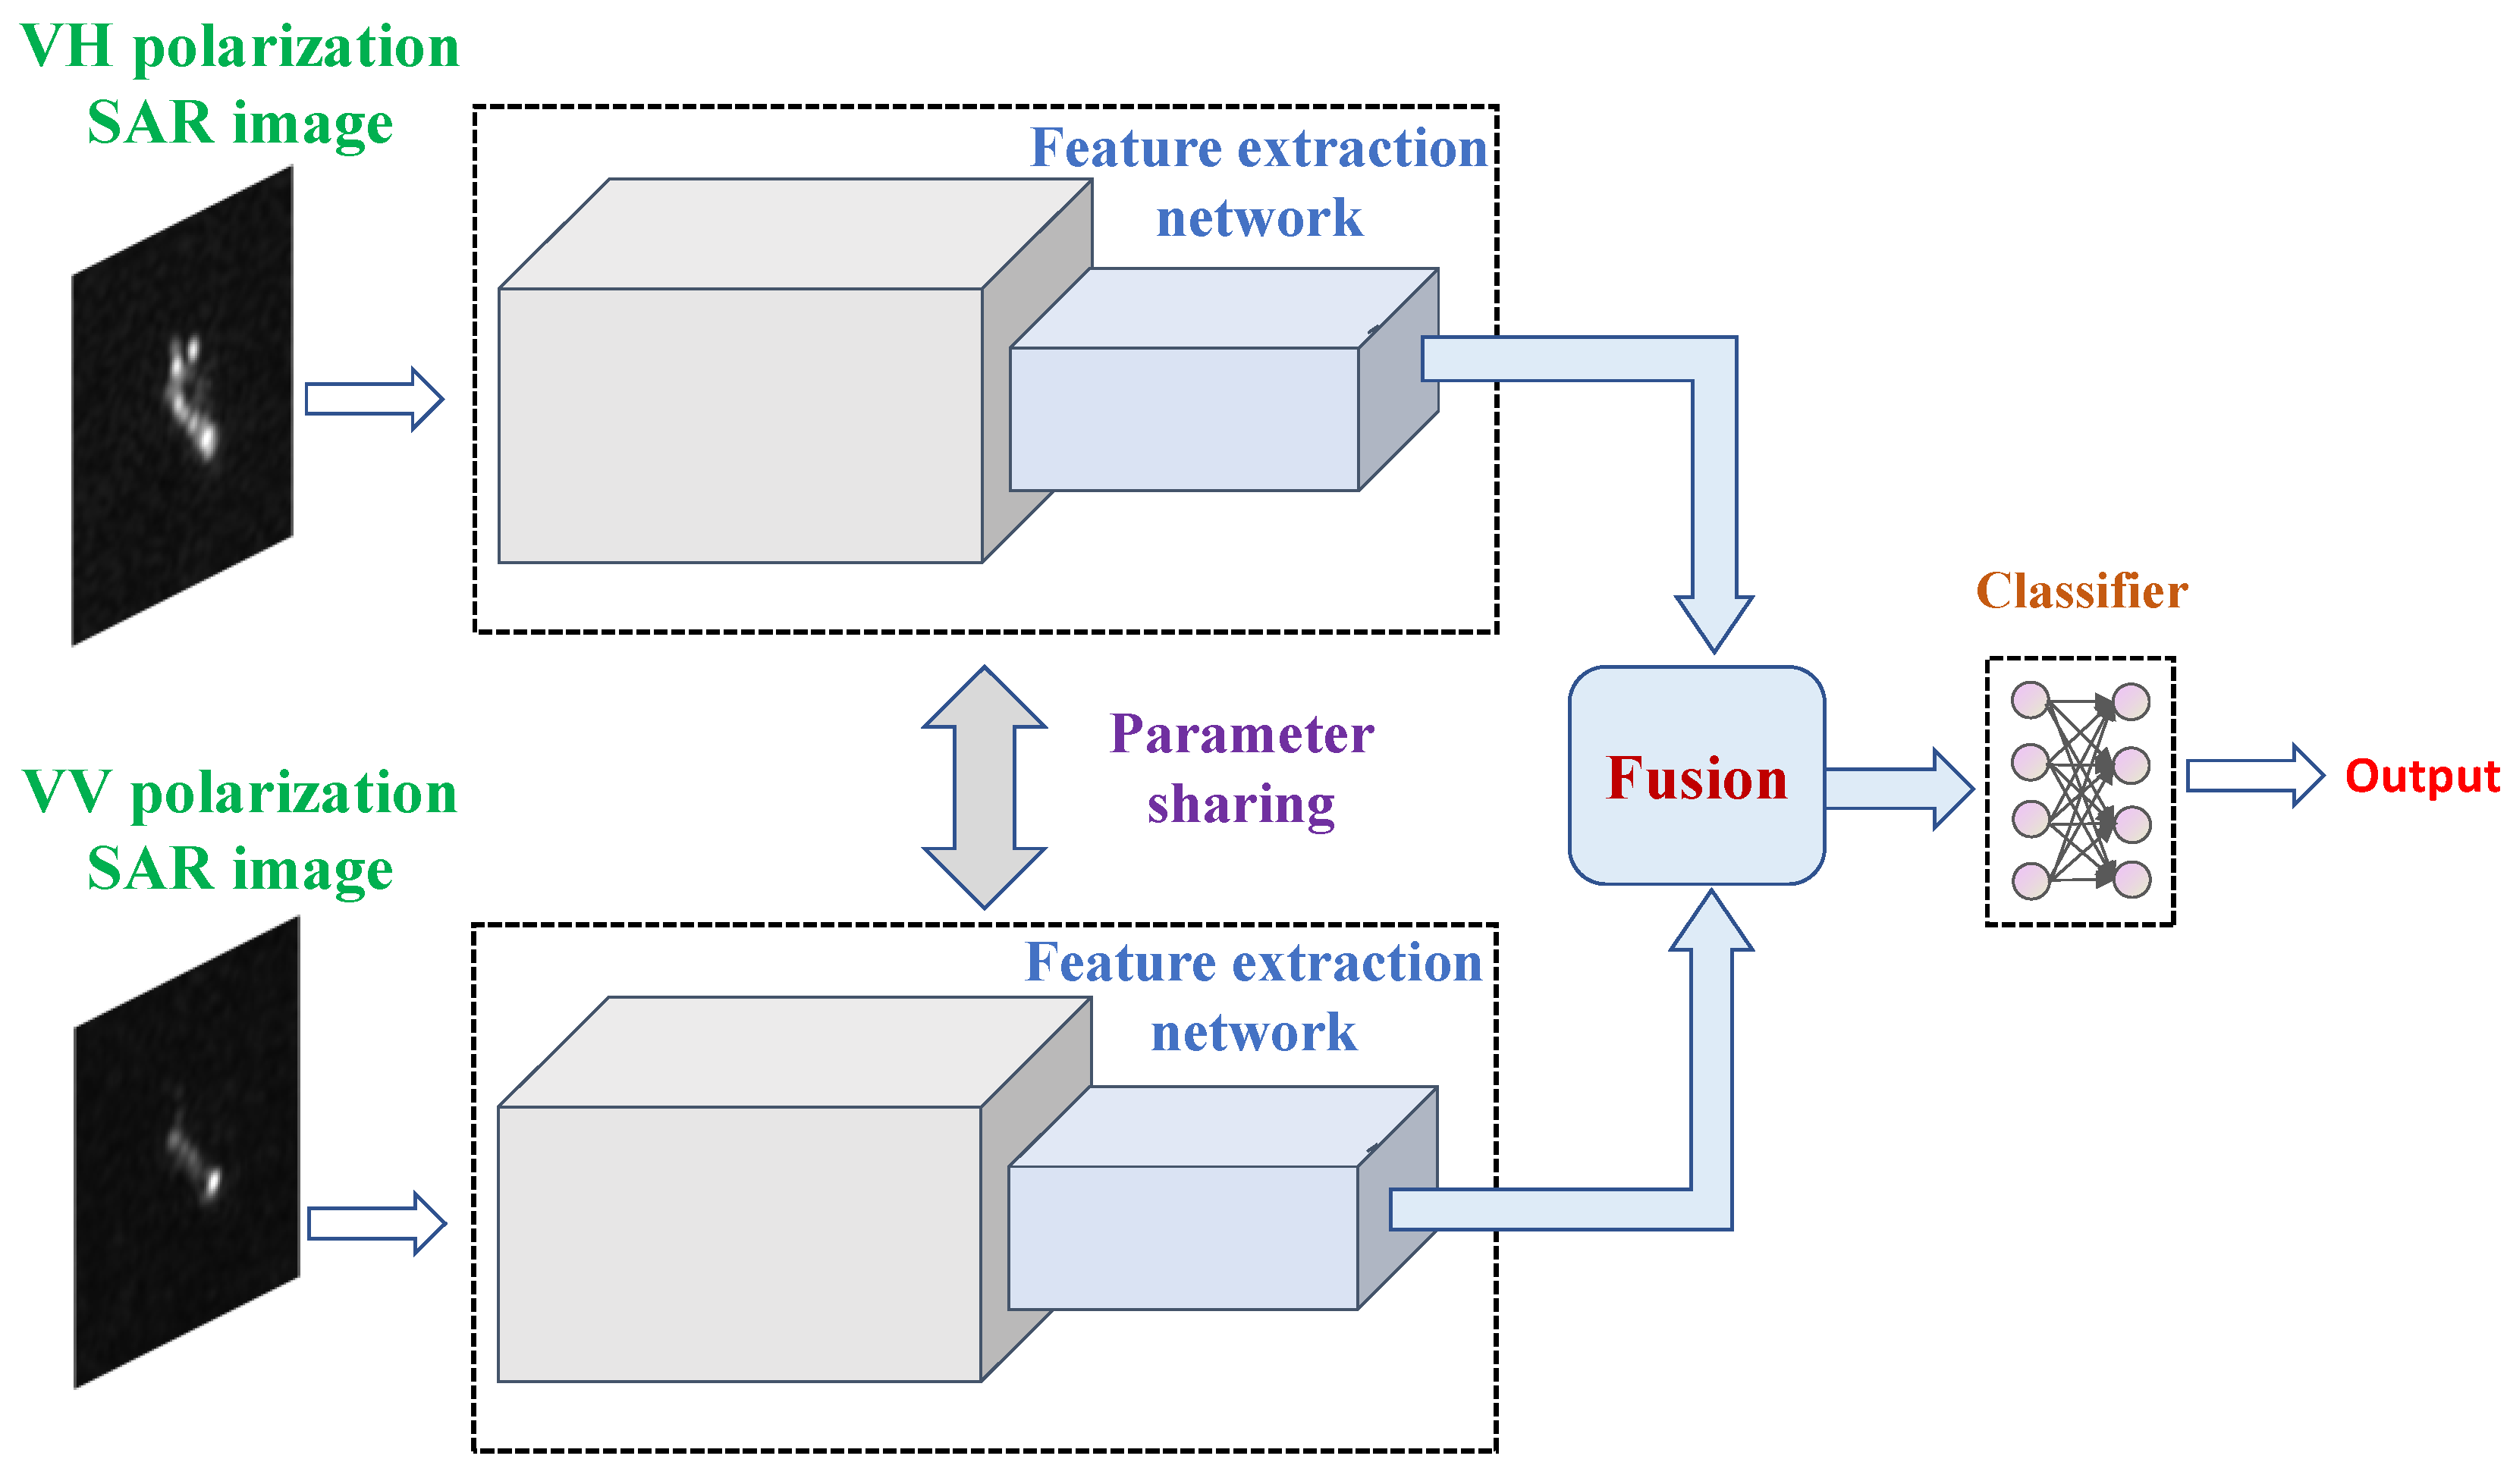
A Siamese network refers to a model with two identical subject networks, and the parameters of the Siamese subjects are shared. It is often used in the fields of face recognition, image registration, etc. It determines whether the image pair belongs to the same category by measuring the difference between the pairs of the inputs.
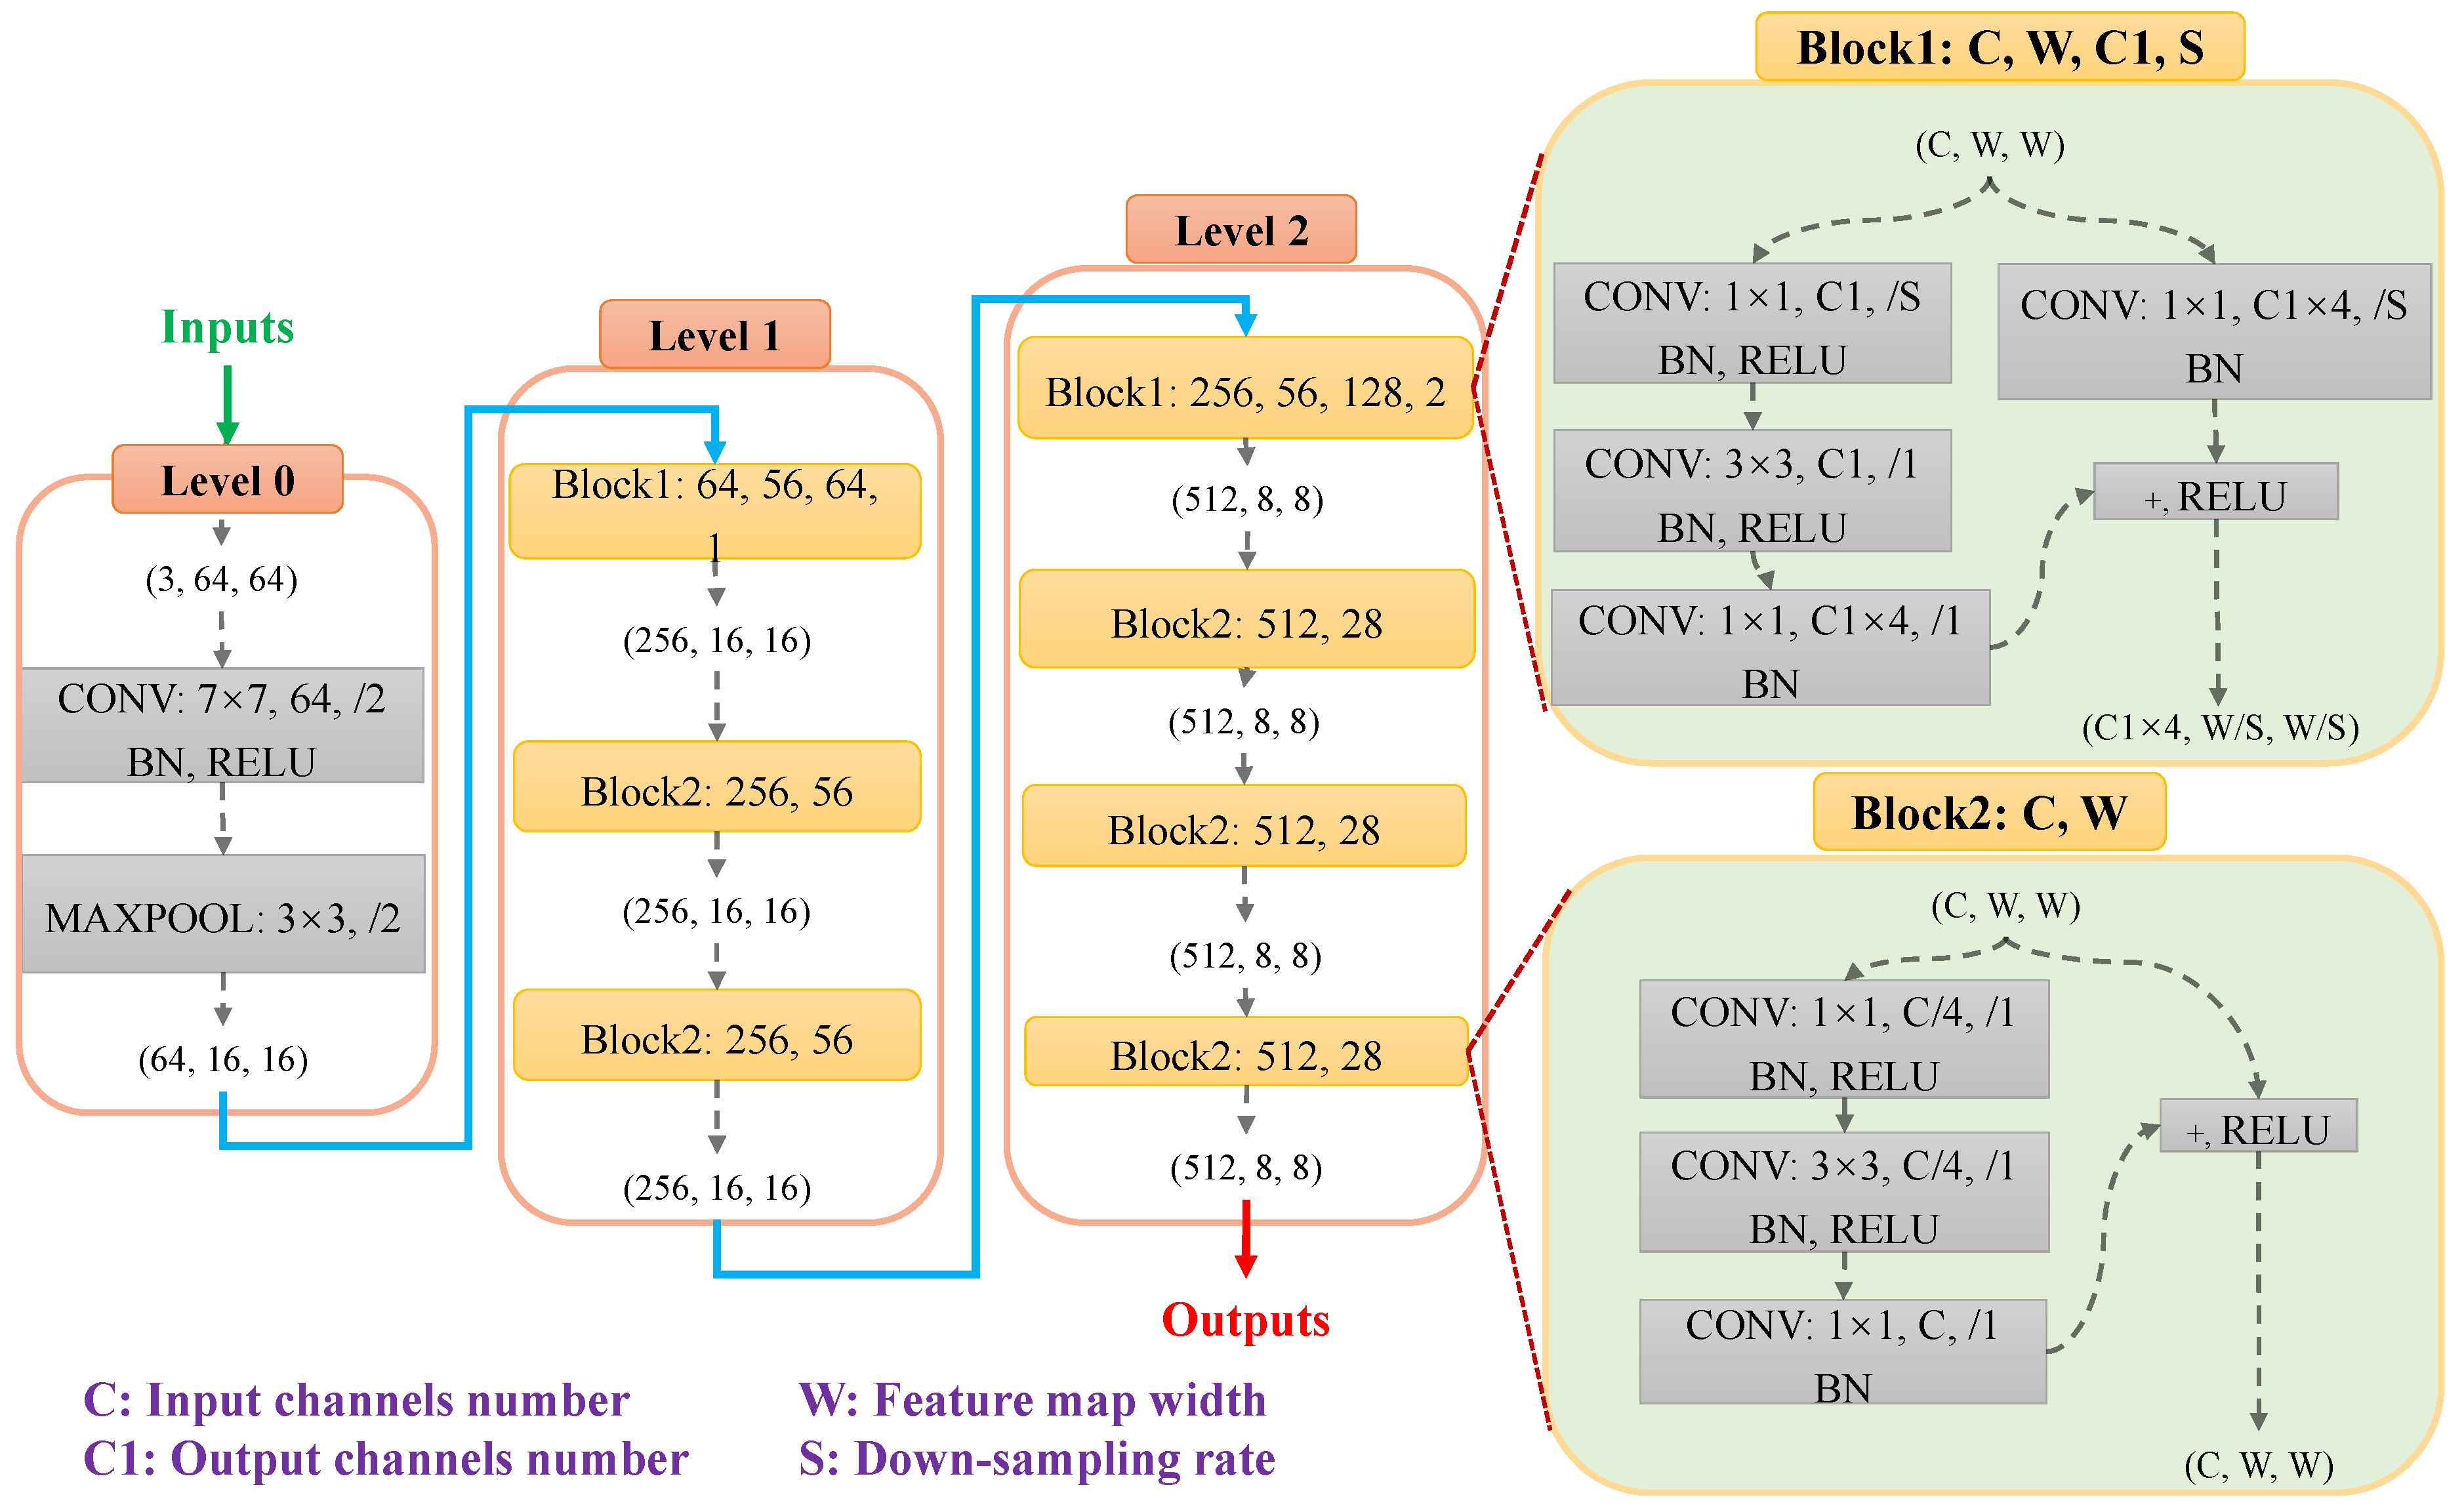
The main body of the proposed model also adopts a Siamese network architecture, as shown in Figure 5, but does not use the one-shot learning method commonly used in tasks such as facial recognition to identify the ship categories. The proposed HOG-SiamShipCLSNet model uses a Siamese network to fuse the dual-polarized SAR ship image data. After obtaining the features of the dual-polarized SAR images through the main feature extraction network, grouping bilinear pooling is used for the fusion. The useful information in the dual-polarized SAR images is fully utilized, thereby improving the recognition ability of the network. The structure of the feature extraction backbone network is shown in Figure 6, which follows the design of the hop layer connection of the residual networks (ResNet). The backbone network mainly consists of three layers. The first layer consists of a convolution layer and a pooling layer, with a lower sampling rate of 4. The second layer contains three skip-layer-connected convolutional blocks, among which the left bypass of Block1 contains three convolutional layers, and the right bypass contains one convolutional layer, which is merged through the skip-layer connections. The same applies to Block2, except that the right-side bypass merges directly with the left-side bypass without passing through the convolutional layer. For the proposed model in this section, the features with the dimensions of (256, 16, 16) and (512, 8, 8) output at levels 1 and 2 are extracted for fusion processing, which can achieve the goal of two-level fusion.
2.2.2. Feature Fusion Processing
The feature fusion processing in the proposed model mainly involves the bilinear transformation layer, grouping bilinear pooling process and concatenation operation. First, the bilinear transformation layer is used for fusing the dual-polarized HOG features; then, the grouping bilinear pooling process is used for fusing the shallow and deep features extracted by the Siamese network; and finally, the concatenation operation is used for fusing the HOG features and features extracted by the neural network. The bilinear transformation layer can fuse two input features, and its mapping relationship is shown in the following
where, and represent the two inputs of the bilinear transformation layer, they represent the HOG features of the two polarization images in this section. and represent the learnable weights and biases of the layer, and represents the output of the bilinear transformation layer.
The grouping bilinear pooling used in this section is an adjustment to the method proposed in [12], which is also an extension of the initial version of bilinear pooling [16]. The specific formulas for the bilinear pooling are shown as follows:
where is the pending features with dimensions of . and respectively represent the height and width of the two-dimensional feature map corresponding to the certain channel of the feature , and is the number of the channels. represents the two-dimensional matrix with the dimensions , which is obtained by flattening the feature map with the size of corresponding to each channel of the input feature . represents the vector after the final bilinear pooling, represents the normalization, and represents the Sign function, whose expression is as follows
According to Formulas (6) and (7), the feature length of channels after the bilinear pooling is . If the number of the input feature channels is large, the pooled feature length will greatly increase the number of the parameters in the subsequent full connection layer. The idea of grouping bilinear pooling is consistent with the idea of reducing the number of the parameters in the grouping convolution, which is to group the input features according to a certain number of channels, then perform the bilinear pooling processing within the group and finally concatenate them. The output data length after the grouping bilinear pooling processing is shown as follows:
where represents the number of the groups.
Compared to directly performing the bilinear pooling, it can greatly reduce the length of the output features, thereby reducing the number of parameters in the subsequent connection layers. The processing formulas for the grouping bilinear pooling fusion of the dual-polarization image features used in this paper are as follows:
where, represents the bilinear pooling processing, and represents the vectors calculated by concatenating each group. Equation (10) represents the cross grouping bilinear pooling processing of the dual-polarized data to achieve the purpose of the fusion. Splicing is the most basic fusion operation, which involves concatenating two feature tensors together in the channel dimension (or other dimensions) to form a new larger tensor for the subsequent processing.
2.2.3. Loss Function
As explained in Section 2.2.2, the specific operation process of the model involves fusing data from the multiple sources to obtain six sets of fused features that are fed into the classifier, resulting in six sets of output values in a single forward propagation process. This paper calculates the loss function between the six sets of output values and the real value respectively, and then takes the average value as the overall loss value, which is then used for the back propagation to update the network parameters, which are shown as follows:
where, refers to the i-th output, refers to the label, and Cross entropy Loss function is used for the calculation of each sub Loss function. Its formula is as follows
where, represents the label value, represents the predicted value, corresponding to the likelihood of the current image belonging to that category, and represents the label length representing the number of categories.
3. Experimental Results and Analysis
3.1. Experimental Setup
In this paper, the OpenSARShip2.0 dataset released by Shanghai Jiao Tong University [6] was adopted as the experimental data, which includes 34,528 SAR ship image slices, mainly obtained from the Sentinel-1 satellite SAR system. It includes two interference wideband modes: single look complex (SLC) and ground range detected (GRD). Each ship SAR image slice is verified by a maritime traffic website or automatic identification system (AIS) to ensure the accuracy of the label. The resolution of the GRD mode is 20 × 22 m, while the resolution of the SLC mode is from 2.7 × 22 m to 3.5 × 22 m. The imaging area of the SAR image slice includes many port regions such as Shanghai and Shenzhen, and there is no interference such as land background. The same ship contains sliced pairs of the VV and VH polarization modes. There are more than 10 types of ship categories in the entire dataset, but the distribution of the category numbers is extremely uneven. Usually, several of them are selected for the experiments and analysis. In this paper, a relatively large number of cargo (with the chip number 21241), tanker (with the chip number 6343), fishing (with the chip number 454), and other type (with the chip number 5224) [6] have been selected for ship recognition and classification in the experiments.
The number of SAR images in the training set and test set was divided in the ratio of 3:1, and the input SAR image size was adjusted to 64 × 64. An Adam optimizer was used for the model training. For the neural network trained in this experiment, the batchsize was set to 32, and the learning rate was set to 0.0001. In the above dataset, the experiment uses a server equipped with a graphics card of the NVIDIA GeForce 3090 and central processing unit (CPU) of the Intel (R) Xeon (R) E5-2678 v3 @ 2.50 GHz model. The operating system is ubuntu 22.04 LTS, and the software development uses the Pytorch 1.13 framework and accelerates the model using the CUDA11.7.
3.2. Evaluating Indicator
In this paper, the common evaluation indicators in the field of general image recognition are used to evaluate the recognition performance of the models involved in the experiment, mainly including the precision, recall rate, and score. The recognition precision, recall rate and score of the single category SAR images can be given as follows:
where represents the number of correctly classified targets in this category, represents the number of falsely identified targets in this category, and represents the number of falsely negative targets in this category that are only recognized as the other categories. Due to the uneven distribution of the number of targets on the various types of ships, for a fair evaluation we use the proportion of the number of ship images as a weighting factor to calculate the weighting value as the overall evaluation index. The specific formulas are as follows:
where, represents the number of all SAR images, represents the number of the SAR images of this category, and represents the number of the categories. The weighted recall rate is equal to the accuracy, which is the proportion of all correctly predicted samples to the total number of samples.
3.3. Experiment and Analysis
3.3.1. Recognition Performance
To verify the effectiveness of the proposed HOG-SiamShipCLSNet strategy, the experiment compared the models with the multiple paradigms. The mainstream classification network based on the CNN selects the ResNet (including 18, 34 and 50 depths) [17], densely connected convolutional network (DenseNet) (including 121 and 161 sizes) [18], VGG16 [19], MobileNet-v2 [20], and AlexNet [21]. The classification network based on the visual transformer selects the ViT [22] and ResNet50ViT. ResNet50ViT is the fusion of the CNN and ViT, which first uses the backbone network of the ResNet50 to extract the image features, then sends the features to the ViT for further learning and finally gives the classification results. In order to verify the effectiveness of the Siamese network used to fuse the dual polarimetric SAR image data, this paper also builds a comparative experimental model based on the network architecture shown in Figure 5 and the backbone network shown in Figure 6. To facilitate the differentiation, these two networks are respectively called the SiamShipCLSNet (Mul) and SiamShipCLSNet (group bilinear) in this paper. The data fusion mode (element-by-element multiplication, and group bilinear pooling) is indicated in parentheses. The comparative experimental results are summarized in Table 1.
Based on the experimental data, it is not difficult to see that the proposed HOG-SiamShipCLSNet model, which integrates the HOG and dual polarization SAR ship image data, achieved the best results in the precision, recall, and F1 score of 0.6787, 0.7017, and 0.6822, respectively. Secondly, two experimental models based on the Siamese network architecture, the SiamShipCLSNet (Mul) and SiamShipCLSNet (Group bilinear), which fuse the dual polarization SAR ship image data, perform better than the other models. Among them, the SiamShipCLSNet (Group bilinear) model achieves the scores of 0.6658, 0.6905, and 0.6707 in precision, recall, and F1 scores, respectively, which is second only to the performance of the proposed HOG-SiamShipCLSNet model. Therefore, it can be considered that the proposed recognition network and design scheme based on the Siamese network fusion of the multiple polarization SAR image data are very effective. This phenomenon is in line with the reports of [14], because ships generally exhibit different backscattering values in the dual-polarized SAR images in the OpenSARShip2.0 dataset, which is helpful for ship recognition and classification. Therefore, introducing the multiple data sources and carefully designing the network can effectively improve the performance of the proposed HOG-SiamShipCLSNet model.
Further analyzing the experimental data, it can easily be found that the experimental model of the transformer architecture performs the worst. One of the important reasons is that the transformer needs more training data than the traditional CNN, and the small amount of SAR ship image data is not conducive to the transformer’s excellent performance, such as the optical image classification tasks. For the mainstream CNN - classification network used in the experiment, the DenseNet161 achieved the best performance, while the lightweight design of the Mobillenet-v2 network produced the worst performance, with an F1 score of only 0.5974, which may be due to its poor learning ability.
3.3.2. Model Parameter
The model parameter quantity is also one of the important evaluation indicators for evaluating the resource utilization demand of the models. When the performance difference of the model is small, the strong advantages of the model with the small parameter quantity will be demonstrated during the deployment. Although the performance of the CNN in the various tasks is improving day by day, the network size is also starting to rise; therefore, its model parameters must be evaluated.
Table 2 shows the mode parameter size of the experimental model in this paper, and the unit of the data is M. According to the data, it can be seen that the proposed HOG-SiamShipCLSNet model integrating the multi-source features and achieves the optimal recognition performance while only occupying a parameter size of 7.81 M. Although some experimental modes (such as the SiamShipCLSNet, Mobillenet-v2 and DenseNet121) have a small parameter size, their recognition performance is worse compared to the proposed HOG-SiamShipCLSNet model in this paper.
4. Conclusions
Firstly, due to the lack of clear features and small inter-class differences in SAR ship images, SAR ship recognition has become a challenging task. Secondly, the existing SAR ship image dataset has limited data and unbalanced class distribution, which is not conducive to learning the deep learning models. Finally, SAR imaging has different polarization modes, and the images under the different polarization modes contain different information about the same target, which should be comprehensively utilized to improve the recognition ability of the network.
This paper presents a two-level feature-fusion ship recognition strategy combining the HOG features with the dual-polarized data in the SAR images, which comprehensively utilizes the features extracted by the HOG operator and dual-polarized SAR ship images, thereby increasing the amount of information for the model learning. First, the Siamese network was used to extract the shallow and deep features from the dual-polarized SAR ship images, and then the HOG features of the dual-polarized SAR ship images were also extracted. Subsequently, the HOG features of the dual-polarized SAR ship images were fused respectively with the shallow and deep features through a feature fusion module. Finally, the fused features were used for the classification and recognition of the SAR ship targets. The ship recognition experiment was conducted on an OpenSARShip2.0 dataset, which shows that the proposed strategy can effectively improve the recognition performance of SAR ships by fusing the dual-polarized SAR images at different levels, thereby proving the effectiveness of the proposed strategy. In further work, more effective information (such as the prior information like SAR imaging characteristics) and more effective fusion methods should be conducted [23].
Author Contributions
Conceptualization, H.X. and J.H. (Jun Hu); methodology, H.X. and J.H. (Jinfeng He); software, H.X. and J.H. (Jinfeng He); validation, H.X. and J.H. (Jun Hu); formal analysis, H.X. and Z.L.; investigation, H.X. and J.H. (Jinfeng He); resources, H.X. and Z.L.; data curation, H.X. and J.H. (Jun Hu); writing—original draft preparation, H.X. and J.H. (Jinfeng He); writing—review and editing, H.X., Z.L. and J.H. (Jun Hu); visualization, H.X. and J.H. (Jinfeng He); supervision, H.X. and J.H. (Jun Hu); project administration, H.X. and J.H. (Jun Hu); funding acquisition, H.X., J.H. (Jun Hu) and Z.L. All authors have read and agreed to the published version of the manuscript.
Funding
This research is co-supported by the Guangdong Basic and Applied Basic Research Foundation (Grants No. 2021A1515010768 and No. 2023A1515011588), the Shenzhen Science and Technology Program (Grant No. 202206193000001, 20220815171723002), the Beijing Nova Program (Grant No. Z201100006820103), and the National Natural Science Foundation of China (Grant No. 62001523, No. 62203465, No. 62201614 and No. 6210593).
Data Availability Statement
Not applicable.
Acknowledgments
The authors would like to thank the editors and reviewers for their very competent comments and helpful suggestions to improve this paper. We would also like to thank Shanghai Jiao Tong University for providing the OpenSARShip2.0 datasets.
Conflicts of Interest
The authors declare no conflict of interest.
References
- Huang, J.; An, D.; Chen, L.; Feng, D.; Zhou, Z. An NSST-Based Fusion Method for Airborne Dual-Frequency, High-Spatial-Resolution SAR Images. IEEE J. Sel. Top. Appl. Earth Obs. Remote Sens. 2023, 16, 4362–4370. [Google Scholar] [CrossRef]
- Ge, B.; An, D.; Liu, J.; Feng, D.; Chen, L.; Zhou, Z. Modified Adaptive 2-D Calibration Algorithm for Airborne Multichannel SAR-GMTI. IEEE Geosci. Remote Sens. Lett. 2023, 20, 1–5. [Google Scholar] [CrossRef]
- Luo, Y.; An, D.; Wang, W.; Chen, L.; Huang, X. Local Road Area Extraction in CSAR Imagery Exploiting Improved Curvilinear Structure Detector. IEEE Trans. Geosci. Remote Sens. 2022, 60, 1–15. [Google Scholar] [CrossRef]
- Hu, X.; Xie, H.; Zhang, L.; Hu, J.; He, J.; Yi, S.; Jiang, H.; Xie, K. Fast Factorized Backprojection Algorithm in Orthogonal Elliptical Coordinate System for Ocean Scenes Imaging Using Geosynchronous Spaceborne–Airborne VHF UWB Bistatic SAR. Remote Sens. 2023, 15, 2215. [Google Scholar] [CrossRef]
- Jiang, X.; Xie, H.; Chen, J.; Zhang, J.; Wang, G.; Xie, K. Arbitrary-Oriented Ship Detection Method Based on Long-Edge Decomposition Rotated Bounding Box Encoding in SAR Images. Remote Sens. 2023, 15, 673. [Google Scholar] [CrossRef]
- Li, B.; Liu, B.; Huang, L.; Guo, W.; Zhang, Z.; Yu, W. OpenSARShip 2.0: A large-volume Dataset for Deeper Interpretation of Ship Targets in Sentinel-1 Imagery. In Proceedings of the SAR in Big Data Era: Models, Methods and Applications (BIGSARDATA), Beijing, China, 13–14 November 2017; pp. 1–5. [Google Scholar]
- Ma, H.; Shao, L.; Jin, X.; Xu, G.L. Advances in Ship Target Recognition Technology. Sci. Technol. Rev. 2019, 37, 65–78. [Google Scholar]
- Dong, J.; Li, Y.; Deng, B. Ship Targets Recognition by Ships Feature in SAR Image. J. Shaanxi Norm. Univ. 2014, 32, 203–205. [Google Scholar]
- Wang, B.; Thomas, B. Generic, Model-Based Estimation and Detection of Peaks in Image Surfaces. In Proceedings of the Image Understanding Workshop, Palm Springs, CA, USA, 12–15 February 1996; pp. 913–922. [Google Scholar]
- Xi, Y.; Xiong, G.; Yu, W. Feature-loss Double Fusion Siamese Network for Dual-polarized SAR Ship Classification. In Proceedings of the IEEE International Conference on Signal, Information and Data Processing (ICSIDP), Chongqing, China, 11–13 December 2019; pp. 1–5. [Google Scholar]
- He, J.; Chang, W.; Wang, F.; Wang, Q.; Li, Y.; Gan, Y. Polarization Matters: On Bilinear Convolutional Neural Networks for Ship Classification from Synthetic Aperture Radar Images. In Proceedings of the International Conference on Natural Language Processing (ICNLP), Xi’an, China, 25–27 March 2022; pp. 315–319. [Google Scholar]
- He, J.; Chang, W.; Wang, F.; Liu, Y.; Wang, Y.; Liu, H.; Li, Y.; Liu, L. Group Bilinear CNNs for Dual-Polarized SAR Ship Classification. IEEE Geosci. Remote Sens. Lett. 2022, 19, 1–5. [Google Scholar] [CrossRef]
- Shao, Z.; Zhang, T.; Ke, X. A Dual-Polarization Information-Guided Network for SAR Ship Classification. Remote Sens. 2023, 15, 2138. [Google Scholar] [CrossRef]
- Zhang, T.; Zhang, X.; Ke, X.; Liu, C.; Xu, X.; Zhan, X.; Wang, C.; Ahmad, I.; Zhou, Y.; Pan, D.; et al. HOG-ShipCLSNet: A Novel Deep Learning Network with HOG Feature Fusion for SAR Ship Classification. IEEE Trans. Geosci. Remote Sens. 2022, 60, 1–22. [Google Scholar] [CrossRef]
- Lin, H.; Song, S.; Yang, J. Ship Classification Based on MSHOG Feature and Task-driven Dictionary Learning with Structured Incoherent Constraints in SAR Images. Remote Sens. 2018, 10, 190. [Google Scholar] [CrossRef]
- Lin, T.; RoyChowdhury, A.; Maji, S. Bilinear CNN Models for Fine-Grained Visual Recognition. In Proceedings of the IEEE International Conference on Computer Vision (ICCV), Santiago, Chile, 11–18 December 2015; pp. 1449–1457. [Google Scholar]
- He, K.; Zhang, X.; Ren, S.; Sun, J. Deep Residual Learning for Image Recognition. In Proceedings of the IEEE Conference on Computer Vision and Pattern Recognition (CVPR), Las Vegas, NV, USA, 27–30 June 2016; pp. 770–778. [Google Scholar]
- Huang, G.; Liu, Z.; Van Der Maaten, L.; Weinberger, K. Densely Connected Convolutional Networks. In Proceedings of the IEEE Conference on Computer Vision and Pattern Recognition (CVPR), Honolulu, HI, USA, 21–26 July 2017; pp. 2261–2269. [Google Scholar]
- Simonyan, K.; Zisserman, A. Very Deep Convolutional Networks for Large-Scale Image Recognition. arXiv 2014, arXiv:1409.1556. [Google Scholar]
- Howard, A.; Zhu, M.; Chen, B.; Kalenichenko, D.; Wang, W.; Weyand, T.; Andreetto, M.; Adam, H. MobileNets: Efficient Convolutional Neural Networks for Mobile Vision Applications. arXiv 2017, arXiv:1704.04861. [Google Scholar]
- Krizhevsky, A.; Sutskever, I.; Hinton, G. ImageNet Classification with Deep Convolutional Neural Networks. Commun. ACM 2017, 60, 84–90. [Google Scholar] [CrossRef]
- Dosovitskiy, A.; Beyer, L.; Kolesnikov, A.; Weissenborn, D.; Zhai, X.; Unterthiner, T.; Dehghani, M.; Minderer, M.; Heigold, G.; Gelly, S.; et al. An Image is Worth 16x16 Words: Transformers for Image Recognition at Scale. arXiv 2020, arXiv:2010.11929. [Google Scholar]
- Chen, J.; Xie, H.; Zhang, L.; Hu, J.; Jiang, H.; Wang, G. SAR and Optical Image Registration Based on Deep Learning with Co-Attention Matching Module. Remote Sens. 2023, 15, 3879. [Google Scholar] [CrossRef]
Figure 1.
Example of the SAR ship targets. (a) Cargo with the VV polarization; (b) Tanker with the VV polarization; (c) Tug with the VV polarization; (d) Cargo with the VH polarization; (e) Tanker with the VH polarization; (f) Tug with the VH polarization.
Figure 1.
Example of the SAR ship targets. (a) Cargo with the VV polarization; (b) Tanker with the VV polarization; (c) Tug with the VV polarization; (d) Cargo with the VH polarization; (e) Tanker with the VH polarization; (f) Tug with the VH polarization.

Figure 2.
Data fusion diagram of the HOG-SiamShipCLSNet model.

Figure 3.
Flowchart of the HOG feature extraction.

Figure 4.
Proposed HOG-SiamShipCLSNet model for SAR ship recognition.

Figure 5.
Schematic diagram of the main Siamese network.

Figure 6.
Backbone network structure.


Table 1.
Recognition performance of the different modes.
| Methods | Modes | Precision | Recall | F1 |
|---|---|---|---|---|
| Mainstream classification network | ResNet18 | 0.6267 | 0.6590 | 0.6331 |
| ResNet34 | 0.6212 | 0.6545 | 0.6312 | |
| ResNet50 | 0.6210 | 0.6597 | 0.6152 | |
| DenseNet121 | 0.6332 | 0.6630 | 0.6389 | |
| DenseNet161 | 0.6371 | 0.6706 | 0.6436 | |
| VGG16 | 0.6319 | 0.6670 | 0.6306 | |
| MobileNet-v2 | 0.5989 | 0.6438 | 0.5974 | |
| AlexNet | 0.6332 | 0.6653 | 0.6258 | |
| Transformer | ViT | 0.6078 | 0.6434 | 0.5826 |
| ResNet50ViT | 0.6213 | 0.6586 | 0.6261 | |
| Siamese network architecture | SiamShipCLSNet (Mul) | 0.6582 | 0.6816 | 0.6612 |
| SiamShipCLSNet (Group-bilinear) | 0.6658 | 0.6905 | 0.6707 | |
| Proposed method | HOG-SiamShipCLSNet | 0.6787 | 0.7017 | 0.6822 |
Table 2.
Model parameter quantity of the different modes.
| Methods | Modes | Model Parameter |
|---|---|---|
| Mainstream classification network | ResNet18 | 11.80 M |
| ResNet34 | 21.29 M | |
| ResNet50 | 23.52 M | |
| DenseNet121 | 6.96 M | |
| DenseNet161 | 26.48 M | |
| VGG16 | 134.28 M | |
| Mobillenet-v2 | 5.64 M | |
| AlexNet | 57.02 M | |
| Transformer | ViT | 12.76 M |
| ResNet50ViT | 9.95 M | |
| Siamese network architecture | SiamShipCLSNet (Mul) | 2.23 M |
| SiamShipCLSNet (Group-bilinear) | 1.97 M | |
| Proposed method | HOG-SiamShipCLSNet | 7.81 M |
Disclaimer/Publisher’s Note: The statements, opinions and data contained in all publications are solely those of the individual author(s) and contributor(s) and not of MDPI and/or the editor(s). MDPI and/or the editor(s) disclaim responsibility for any injury to people or property resulting from any ideas, methods, instructions or products referred to in the content. |
© 2023 by the authors. Licensee MDPI, Basel, Switzerland. This article is an open access article distributed under the terms and conditions of the Creative Commons Attribution (CC BY) license (https://creativecommons.org/licenses/by/4.0/).
Share and Cite
MDPI and ACS Style
Xie, H.; He, J.; Lu, Z.; Hu, J. Two-Level Feature-Fusion Ship Recognition Strategy Combining HOG Features with Dual-Polarized Data in SAR Images. Remote Sens. 2023, 15, 4393. https://doi.org/10.3390/rs15184393
AMA Style
Xie H, He J, Lu Z, Hu J. Two-Level Feature-Fusion Ship Recognition Strategy Combining HOG Features with Dual-Polarized Data in SAR Images. Remote Sensing. 2023; 15(18):4393. https://doi.org/10.3390/rs15184393
Chicago/Turabian StyleXie, Hongtu, Jinfeng He, Zheng Lu, and Jun Hu. 2023. "Two-Level Feature-Fusion Ship Recognition Strategy Combining HOG Features with Dual-Polarized Data in SAR Images" Remote Sensing 15, no. 18: 4393. https://doi.org/10.3390/rs15184393
Note that from the first issue of 2016, this journal uses article numbers instead of page numbers. See further details here.