
The Role of Changbai Mountain in an Extreme Precipitation Event in Liaoning Province, China


1
College of Oceanography, Hohai University, Nanjing 210098, China
2
State Key Laboratory of Hydrology-Water Resources and Hydraulic Engineering, Hohai University, Nanjing 210024, China
3
College of Civil Aviation, Nanjing University of Aeronautics and Astronautics, Nanjing 211106, China
*
Author to whom correspondence should be addressed.
Remote Sens. 2023, 15(18), 4381; https://doi.org/10.3390/rs15184381
Submission received: 24 July 2023
/
Revised: 1 September 2023
/
Accepted: 4 September 2023
/
Published: 6 September 2023
(This article belongs to the Special Issue Advancement of Remote Sensing in Regional Climate Modeling: Observations, Mechanisms, and Projections)
Abstract
:Based on the half-hourly Integrated Multi-Satellite Retrievals for Global Precipitation Measurement (IMERG) data product (0.1°), the fifth-generation European Center for Medium-Range Weather Forecasting atmospheric reanalysis dataset (ERA5), sounding data, and the Weather Research and Forecasting Model (WRF-ARW), this study explored the developmental process of a typical extreme precipitation event in Liaoning Province on 2 June 2021. This study focused on the impact of Changbai Mountain on this precipitation process and its corresponding physical mechanisms. The research findings revealed that Changbai Mountain significantly affected the precipitation event in three main aspects: blocking drag, forcing uplift, and leeside convergence. The blocking drag caused by the mountain topography led to an extension in the duration of heavy rainfall. The dynamic lifting and leeside convergence associated with the mountainous terrain also substantially increased the amount of precipitation. Furthermore, the topography hindered the movement of the Bohai Bay cold pool and enhanced the intensity of the cold pool, contributing to the sustained extreme precipitation in Liaoning Province. Lastly, the terrain sensitivity experiment demonstrated that when the height of Changbai Mountain was reduced, the convergence uplift, moisture condensation, and cold pool intensity were weakened, leading to significant changes in precipitation intensity and spatial distribution. These findings further confirm the crucial role of Changbai Mountain in the occurrence and development of local precipitation in Liaoning Province.
1. Introduction
Coastal mountainous regions, particularly in monsoon areas, are highly susceptible to extreme precipitation events due to the intricate interplay between land and sea and complex terrain, causing severe impacts on natural ecosystems and society [1]. Research indicates that large-scale circulation patterns, such as the North Atlantic Oscillation, Madden Julian Oscillation, and El Niño-Southern Oscillation, synoptic-scale disturbances, mesoscale convective systems, boundary layer convergence, and local terrain, all play pivotal roles in the dynamics of extreme precipitation [2,3,4]. Additionally, monsoonal circulation, moisture transport, and the downward propagation of high potential vorticity also influence the formation of extreme precipitation [5,6,7]. Nonetheless, predicting extreme precipitation accurately remains challenging due to the complex interaction between various physical processes across different spatial and temporal scales [8,9]. Thus, understanding the dynamic mechanisms behind extreme precipitation formation is of significant importance in enhancing flood forecasting and warning systems.
Extreme precipitation is governed and modified by various atmospheric and geographical factors; in particular, topography significantly influences the extreme precipitation in mid-latitude mountainous regions. Topographical forcing can be categorized into two main types: mechanical and thermal forcing, the specific mechanisms of which are contingent upon the environmental conditions, such as background wind speed, static stability, and the height and shape of the mountains. Mechanical forcing encompasses large-scale upward motion on the slopes and horizontal convergence induced by dynamic changes in wind direction [10]. Simultaneously, thermal variations caused by daytime solar radiation and nocturnal radiative cooling generate hydrostatic pressure gradients, leading to upslope or downslope winds along mountain surfaces, which favor convergence and orographic precipitation [11,12,13]. Undulating mountainous terrain can also impede the transport of moisture flux and increase the friction of the ground against the atmosphere, affecting the movement of precipitation cloud systems [14,15]. Furthermore, intricate topography interacted with cold pools and other factors, influencing the intensity, height, and movement of the cold pools, thereby affecting the convergence between colder, denser air within the cold pool and the surrounding environment [16]. While extensive research has been conducted on the influence of topography on precipitation, its mechanisms vary across different climate zones and even within the same climate zone at distinct locations, and therefore, specific studies in local regions are needed.
Liaoning Province is a typical coastal mountainous region in Northeast China, bordered by the Bohai Bay and the Yellow Sea to the south, facing the majestic Changbai Mountains to the east. Since the 1990s, the province has been more prone to extreme precipitation events in Northeast China, and it is projected that such occurrences will increase in the future, posing major risks to human lives, property, and sustainable socio-economic development [17,18]. However, studying precipitation patterns in the mountainous regions of Liaoning Province has been exceptionally challenging due to the scarcity of ground observation data and the limitations imposed by the mountainous terrain on weather radar detection [19,20]. With the rapid advancement of computer technology, various numerical models have been widely employed to investigate the orographic effects on regional precipitation. Previous studies have shown that the uplifting effect of topography enhances positive vorticity on the windward slopes, fostering accelerated vertical upward motion [5]. On the other hand, the obstructive effect of topography alters the wind direction at the bottom of the Northeast cold vortex, forming new convective clouds on the windward slopes and intensifying precipitation [21]. Furthermore, this topographical obstruction makes moisture converge on the windward slope, resulting in enhanced precipitation on the windward slope [22]. Despite the progress made in understanding the dynamic mechanisms of Changbai Mountain’s topographical impact on precipitation, the orographic effects on precipitation on the leeward side remain insufficient [23]. Meanwhile, few studies have been conducted to investigate the interaction between the cold pool and the local terrain, and existing research is mainly to explore the impact of cold pools on gales and tornadoes in Liaoning Province [24,25]. Moreover, using mesoscale numerical atmospheric models and observation data with limited resolution has constrained our cognitive grasp of the impact of Changbai Mountain on regional precipitation. Therefore, a better understanding of the influence of Changbai Mountain on precipitation is still needed.
On 2 June 2021, a typical extreme precipitation event occurred in Liaoning Province, China. This event was accompanied by lightning and tornadoes, resulting in multiple casualties and direct economic losses exceeding CNY 5 million. This study employed the mesoscale numerical model WRF-ARW to conduct convection-permitting simulations of this representative precipitation event. Additionally, we conducted sensitivity experiments to analyze the impact of different heights of Changbai Mountain on regional precipitation to reveal the mechanisms underlying the role of Changbai Mountain in local precipitation. Section 2 overviews the study area, data sources, and modeling techniques. Section 3 presents the main research findings, followed by Section 4 and Section 5, which consist of the discussion and conclusion. This research will contribute to elucidating the effect of Changbai Mountain on regional extreme precipitation and enhancing the predictability of such extreme events.
2. Model, Data and Methodology
2.1. Study Area
Liaoning is a coastal province located at the northern edge of the East Asian summer monsoon region (38–43°N, 118–125°E). Liaoning has a temperate continental monsoon climate, with an average annual precipitation of 500–1000 mm [26]. Liaoning Province is renowned as the ‘Golden Triangle’, owing to its advantageous coastal geographical position and its commercial and cultural strengths in the northeastern region [27]. Based on its topographical and hydrological features, Liaoning can be divided into three main regions: the eastern mountainous area, the western plateau, and the central plain [28,29]. Among these, the Changbai Mountain and the Qianshan mountain range dominate the eastern mountainous area, extending into the sea to form the Liaodong Peninsula. The Changbai Mountain, a dormant volcano, acts as a natural barrier in Northeast China, effectively blocking moist oceanic airflows and playing a vital role in Liaoning Province’s climate. Influenced by the East Asian monsoon and intricate topography, Liaoning Province experiences significant characteristics in its heavy rainfall, such as high intensity, concentrated time, localized occurrence, and suddenness. The eastern mountainous region of Liaoning Province receives the highest precipitation, whereas the western plateau experiences the lowest, and the central plain receives a moderate amount. This spatial pattern of annual precipitation decreases from southeast to northwest, resulting in the unique climatic features of the eastern humid and western semi-humid areas [30,31].
2.2. Model Configuration and Experiment Design
To investigate the influence of the topography of Changbai Mountain on extreme precipitation in Liaoning Province, this study employed the WRF-ARW Model version 4.3, a fully compressible, non-hydrostatic model, to conduct convection-permitting simulations [32,33]. The model was configured with two nested domains, encompassing a horizontal grid spacing of 9 km (308 × 300) and 3 km (481 × 481), along with 48 vertical levels with 10 hPa at the top of the atmospheric columns. The integration time step of the WRF model was set at 10 s, and the data output frequency was every 30 min. The Morrison parameterization scheme was employed for the microphysical processes, which has been widely applied in China [34,35]. The Planetary boundary and radiation schemes were the Mellor–Yamada Nakanishi Niino (MYNN) [36] and RRTMG [37] schemes, respectively. The topo_gmted2010_30s dataset was used to obtain topographical data, and the land surface processes were modeled using the unified Noah land surface model [38]. Due to the model’s horizontal resolution being less than 4 km, the cumulus convection parameterization scheme was deactivated in this study. More details about the model configuration can be found in Table 1.
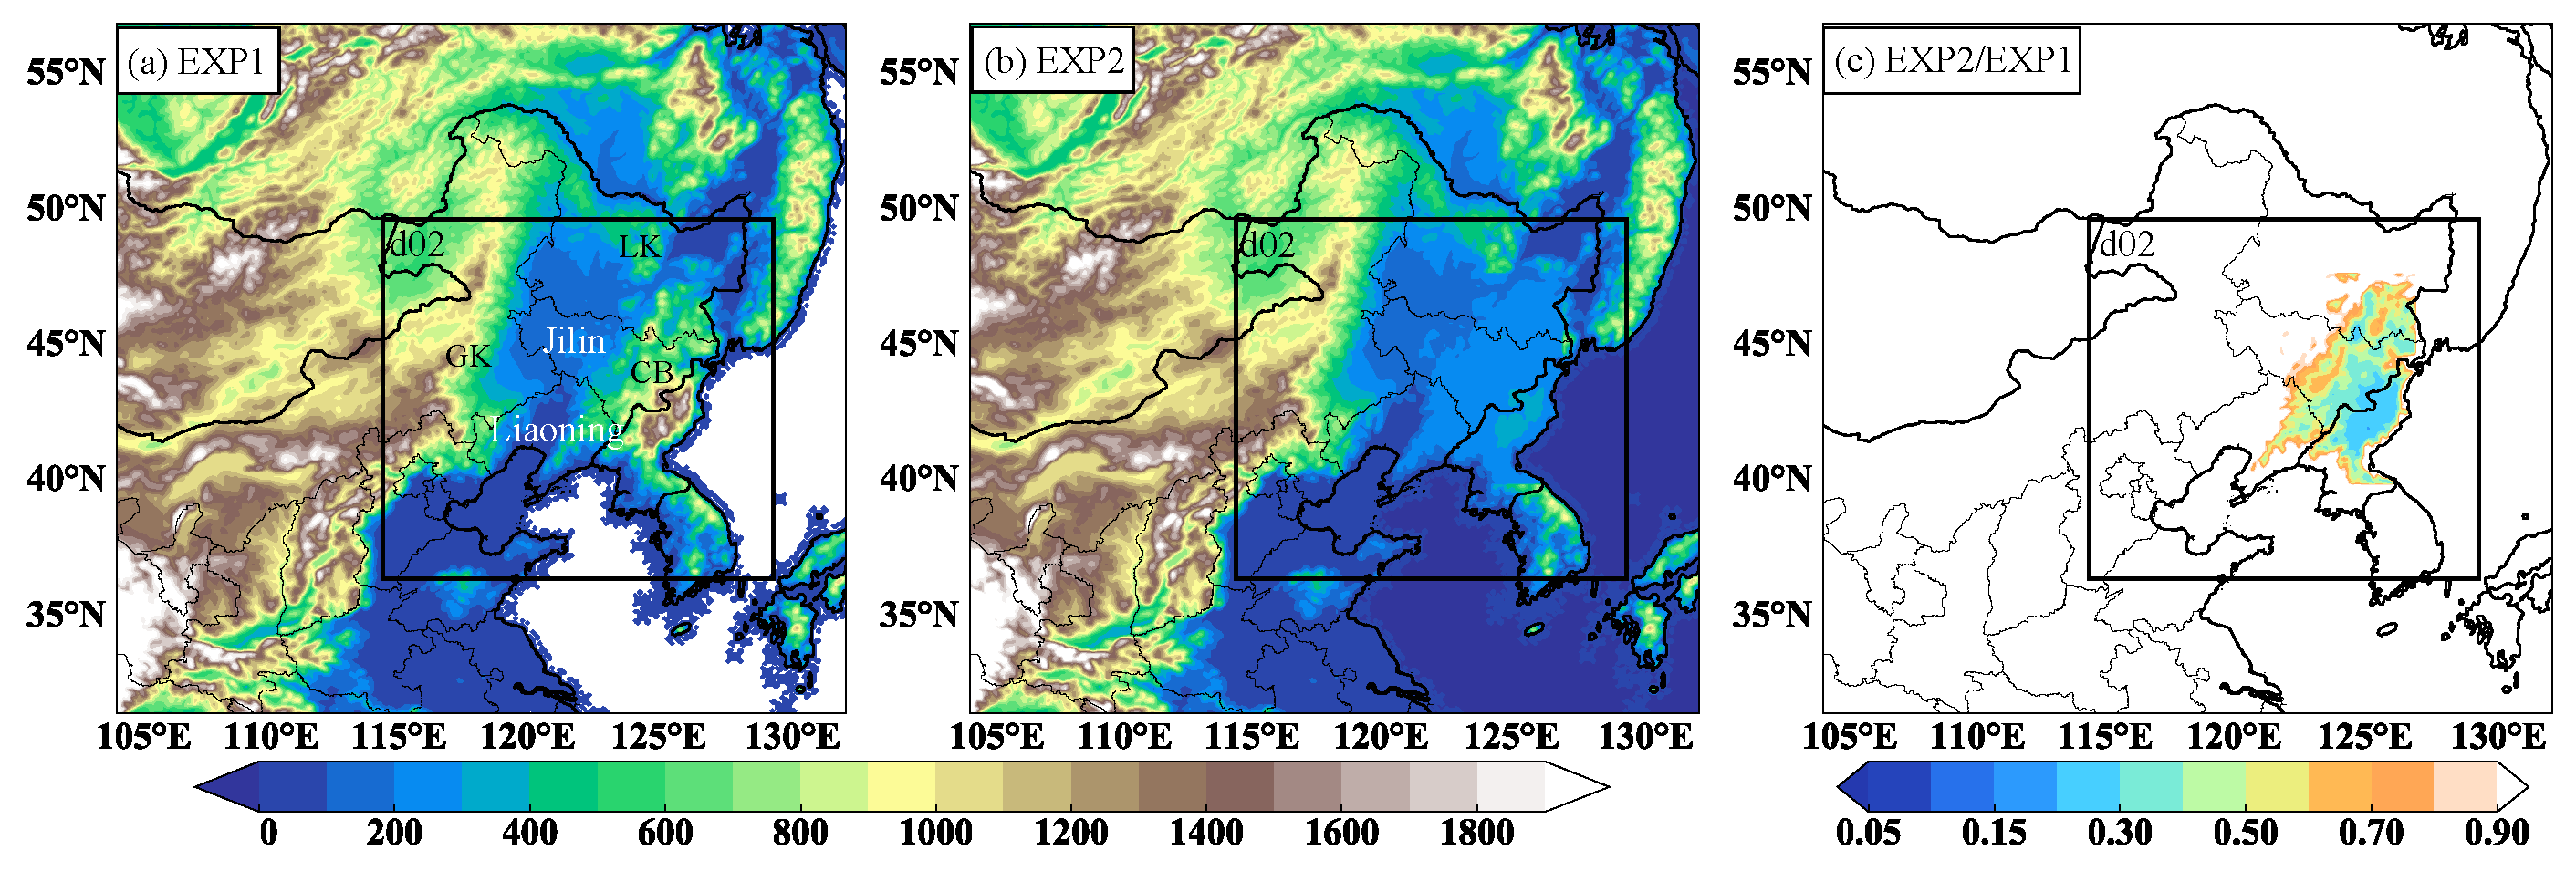
This study comprises two sets of experiments, and by comparing the simulation differences between these two sets of experiments, we can assess the impact of Changbai Mountain on extreme precipitation in Liaoning Province. The simulation period for all experiments spans from 18:00 UTC on 1 June 2021, to 24:00 UTC on 2 June 2021, lasting 30 h, with the initial 6 h designated for model spin-up. Experiment 1 (EXP1) serves as the control experiment, employing the default elevation of the Changbai Mountain region to conduct convection-permitting simulations of a typical precipitation event. In Experiment 2 (EXP2), the model parameterization schemes and simulation area remain identical to EXP1, but the elevation of the Changbai Mountain region (122–132°E, 39.5–46°N) is reduced to one-tenth of the default height (Figure 1). The specific formula for this terrain adjustment is as follows:
where the and represent the terrain height of Changbai Mountain in EXP1 and EXP2, respectively; 200 denotes the average elevation of the surrounding terrain of Changbai Mountain.
2.3. Observational and Reanalysis Data
The initial and lateral boundary conditions for WRF simulations were derived from the fifth-generation European Center for Medium-Range Weather Forecasting atmospheric reanalysis dataset (ERA5) spanning from 18:00 UTC on 2 June 2021, to 24:00 UTC on 2 June 2021. The ERA5 dataset provides a temporal resolution of 1 h and a horizontal resolution of 0.25° × 0.25°. Additionally, to validate the accuracy of the initial conditions provided by ERA5, this research employed sounding data from the esteemed University of Wyoming. For over two decades, this dataset has been widely used as a standard true value to verify the accuracy of the reanalysis dataset in global upper-air analysis [39,40]. In this study, sounding data for Dalian station (38.5°N, 121.5°E) on 2 June at 00:00 UTC were downloaded from the official database, which includes vertical profiles of height (m), pressure (hPa), temperature (°C), relative humidity (%), mixing ratio (g/kg), and wind speed (m/s).
To assess the simulation performance of the WRF model regarding precipitation in the study area, this research employed the Integrated Multi-Satellite Retrievals for Global Precipitation Measurement (IMERG) data product, jointly developed by the National Aeronautics and Space Administration (NASA) of the United States and the Japan Aerospace Exploration Agency (JAXA). IMERG is a high-resolution and high-quality precipitation estimation data product widely used in meteorological, hydrological, and other research fields at both global and regional scales. This data product primarily relies on satellite microwave and infrared radiance data, as well as ground-based rainfall observations. By fusing multiple satellite data sources, IMERG provides precipitation estimates with a spatial resolution of 0.1° × 0.1° at half-hourly intervals on a global scale [41]. Currently, NASA offers three types of IMERG data products: IMERG Early, Late, and Final Runs. This study utilizes the IMERG-Final Run (V06 version) data product, which closely aligns with observed precipitation [42].
2.4. Methodology
To scrutinize the interplay between terrain and the surrounding atmospheric flow and to authenticate the blocking effect of Changbai Mountain on the atmospheric flow, the present study computed the Froude number. The Froude number signifies a dimensionless parameter that characterizes the relative magnitudes of the fluid’s inertial force and gravity and is conventionally employed for distinguishing the flow states of distinct fluids. A large Froude number (Fr ≥ 1) denotes that the air current can surmount the obstructing mountains, whereas a low Froude number (Fr < 1) indicates that the mountains will obstruct the air current [43]. The formula for calculating the Froude number is expressed as follows [44]:
where U is the flow speed and N and H are Brunt–Väisällä frequency and the mountain height, respectively.
In addition, to comprehend the role of low-level cold pools in a preexisting cold front in the evolution of convective systems in the Changbai Mountain region [45], we calculated of the intensity of the cold pool, which can be measured by its propagation speed:
where C represents the intensity of the cold pool, H represents the depth of the cold pool, and B represents buoyancy, which is calculated using Formula (3). refers to potential temperature, while , and represent the mixing ratios of water vapor, cloud water, and rainwater, respectively. refers to the regional average of potential temperature, while refers to the regional average of the mixing ratios of water vapor.
3. Results
3.1. Synoptic Background of the Precipitation Event
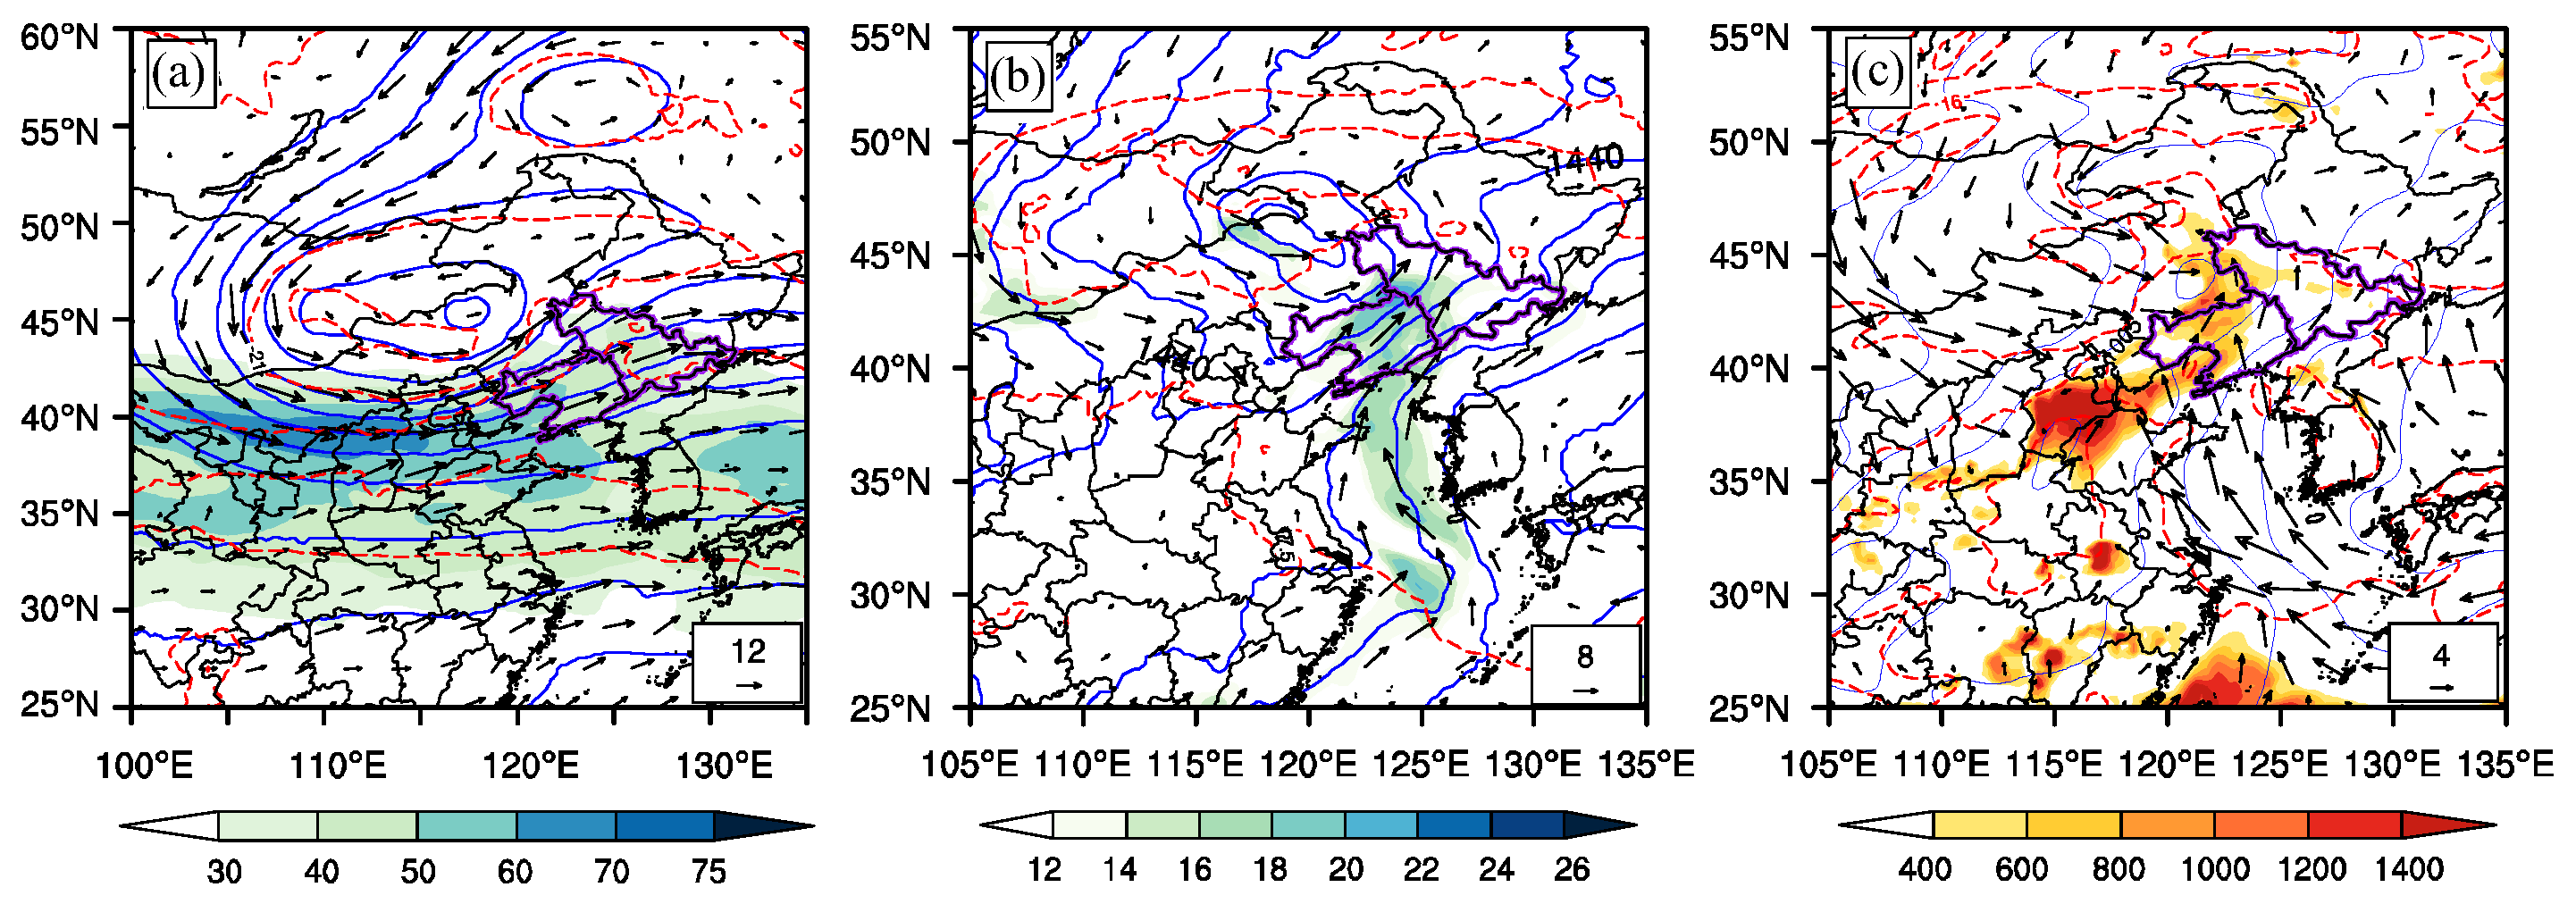
Based on the ERA5 reanalysis data on 2 June 2021, the atmospheric conditions in Liaoning Province were conducive to the formation of heavy precipitation. At 6:00 UTC, the Northeast Cold Vortex remained stable at 500 hPa, and the heavy rain area was located ahead of the trough at 500 hPa and to the left of the exit of the East Asia Upper-Tropospheric Jet Stream (EAJS) at 200 hPa. Consequently, the formation of heavy rainfall was influenced by the positive vorticity advection ahead of the trough and the upper-level divergence. Simultaneously, the thermal trough was behind the westerly trough, leading to cold air in the upper atmosphere of Liaoning Province (Figure 2a). The low-level jet (LLJ) at 850 hPa transported substantial heat and moisture into Liaoning Province, resulting in the total column precipitable water exceeding 40 mm (Figure S1). Additionally, the warm air from the LLJ converged with the northwesterly wind, forming a shear line along the northeast-southwest direction (Figure 2b). Along this shear line, convective available potential energy (CAPE) was found beyond 1400 at mid-levels. At the surface, cyclonic circulation dominates near Liaoning Province, where the convergence of northwesterly and southerly winds at the base of the circulation formed a northeast-southwest-oriented cold front, extending from Bohai Bay to Jilin Province (Figure 2c). In summary, the interplay of the 500 hPa trough, the 850 hPa shear line, the coupling of high and low-level jets, and the surface cold front all contributed positively to the rapid development of convective systems and the favorable conditions for the formation of intense precipitation.
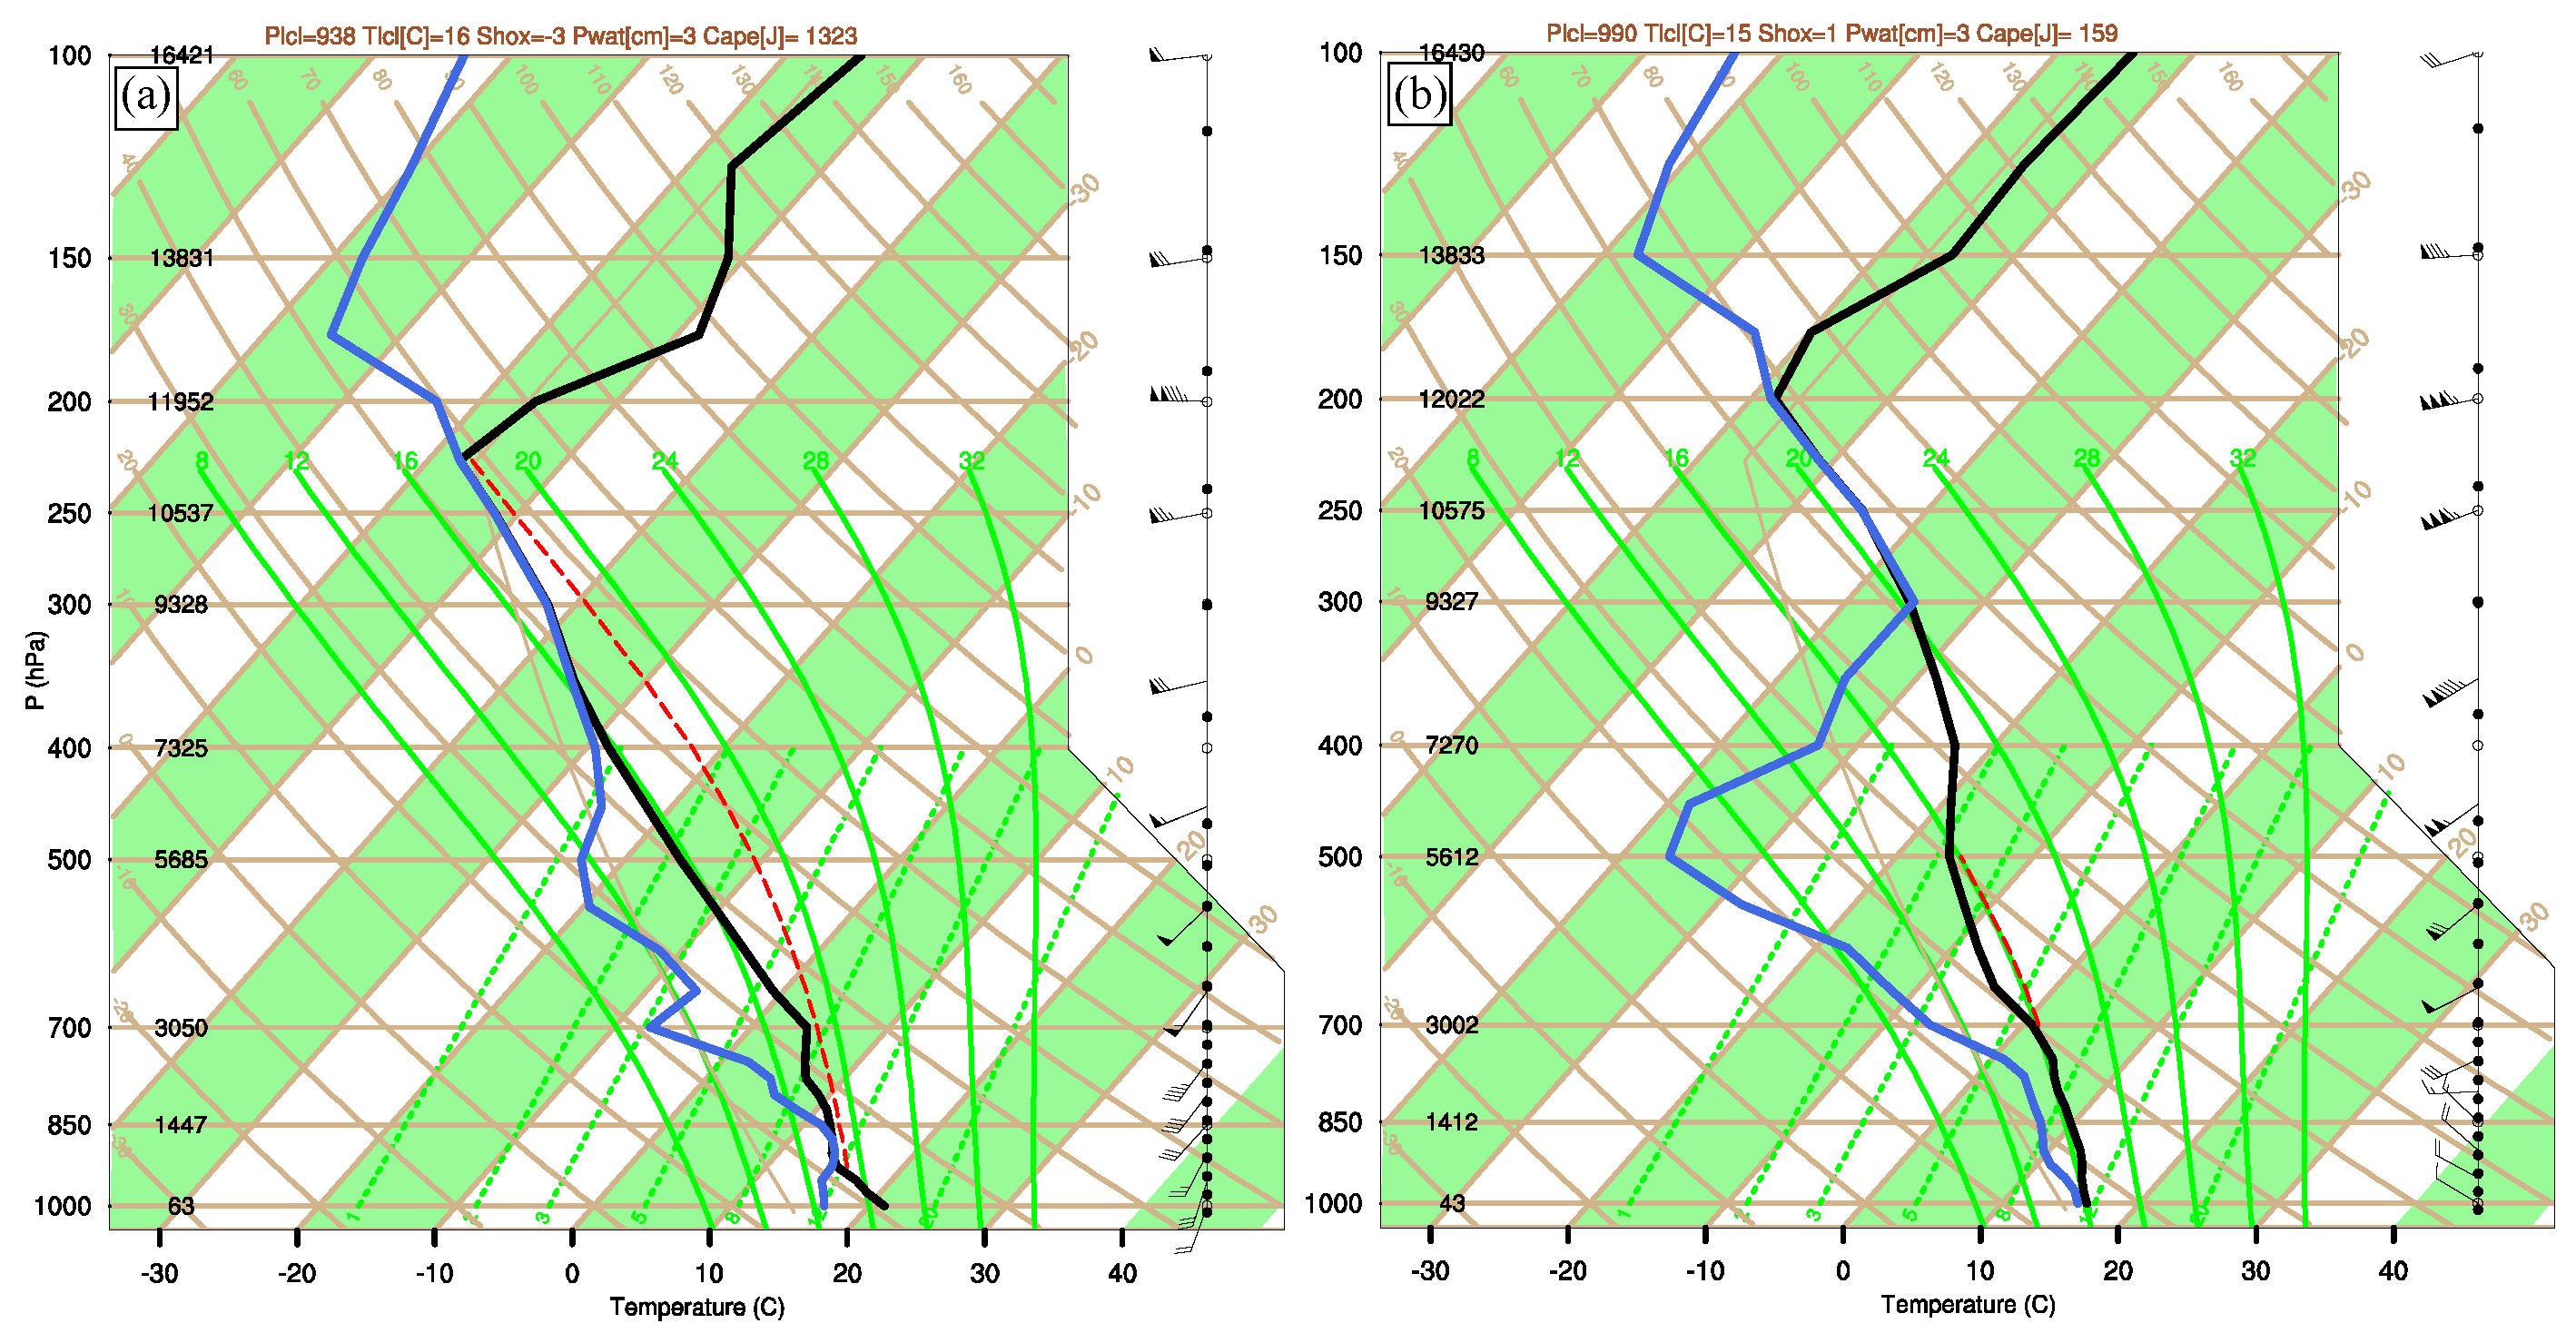
According to the 3:00 UTC sounding observation data in Anshan City, Liaoning Province (41°N, 122.5°E), the lower levels of the troposphere, particularly the 900–850 hPa level, exhibited relative humidity, while the levels at 800–400 hPa were comparatively drier. Additionally, at the near-surface 1000 hPa level, the CAPE reached as high as 1323 J·kg−1, and the lifting condensation level (LCL) was relatively low (938 hPa), indicating that the region was prone to triggering strong convection (Figure 3a). By 21:00 UTC on 2 June, the sounding data revealed a shift in near-surface wind direction to the northwest, accompanied by a decrease of approximately 5 °C in surface air temperature. The mid-level atmosphere showed a trend of drying and cooling, and the CAPE declined to 159 J·kg−1. These indicators collectively suggest that precipitation was either ongoing or had already occurred, and unstable energy had been released (Figure 3b).
3.2. Evaluation of Simulated Precipitation in the EXP1
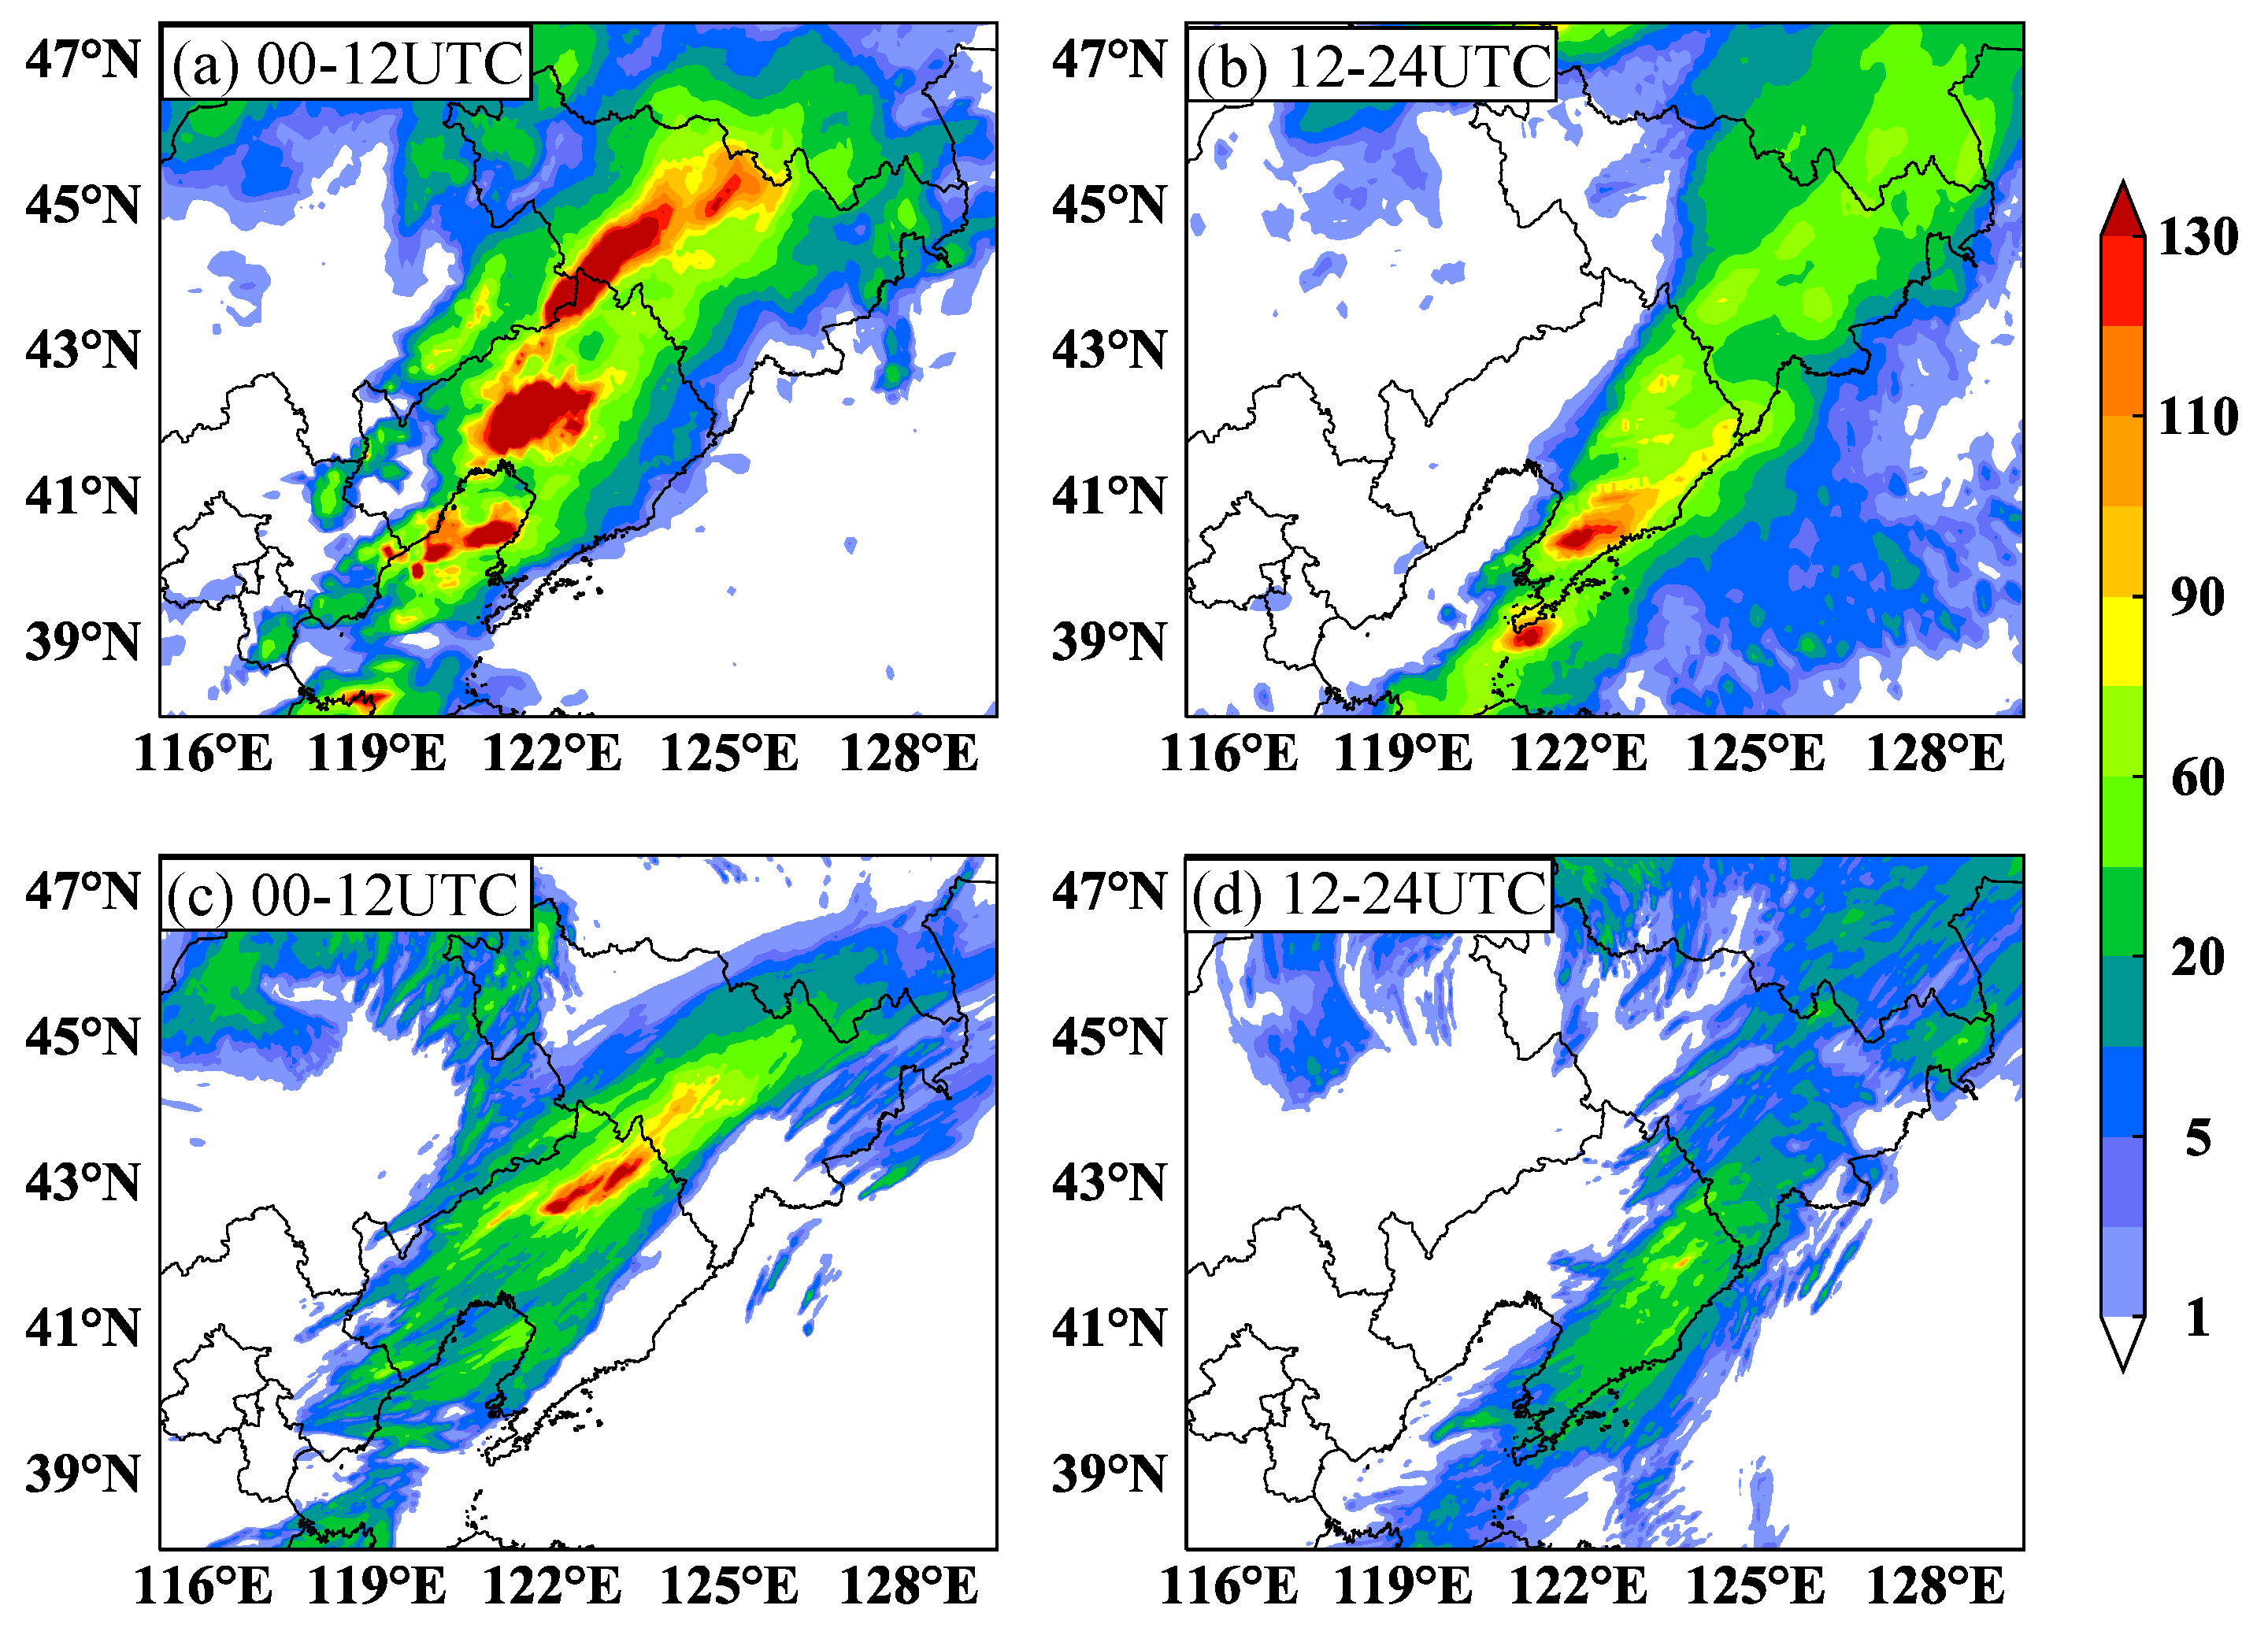
As shown in Figure 4a, during the daytime (from 00:00 to 12:00 UTC on 2 June; UTC = LST − 8), the rain belt observed by IMERG extends from the Bohai Sea to Jilin Province, exhibiting a southwest-northeast orientation. Additionally, two distinct precipitation centers are evident, located in the central parts of Liaoning Province and Jilin Province, with both centers showing accumulated precipitation peaks exceeding 130 mm (Figure 4a). During the nighttime (from 12:00 UTC to 24:00 UTC on 2 June), the rain belt gradually shifts eastward towards the vicinity of Changbai Mountain, with only one precipitation center located in the southeastern region of Liaoning Province (Figure 4b). EXP1 can effectively reproduce the spatial distribution and evolution of the IMERG-observed rain belt, but there are discrepancies in the precipitation amounts between the observations and simulations. During the daytime, the spatial correlation coefficient between the simulated and observed precipitation is approximately 0.68, whereas at nighttime, this coefficient increases to approximately 0.79. This indicates that the WRF model performs well in simulating the spatial pattern of precipitation in the region. The peak of simulated accumulated precipitation is around 120 mm during the daytime and approximately 90 mm during the nighttime, showing a general underestimation of about 30 mm compared to the observed values. Additionally, the simulated rain belt exhibits a smaller spatial extent than the observed one, with the simulated daytime precipitation center situated more eastward and the nighttime precipitation center slightly northward in comparison to the observed centers (Figure 4c,d). In summary, despite a dry bias in the simulated precipitation, the WRF model can effectively capture the spatial pattern and evolution of the rain belt in the study area.
3.3. Impacts of Changbai Mountain on Precipitation
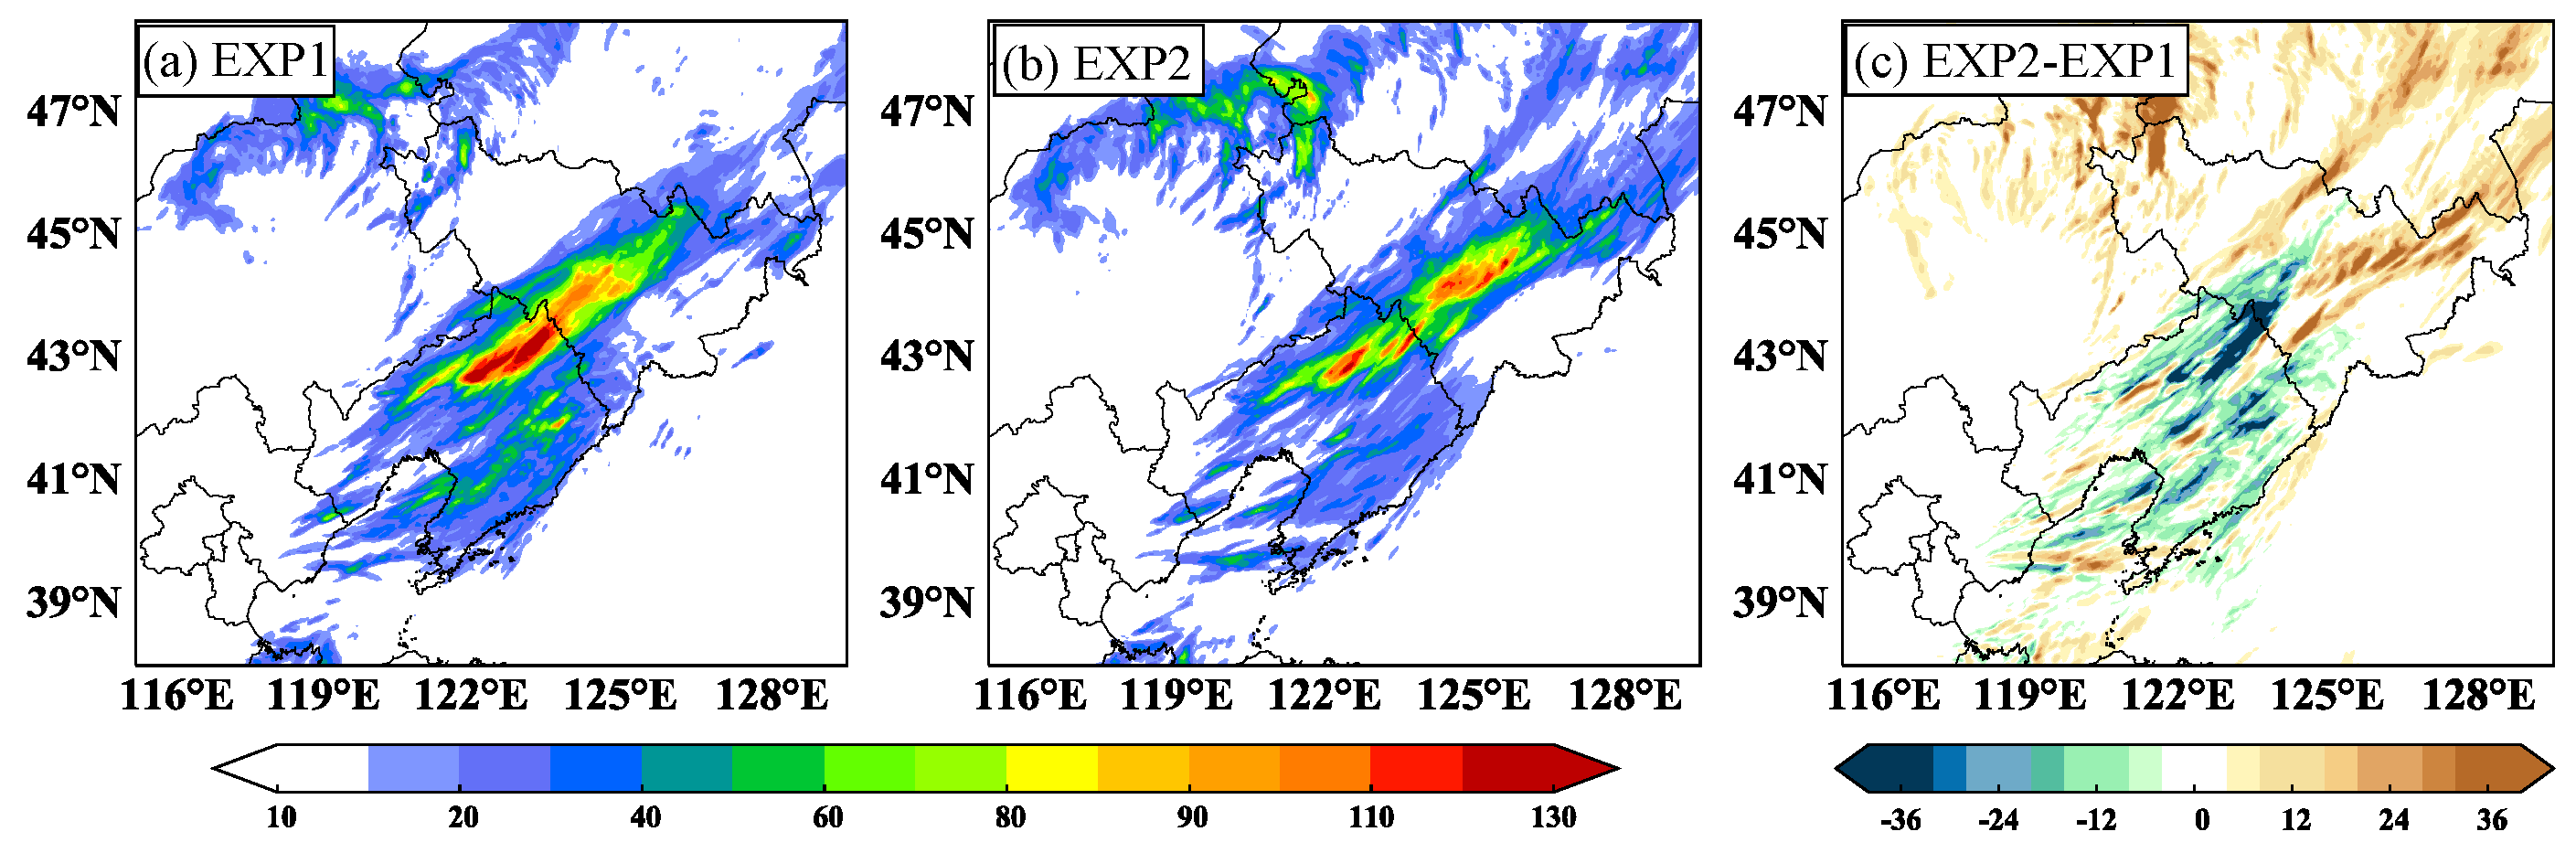
As shown in Figure 5a, the simulated rainfall belt in EXP1 exhibits a southwest-northeast orientation for 2 June, from 00:00 to 24:00 UTC, with the precipitation center mainly located within Liaoning Province, reaching a peak accumulated rainfall of approximately 130 mm. Furthermore, in the vicinity of Changbai Mountain, there is a weak precipitation center with a peak accumulated precipitation of approximately 90 mm (Figure 5a). The spatial distribution and pattern of the rain belt simulated by EXP2 are generally consistent with EXP1. However, compared to EXP1, EXP2 exhibits a narrower rain belt, and the intensity of the precipitation center is also weakened. The average hourly precipitation in the study area decreases by about 0.2 mm/h (Figure S2), and the precipitation center near Changbai Mountain almost disappears (Figure 5b). Spatially, the regions significantly influenced by the terrain in terms of precipitation are primarily concentrated in the central regions of Liaoning Province and in the vicinity of Changbai Mountain. In EXP2, the peak rainfall amount in the precipitation centers is reduced by more than 30 mm compared to EXP1, but there is a slight increase of approximately 20 mm in precipitation in the eastern regions of Jilin Province (Figure 5c). Notably, the wet bias in the precipitation between the two experiments mainly stems from the daytime precipitation simulated in eastern Jilin Province, whereas the dry bias in precipitation primarily originates from nighttime precipitation (Figure S3). Overall, the topography of Changbai Mountain favors the enhancement of precipitation intensity and coverage in Liaoning Province.
3.4. The Drag Effect of Changbai Mountain on Horizontal Wind
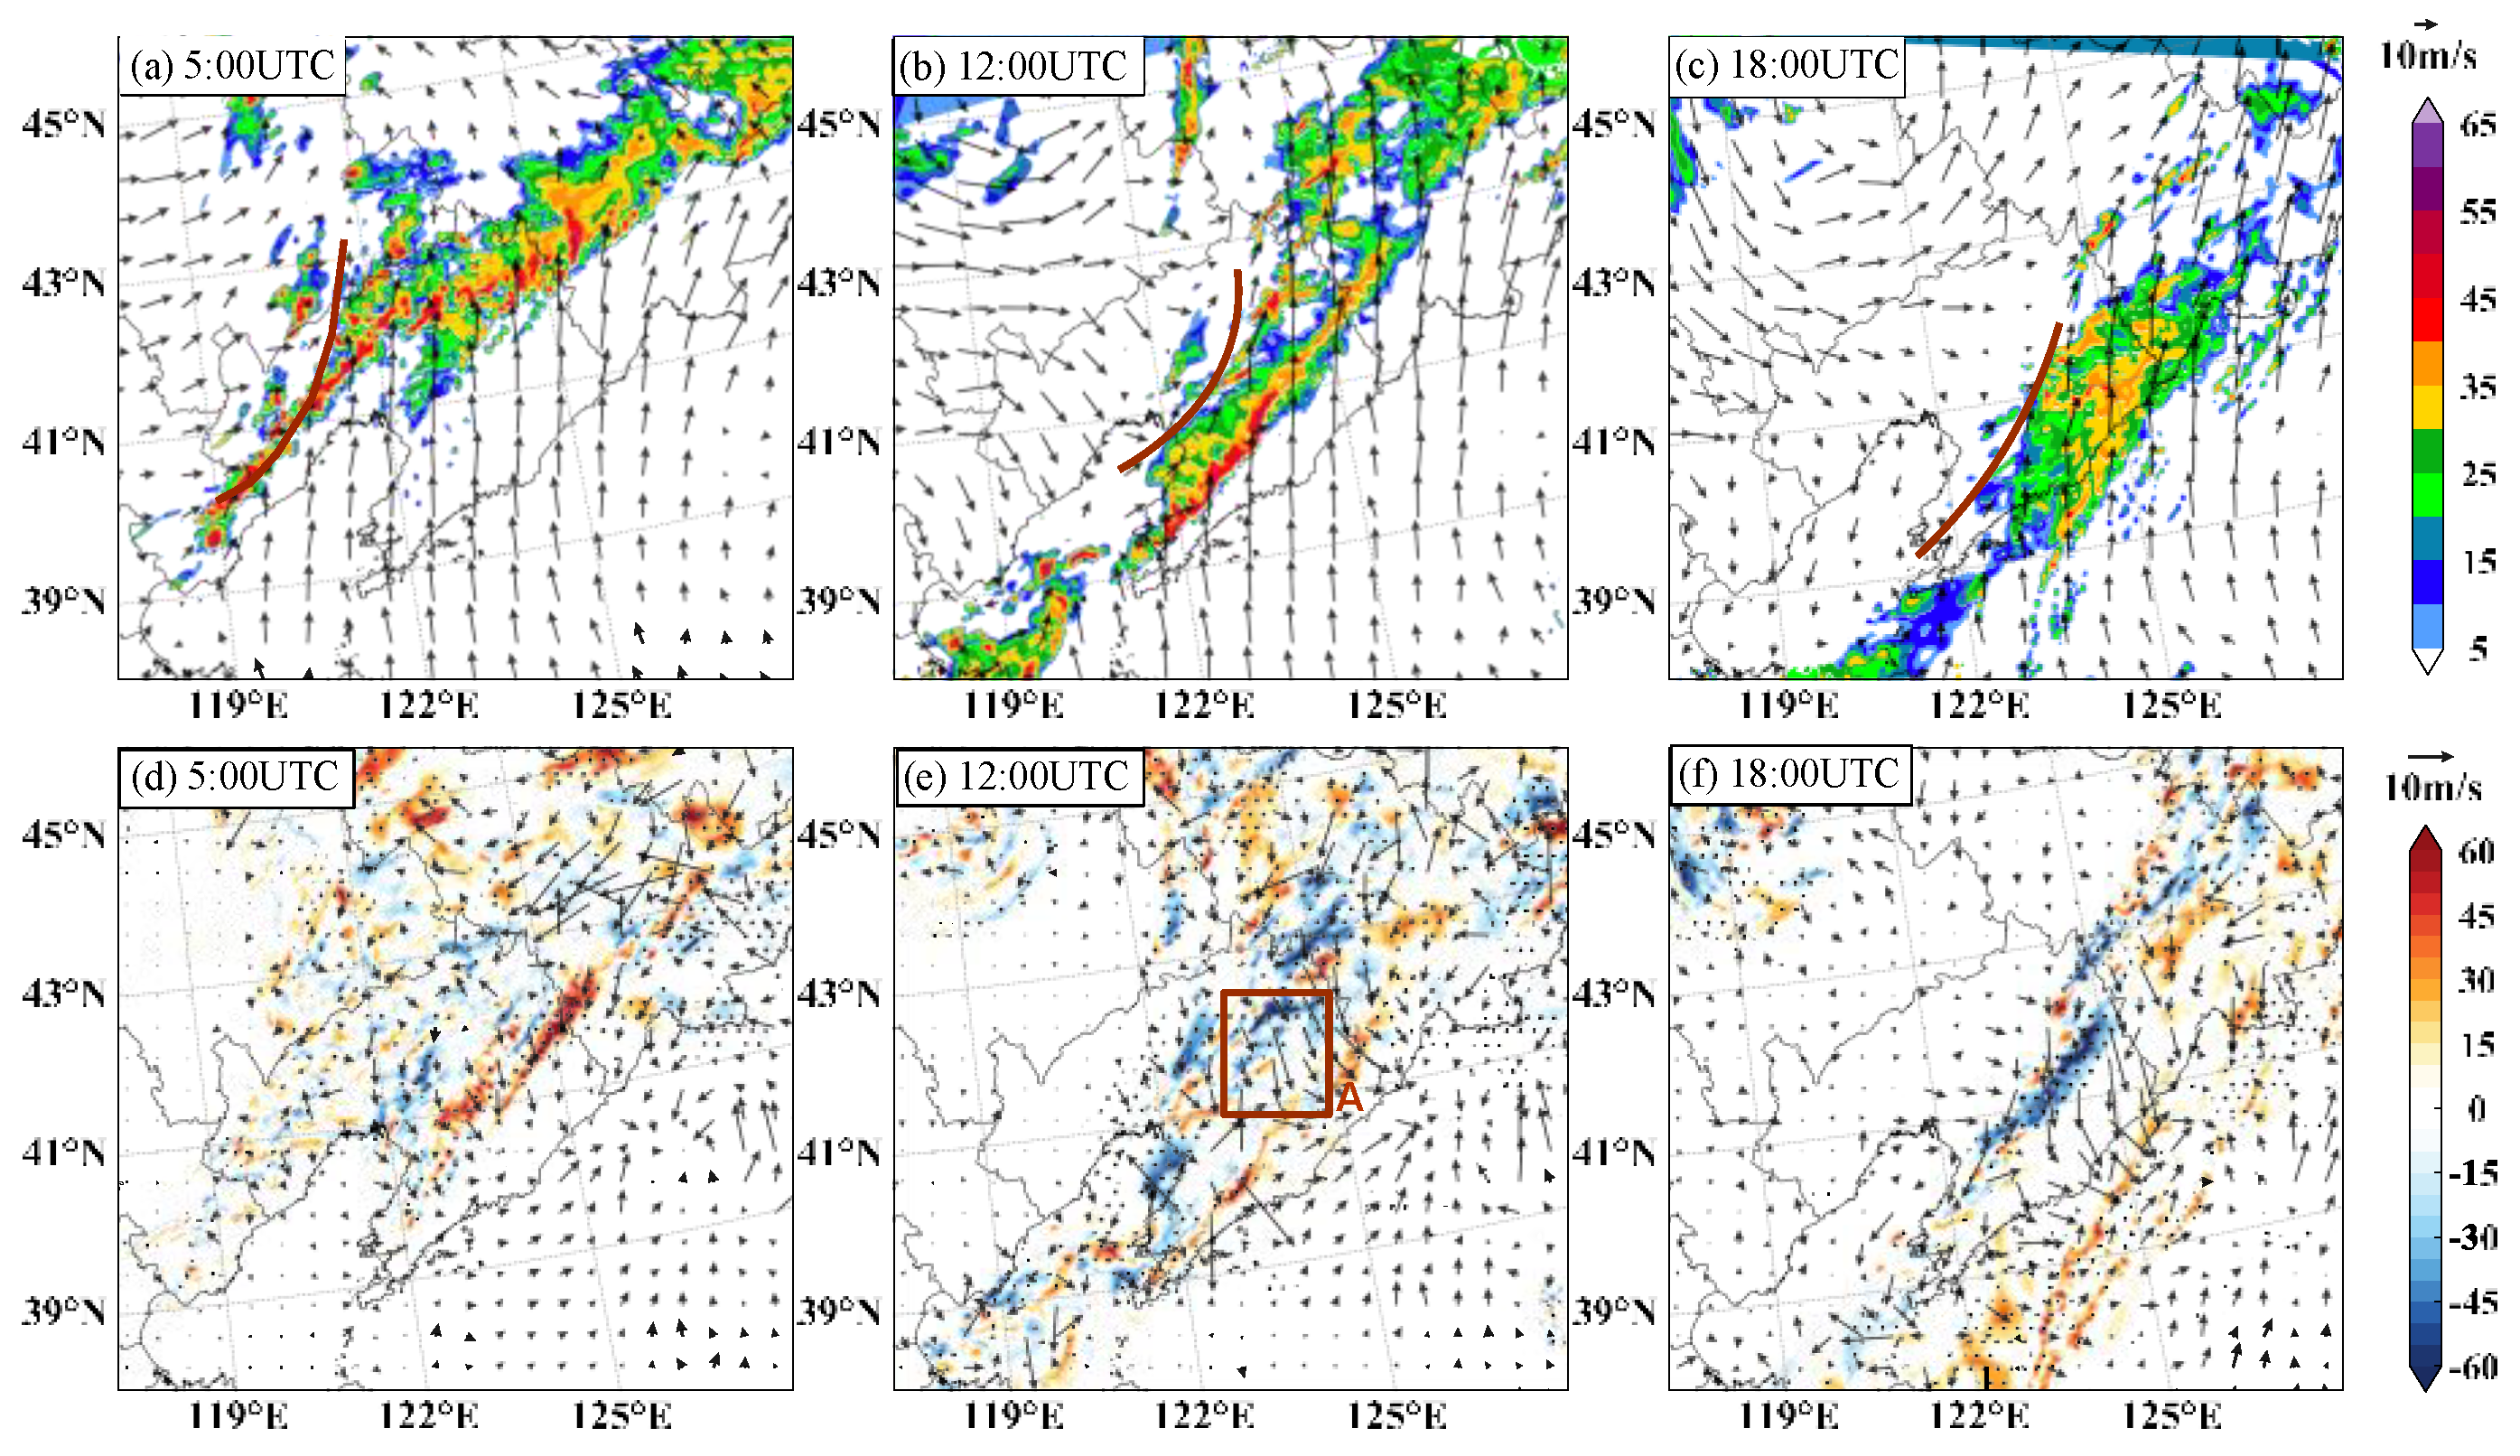
The terrain of Changbai Mountain, by attenuating the strength of westerly winds and slowing down the movement of the cold front, prolongs the duration of precipitation in Liaoning Province. In EXP1, at 5:00 UTC on 2 June, the convective system was triggered along the southwest-northeast-oriented cold front (Figure 6a). As the cold front proceeded eastward, the convective system propagated in the same direction under the influence of the prevailing westerly flows. By 12:00 UTC, the cold front had moved eastward to the central part of Liaoning Province, and the convective system was located in the eastern region of Liaoning Province, with the maximum intensity observed near Changbai Mountain (Figure 6b). At 18:00 UTC, the cold front’s movement was sluggish, and the linear convective system along the southwest-northeast direction persisted in the eastern part of Liaoning Province (Figure 6c). In comparison with EXP1, at 5:00 UTC on 2 June in EXP2, the convective system in the western part of Liaoning Province showed no significant change, but the intensity of the convective systems in the eastern part of Liaoning Province and eastern Jilin Province had strengthened (Figure 6d). At 12:00 UTC, an abnormal westerly wind of 15 m·s−1 appeared at position A (123–125°E and 41–42°N), indicating that the terrain’s friction and hindering effect weakened the strength of the westerly winds (Figure 6e), resulting in a slower movement of the westerly dominated cold front (Figure S4b). At the same time, upstream of the convective system’s movement direction (southeast of position A), positive abnormal radar reflectivity was observed, while downstream (northwest of position A), negative abnormal radar reflectivity appeared (Figure 6e,f). This suggests that Changbai Mountain decelerated the convective system’s movement speed, enabling the rain belt to persist over Liaoning Province.
3.5. The Effect of Topography on Vertical Wind
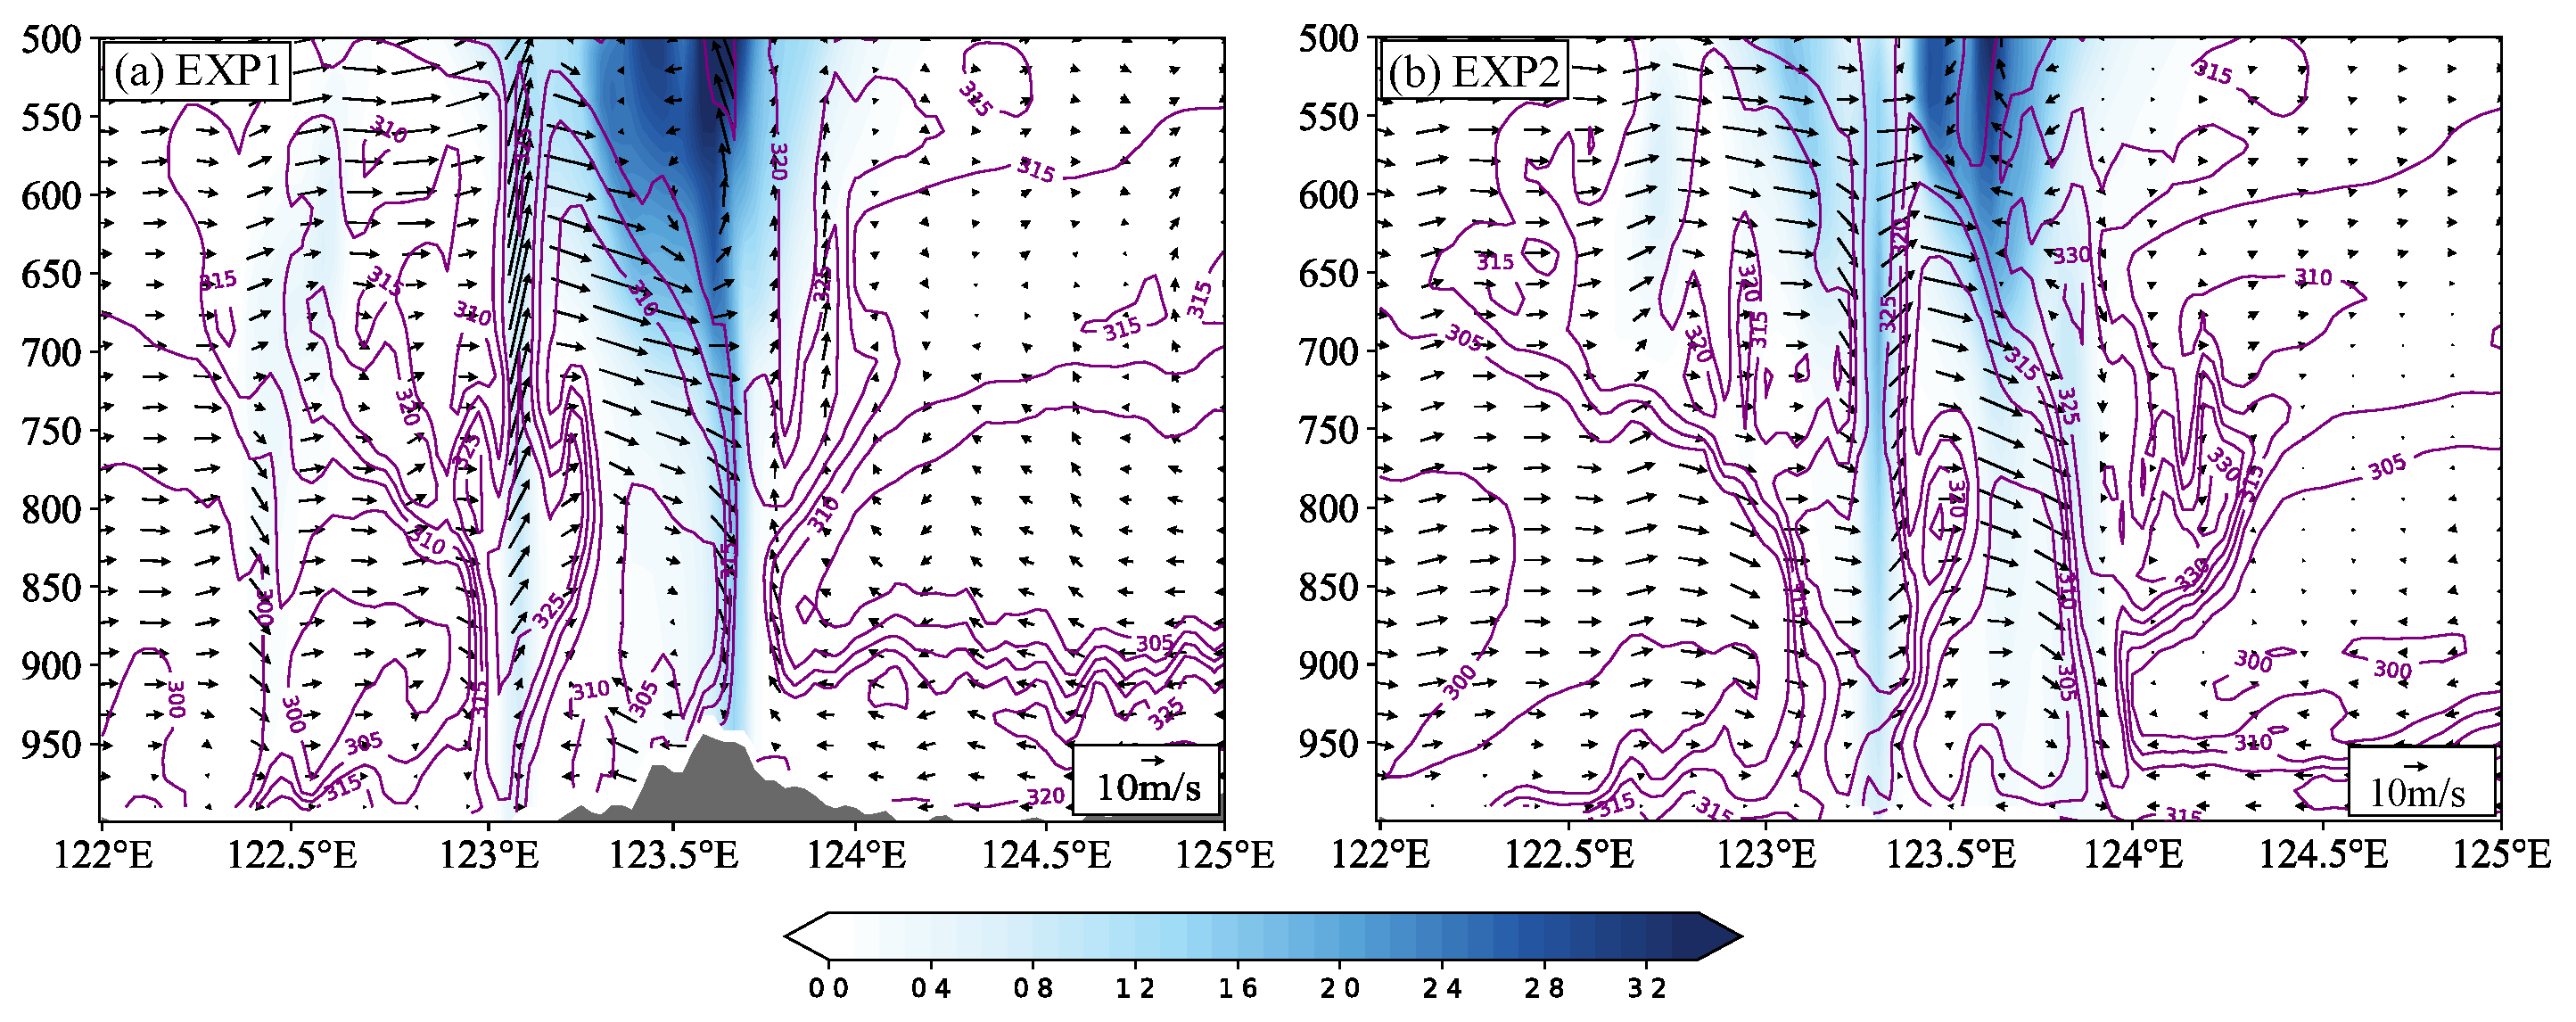
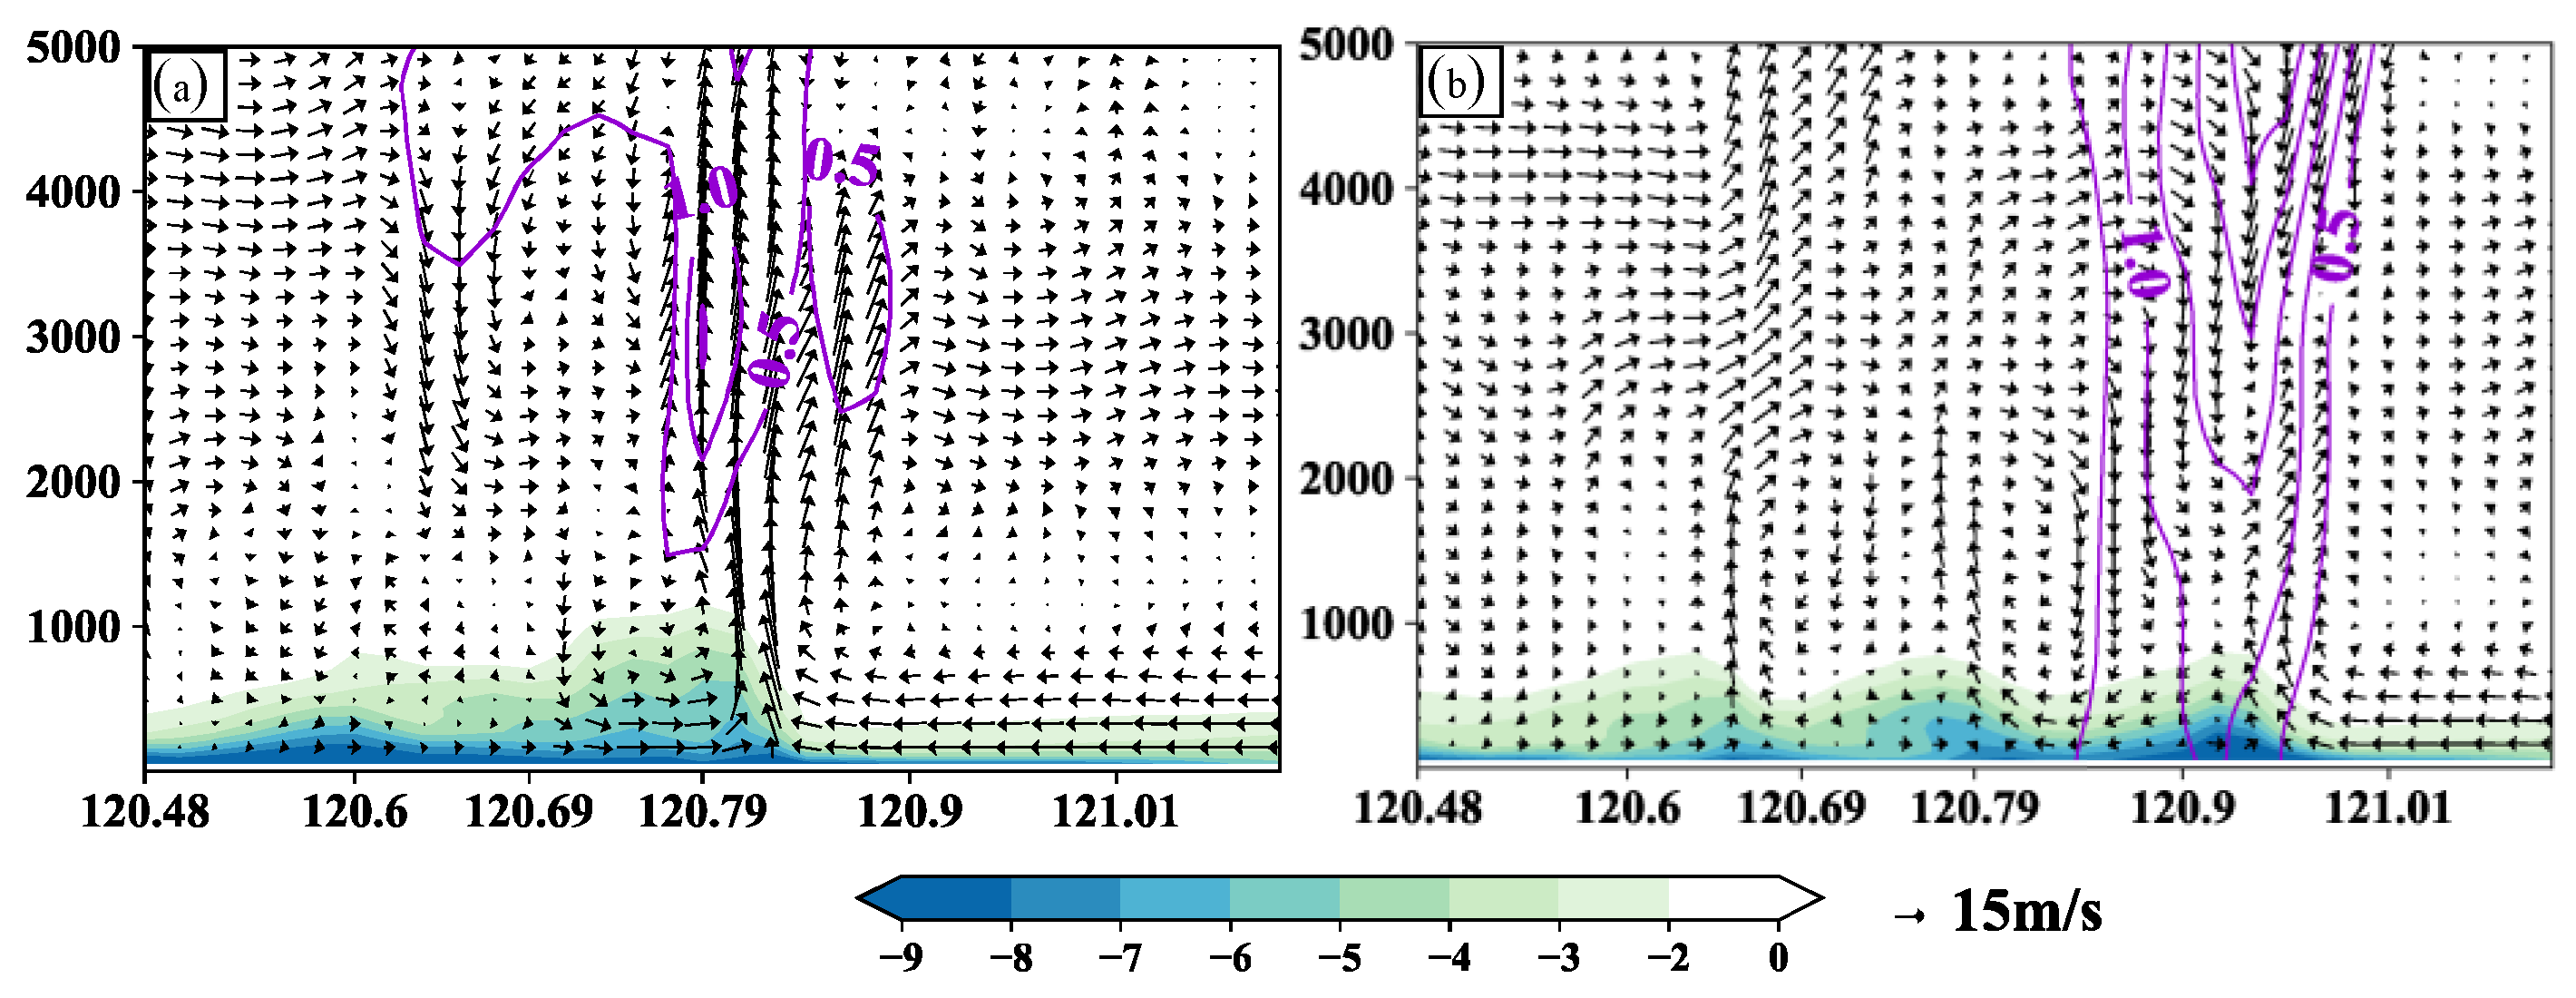
The topography of Changbai Mountain enhances the convergence of wind fields and vertical upward motion near the mountain by forcing the ascent of warm and moist air and creating orographic downslope winds due to thermal differences, thereby promoting precipitation formation. In EXP1, at 12:00 UTC, a strong gradient in pseudo-equivalent potential temperature () appeared at 123.8°E on the eastern side of Changbai Mountain, indicating the position of the front. Ahead of the front, gradually decreased with increasing altitude, indicating strong atmospheric instability in the region. The warm and moist airflow from the Bohai Sea uplifted and condensated due to the effects of the unstable stratification and orographic forcing and continued to rise upon encountering the upper-level cold front, leading to strong vertical updrafts throughout the atmosphere near Changbai Mountain. Furthermore, on the western side of Changbai Mountain, during the night, thermal differences between the mountain and the surrounding plains resulted in noticeable downslope winds near 123.5°E. The downslope winds converged with the northwesterly and southwesterly winds, enhancing vertical updrafts on the western side of Changbai Mountain and forming a secondary circulation with ascending motion on the warm side and descending motion on the cold side (Figure 7a). However, compared to EXP1, in EXP2, the near-surface vertical upward motion and water vapor condensation are relatively weaker, and the cloud–water mixing ratio is reduced to 0.5 kg·kg−1, and mainly exists above 700 hPa. As the westerlies moved to around 124°E, there was no convergence between the westerlies and the downslope winds, leading to a significant weakening of vertical updrafts over Liaoning Province (Figure 7b).
3.6. Impacts of Changbai Mountain on Cold Pool
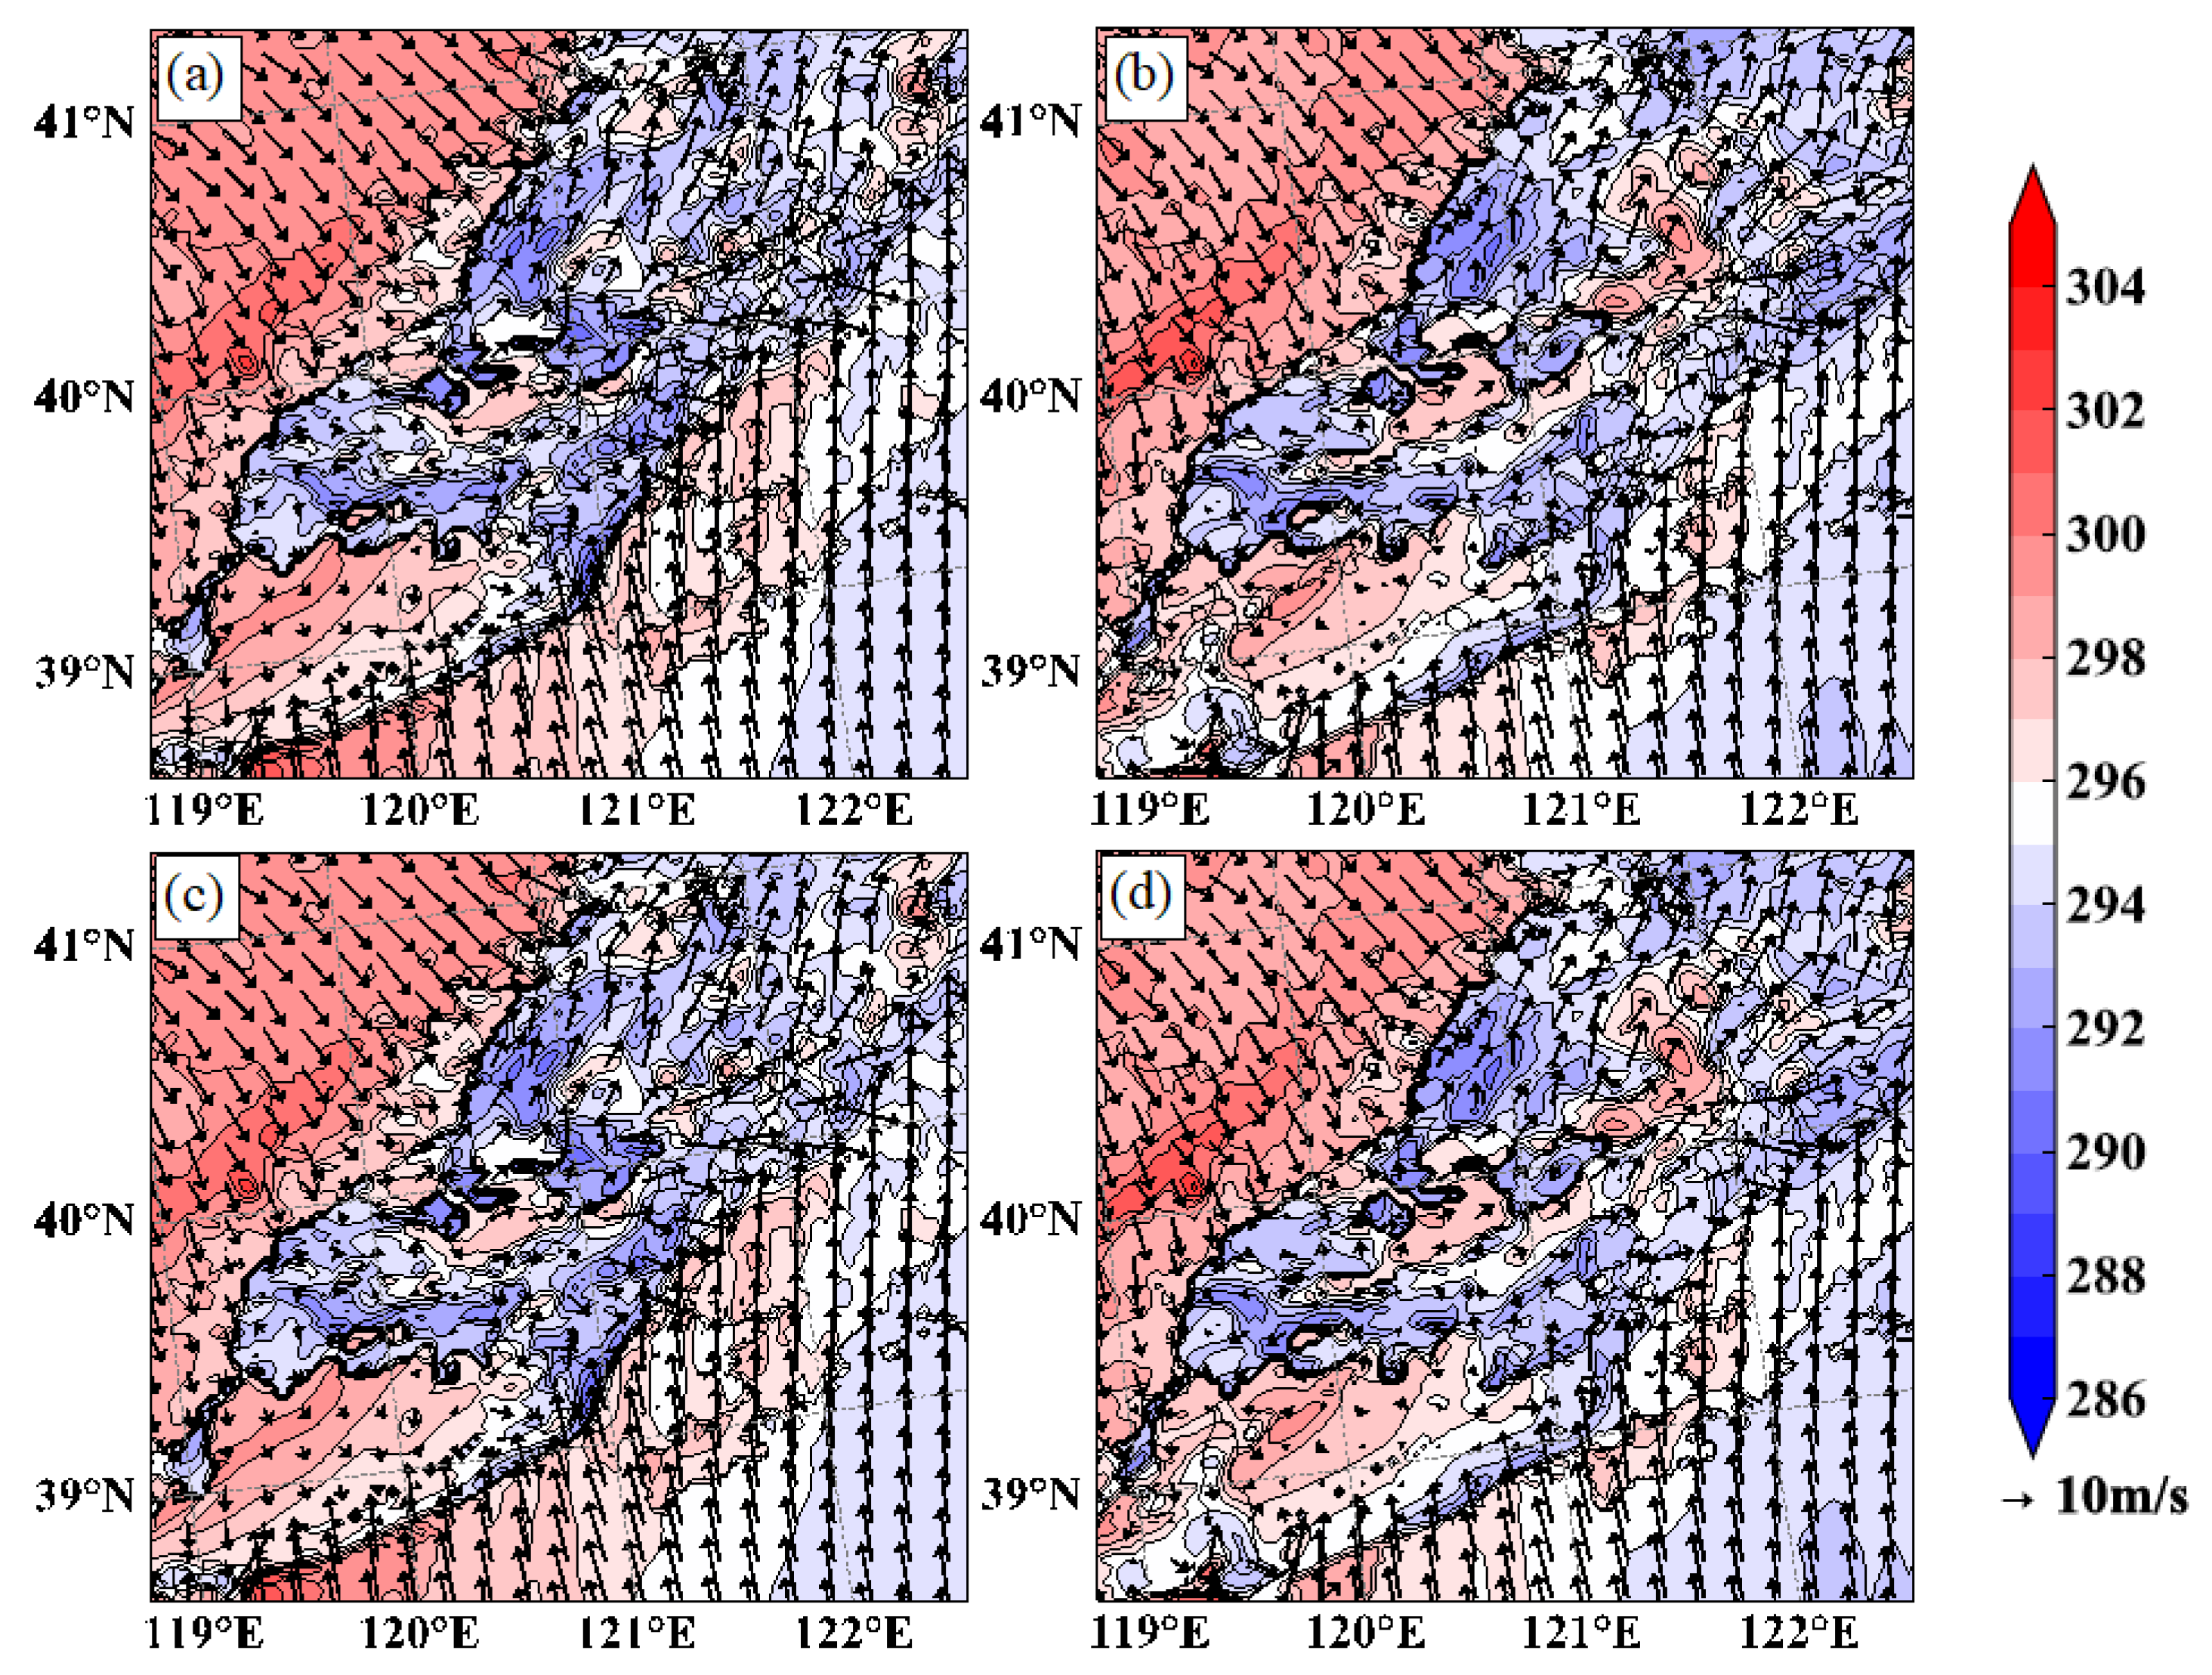
The terrain of Changbai Mountain can impede the eastward movement of the cold pool, thus influencing the development of convection and the maintenance of the rainband. In EXP1, the early-stage precipitation formed a cold pool with a potential temperature below 290 K over the Bohai Sea through evaporative cooling. The colder air within the cold pool laterally diffused and converged with the southeast winds at the outflow boundary of the cold pool, resulting in the forced upward motion of warm and moist air, which favored the triggering of convection (Figure 8a). At 11:30 UTC, the cold pool slowly shifted eastward, and the convective cells triggered along the outflow boundary of the cold pool continuously moved northeastward, contributing to the sustenance of precipitation in Liaoning Province (Figure 8b). After terrain height reduction in EXP2, the cold pool shifted further eastward, exhibiting a faster eastward movement, and resulted in a decrease in the formation of new convective cells along the edge of the cold pool (Figure 8c,d)
In addition to impeding the movement of the cold pool, the topography of Changbai Mountain can also enhance the intensity and height of the cold pool, maintaining a balance between the cold pool and the southeast wind and vertical wind shear, thereby promoting the formation and sustenance of precipitation. In EXP1, at 11:00 UTC, a cold pool extending about 1 km upwards (perturbation potential temperature < −2 K) was observed over the Bohai Sea (Figure 9a). According to the RKW theory, the cold pool outflow velocity (C), which was calculated in the region (39–39.5°N, 120.8–121.2°E) in EXP1 was 14.43 m·s−1, nearly offsetting the inflow velocity of the lower-level southeasterly winds, which was 14.72 m·s−1. Simultaneously, at 11:00 UTC, the intensity of the lower-level vertical wind shear (ΔU) was 14.33 m·s−1, and the ratio of C to ΔU was 1.01, indicating a near balance between the strength of the cold pool and the lower-level vertical wind shear. This equilibrium between the cold pool and the vertical wind shear, as well as the southeastern winds, fosters the development of the convective system. In contrast, in EXP2, the height of the cold pool was reduced by approximately 0.1 km, and its position shifted eastward, resulting in the triggering of convection and upward motion also occurring easterly (Figure 9b). The strength of the cold pool weakened to 13.56 m·s−1, no longer maintaining equilibrium with the southeastern winds (9.76 m·s−1) and the vertical wind shear (ΔU = 8.31 m·s−1).
4. Discussion
4.1. Thermal and Dynamic Mechanisms Supporting the Extreme Precipitation
Previous research has demonstrated that the high positive vorticity at the 500 hPa level associated with the Northeast Cold Vortex can induce low-level cyclonic circulation, significantly influencing extreme weather events in northeastern China [21,46]. In this study, the 500 hPa Northeast Cold Vortex, along with the cyclones at 850 hPa and the surface level, created an ideal circulation background for heavy precipitation in Liaoning Province (Figure 2a–c). The 850 hPa wind shear, the surface cold front, and the coupling of the upper and lower-level jet streams provided the dynamic conditions necessary to trigger convection (Figure 2a–c and Figure 6). A substantial amount of moisture was transported into Liaoning Province through the low-level jet stream, resulting in the area’s precipitable water (48 mm) being 60% higher than the July average (28.58 mm) for Liaoning Province [47], thus providing ample moisture for the formation of extreme precipitation events (Figure S1). Additionally, higher CAPE values, lower LCL, and the dry and cold upper layers coupled with warm and moist lower layers also favor the initiation of convection (Figure 3a).
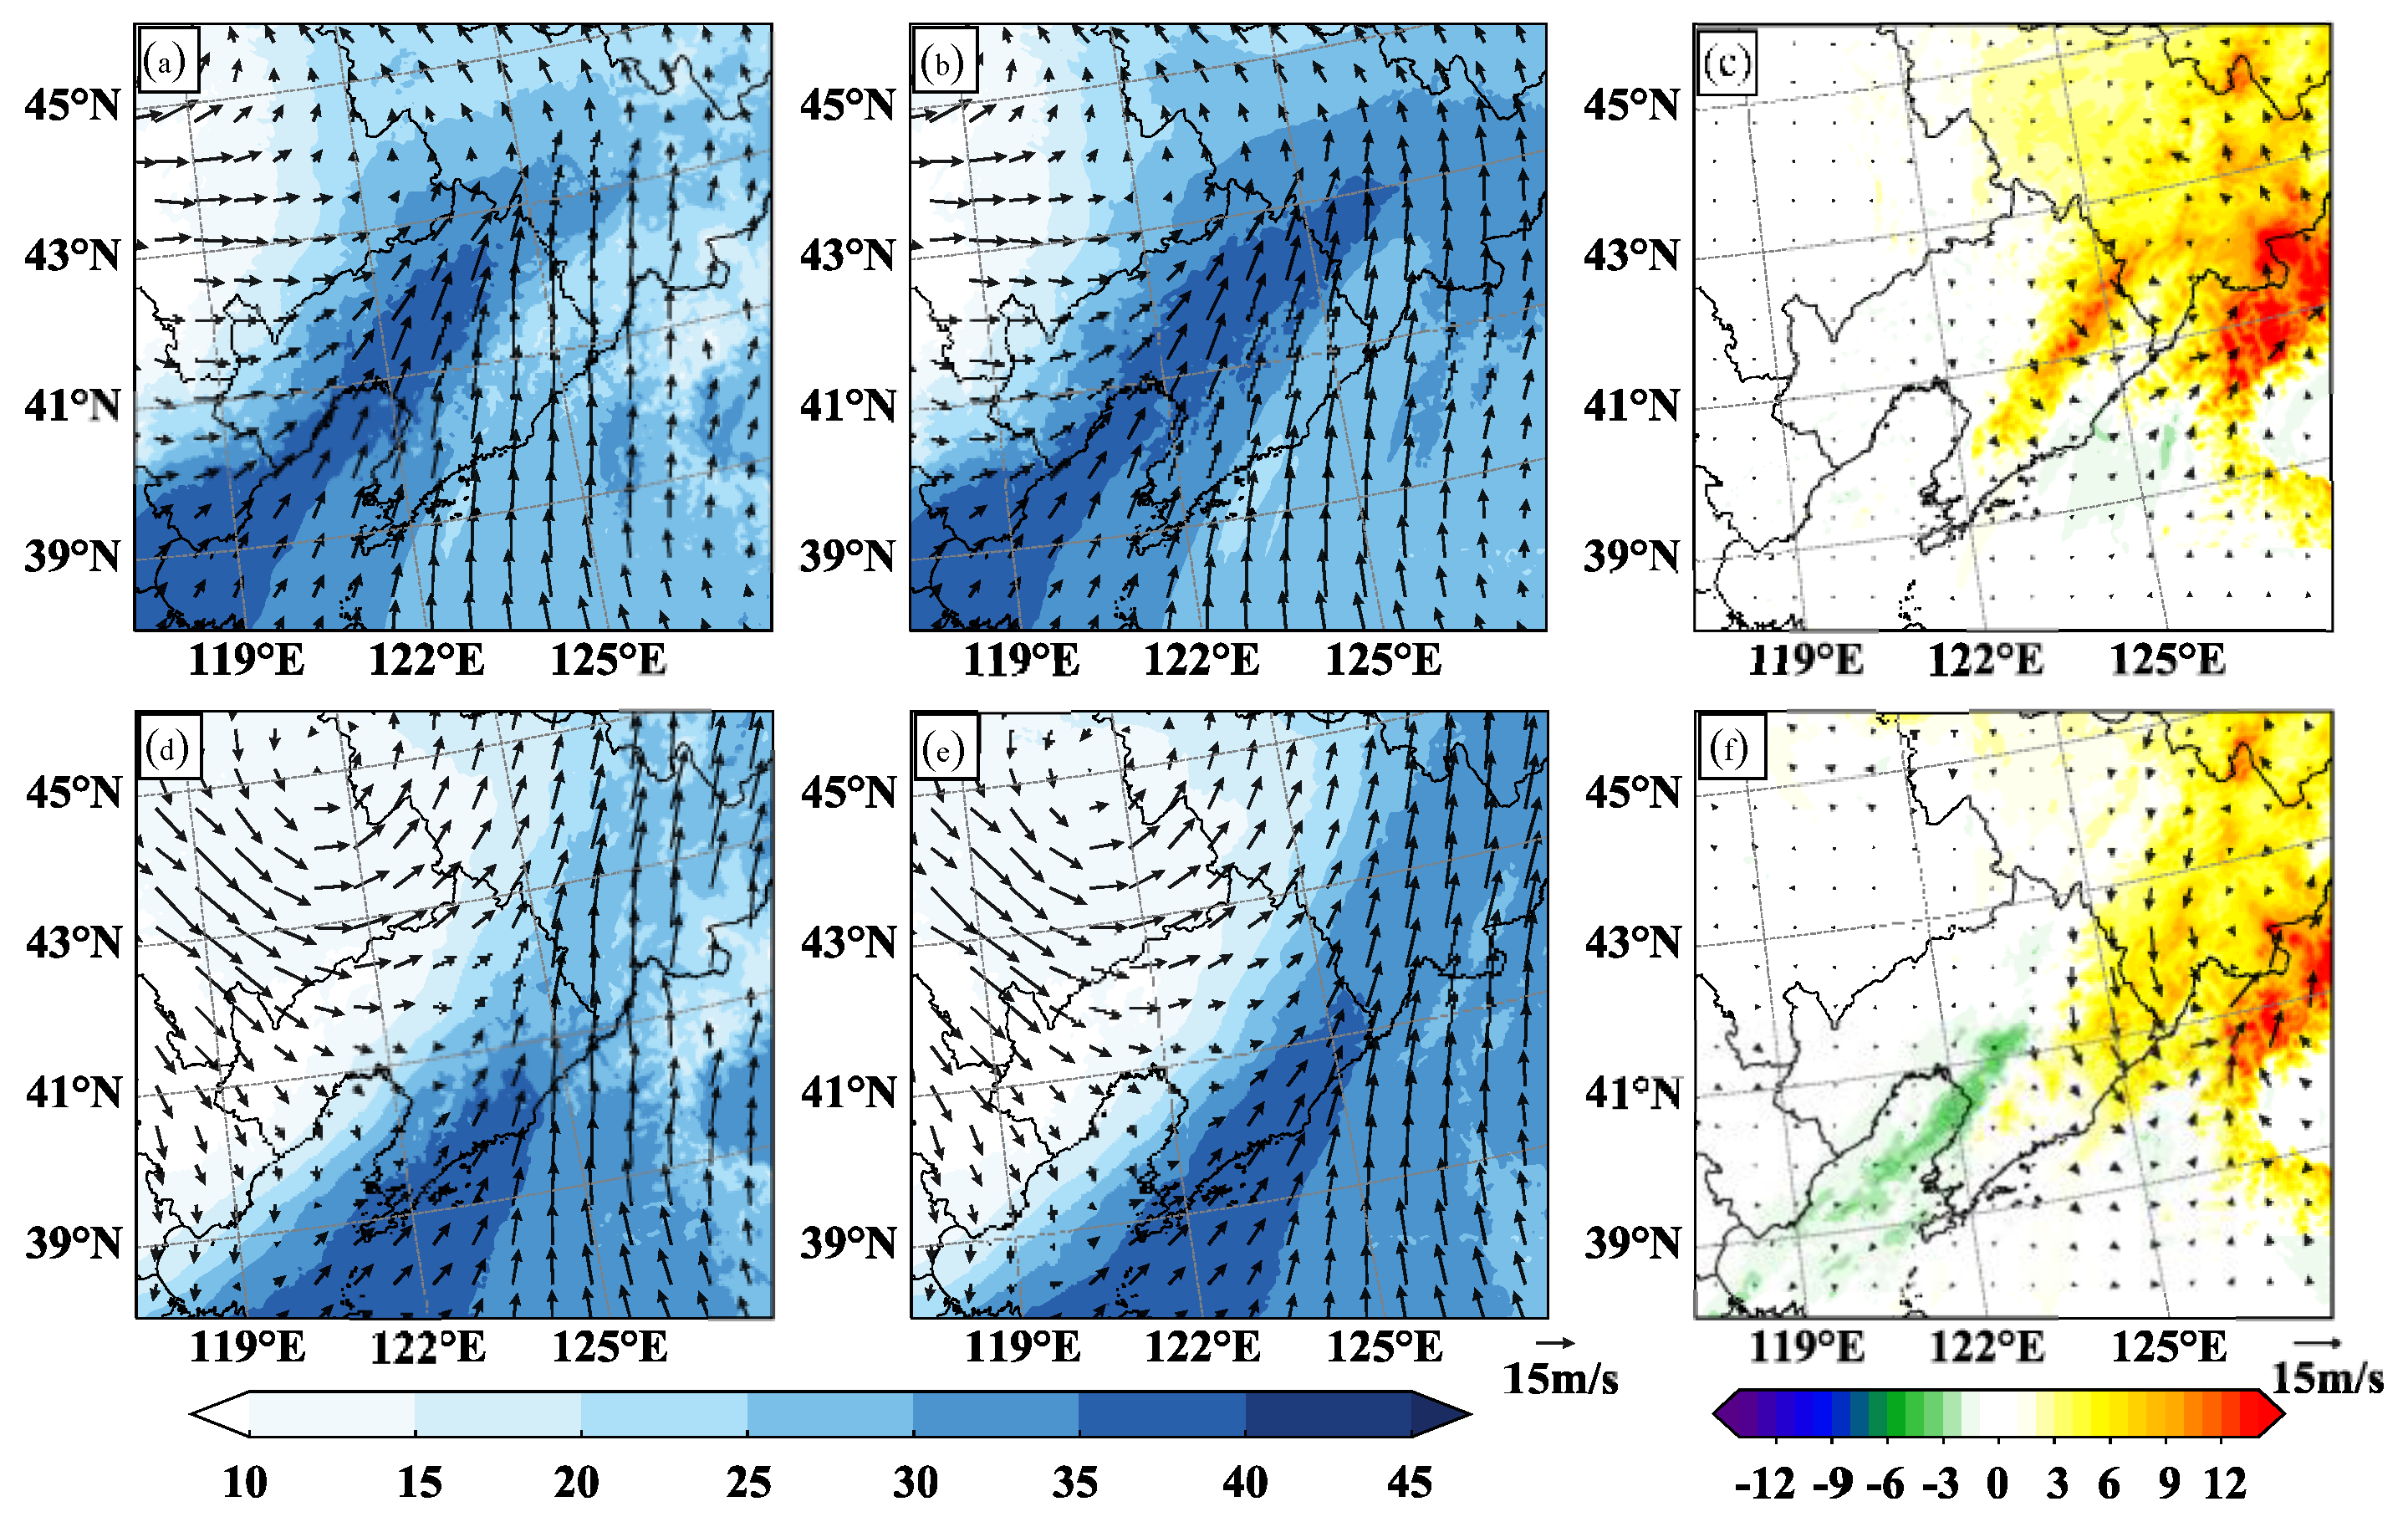
The influence of Changbai Mountain on precipitation varies between daytime and nighttime, stemming from the dynamic lifting mechanism of the terrain and its effect on hindering moisture. During the daytime, the terrain tends to weaken precipitation in the eastern part of Jilin Province (Figure S3c). In EXP1, moisture is blocked by Changbai Mountain and concentrated in the central part of Liaoning Province, where it undergoes lifting and condensation influenced by the cold front (Figure 10a). After reducing the height of the terrain, more moisture is transported to Jilin Province (Figure 10b,c), resulting in EXP2 simulating more daytime precipitation in the central region of Jilin Province (Figure S3c). During the nighttime, the terrain enhances precipitation in eastern Liaoning Province and Jilin Province (Figure S3d). In EXP1, moisture is blocked by the terrain, accumulating near the southeastern part of Liaoning Province (Figure 10d), and is then lifted and condensed by the dynamic lifting caused by the terrain and the downslope winds, providing favorable conditions for precipitation in Liaoning Province. However, in EXP2, after reducing the height of the Changbai Mountains, although more moisture is transported to the central part of Liaoning Province, the lack of dynamic lifting from the terrain results in less simulated precipitation in the eastern part of Liaoning Province (Figure 10e,f).
The cold pool in the Bohai Sea is considered another significant factor in enhancing and sustaining precipitation in Liaoning Province. The early precipitation forms a cold pool through evaporative cooling, and the convergence of the cold pool outflow with the southeast wind favors the formation of a linear convective system oriented from southwest to northeast (Figure 8a). Simultaneously, new convective cells are continuously triggered on the southwest side of the main convection and move northeastward under the influence of the prevailing southwestern winds, gradually merging into the primary convection, thereby contributing to the sustenance of precipitation in Liaoning Province (Figure 8b). The equilibrium between the warm and moist airflow and the outflow from the cold pool is considered another factor in maintaining the convection, as observed during the process of convective initiation on 2 June 2021 [48]. Moreover, the intensity and duration of convection triggered by the cold pool are highly sensitive to the low-level vertical wind shear in the surrounding environment. When the cold pool reaches equilibrium with the environmental wind shear, the lifting at the front edge of the cold pool becomes the strongest, making it more prone to triggering intense convection [49]. However, after reducing the height of Changbai Mountain, the weakening of the cold pool’s intensity and lowering of its height cause the cold pool to no longer balance with the vertical wind shear and the warm and moist southeastern airflow, thus affecting the intensity and duration of precipitation (Figure 9b). For a comprehensive understanding of the physical mechanism underlying the formation of extreme precipitation in Liaoning Province on 2 June 2022, please refer to Figure S5.
In summary, this study investigated the role of Changbai Mountain in an Extreme Precipitation Event in Liaoning Province, emphasizes the importance of considering the impact of Changbai Mountain on the intensity and movement of cold pool in Bohai Bay, which not only fills the knowledge gap in the interaction between complex terrain and sea in this region but also provides new ideas for further exploring the influencing factors and mechanisms of extreme precipitation in Liaoning Province. Meanwhile, it is also of great significance to study the dynamic process of the terrain affecting precipitation on both leeward and windward sides of the mountain for a deeper understanding of the valley winds. Liaoning Province is one of the 13 major grain-producing areas in China and is a crucial agricultural area and commodity grain base. Therefore, it is imperative to improve forecasting accuracy and quantify the flood risk and its impact on main crop yields, which benefit farmers by mitigating or adapting to flood-induced impact on agricultural systems.
4.2. Limitations of the Research
To establish the credibility of the simulation before analyzing the physical processes based on the simulation output, we use the IMERG-Final Run (V06 version) data product as rainfall observation to evaluate the WRF model’s simulation performance concerning the precipitation in Liaoning Province. The IMERG products have the advantage of higher temporal (half-hourly) and spatial resolution (0.1°) compared to low density and uneven spatial distribution ground-based observations in the regions with complex terrain [50]. Therefore, using high-resolution satellite-derived precipitation datasets can well reflect the precipitation situation and identify rainfall characteristics in the vicinity of Changbai Mountain. Meanwhile, the IMERG products demonstrate an improved capacity for effectively monitoring precipitation events and are capable of making up for the data uncertainties introduced by algorithms to interpolate sparse ground-based observations [51,52]. In addition, a previous study comparing IMERG data with other observations in Liaoning Province has shown that the IMERG products can exhibit good performance and better capture both the spatial and temporal distributions of the precipitation in Liaoning Province [53].
Comparing the WRF model with the precipitation observed by IMERG, the spatial distribution of the WRF model is close to the observation, but there is a certain discrepancy in the cumulative precipitation peak, which we believe could be attributed to the uncertainty of the model and other factors. Earlier investigations have emphasized that utilizing ERA5 as the initial and lateral boundary conditions for driving the WRF model leads to attenuated convection and an underestimation of precipitation due to reduced moisture transport to the mid-levels and the absence of vigorous updraft [54]. Based on sounding data from the Dalian station, the observed near-surface atmospheric moisture is saturated, while ERA5 indicates lower atmospheric moisture levels (Figure S6). This moisture deficiency, coupled with higher LCL in ERA5, results in diminished moisture condensation, consequently affecting the process of precipitation formation. Moreover, the inadequate horizontal resolution of the model in this study may also contribute to discrepancies between the simulated and observed precipitation. Higher horizontal resolution enables the WRF model to simulate small-scale precipitation systems better, thereby aiding in a more accurate representation of precipitation distribution, intensity, and spatiotemporal variations [55,56]. Note that the IMERG Final Run products have also been compared with ground-based observations and other satellite precipitation products; we found that there also exists a significant discrepancy in the rainfall amount among different precipitation products (not shown), which could affect the magnitude of the difference between observation and WRF simulated precipitation. However, despite these biases, the distribution of the rainfall is well-agreement with the observations, and therefore, this model experiment is suited to study the dynamics of the precipitation processes.
5. Conclusions
Based on half-hourly IMERG precipitation data, ERA5, and sounding data, this study conducted convection-permitting simulations using the mesoscale numerical model WRF-ARW to investigate the developmental process of a typical extreme precipitation event in Liaoning Province on 2 June 2021. The impact of Changbai Mountain’s topographical height variation on the typical heavy rainfall in Liaoning Province was explored by comparing the differences in atmospheric dynamic processes between the control and terrain-sensitive experiments. The main findings are as follows:
- (1)
- The topography obstructed the eastward progression of the cold front as the convective system advanced eastward towards the vicinity of Changbai Mountain, thus prolonging the duration of rainfall.
- (2)
- On the eastern slope of Changbai Mountain, precipitation was intensified by the uplifting effect of the topography on the warm and moist low-level airflow. On the western slope, orographic downslope winds converged with the southwest and northwest winds, further enhancing the upward motion.
- (3)
- The topography hindered the eastward movement of the cold pool and amplified its intensity, leading to a delicate balance between the cold pool, southeasterly wind, and vertical wind shear. This equilibrium facilitated the development of convection and sustained precipitation for several hours near Changbai Mountain.
In conclusion, Changbai Mountain played a crucial role in the extreme precipitation event in Liaoning Province. This study analyzed the impact of Changbai Mountain on extreme precipitation in Liaoning Province from the perspective of dynamics and moisture transport. However, it focused on a single typical case and only considered the influence of Changbai Mountain in Northeast China on local precipitation in Liaoning Province, without discussing the effects of other mountains in the region, such as Da Hinggan Ling and Xiao Hinggan Ling. In the future, further research will incorporate high-precision multi-source observational data, high-resolution numerical models, and various analytical techniques to investigate in-depth the influence and mechanisms of complex terrain in the northeast on regional precipitation.
Supplementary Materials
The following supporting information can be downloaded at: https://www.mdpi.com/article/10.3390/rs15184381/s1, Figure S1. Total column precipitable water (shaded; mm) distribution: (a) 6:00 UTC, (b) 12:00 UTC. The purple solid line outlines Liaoning Province; Figure S2. The regional average of Liaoning Province (38–43°N, 118–125°E) hourly precipitation (mm/h) changes in EXP1 (purple) and EXP2 (orange); Figure S3. Spatial pattern of observed 12 h accumulated total precipitation (mm) over Liaoning and Jilin during (a) 06/02/00:00–06/02/12:00 UTC and (b) 06/02/12:00–06/02/24:00 UTC in EXP2, and the precipitation in EXP2 minus the precipitation in EXP1 during (c) 06/02/00:00–06/02/12:00 UTC and (d) 06/02/12:00–06/03/00:00 UTC; Figure S4. Simulated 10 m composite radar reflectivity (shaded, dBZ) and 10 m horizontal wind at (a) 5:00 UTC, (b) 12:00 UTC and (c) 18:00 UTC in EXP2; Figure S5. A conceptual model of the multiscale dynamical process that formed the severe noc-turnal precipitation. The green shading is Changbai Mountain, and the blue shading at high altitude and low altitude are upper-level jet and cold pools respectively. The motion of the airflow is indi-cated by curved arrows of different colors; Figure S6. Thermodynamic (skew T-log p) diagram for the sounding taken at Dalian City at 0:00 UTC using (a) sounding data and (b) ERA5. For winds, full (half) barbs denote 4 (2) m s−1. The subgraph in the lower left corner of (a) shows the location of Dalian.
Author Contributions
J.Y.: Conceptualization, Methodology, Writing, original draft preparation, Analyzed the data; Y.H.: Writing, Review and Editing, Conceptualization, Methodology; L.L.: Conceptualization, Supervision; Y.L.: Validation, Funding, Writing—Review and Editing. All authors have read and agreed to the published version of the manuscript.
Funding
The study was funded by the Natural Science Foundation of Jiangsu Province (BK20230957), the Open Research Fund of State Key Laboratory of Simulation and Regulation of Water Cycle in River Basin, China Institute of Water Resources and Hydropower Research (IWHR-SKL-KF202204), the Jiangsu Funding Program for Excellent Postdoctoral Talent (2022ZB147), the Key Scientific and Technological Project of the Ministry of Water Resources. P.R.C (SKS-2022001), the Systematic Project of Guangxi Key Laboratory of Disaster Prevention and Engineering Safety (2022ZDK026), the TianHe Qingsuo Project special fund project in the field of climate, meteorology and ocean, the Natural Science Foundation of China (419505044), and the Talent Research Start-Up Fund of Nanjing University of Aeronautics and Astronautics (No. 1007-90YAH22046).
Data Availability Statement
All the data are freely available. The ERA5 reanalysis dataset from Copernicus Climate Change Service at European Center for Medium-Range Weather Forecasting (https://cds.climate.copernicus.eu/cdsapp#!/search?type=dataset&text=ERA5, access on 23 July 2023). The IMERG observation data from the National Aeronautics and Space Administration of the United States and the Japan Aerospace Exploration Agency (https://gpm.nasa.gov/data/directory, access on 23 July 2023). Sounding data from the esteemed University of Wyoming in the United States (http://weather.uwyo.edu/upperair/bufrraob.shtml, access on 23 July 2023).
Conflicts of Interest
We have no competing financial interest or personal relationships that could have appeared to influence the work reported in this paper.
References
- Jayesh, P. Role of Eastern Ghats Orography and Cold Pool in an Extreme Rainfall Event over Chennai on 1 December 2015. Mon. Weather Rev. 2018, 4, 943–965. [Google Scholar]
- Akkoyunlu, B.-O.; Baltaci, H.; Tayanc, M. Atmospheric conditions of extreme precipitation events in western Turkey for the period 2006–2015. Nat. Hazards Earth Syst. Sci. 2019, 1, 107–119. [Google Scholar] [CrossRef]
- Luo, L.-P.; Xue, M.; Zhu, K.-F. The Initiation and Organization of a Severe Hail-Producing Mesoscale Convective System in East China: A Numerical Study. J. Geophys. Res. Atmos. 2020, 17, e2020JD032606. [Google Scholar]
- Hock, N.; Zhang, F.-M.; Pu, Z.-X. Numerical Simulations of a Florida Sea Breeze and Its Interactions with Associated Convection: Effects of Geophysical Representation and Model Resolution. Adv. Atmos. Sci. 2022, 39, 697–713. [Google Scholar] [CrossRef]
- Zhu, D.; Zhi, X.; Wang, N.; Chen, C.; Tian, X.; Yu, Y. Impacts of Changbai Mountain Topography on the Extreme Precipitation From Super Typhoon Maysak. Front. Environ. Sci. 2022, 9, 818402. [Google Scholar] [CrossRef]
- Brian, H. A potential vorticity view of synoptic development. Meteorol. Appl. 1997, 4, 325–334. [Google Scholar]
- Xin, X.; Ming, X.; Yuan, W.; Hao, H. Mechanisms of secondary convection within a Mei-Yu frontal mesoscale convective system in eastern China. J. Geophys. Res. Atmos. 2017, 1, 47–64. [Google Scholar]
- Wang, Y.; Wu, J. Overview of the Application of Orographic Data in Numerical Weather Prediction in Complex Orographic Areas. Adv. Meteorol. 2022, 2022, 1279625. [Google Scholar] [CrossRef]
- Lapenta, K.-D.; McNaught, B.-J.; Capriola, S.-J.; Giordano, L.-A.; Little, C.-D.; Hrebenach, S.-D.; Carter, G.-M.; Valverde, M.-D.; Frey, D.-S. The challenge of forecasting heavy rain and flooding throughout the Eastern Region of the National Weather Service. Part I: Characteristics and events. Weather Forecast. 1995, 1, 78–90. [Google Scholar] [CrossRef]
- Agyakwah, W.; Lin, Y. Generation and enhancement mechanisms for extreme orographic rainfall associated with Typhoon Morakot (2009) over the Central Mountain Range of Taiwan. Atmos. Res. 2021, 247, 105160. [Google Scholar] [CrossRef]
- Yu, R.; Zhou, T.; Xiong, A.; Zhu, Y.; Li, J. Diurnal variations of summer precipitation over contiguous China. Geophys. Res. Lett. 2007, 1, L1704. [Google Scholar] [CrossRef]
- Nishizawa, S.; Yamaura, T.; Kajikawa, Y. Influence of sub-mesoscale topography on daytime precipitation associated with thermally driven local circulations over a mountainous region. J. Atmos. Sci. 2021, 8, 2511–2532. [Google Scholar] [CrossRef]
- He, H.; Zhang, H. Diurnal Variations of Warm-Season Precipitation over Northern China. Mon. Weather Rev. 2010, 4, 1017–1025. [Google Scholar]
- Richard, R.; Robert, A.-H. Lessons on orographic precipitation from the Mesoscale Alpine Programme. Q. J. R. Meteorol. Soc. 2007, 625, 811–830. [Google Scholar]
- Luis, G.; Francina, D.; Raquel, N.; Ricardo, T.; Anita, D.; Chris, J.-C.-R.; Andréa, S.-T.; Alexandre, M.-R.; Ramesh, K.; José, M. Major Mechanisms of Atmospheric Moisture Transport and Their Role in Extreme Precipitation Events. Annu. Rev. Environ. Resour. 2016, 1, 117–141. [Google Scholar]
- Katurji, M.; Zhong, S. The Influence of Topography and Ambient Stability on the Characteristics of Cold-Air Pools: A Numerical Investigation. J. Appl. Meteorol. Climatol. 2012, 10, 1740–1749. [Google Scholar]
- Chu, Z.; Guo, J.; Zhao, J. Impacts of future climate change on agroclimatic resources in Northeast China. J. Geogr. Sci. 2017, 9, 1044–1058. [Google Scholar] [CrossRef]
- Tao, C.; Jiang, C.; Sun, J. Prediction of future change in climate in Northeast China using a CMIP5 multi-model ensemble. Chin. J. Geophys. 2016, 10, 3580–3591. [Google Scholar]
- Zhang, L.; Meng, X.; Wang, H.; Yang, M.; Cai, S. Investigate the Applicability of CMADS and CFSR Reanalysis in Northeast China. Water 2020, 4, 996. [Google Scholar] [CrossRef]
- Villarini, G.; Krajewski, W.-F. Review of the Different Sources of Uncertainty in Single Polarization Radar-Based Estimates of Rainfall. Surv. Geophys. 2010, 1, 23. [Google Scholar]
- Liu, Y.; Liang, Z.; Li, Y. Observational and Simulative Study of a Local Severe Precipitation Event Caused by a Cold Vortex over Northeast China. Adv. Meteorol. 2017, 2017, 2764340. [Google Scholar] [CrossRef]
- He, H.; Sun, J.; Yu, E.; Wang, H.; Zhang, M.; Hua, W. Simulation Study on the Influence of the Great Khingan Strip and Changbai Mountain on Summer Rainfall in Northeast China. Clim. Environ. Res. 2020, 25, 268–280. [Google Scholar]
- Li, N.; Jiao, B.; Ran, L.; Gao, Z.; Gao, S. Influence of the Upstream Terrain on the Formation of a Cold Frontal Snowband in Northeast China. Asia Pac. J. Atmos. Sci. 2022, 2, 243–264. [Google Scholar] [CrossRef]
- Wu, Y.; Cui, J.; Li, C.; Li, D.; Duan, Y.; Xu, S. Analysis of Environmental Conditions and Predictability of a Strong Wind Process in Shenyang City after the Cold Vortex. For. Chem. Rev. 2022, 488–503. Available online: https://forestchemicalsreview.com/index.php/JFCR/article/view/563 (accessed on 23 July 2023).
- Geng, S.; Cai, K.; Wang, Y.; Zhou, F.; Xiao, G.; Huang, H.; Chai, X. Observational analysis of EF4 tornadic supercell storm in Kaiyuan of Liaoning province on 3 July 2019. J. Meteorol. Environ. 2022, 3, 1–10. (In Chinese) [Google Scholar]
- Yang, X.-J.; Xu, Z.-X.; Liu, W.-F.; Liu, L. Spatiotemporal characteristics of extreme precipitation at multiple timescales over Northeast China during 1961–2014. J. Water Clim. Chang. 2017, 3, 535–556. [Google Scholar] [CrossRef]
- Long, J. Regional tourism cooperation in triangle zone of liaoning province. Chin. Geogr. Sci. 2005, 4, 361–367. [Google Scholar] [CrossRef]
- Guan, Y.; Li, X.; Yang, J.; Li, S.; Tian, S. Spatial differentiation of comprehensive suitability of urban human settlements based on GIS: A case study of Liaoning Province, China. Environ. Dev. Sustain. 2021, 24, 4150–4174. [Google Scholar] [CrossRef]
- Qian, F.; Chi, Y.; Lal, R.; Lorenz, K. Spatio-temporal characteristics of cultivated land fragmentation in different landform areas with a case study in Northeast China. Ecosyst. Health Sustain. 2020, 1, 1800415. [Google Scholar] [CrossRef]
- Li, Y.; Liu, M.; Sun, J.; Zhao, Y. Analysis of extreme precipitation event characteristics and typical events based on the intensity–area–duration method in Liaoning Province. Theor. Appl. Climatol. 2023, 152, 201–211. [Google Scholar] [CrossRef]
- Sun, F.; Yuan, J. Recent 40 years inter-decadal fluctuation of dry and wet climate boundary and its cause in Liaoning Province. J. Appl. Ecol. Chin. 2006, 17, 1274–1279. [Google Scholar]
- Vlado, S.; Julian, B.; Bosko, T.; Boro, J. Prediction of extreme convective rainfall intensities using a free-running 3-D sub-km-scale cloud model initialized from WRF km-scale NWP forecasts. J. Atmos. Sol. Terr. Phys. 2020, 209, 105401. [Google Scholar]
- Neyestani, A.; Gustafsson, N.; Ghader, S.; Mohebalhojeh, A.-R.; Körnich, H. Operational convective-scale data assimilation over Iran: A comparison between WRF and HARMONIE-AROME. Dyn. Atmos. Ocean. 2021, 95, 101242. [Google Scholar] [CrossRef]
- Zhu, K.; Yu, B.; Xue, M.; Zhou, B.; Hu, X. Summer Season Precipitation Biases in 4 km WRF Forecasts Over Southern China: Diagnoses of the Causes of Biases. J. Geophys. Res. Atmos. 2021, 126, e2021JD035530. [Google Scholar] [CrossRef]
- Gao, Y.; Wu, T.; Chen, B.; Wang, J.; Liu, Y. A Numerical Simulation of Microphysical Structure of Cloud Associated with the 2008 Winter Freezing Rain over Southern China. J. Meteorol. Soc. Japan Ser. II 2013, 2, 101–117. [Google Scholar]
- Nakanishi, M.; Niino, H. Development of an Improved Turbulence Closure Model for the Atmospheric Boundary Layer. J. Meteorol. Soc. Japan Ser. II 2009, 5, 895–912. [Google Scholar] [CrossRef]
- Iacono, M.-J.; Delamere, J.-S.; Mlawer, E.-J.; Shephard, M.-W.; Clough, S.-A.; Collins, W.-D. Radiative forcing by long-lived greenhouse gases: Calculations with the AER radiative transfer models. J. Geophys. Res. 2008, 113. [Google Scholar] [CrossRef]
- Niu, G.-Y.; Yang, Z.-L.; Mitchell, K.-E.; Chen, F.; Ek, M.-B.; Barlage, M.; Kumar, A.; Manning, K.; Niyogi, D.; Rosero, E.; et al. The community Noah land surface model with multiparameterization options (Noah-MP): 1. Model description and evaluation with local-scale measurements. J. Geophys. Res. 2011, 116. [Google Scholar] [CrossRef]
- Zhang, C.; Gu, M.; Hu, Y.; Huang, P.; Yang, T.; Huang, S.; Yang, C.; Shao, C. A Study on the Retrieval of Temperature and Humidity Profiles Based on FY-3D/HIRAS Infrared Hyperspectral Data. Remote Sens. 2021, 11, 2157. [Google Scholar] [CrossRef]
- Pérez-Planells, L.; García-Santos, V.; Caselles, V. Comparing different profiles to characterize the atmosphere for three MODIS TIR bands. Atmos. Res. 2015, 161, 108–115. [Google Scholar] [CrossRef]
- Silva, N.-A.; Webber, B.-G.-M.; Matthews, A.-J.; Feist, M.-M.; Stein, T.-H.-M.; Holloway, C.-E.; Abdullah, M.-F.-A.-B. Validation of GPM IMERG Extreme Precipitation in the Maritime Continent by Station and Radar Data. Earth Space Sci. 2021, 7, e1738E–e2021E. [Google Scholar] [CrossRef]
- Moazami, S.; Najafi, M.-R. A Comprehensive Evaluation of GPM-IMERG V06 and MRMS with Hourly Ground-Based Precipitation Observations across Canada. J. Hydrol. 2020, 594, 125929. [Google Scholar] [CrossRef]
- Robert, A.-H. Orographic effects on precipitating clouds. Rev. Geophys. 2012, 1, G1001. [Google Scholar]
- Piotr, K.-S.; Richard, R. Low Froude Number Flow Past Three-Dimensional Obstacles. Part I: Baroclinically Generated Lee Vortices. Am. Meteorol. Soc. 1988, 8, 1154–1164. [Google Scholar]
- Buzzi, A.; Tartaglione, N.; Piero, M. Numerical simulations of the 1994 Piedmont flood: Role of orography and moist processes. Mon. Weather Rev. 1998, 9, 2369–2383. [Google Scholar] [CrossRef]
- Xie, Z.-W.; Bueh, C.; Ji, L.-R.; Sun, S.-Q. The Cold Vortex Circulation over Northeastern China and Regional Rainstorm Events. Atmos. Ocean. Sci. Lett. 2015, 2, 134–139. [Google Scholar]
- Yang, L.; Jiang, D.; Ying, W.; Kuizhi, C.; Li, S. Analysis of Atmospheric Precipitable Water Vapor Characteristics During Flood Season in Liaoning Province Based on GPS Remote Sensing Data. J. Arid Meteorol. 2016, 34, 82–87. [Google Scholar]
- Wei, P.; Xu, X.; Xue, M.; Zhang, C.; Wang, Y.; Zhao, K.; Zhou, A.; Zhang, S.; Zhu, K. On the Key Dynamical Processes Supporting the 21.7 Zhengzhou Record-breaking Hourly Rainfall in China. Adv. Atmos. Sci. 2023, 40, 337–349. [Google Scholar] [CrossRef]
- Coniglio, M.-C.; Corfidi, S.-F.; Kain, J.-S. Views on Applying RKW Theory: An Illustration Using the 8 May 2009 Derecho-Producing Convective System. Mon. Weather Rev. 2012, 3, 1023–1043. [Google Scholar] [CrossRef]
- Zhang, D.; Yang, M.; Ma, M.; Tang, G.; Wang, T.; Zhao, X.; Ma, S.; Wu, J.; Wang, W. Can GPM IMERG Capture Extreme Precipitation in North China Plain? Remote Sens. 2022, 4, 928. [Google Scholar] [CrossRef]
- Ehsan, S.; Reinhold, S.; Bahram, S. Assessment of GPM-IMERG and Other Precipitation Products against Gauge Data under Different Topographic and Climatic Conditions in Iran: Preliminary Results. Remote Sens. 2016, 8, 135. [Google Scholar] [CrossRef]
- Sahlu, D.; Nikolopoulos, E.-I.; Moges, S.-A.; Anagnostou, E.-N.; Hailu, D. First Evaluation of the Day-1 IMERG over the Upper Blue Nile Basin. J. Hydrometeorol. 2016, 17, 2875–2882. [Google Scholar] [CrossRef]
- Yang, G.; Wu, Y.; Lin, M. Evaluating the Applicability of GPM Satellite Precipitation Data. J. Shenyang Agric. Univ. Chin. 2020, 5, 559–567. [Google Scholar]
- Leena, K.; Sandeep, P. Impact of initial conditions and cloud parameterization on the heavy rainfall event of Kerala (2018). Model. Earth Syst. Environ. 2021, 7, 2809–2822. [Google Scholar]
- Stergiou, I.; Tagaris, E.; Sotiropoulou, R.-P. Investigating the WRF Temperature and Precipitation Performance Sensitivity to Spatial Resolution over Central Europe. Atmosphere 2021, 2, 278. [Google Scholar] [CrossRef]
- Dario, C.; Silvio, G.; Piero, L. Effect of Model Resolution on Intense and Extreme Precipitationinthe Mediterranean Region. Atmosphere 2020, 11, 699. [Google Scholar] [CrossRef]
Figure 1.
The WRF domain and its topography. (a) Default elevation; (b) elevation in the Changbai Mountain region (122–132°E, 39.5–46°N) is one-tenth of the default elevation; (c) the ratio between EXP2 and EXP1 altitudes, where GK, LK, and CB represent Great Khingan, Lesser Khingan Mountains, and Changbai Mountain, respectively.

Figure 2.
Synoptic environment at 6:00 UTC on 2 June: (a) geopotential height at 500 hPa (solid lines; gpm), temperature (dotted lines; °C), horizontal wind (vector; m·s−1) and EAJS at 200 hPa (shaded; m·s−1), (b) geopotential height at 850 hPa (solid lines; gpm), temperature (dotted lines; °C), horizontal wind (vector; m·s−1) and low-level jet stream (shaded; m·s−1), (c) CAPE at 1000 hPa (shaded; J·kg−1), surface pressure (solid lines; hPa), temperature (dotted lines; °C), horizontal wind (vector; m·s−1) distribution. The solid purple line outlines Liaoning and Jilin Provinces.

Figure 3.
Thermodynamic (skew T-log p) diagram for the sounding taken at Anshan City at (a) 3:00 UTC on 2 June and (b) 21:00 UTC on 2 June. For winds, full (half) barbs denote 4 (2) m·s−1.
Figure 3.
Thermodynamic (skew T-log p) diagram for the sounding taken at Anshan City at (a) 3:00 UTC on 2 June and (b) 21:00 UTC on 2 June. For winds, full (half) barbs denote 4 (2) m·s−1.

Figure 4.
Spatial pattern of observed 12 h accumulated total precipitation (mm) over Liaoning and Jilin Province during (a) 06/02/00:00–06/02/12:00 UTC and (b) 06/02/12:00–06/02/24:00 UTC. (c,d) as in panels (a,b), but showing simulated precipitation in EXP1.
Figure 4.
Spatial pattern of observed 12 h accumulated total precipitation (mm) over Liaoning and Jilin Province during (a) 06/02/00:00–06/02/12:00 UTC and (b) 06/02/12:00–06/02/24:00 UTC. (c,d) as in panels (a,b), but showing simulated precipitation in EXP1.

Figure 5.
Spatial pattern of observed 24 h accumulated total precipitation (mm) during 06/02/00:00 UTC–06/02/24:00 UTC in (a) EXP1 and (b) EXP2, and (c) The difference in precipitation between EXP2 and EXP1 (defined as EXP2 minus EXP1) during 06/02/00:00 UTC–06/02/24:00 UTC.
Figure 5.
Spatial pattern of observed 24 h accumulated total precipitation (mm) during 06/02/00:00 UTC–06/02/24:00 UTC in (a) EXP1 and (b) EXP2, and (c) The difference in precipitation between EXP2 and EXP1 (defined as EXP2 minus EXP1) during 06/02/00:00 UTC–06/02/24:00 UTC.

Figure 6.
Simulated 10 m composite radar reflectivity (shaded, dBZ) and 10 m horizontal wind (vector, m·s−1) at (a) 5:00 UTC, (b) 12:00 UTC and (c) 18:00 UTC in EXP1. The brown lines in (a–c) denote the cold front. Additionally, the differences between EXP2 and EXP1 (defined as EXP2 minus EXP1) at (d) 5:00 UTC, (e) 12:00 UTC and (f) 18:00 UTC. The dotted areas are indicated to pass the 95% confidence test.

Figure 7.
Vertical cross sections of (contour, every 10 K), wind vectors (m·s−1) and total cloud mixing ratio (shading, kg·kg−1) from (42°N, 122°E) to (39.9°N, 125°E) in (a) EXP1 and (b) EXP2 at 12:00 UTC.
Figure 7.
Vertical cross sections of (contour, every 10 K), wind vectors (m·s−1) and total cloud mixing ratio (shading, kg·kg−1) from (42°N, 122°E) to (39.9°N, 125°E) in (a) EXP1 and (b) EXP2 at 12:00 UTC.

Figure 8.
The 10 m potential temperature (shaded, K), horizontal wind (m·s−1) and 45 dBZ radar reflectivity (green contours, dBZ) at (a) 11:00, (b) 11:30 UTC in EXP1 and (c) 11:00, (d) 11:30 UTC in EXP2.
Figure 8.
The 10 m potential temperature (shaded, K), horizontal wind (m·s−1) and 45 dBZ radar reflectivity (green contours, dBZ) at (a) 11:00, (b) 11:30 UTC in EXP1 and (c) 11:00, (d) 11:30 UTC in EXP2.

Figure 9.
Vertical cross-sections of wind vectors (vector, m·s−1), radar reflectivity (contour, dBZ), perturbation potential temperature (shaded, K) at 11:00 UTC in (a) EXP1 and (b) EXP2 from (39.8°N, 120.5°E) to (39°N, 121°E).
Figure 9.
Vertical cross-sections of wind vectors (vector, m·s−1), radar reflectivity (contour, dBZ), perturbation potential temperature (shaded, K) at 11:00 UTC in (a) EXP1 and (b) EXP2 from (39.8°N, 120.5°E) to (39°N, 121°E).

Figure 10.
Spatial pattern of total column precipitable water (shaded, mm), horizontal wind at 850 hPa (m·s−1) averaged from 06/02/00:00 UTC to 06/02/12:00 UTC in (a) EXP1, (b) EXP2 and (c) the difference between EXP2 and EXP1 (defined as EXP2 minus EXP1. (d–f) as in panels (a–c), but showing the simulation averaged from 06/02/12:00 UTC to 06/02/24:00 UTC.


Table 1.
The parameterization scheme configuration of the WRF model in this study.
| Description | EXP1 (CTL) | EXP2 |
|---|---|---|
| Altitude of Changbai Mountain | Default altitude | Default altitude × 0.1 |
| Horizontal resolution (grid dimensions) | d01: 9 km (308 × 300) d02: 3 km (481 × 481) | |
| Vertical levels (Top pressure) | 48 (10 hPa) | |
| Cloud microphysics | Morrison | |
| Atmospheric surface layer | MYNN | |
| Planetary boundary layer scheme | MYNN | |
| Short-/Longwave radiation scheme | RRTMG | |
| Land surface | unified Noah | |
| Cumulus parameterization | None | |
Disclaimer/Publisher’s Note: The statements, opinions and data contained in all publications are solely those of the individual author(s) and contributor(s) and not of MDPI and/or the editor(s). MDPI and/or the editor(s) disclaim responsibility for any injury to people or property resulting from any ideas, methods, instructions or products referred to in the content. |
© 2023 by the authors. Licensee MDPI, Basel, Switzerland. This article is an open access article distributed under the terms and conditions of the Creative Commons Attribution (CC BY) license (https://creativecommons.org/licenses/by/4.0/).
Share and Cite
MDPI and ACS Style
Yang, J.; Huang, Y.; Luo, L.; Li, Y. The Role of Changbai Mountain in an Extreme Precipitation Event in Liaoning Province, China. Remote Sens. 2023, 15, 4381. https://doi.org/10.3390/rs15184381
AMA Style
Yang J, Huang Y, Luo L, Li Y. The Role of Changbai Mountain in an Extreme Precipitation Event in Liaoning Province, China. Remote Sensing. 2023; 15(18):4381. https://doi.org/10.3390/rs15184381
Chicago/Turabian StyleYang, Jing, Ya Huang, Liping Luo, and Yanping Li. 2023. "The Role of Changbai Mountain in an Extreme Precipitation Event in Liaoning Province, China" Remote Sensing 15, no. 18: 4381. https://doi.org/10.3390/rs15184381
Note that from the first issue of 2016, this journal uses article numbers instead of page numbers. See further details here.