Article

Typical Fine Structure and Seismogenic Mechanism Analysis of the Surface Rupture of the 2022 Menyuan Mw 6.7 Earthquake

1
Key Laboratory of Mineral Resources in Western China (Gansu Province), School of Earth Sciences, Lanzhou University, Lanzhou 730000, China
2
Lanzhou Institute of Seismology, China Earthquake Administration, Lanzhou 730000, China
3
Department of Geographic Science, Faculty of Arts and Sciences, Beijing Normal University, Zhuhai 519000, China
4
Qinghai Earthquake Agency, Xining 810001, China
*
Author to whom correspondence should be addressed.
Remote Sens. 2023, 15(18), 4375; https://doi.org/10.3390/rs15184375
Submission received: 9 July 2023 / Revised: 21 August 2023 / Accepted: 28 August 2023 / Published: 6 September 2023

Abstract

:
On 8 January 2022, a seismic event of significant magnitude (Mw 6.7, Ms 6.9) occurred in the northeastern region of the Tibetan Plateau. This earthquake was characterized by left-lateral strike-slip motion, accompanied by a minor reverse movement. The Menyuan earthquake resulted in the formation of two main ruptures and one secondary rupture. These ruptures were marked by a left-lateral step zone that extended over a distance of 1 km between the main ruptures. The length of the rupture zones was approximately 37 km. The surface rupture zone exhibited various features, including left-lateral offset small gullies, riverbeds, wire fences, road subgrades, mole tracks, cracks, and scarps. Through a comprehensive field investigation and precise measurement using unmanned aerial vehicle (UAV) imagery, 111 coseismic horizontal offsets were determined, with the maximum offset recorded at 2.6 ± 0.3 m. The analysis of aftershocks and the findings from the field investigation led to the conclusion that the earthquake was triggered by the Lenglongling fault and the Tuolaishan fault. These faults intersected at a release double-curved structure, commonly referred to as a stepover. During this particular process, the Lenglongling fault was responsible for initiating the coseismic rupture of the Sunan–Qilian fault. It is important to note that the stress applied to the Tuolaishan fault has not been fully relieved, indicating the presence of potential future hazards.

1. Introduction

Earthquake surface ruptures are a visible indication of fault activity, and studying the spatial extent and displacement distribution of these ruptures is crucial for understanding the behavior of active faults during seismic events [1]. They also provide an excellent opportunity to investigate the mechanisms and dynamics of regional tectonic deformations. The parameters of earthquake ruptures can be used to establish empirical relationships with earthquake magnitude [2] and assess the hazards associated with faults [3]. Traditionally, the distribution and displacement of earthquake surface rupture zones are determined via tracking and measuring along the fault zone. However, this method could be more efficient and prone to measurement errors. The accuracy of earthquake rupture data limits our comprehensive understanding of the process and mechanisms of seismic ruptures. Recent advancements in photogrammetry have greatly improved our ability to describe earthquake surface ruptures. This technology allows for acquiring high-resolution topographic data, enabling more detailed mapping of seismic surface ruptures [4,5]. Photogrammetry has proven to be a valuable tool for studying earthquake ruptures in remote and high-altitude mountainous regions [6,7].
On 8 January 2022, a magnitude 6.7 earthquake occurred along the western section of the Lenglongling fault (LLLF) within the Qilian–Haiyuan fault zone (QHF) in the northeastern margin of the Tibetan Plateau (Figure 1). The slip model and rupture parameters of this earthquake are crucial for studying geological structures and evaluating potential seismic hazard models of active faults. Various organizations have obtained multiple explanations (Table 1) for the focal mechanism of this earthquake using different methods and data sources. Although these focal mechanisms derived from seismic wave data using single fault models have varying degrees of uncertainty, they all indicate that the earthquake was a strike-slip event.
Based on the published articles in the emerging scientific field of investigation following the earthquake, there are discrepancies in understanding the number of rupture zones, the total length, the geometric relationship, and the maximum offset of the Menyuan Mw 6.7 earthquake. For instance, Li et al. [8], combining surface investigation results and InSAR inversion, concluded that the earthquake rupture zone was distributed in the western part of the LLLF and the eastern part of the Tuolaishan fault (TLSF), with a total length exceeding 22 km and a maximum horizontal displacement of approximately 2.41 m. Pan et al. [9] found that the earthquake rupture zone was about 27 km, with a step distance of approximately 3 km between the northern and southern rupture zones and a maximum horizontal displacement of about 3.7 m. Han et al. [10] suggested that the maximum displacement was approximately 3 ± 0.2 m, with a main rupture length of 22 km and a secondary rupture length of about 7.5 km (a right-lateral normal fault). Liang et al. [11] determined that the rupture zone of the earthquake had a length of 29.5 km and a maximum offset of 2.77 m. In contrast, Yuan et al. [12] conducted field investigations and utilized aerial photography from UAVs (unmanned aerial vehicles) to estimate that the length of the northern rupture zone was over 22 km, the southern rupture zone was approximately 9 km, and the total length was around 31 km. These two rupture zones exhibited left-stepping behavior, with a minimum step distance of about 1.0 km and a maximum offset of approximately 2.6 ± 0.3 m. Niu et al. [13] proposed that the earthquake generated five rupture zones measuring 31.7 km long with a maximum offset of 3.5 m. There are still discrepancies in the understanding of the surface rupture zone of this earthquake, particularly regarding the offsets, rupture mechanisms, and stepped distance (Table 2).
In this study, a thorough investigation was conducted by combining emergency surveys conducted in January and mapping investigations conducted in June 2022. Furthermore, high-resolution remote sensing images obtained from unmanned aerial vehicles (UAVs) were employed to interpret and precisely ascertain the characteristics of the earthquake rupture zones, such as their quantity, length, and maximum displacement. Subsequently, we analyzed the seismogenic structure, mechanism, and tectonic implications of this earthquake.

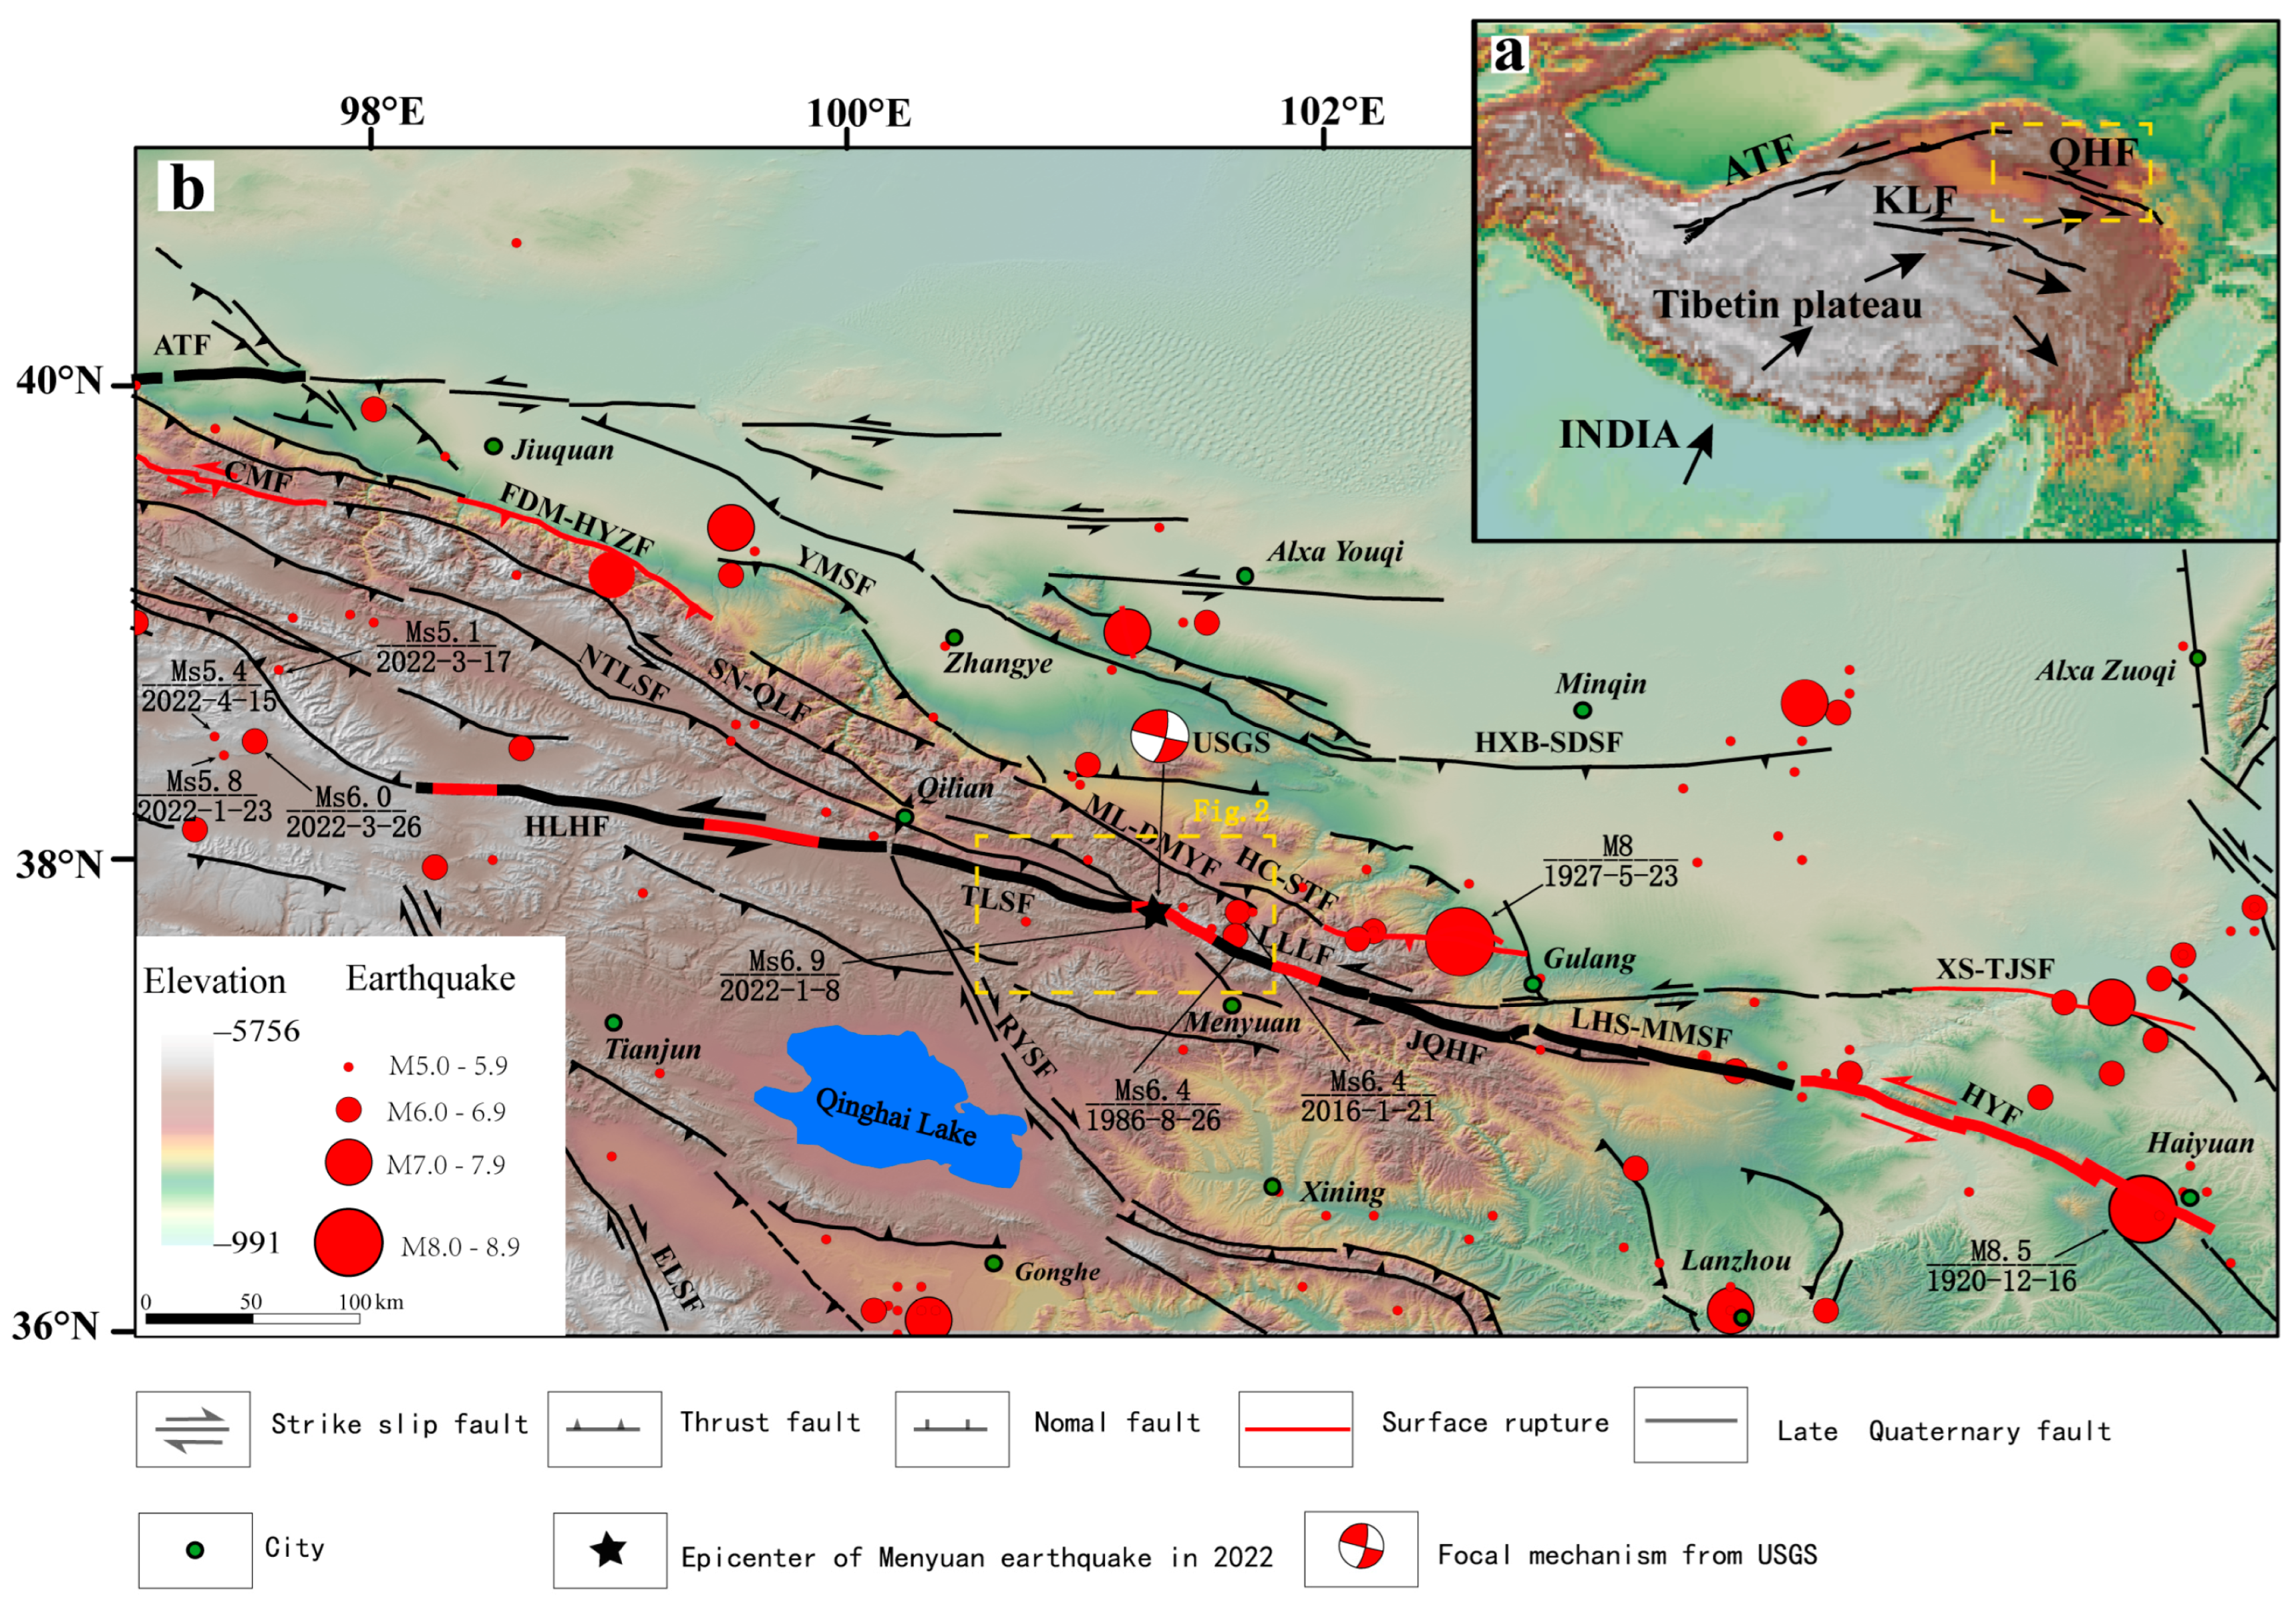
2. Geological Setting

The convergence of the Indian Plate and the Eurasian Plate during the Late Cretaceous period [14,15] gave rise to the formation of the Tibetan Plateau, a relatively youthful landmass. This tectonic event had a profound impact on the pre-existing suture zones within the plateau, resulting in the development of a series of expansive and highly active fault zones [16]. One prominent fault zone is the Altyn Tagh–Haiyuan fault zone, which serves as the northern boundary of the plateau. The northeastern periphery of the plateau is delineated by the Cenozoic Qilian Shan thrust belt and the Qilian–Haiyuan fault system [17].
The Qilian–Haiyuan fault (QHF) is a significant sinistral strike-slip fault in the northeastern Tibetan Plateau. It, along with the Kunlun and Altyn Tagh faults, accommodates the northeastward extrusion of tectonic blocks resulting from the India–Eurasia collision [14,18,19]. The QHF is a left-lateral strike-slip fault zone with a total length of approximately 1000 km. It can be divided into segments from west to east, including the Halahu, Tuolaishan, Lenglongling, Jinqianghe, Laohushan–Maomaoshan, and Haiyuan faults [20,21]. The QHF had a history of intense seismic activity in the late Quaternary Period [19], with notable earthquakes occurring along this fault zone, such as the 1920 Haiyuan M 8.5, the 1927 Gulang M8, the 1986 Menyuan Ms 6.4, and the 2016 Menyuan Ms 6.4 [22,23,24,25,26,27] (Figure 1).
The Menyuan earthquake occurred in 2022 at the tectonic transition site of the western section of the Lenglongling fault (LLLF) within the QHF. This earthquake involved four faults: the LLLF and its west extension faults, namely, the Sunan–Qilian fault (SN-QLF), the North Tuolaishan fault (NTLSF), and the Tuolaishan fault (TLSF). As the LLLF continues to extend westward, it transforms into three late Quaternary active faults with different strike and movement properties [12] (Figure 2). The TLSF located in the south is primarily a left-lateral strike-slip fault and serves as the main active fault of the LLLF, as it extends westward. They form a release double-bend structure within the main strike-slip fault zone. On the north side is the SN-QLF, which is mainly a compressional thrust fault. In the middle, the NTLSF represents the westward extension of the LLLF. Its nature gradually changes into a compressional and thrust fault fold belt. Both the SN-QLF and the NTLSF are branch faults of the LLLF, extending along the shear direction when the strike of the LLLF deflects.
To facilitate the analysis and discussion of the tectonic characteristics of this earthquake, including the spread of the seismic surface rupture and its extension, the essential characteristics of the four active faults are as follows:
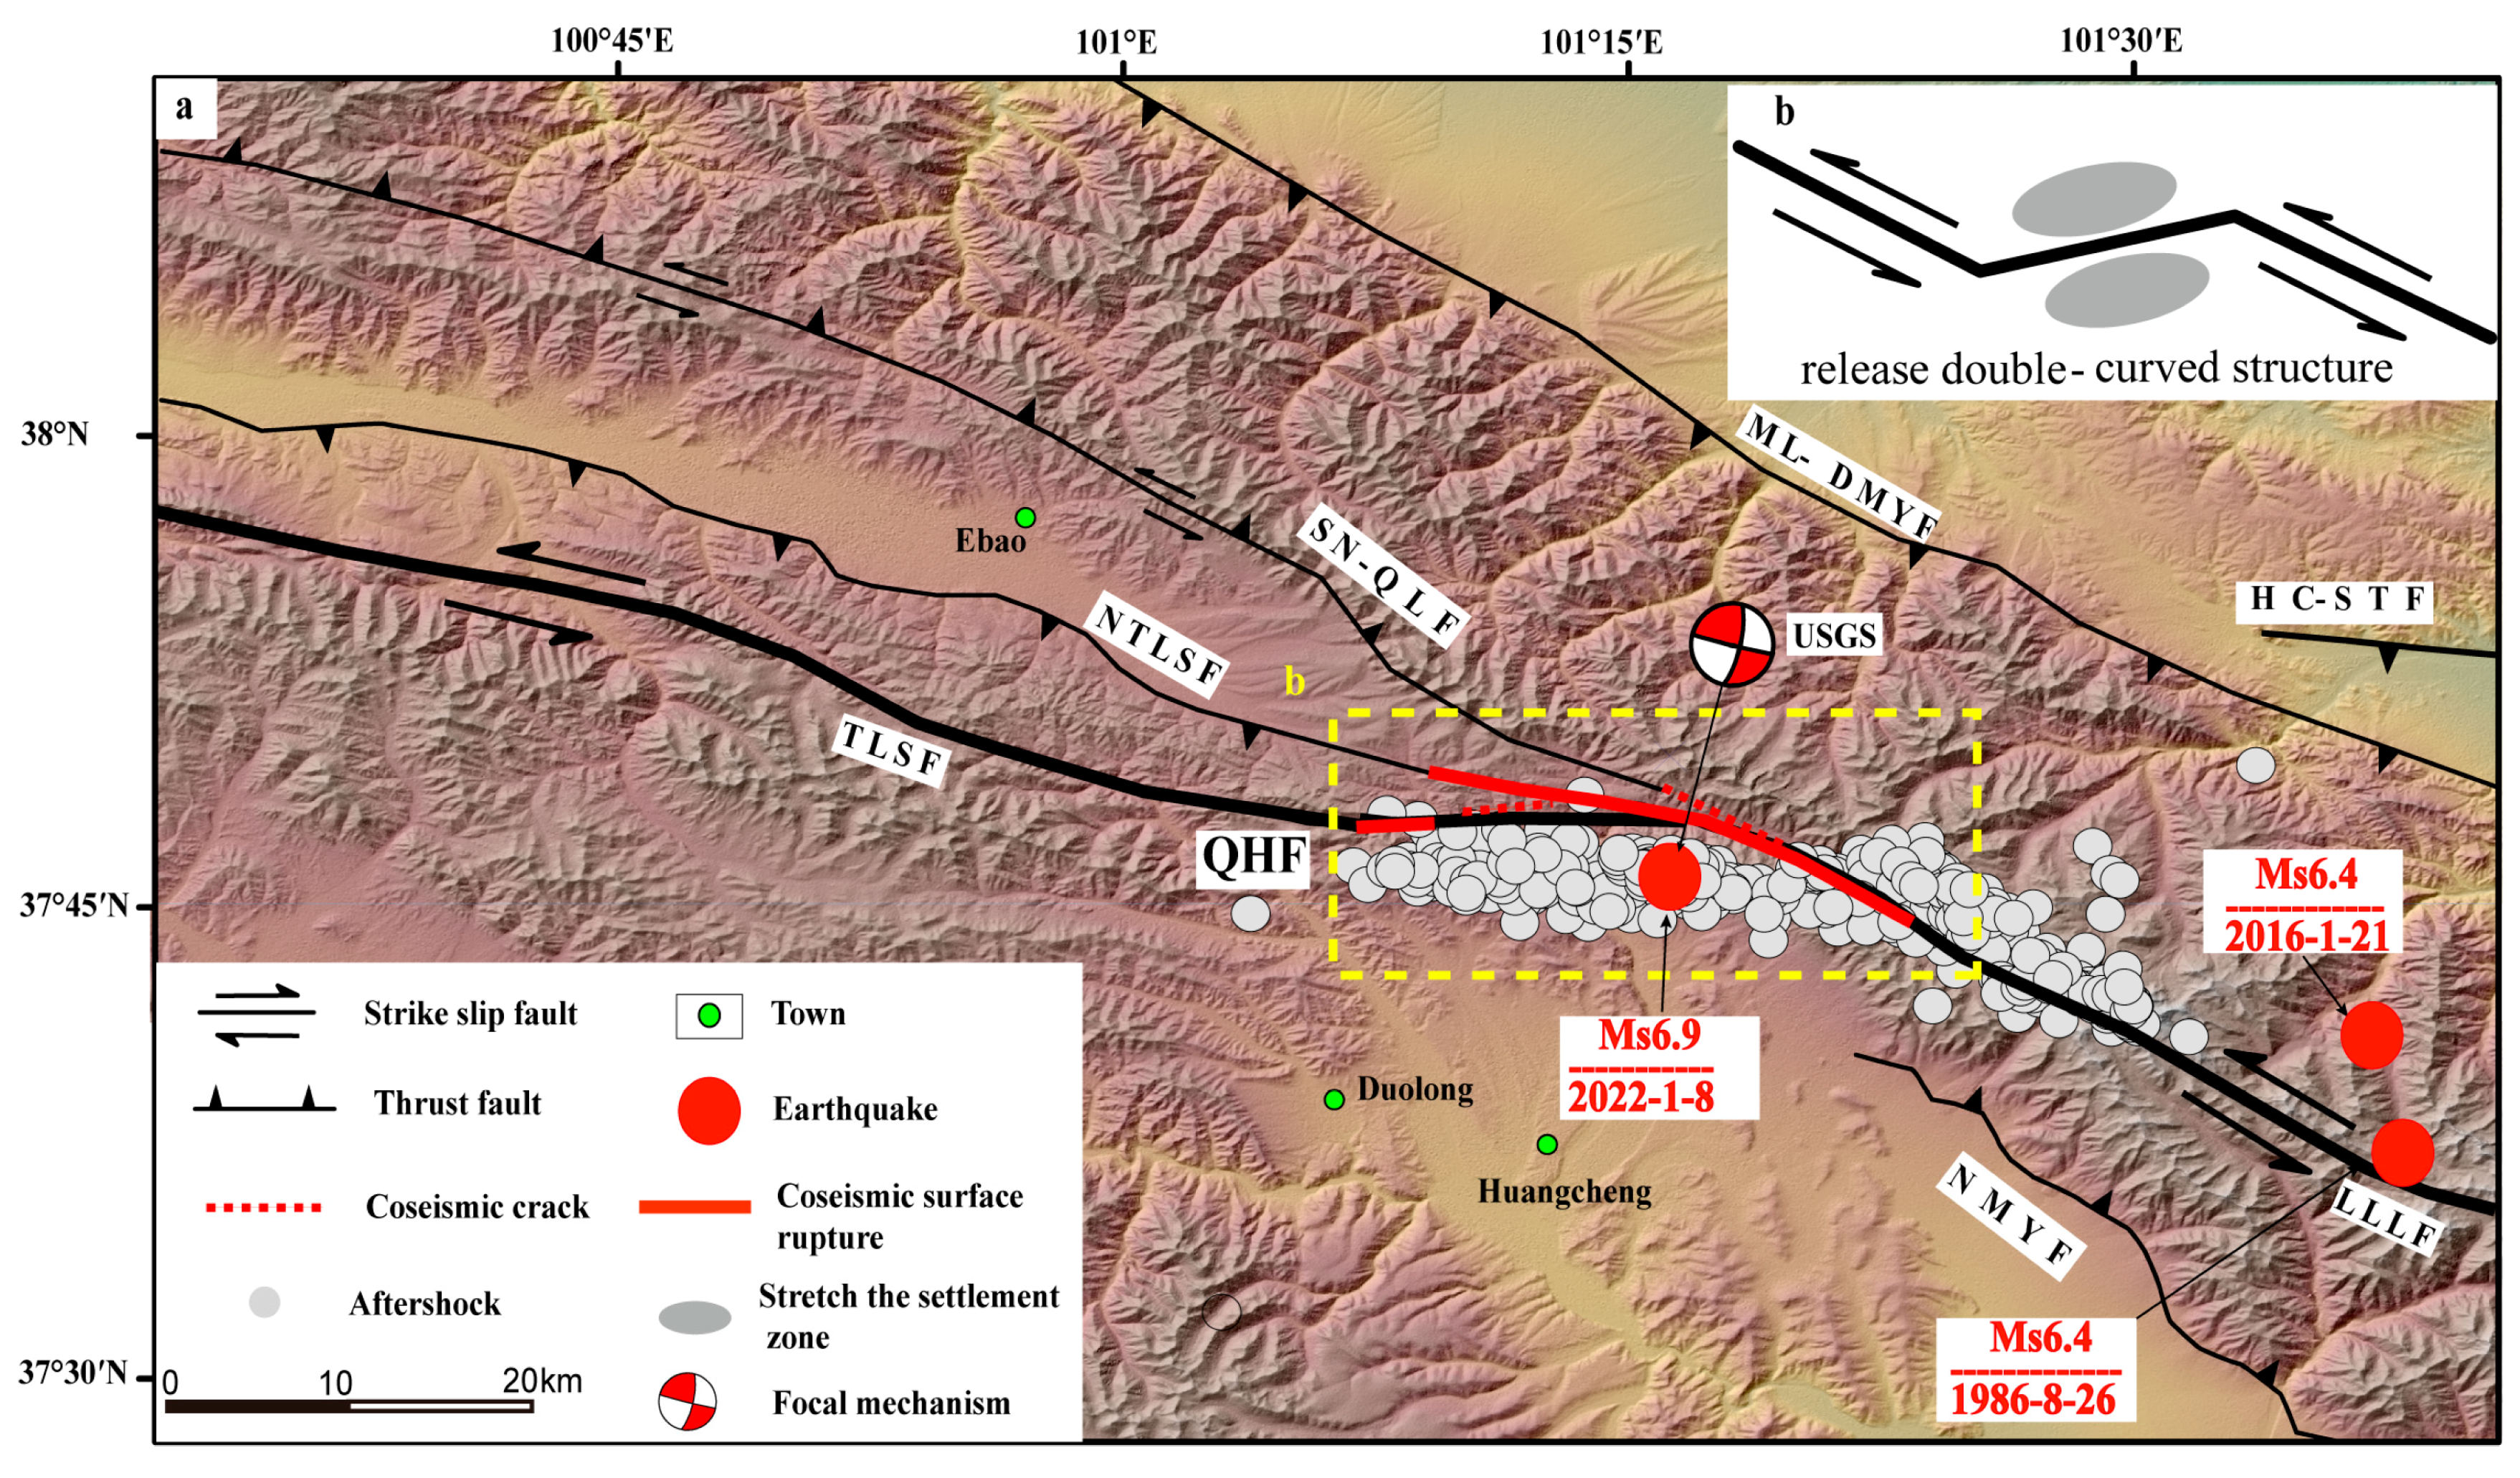
  • The Lenglongling fault (LLLF) stretches from the Shuanglong Coal Mine in Haxi Town, Tianzhu County, to Daliang, covering a distance of approximately 120 km. The LLLF is an active left-lateral strike-slip fault that has been active during the Holocene period. It exhibits a distinct fault landscape with a horizontal slip rate of 4.4 to 6.4 mm/yr [20,29,30]. Historical seismic events have been recorded along the fault and its vicinity, including the M 7.2 earthquakes in 1540 [31], the 1986 Menyuan Ms 6.4 earthquakes [22], and the 2016 Menyuan Ms 6.4 earthquake [32,33,34,35]. Guo et al. [26] suggest that this fault is one of the main seismogenic faults responsible for the 1927 Gulang M8 earthquake.
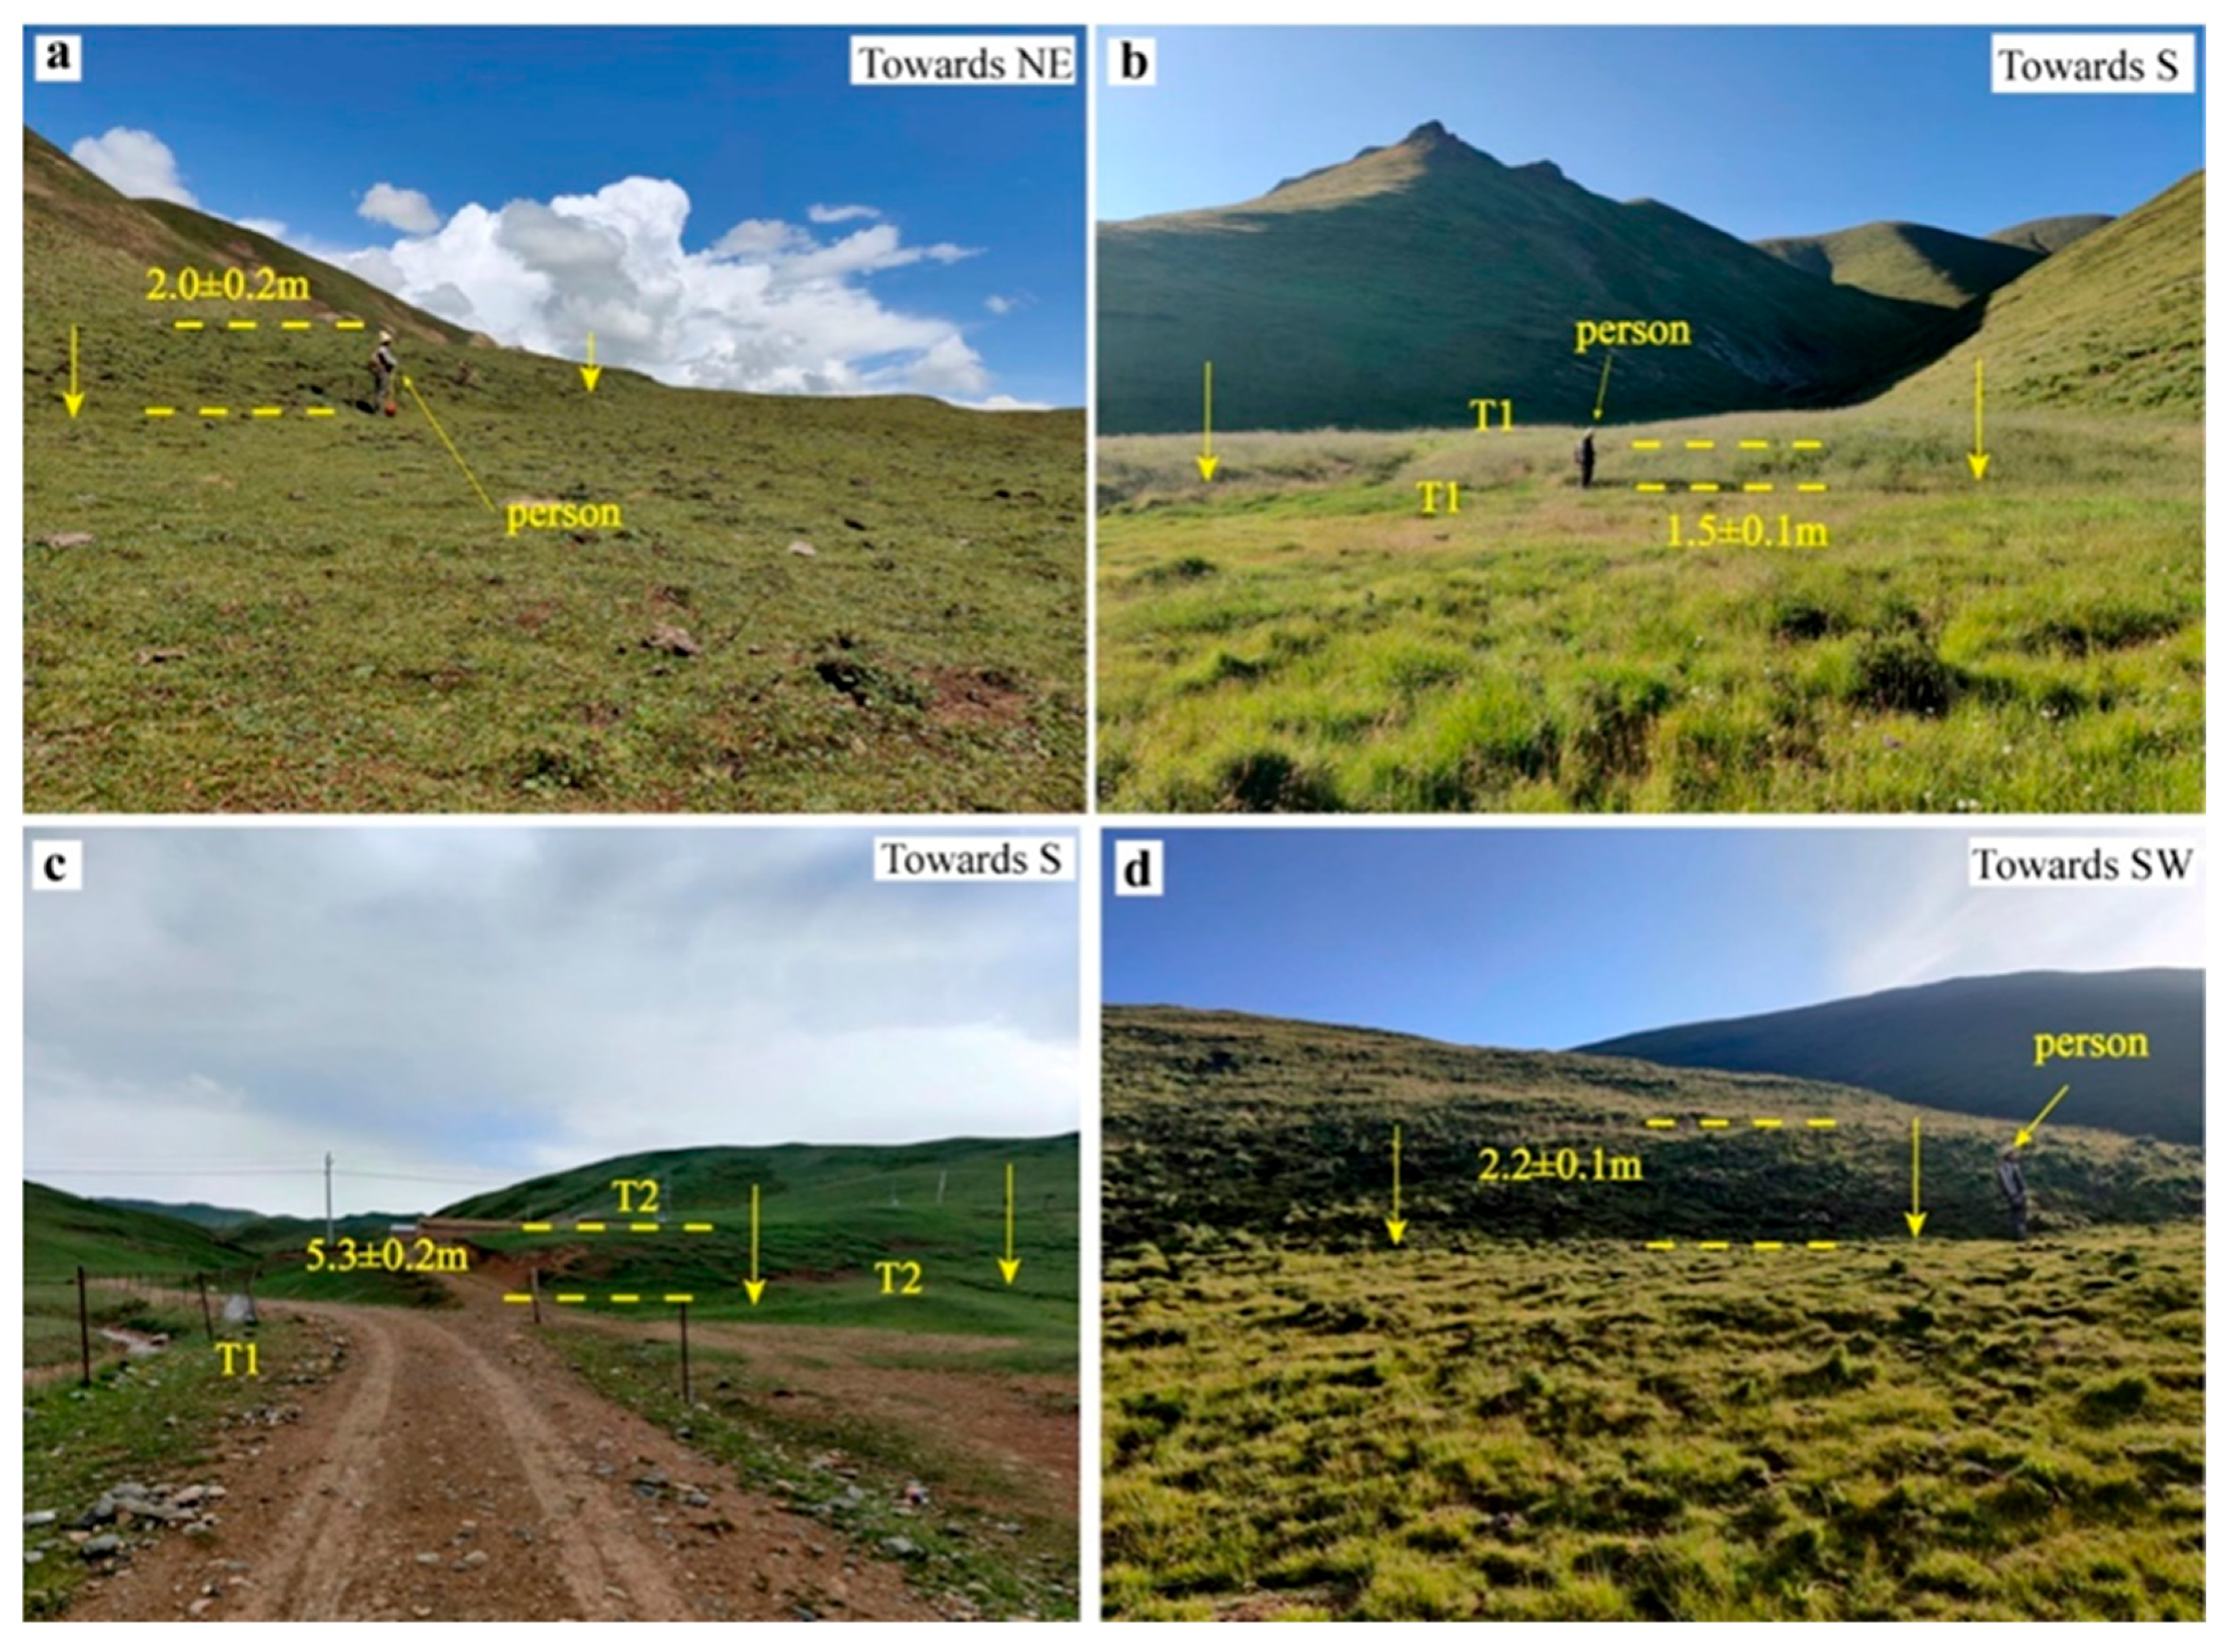
  • The Tuolaishan fault (TLSF) is a fault that intersects diagonally with the LLLF at the big bend of Liuhuanggou. It extends westward through Daogou, Daquanwo, Daxigou, and Cairituhe and terminates at Binggou in Qilian County, Qinghai Province. The TLSF has an overall direction of 290–300°, trending southwest, with an inclination angle of 40–60° and a total length exceeding 100 km. The fault exhibits vigorous activity and is characterized by prominent topographic features. Prominent fault scarps, measuring approximately 1–2 m in height, can be observed in Cairituhe (Figure 3a) and Xiuhelong (Figure 3b). The TLSF represents the primary left-lateral strike-slip active fault zone that extends westward from the LLLF.
  • The North Tuolaishan Fault (NTLSF) can be divided into three sections. Hu et al. [36] determined a vertical uplift rate of 1.5 ± 0.1 mm/yr in the middle section based on the deformation of river terraces, although no data were reported for the east and west sections. Field investigations have revealed clear landforms along the fault in the west section (Babao River section) (Figure 3c), indicating predominantly reverse and reverse fault-folding characteristics. The fault has an overall direction of approximately 310°, trending southwest, and spans over 280 km. The NTLSF constitutes a branch thrust fault zone that extends along the left-lateral shear sliding direction at the western end of the LLLF.
  • The Sunan–Qilian fault (SN-QLF) is located west of the Hongshuiba River, and the eastern section intersects with the LLLF on the northern side of Liuhuanggou. It spans approximately 360 km, with an overall direction of 320° and an inclination angle of 55–60° toward the southwest. In a study by Liu et al. [37,38], a new activity was only observed in the Baiquanmen–Dachamuchang area in the Sunan section. Our investigation focused on the Ebao section, which is the eastern segment of the fault. We observed clear evidence of faulting in the landscape, with a series of fault scarps visible on gully terraces. For instance, a fault scarp measuring approximately 1–3 m height was observed north of Qilian Airport (Figure 3d). This fault also forms part of a branch thrust fault zone that extends along the left-lateral shear sliding direction at the western end of the LLLF.

3. Data and Methods

3.1. Data Acquisition and Process

In recent times, unmanned aerial vehicles (UAVs) have gained widespread use, and the technology known as Structure from Motion (SfM), which relies on drone platforms, has also witnessed significant advancements and practical implementations [38,39,40,41]. Aerial photogrammetry SfM technology relies on the scale-invariant feature transform algorithm to acquire images with adequate overlap from various perspectives and subsequently perform automatic feature matching [41]. Through-beam adjustment correction is then applied to identify the X, Y, and Z coordinates of each feature point in the image, as well as determine the 3D position and orientation of the camera. The search and matching process between images is based on the principle of multi-angle stereo photogrammetry, resulting in the generation of dense point cloud data [42,43]. To ensure accurate geographic coordinates, dynamic post-differential technology is utilized to link the real-time positioning information of the camera with the ground GPS base station. This enables coordinate correction and spatial interpolation for the dense point cloud, ultimately yielding a point cloud with precise geographic coordinates. Additionally, a Digital Elevation Model (DEM) is generated, which is a type of digital terrain model that uses numerical values to simulate the ground terrain based on limited elevation data. [44,45]
The aerial data were collected using the CW-15 fixed-wing unmanned aerial vehicle (Figure 4), manufactured by Chengdu Zongheng, equipped with a fixed-focus digital camera. The data collection period spanned from 10 to 12 January 2022. Depending on the terrain, the aerial survey altitude ranged from 200 to 350 m, with the images having a heading overlap rate of 80% and a lateral overlap rate of 70%. To enhance the accuracy of the absolute position of the aerial photos, the UAV Pos attitude data were calibrated by establishing RTK ground base stations and collecting Cors station data. The aerial photogrammetry range was primarily determined based on the site survey of the Menyuan earthquake, conducted from 8 to 10 January 2022. The Agisoft Photoscan professional software was utilized to process the aerial survey data, enabling the registration of aerial images and the generation of Digital Elevation Models (DEMs) and digital orthophoto maps (DOMs: DOMs are images obtained via the vertical parallel projection of a surface and ensure the geometric accuracy of a map and the visual characteristics of an image.) with a resolution of approximately 0.07 to 0.1 m.

3.2. Geomorphic Mapping and Offset Measurements

We conducted a scientific investigation to examine the geomorphological and micro-topographical characteristics of ground deformation characterized by left-lateral displacement. Our analysis utilized digital orthophoto maps (DOMs) to identify mole tunnels, cracks, and other associated features. Additionally, a shaded relief map with a 45° angle of illumination was employed to enhance our understanding of the geomorphology. To ensure the accuracy of computer-based mapping, comprehensive field surveys were conducted between June and July 2022. During these surveys, we meticulously traversed the surface rupture zones, particularly in areas with complex geometries. Moreover, we verified the endpoints of the ruptures in both the east and west directions. In certain locations, supplementary measurements were obtained at low altitudes using drones, achieving resolutions as fine as 1 cm.
Coseismic offsets were measured using two methods. Firstly, we identified and measured offsets on the topographic map (Digital Elevation Model—DEM). Horizontal offsets were analyzed based on our mapping of fault traces and displaced geomorphic features such as fences, footprints, ruts, ice, and snow. However, we did not target the vertical component given the significant topographic relief in the study area, as the apparent vertical measurement does not represent an actual vertical offset. Secondly, we measured offsets during detailed field investigations focusing on surface rupture mapping. We visited all mapped offset features along the fault lines on-site to validate our computer-based measurements.
Combining of the on-site Menyuan earthquake coseismic offset measurement with image analysis allowed for the identification of subtle field features. A comparison of the results obtained from these two methods revealed their respective advantages and disadvantages. UAV images proved effective in identifying offsets related to terrain, although their resolution of 0.08–0.1 m limited the detection of offsets smaller than 0.2 m. Additionally, unclear surfaces sometimes led to incorrect identification. In the field, poor visibility and geomorphic features in highlands posed challenges in identifying large offsets. Two factors contributed to these discrepancies. Firstly, the resolution of the UAV images prevented the identification of features with slight offsets below the resolution, whereas on-site observations were not affected by this limitation. Secondly, computer-based measurements could include far-field deformations, whereas field measurements were typically confined to a narrow near-field deformation. By employing both methods, we enhanced the reliability of our coseismic displacement measurements for the Menyuan earthquake.

4. Details and Geometry of the Surface Rupture of the Menyuan Earthquake

In order to characterize the complexity of the Menyuan earthquake surface rupture, we identified two distinct types: (1) the main surface rupture zone, which consists of a series of cracks aligned with the main strike-slip fault and exhibits the highest displacement along the fault; (2) the secondary rupture zone, comprising cracks occurring outside the main fault and having a different strike orientation. These secondary ruptures display characteristics such as short, discontinuous surface ruptures, with lengths reaching up to tens of meters. Our mapping analysis reveals that the coseismic surface rupture can be divided into two main sections: the south and north (see Figure 5a). These sections are located within a sinistral terrace area, with a stepping zone separating them. If we strictly define the rupture zone based on surface displacement, the distance between the two rupture zones exceeds 3 km. However, previous statistical studies [46,47] suggest that it would be more appropriate to consider dense seismic crack zones to be a distinct form of surface rupture if the distance between fault segments is only 1 km. For convenience, we further divided the north section into two subsections based on their geometric characteristics. The details and lengths of these subsections are as follows: the S1 main rupture spans approximately 14 km (Figure 5a); the S2 main rupture extends for about 7.5 km (Figure 5a); the S3 main rupture covers approximately 3.8 km (Figure 5a), with an associated crack zone of about 4.7 km; and the S4 secondary rupture measures approximately 6.6 km (Figure 5a).

4.1. Section 1 (S1)

We investigated extensively by integrating two field surveys and analyzing high-resolution aerial imagery from unmanned aerial vehicles (UAVs). The imagery allowed us to map the surface rupture of S1 accurately. The key originates from Aobaogou; passes through Keshugou, Liuhuanggou Bridge, Honggou; and terminates at the big bend of Liuhuanggou, with an overall trend of approximately 300° (Figure 5b). We observed that S1 develops along the slopes on both sides of Liuhuanggou. The width of the surface rupture zone in this section varies from tens of meters to over two hundred meters, which can be attributed to the fact that the rupture primarily occurs on the slope of Liuhuanggou and is significantly influenced by the topography.
At the eastern end of the surface rupture zone, it tapers off in Aobaogou. No cracks were observed in the area further east during our field investigation and imaging. Moving westward from Aobaogou, the rupture zone manifests as an en-echelon crack (Figure 6a), with a crack width ranging from approximately 10 to 30 cm. As we continue westward along the rupture zone, it shifts from the north slope to the south slope of Liuhuanggou on the eastern side of Keshugou. In an alluvial fan located south of Keshugou, the surface rupture zone exhibits a series of mole tracks interspersed with tensile shear cracks (Figure 6b). Given the influence of the terrain, the mole tracks are predominantly found in lower positions, with a series of cracks above them. Within this area, we discovered a left-lateral offset animal footprint (Figure 6c) with an offset of 0.98 ± 0.03 cm. To the west, the rupture zone intersects with the Liuhuanggou high-speed rail tunnel, severely damaging the tunnel and bridge. On the western hillside, a series of tensile cracks formed, and some of these cracks have been eroded by rainwater, creating bottomless pits of approximately 2 m in depth (Figure 6d).

4.2. Section 2 (S2)

S2 extends from the big bend of Liuhuanggou to the west branch of the Xiadaquangou, passing through Daogou and Shangdaquangou. It has a general strike of 285° (Figure 5c). S2 exhibited the highest abundance and concentration of surface deformations during the earthquake.
The most complex surface deformation occurs on the west side of the Liuhuanggou bend. At this location, the surface features show two directions: one aligns with the main rupture zone, the other deviates at a 30° angle from the main rupture zone (Figure 7a). Both directions exhibit tensile shear cracks and mole tracks, with a better distribution of tensile cracks on the south side. A maximum offset of 2.6 ± 0.3 m was observed 1.5 km west of the big bend of Liuhuanggou. Moving eastward, the direction of the rupture zone changes from 100° clockwise to 120°.
Approximately 0.7 km east of Daogou, a group of sinistral left-terrace areas consisting of mole tracks and tensile cracks were observed (Figure 7b). On the access road of Daogou, distinct ruts were found, exhibiting a vertical offset of 0.4 ± 0.02 m and a horizontal offset of 1.1 ± 0.04 m (Figure 7c). The main rupture crosses the river channel, forming a sinistral strike-slip terrace area on the mountain to the west. Mole tracks and extensional shear cracks characterize this area. A dislocated ice surface with a displacement of 0.8 ± 0.04 m was observed in the gully west of the terrace (Figure 7d). In Shangdaquangou, mole tracks of various sizes were identified (Figure 7e), and a series of shear cracks between them. A staggered ice surface of approximately 0.9 ± 0.06 m was observed in the river channel west of Shangdaquangou (Figure 7f). The main rupture terminates approximately 1.6 km to the west, and no farther surface crack was observed in the field survey or UAV images.

4.3. Section 3 (S3)

S3 is a fault that extends from the head of Daxigou, passes through Shizikou, and terminates at Daogou (Figure 5d). The characteristics of S3 differ on the east and west sides of Yangchangzigou. On the west side, there is a continuous surface rupture; on the east side, there are cracks of varying lengths.
Using UAV images and field surveys, we observed several typical features of a left-lateral strike-slip fault on the main rupture of S3. These features include en-echelon cracks, tension cracks, and mole tracks. The most complex section of the fault is located 0.4 km west of Yangchangzigou. This section primarily comprises a series of cracks with different orientations and near east–west mole tracks (Figure 8a). These cracks exhibit left-handed offsets, with left-lateral displacements ranging from a few to tens of centimeters.
A sinistral left-terrace area was identified at a distance of 1.5 km west of Yangchangzigou. This area is characterized by tensile cracks and mole tracks, with crack widths ranging from a few centimeters to more than ten centimeters (Figure 8c). On the eastern side of the fence, a left-handed offset of 0.49 ± 0.06 m was measured (Figure 8b). In the eastern part of Yangchangzigou, only a displacement of approximately 15 cm was observed on the sidewalk south of the Xiadaquangou valley.
On the remaining eastern side of Yangchangzigou, cracks were sporadically distributed with varying sizes and lengths. These cracks can be roughly divided into three groups based on their strikes: 0°, 50°, and 120°. Most cracks did not exhibit visible vertical offsets (Figure 8d), although some showed vertical offsets ranging from a few centimeters to more than ten centimeters (Figure 8e).

4.4. Section 4 (S4)

S4 is a secondary rupture zone consisting of cracks identified during the investigation of the alluvial fan located south of Keshugou. A surface crack was observed when we crossed the river channel, exhibiting a relatively short extension distance and a scarp height of approximately 0.31 ± 0.03 m (Figure 9a). An analysis of the UAV images revealed that this coseismic rupture was part of a larger secondary rupture zone, characterized by a lack of continuity and primarily composed of nearly northwest-oriented cracks (Figure 5a). S4 intersects with the main rupture zone east of Keshugou, gradually splitting into two segments along the Liuhuanggou River channel to the west, and ultimately terminates after passing through the Liuhuanggou Bridge, extending approximately 1.5 km westward. The overall orientation of S4 is 154°, with a length of approximately 7 km. Notably, the width of the fault zone varies along its length, being narrow in the east, spanning only a few tens of meters and widening up to 300 m in the west.
Although coseismic horizontal offsets were not observed in the UAV images within this section, several coseismic vertical offsets were identified during field investigations. Only two coseismic horizontal offsets were detected, while numerous vertical offsets were observed, with a maximum horizontal displacement of 0.2 ± 0.02 m (Figure 9b). Toward the east of Liuhuanggou Bridge, the secondary rupture zone bifurcates into two sets of cracks, extending westward along the northern and southern sides of the Liuhuanggou River channel. No coseismic offsets were observed in the southern cracks (Figure 9d), whereas vertical offsets were identified in the northern cracks, exhibiting an offset of 0.13 ± 0.02 m (Figure 9c).

5. Summary of the Surface Coseismic Offset

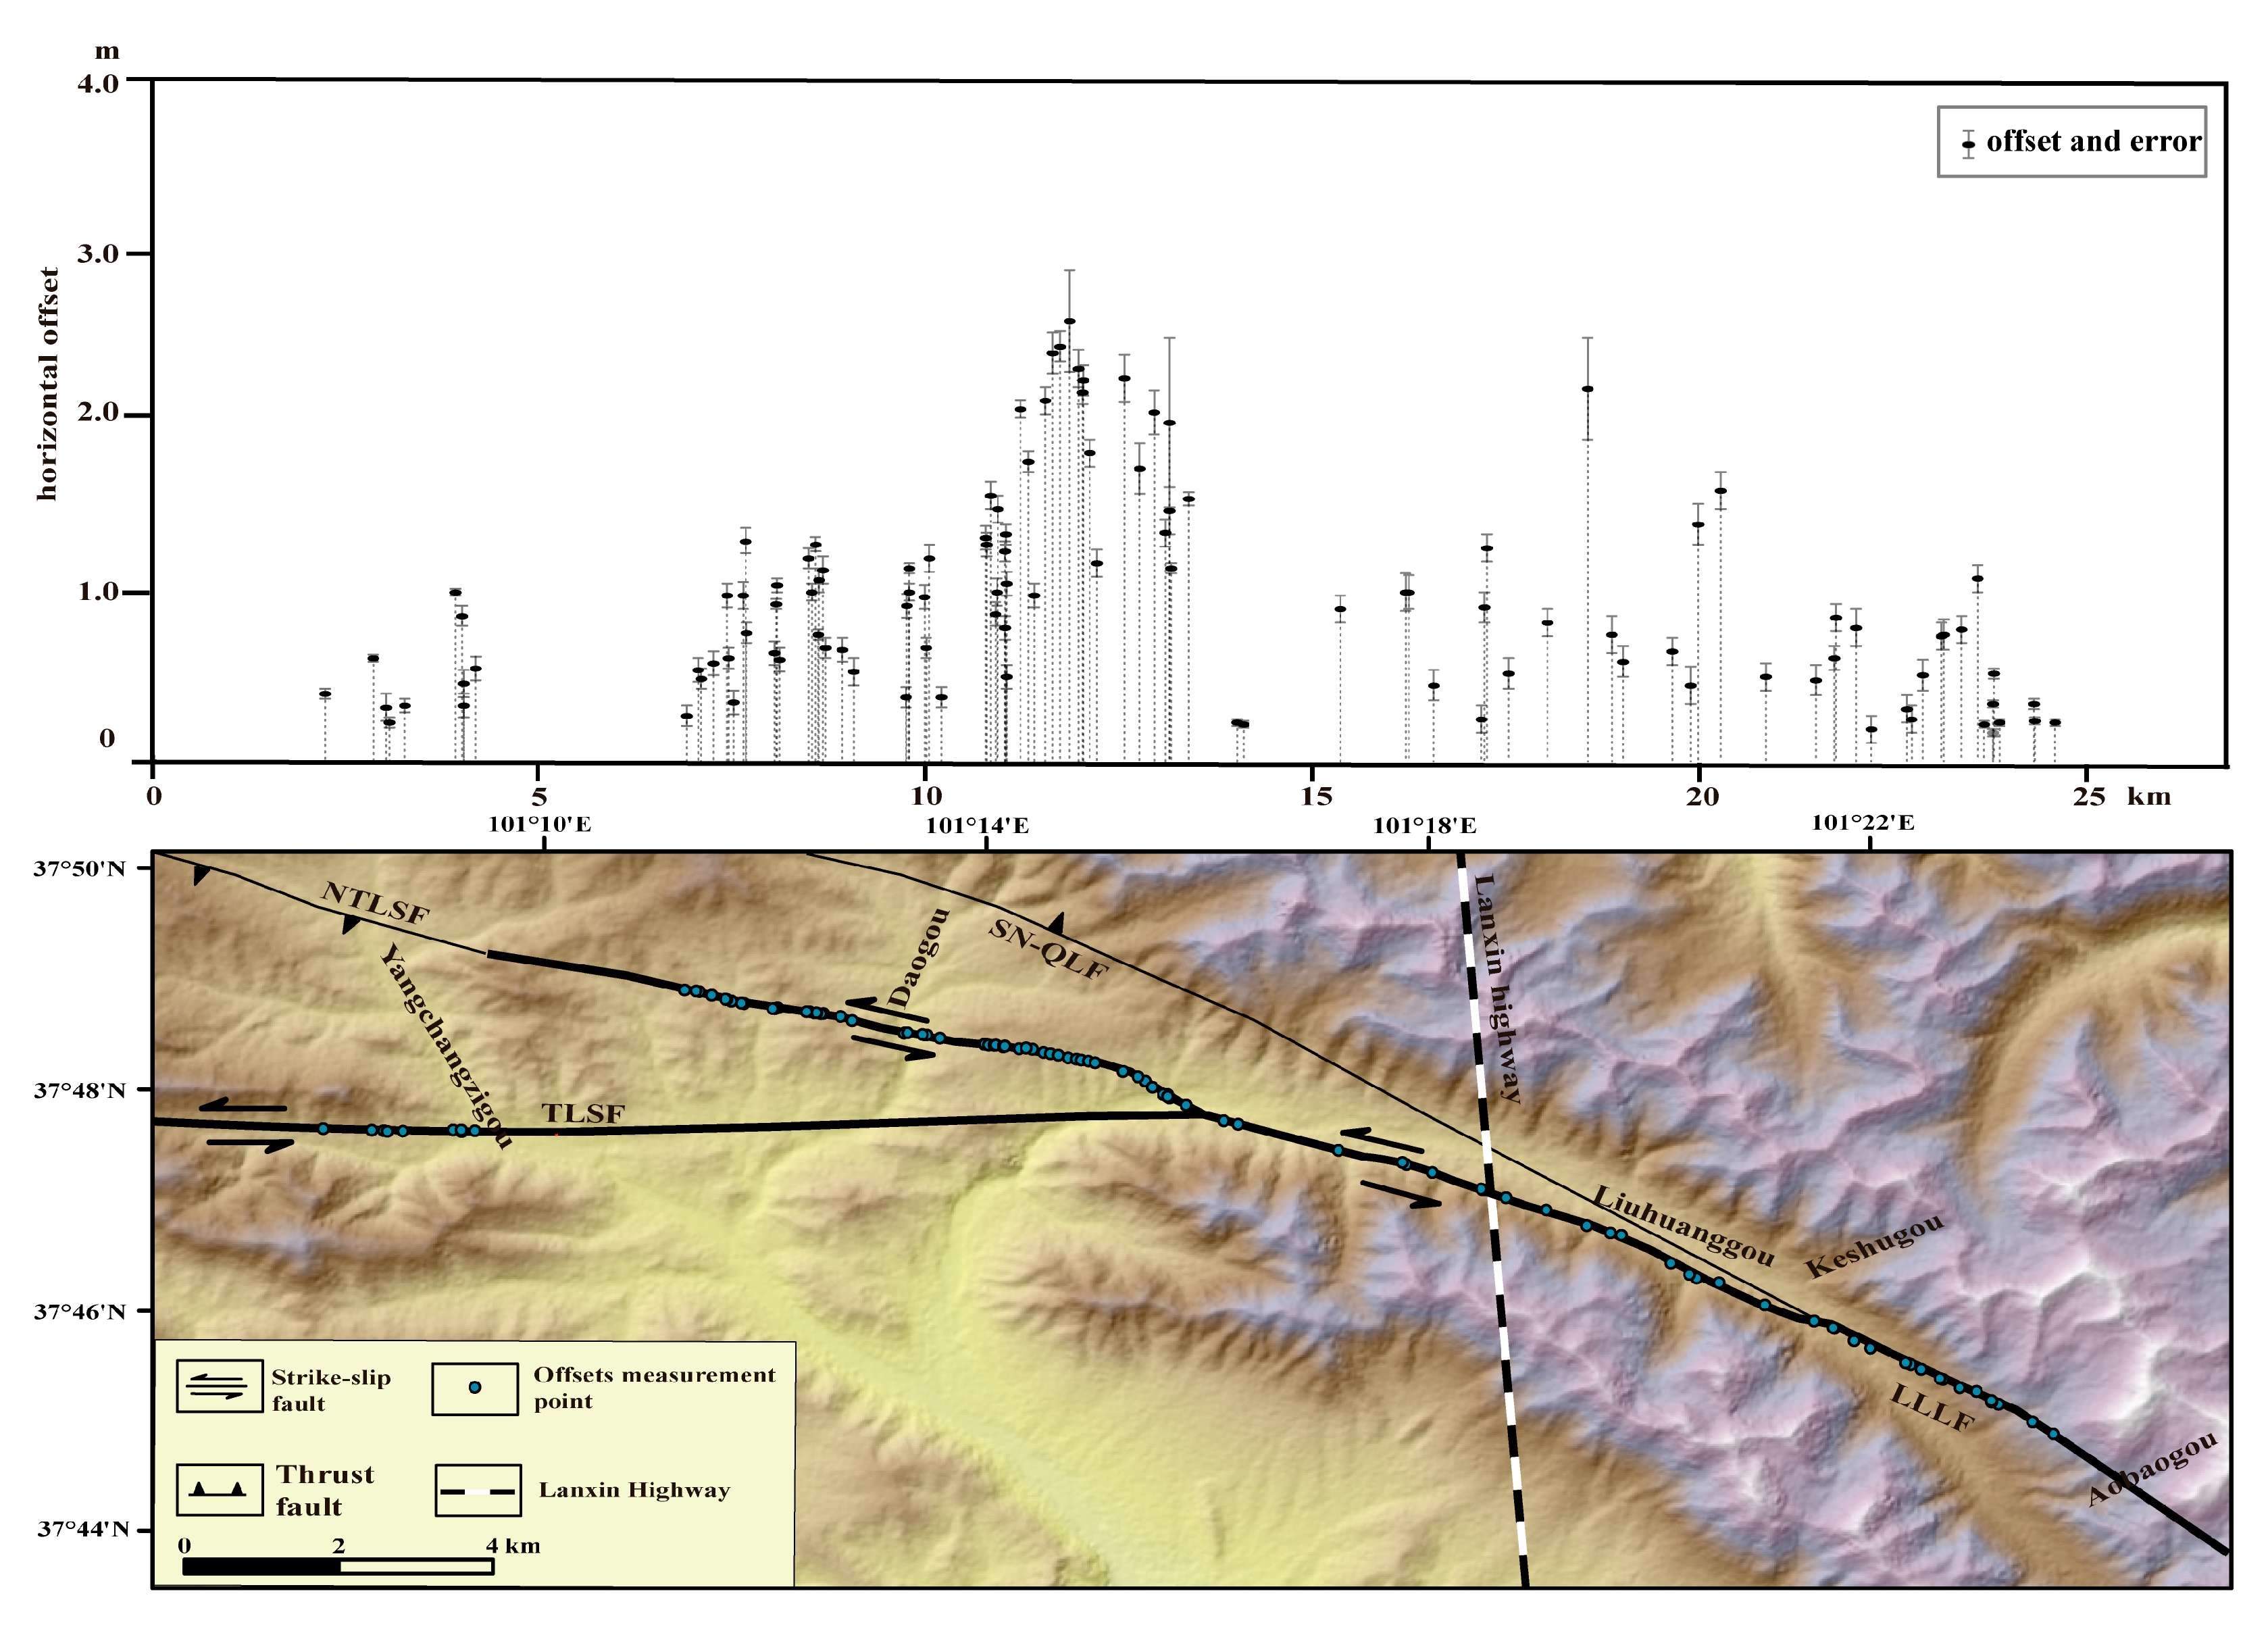
5.1. Coseismic Horizontal Offset Distribution

This study examined the distribution of surface slips resulting from the 2022 Menyuan earthquake. To achieve this, we collected 111 horizontal offsets along or in close to the fault line (see Figure 10, detailed data see Appendix A). The occurrence of the earthquake during the winter season facilitated the observation of surface ruptures that displaced the accumulated snow in the vicinity of high-altitude mountains. This snow cover presented a valuable opportunity to analyze the distribution of surface displacement caused by the earthquake. Furthermore, the presence of fences established by herders in the pastures proved to be advantageous in studying the distribution of surface displacement.
In the northern branch of the coseismic surface rupture zone, the offsets ranged from 0.1 to 2.6 m for the Menyuan Ms6.9 earthquake. The distribution of offsets exhibited a double peak pattern, gradually decreasing from each peak toward both sides. The first peak was observed at 2.6 ± 0.3 m, while the second was at 2.2 ± 0.3 m. The maximum horizontal offset of 2.6 ± 0.3 m was recorded at a fence 1.45 km east of the big bend of Liuhuanggou. On the east side of the Lanxin high-speed rail tunnel, the second peak of the surface rupture was observed at 2.2 ± 0.3 m. Unfortunately, no similar surface displacement was found on the east or west sides of the tunnel.
In the southern branch of the coseismic surface rupture zone, the offset distribution showed a single peak, gradually decreasing from the peak toward both sides. A maximum offset of 1 ± 0.1 m was observed at the gully’s edge, and two approximate offsets were observed east. In S1, a total of 40 horizontal offsets were collected, which were consistent with the fault properties. The markers used for measurement were mainly staggered snow boundaries and footprints caused by the distribution of ruptures on the slopes on both sides of Liuhuanggou. The maximum offset recorded was 2.2 ± 0.3 m. In S2, 61 horizontal offsets were collected, consistent with the fault properties, with a maximum offset of 2.6 ± 0.3 m. In S3, 10 horizontal offsets were collected, consistent with the fault properties, with a maximum offset of 1.0 m and a minimum offset of 0.23 m. In S4, only two horizontal offsets were obtained, with a maximum offset of 0.2 ± 0.02 m.

5.2. Discussion of Maximum Displacement

Previous studies have reported varying data on the maximum offset of the Menyuan earthquake, with significant differences in values. This study determined the maximum offset between Liuhuanggou and Daogou, as shown in Figure 11a. We obtained similar offsets on both sides of fences from ①, ②, ④, and ⑤; they are 2.41 ± 0.05 m, 2.45 ± 0.06 m, 2.32 ± 0.05 m, and 2.25 ± 0.03 m (Figure 11a). In order to verify the accuracy of our measurements, we executed an unmanned aerial vehicle (UAV) survey within the designated region, acquiring high-resolution images with a precision of 1 cm. These images were carefully examined and measured, resulting in a maximum offset of 2.6 ± 0.3 m (Figure 11b, fence ③). Figure 11c–e illustrates that the maximum offset is on a relatively steep slope with a wide rupture zone. The surrounding offset positions are relatively flat or have narrow ruptures.
Consequently, the offset value is relatively large and may be influenced by the topography. During the measurement, we observed that the marking fence to the south was not straight and exhibited noticeable bending deformation near the rupture, leading to a significantly larger displacement from a distance. Because of other barriers on both sides of the maximum offset barrier, offsets are expected to occur sequentially, akin to dominoes (Figure 11a). Although their values may differ because of terrain, they should not differ significantly.
Using the same methodology, we measured the offsets at the big bend of Liuhuanggou and the west side of Liuhuanggou Bridge, obtaining displacements of 2.0 ± 0.5 m and 2.2 ± 0.3 m, respectively. We compared and analyzed the displacements on both sides and found no similar approximate displacements. Researchers have analyzed small earthquake data using precise positioning technology to determine the characteristics of the LLLF plane. Wan et al. [48] a study found that the specific earthquake event had a slip angle of 47.17 ± 15.33°. Additionally, the maximum horizontal surface displacement was calculated to be 2.6 ± 0.3 m, resulting in an estimated maximum fault plane slip of approximately 3.8 m. Given that the highest displacement we measured occurred on a slope, it is possible that this value may be magnified because of the influence of the terrain. Consequently, the actual displacement value is lower than what was recorded. Simultaneously, Huang et al. [49] acquired a seismic slip measurement of 3.8 m at a depth of 4 km using InSAR technology. Similar findings were also obtained by Li [50] and Liu [51]. We contention that a maximum horizontal displacement of 2.6 m on the Earth’s surface is a plausible estimate. It is important to note that InSAR deformation encompasses diffusive deformation, and it is imperative to ascertain the quantity of displacements occurring within the fault zone.

6. Discussion on Seismogenic Mechanism

Field investigations conducted after the Menyuan earthquake show that the surface rupture consists of two main ruptures separated by a step and a secondary rupture zone. The participating faults are the TLSF and the LLLF, predominantly left-lateral strike-slip faults, and the SN-QLF, characterized by a thrust and left-lateral slip.
Statistical analyses were performed on the trend of the surface rupture. Figure 12 illustrates that the northern surface rupture deflects from 146° anticlockwise to 155° from Aobaogou toward the west. It then bifurcates into two branches east of Keshugou. One branch briefly extends along the direction of 154° before terminating. The other branch extends westward toward 156°, deflects counterclockwise to 161°, and then deflects again to 167°. East of the big bend of Liuhuanggou, the surface rupture changes direction from 167° clockwise to 154°, and after passing through Liuhuanggou, it turns counterclockwise to 168°. To understand the change in the trend of the surface rupture, a specific area within the rupture zone was selected for the statistical analysis of crack trends, resulting in a strike rose diagram (Figure 12a). The statistical findings reveal an acute angle between the dominant strike of the crack and the strike of the surface rupture. This angle causes the strike of the northern branch of the surface rupture to change from 146° in the east to 169° in the west and then to 177° in the southern surface rupture. However, an anomaly was observed near the big bend of Liuhuanggou, where the strike of the surface rupture zone abruptly changed from 167° to 154° and then deflected to 168°. The statistically dominant direction of the crack is nearly parallel to the strike of the surface rupture.
The research conducted by Sun et al. [52] on the structure of the Menyuan earthquake indicates that the fracture density of the north side of the LLLF is higher than that of the south side. Zhao et al. [53] suggest the LLLF is an important physical property difference zone that contrasts its two sides. A high-resistivity body obstructs the flow of low-resistivity soft materials on the south side beneath the Gulang Nappe, making the LLLF the core area where the northeast compressive expansion pressure of the Tibetan Plateau transforms into southeast migration and escape. Based on the research mentioned earlier, the northeast compression of the Tibetan Plateau triggered the Menyuan earthquake. Following the earthquake, the LLLF and TLSF experienced coseismic ruptures. As the LLLF propagated from west to east, it induced the rupture of the SN-QLF, located north, resulting in a secondary rupture, S4. The earthquake triggered simultaneous ruptures in the LLLF, the TLSF, and the SN-QLF. However, the SN-QLF did not exhibit a continuous surface rupture because of energy constraints. Similar to the 2010 Yushu Ms 7.1 earthquake [54], this seismic event did not generate a surface rupture zone at the epicenter location; only a few cracks were observed.
From a geometrical perspective (Figure 12b), the distribution of the four sections of the surface rupture zones is strictly aligned with the shear sliding directions of the LLLF and its branch faults. However, it is intriguing that the aftershocks of this earthquake did not align with the fault distribution in the transition section, except for the two ends coinciding with the LLLF and the TLSF, other aftershocks were located at the fault bend on the south side (see Figure 2). The distribution can be explained by the fact that the aftershocks primarily occurred along the south side of the release double bends, which are more prone to rupture and release energy. However, the double-release bend developed a dense seismic crack zone on the north side. Following the Menyuan earthquake, four earthquakes with a magnitude exceeding five occurred near Hala Lake (Figure 1). Sun et al. [52] conducted a study revealing that the deep rupture caused by the Menyuan earthquake and its subsequent aftershocks, confluent with the rupture of the 2016 Menyuan earthquake, impeded the accumulation of additional energy in the focal area within a short period. Li et al. [50] demonstrated that the stress on the TLSF was not fully released. Previous investigations identified two surface rupture zone of unknown age along the Halahu fault. Notably, the TLSF has not experienced a significant earthquake; consequently, we should pay attention to the future seismic risk associated with the TLSF, which is situated between the LLLF and Halahu fault and is part of the QHF system.

7. Conclusions

Based on the results of a field survey, an analysis of seismic activity data, and in consideration of the tectonic background, the following scientific conclusions can be drawn regarding the earthquake:
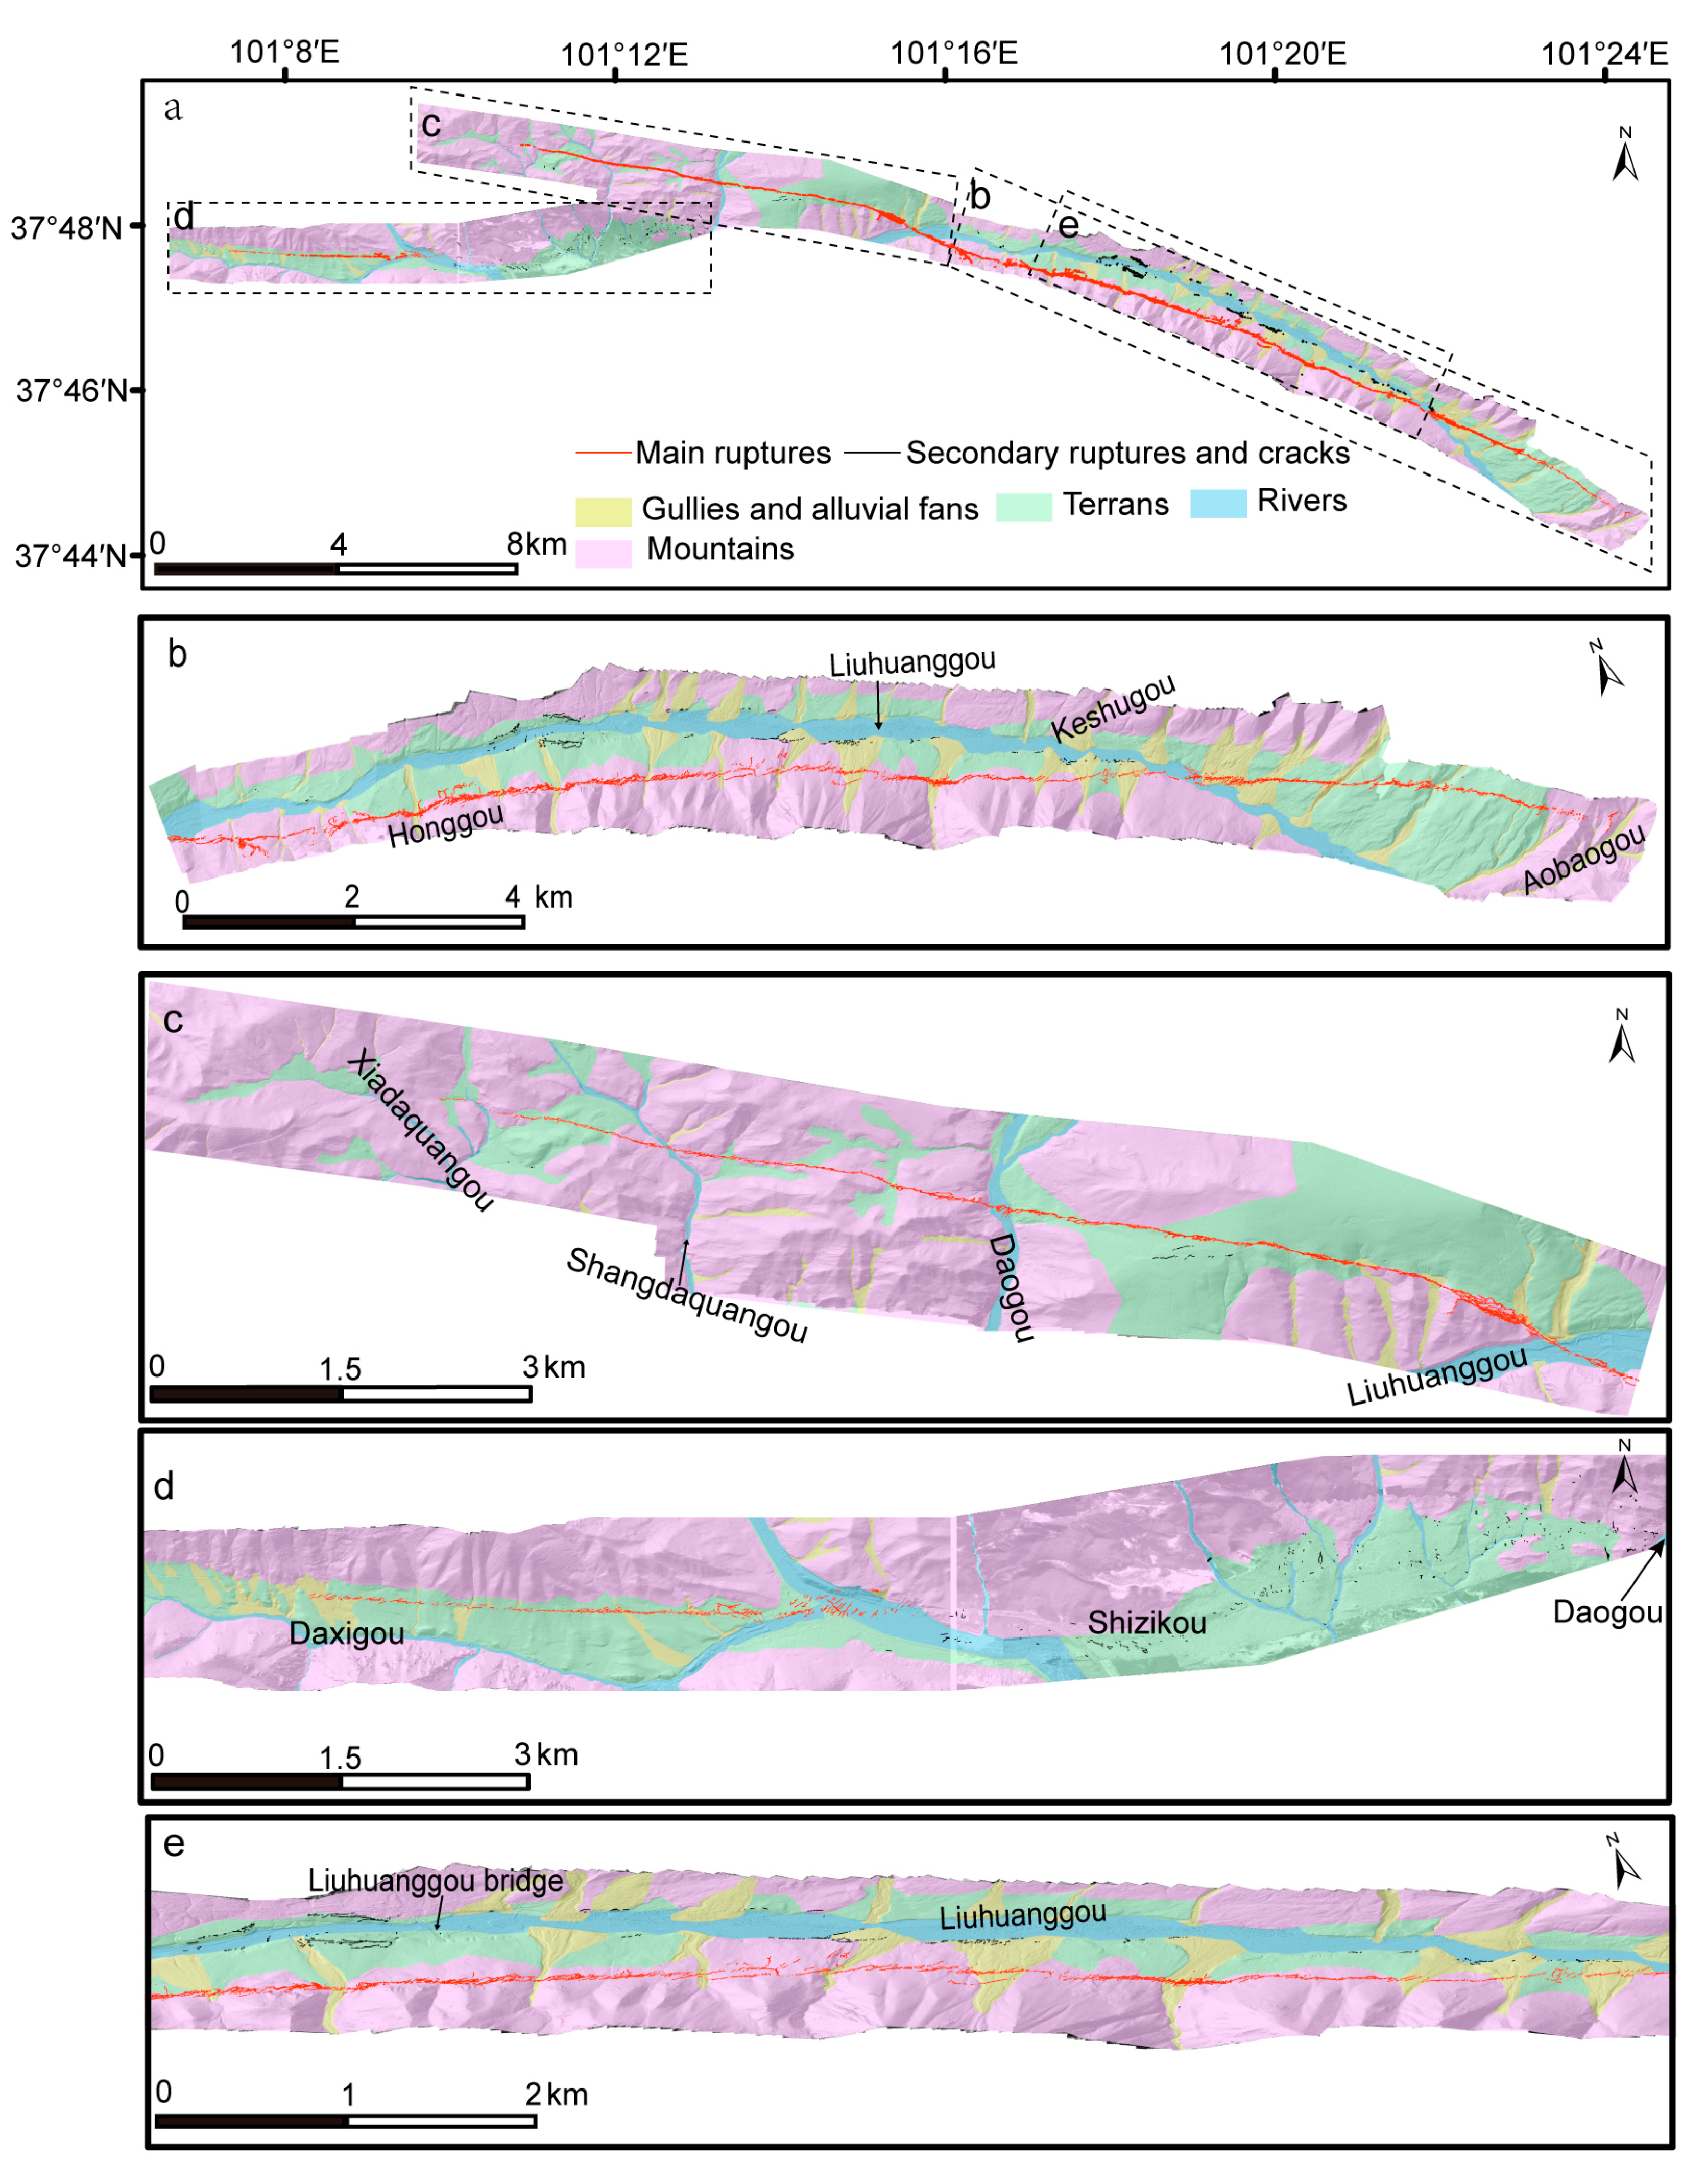
  • The earthquake occurred at the tectonic boundary between the LLLF and the TLSF in the central region of the QHF in the northern Tibet Plateau. It resulted in three surface ruptures with a combined length approximately 37 km. The primary movement observed was left-lateral sliding, with a maximum horizontal offset of 2.6 ± 0.3 m.
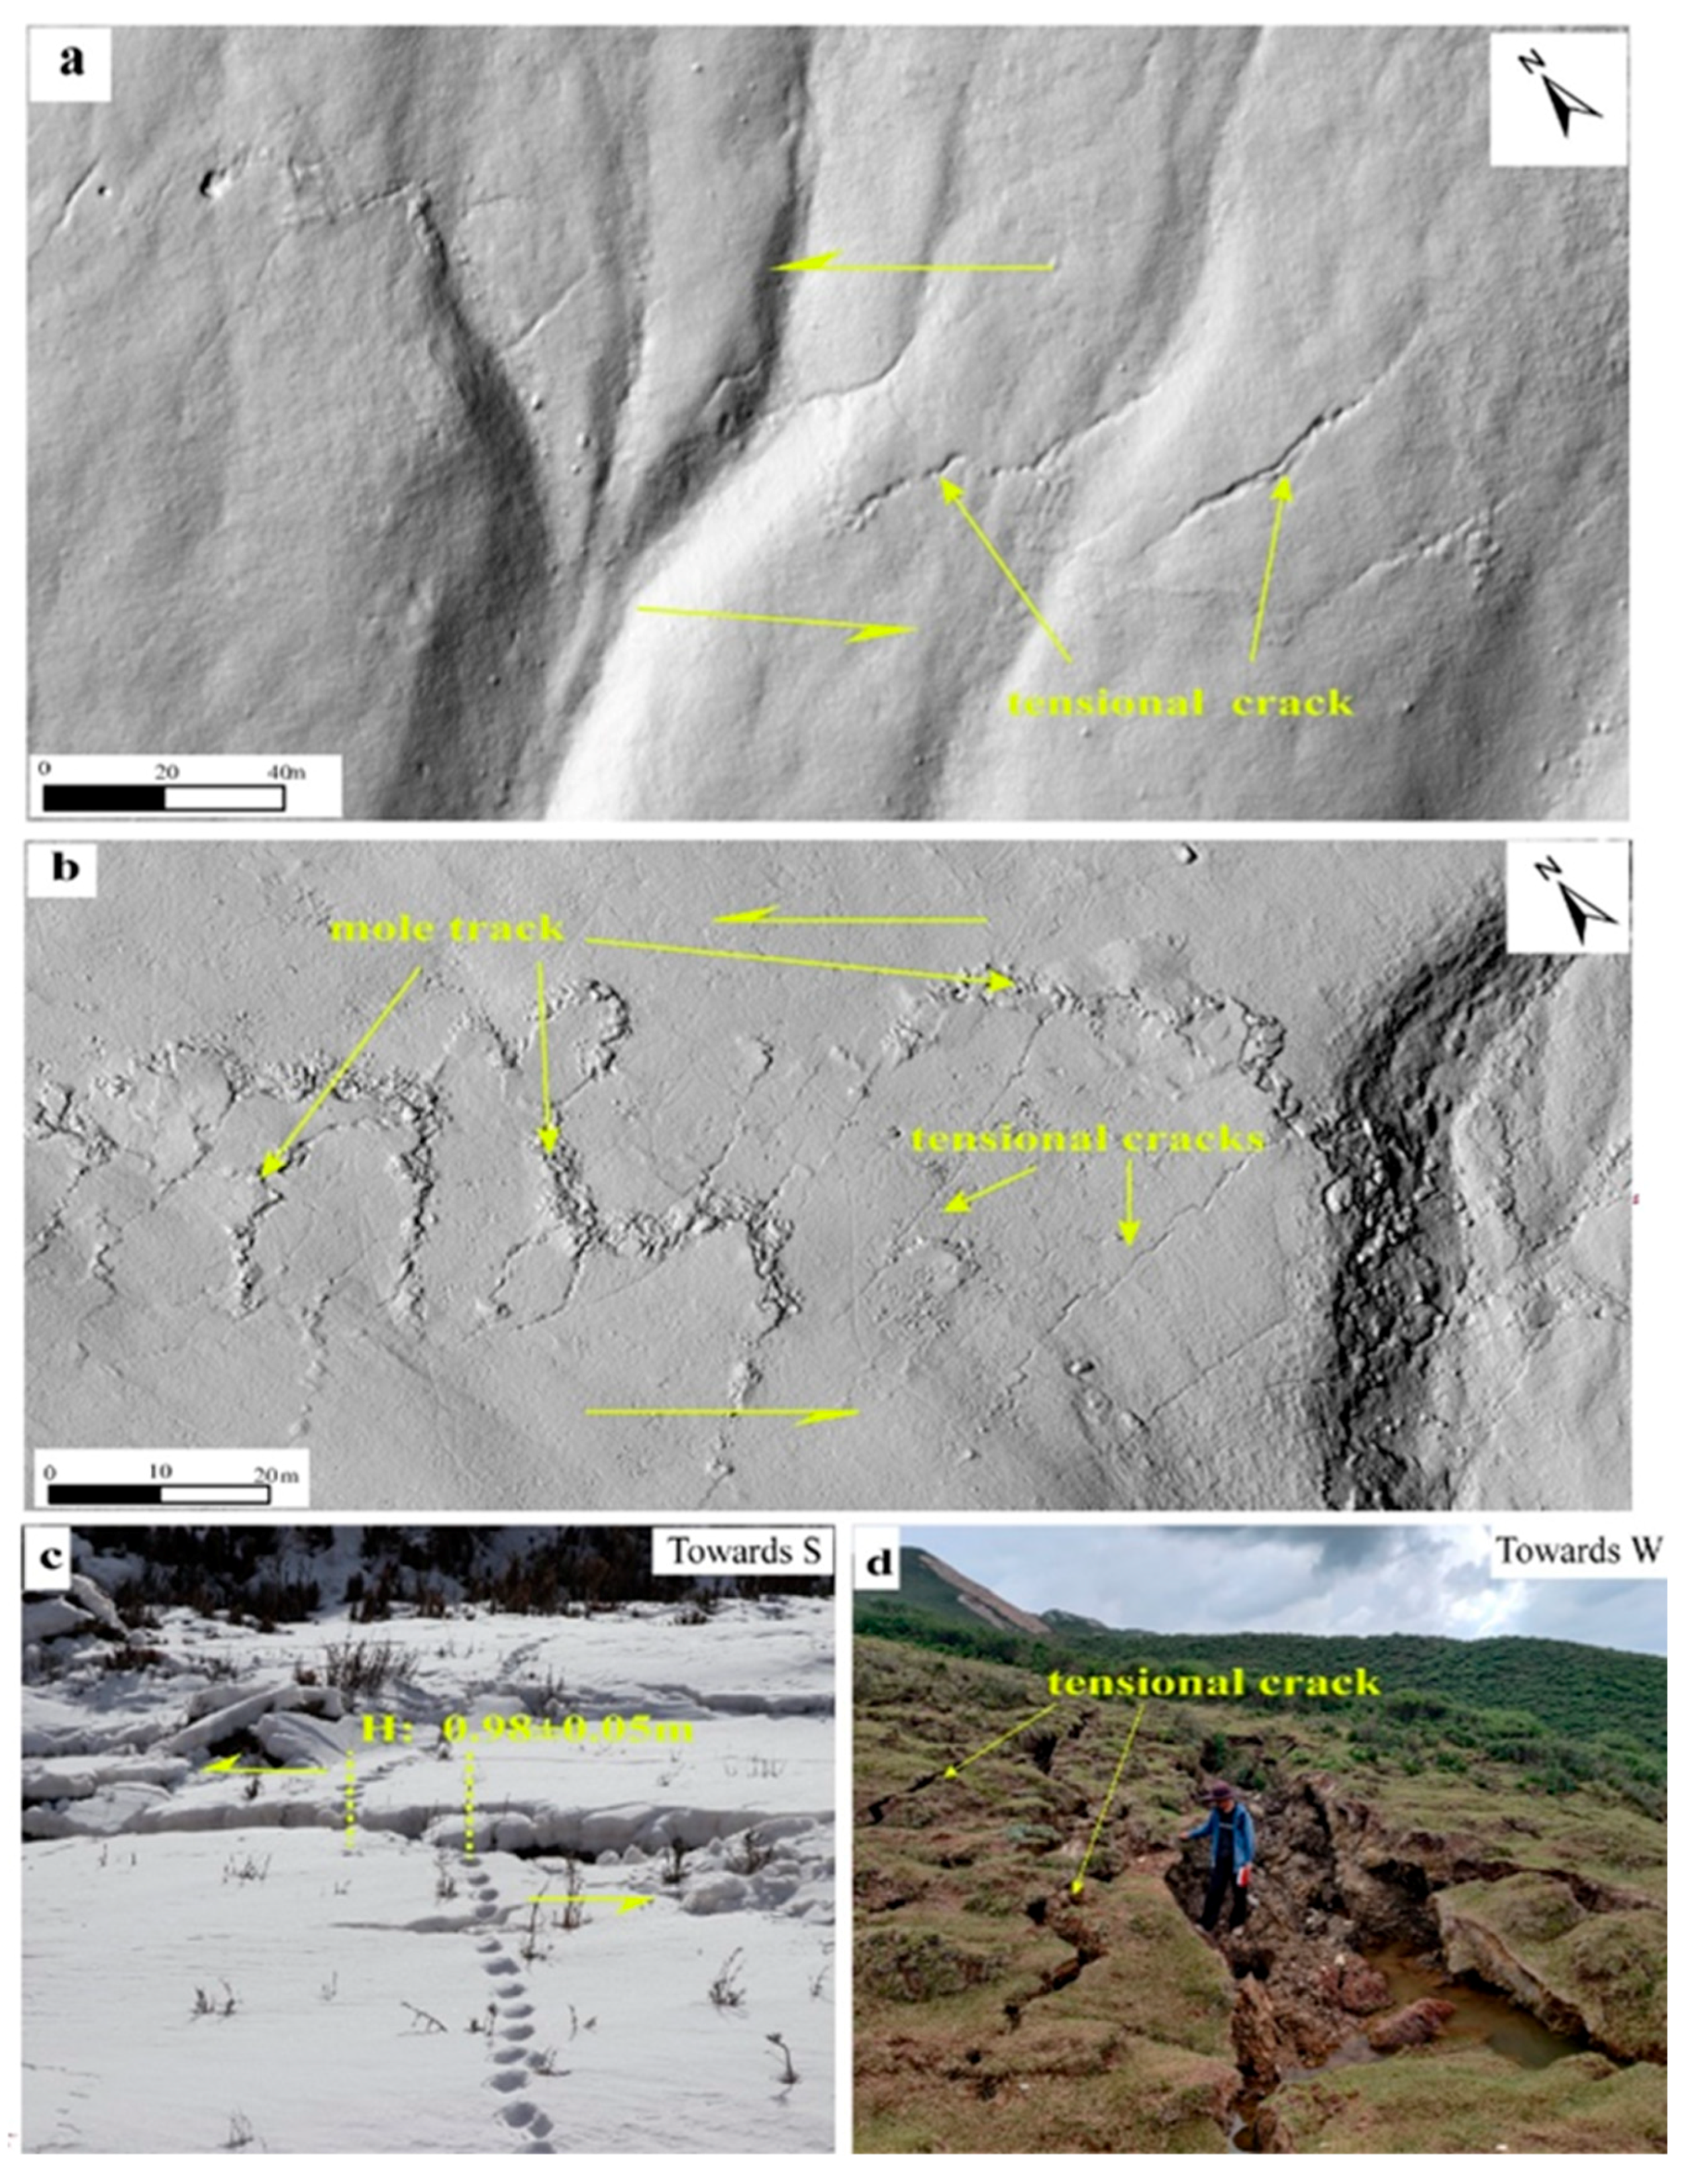
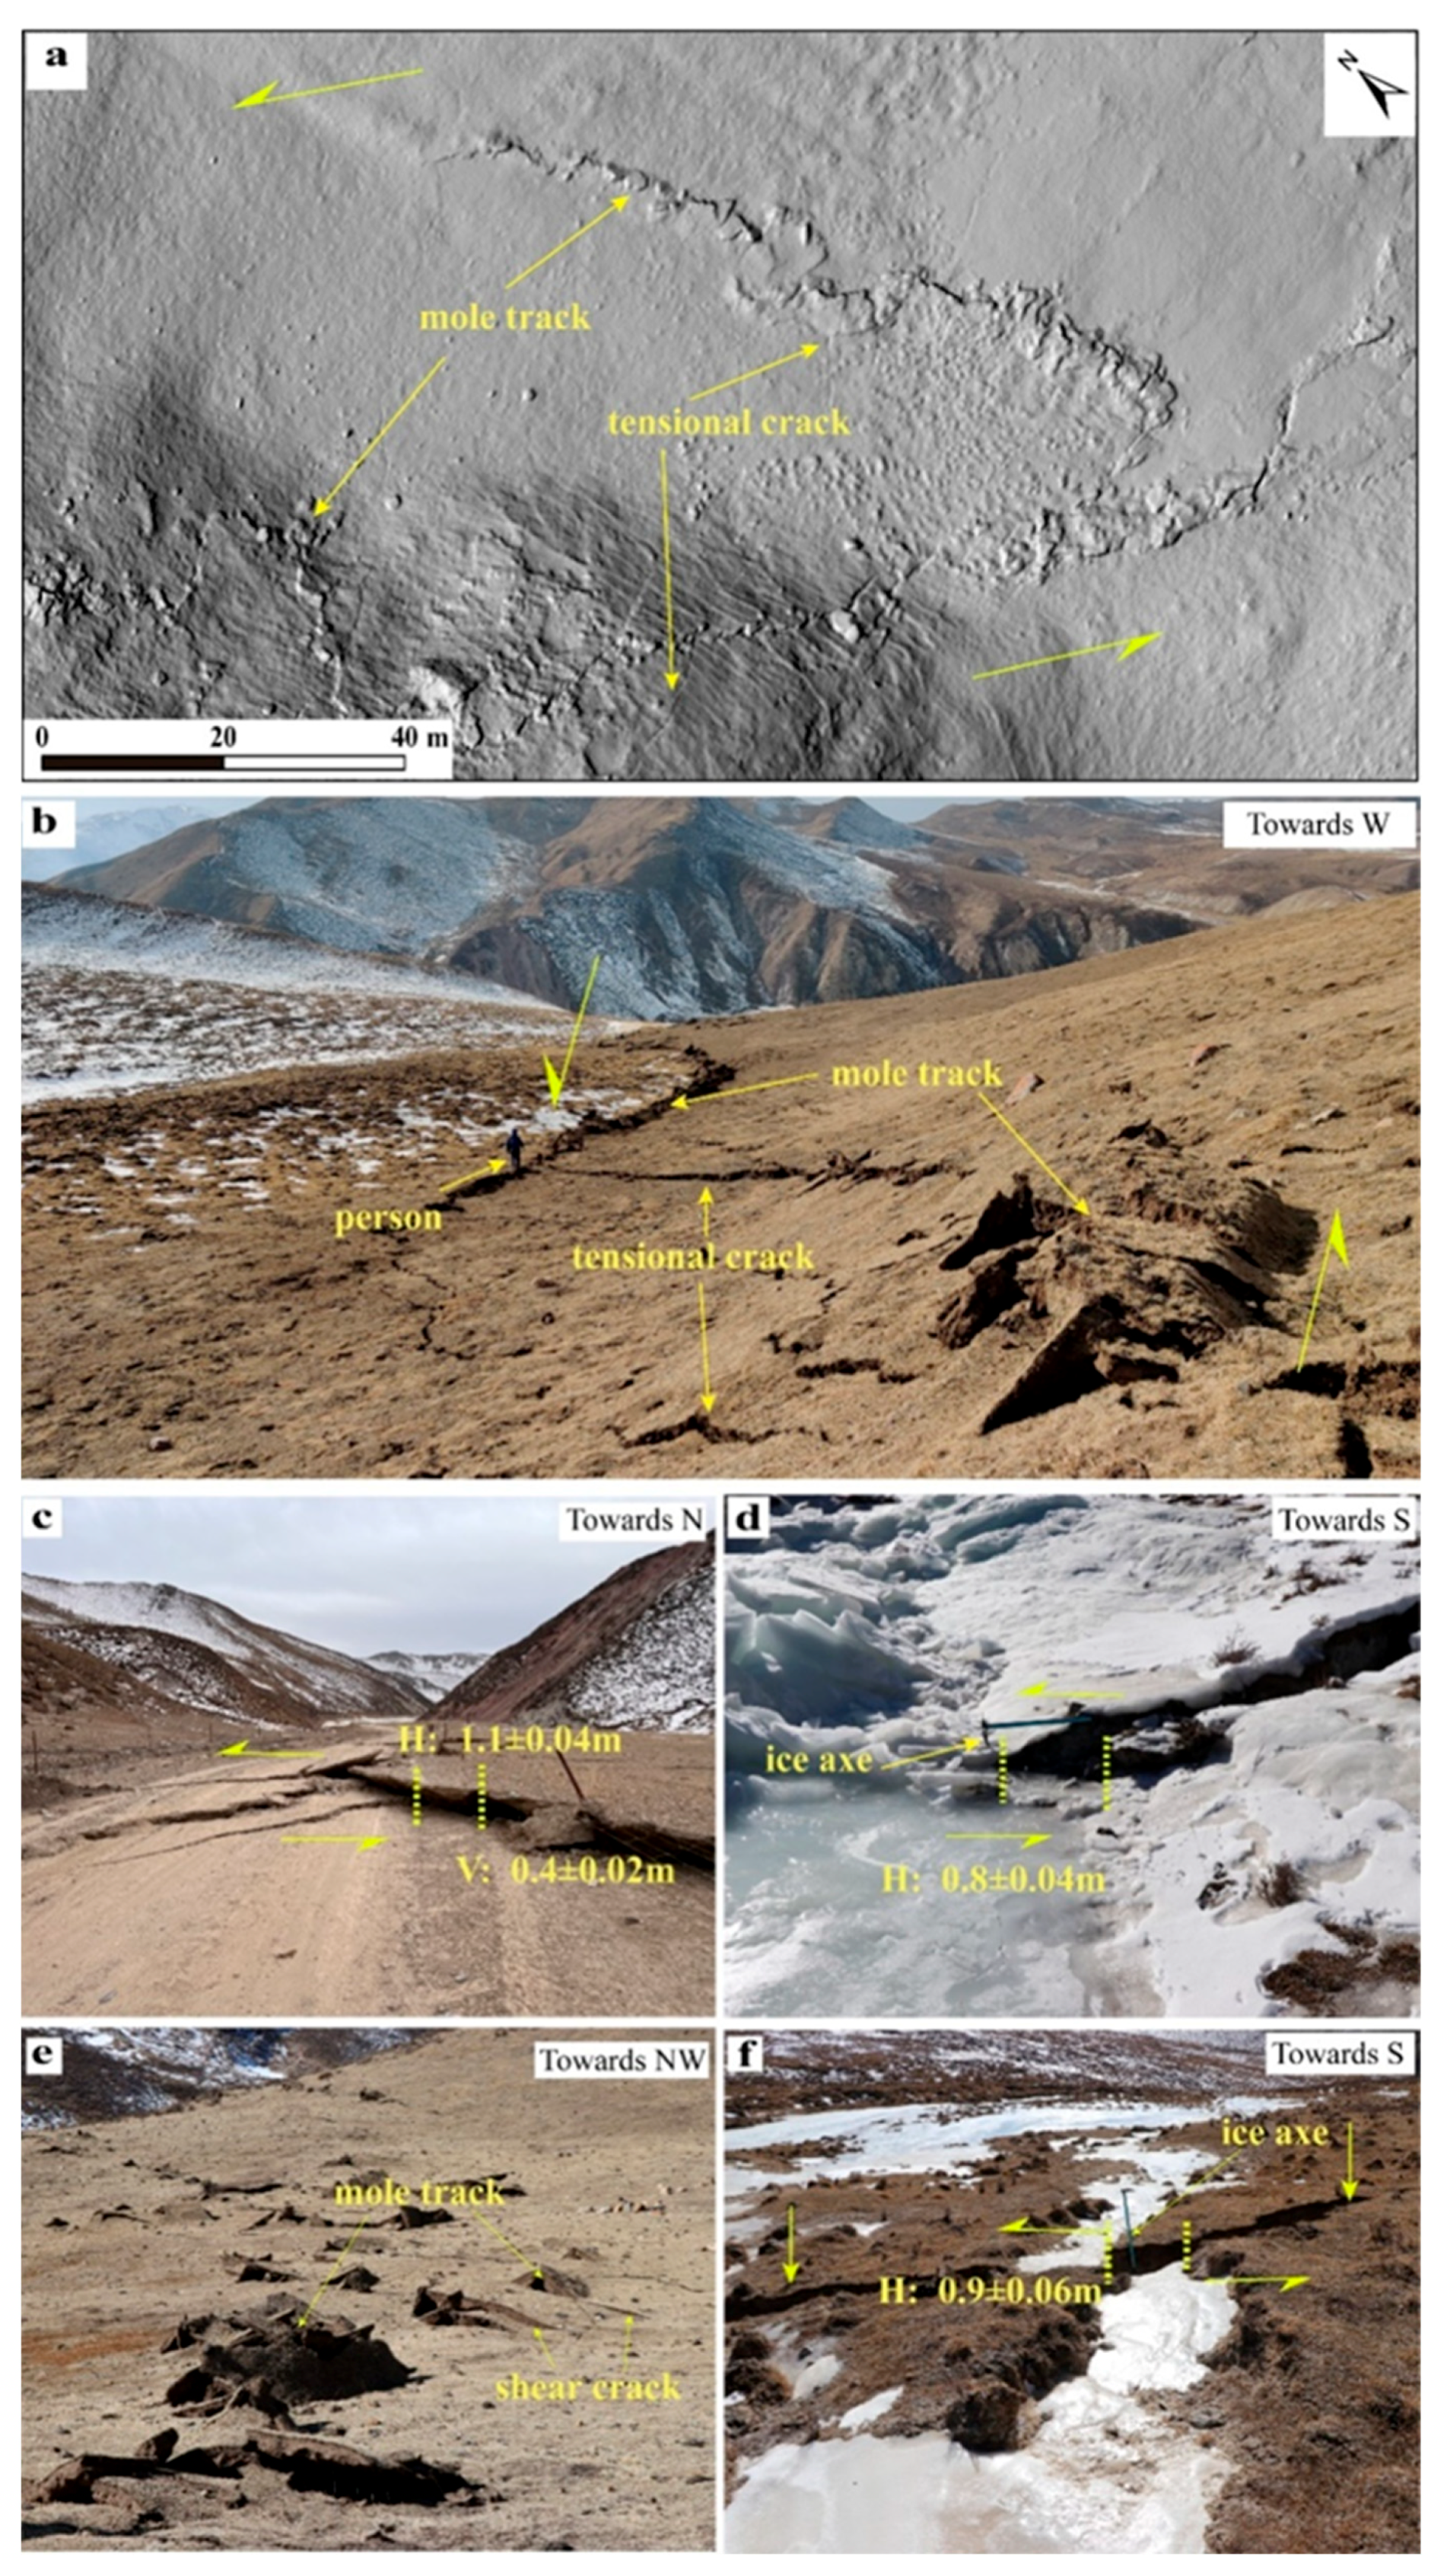
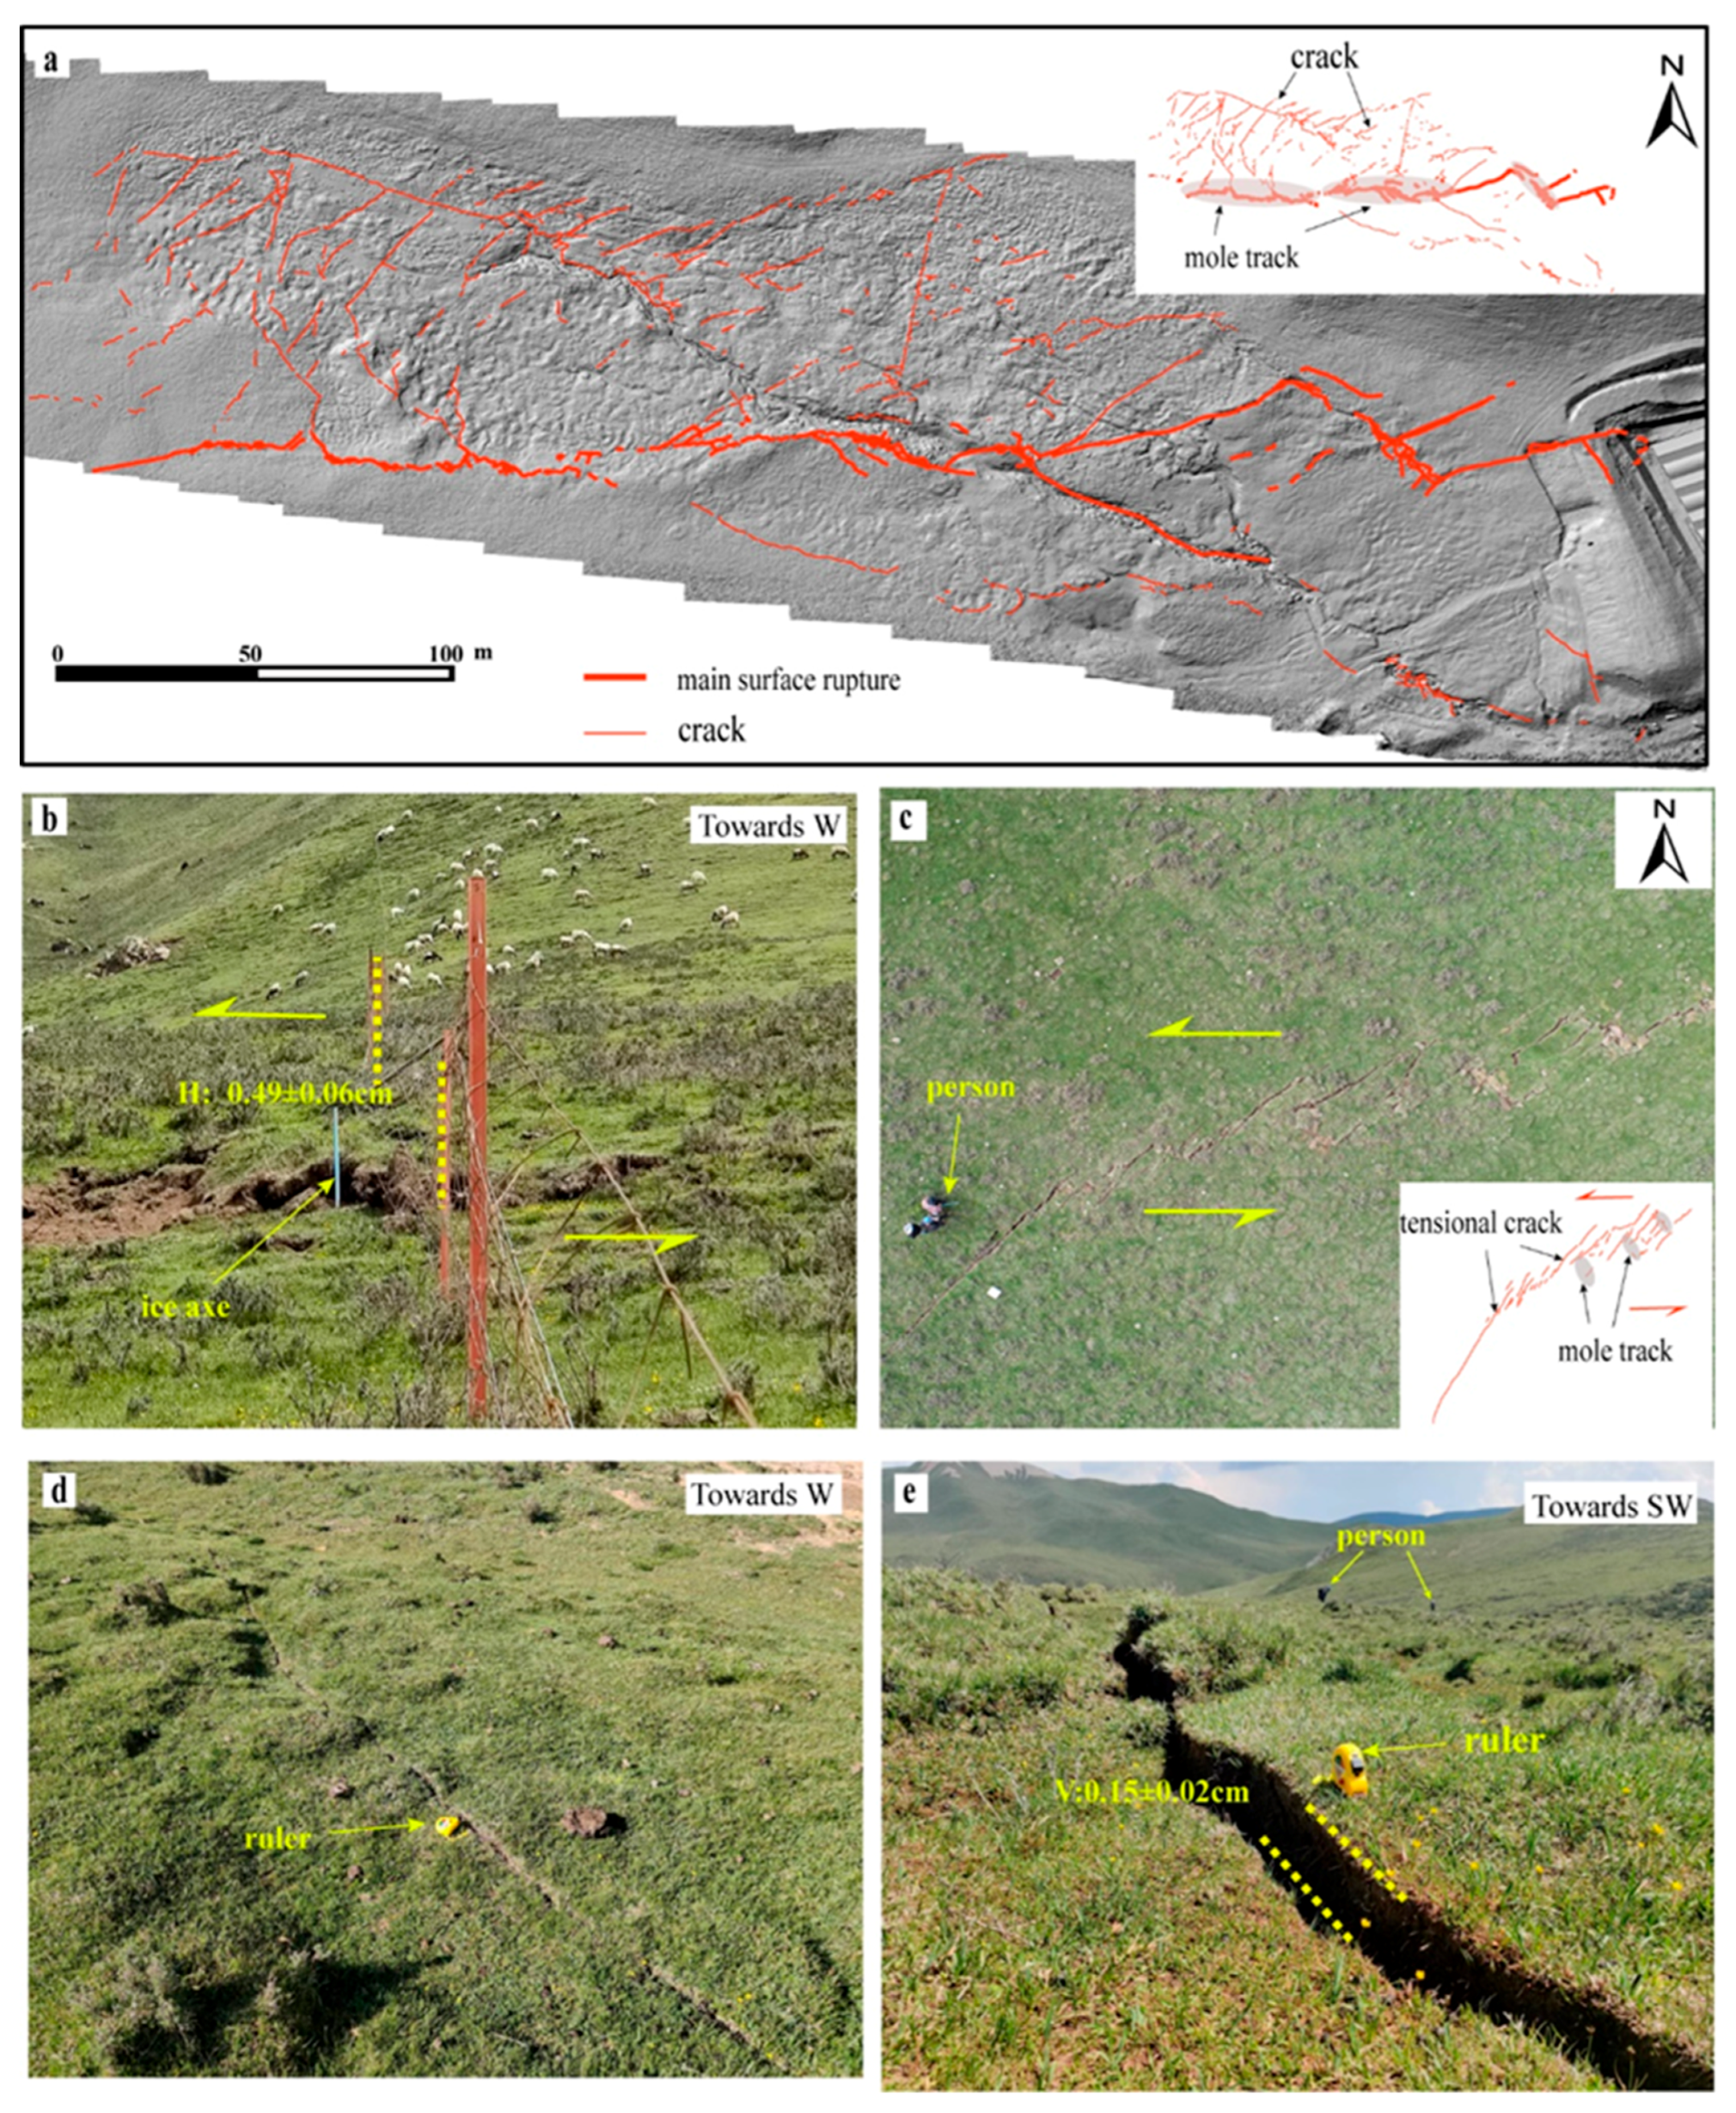
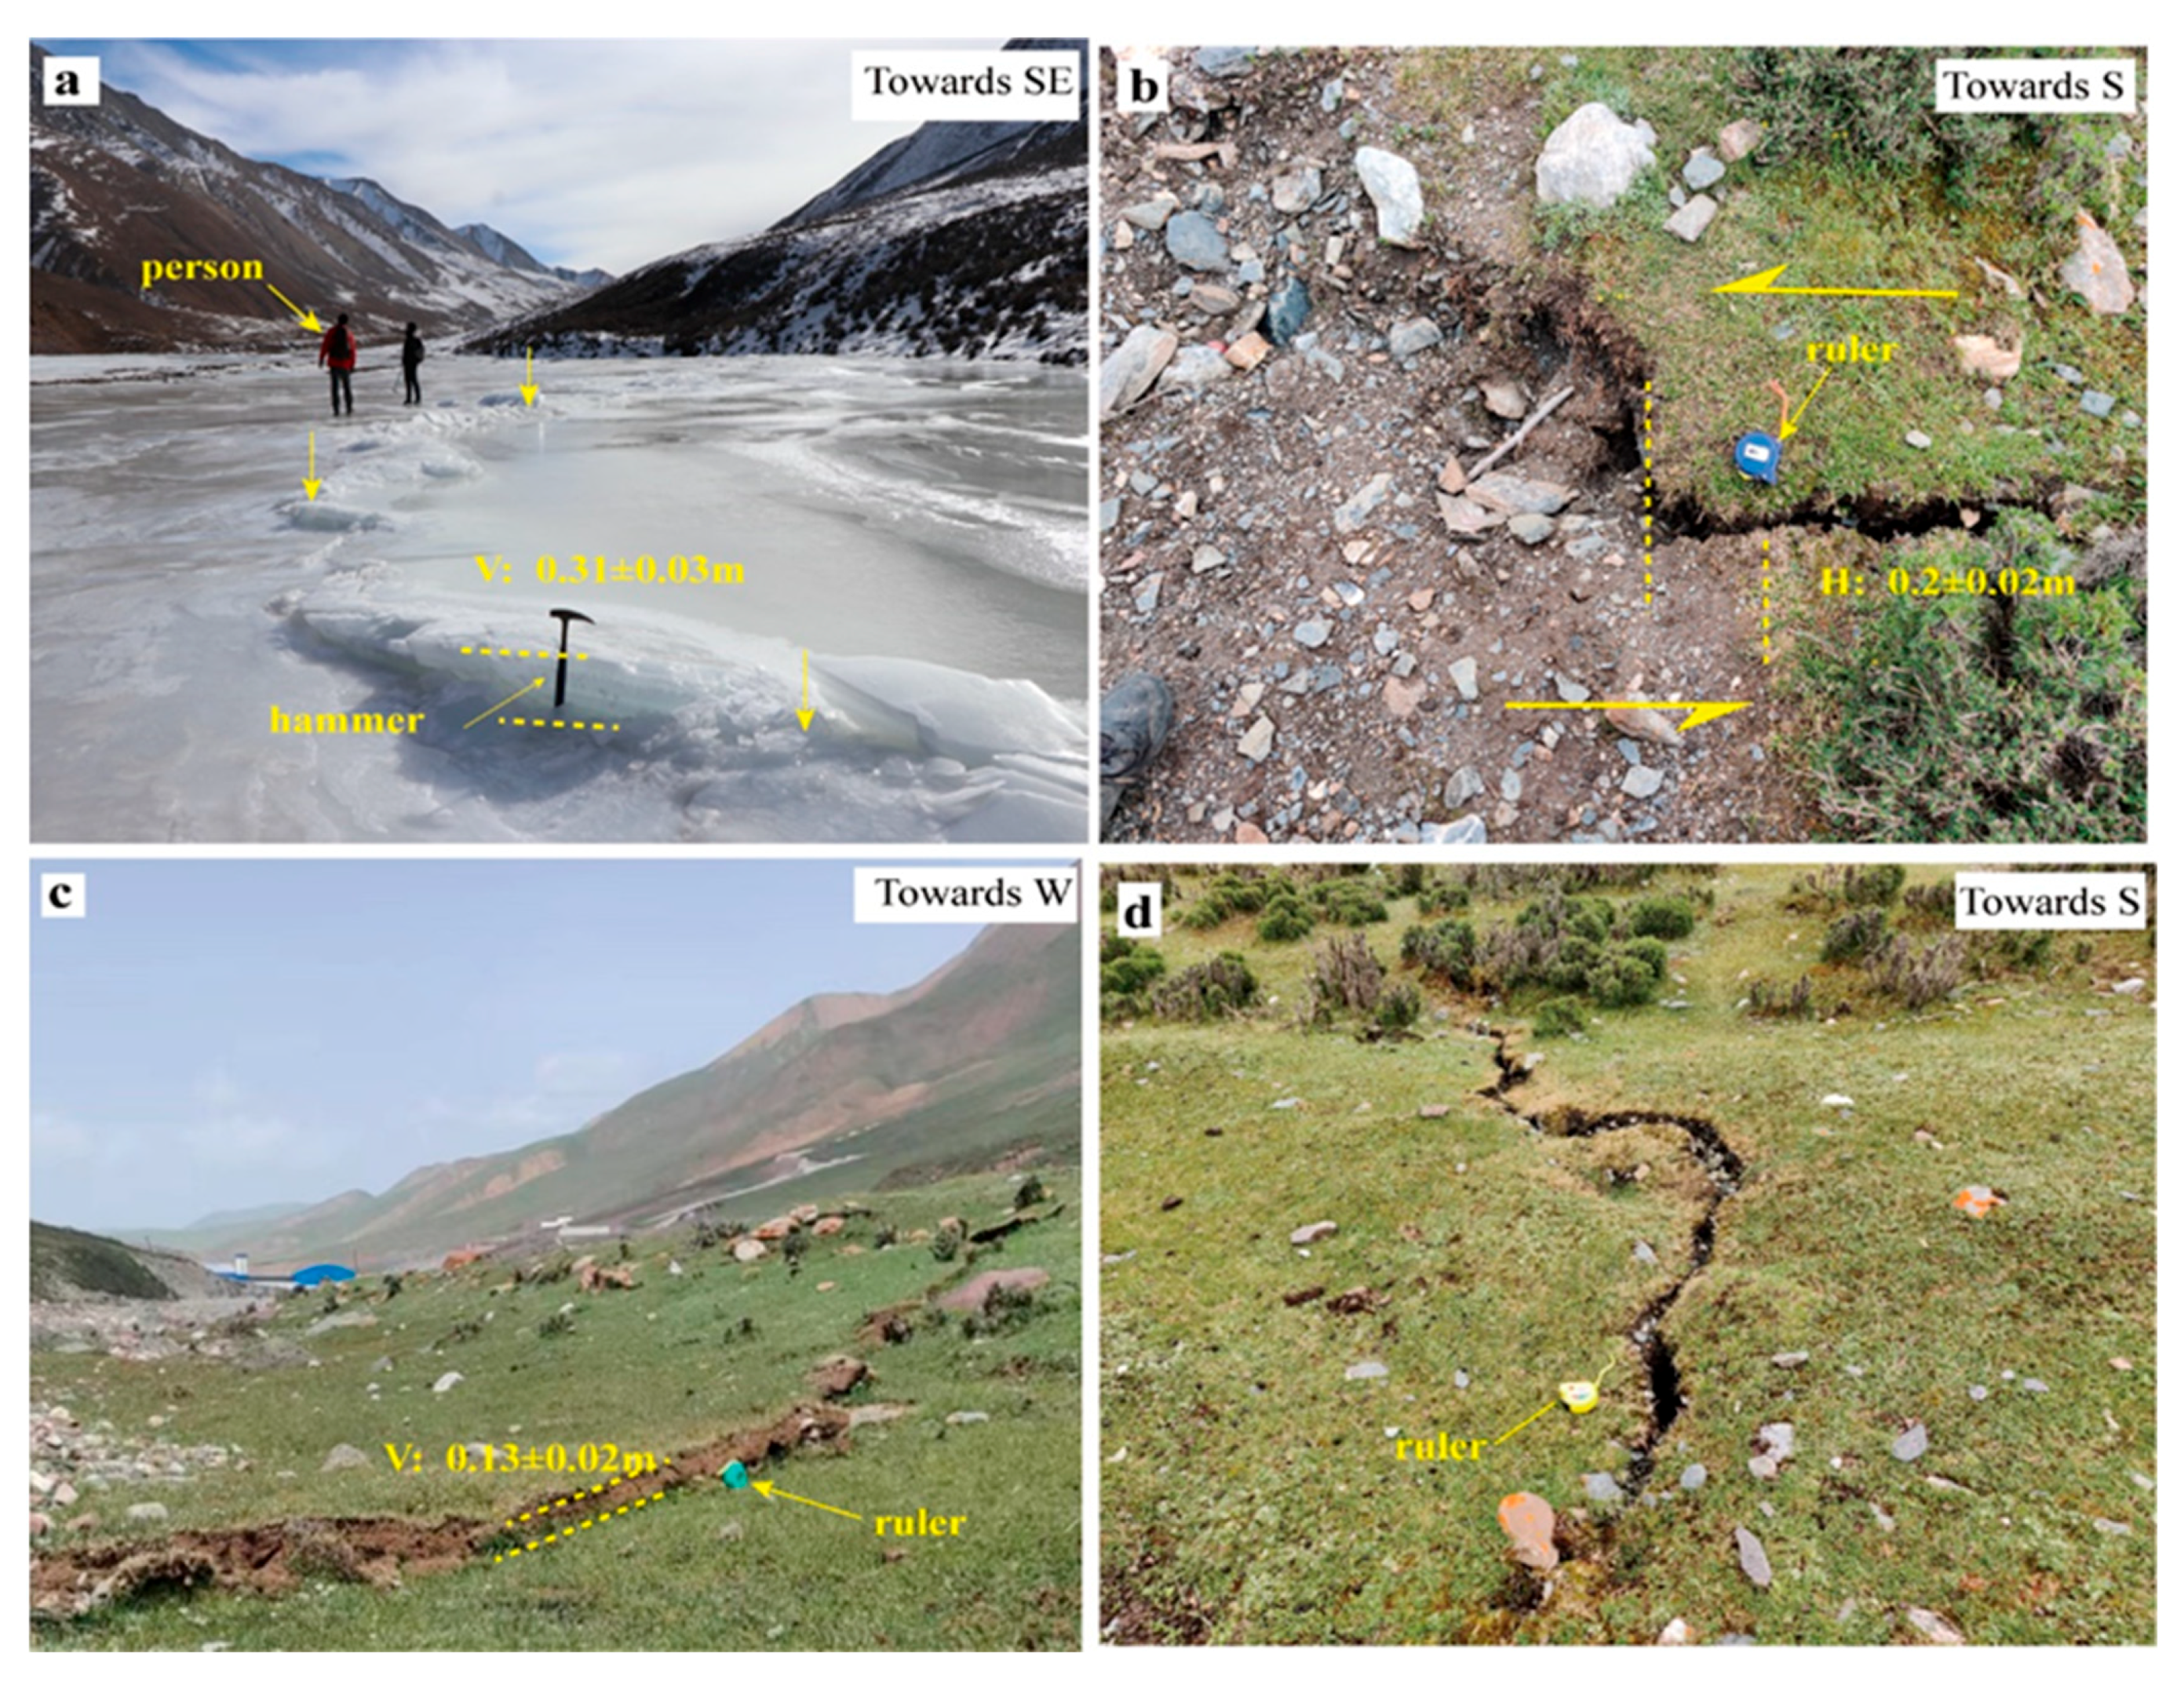
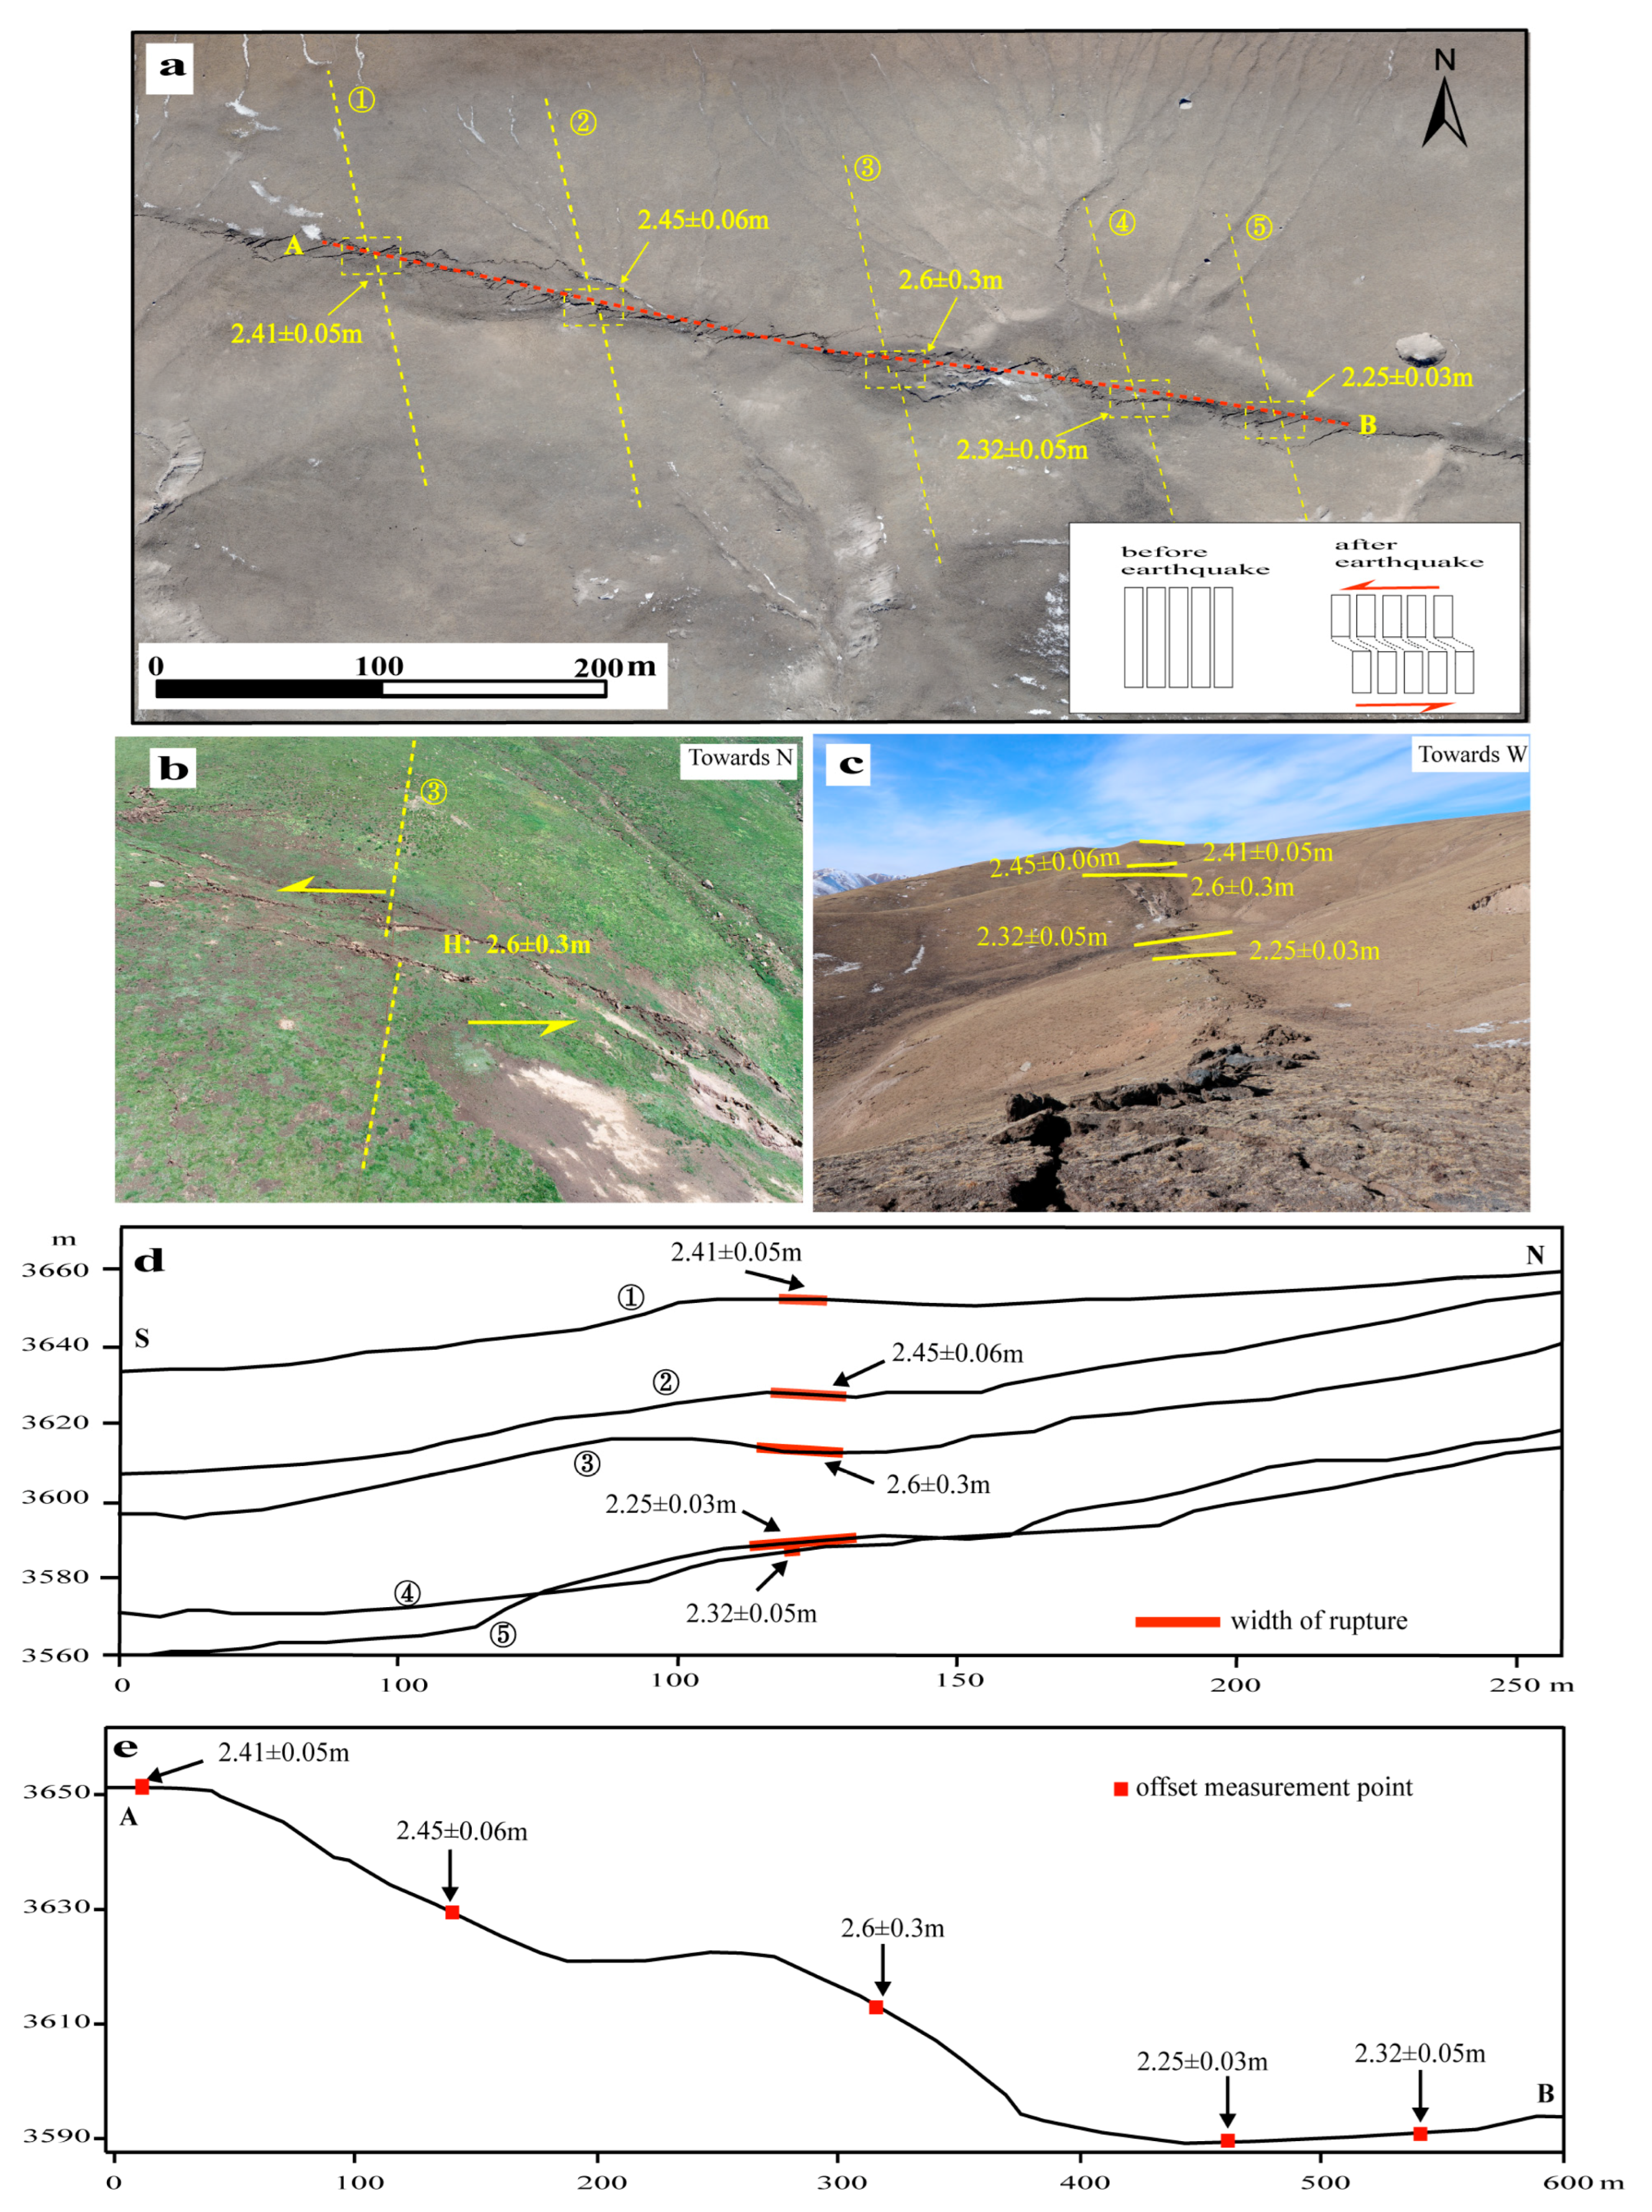
  • The earthquake-induced surface deformation phenomena, including left-step stretching and right-step compression, are characteristic of a strike-slip active fault landform.
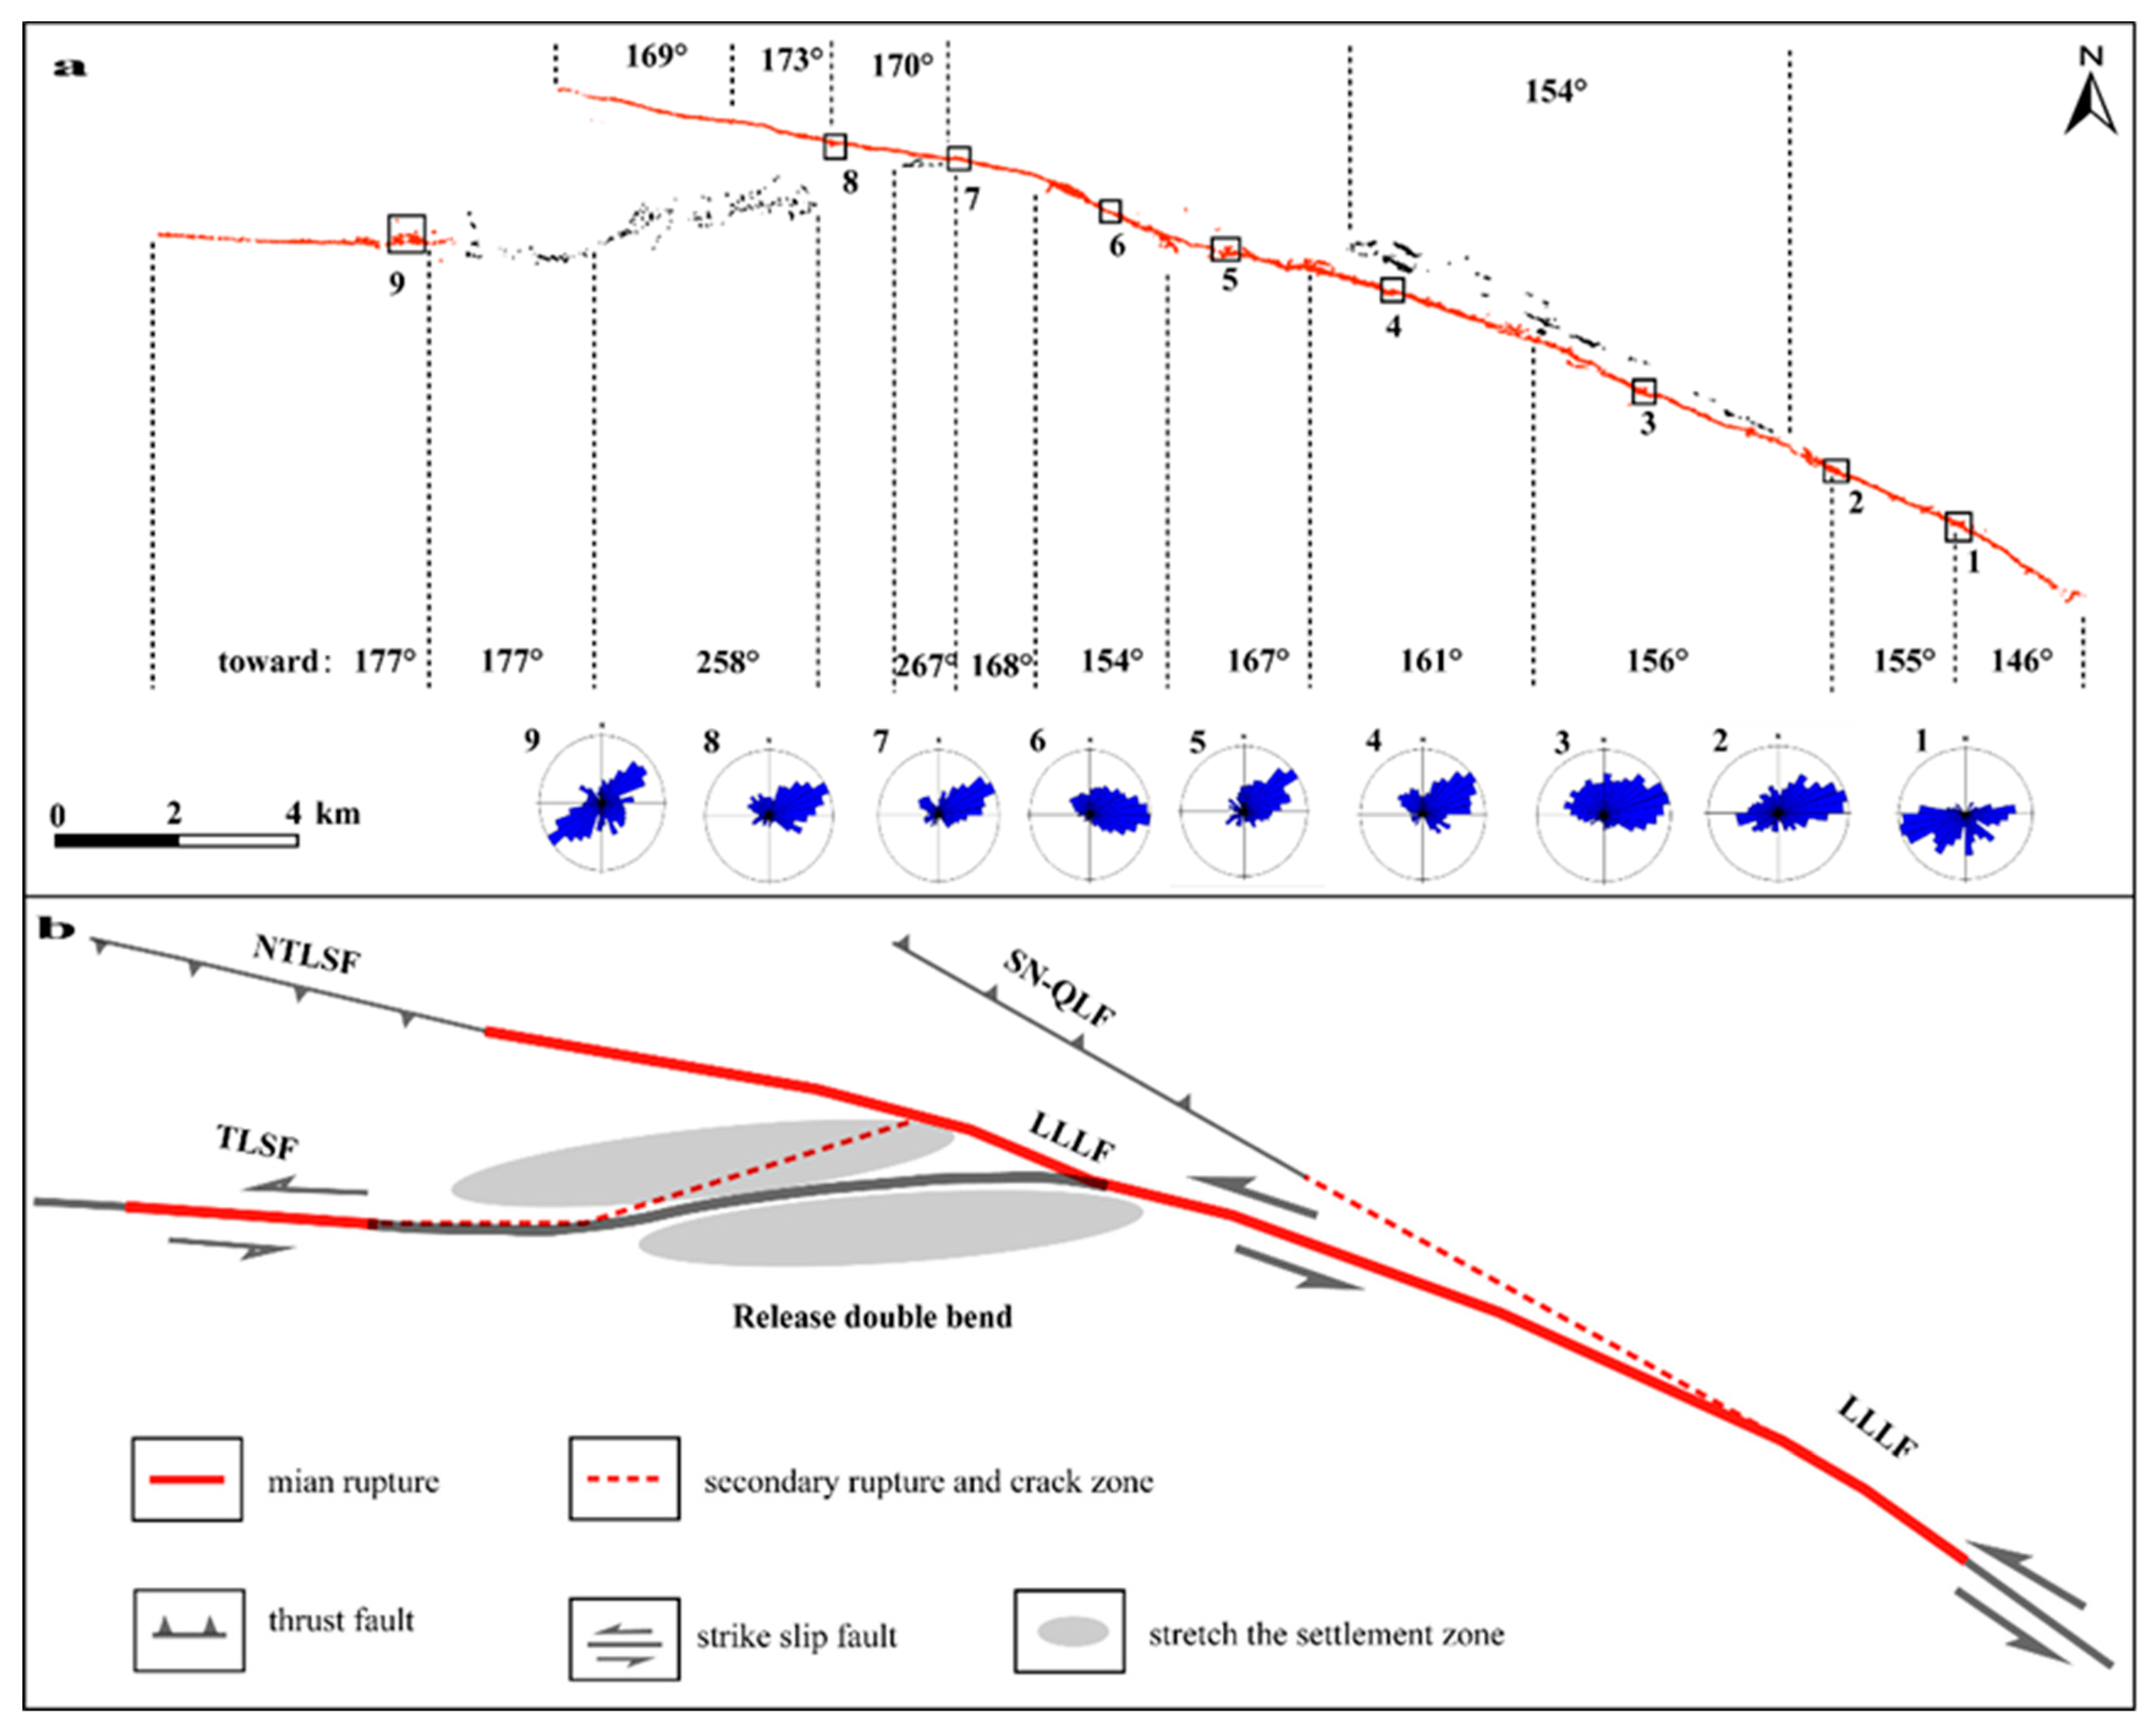
  • This earthquake can be classified as a double-release bend transition earthquake, where the seismic surface rupture jumps from the north branch to the south branch because of differences in structural properties on either side of the fault. During the transition, the north branch experiences tearing, forming two main ruptures and one secondary rupture.
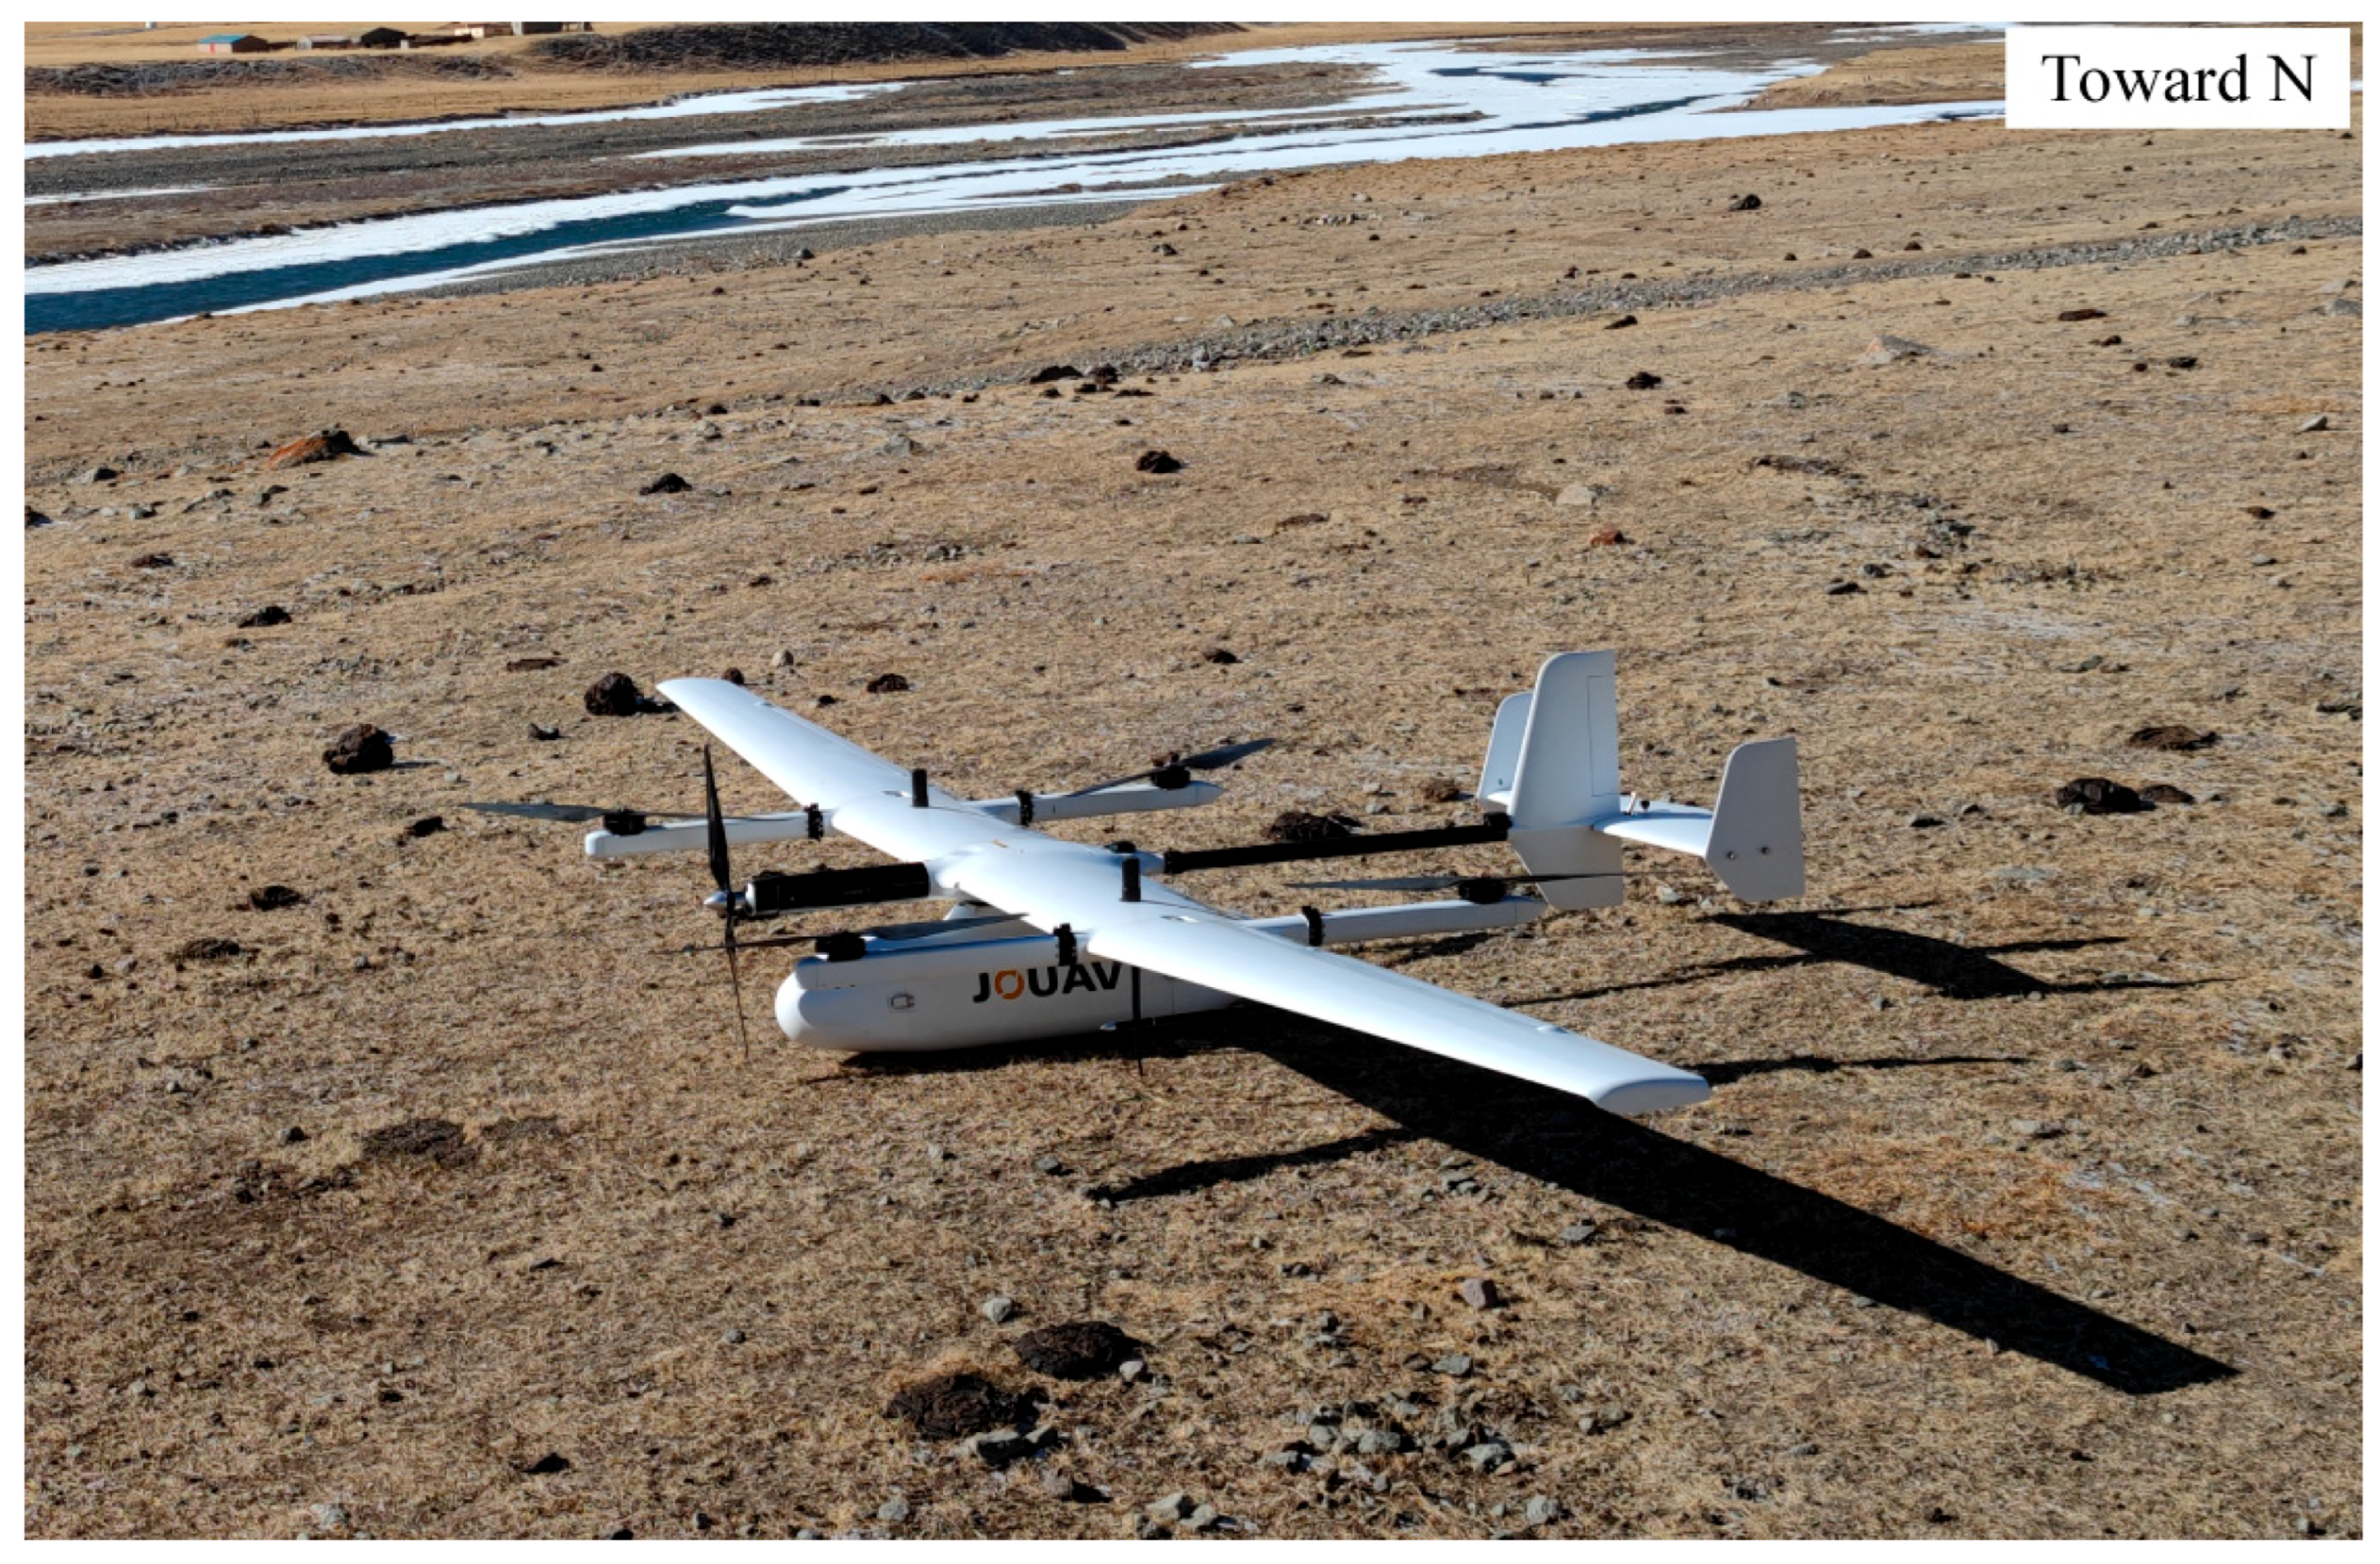
  • UAVs have the potential to gather comprehensive data regarding surface rupture zones following earthquakes efficiently. Nevertheless, the resolution limitations of UAVs necessitate the inclusion of on-site field investigations to augment the accuracy and precision of the information obtained.
  • Based on the findings of this earthquake investigation and previous research, it is anticipated that the TLSF will become a significant earthquake-prone region.

Author Contributions

All the authors participated in editing and reviewing the manuscript. Conceptualization, Y.W. and D.Y.; methodology, D.Y.; validation, D.Y., H.X., Q.S. and Z.L.; formal analysis, Y.W.; investigation, Y.W., D.Y., H.X., R.S., G.S., J.Y., Z.L. and H.S.; resources, Y.W. and H.X.; data curation, Y.W., H.L., L.Z. and Y.C.; writing—original draft preparation, Y.W.; writing—review and editing, Q.S. and D.Y.; visualization, Y.W. and L.Z.; supervision, D.Y.; project administration, D.Y.; funding acquisition, D.Y. All authors have read and agreed to the published version of the manuscript.

Funding

This research was funded by the Second Tibetan Plateau Scientific Expedition and Research Program (grant number 2019QZKK0901) and the National Natural Science Foundation of China (grant number 42172227 and 41572197).

Data Availability Statement

Not applicable.

Acknowledgments

We thank the anonymous reviewers for their comments and suggestions. The data of the 30 m resolution DEM set were provided by the Geospatial Data Cloud Site, Computer Network Information Center, Chinese Academy of Sciences (http://www.gscloud.cn (accessed on 31 January 2023)). The GF-7 data came from the China National Resources Satellite Center.

Conflicts of Interest

The authors declare no conflict of interest.

Appendix A

Table A1. Statistical table of coseismic left offsets of the Menyuan Ms 6.9 earthquake.
Longitude (°)Latitude (°)Offset (m)ErrorSignLongitude (°)Latitude (°)Offset (m)ErrorSign
101.39430337.7480570.230.02Small striated groove101.24031637.8060450.90.05Snow boundaries
101.39124737.7498620.240.02Grass edges101.2393937.8062181.60.1Fence
101.39116237.7498970.340.03Grass edges101.23828637.8061042.080.08Fence
101.38637.7525780.230.02Grass edges101.23614637.8064921.050.08Snow boundaries
101.38501737.752920 0.170.02Grass edges101.2361437.8065110.50.08Snow boundaries
101.38503237.7530830.520.03Grass edges101.23597737.8064441.30.05Fence
101.38497737.753130 0.340.02Small striated groove101.23595937.8064371.240.08Snow boundaries
101.38357637.7546990.220.02Grass edges101.2359237.8064230.790.08Snow boundaries
101.38270537.7545271.080.08Snow boundaries101.23485937.8066891.490.08Snow boundaries
101.38017137.7550330.780.08Footprints101.23475537.80667710.08Snow boundaries
101.37760237.756270.750.09Snow boundaries101.23450837.8066320.870.08Snow boundaries
101.37718337.7565180.740.08Footprints101.23368537.8066731.570.08Snow boundaries
101.37434737.757850.510.09Footprints101.23312537.806821.280.08Snow boundaries
101.37274837.7585550.250.08Snow boundaries101.23305537.8067841.320.08Snow boundaries
101.3719137.7587640.310.08Footprints101.22633837.8077110.380.08Snow boundaries
101.36663737.7610290.190.08Snow boundaries101.22443137.8082051.20.08Snow boundaries
101.36427737.7621330.790.11Snow boundaries101.22437.8082080.670.08Snow boundaries
101.36130737.763980.850.08Ice boundaries101.2237237.8082830.970.08Snow boundaries
101.36096437.7641320.610.07footprints101.22148337.8085231.140.05Rut
101.35818537.7651790.480.09footprints101.22146537.80852310.08Fence
101.35072337.7675580.50.08Snow ridgeline101.22103237.8085160.920.08Snow boundaries
101.34383237.7708711.60.11Snow boundaries101.2209437.8084510.380.08Snow boundaries
101.34044437.7715370.980.05Footprints101.21307837.8103480.80.08Ice boundaries
101.33941637.7721650.90.1Gully101.21137137.8109650.660.08Snow boundaries
101.33659937.7738780.650.08Footprints101.20879537.8114070.670.08Snow boundaries
101.32919437.7780090.590.09Footprints101.20839737.8113761.130.08Snow boundaries
101.327537.7782570.750.11Snow boundaries101.20779137.8115121.070.08Snow boundaries
101.32384537.7793992.20.3Rut101.2077337.8115330.750.08Footprints
101.31779237.7831960.820.08Snow boundaries101.20736537.8114961.20.1Footprints
101.31186737.7836250.520.09Road101.20668837.81168310.08Fence
101.30858337.7847671.260.08Road101.20622937.8116661.20.08Snow boundaries
101.30820237.7847430.910.09Snow boundaries101.2018937.8122730.80.05Ice boundaries
101.30782237.7849570.250.08Footprints101.20154537.8121641.40.05Ice boundaries
101.30058837.7872410.450.09Footprints101.20144837.8121490.90.08Ice boundaries
101.29678137.78847910.1Footprints101.20112237.8121730.640.08Snow boundaries
101.29632937.78890710.11Footprints101.19684137.8129310.760.08Snow boundaries
101.2864737.7906250.90.08Footprints101.19680937.8129231.30.08Snow boundaries
101.27091737.7944540.230.02Small striated groove101.19640237.8129710.980.08Snow boundaries
101.27185937.7942970.220.02Small striated groove101.19489837.8132740.350.08Snow boundaries
101.2635837.7975731.420.05Ice boundaries101.19419537.8135350.610.08Snow boundaries
101.2609637.7987410.90.05Ice boundaries101.19400537.8135520.980.08Snow boundaries
101.26072437.79890620.5Ice boundaries101.19194237.8141950.580.08Snow boundaries
101.26067737.7992051.70.1Road101.19005837.8147230.490.08Snow boundaries
101.2600537.7992611.350.05Ice boundaries101.18955137.8147940.540.08Snow boundaries
101.25839337.8003421.760.04Ice boundaries101.18785737.8149440.270.08Snow boundaries
101.25621737.8018881.50.1Fence101.15599937.7934230.550.08Road
101.25395737.8026892.260.14Fence101.15420437.7936480.460.08Groove edge
101.24978137.8040121.170.08Fence101.15417537.7936410.330.08Small striated groove
101.24872237.8042381.810.05Fence101.15403137.7936050.860.08Small striated groove
101.24764637.8044042.180.06Fence101.15294637.79366710.08Groove edge
101.24765637.8044052.250.03Fence101.14534237.7937220.330.08Fence
101.24695137.8045442.320.05Fence101.14301737.7936980.490.08Fence
101.24569137.8047432.60.3Fence101.14250637.7938020.320.08Snow boundaries
101.24418337.8051532.450.06Fence101.14062237.7938460.610.08Fence
101.24306637.8053582.410.05Fence101.1333237.7940940.40.08Road
101.24198337.8055582.130.08Fence

References

  1. Wesnousky, S.G. Predicting the Endpoints of Earthquake Ruptures. Nature 2006, 444, 358–360. [Google Scholar] [CrossRef]
  2. Wells, D.L.; Coppersmith, K.J. New Empirical Relationships among Magnitude, Rupture Length, Rupture Width, Rupture Area, and Surface Displacement. Bull. Seismol. Soc. Am. 1994, 84, 974–1002. [Google Scholar]
  3. Petersen, M.D.; Dawson, T.E.; Chen, R.; Cao, T.; Wills, C.J.; Schwartz, D.P.; Frankel, A.D. Fault Displacement Hazard for Strike-Slip Faults. Bull. Seismol. Soc. Am. 2011, 101, 805–825. [Google Scholar] [CrossRef]
  4. Rockwell, T.K.; Klinger, Y. Surface Rupture and Slip Distribution of the 1940 Imperial Valley Earthquake, Imperial Fault, Southern California: Implications for Rupture Segmentation and Dynamics. Bull. Seismol. Soc. Am. 2013, 103, 629–640. [Google Scholar] [CrossRef]
  5. Kurtz, R.; Klinger, Y.; Ferry, M.; Ritz, J.-F. Horizontal Surface-Slip Distribution through Several Seismic Cycles: The Eastern Bogd Fault, Gobi-Altai, Mongolia. Tectonophysics 2018, 734–735, 167–182. [Google Scholar] [CrossRef]
  6. Ren, J.; Xu, X.; Zhang, G.; Wang, Q.; Zhang, Z.; Gai, H.; Kang, W. Coseismic Surface Ruptures, Slip Distribution, and 3D Seismogenic Fault for the 2021 Mw 7.3 Maduo Earthquake, Central Tibetan Plateau, and Its Tectonic Implications. Tectonophysics 2022, 827, 229275. [Google Scholar] [CrossRef]
  7. Yuan, Z.; Liu, J.; LI, X.; Xu, J.; Yao, W.; Han, L.; Li, T. Detailed mapping of the surface rupture of the 12 February 2014 Yutian Ms7.3 earthquake, Altyn Tagh fault, Xinjiang, China. Sci. China Earth Sci. 2021, 51, 276–298. (In Chinese) [Google Scholar]
  8. Li, Y.; Jiang, W.; Li, Y.; Shen, W.; He, Z.; Li, B.; Li, Q.; Jiao, Q.; Tian, Y. Coseismic Rupture Model and Tectonic Implications of the January 7 2022, Menyuan Mw 6.6 Earthquake Constraints from InSAR Observations and Field Investigation. Remote Sens. 2022, 14, 2111. [Google Scholar] [CrossRef]
  9. Pan, J.; Li, H.; Chevalier, M.L.; Liu, D.; Li, C.; Liu, F.; Wu, Q.; Lu, H.; Jiao, L. Coseismic surface rupture and seismogenic structure of the 2022 Ms6.9 Menyuan earthquake, Qinghai Province, China. Acta Geol. Sin. 2022, 96, 215–231. (In Chinese) [Google Scholar]
  10. Han, S.; Wu, Z.; Gao, Y.; Lu, H. Surface rupture investigation of the 2022 Menyuan MS 6. 9 Earthquake, Qinghai, China: Implications for the fault behavior of the Lenglongling fault and regional intense earthquake risk. J. Geomech. 2022, 28, 155–168. (In Chinese) [Google Scholar]
  11. Liang, K.; He, Z.; Jiang, W.; Li, Y.; Liu, Z. Coseismic Surface rupture characteristics of the Menyuan Ms 6.9 earthquakes on January 8, 2022, Qinghai province. Seism. Geol. 2022, 44, 256–278. (In Chinese) [Google Scholar]
  12. Yuan, D.; Xie, H.; Su, R.; Li, Z.; Wen, Y.; Si, G.; Xue, S.; Chen, G.; Liu, B.; Liang, S.; et al. Characteristics of co-seismic surface rupture zone of Menyuan MS6.9 earthquake in Qinghai Province on January 8, 2022 and seismogenic mechanism. Chin. J. Geophys. 2023, 66, 229–244. (In Chinese) [Google Scholar]
  13. Niu, P.; Han, Z.; Li, K.; Lv, L.; Guo, P. The 2022 Mw 6.7 Menyuan Earthquake on the Northeastern Margin of the Tibetan Plateau, China: Complex Surface Ruptures and Large Slip. Bull. Seismol. Soc. Am. 2023, 113, 976–996. [Google Scholar] [CrossRef]
  14. Molnar, P.; Tapponnier, P. Cenozoic Tectonics of Asia: Effects of a Continental Collision. Science 1975, 189, 419–426. [Google Scholar] [CrossRef]
  15. Ding, L.; Kapp, P.; Cai, F.; Garzione, C.N.; Xiong, Z.; Wang, H.; Wang, C. Timing and mechanisms of Tibetan Plateau uplift. Nat. Rev. Earth Environ. 2022, 3, 652–667. [Google Scholar] [CrossRef]
  16. Zhang, P.; Deng, Q.; Zhang, G.; Ma, J.; Gan, W.; Min, W.; Mao, F.; Wang, Q. Seismic Activity and Active Tectonic Blocks in continental China. Sci. China Earth Sci. 2003, 33, 12–20. (In Chinese) [Google Scholar]
  17. Li, B.; Chen, X.; Zuza, A.V.; Hu, D.; Ding, W.; Huang, P.; Xu, S. Cenozoic cooling history of the North Qilian Shan, northern Tibetan Plateau, and the initiation of the Haiyuan fault: Constraints from apatite-and zircon-fission track thermochronology. Tectonophysics 2019, 751, 109–124. [Google Scholar] [CrossRef]
  18. Zhang, P.; Wang, M.; Gan, W.; Deng, Q. Slip rates along major active faults from GPS measurements and constrains on contemporary continental tectonics. Earth Sci. Front. 2003, 10, 81–92. (In Chinese) [Google Scholar]
  19. Liu-Zeng, J.; Klinger, Y.; Xu, X.; Lasserre, C.; Chen, G.; Chen, W.; Tapponnier, P.; Zhang, B. Millennial Recurrence of Large Earthquakes on the Haiyuan Fault near Songshan, Gansu Province, China. Bull. Seismol. Soc. Am. 2007, 97, 14–34. [Google Scholar] [CrossRef]
  20. Zheng, W.; Zhang, P.; He, W.; Yuan, D.; Shao, Y.; Zheng, D.; Ge, W.; Min, W. Transformation of Displacement between Strike-Slip and Crustal Shortening in the Northern Margin of the Tibetan Plateau: Evidence from Decadal GPS Measurements and Late Quaternary Slip Rates on Faults. Tectonophysics 2013, 584, 267–280. [Google Scholar] [CrossRef]
  21. Daout, S.; Jolivet, R.; Lasserre, C.; Doin, M.-P.; Barbot, S.; Tapponnier, P.; Peltzer, G.; Socquet, A.; Sun, J. Along-Strike Variations of the Partitioning of Convergence across the Haiyuan Fault System Detected by InSAR. Geophys. J. Int. 2016, 205, 536–547. [Google Scholar] [CrossRef]
  22. Dang, G.; Tu, D.; Ye, J.; Zhang, R.; Jia, H. Seismic damage and intensity distribution of the Menyuan (M = 6.4) earthquake in 1986. Northwest Seismol. J. 1988, 3, 95–97. (In Chinese) [Google Scholar]
  23. Xu, J.; Yao, L.; Wang, J. Earthquake source mechanism of the Menyuan earthquake (Ms = 6.4, on Aug. 26, 1986) and its strong aftershocks. Northwest Seismol. J. 1986, 4, 82–84. (In Chinese) [Google Scholar]
  24. Jiang, W. Holocene Rupture Pattern, Seismic Recurrence Feature of the Lenglongling Fault Zone and Its Tectonic Implication for the Northeast Tibetan Plateau. Ph.D. Thesis, Institute of Geology, China Earthquake Administration, Beijing, China, 2018. (In Chinese). [Google Scholar]
  25. Lei, D.; Liu, J.; Liu, Z.; He, Y.; Qiao, Y. Discussion on the seismogenic structure of 2016 Menyuan M6. 4 Earthquakes in Menyuan Qinghai. Seismol. Geol. 2018, 40, 107–120. (In Chinese) [Google Scholar]
  26. Guo, P.; Han, Z.; Gao, F.; Zhu, C.; Gai, H. A New Tectonic Model for the 1927 M8.0 Gulang Earthquake on the NE Tibetan Plateau. Tectonics 2020, 39, e2020TC006064. [Google Scholar] [CrossRef]
  27. Ou, Q.; Kulikova, G.; Yu, J.; Elliott, A.; Parsons, B.; Walker, R. Magnitude of the 1920 Haiyuan Earthquake Reestimated Using Seismological and Geomorphological Methods. J. Geophys. Res. Solid Earth 2020, 125, e2019JB019244. [Google Scholar] [CrossRef]
  28. Fan, L.; Li, B.; Liao, S.; Jiang, C.; Fang, L. High-precision relocation of the aftershock sequence of the January 8, 2022, Ms6.9 Menyuan earthquake. Earthq. Sci. 2022, 35, 138–145. [Google Scholar] [CrossRef]
  29. He, W.; Liu, B.; Yuan, D.; Yang, M. Reseacrh on the slip rate of the Lenglongling active fault zone. Northwest Seismol. J. 2000, 22, 90–97. (In Chinese) [Google Scholar]
  30. Guo, P.; Han, Z.; Jiang, W.; Mao, Z. Holocene left-lateral slip rate of the Lenglongling fault on the northeastern margin of the Qinghai-Tibet Plateau. Seismol. Geol. 2017, 39, 323–341. (In Chinese) [Google Scholar]
  31. He, W.; Liu, B.; Yuan, D. Preliminary study of the paleoearthquake on Lenglongling Fault. Res. Act. Fault. 2001, 8, 64–74. (In Chinese) [Google Scholar]
  32. Hu, C.; Yang, P.; Li, Z.; Huang, S.; Zhao, Y.; Chen, D.; Xiong, R.; Chen, Q. Seismogenic mechanism of the 21 Jaunary 2016 Menyuan, Qinghai Ms6.4 earthquake. Chinese. J. Geophys. 2016, 59, 1637. (In Chinese) [Google Scholar]
  33. Jiang, W.; Li, Y.; Tian, Y.; Han, Z.; Zhang, J. Research of seismogenic structure of the Menyuan Ms6.4earthquake on January 21, 2016 in Lenglongling aera of NE Tibetan plateau. Seismol. Geol. 2017, 39, 536–549. (In Chinese) [Google Scholar]
  34. Guo, P.; Han, Z.; An, Y.; Jiang, W.; Mao, Z.; Feng, W. Activity of the Lenglongling fault system and seismotectonics of the 2016 Ms6.4 Menyuan earthquake. Sci. China Earth Sci. 2017, 60, 925–942. (In Chinese) [Google Scholar] [CrossRef]
  35. He, X.; Zhang, Y.; Shen, X.; Zheng, W.; Zhang, P.; Zhang, D. Examination of the Repeatability of Two Ms6.4 Menyuan Earthquakes in Qilian-Haiyuan Fault Zone (NE Tibetan Plateau) Based on Source Parameters. Phys. Earth Planet. Inter. 2020, 299, 106408. [Google Scholar] [CrossRef]
  36. Hu, X.; Cao, X.; Li, T.; Mao, J.; Zhang, J.; He, X.; Zhang, Y.; Pan, B. Late Quaternary Fault Slip Rate Within the Qilian Orogen, Insight Into the Deformation Kinematics for the NE Tibetan Plateau. Tectonics 2021, 40, e2020TC006586. [Google Scholar] [CrossRef]
  37. Liu, J.; Liu, B.; Yuan, D. The late Quaternary Activity Characteristics of the Sunan Fault and a Preliminary Study on Paleoearthquakes; Research on Active Faults in China; Earthquake Press: Beijing, China, 1994; pp. 36–41. [Google Scholar]
  38. Lucieer, A.; Jong, S.M.D.; Turner, D. Mapping landslide displacements using Structure from Motion (SfM) and image correlation of multi-temporal UAV photography. Prog. Phys. Geogr. 2014, 38, 97–116. [Google Scholar] [CrossRef]
  39. Carrera-Hernández, J.J.; Levresse, G.; Lacan, P. Is UAV-SfM surveying ready to replace traditional surveying techniques? Int. J. Remote Sens. 2020, 41, 4820–4837. [Google Scholar] [CrossRef]
  40. Esposito, G.; Salvini, R.; Matano, F.; Sacchi, M.; Danzi, M.; Somma, R.; Troise, C. Multitemporal monitoring of a coastal landslide through SfM-derived point cloud comparison. Photogramm. Rec. 2017, 32, 459–479. [Google Scholar] [CrossRef]
  41. Westoby, M.J.; Brasington, J.; Glasser, N.F.; Hambrey, M.J.; Reynolds, J.M. ‘Structure-from-Motion’ Photogrammetry: A Low-Cost, Effective Tool for Geoscience Applications. Geomorphology 2012, 179, 300–314. [Google Scholar] [CrossRef]
  42. Harwin, S.; Lucieer, A. Assessing the Accuracy of Georeferenced Point Clouds Produced via Multi-View Stereopsis from Unmanned Aerial Vehicle (UAV) Imagery. Remote Sens. 2012, 4, 1573–1599. [Google Scholar] [CrossRef]
  43. Johnson, K.; Nissen, E.; Saripalli, S.; Arrowsmith, J.R.; McGarey, P.; Scharer, K.; Williams, P.; Blisniuk, K. Rapid Mapping of Ultrafine Fault Zone Topography with Structure from Motion. Geosphere 2014, 10, 969–986. [Google Scholar] [CrossRef]
  44. AI, M.; Bi, H.; Zheng, W.; Yin, J.; Yuan, D.; Ren, Z.; Chen, G.; Liu, J. Using unmanned aerial vehicle photogrammetry technology to obtain quantitative parameteras of active tectonics. Seismol. Geol. 2018, 40, 1276–1293. (In Chinese) [Google Scholar]
  45. Liang, Z.; Wei, Z.; Zhuang, Q.; Sun, W.; He, H. Segmentation of surface rupture and offsets characteristics of the Fuyun M 8.0 earthquake based on high-resolution topographic date. Seismol. Geol. 2021, 43, 1507–1523. (In Chinese) [Google Scholar]
  46. Yuan, D.; Liu, X.; Liu, B. Research on the relation between barriers and earthquake rupture in strike-slip active fault zone. South China Earthq. 1998, 18, 35–40. (In Chinese) [Google Scholar]
  47. Huan, W.; Zhang, X.; Song, Z. Structural characteristics of stick-slip motion of Chinese mainland internal strike-slip seismic structure. Acta Seismol. Sin. 1997, 19, 225–234. (In Chinese) [Google Scholar]
  48. Wan, Y.; Huang, S.; Wang, F.; Xu, Y.; Yu, H. Fault geometry and slip characteristics revealed by the 2022 Menyuan earthquake sequence. Chinese J. Geophys. 2023, 66, 2796–2810. (In Chinese) [Google Scholar]
  49. Huang, C.; Zhang, G.; Zhao, D.; Shan, X.; Xie, C.; Tu, H.; Qu, C.; Zhu, C.; Han, N.; Chen, J. Rupture Process of the 2022 Mw6.6 Menyuan, China, Earthquake from Joint Inversion of Accelerogram Data and InSAR Measurements. Remote Sens. 2022, 14, 5104. [Google Scholar] [CrossRef]
  50. Li, Z.; Han, B.; Liu, Z.; Zhang, M.; Yu, C.; Chen, B.; Liu, H.; Du, J.; Zhang, S.; Zhu, W.; et al. Source Parameters and Slip Distributions of the 2016 and 2022 Menyuan, Qinghai Earthquakes Constrained by InSAR Observations. Geomat. Inf. Sci. Wuhan Univ. 2022, 47, 887–897. [Google Scholar]
  51. Liu, J.; Hu, J.; Li, Z.; Ma, Z.; Shi, J.; Xu, W.; Sun, Q. Three-Dimensional Surface Displacements of the 8 January 2022 Mw6.7 Menyuan Earthquake, China from Sentinel-1 and ALOS-2 SAR Observations. Remote Sens. 2022, 14, 1404. [Google Scholar] [CrossRef]
  52. Sun, A.; Gao, Y.; Zhao, G.; Ren, C.; Liang, S. Seismic structure and b-value in the focal area of the 8th January 2022 Menyuan, Qinghai Ms6.9earthquake. Chin. J. Geophys. 2022, 65, 1175–1183. (In Chinese) [Google Scholar]
  53. Zhao, L.; Sun, X.; Zhan, Y.; Yang, H.; Wang, Q.; Hao, M.; Liu, X. The seismogenic model of the Menyuan Ms6.9earthquake on January 8, 2022, Qinghai Province and segmented extensional characteristics of the Lenglongling fault. Chin. J. Geophys. 2022, 65, 1536–1546. (In Chinese) [Google Scholar]
  54. Chen, L.; Wang, H.; Ran, Y.; Sun, X.; Su, G.; Wang, J.; Tan, X.; Li, Z.; Zhang, X. The MS7.1 Yushu Earthquake Surface Rupture and Large Historical Earthquakes on the Garzê-Yushu Fault. Chin. Sci. Bull. 2010, 55, 3504–3509. [Google Scholar] [CrossRef]
Figure 1. Distribution map of active faults and strong earthquakes. (a) Black arrows indicate the direction of the block movement. ATF: Altyn Tagh fault; KLF: Kunlun fault; QHF: Qilian–Haiyuan fault. (b) HYF: Haiyuan fault; LHS-MMSF: Laohushan–Maomaoshan fault; JQHF: Jinqianghe fault; LLLF: Lenglongling fault; TLSF: Tuolaishan fault; HLHF: Halahu fault; NTLSF: North Tuolaishan fault; SN-QLF: Sunan–Qilian fault; ML-DMYF: Minle-Damaying fault; HC-STF: Huangcheng-Shuangta fault; XS-TJSF: Xiangshan-–Tianjiangshan fault; HXB-SDSF: Hexibao–Sidaoshan fault; YMSF: Yumushan fault; FDM-HYZF: Fodongmiao–Hongyazhi fault; CMF: Changma fault; RYSF: Riyueshan fault; ELSF: Elashan fault. The basemap is based on 30 m DEM.
Remotesensing 15 04375 g001
Figure 2. (a,b) Map of active faults, seismic surface rupture, and aftershock distribution [28]. QHF: Qilian–Haiyuan fault; LLLF: Lenglongling fault; TLSF: Tuolaishan fault; SN-QLF: Sunan–Qilian fault; NTLSF: North Tuolaishan fault; ML-DMYF: Minle–Damaying fault; NMYF: North Menyuan fault. The basemap is based on 30 m DEM.
Remotesensing 15 04375 g002
Figure 3. Geomorphological map of the main active fault. (a) Scarp (~2 m) of Tuolaishan fault in Cairituhe; (b) Scarp (~1–2 m) of T1 about Tuolaishan fault in Xiuhelong; (c) Scarp (~5–6) of T2 about North Tuolaishan fault in Yaodonggou; (d) Scarp (~2–3 m) of the Sunan–Qilian fault in Rixu.
Remotesensing 15 04375 g003
Figure 4. Appearance of CW-15 VTOL fixed-wing UAV.
Remotesensing 15 04375 g004
Figure 5. Distribution map of surface ruptures. (a) The distribution map of surface ruptures; (b) The surface rupture of S1; (c) The surface rupture of S2; (d) The surface rupture of S3; (e) The surface ruptures of S4 and some S1.The legends in (be) are consistent with (a). The base map is based on a drone aerial survey and GF-7 imagery.
Remotesensing 15 04375 g005
Figure 6. Characteristics of typical surface rupture in S1. (a) Typical en-echelon crack to the west of Aobaogou; (b) Surface rupture zone map on the south side of Keshugou; (c) Left-handed animal footprints of 0.98 ± 0.05 m; (d) Tensional crack.
Remotesensing 15 04375 g006
Figure 7. Characteristics of typical surface rupture in S2. (a) Typical rupture zone; (b) Left-handed left step area; (c) Ruts with a left offset of 1.1 ± 0.04 m and a vertical offset of 0.4 ± 0.02 m; (d) Left-handed offset of 0.8 ± 0.04 m about the ice surface; (e) Mole tracks; (f) Left-handed offset, of 0.9 ± 0.06 m about the ice surface.
Remotesensing 15 04375 g007
Figure 8. Characteristics of typical surface rupture in S3. (a) Surface rupture interpretation map of Daxigou; (b) Left-handed offset of 0.49 ± 0.06 m; (c) Left-handed step region and its interpretation map; (d) Crack; (e) Shear crack with a vertical offset of 0.15 ± 0.02 m.
Remotesensing 15 04375 g008
Figure 9. Characteristics of typical surface rupture in S4. (a) Shear crack with a vertical offset of 0.31 ± 0.03 m; (b) Left-handed offset of 0.2 ± 0.02 m; (c) Shear crack with a vertical offset of 0.13 ± 0.02 m; (d) Tensional crack.
Remotesensing 15 04375 g009
Figure 10. Map of the distribution of surface coseismic offsets. The fault is same as Figure 2; The basemap is based on 30 m DEM.
Remotesensing 15 04375 g010
Figure 11. Map of maximum offset position. (a) Plane distribution of maximum offset and its surrounding offsets (yellow dotted box shows the offset measurement location; yellow dotted lines (①, ②, ③, ④, ⑤) are the offset measurement terrain profile location and the survey line; the red dotted line (A, B) shows the location of the terrain profile along the fault offset measurement point). (b) Maximum offset with 2.6 ± 0.3 m. (c) Topographic distribution of obtained offset position. (d) The displacement marker fence topographic profile and the obtained displacement location. S: south; N: north. (e) Terrain profile line along rupture offset measurement points.
Remotesensing 15 04375 g011
Figure 12. Trend change map and pattern map of the surface rupture zone.(a): Distribution and trend map of surface rupture zones; (b): Fault distribution and seismicrupture mode map; The black box indicates the crack trend statistical area; the blue rosette plot shows the statistical crack trend.
Remotesensing 15 04375 g012
Table 1. Parameters of the 2022 Menyuan earthquake.
InstitutionLocationDepth (km)MagnitudeSection 1Section 2
Longitude
(°)
Latitude (°)Strike (°)Dip (°)Rake (°)Strike (°)Dip (°)Rake (°)
CENC101.2637.7710Ms 6.9
USGS101.29037.82813Mw 6.613751781048815
GCMT101.3137.8014.8Mw 6.71048211489172
GFZ101.3237.7815Mw 6.6285821619374172
CEA-IGP101.2637.7710Mw 6.7192°69°172°284°82°21°
IPGP101.27537.81115Mw 6.728489−21418−179
CENC: China Earthquake Networks Center; USGS: U.S. Geological Survey; GCMT: Global Centroid Moment Tensor Project; GFZ: German Research Center for Geoscience; CEA-IGP: Institute of Geophysics, China Earthquake Administration; IPGP: Institut de Physique du Globe de Paris.
Table 2. Parameters of the Menyuan earthquake surface rupture from different scholars.
SourceLength of RuptureNumber of RupturesStep Maximum Offset
Pan et al. [9]27 km23 km3.7 m
Han et al. [10]30 km32 km3 ± 0.2 m
Liang et al. [11]29.5 km2 2.77 m
Yuan et al. [12]31 km21 km2.6 ± 0.3 m
Niu et al. [13]31.7 km5 3.5 ± 0.3 m
This article36.6 km (including crack zones and secondary ruptures)31 km2.6 ± 0.3 m
Disclaimer/Publisher’s Note: The statements, opinions and data contained in all publications are solely those of the individual author(s) and contributor(s) and not of MDPI and/or the editor(s). MDPI and/or the editor(s) disclaim responsibility for any injury to people or property resulting from any ideas, methods, instructions or products referred to in the content.

