Article

Analysis of Aerosol Optical Depth and Forward Scattering in an Ultraviolet Band Based on Sky Radiometer Measurements

1
School of Mechanical and Precision Instrument Engineering, Xi’an University of Technology, Xi’an 710048, China
2
Key Laboratory for Semi-Arid Climate Change of the Ministry of Education, College of Atmospheric Sciences, Lanzhou University, Lanzhou 730000, China
*
Author to whom correspondence should be addressed.
Remote Sens. 2023, 15(17), 4342; https://doi.org/10.3390/rs15174342
Submission received: 3 August 2023 / Revised: 29 August 2023 / Accepted: 30 August 2023 / Published: 3 September 2023

Abstract

:
The sky-radiometer/sun-photometer is the most widely used instrument for obtaining aerosol optical depth (AOD) or aerosol optical properties worldwide. Due to the existence of field of view (FOV, 1°), the radiation received by the sky-radiometer includes the forward scattering in addition to direct solar irradiance. This leads to more diffuse light errors of retrieved AODs, especially for shorter wavelength and heavily polluted weather conditions. Using simulation data of three typical aerosol particles (dust, soot, water-soluble), we first verified the accuracy of the Monte Carlo method for calculating the forward scattering effect. Based on the sky-radiometer data collected in Xi’an (2015–2020) where heavy pollution weather is common, the relative errors and correction factors of the AOD were obtained under different conditions, including various short wavelengths (≤400 nm), solar zenith angles (SZAs) and AODs. Our analysis indicates the close dependence of AOD correction factors on wavelength, SZA, AOD and the optical properties of aerosol particles. The mean relative error in Xi’an increases with the decrease of wavelength (~16.1% at 315 nm) and decreases first and then increases with the increase of the SZA. The relative errors caused by forward scattering can exceed 10% when the AOD is greater than 1 and 25% when the AOD is larger than 2 in the ultraviolet (UV) band. The errors with a wavelength greater than 400 nm and an AOD below 1.0 can be within 5%, which can be ignored. The correlation coefficients of AODs before and after a correction from 315 nm to 400 nm are greater than 0.96, which basically increase with the increase of the wavelength. This indicates that the significance of the forward scattering effect in the Xi’an area with heavy pollution cannot be ignored for short wavelengths. However, such effect is negligible at the longer wavelengths and lower AODs (<1.0) of a sky-radiometer.

1. Introduction

As an important part of the complex earth–atmosphere system, atmospheric aerosols primarily come from anthropogenic sources (e.g., black carbon and soot aerosols) and natural sources (e.g., dust and marine aerosols) [1,2], which have a critical impact on the radiation balance [3] and the physico-chemical processes in the atmosphere [4]. With rapid economic development in recent years, numerous atmospheric pollutants emitted from human activities have caused a gradual deterioration of the atmospheric environment, more frequent hazy weather and more respiratory diseases [5,6,7,8,9,10]. Xi’an, a city influenced by heavy industrial and dust source, is located in northwest China where the aerosol load and component are heavy, are chemically complex and have huge spatial and temporal distribution variations [11,12,13,14,15,16,17]. Therefore, it is of great significance to accurately evaluate the physical and optical properties of aerosols in Xi’an for studying climate change and improving local people’s livelihood.
In recent years, scientists and some atmospheric research organizations around the world have begun to give great attention to the characteristics of ultraviolet (UV) radiation and aerosol optical depth (AOD) and have conducted long-term observations and studies [7,18,19,20]. Research has shown that UV radiation occupies an important position in atmospheric radiation research [21]. It not only participates in various gas-phase reactions in the atmosphere [22] but also has important effects on the growth of ecosystems and human health [23]. Moreover, the aerosol loading directly affects UV radiation reaching the ground [24,25]. So, the atmospheric AOD at the UV band (UV AOD) is an important parameter that describes the aerosol impact on UV radiation [26]. In a sense, obtaining accurate UV band aerosol optical parameters (AOPs) is helpful for studying the climatic effects of aerosols and atmospheric chemical reaction.
At present, the sky-radiometer/sun-photometer, the most important passive ground-based measurement instrument for detecting the AOPs, is applied to observe solar radiation. Nevertheless, the radiation entering the instrument includes some forward scattering in addition to direct solar radiation due to the inherent field of view (FOV) of the instrument, resulting in an increase in the amount of solar radiation entering the instrument, and, thus, the AOD obtained is smaller than the actual value (especially for UV AOD); the larger the FOV, the greater the received scattered radiation. Nonetheless, the inversion is often performed by assuming that only a single scattering process occurs in order to obtain the AOPs quickly and easily, which is only applicable to the inversion of AOPs under conditions without heavily polluted weather and longer wavelengths [27]. Some earlier studies have considered the effect of forward scattering on the AOD. For instance, Chen et al. [28] demonstrated that the effect of multiple scattering on the AOD must be considered when the optical thickness of aerosols is greater than 0.1. By simulating dust aerosols with spherical and spherical particle shapes, Ge et al. [29] indicated that the error caused by forward scattering was up to 10%. Zhao et al. [27] reported the large effect of forward scattering on the AOD and proposed a correction algorithm. Sinyuk et al. [30] analyzed level 2.0 aerosol data from the Aerosol Robotic Network (AERONET)and calculated the forward scattering effect. By implementing the evaluation and correction of forward scattering on the AOD based on AERONET aerosol data and aerosol size distribution (ASD). Russell et al. [31] indicated the possibility of ignoring the error of less than 1% for the correction for sun photometers with half-field angles less than 1°. However, the correction of the AOD is required for other cases. Sun et al. [32] simulated natural dust particles and analyzed the forward scattering characteristics of dust aerosols using the vector accumulation method and showed that the forward scattering of dust particles of any shape would produce large errors.
Despite the numerous studies conducted on aerosol forward scattering, there were great uncertainties, and no estimates were reported fora UV band with heavily polluted weather. Here we present a study on the effect of forward scattering on UV AOD (315 nm, 340 nm, 380 nm, 400 nm) by combining the Monte Carlo model and log-normal distribution for three typical aerosols as well as realistic AOPs based on the sky-radiometer retrievals during 2015 and 2020 in Xi’an in this manuscript. The relative errors caused by forward scattering on the UV AOD inversion are examined and quantified. Meanwhile, those situations with different AOD, solar zenith angle (SZA) and wavelengths in the variability of AOD retrieved by sky-radiometer are also assessed and analyzed.

2. Materials and Methods

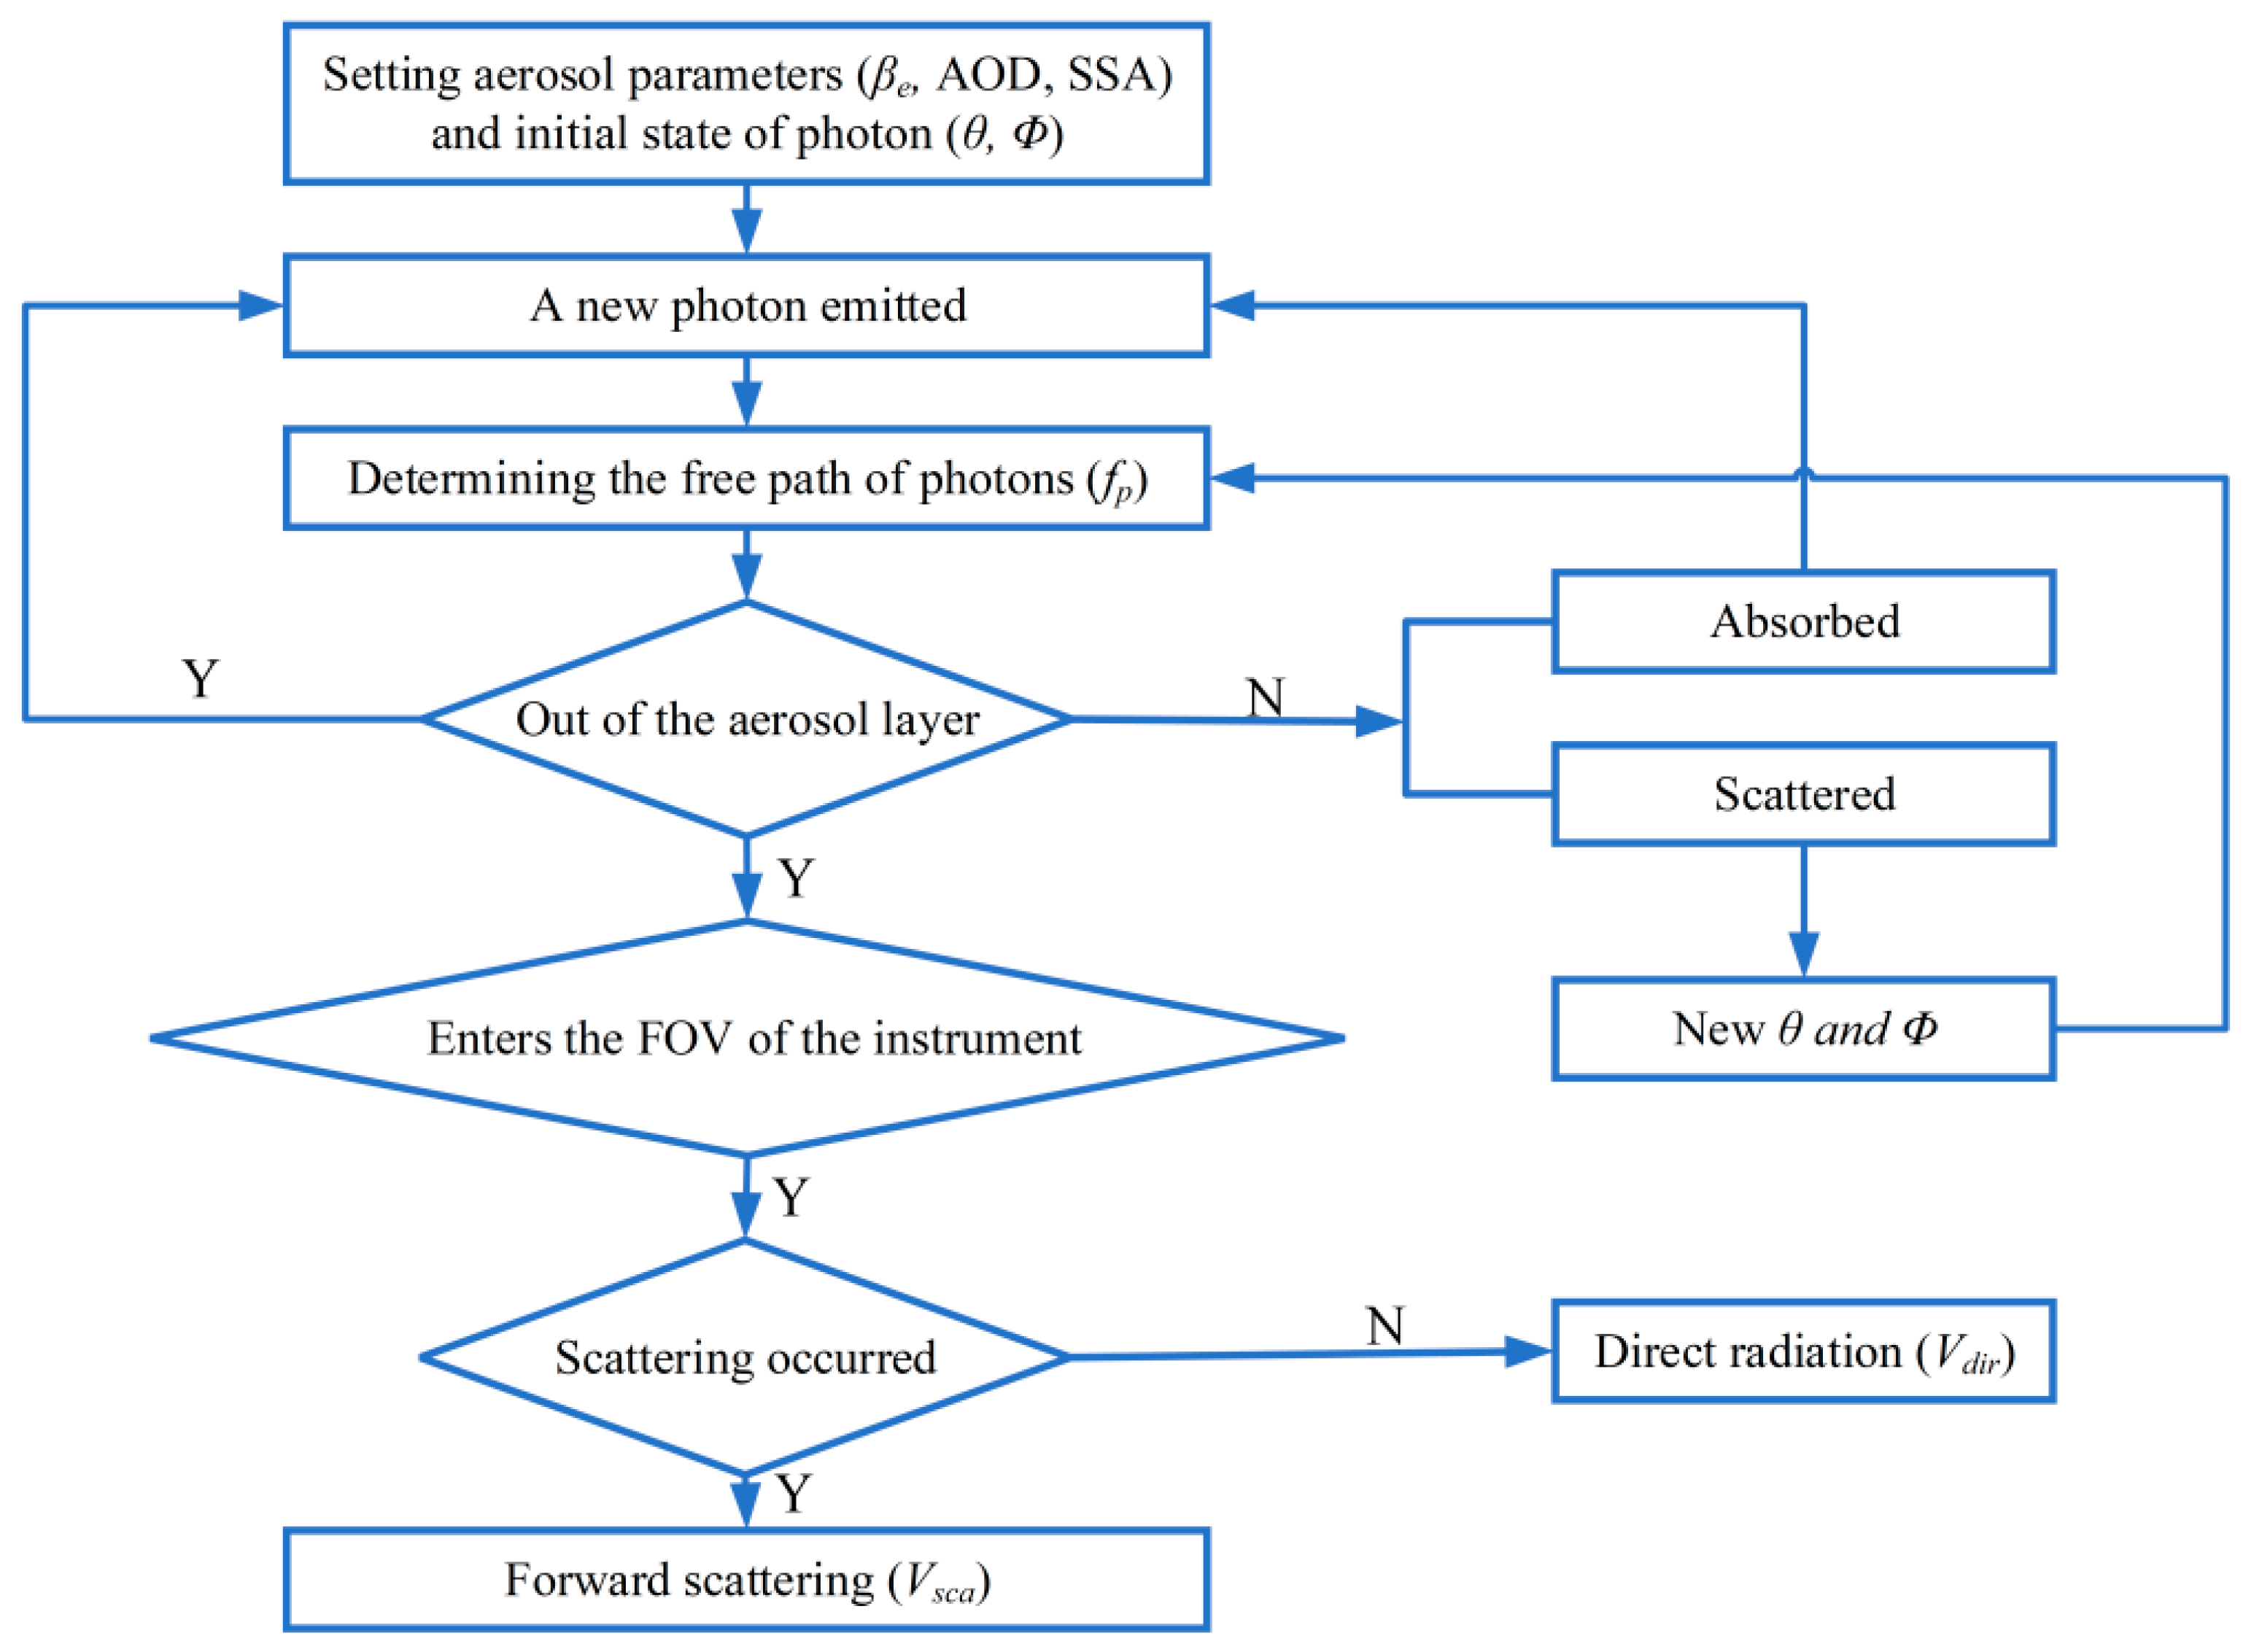
2.1. Monte Carlo Simulation

Kinne et al. (1997) [33] showed that forward scattered radiation may enter the FOV of the instrument when the FOV of the observation instrument is larger than that of the sun. The half-FOV sky-radiometer instrument commonly used in this study to obtain AOPs is 0.5° [34], which exceeds that of the sun (0.25°). Thus, the measured radiation by the instrument includes not only the direct solar radiation but also forward scattered radiation captured into the FOV of the instrument, leading to an AOD that is smaller than the actual value. Therefore, the transfer processes of solar radiation caused by aerosol particles in the atmosphere are simulated with the Monte Carlo radiative transfer model to determine the effect of forward scattering on the inversion of sky-radiometer UV AOD in this study. So, the forward scattering is defined as the scattering radiation entering FOV of the instrument [27]. In more detail, we converted the transport of solar radiation into the transport processes of photons. The flow chat of Monte Carlo algorithm is given in Figure 1, and the key steps are as follows:
(1)
The initial position (x = 0, y = 0, z = 0) and initial state (SZA (θ), azimuth angle(ϕ)) of the simulated photon and AOPs, including the mean volume extinction coefficient (βe), single scattering albedo (SSA) and AOD, were given. The initial orientations of the photon are given by the following:
μ x = sin ( θ ) cos ( ϕ ) μ y = sin ( θ ) sin ( ϕ ) μ z = cos ( θ )
(2)
The free path length of photons then is calculated.
A photon is launched into the atmosphere and has a free path length (fp) before interactions with atmospheric aerosol particles. Based on results of Shiobara and Asano [35] and Liou et al. [36], transmission of radiation along a path (fp) is given by the following:
T = exp ( 0 f p β d f p ) = exp ( β e f p ) = exp ( τ ) ,
where β is the volume extinction coefficient along the path. τ represents the optical length given by the integral of β over the path. T is equivalent to the probability of a photon reaching τ and the probability given as a random number (RN1) that takes a value between 0 and 1. Therefore, there is the following equation:
R N 1 = exp ( β e f p ) ,
(3)
The position where photon interacts with aerosol is found.
The position where photons interact with aerosols after free propagation is expressed as follows:
x = x + μ x f p y = y + μ y f p z = z + μ z f p
(4)
Scattering direction of photons can be determined.
When the photon passes through the aerosol layer and reaches the bottom of the atmosphere directly without interacting with the aerosol particles, it will directly enter the FOV of the instrument. If the photon after collisions remains in the layer, the second random number (RN2) is generated, representing the probability of scattering and absorption. If RN2 is greater than the SSA(ω), the photon will be absorbed. Otherwise, the photon will be scattered; the scattering angle (Θ) can be determined from the scattering phase function P(Θ) (representing the probability of photon scattering in all directions), and the third RN3 is randomly generated by computer:
R N 3 = 1 2 cos Θ 1 P ( cos Θ ) d cos Θ
According to Legendre polynomial, P(cos Θ) can be expanded as follows:
P ( cos Θ ) = l = 0 N ϖ l P l ( cos Θ )
where ϖl is the moment of the Legendre polynomial, and N (=255) is the number of expansion terms. N = 255 in this expression is already able to converge the aerosol phase function [37]. ϖl can be expressed according to its orthogonal properties as follows:
ϖ l = 2 l + 1 2 1 1 P ( cos Θ ) P l ( cos Θ ) d cos Θ
By assuming the random orientation of the aerosol particles with an azimuth is uniformly distributed between 0 and 2π after the photon is scattered and is remaining in the aerosol layer, the fourth RN4 is generated to represent the probability of a uniform distribution of the azimuth after scattering:
ϕ = 2 π R N 4
(5)
Termination condition is the final step.
The above process is repeated until the photon is beyond the aerosol boundary (reflected or transmitted) or absorbed, and then a new photon is emitted.

2.2. The Inversionand Relative Error of Sky-Radiometer AOD

The total atmosphere optical thickness (τ(λ)) due to atmosphere attenuation at a certain wavelength follows the Beer Lambert law:
V ( λ ) = V 0 ( λ ) exp [ m τ ( λ ) ] ,
where V(λ) represents the direct solar radiation reaching the surface received by a sky-radiometer at the channel with wavelength λ; V0(λ) represents the direct solar radiation at the top of the atmosphere (TOA); m denotes the airmass as a function of SZA.
Equation (9) can be presented as follows:
ln V ( λ ) = ln V 0 ( λ ) m τ ( λ ) ,
The parameters, such as V(λ) and m, are known for a certain site and instrument. So τ(λ) can be calculated only by knowing V0(λ), which is obtained generally using the traditional [38] and improved [39] Langley plot method.
τ a ( λ ) = τ ( λ ) τ R ( λ ) τ a b s ( λ ) ,
Therefore, AOD (τa(λ)) can be obtained by subtracting Rayleigh scattering optical thickness (τR(λ)) and molecular absorption optical thickness (τabs(λ)) from total atmosphere optical thickness, that is, original AOD. It is worth noting that although the optical thickness caused by atmospheric molecules in the UV band has a large value [40], the forward scattering effect can be ignored due to the small forward scattering caused by Rayleigh scattering, that is, Rayleigh scattering almost does not affect the correction of scattered radiation measured by the sky-radiometer [31]. Therefore, only the forward scattering effect of aerosol is considered in this study, while atmospheric molecules are not considered.
According to the photon transport processes described in Section 2.1 simulated with the Monte Carlo model, the forward scattering effect and relative errors (ε) on UV AOD can be calculated based on Equations (9)–(11), that is, corrected AOD can be obtained. In more detail, the initial photon number represents the solar radiation at the TOA(N0), while the photon number without scattering and absorption represents the direct solar irradiation transmitted into the FOV of the instrument (Ndir). The photon number with consideration of scattering and entering the FOV of the instrument represents the forward scattered radiation (Nsca). The relative error ε(λ) of the forward scattered radiation on AOD retrievals can be obtained, which is defined as follows:
ε ( λ ) = 1 ln [ N 0 ( λ ) / N d i r + s c a ( λ ) ] ln [ N 0 ( λ ) / N d i r ( λ ) ]

3. Results

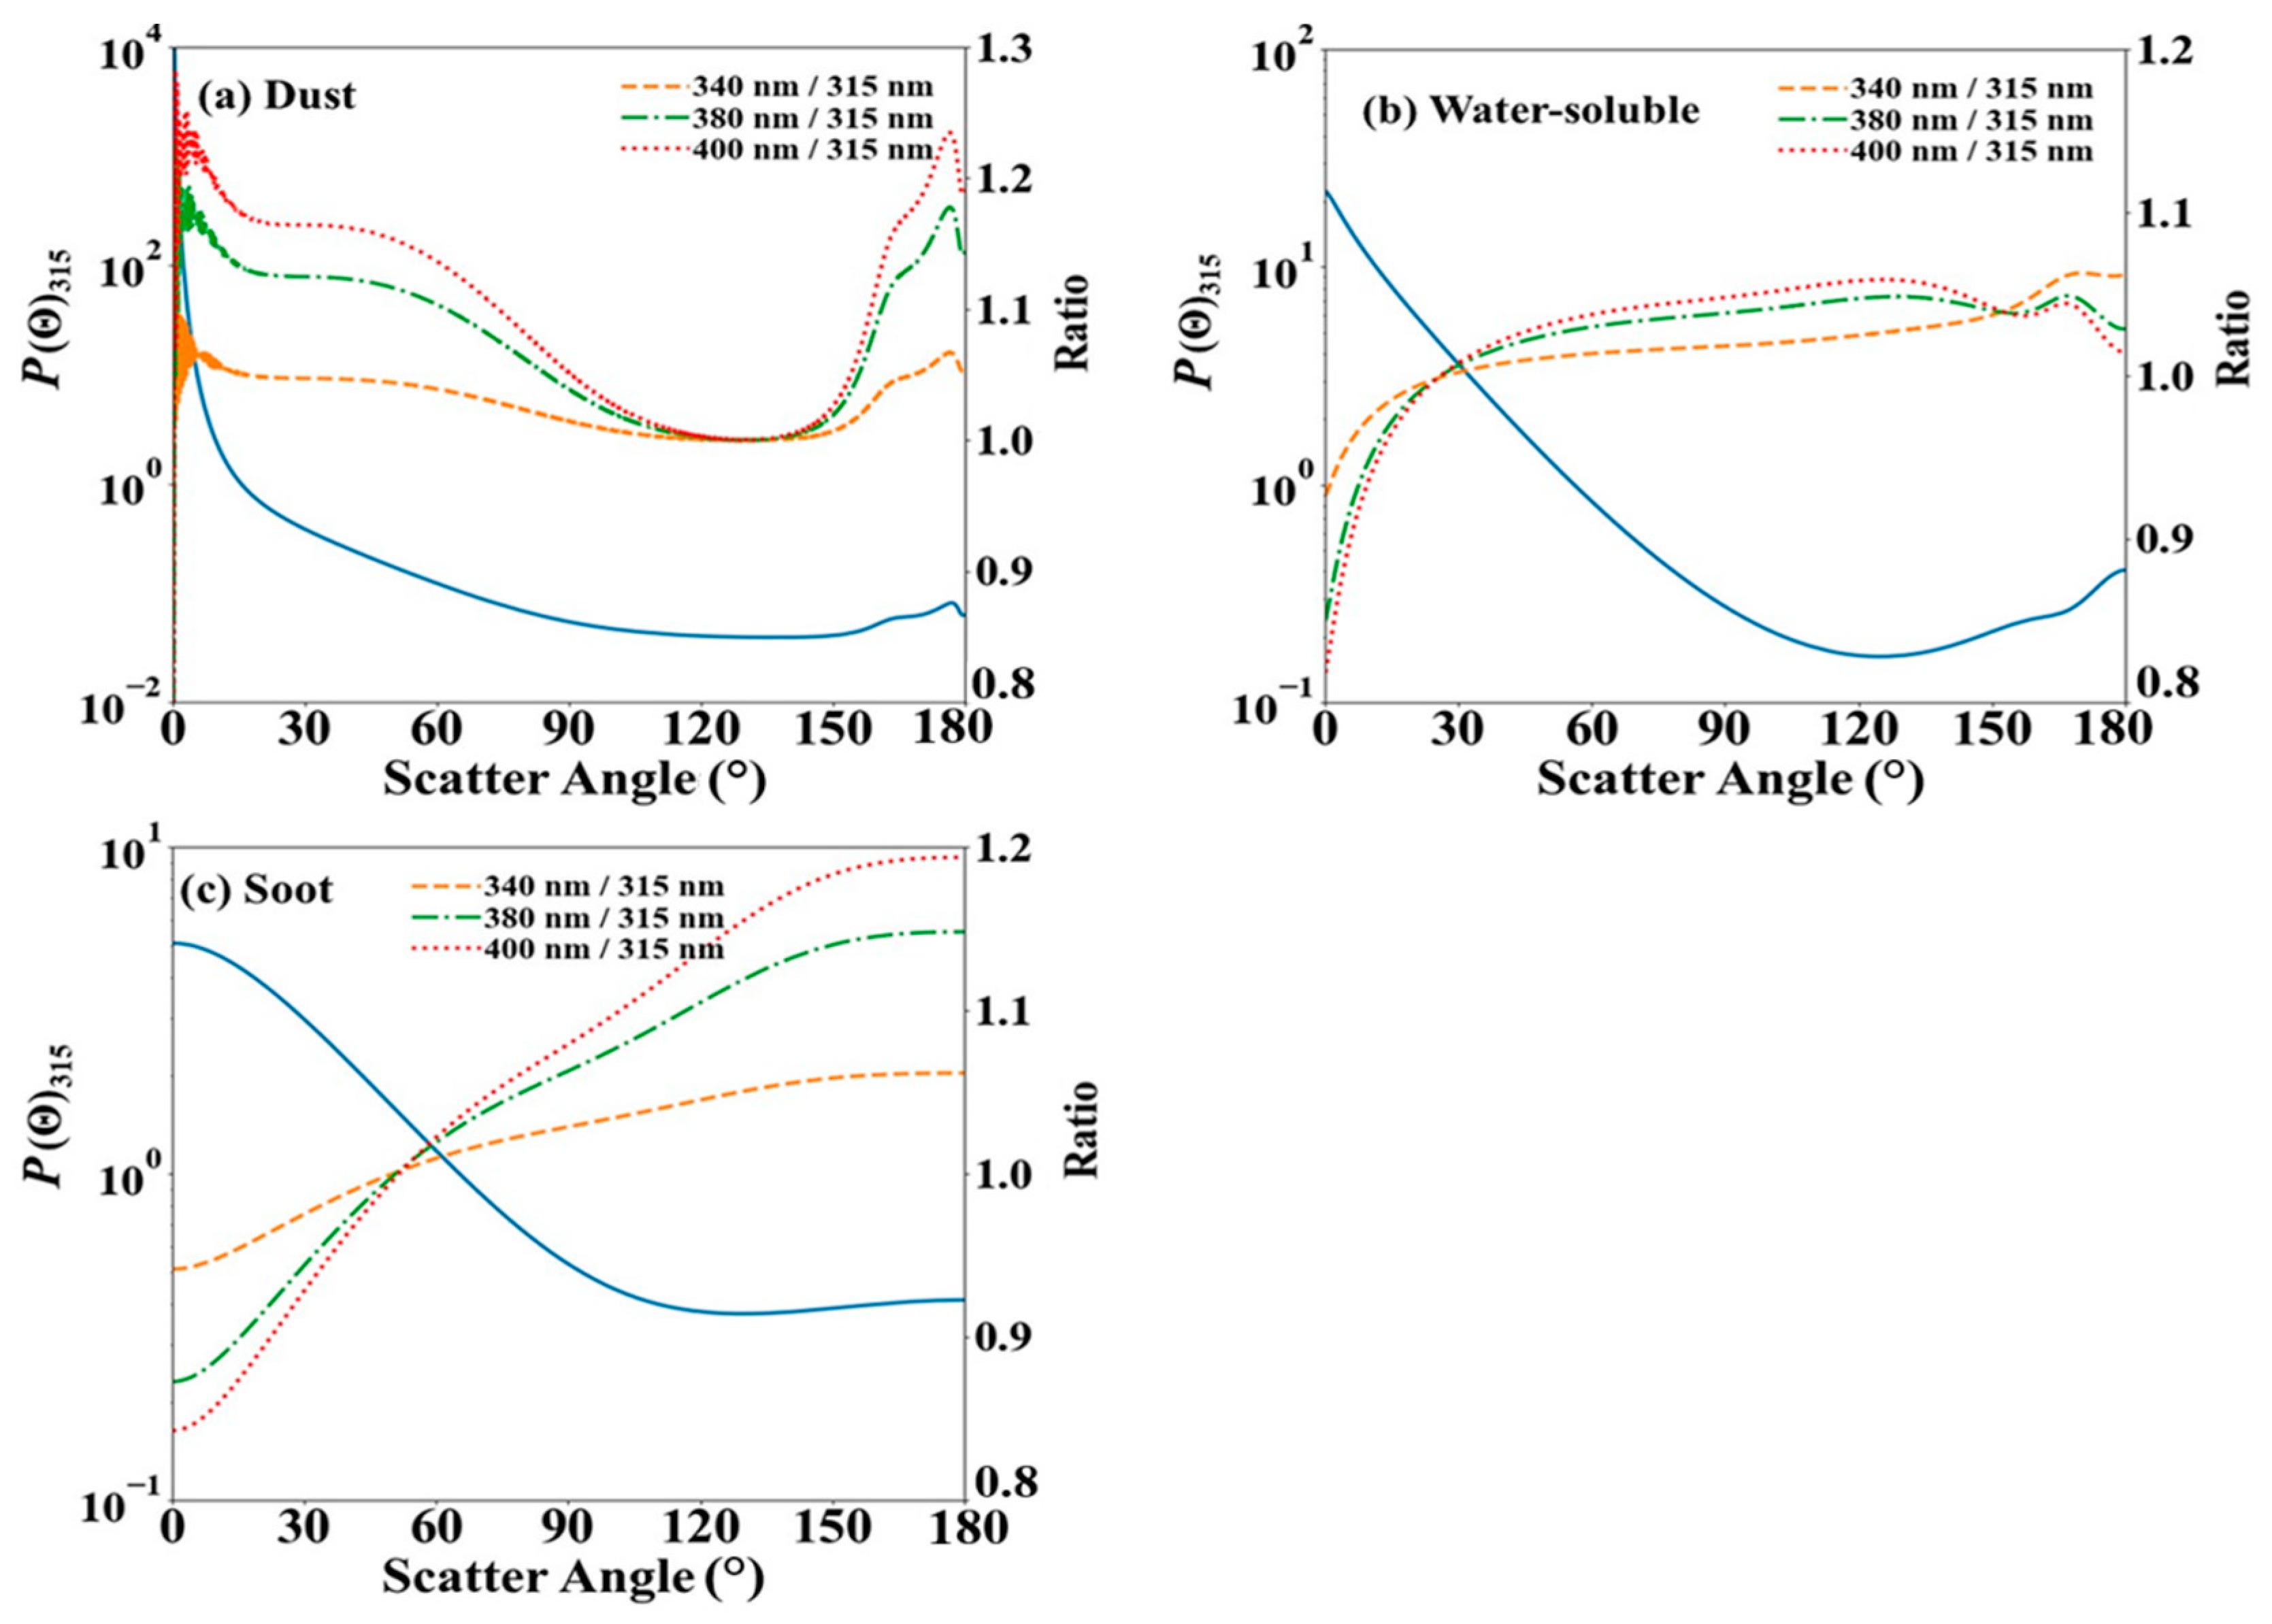
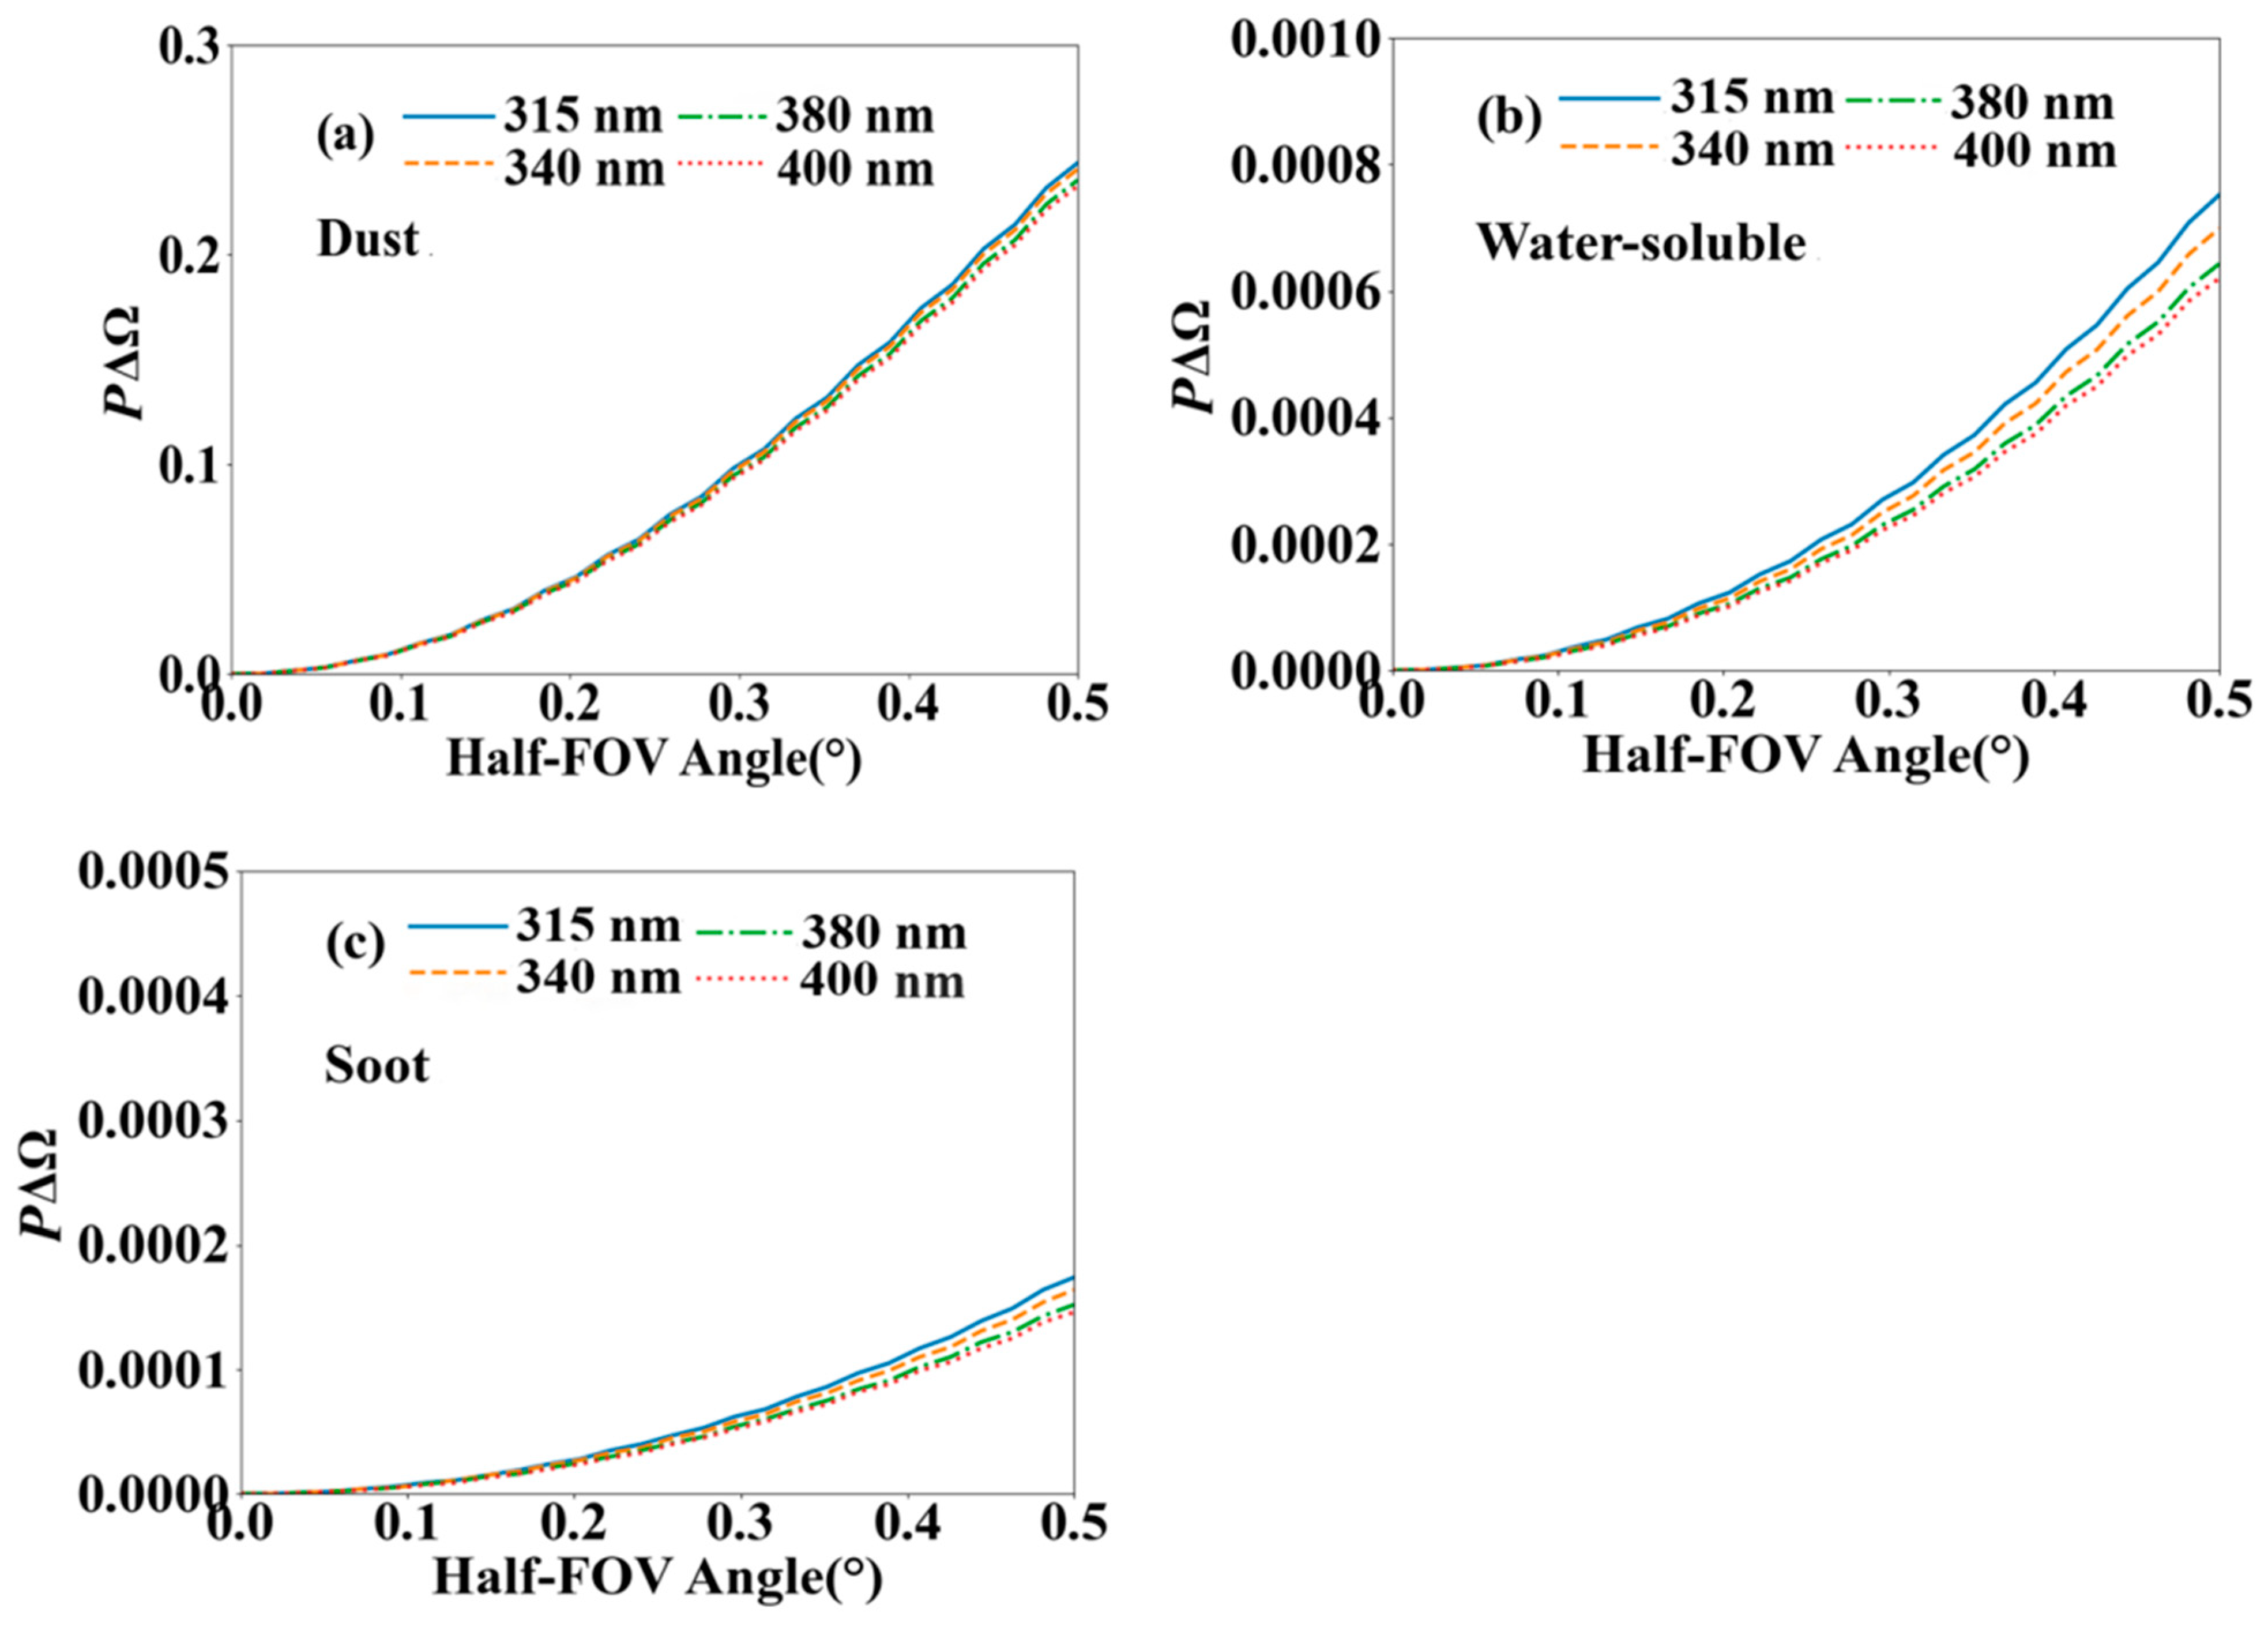
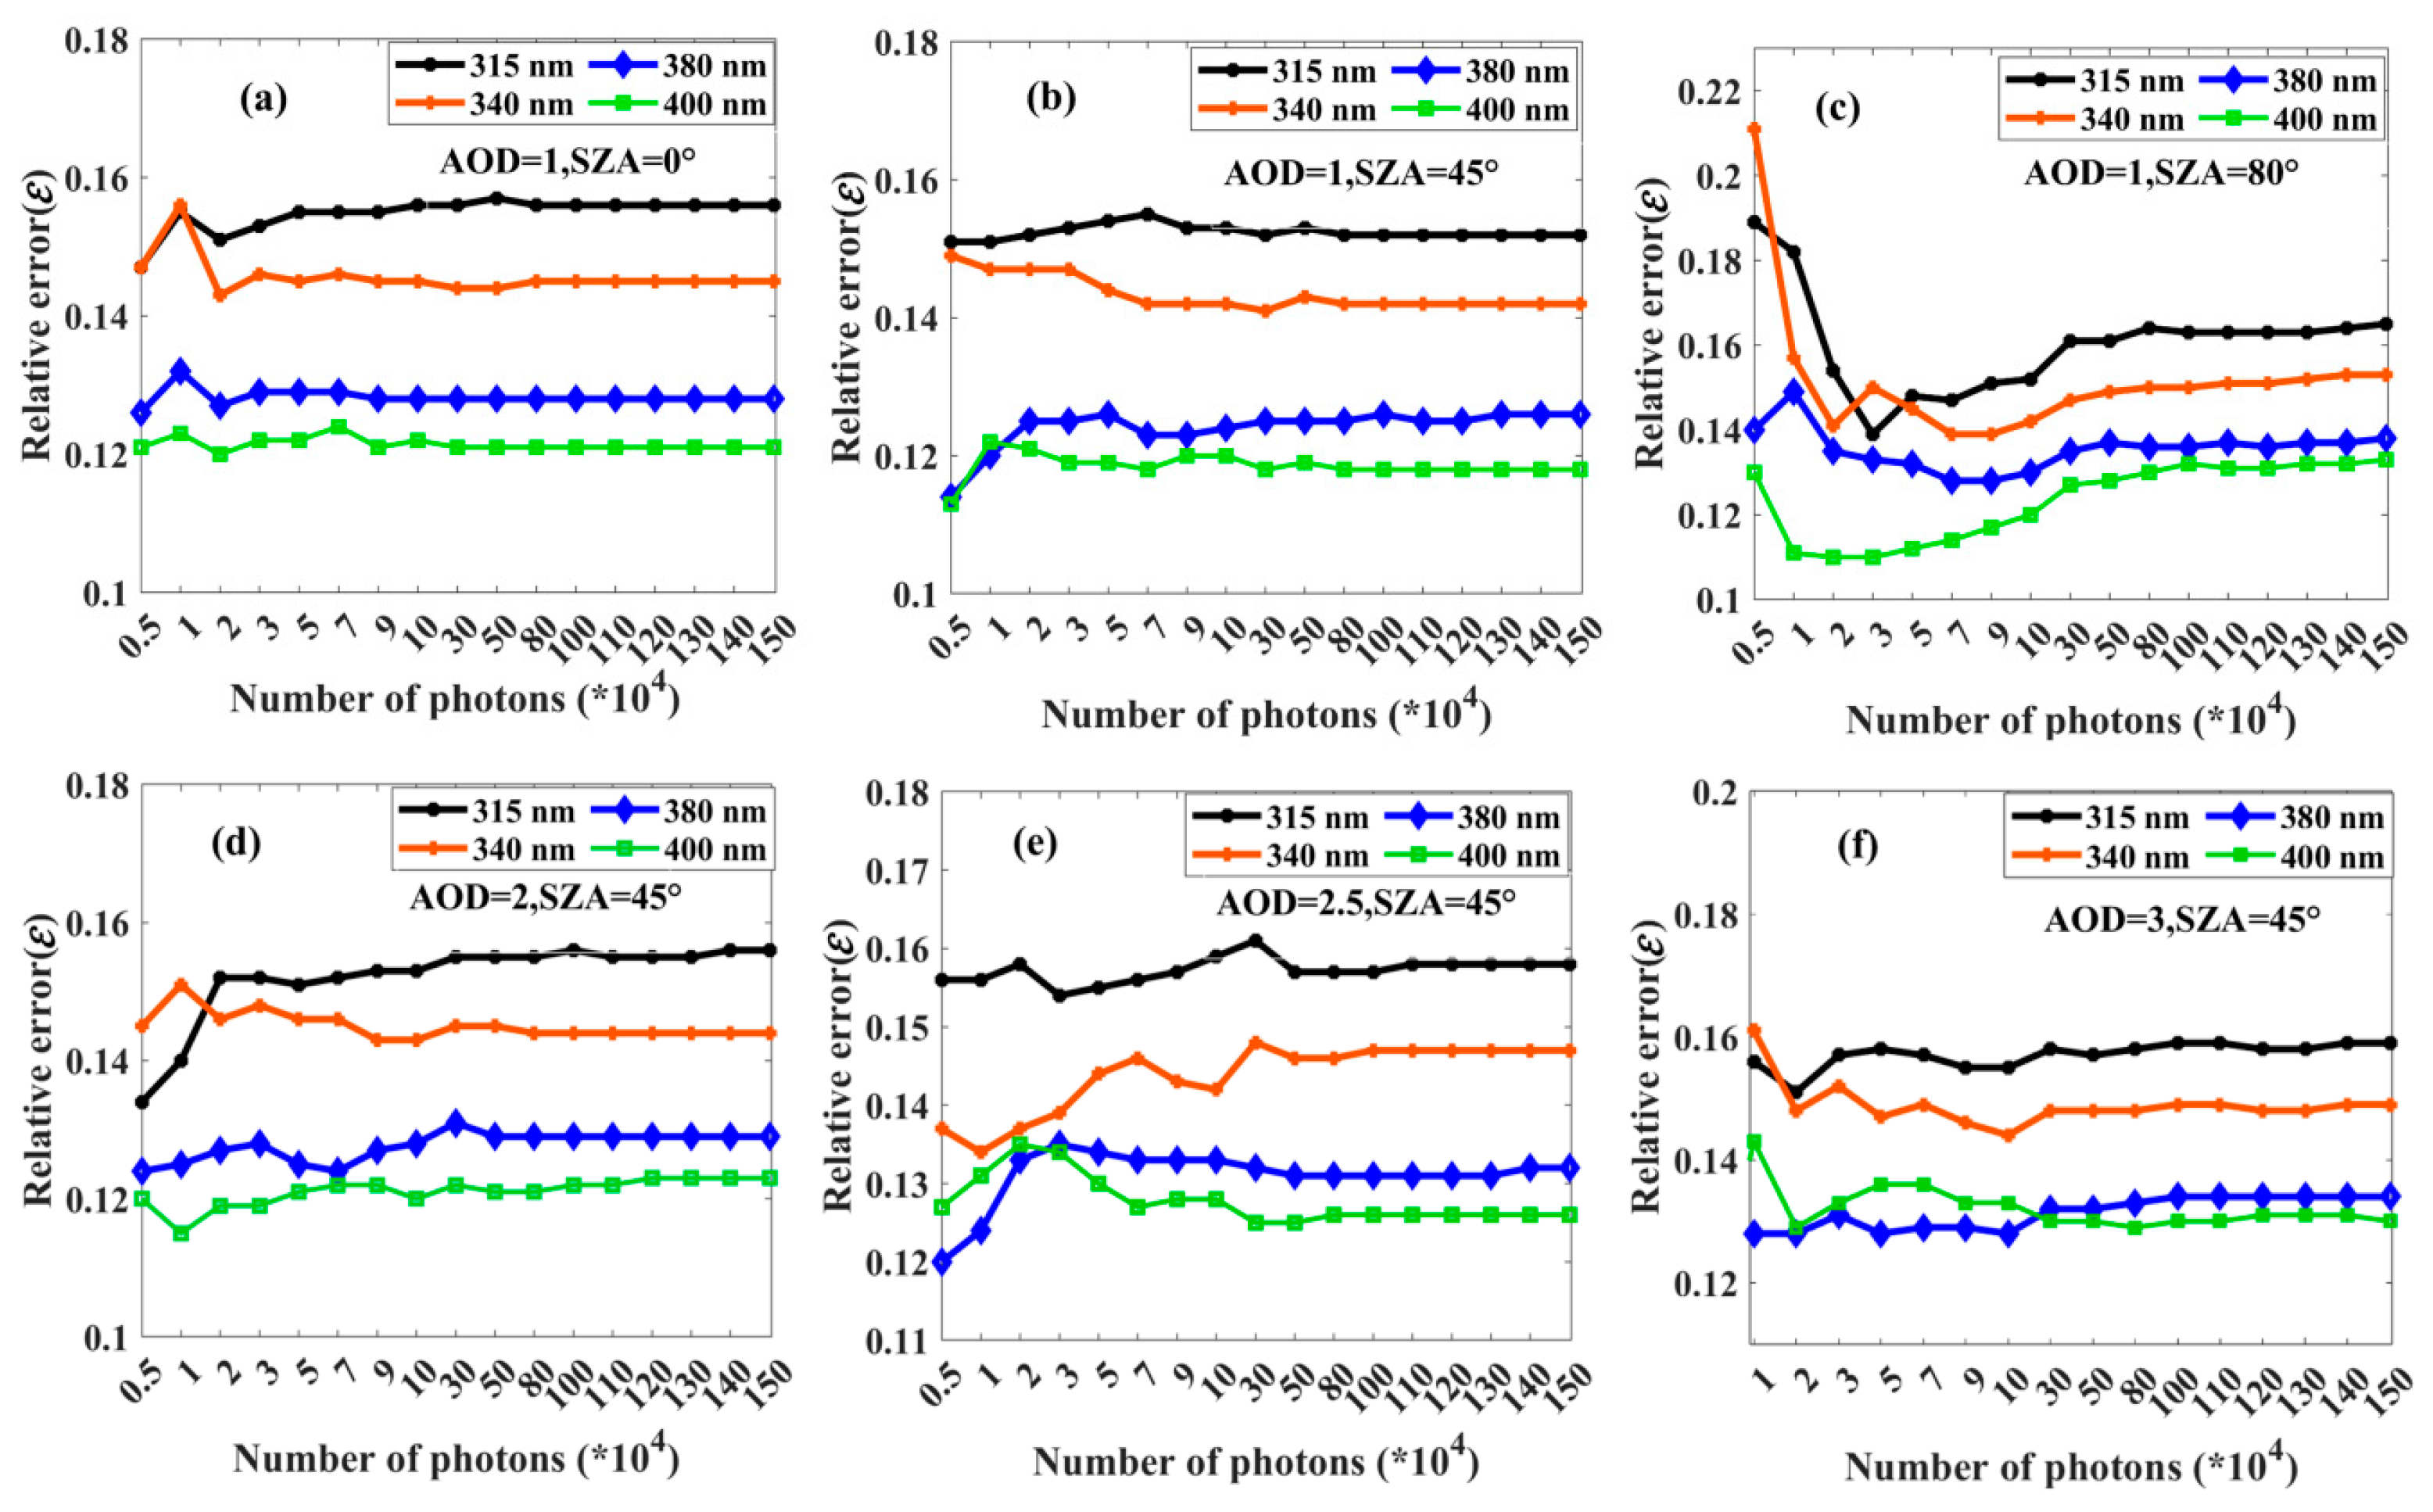
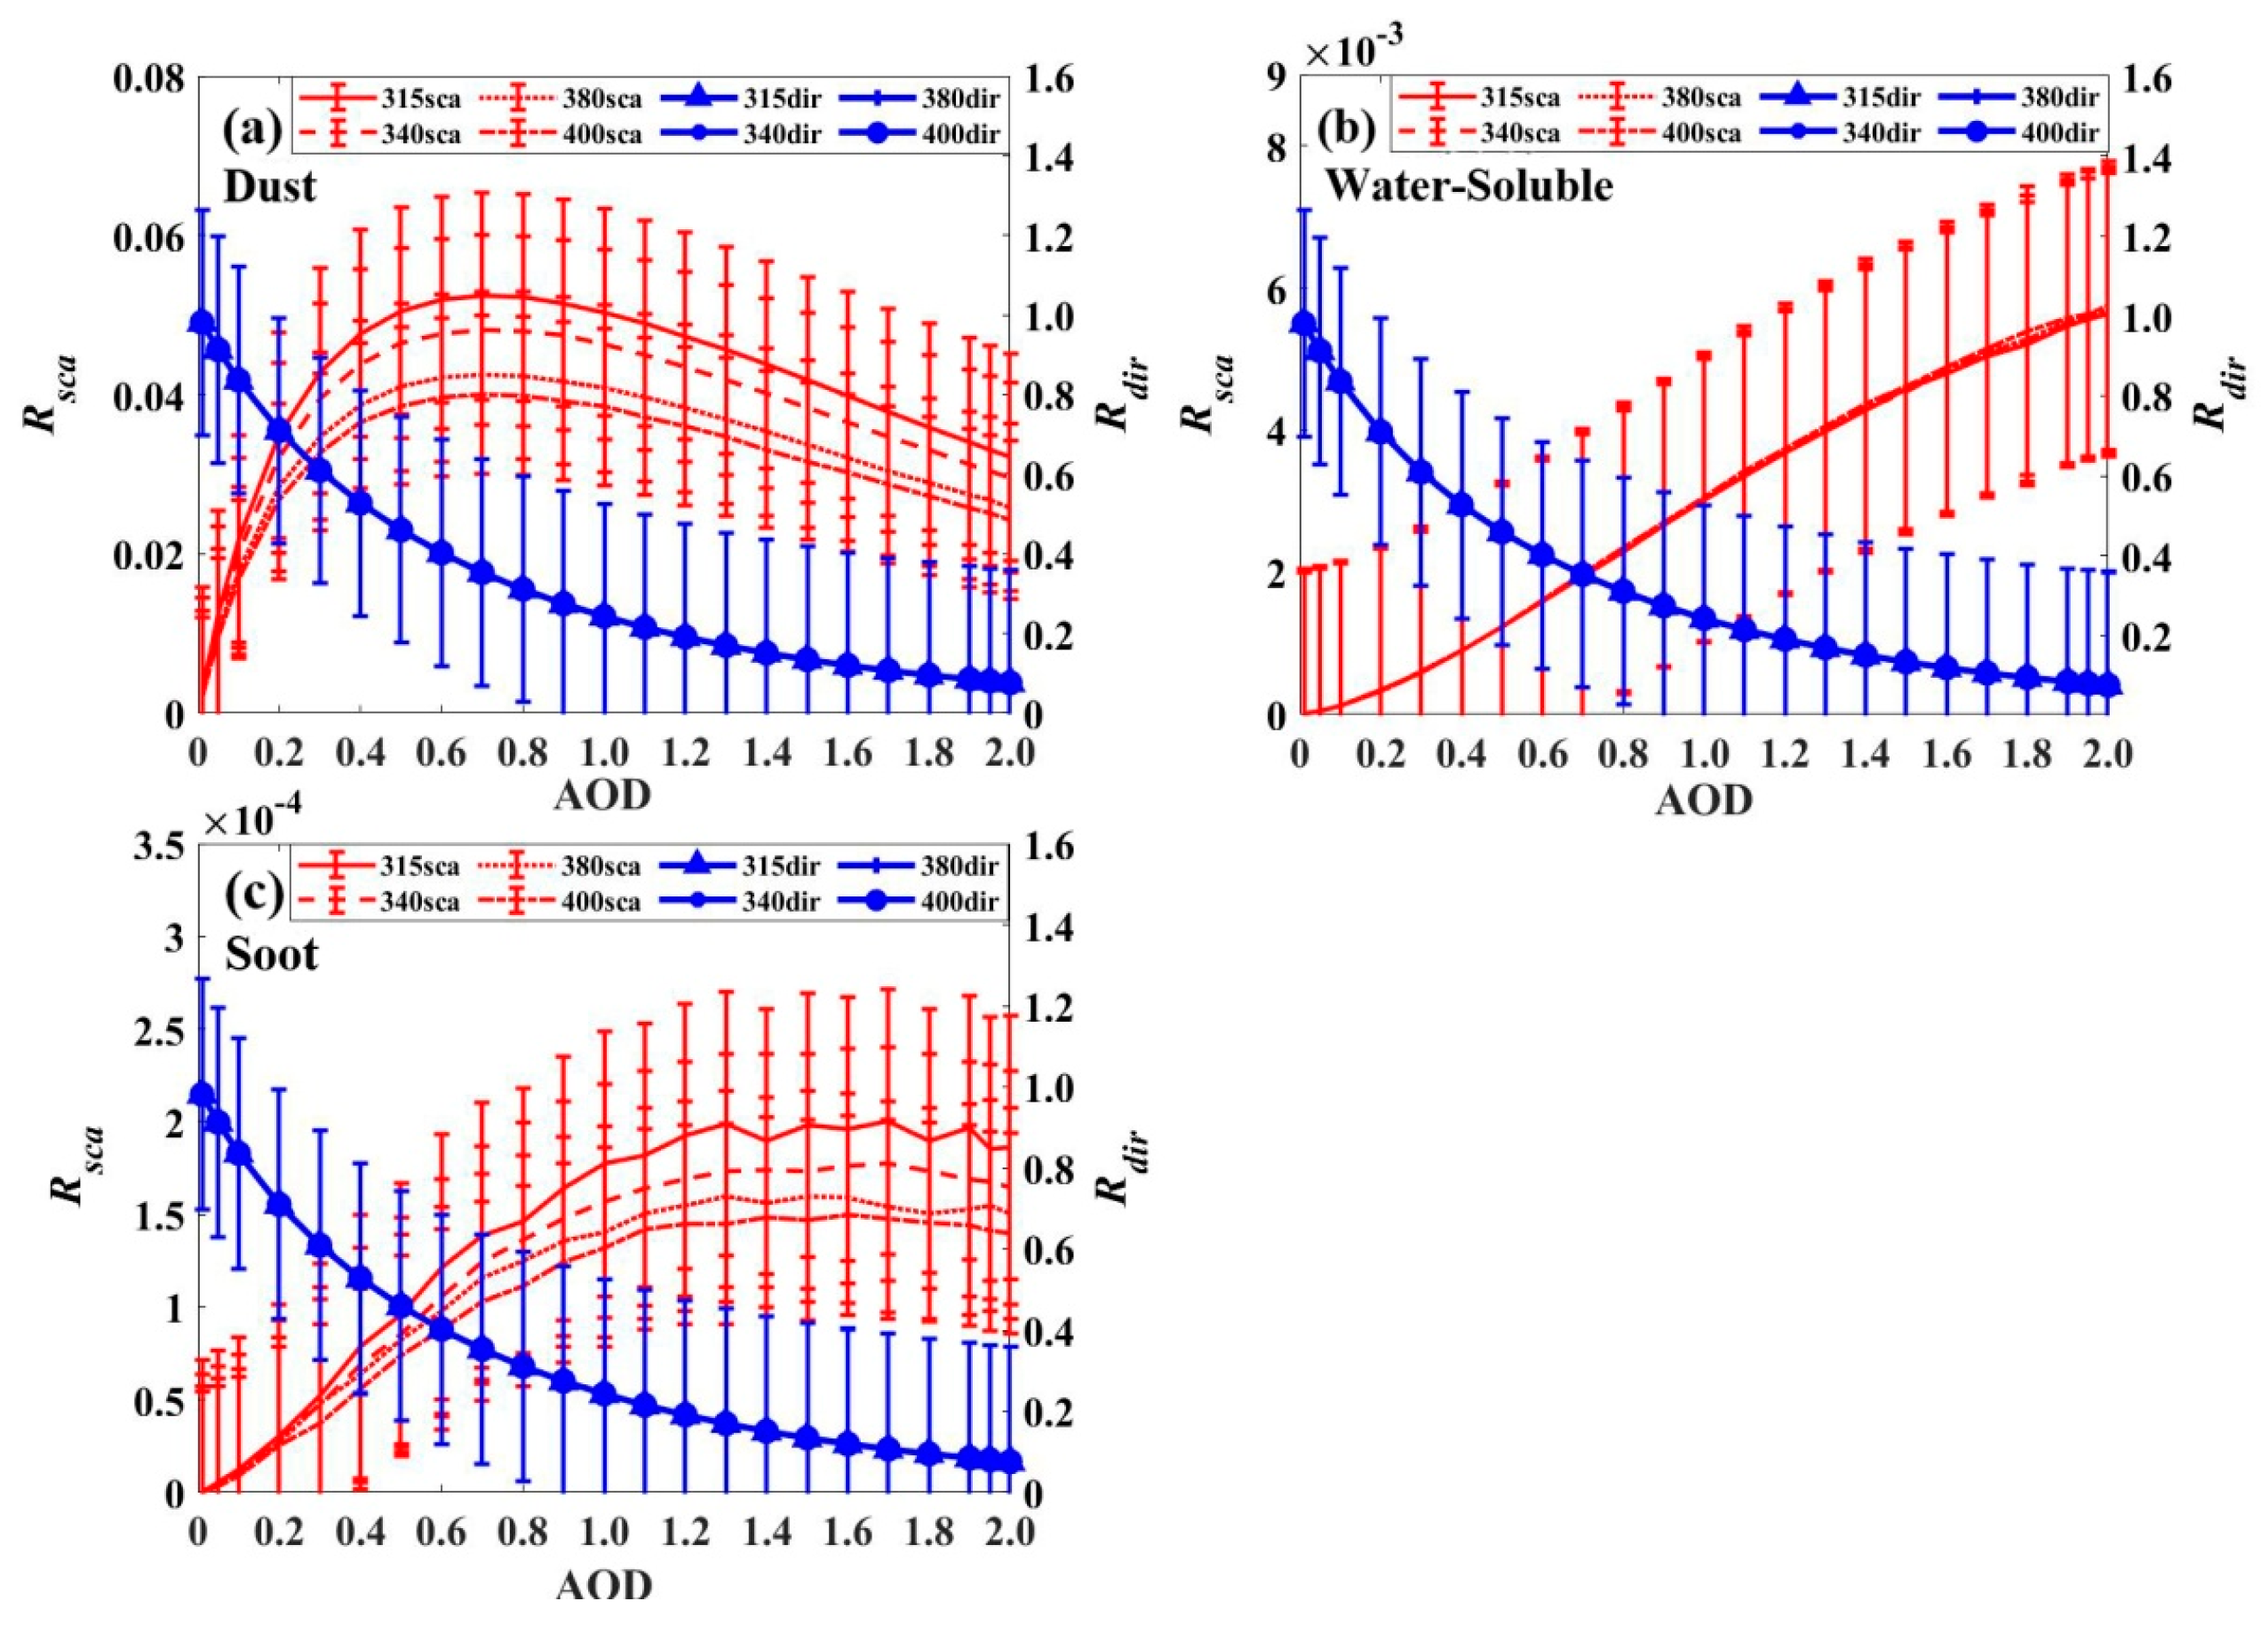
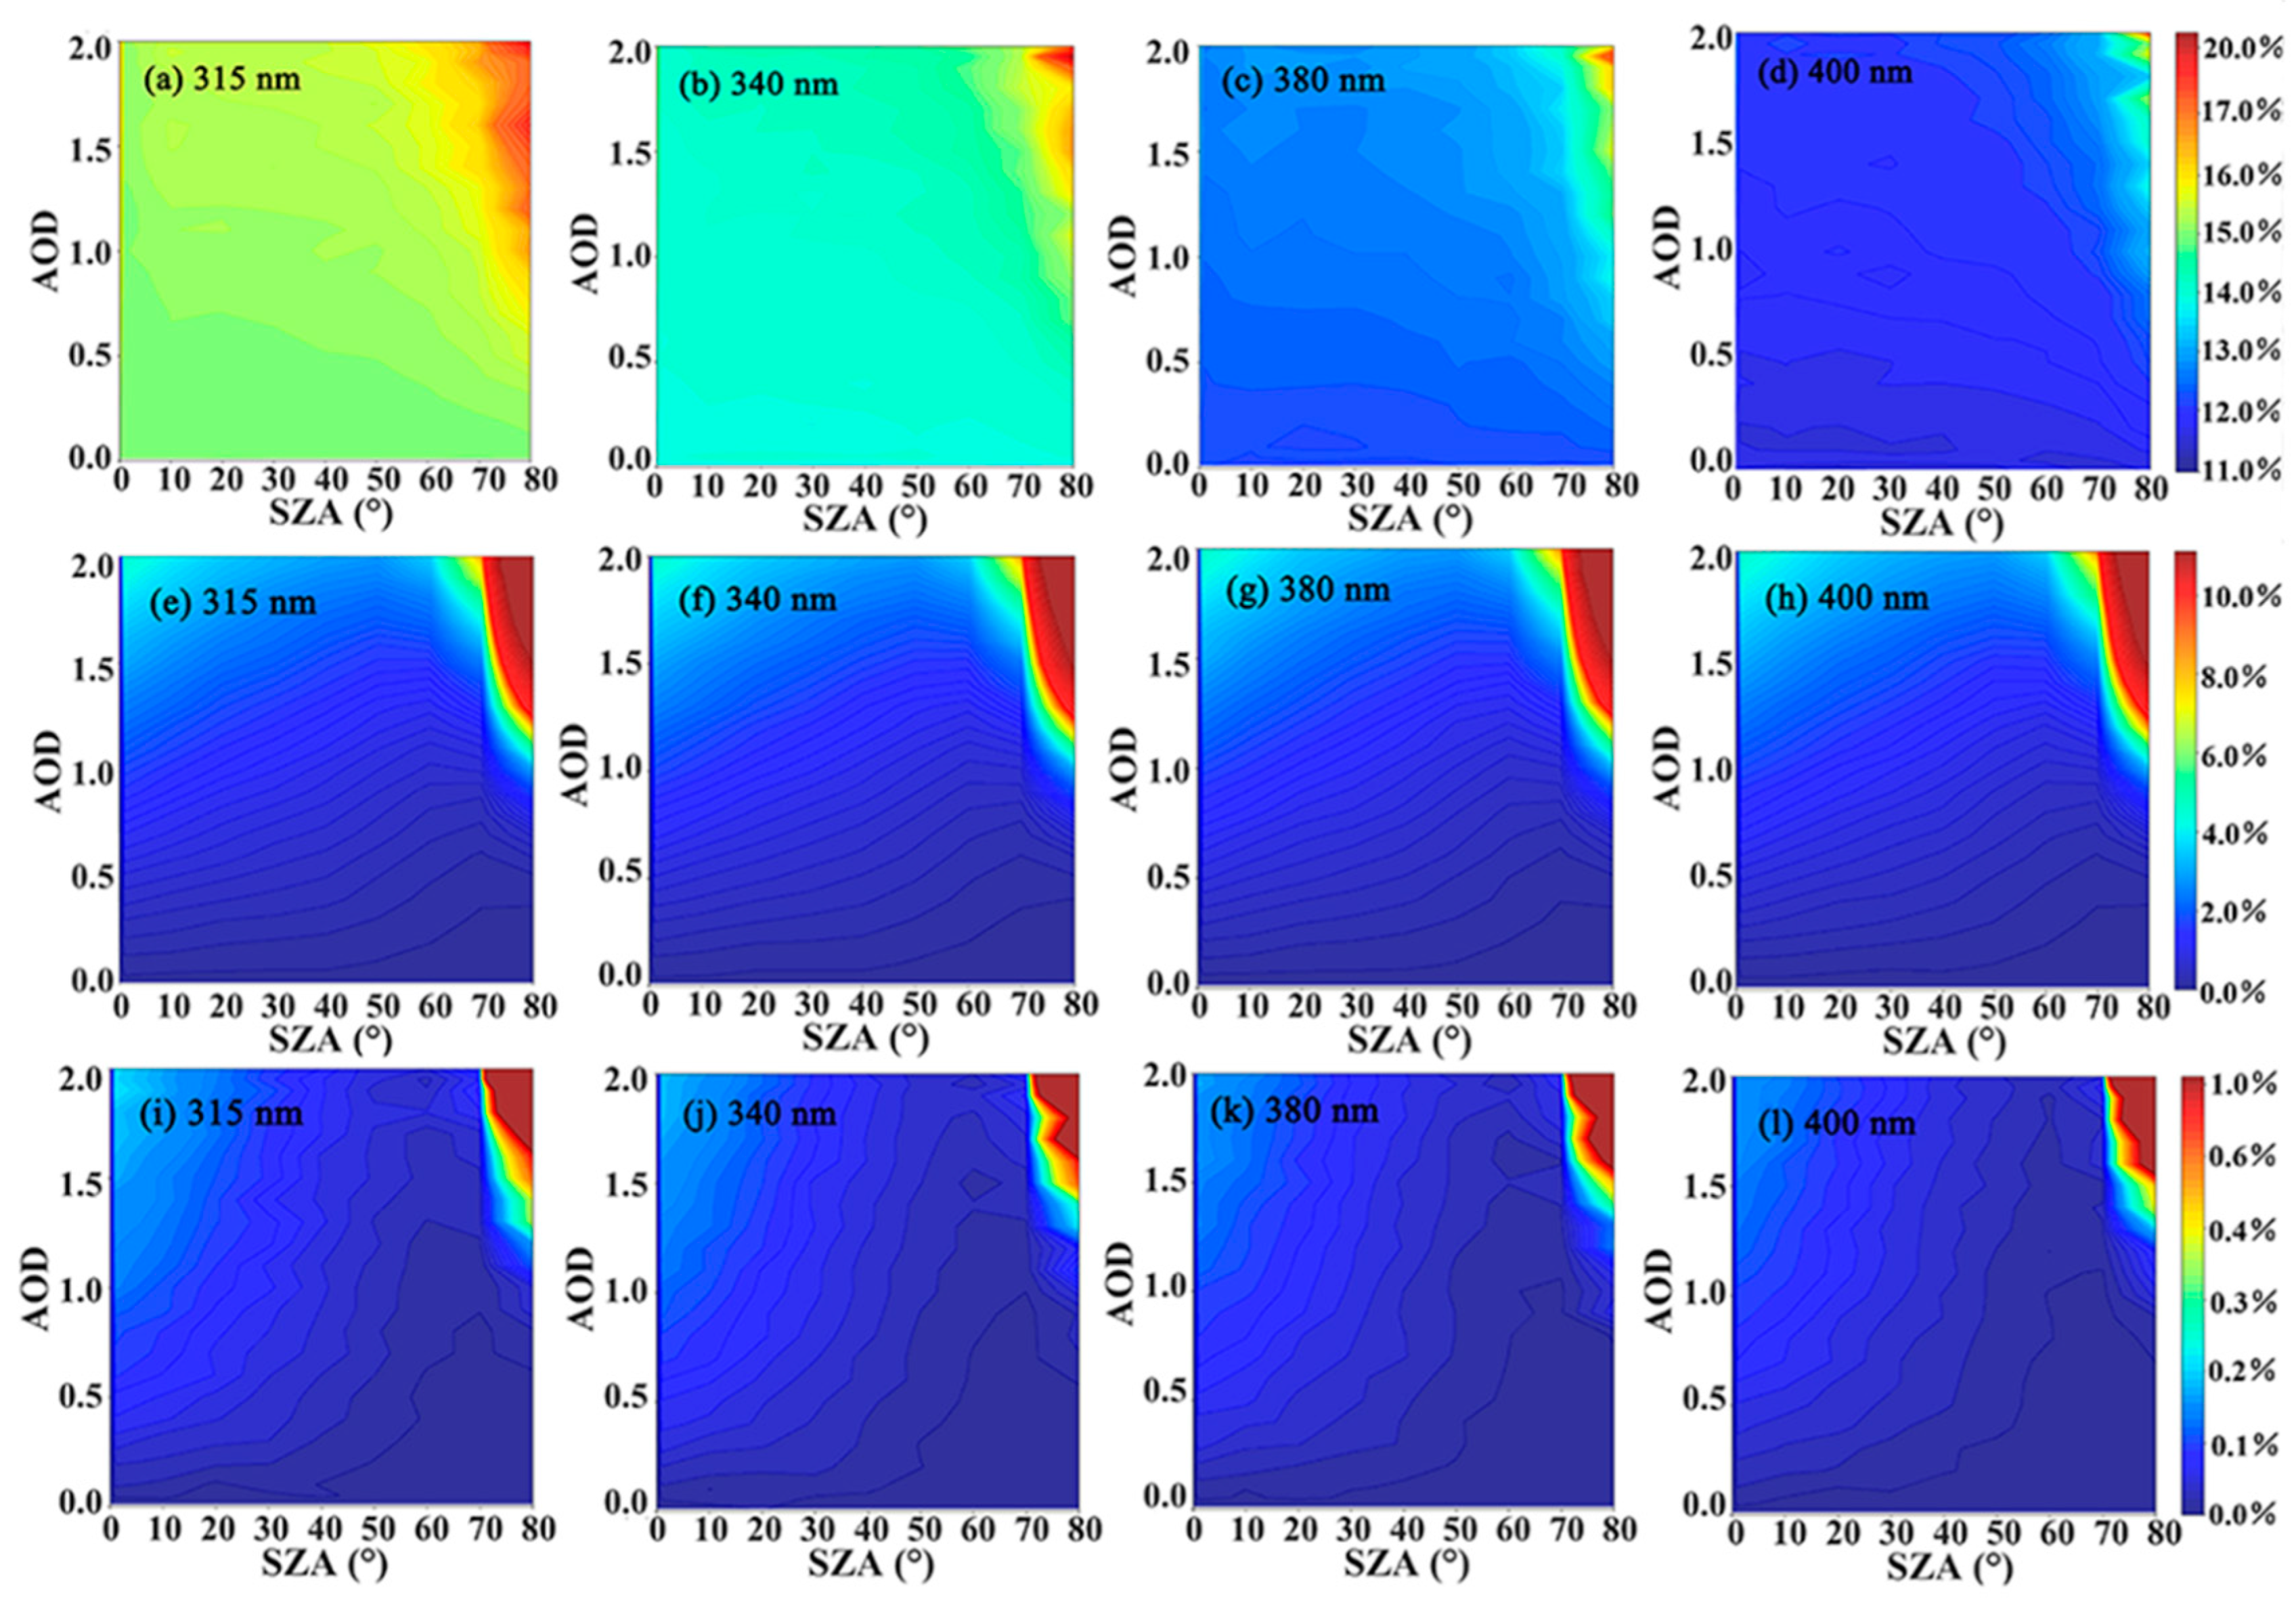
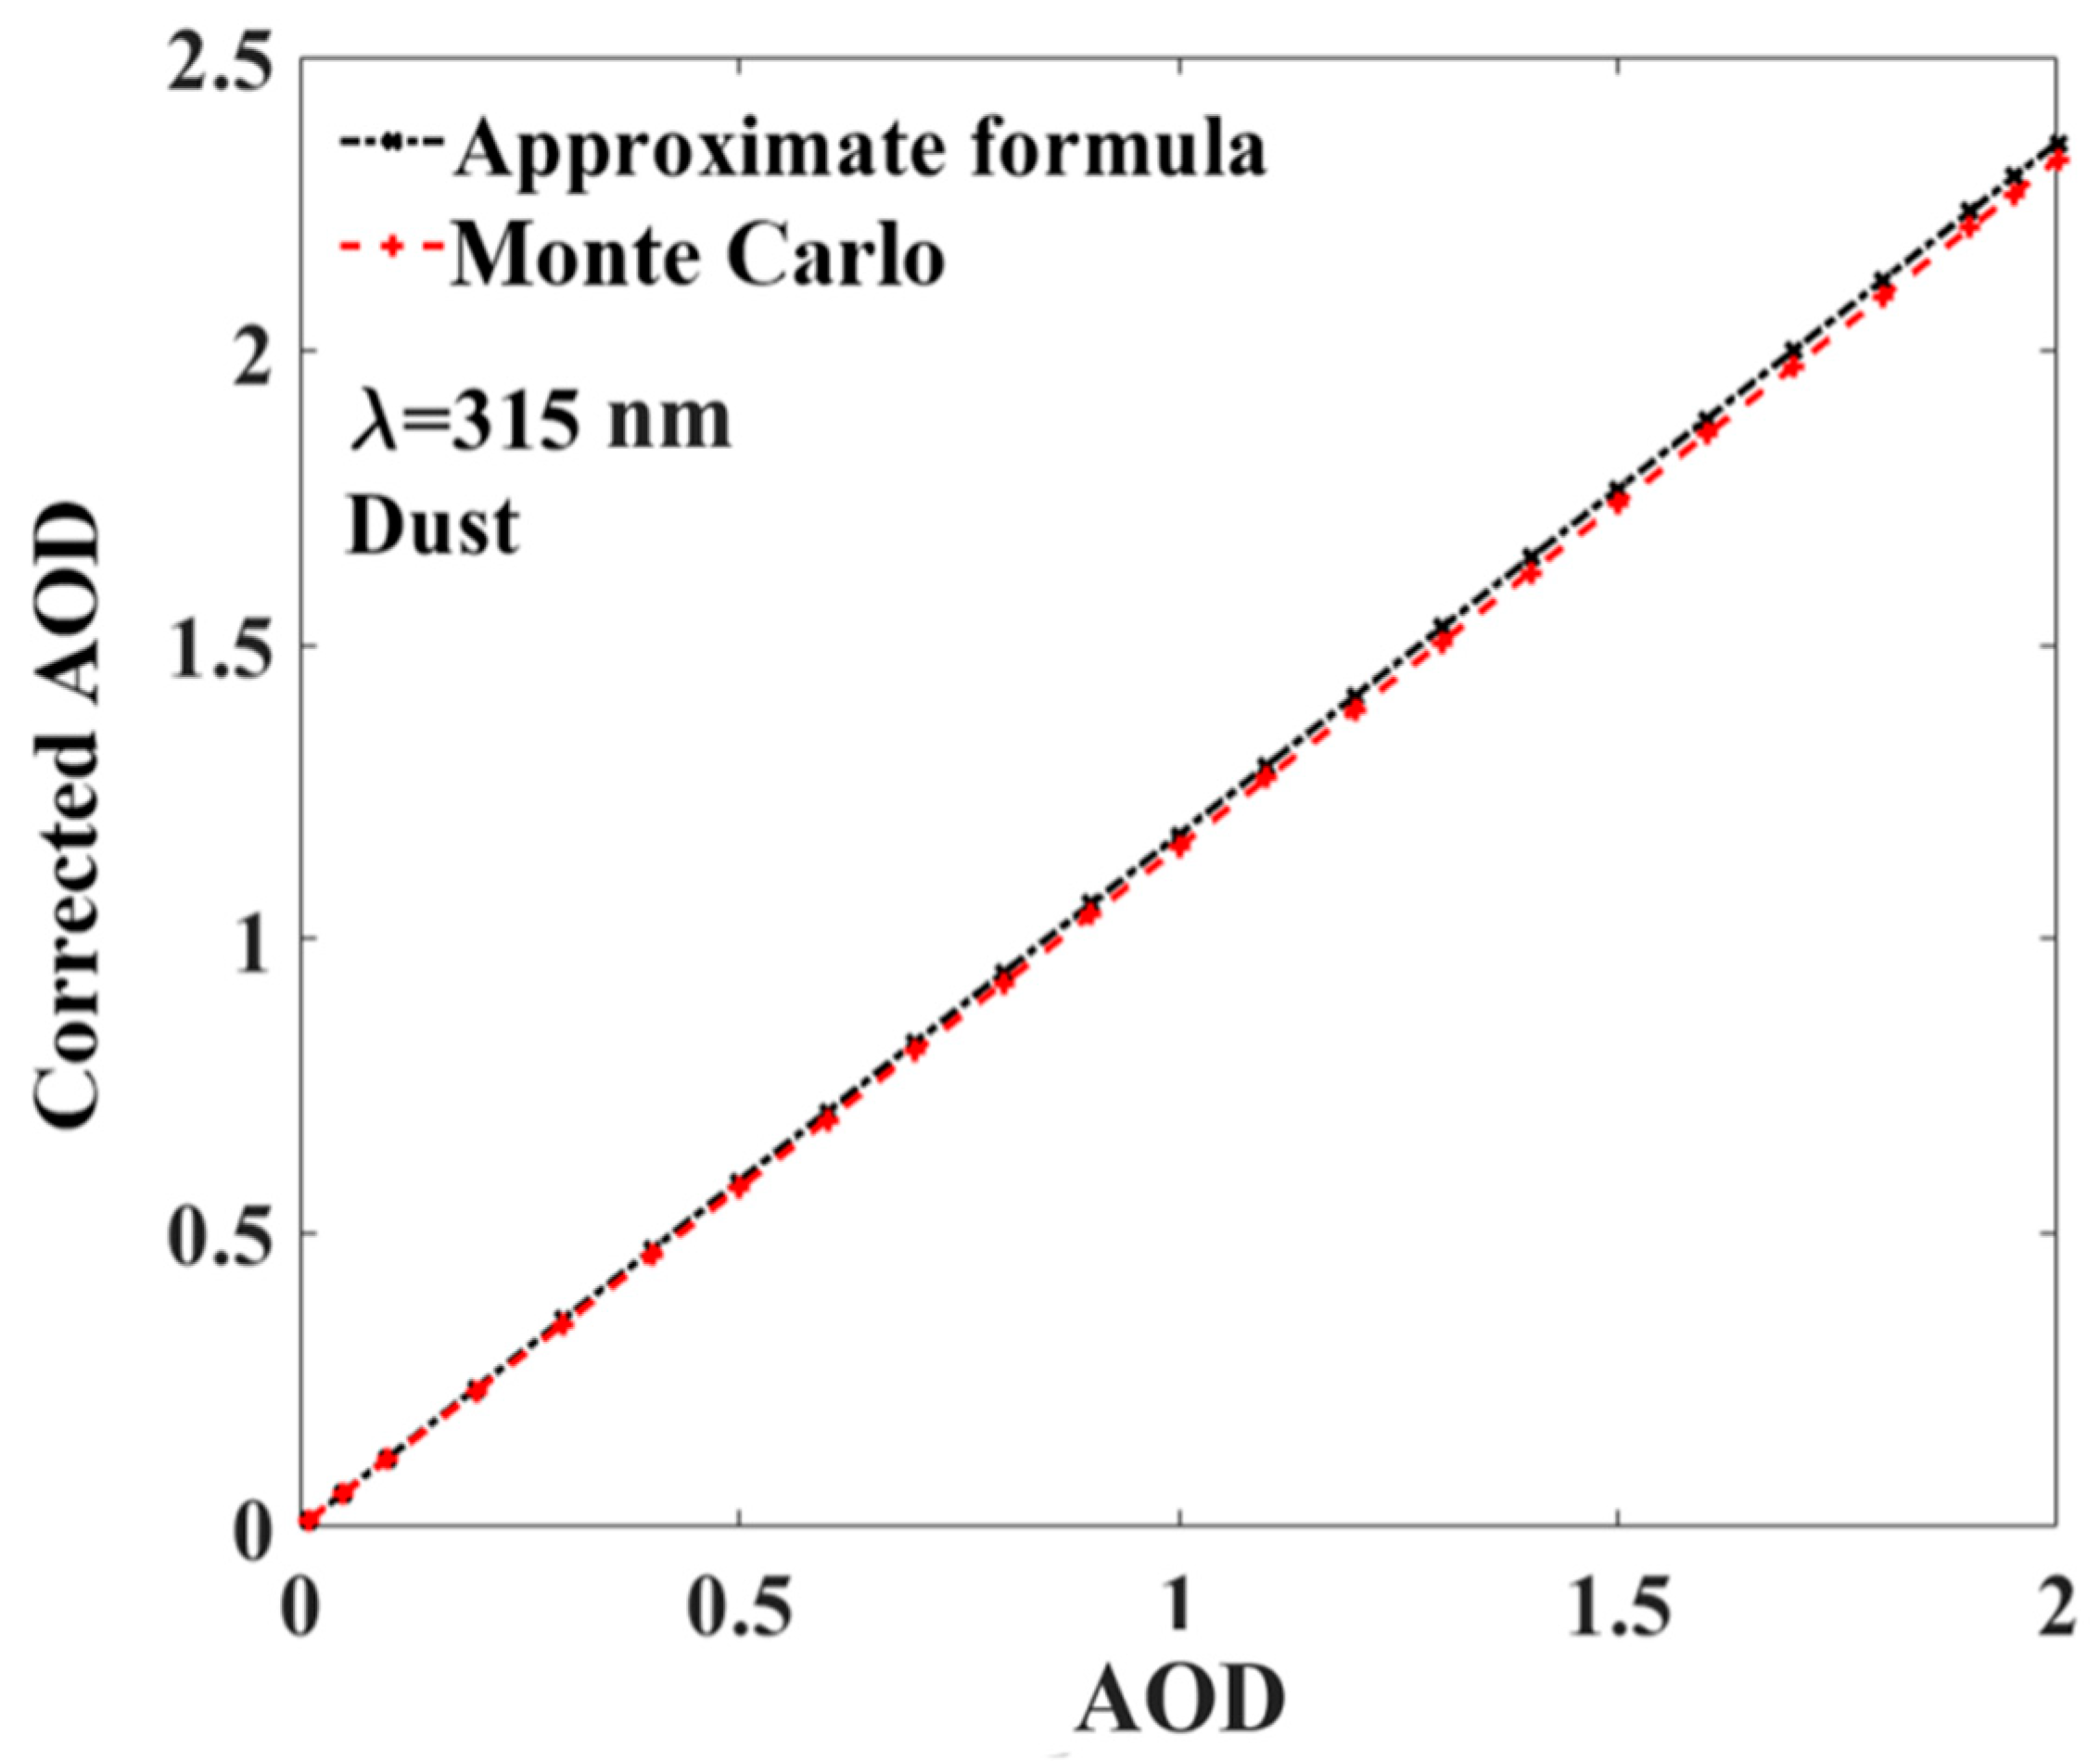
3.1. Analysis of the Forward Scattering Effect Using Simulated Data

To perform theoretical analysis and investigate the aerosol forward scattering of UV AOD, we select three typical aerosols, i.e., dust aerosol, water-soluble aerosol and soot aerosol. It is shown that the ASD generally has a single-peaked or multi-peaked log-normal distribution. To obtain the bulk forward scattering effect of the three typical aerosols, the single-peaked log-normal distribution is employed:
n ( r ) = 1 2 π ln σ exp ( ln r ln r m ) 2 2 ( ln σ ) 2
where rm and σ are the mode radius of the aerosol and the standard deviation, respectively. Their specific values are displayed in Table 1, which can be obtained from the standard radiative atmospheric aerosol model [41]. The average effective radius (re) of dust aerosol is 7.2 μm, and the re of soot aerosol is the minimum with a value of 0.04 μm. Following Shi et al. [42], the complex refractive indices (CRIs) of dust aerosols, water-soluble aerosols and soot aerosols in four wavelengths from 315 nm to 400 nm can be determined (shown in Table 2). The SSA of typical aerosols can be obtained by taking the CRI to compute aerosol single scattering properties for a single particle size using Mie theory and then integrating particle sizes using ASD (see Table 2). The SSA values are the largest for water-soluble aerosol particles at each wavelength, and all are greater than 0.96. However, those of soot aerosols are the smallest, indicating that the scattering ability of soot aerosol particles is lower than the other two types of aerosols.
The scattering phase functions (P(Θ)) of the three typical aerosols from 315 nm to 400 nm have the overall characteristics of stronger forward scattering, especially for dust, and the peak decreases with the decrease of re (Figure 2). P(Θ) of dust aerosol decreases with the increase of wavelength when Θ is less than 5°; otherwise it increases with the increase of wavelength. The P(Θ) of water-soluble aerosol decreases with increasing wavelength at Θ < 25° and increases with its increase when Θ is between 25° and 160°, respectively. For soot aerosol, the shorter the wavelength at the scattering angle Θ < 60°, the larger the value of P(Θ). P(Θ) increases with an increase of wavelength when Θ > 60°.
P∆Ω represents a shorthand for the normalized phase function P integrated over the instrument’s FOV, which is defined as the radiance singly scattered into the instrument’s FOV when the AOD is small enough [29,33,35]. Therefore, it is named single forward scattering ratio in this study:
P Δ Ω = 0 η P ( Θ ) sin Θ d Θ / 0 π P ( Θ ) sin Θ d Θ = 1 2 cos η 1 P ( cos Θ ) d cos Θ
where η represents the half-FOV, which is equal to 0.5 since the FOV is 1° of the sky-radiometer (POM-02) used in this paper. Therefore, the P∆Ω can be calculated using above Equations (6), (7) and (14), which is expressed as:
P Δ Ω = 1 2 { ( 1 cos η ) + l = 1 N ϖ l [ P l 1 ( cos η ) P l + 1 ( cos η ) ] 2 l + 1 }
For the three aerosols (in Figure 3), P∆Ω entering the FOV of the sky-radiometer from 315 nm to 400 nm trends upward with decreasing wavelength and increasing half-FOV and re. The variation of P∆Ω with FOV is the most dramatic for dust aerosols, followed by water-soluble aerosols and soot aerosols. The reason may be that, as the wavelength decreases or FOV and re increase, the forward scattering effect increases, that is, the amount of scattered light entering the instrument’s FOV increases. Among them, the P∆Ω values of dust aerosol at 315nm, 340 nm, 380 nm and 400 nm are the highest, which are 24.60%, 22.81%, 20.31% and 19.20%, respectively. The magnitude of P∆Ω values for water-soluble and soot aerosols with small re is relatively low (<0.05%), indicating a small amount of forward scattered light received by the instrument, and the forward scattering may not significantly affect the inversion accuracy of UV AOD from POM-02.
The forward scattering effect of aerosol can be obtained by taking the above parameters (PΔΩ, SZA, AOD and SSA) into the Monte Carlo model. In order to verify the influence of photon number on the results, we analyzed the influence of different photon numbers on relative errors of dust aerosol under different conditions. It can be found in Figure 4 that the fluctuation of simulation results is greater when the SZA is larger or the AOD is larger and more photons are needed in order to make the simulation results converge. However, the results overall tend to be stable when the photon number reaches 1.2 million in Figure 4, indicating that the Monte Carlo simulation is sufficient. In this paper, 1.5 million photons were used to ensure the accuracy of the simulation results in this study. It is worth mentioning that aerosol particles are assumed to be spherical for convenience in this study because the relative errors of retrieved AOD caused by forward scattering effects for spheroid and sphere particles are similar, which was obtained by the Monte Carlo algorithm used by Ge et al. [29]. Therefore, dust particles are also treated as spherical particles in this paper.
The ratio of forward scattering (Rsca) and direct radiation (Rdir) entering the FOV of the instrument to solar radiation at TOA with different wavelengths and AODs can be seen in Figure 5. The Rdir of the three aerosol types decrease with the increase of AOD and have little change with wavelength. The Rsca of the dust aerosols have more obvious wavelength dependence than the other two types. Meanwhile, the Rsca of the three types of aerosols have different trends with AOD. The Rsca of dust aerosol increases first and then decreases with the increase of AOD, and it is stronger when the wavelength is shorter. Water-soluble aerosols and soot aerosols have a significant increase trend with AOD. Meanwhile, the mean values and standard deviations of Rsca at all wavelengths and AODs for dust, water-soluble, and soot aerosols are 0.034 ± 0.018, 0.0029± 0.003, 0.0001± 0.0001, respectively. The Rsca of dust aerosols is one to two orders of magnitude larger than soot and water-soluble aerosol particles.
Figure 6 illustrates the distributions of relative errors between the original AODs and corrected AODs of three typical aerosols (dust, water-soluble, soot) with different AODs and SZAs for a range of wavelengths(315 nm, 340 nm, 380 nm, 400 nm). Generally, the error magnifies with the increase of AOD and the decrease of wavelength. The relative errors caused by forward scattering of dust aerosols among three types of aerosols are the largest, which decrease with the increase of wavelength, and the average errors at 315 nm, 340 nm, 380 nm and 400 nm are 15.5%, 14.3%, 12.8% and 12.1%, respectively. When SZA is less than 60°, the relative error of water-soluble aerosol is less than 6% and increases with the decrease of SZA. Nevertheless, the wavelength dependence of the error changes is not obvious. The possible reason is that the differences between the SSA and forward scattering ability at 315–400 nm are small, and the mean re of aerosol particles is small, resulting in the probability of a photon scattering that is similar to the wavelength changes from the Monte Carlo method. For soot aerosol, the errors are less than 0.1% when SZA is less than 70°, and it decreases with the decrease of AOD and the increase of wavelength. It shows that the forward effect of soot aerosol particles in the UV band is negligible, mostly because the mean re of soot aerosol is small (~0.1 μm), and the SSA and forward scattering ability are smaller. That is to say that the scattering processes of solar irradiation of soot aerosol are less and the diffuse radiation received by the instrument is small. Overall, there are two higher-value regions of the errors for all aerosol types, which is similar to Ge et al. [29]. One region is where AOD is greater than 1 and the SZA is less than 20°, mainly due to the large forward scattering effect. Different from the former, the latter is the area with a higher SZA (>60°) with an AOD greater than 1. The key reason is that direct radiation received by the instrument is small due to a strong attenuation of direct sunlight when it passes through the thick aerosol layer, which can be seen in Figure 5. The above phenomenon indicates that the error first decreases and then increases with the increase of the SZA, and the retrieved AOD should be corrected under these circumstances.
The correction factor of aerosol forward scattering is obtained according to an approximation method [27,33], which is suitable for the range of AOD between 0 and 6. Our results simulated with the Monte Carlo model were validated through this approximate formula. The correction factor is expressed as follows:
C = τ c / τ a = 1 / ( 1 ω P Δ Ω )
where τc is the corrected AOD and τa is the original AOD, which represents AOD retrieved from apparent solar radiation including radiation forward scattered into the FOV of the instrument. The correlations of the AOD and corrected AOD for dust aerosol at 315 nm from the approximation method and Monte Carlo simulation were compared and analyzed. The two methods are found to be highly consistent in Figure 7. Therefore, this method can be used to analyze and process the data actually observed with a sky-radiometer.

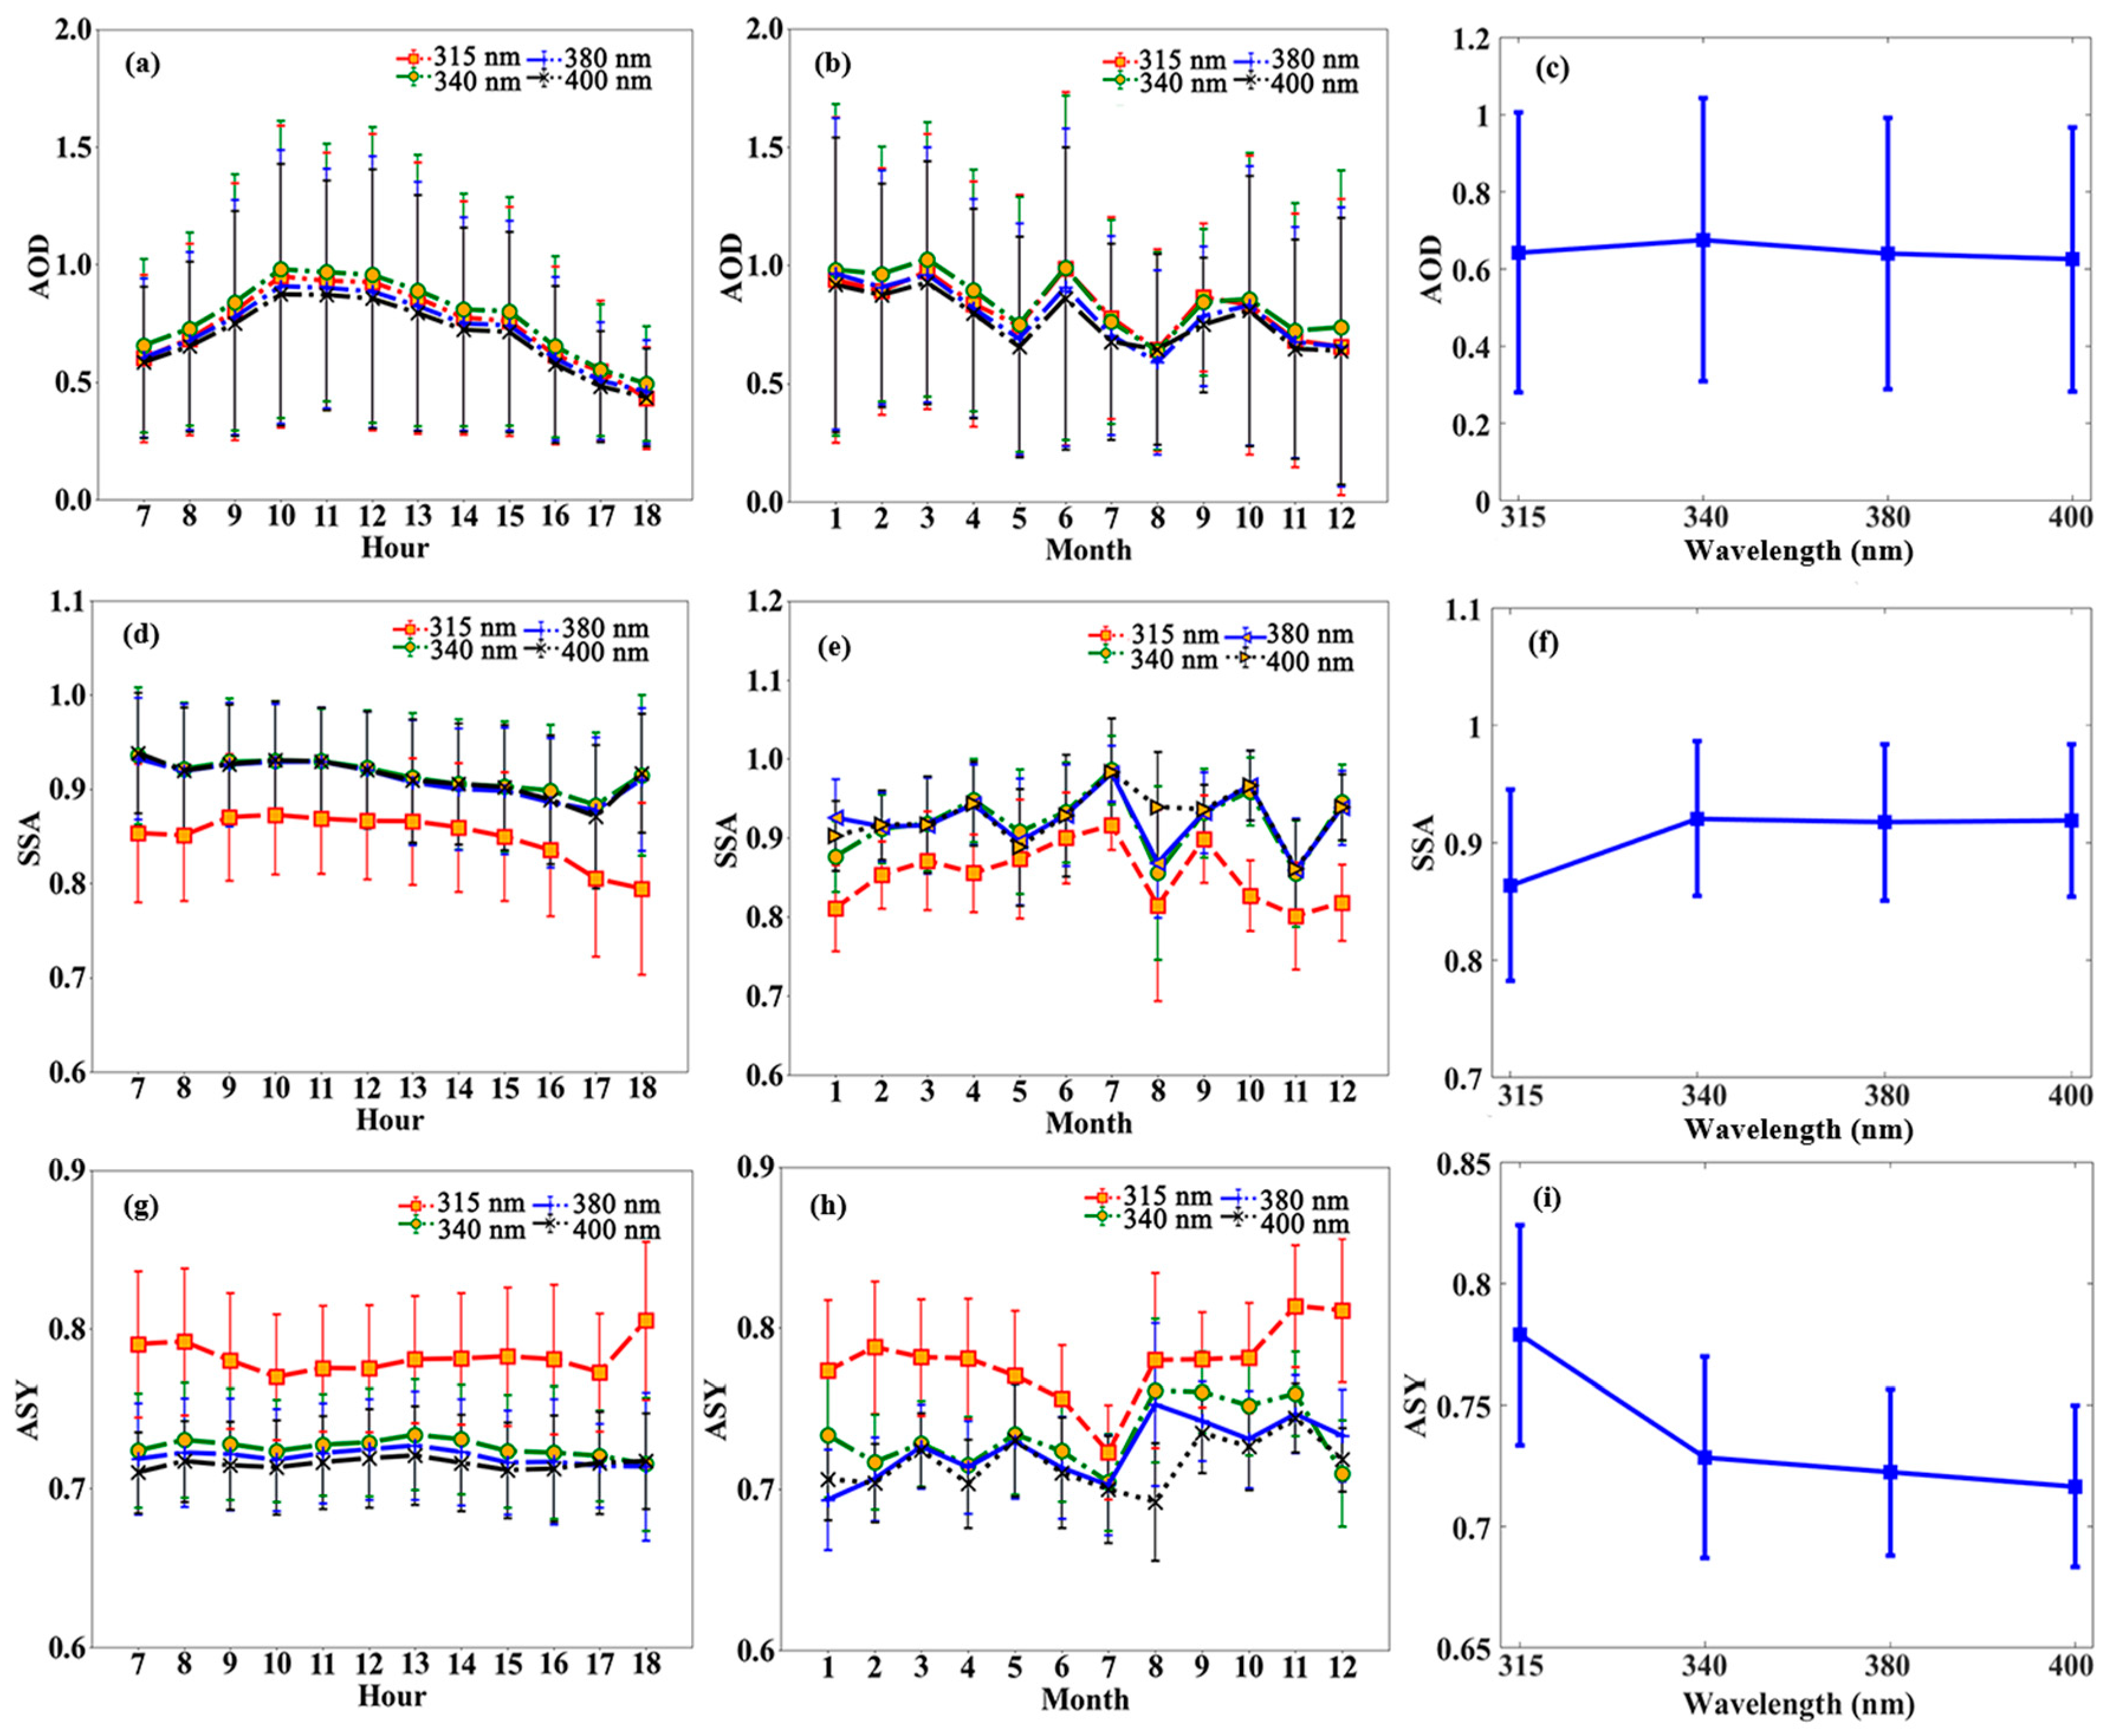
3.2. Analysis of Observed Data

By analyzing the above simulation data, we can see that the AOD needs to be corrected especially for high AODs, short wavelengths and large aerosol particles. Located in the northwest region of China, Xi’an is affected by heavy local and long-transported pollution all year round. Furthermore, average proportions of different aerosol types show significant seasonal variations in Xi’an. Dust accounts for about 6% in spring due to the effect of dust episodes, and the proportion of scattering aerosols reaches up to 40% in summer [43]. This shows that aerosol types in Xi’an area are various with complex and diverse scattering characteristics. Thus, the AOD retrieved from the sky-radiometer at the Xi’an site needs to be analyzed and corrected. The sky-radiometer with 11 channels of 315 nm, 340 nm, 380 nm, 400 nm, 440 nm, 500 nm, 870 nm, 940 nm, 1020 nm, 1627 nm, 2200 nm and 1° of FOV [34] was installed at the Xi’an University of Technology in 2015. Therefore, the actual observation data in the Xi’an area focused on different wavelengths of 315 nm, 340 nm, 380 nm and 400 nm can be obtained from 2015 to 2020. Those micro-physics parameters (AOD, SSA, ASY, CRI and ASD) were derived from the measured radiance using the Skyrad package (Version 4.2) developed by Nakajima et al. [44], shown in Figure 7 and Figure 8. The cloud screening [45,46] used mainly corresponds to the combination of a spectral variability test [47] and a statistical analysis test of Smirnov et al. [45] in this paper. Meanwhile, the uncertainty of optical properties retrieved have also been reported [48,49]. The absolute uncertainty of retrieved AOD was estimated to be about 0.03 for shorter wavelengths. Mean values of SSA retrieved from the PREDE sky-radiometer were significantly larger than those from the Cimel Sun photometer, with differences between 0.03 and 0.07. The accuracies of SSA and ASD retrievals are affected by the propagation of errors in measurement, calibrations for direct solar and diffuse sky radiation, ground albedo, cloud screening. The forward scattering effect of aerosols is studied and analyzed by using inversion results of those micro-physics parameters. By performing quality control on the observation data, 364 days of valid observations can be obtained, including 10,788 successful retrievals with the Skyrad package (with successful almucantar retrievals and without the impact of cloud)(shown in Table 3), which allow for a statistically meaningful analysis of aerosol optical and physical properties of the total atmospheric column. By inserting the aerosol optical parameters obtained using POM-02 into the Monte Carlo model, the relative error (defined in Equation (12)) of the AOD due to forward scattering at different wavelengths can be calculated. The characteristic distributions of the errors in Xi’an at different wavelengths and different SZAs are obtained from statistical analysis, and the comparison of the original and the corrected AODs was conducted.
The daily variation of the AOD in Figure 8 shows a convex feature, which is lower in the morning and evening and higher between 10:00 and 12:00. Higher values of monthly mean AODs occurred in January and February (~equal to 1), while lower values happened in July and August. The fluctuation amplitude of SSA is small, and the distribution range is 0.87–0.93. The highest and lowest values of SSA at 315 nm (lower than other wavelengths) were 0.91 ± 0.08 and 0.80 ± 0.07 and occurred in July and November, respectively. It can be found from Figure 8 that the optical properties at different wavelengths have obvious differences. The average values of AOD are about 0.6 for each wavelength, but it is the largest at 340 nm. The SSA at 315 nm is less than 0.9, which is significantly lower than that of the other three wavelengths, while the ASY at 315 nm is significantly larger than them. The ASY decreases with the increase of wavelength with the values between 0.77 and 0.82. The overall ASD (Figure 9) can be divided into two modes, i.e., fine mode (particle size < 0.6 μm) and coarse mode > 0.6 μm), similar to those obtained by others in different situations [50,51]. Under the coarse mode, there was a characteristic of being higher in spring and winter than the other two seasons. The summer VSD in the fine mode was higher than other seasons, indicating the relatively high fine-particle aerosols in summer compared with those in other seasons.
Figure 10a shows the variation of the relative error caused by forward scattering at 315–1020 nm for AOD. In general, the errors increase with the increase of AOD and decrease of wavelength. The mean relative error of 315–1020 nm increases with the decrease of wavelength, with a maximum of 16.1% at 315 nm and a minimum of 6.6% at 1020 nm. Moreover, the standard deviations decrease with the increase of wavelength (Figure 11). The errors with a wavelength greater than 400 nm and an AOD less than 1.0 can be within 5%, which can be ignored. However, the relative errors caused by forward scattering can exceed 10% when AOD is greater than 1 and 25% when AOD is larger than 2 in the UV band. The possible explanation is the frequent occurrence of haze and dust weather in the Xi’an area, and the instrument receives more forward scattering. Therefore, the forward scattering needs to be considered under these conditions. Figure 10b shows that the distribution of the average relative errors caused by forward scattering effect can vary with SZA and wavelength, and the error decreases first and then increases with the increase of the SZA. The larger errors are mainly due to the large forward scattering effect in which the wavelength is shorter and the SZA is less than 30° under the condition of a larger AOD; it can be seen in Figure 8 that the monthly means of AODs are between 0.7 and 1. Different from the former, the other lager errors are the area with higher SZAs (>40°) and shorter wavelengths. The probable reason is that direct radiation received by the instrument is small due to strong attenuation of direct sunlight when wavelength is shorter.
The comparisons of the original and corrected AODs of 315 nm, 340 nm, 380 nm and 400 nm are shown in Figure 12. The correlations of AODs before and after correction are greater than 0.96, and the correlations basically increase with wavelengths. The real AODs are underestimated before removing the effect of forward scattering in the wavelength range 315–1020 nm, and the AODs at 315–400 nm are more deviated than those at 500–1020 nm, indicating the relatively strong effect of forward scattering on AODs at the UV band. The average and standard deviation values of corrected AODs at 315–400nm are 0.78 ± 0.47, 0.81 ± 0.48, 0.76 ± 0.44, 0.73 ± 0.43, respectively, which are significantly larger than the original AODs in Figure 8.

4. Discussion and Conclusions

Due to the existence of FOV, the radiation received by the sky-radiometer includes the forward scattering in addition to direct solar irradiance. This leads to more diffuse light errors of the retrieved AOD, especially for shorter wavelengths and heavily polluted weather. In this study, the accuracy of the Monte Carlo method for calculating forward scattering effect was verified using the simulation data of three typical aerosol particles. Notably, the corrections used the Monte Carlo method and Mie theory by assuming that particles are spherical, but the error caused by this assumption is quite small [29]. The forward scattering effects and influencing factors of different aerosol types in different seasons in Xi’an need to be analyzed in the future. We conducted the analysis using the observation data from a sky-radiometer in Xi’an (period: 2015–2020) where heavy pollution weather is frequent. Therefore, the relative errors of AOD were obtained under different conditions, including different shorter wavelengths (≤400 nm), SZAs and AODs.
Generally, the error increases with the increase of AOD and particle size and decrease of wavelength. The relative errors caused by forward scattering of dust aerosols among the three types of aerosols are the largest, with the average errors at 315 nm, 340 nm, 380 nm and 400 nm being 15.5%, 14.3%, 12.8% and 12.1%, respectively. The correction factors of water-soluble aerosols and soot aerosols for all wavelengths are negligible. Overall, there are two higher-value regions of the errors for all aerosol types. The relatively higher errors mainly concentrate in two regions where the SZA is lower than 20° and higher than 60° with AOD being greaterthan1, corresponding to the two main reasons for large forward scattering and strong attenuation of direct solar radiation when it passes through the thick aerosol layer, respectively. The results show that the forward scattering effect can be more significant when the AOD is larger and the SZA has a smaller or larger value. Basically, the relative errors at Xi’an site caused by forward scattering can reach more than 10% when AOD is greater than 1, and it even can exceed 25% in the UV band when the AOD is larger than 2. The mean relative error of 315–1020 nm increases with the decrease of wavelength, with a maximum of 16.1% at 315 nm and a minimum of 6.6% at 1020 nm. The correlation coefficients of AODs before and after correction from 315 nm to 400 nm are greater than 0.96, which increase with the increase of wavelength. This indicates that the significance of forward scattering effect in the Xi’an area cannot be ignored for short wavelengths. At longer wavelengths and lower AODs (<1.0) of the sky-radiometer, the effect of forward scattering is negligible. Therefore, to better study the UV aerosol–radiation relationship and the climate effect of aerosols, it is important to obtain a more accurate UV AOD.

Author Contributions

Scheme and design, J.L. (Jingjing Liu), J.L. (Jingtao Liu) and D.H.; methodology, J.L. (Jingjing Liu), J.L. (Jingtao Liu) and J.G.; software, J.L. (Jingtao Liu), J.G. and L.Z.; validation, M.L. and Z.G.; visualization, J.L. (Jingtao Liu) and L.Z.; observation, Y.L., J.W. and Q.Y.; writing—original draft preparation, J.L. (Jingjing Liu) and L.Z.; writing—review and editing, J.L. (Jingjing Liu), L.Z., M.L. and D.H. All authors have read and agreed to the published version of the manuscript.

Funding

This research was supported by the National Natural Science Foundation of China (Nos. 41975045, 61705180, 41875034) and the Young Talent Support Program Project of Shaanxi University Association for Science and Technology (No. 20210701).

Data Availability Statement

The data and data analysis method are available upon request.

Acknowledgments

The authors would like to express their gratitude to Jietai Mao from Peking University for his thoughts and ideas.

Conflicts of Interest

The authors declare no conflict of interest.

References

  1. Kaufman, Y.J.; Boucher, O.; Tanré, D.; Chin, M.; Remer, L.A.; Takemura, T. Aerosol anthropogenic component estimated from satellite data. Geophys. Res. Lett. 2005, 32, L17804. [Google Scholar] [CrossRef]
  2. Pace, G.; di Sarra, A.; Meloni, D.; Piacentino, S.; Chamard, P. Aerosol optical properties at Lambeduca (central Mediterranean), 1. Influence of transport and identification of different aerosol types. Atmos. Chem. Phys. 2006, 6, 697–713. [Google Scholar] [CrossRef]
  3. Yu, H.; Kaufman, Y.J.; Chin, M.; Feingold, G.; Remer, L.; Anderson, T.L.; Balkanski, Y.; Bellouin, N.; Boucher, O.; Christopher, S.; et al. A review of measurement-based assessments of the aerosol direct radiative effect and forcing. Atmos. Chem. Phys. 2006, 6, 613–666. [Google Scholar] [CrossRef]
  4. Collins, D.B.; Zhao, D.; Ruppel, M.J.; Laskina, O.; Grandquist, J.R.; Modini, R.; Stokes, M.D.; Russell, L.; Bertram, T.H.; Grassian, V.H.; et al. Direct aerosol chemical composition measurements to evaluate the physicochemical differences between controlled sea spray aerosol generation schemes. Atmos. Meas. Tech. 2014, 7, 3667–3683. [Google Scholar] [CrossRef]
  5. Yu, X.; Lü, R.; Liu, C.; Yuan, L.; Shao, Y.; Zhu, B.; Lei, L. Seasonal variation of columnar aerosol optical properties and radiative forcing over Beijing, China. Atmos. Environ. 2017, 166, 340–350. [Google Scholar] [CrossRef]
  6. Xia, X.; Chen, H.; Wang, P. Aerosol properties in a Chinese semiarid region. Atmos. Environ. 2004, 38, 4571–4581. [Google Scholar] [CrossRef]
  7. Torres, O.; Bhartia, P.K.; Herman, J.R.; Sinyuk, A.; Ginoux, P.; Holben, B. A long-term record of aerosol optical depth from TOMS observations and comparison to AERONET measurements. J. Atmos. Sci. 2002, 59, 398–413. [Google Scholar] [CrossRef]
  8. Ma, Y.; Gong, W.; Wang, L.; Zhang, M.; Chen, Z.; Li, J.; Yang, J. Inversion of the haze aerosol sky columnar AVSD in central China by combining multiple ground observation equipment. Opt. Express 2016, 24, 8170–8185. [Google Scholar] [CrossRef]
  9. Che, H.; Zhang, X.-Y.; Xia, X.; Goloub, P.; Holben, B.; Zhao, H.; Wang, Y.; Zhang, X.C.; Wang, H.; Blarel, L.; et al. Ground-based aerosol climatology of China: Aerosol optical depths from the China Aerosol Remote Sensing Network (CARSNET) 2002–2013. Atmos. Chem. Phys. 2015, 15, 7619–7652. [Google Scholar] [CrossRef]
  10. Che, H.; Xia, X.; Zhu, J.; Li, Z.; Dubovik, O.; Holben, B.; Goloub, P.; Chen, H.; Estelles, V.; Cuevas-Agulló, E.; et al. Column aerosol optical properties and aerosol radiative forcing during a serious haze-fog month over North China Plain in 2013 based on ground-based Sunphotometer measurements. Atmos. Chem. Phys. 2013, 14, 2125–2138. [Google Scholar] [CrossRef]
  11. Li, Z.; Xu, H.; Li, K.; Li, D.; Xie, Y.; Li, L.; Zhang, Y.; Gu, X.; Zhao, W.; Tian, Q.; et al. Comprehensive study of optical, physical, chemical and radiative properties of total columnar atmospheric aerosols over China: An overview of Sun-sky radiometer Observation NETwork (SONET) measurements. Bull. Am. Meteorol. Soc. 2018, 99, 739–755. [Google Scholar] [CrossRef]
  12. Cao, J.; Wang, Q.; Chow, J.C.; Watson, J.G.; Tie, X.; Shen, Z.; Wang, P.; An, Z. Impacts of aerosol compositions on visibility impairment in Xi’an, China. Atmos. Environ. 2012, 59, 559–566. [Google Scholar] [CrossRef]
  13. Zhang, X.; Cao, J.; Li, L.; Arimoto, R.; Cheng, Y.; Huebert, B.; Wang, D. Characterization of atmospheric aerosol over Xi’an in the south margin of the Loess Plateau, China. Atmos. Environ. 2002, 36, 4189–4199. [Google Scholar] [CrossRef]
  14. Bi, J.; Shi, J.S.; Xie, Y.; Liu, Y.; Takamura, T.; Khatri, P. Dust aerosol characteristics and shortwave radiative impact at a Gobi Desert of Northwest China during the spring of 2012. J. Meteorol. Soc. Jpn. 2014, 92A, 33–56. [Google Scholar] [CrossRef]
  15. Bi, J.; Huang, J.P.; Fu, Q.; Wang, X.; Shi, J.; Zhang, W.; Huang, Z.; Zhang, B. Toward characterization of the aerosol optical properties over Loess Plateau of Northwestern China. J. Quant. Spectroc. Radiat. Transf. 2011, 112, 346–360. [Google Scholar] [CrossRef]
  16. Han, Y.; Wang, T.H.; Tan, R.; Tang, J.; Wang, C.; He, S.; Dong, Y.; Huang, Z.; Bi, J. CALIOP-Based Quantification of Central Asian Dust Transport. Remote Sens. 2022, 14, 1416. [Google Scholar] [CrossRef]
  17. Wang, T.; Han, Y.; Hua, W.; Tang, J.; Huang, J.; Zhou, T.; Huang, Z.; Bi, J.; Xie, H. Profiling dust mass concentration in Northwest China using a joint lidar and sun-photometer setting. Remote Sens. 2021, 13, 1099. [Google Scholar] [CrossRef]
  18. Ogunjobi, K.O.; Kim, Y.J. Ultraviolet (0.280–0.400 μm) and broadband solar hourly radiation at Kwangju, South Korea: Analysis of their correlation with aerosol optical depth and clearness index. Atmos. Res. 2004, 71, 193–214. [Google Scholar] [CrossRef]
  19. Wenny, B.N.; Saxena, V.K.; Frederick, J.E. Aerosol optical depth measurements and their impact on surface levels of ultraviolet-B radiation. J. Geophys. Res. Atmos. 2001, 106, 17311–17319. [Google Scholar] [CrossRef]
  20. Sellitto, P.; di Sarra, A.; Siani, A.M. An improved algorithm for the determination of aerosol optical depth in the ultraviolet spectral range from Brewer spectrophotometer observations. J. Opt. A Pure Appl. Opt. 2006, 8, 849. [Google Scholar] [CrossRef]
  21. Madronich, S.; McKenzie, R.L.; Björn, L.O.; Caldwell, M.M. Changes in biologically active ultraviolet radiation reaching the Earth’s surface. J. Photochem. Photobiol. B Biol. 1998, 46, 5–19. [Google Scholar] [CrossRef] [PubMed]
  22. Haigh, J.D. The role of stratospheric ozone in modulating the solar radiative forcing of climate. Nature 1994, 370, 544–546. [Google Scholar] [CrossRef]
  23. Kataria, S.; Guruprasad, K.N. Solar UV-B and UV-A/B exclusion effects on intraspecific variations in crop growth and yield of wheat varieties. Field Crops Res. 2011, 125, 8–13. [Google Scholar] [CrossRef]
  24. Liu, S.C.; McKeen, S.A.; Madronich, S. Effect of anthropogenic aerosols on biologically active Ultraviolet radiation. Geophys. Res. Lett. 1991, 18, 2265–2268. [Google Scholar] [CrossRef]
  25. Stanhill, G.; Ianetz, A. Long-term trends in, and the spatial variation of, global irradiance in Israel. Tellus B 1997, 49, 112–122. [Google Scholar] [CrossRef]
  26. Li, Q.; Li, C.C.; Mao, J.T. Evaluation of atmospheric aerosol optical depth products at Ultraviolet bands derived from MODIS Products. Aerosol Sci. Technol. 2012, 46, 1025–1034. [Google Scholar] [CrossRef]
  27. Zhao, F.; Tan, Y.; Li, Z.; Gai, C. The effect and correction of aerosol forward scattering on retrieval of aerosol optical depth from Sun photometer measurements. Geophys. Res. Lett. 2012, 39, L14805. [Google Scholar] [CrossRef]
  28. Chen, X.; Liu, Q.; Wei, H. The treatment of scattering phase function in the multi-scattering radiative transfer calculation. J. Quant. Spectrosc. Radiat. Transfer. 2007, 19, 283–289. [Google Scholar]
  29. Ge, J.M.; Su, J.; Fu, Q.; Ackerman, T.; Huang, J. Dust aerosol forward scattering effects on ground-based aerosol optical depth retrievals. J. Quant. Spectrosc. Radiat. Transfer. 2011, 112, 310–319. [Google Scholar] [CrossRef]
  30. Sinyuk, A.; Holben, B.N.; Smirnov, A.; Eck, T.F.; Slutsker, I.; Schafer, J.S.; Giles, D.M.; Sorokin, M. Assessment of error in aerosol optical depth measured by AERONET due to aerosol forward scattering. Geophys. Res. Lett. 2012, 39, 23806. [Google Scholar] [CrossRef]
  31. Russell, P.B.; Livingston, J.M.; Dubovik, O.; Ramirez, S.A.; Wang, J.; Redemann, J.; Schmid, B.; Box, M.; Holben, B.N. Sunlight transmission through desert dust and marine aerosols: Diffuse light corrections to Sun photometry and pyrheliometry. J. Geophys. Res. Atmos. 2004, 109, D08207. [Google Scholar] [CrossRef]
  32. Sun, X.; Wang, H.; Shen, J. Multiple scattering characteristics of unpolarized light in dustlike aerosol. Laser Optoelectron. Prog. 2010, 47, 82901. [Google Scholar]
  33. Kinne, S.; Akerman, T.; Shiobara, M.; Uchiyama, A.; Heymsfield, A.J.; Miloshevich, L.M.; Wendell, J.; Eloranta, E.W.; Purgold, C.; Bergstrom, R.W. Cirrus Cloud Radiative and Microphysical Properties from Ground Observations and In Situ Measurements During FIRE 1991 and Their Application to Exhibit Problems in Cirrus Solar Radiative Transfer Modeling. J. Atmos. Sci. 1997, 54, 2320–2344. [Google Scholar] [CrossRef]
  34. Uchiyama, A.; Matsunaga, T.; Yamazaki, A. The instrument constant of sky radiometers (POM-02)–Part 2: Solid view angle. Atmos. Meas. Tech. 2018, 11, 5389–5402. [Google Scholar] [CrossRef]
  35. Shiobara, M.; Asano, S. Estimation of cirrus optical thickness from sun photometer measurements. J. Appl. Meteorol. Clim. 1994, 33, 672–681. [Google Scholar] [CrossRef]
  36. Liou, K.N. An Introduction to Atmospheric Radiation; Meteorological Press: Beijing, China, 2004; p. 343. [Google Scholar]
  37. Fu, Q.; Thorsen, T.J.; Su, J.; Ge, J.M.; Huang, J.P. Test of Mie-based single-scattering properties of non-spherical dust aerosols in radiative flux calculations. J. Quant. Spectrosc. Radiat. Transf. 2009, 110, 1640–1653. [Google Scholar] [CrossRef]
  38. Campanelli, M.; Nakajima, T.; Olivieri, B. Determination of the Solar Calibration Constant for a Sun-Sky Radiometer: Proposal of an In-Situ Procedure. Appl. Opt. 2004, 43, 651–659. [Google Scholar] [CrossRef]
  39. Campanelli, M.; Estellés, V.; Tomasi, C.; Nakajima, T.; Malvestuto, V.; Martínez-Lozano, J.A. Application of the SKYRAD Improved Langley plot method for the in situ calibration of CIMEL Sun-sky photometers. Appl. Opt. 2007, 46, 2688–2702. [Google Scholar] [CrossRef]
  40. Bodhaine, B.A.; Wood, N.B.; Dutton, E.G.; Slusser, J.R. On rayleigh optical depth calculations. J. Atmos. Ocean. Technol. 1999, 16, 1854–1861. [Google Scholar] [CrossRef]
  41. Hong, Y. Fundamentals of Atmospheric Radiation; Meteorological Press: Beijing, China, 1993; pp. 30–192. [Google Scholar]
  42. Shi, G. Atmospheric Radiation; Science Press: Beijing, China, 2007; pp. 367–370. [Google Scholar]
  43. Su, X.L.; Cao, J.J.; Li, Z.Q.; Li, K.T.; Xu, H.; Liu, S.X.; Fan, X.H. Multi-Year Analyses of Columnar Aerosol Optical and Microphysical Properties in Xi’an, a Megacity in Northwestern China. Remote Sens. 2018, 10, 1169. [Google Scholar] [CrossRef]
  44. Nakajima, T.; Tonna, G.; Rao, R.; Boi, P.; Kaufman, Y.; Holben, B. Use of sky brightness measurements from ground for remote sensing of particulate polydispersions. Appl. Optics 1996, 35, 2672–2686. [Google Scholar] [CrossRef] [PubMed]
  45. Smirnov, A.; Holben, B.N.; Eck, T.F.; Dubovik, O.; Slutsker, I. Cloud-screening and quality control algorithms for the AERONET data-base. Remote Sens. Environ. 2000, 73, 337–349. [Google Scholar] [CrossRef]
  46. Khatri, P.; Takamura, T. An algorithm to screen cloud-affected data for sky radiometer data analysis. J. Meteorol. Soc. Jpn. 2009, 87, 189–204. [Google Scholar] [CrossRef]
  47. Kaufman, Y.J.; Gobbi, G.P.; Koren, I. Aerosol climatology using a tunable spectral variability, cloud screening of AERONET data. Geophys. Res. Lett. 2006, 33, L07817. [Google Scholar] [CrossRef]
  48. Che, H.Z.; Shi, G.Y.; Uchiyama, A.; Yamazaki, A.; Chen, H.; Goloub, P. Intercomparison between aerosol optical properties by a PREDE skyradiometer and CIMEL sunphotometer over Beijing, China. Atmos. Chem. Phys. 2008, 8, 3199–3214. [Google Scholar] [CrossRef]
  49. Nakajima, T.; Campanelli, M.; Che, H.Z.; Estellés, V.; Irie, H.; Kim, S.W. An overview of and issues with sky radiometer technology and SKYNET. Atmos. Meas. Tech. 2020, 13, 4195–4218. [Google Scholar] [CrossRef]
  50. Dubovik, O.; Holben, B.; Eck, T.F.; Smirnov, A.; Kaufman, Y.J.; King, M.D. Variability of absorption and optical properties of key aerosol types observed in worldwide locations. J. Atmos. Sci. 2002, 59, 590–608. [Google Scholar] [CrossRef]
  51. Wang, Z.Z.; Liu, D.; Wang, Z.E.; Wang, Y.J.; Khatri, P.; Zhou, J. Seasonal characteristics of aerosol optical properties at the SKYNET Hefei site (31.90° N, 117.17° E) from 2007 to 2013: First long-term AOP over Hefei. J. Geophys. Res. Atmos. 2014, 119, 6128–6139. [Google Scholar] [CrossRef]
Figure 1. The flow chat of the Monte Carlo simulation.
Remotesensing 15 04342 g001
Figure 2. Scattering phase functions (left y-axis) of three typical aerosols at 315 nm and the ratios of it as well as phase functions (right y-axis) for other wavelengths.
Remotesensing 15 04342 g002
Figure 3. P∆Ω as a function of instrument half-FOV for three aerosol types from 315 nm to 400 nm.
Remotesensing 15 04342 g003
Figure 4. Convergence of Monte Carlo simulation for dust aerosol under the different condition of (a) SZA = 0°, (b) 45°, (c) 80° when AOD = 1 and (d) AOD = 2, (e) AOD = 2.5, (f) AOD = 3 when SZA = 45° for the calculation of relative errors at UV bands.
Remotesensing 15 04342 g004
Figure 5. The ratio of forward scattering (Rsca = Nsca/N0, left y-axis) and direct radiation (Rdir = Ndir/N0, right y-axis) entering the FOV of the instrument to solar radiation at TOA at different wavelengths and AODs.
Remotesensing 15 04342 g005
Figure 6. The relative error distributions of three typical aerosol particles ((ad) dust, (eh) water-soluble, (il) soot) caused by forward scattering versus AOD and SZA with four wavelengths of 315 nm, 340 nm, 380 nm, 400 nm.
Remotesensing 15 04342 g006
Figure 7. The correlations of the AOD and corrected AOD for dust aerosol at 315 nm from the approximation method and Monte Carlo simulation.
Remotesensing 15 04342 g007
Figure 8. Daily and monthly variation and mean spectral values of (ac) AOD, (df) SSA and (gi) ASY at 315 nm, 340 nm, 380 nm, 400 nm.
Remotesensing 15 04342 g008
Figure 9. The seasonal and yearly variation of aerosol volume spectrum distribution.
Remotesensing 15 04342 g009
Figure 10. Distribution of the relative error caused by forward scattering effect varying with (a) AOD, (b) SZA and wavelength.
Remotesensing 15 04342 g010
Figure 11. The mean values and standard deviation of relative errors at different wavelengths.
Remotesensing 15 04342 g011
Figure 12. The comparisons of the AODs and corrected AODs of (a) 315 nm, (b) 340 nm, (c) 380 nm, and (d) 400 nm.
Remotesensing 15 04342 g012
Table 1. Aerosol log-normal distribution parameters [41] and effective particle radius.
Typical Aerosolsrm/μmln (σ)re /μm
Dust0.50001.09537.2
Soot0.01180.69310.1
Water-soluble0.00501.09530.04
Table 2. The complex refractive index [42] and SSA of three typical aerosol particles.
Wavelength
/nm
Dust Water-Soluble Soot
Real Imaginary SSAReal Imaginary SSAReal Imaginary SSA
3151.530.0080.61111.530.0080.96161.740.470.3044
3401.530.0080.61671.530.0050.96211.750.470.2943
3801.530.0080.62541.530.0050.96281.750.460.2768
4001.530.0080.62961.530.0050.96301.750.460.2671
Table 3. Number of successful retrieval samples of the sky-radiometer per month.
Months123456789101112
Samples106192614622023246999542374645214219311
Disclaimer/Publisher’s Note: The statements, opinions and data contained in all publications are solely those of the individual author(s) and contributor(s) and not of MDPI and/or the editor(s). MDPI and/or the editor(s) disclaim responsibility for any injury to people or property resulting from any ideas, methods, instructions or products referred to in the content.

