
Insight into the Characteristics and Triggers of Loess Landslides during the 2013 Heavy Rainfall Event in the Tianshui Area, China

1
National Institute of Natural Hazards, Ministry of Emergency Management of China, Beijing 100085, China
2
Key Laboratory of Compound and Chained Natural Hazards Dynamics, Ministry of Emergency Management of China, Beijing 100085, China
3
Institute of Geology, China Earthquake Administration, Beijing 100029, China
4
Key Laboratory of Seismic and Volcanic Hazards, Institute of Geology, China Earthquake Administration, Beijing 100029, China
5
Key Laboratory of Earthquake Prediction, Institute of Earthquake Forecasting, China Earthquake Administration, Beijing 100036, China
*
Author to whom correspondence should be addressed.
Remote Sens. 2023, 15(17), 4304; https://doi.org/10.3390/rs15174304
Submission received: 30 June 2023
/
Revised: 28 August 2023
/
Accepted: 30 August 2023
/
Published: 31 August 2023
(This article belongs to the Special Issue Anticipation of Flash Floods and Rainfall-Induced Hydro-Geomorphic Hazards)
Abstract
:The 2013 heavy rainfall event (from June to July) in the Tianshui area triggered the most serious rainfall-induced group-occurring landslides since 1984, causing extensive casualties and economic losses. To better understand the characteristics and triggers of these loess landslides, we conducted a detailed analysis of the landslides and relevant influencing factors. Based on the detailed rainfall-induced landslide database obtained using visual interpretation of remote sensing images before and after rainfall, the correlation between the landslide occurrence and different influencing factors such as terrain, geomorphology, geology, and rainfall condition was analyzed. This rainfall event triggered approximately 54,000 landslides with a total area of 67.9 km2, mainly consisting of shallow loess landslides with elongated type, shallow rockslides, collapses, and mudflows. The landslides exhibited a clustered distribution, with the majority concentrated in two specific areas (i.e., Niangniangba and Shetang). The abundance index of landslides was closely associated with the hillslope gradient, total rainfall, and drainage (river) density. The landslide area density (LAD) was positively correlated with these influential factors, characterized by either an exponential or a linear relationship. The Middle Devonian Shujiaba formation (D2S) was identified to be highly susceptible to landslides, and the landslide events therein accounted for 35% of the total landslide occurrences within 22% of the study area. In addition, the E-SE aspect was more prone to landslides, while the W-NW aspect exhibited a low abundance of landslides.
1. Introduction
Loesses are predominantly observed in arid and semi-arid regions, and they are a result of the accumulation of fine sand and clay particles transported by wind. Covering approximately 6.6% of China’s total area, loess deposits span about 640,000 km2, with the majority concentrated in the northwest region [1]. Due to the distinct topographic and geomorphological features, as well as engineering properties such as low mechanical strength, the presence of macro-pores, and susceptibility to collapse [2,3], loess landslides are considered to be the most prevalent and serious geological hazard in loess areas. Rainfall is widely acknowledged as a crucial triggering factor for loess landslides. Moreover, the uneven distribution of precipitation in the loess regions, coupled with frequent short-term rainstorms, often gives rise to concentrated and clustered occurrence of rainfall-induced landslides [4,5].
An event-based landslide inventory refers to a newly generated inventory that captures landslides occurring after a significant triggering event, such as an earthquake, a volcanic eruption, or a heavy rainfall event. A detailed and objective landslide inventory is necessary for the regional analysis of landslides triggered by a single extreme event. Furthermore, the data serve as a crucial foundation for subsequent investigations on the spatial distribution characteristics [6,7], susceptibility and hazard assessment [8,9,10], formation mechanisms [11,12], and geomorphological evolution of the relevant landslides [13,14]. In recent years, advancements in RS and GIS technology have led to the development of high-quality earthquake-induced landslide databases [15,16]. Guzzetti et al. [17] provided a comprehensive overview of landslide investigation methods, classifying them into two categories: (1) traditional methods involving geomorphology, on-site surveys, and visual interpretation of aerial photographs; (2) the utilization of airborne LiDAR, as well as automated and semi-automatic techniques for landslide identification in high-precision satellite imagery. Due to the substantial economic and time costs of traditional field investigation methods, utilizing high-resolution optical images in conjunction with semi-automatic and automatic recognition techniques has gradually become popular. Nonetheless, the interpretation accuracy of most of the automated and semi-automatic methods are low, preventing them from achieving dependable recognition precision for landslides triggered by single events. For instance, these approaches cannot accurately demarcate individual landslide boundaries and may even erroneously group multiple landslides as a single event [18,19]. Therefore, the utilization of high-resolution, multi-temporal remote-sensing images, combined with the Google Earth (GE) software, has gained widespread traction for providing a stereoscopic 3D visualization of landslides [20,21]. The successful application of this method in various natural disaster cases and the satisfactory results have further demonstrated its reliability.
Significant progress has been made in constructing earthquake-induced landslide databases, particularly following the 2008 Wenchuan earthquake. Several recent studies indicated that there are 57 publicly available digital landslide catalogs worldwide, of which around 46 provide detailed inventories of coseismic landslides by using polygons to delineate landslide boundaries [16,22,23]. These databases offer vital data for understanding the formation mechanisms and distribution patterns of landslides triggered by individual earthquakes, as well as for evaluating landslide susceptibility and hazard risk in affected areas. Noteworthy examples of high-quality coseismic landslide databases established in the past decade include the 2015 Nepal earthquake [24,25], the 2016 New Zealand earthquake [26,27], the 2018 Palu earthquake [11,28], and the 2022 Luding earthquake [29,30].
However, in contrast to earthquake-induced events, the establishment of landslide inventories associated with heavy rainfall events has encountered enormous challenges, with only a few databases available [10,31,32]. One of the primary challenges is the presence of clouds in the affected areas, which often limits visibility in satellite images and hinders visual interpretation of rainfall-induced landslides [31]. Currently, there are 16 publicly available landslide inventories worldwide that document landslides triggered by heavy rainfall events, most of which are on a small scale. Among these databases, only four contain more than 2000 landslides, including the 6–9 August 2008 Morakot Typhoon event in southern Taiwan [33], the heavy rainfall event in the Teresópolis region of Brazil from 11 to 13 January [32], the long-term heavy rainfall event from 28 June to 9 July 2018 in Hiroshima region of Japan [34], and the Hurricane Maria event in the Dominica region from 18 to 22 September 2017 [35,36]. Thus, compared to earthquake-induced landslide databases, the establishment of landslide inventories associated with heavy rainfall events is more urgently needed.
The 2013 continuous rainfall event in the Tianshui region lasted as long as 38 days (from 19 to 26 July). This intense rainfall process encompasses four episodes of severe short-term rainfall events, accompanied by prolonged periods of intermittent rainfall. Under the influence of extreme rainfall, massive landslides occurred in the Tianshui region, mainly including small-scale shallow loess landslides, debris flows, and mudflows [37,38]. In addition, this event is the most serious rainfall event in the Tianshui area since 1984. The impacted population exceeded 50,000, including 24 fatalities. Nearly 10,000 houses were destructed, leading to an estimated direct economic loss amounting to 8.4 billion yuan [39,40]. In recent years, some detailed investigations of the formation mechanisms, causative factors, and mobility characteristics of typical landslides triggered by this rainfall have been conducted. For instance, Peng et al. [41] analyzed the triggering mechanism and movement process of the Dagou landslide-debris flow with a volume of about 1.9 × 10⁵ m3 in the Maiji area, Tianshui City. The results indicated that the maximum speed of the debris flow reached 7.2 m/s, and the effective rainfall in the early stage was an important triggering factor. With the assistance of an AI-based method, Qi et al. [42] successfully finished the landslide susceptibility mapping and assessed the significance of different factors influencing landslide occurrence in this specific event. Guo, Meng, Li, Xie, Chen, and He [40] and Yu, Zhang, and Hu [39] studied the 708 landslides of this rainfall event based on field investigations. According to their results, the landslides were unevenly distributed and mainly occurred in groups, and the previous effective rainfalls and instantaneous rainfalls with high intensity were the main driving factors for landslide occurrence. However, these studies focused on large-scale landslide events or local areas with severe disasters, and the landslide data used cannot accurately represent the spatial distribution of rainfall-induced landslides, possibly leading to some deviations in understanding the distribution characteristics and controlling factors of landslides in the Tianshui region. Despite the above-mentioned studies, those regarding the distribution characteristics, control factors, and formation process of the landslides caused by this rainfall event are still limited.
The massive landslides triggered by heavy rainfall events in the Tianshui area from June to July 2013 offers a precious opportunity to study the distribution pattern and causative factors of such group-occurring landslides. Therefore, in order to better understand the characteristics and triggers of landslides induced by the 2013 heavy rainfall event in the Tianshui area, we compiled a detailed inventory of these landslides and analyzed the data of relevant influencing factors, including terrain, geomorphology, geology, and rainfall condition. Additionally, we discussed the impact of the previous earthquake events on the occurrence of rainfall-induced landslides. This study is essential for understanding the distribution characteristics and controlling factors of rainfall-induced landslides in the Tianshui region, as well as in loess areas, and may serve as a significant practical guidance for predicting the occurrence of rainstorm-type landslides in the loess area.
2. Study Area
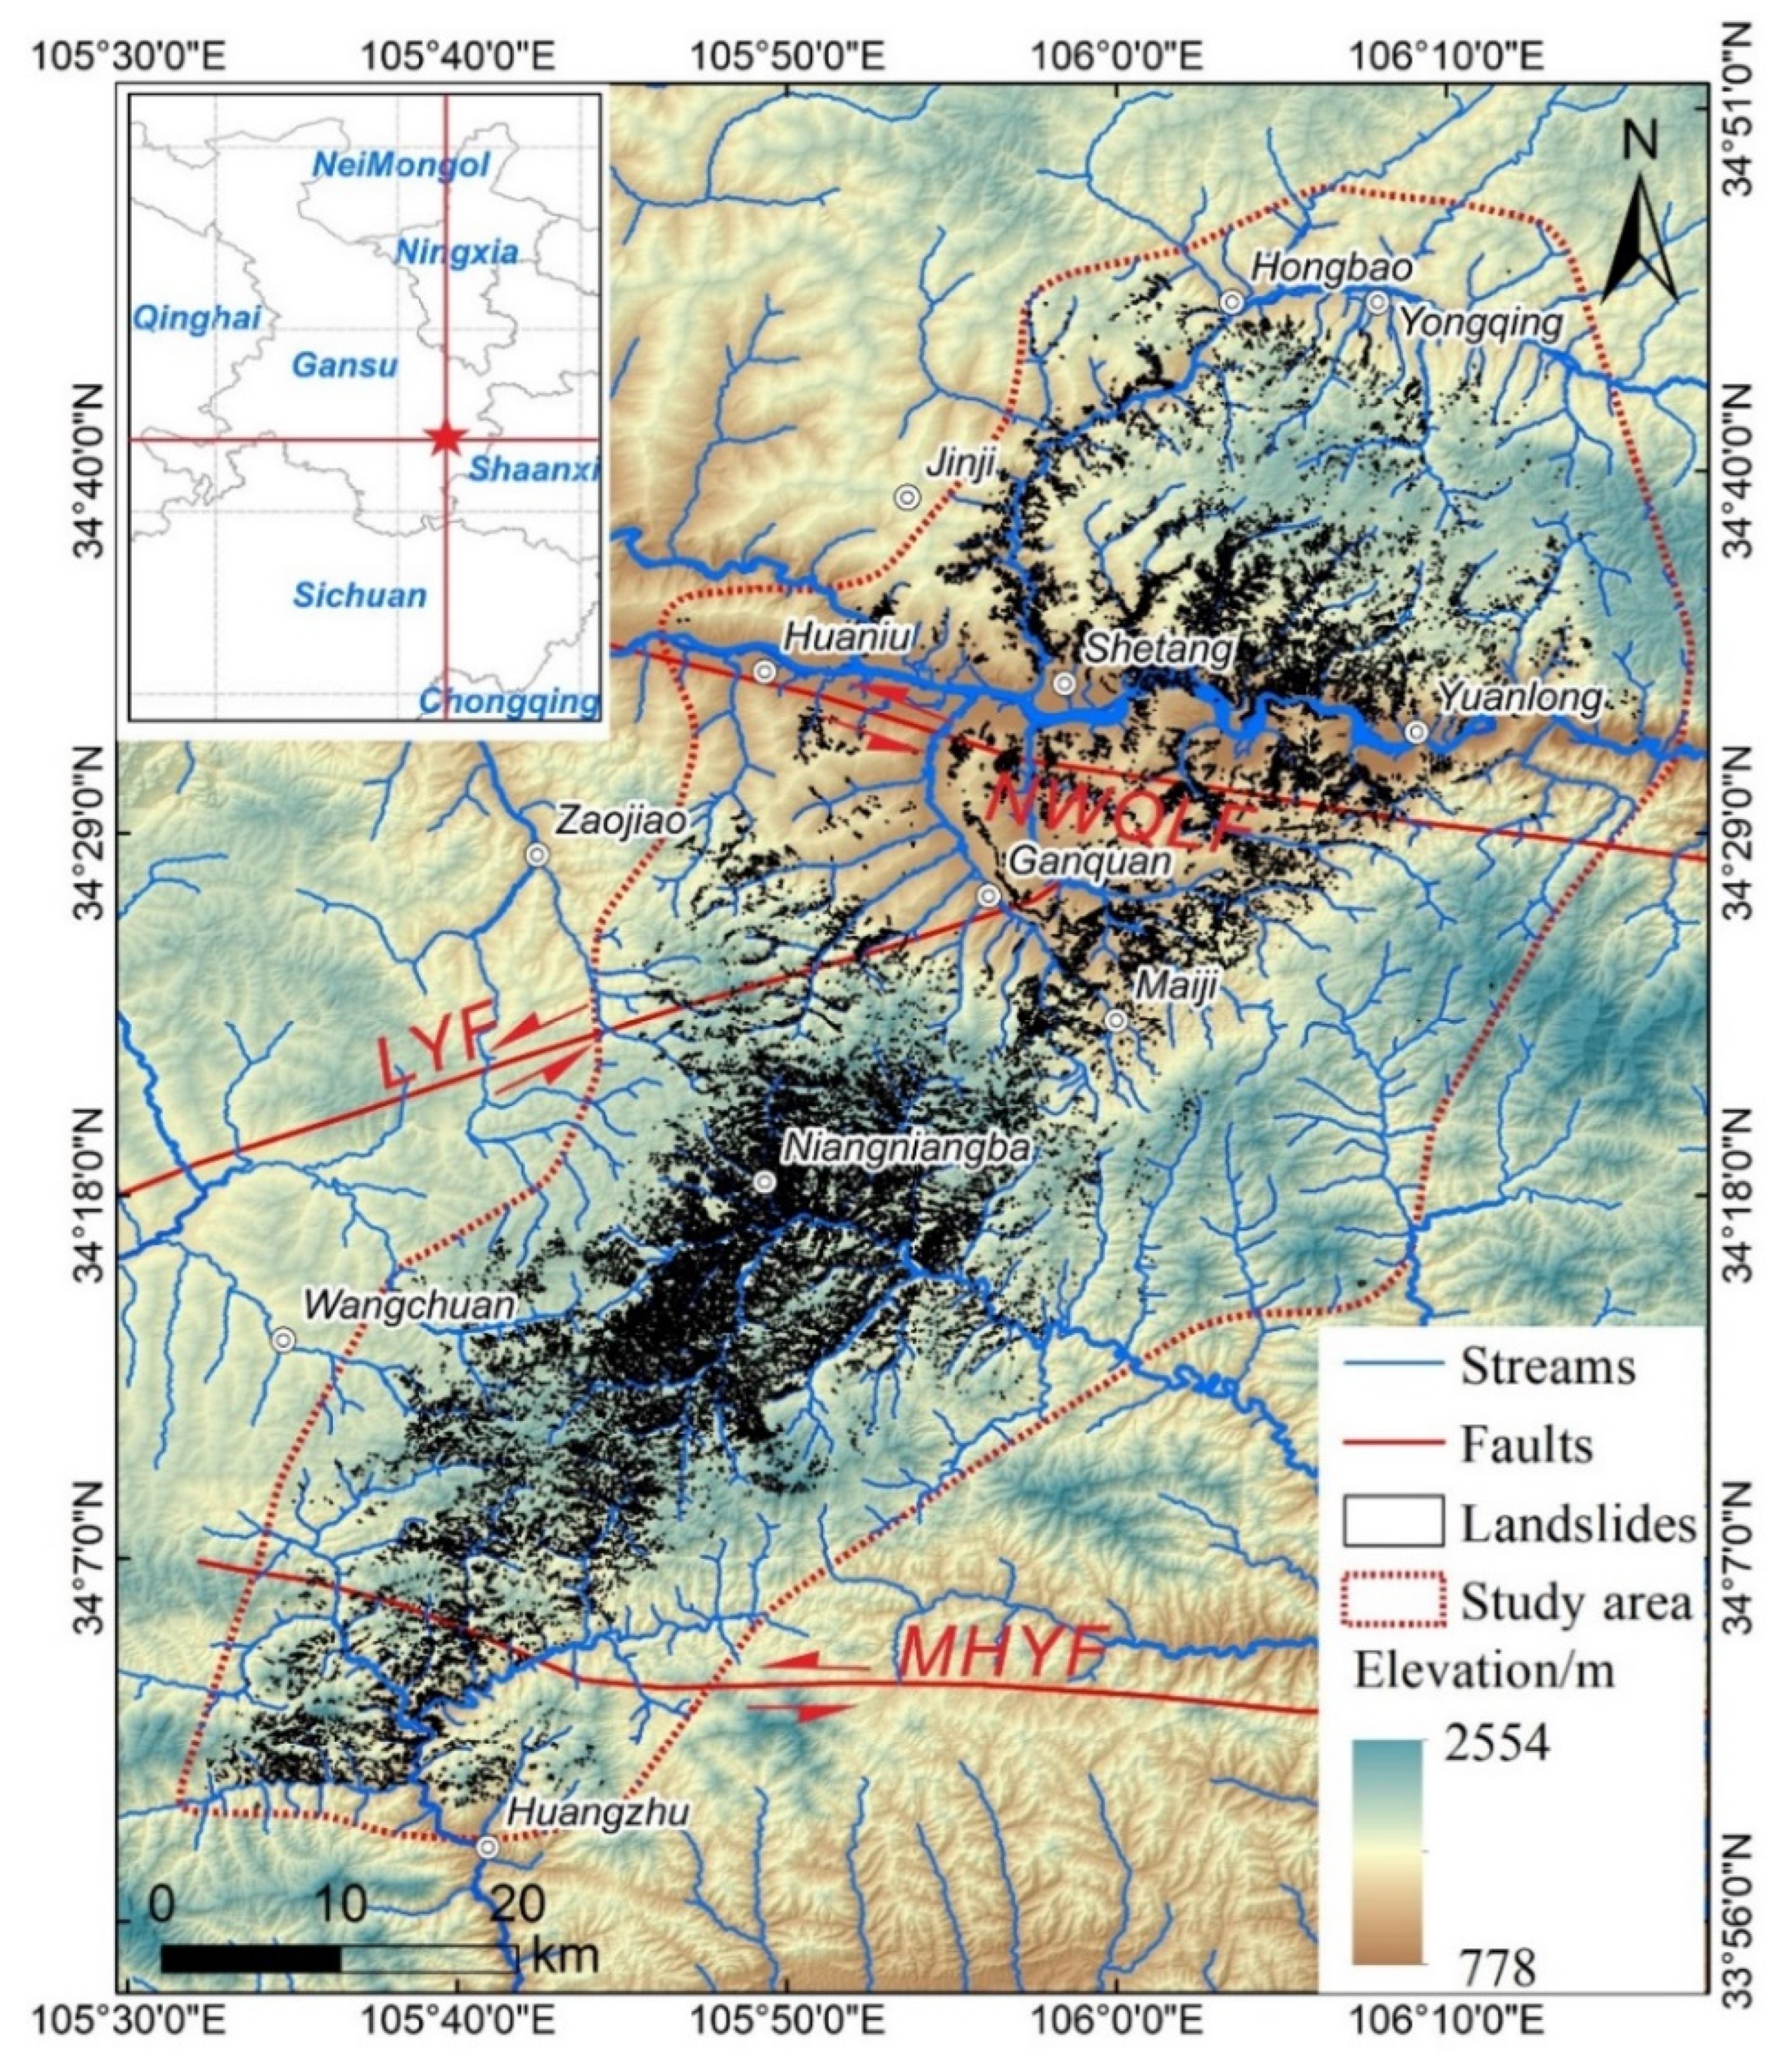
The Tianshui area is one of the regions with the most frequent and severe landslides on the Loess Plateau in China [38,42]. The study area is located at the northern edge of the Western Qinling Mountains, with geographical coordinates ranging from 33.9° to 34.8°N and 105.5° to 106.3°E. The overall terrain is high in the southwest and low in the northeast. The elevation in the study area ranges from 748 to 2600 m, with an average of approximately 1500 m. Due to the fact that its location is at the junction of the Liupan mountains, Mid-Gansu Loess Plateau, and the Qinling Mountains, the local geological environment is complex. There are three major active faults in the study area, namely the Maheyan Fault, Lixian–Luojiapu Fault, and the northern margin of the Western Qinling fault (Figure 1). The region belongs to a semi-alpine and semi-humid climate, influenced by the landforms. The average annual temperature is less than 8 °C, with July being the hottest month with an average temperature of 22.8 °C, and January being the coldest month with an average temperature of −2.0 °C. Furthermore, the annual average precipitation in the region is approximately 600 to 750 mm, with June, July, and August being the months with the highest rainfall, accounting for around 50% of the annual precipitation.
The strata of the study area from new to old include Quaternary (Q), Neogene (N), Paleogene (E), Caotangou formation of middle Carboniferous (C2), late Devonian (D3), Xihanshui formation of middle Devonian (D2x), Shujiaba formation of middle Devonian (D2s), Niutouhe group of Precambrian (PZ1), and magmatic rock (Mag). Specifically, the study area is dominantly covered by the Quaternary (Q), the Shujiaba formation of middle Devonian (D2s), and the magmatic rock (Mag), accounting for about 75% of the area. The Quaternary (Q) strata are mainly composed of fluvial deposits (Q4a1-p1), landslide deposits (Q4del), and eolian loesses (Q3eol), with fluvial deposits mainly distributed along river banks. The main lithology of Shujiaba formation of middle Devonian (D2s) is Quartzite and quartz schist, mixed with sericite quartz schist, which are mainly in the south and central parts of the study area. Magmatic rock is mainly composed of Biotite granite and medium coarse grained granite, which mostly occur as veins. Table 1 depict the primary strata that are exposed within the study area and their corresponding lithological descriptions.
3. Data and Methods
3.1. Rainfall Data
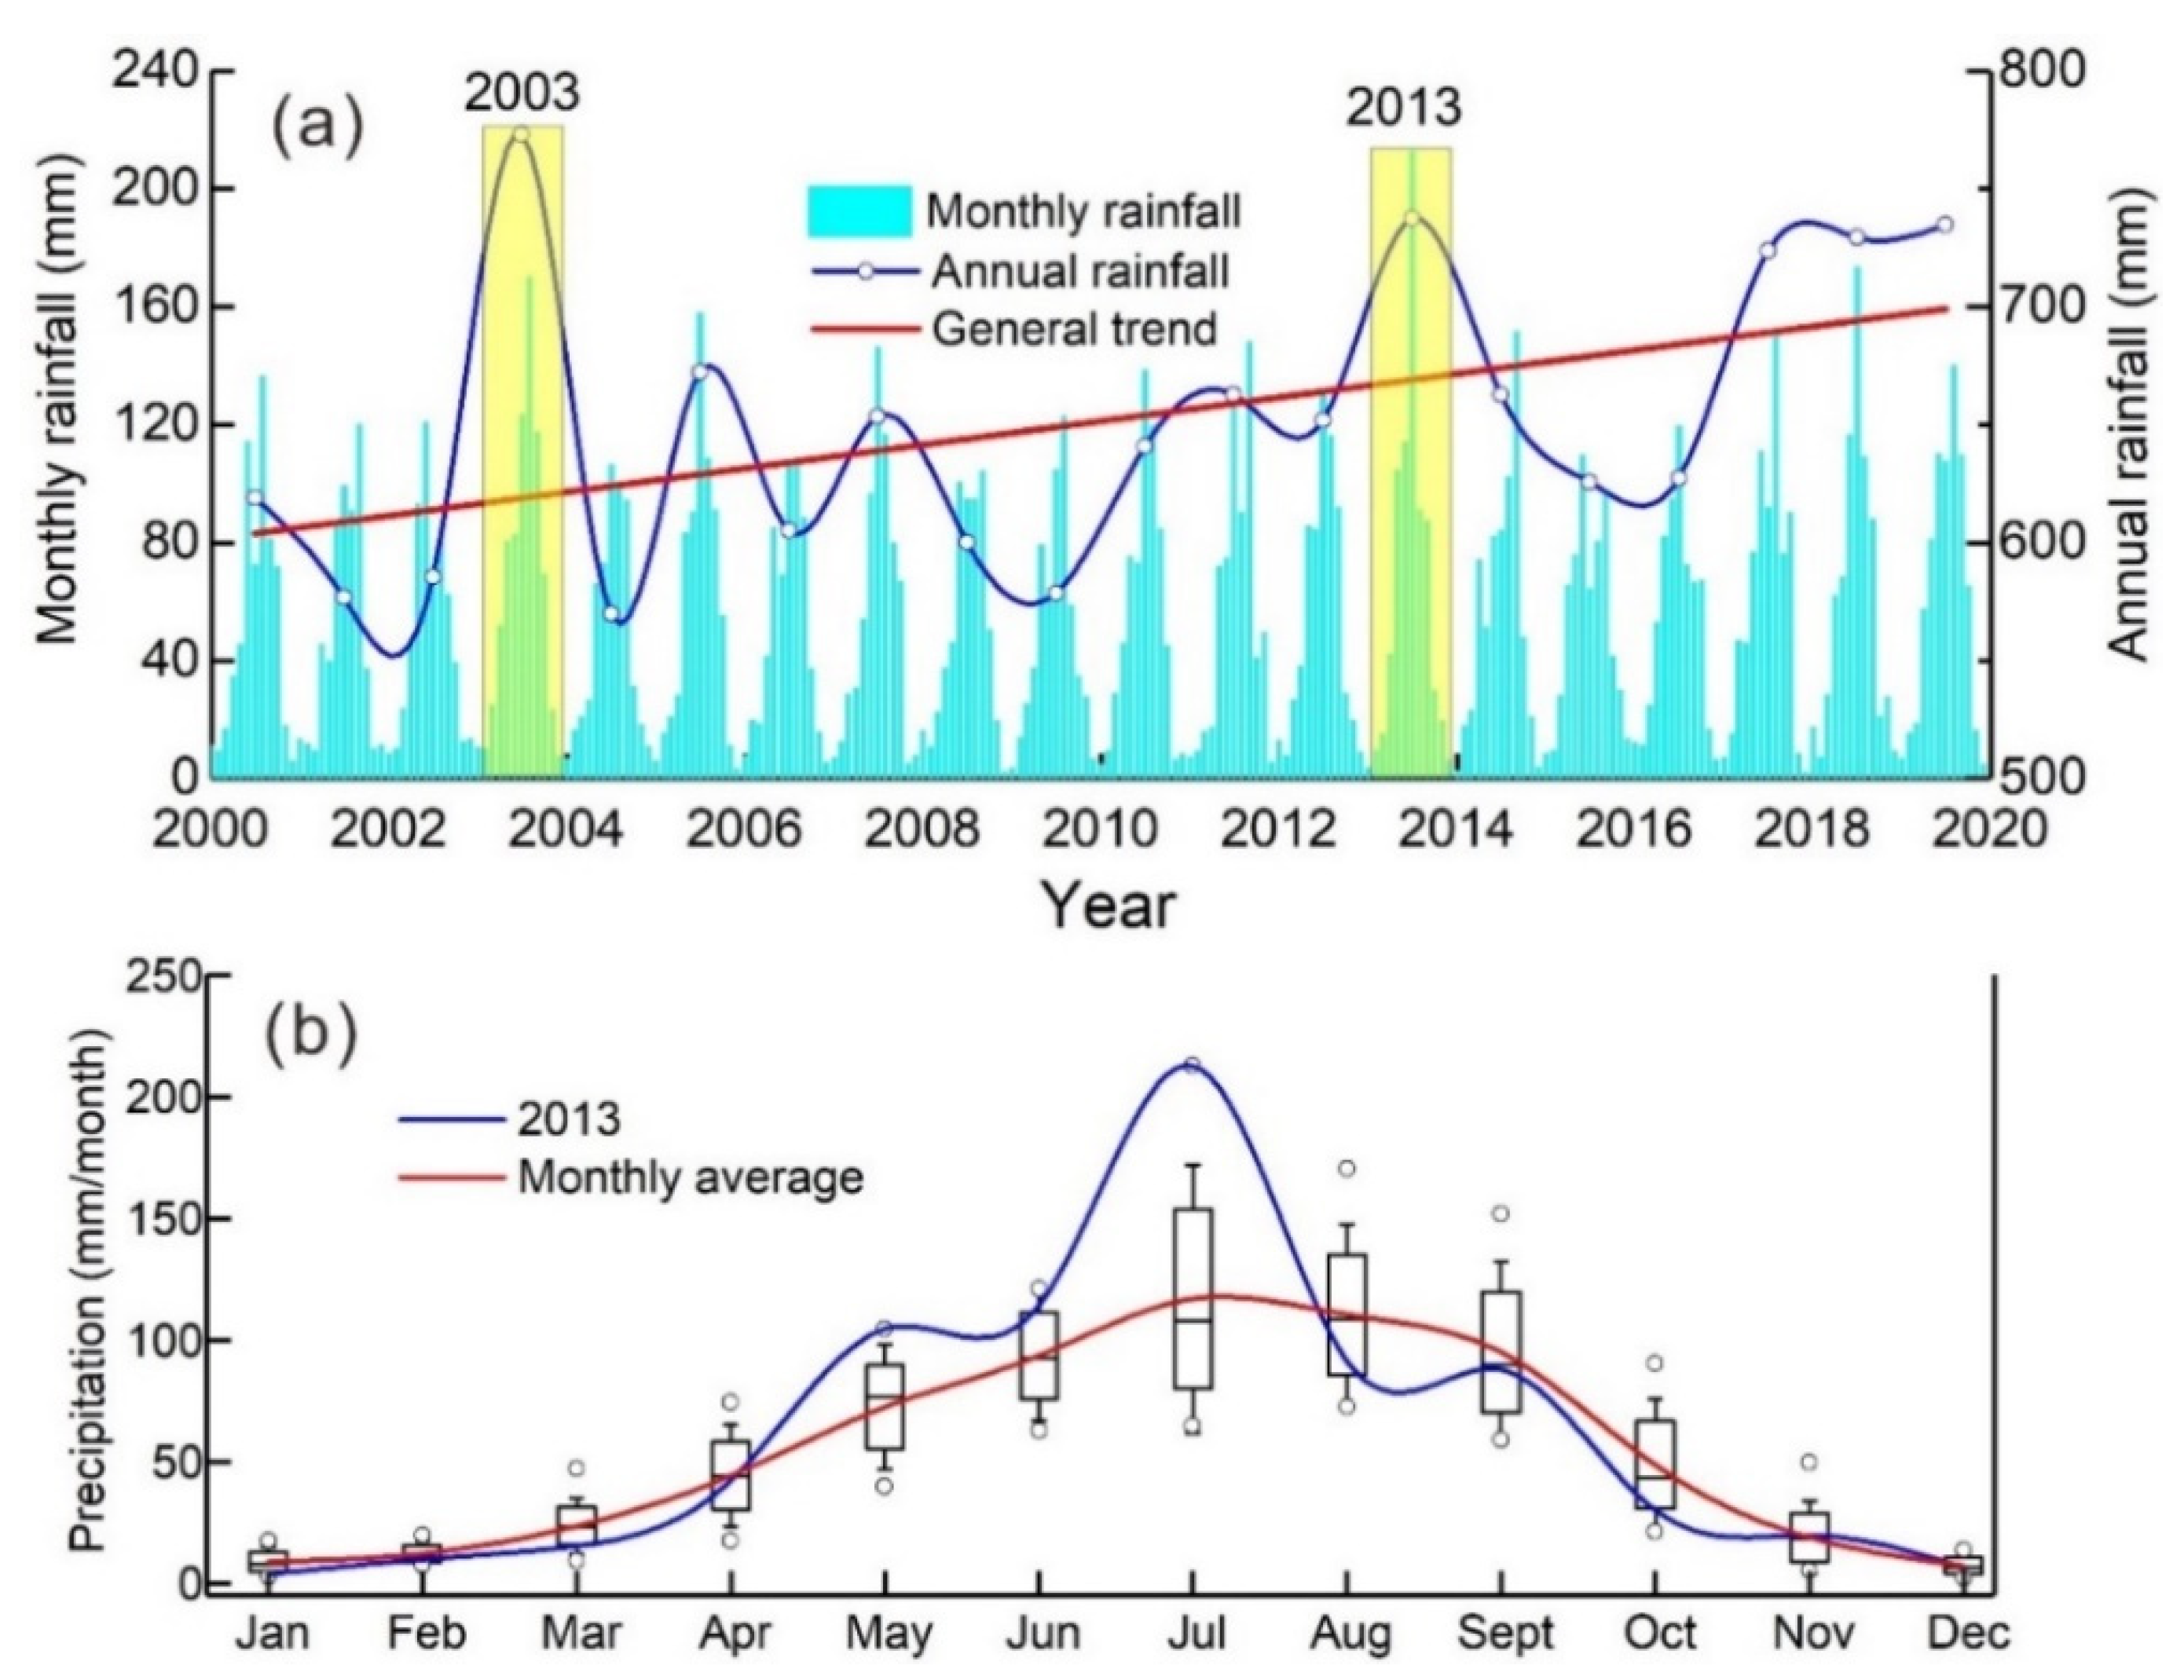
We collected the precipitation data in the Tianshui area from 2000 to 2020. The statistical results indicated that the overall average rainfall in the entire Tianshui area was in the range of 600–750 mm over the past twenty years, but there has been an upward trend in annual rainfall. Specifically, the years 2003 and 2013 recorded the highest rainfall during this period, with annual precipitation exceeding 750 mm (Figure 2a). Comparing the monthly rainfall in 2013 with the average monthly rainfall over the past twenty years, we observed a more concentrated rainfall period in 2013, particularly in June and July, when the rainfall was significantly higher than the average for the same months in previous years. In July of 2013, the rainfall reached 230 mm, which is twice the monthly average (Figure 2b).
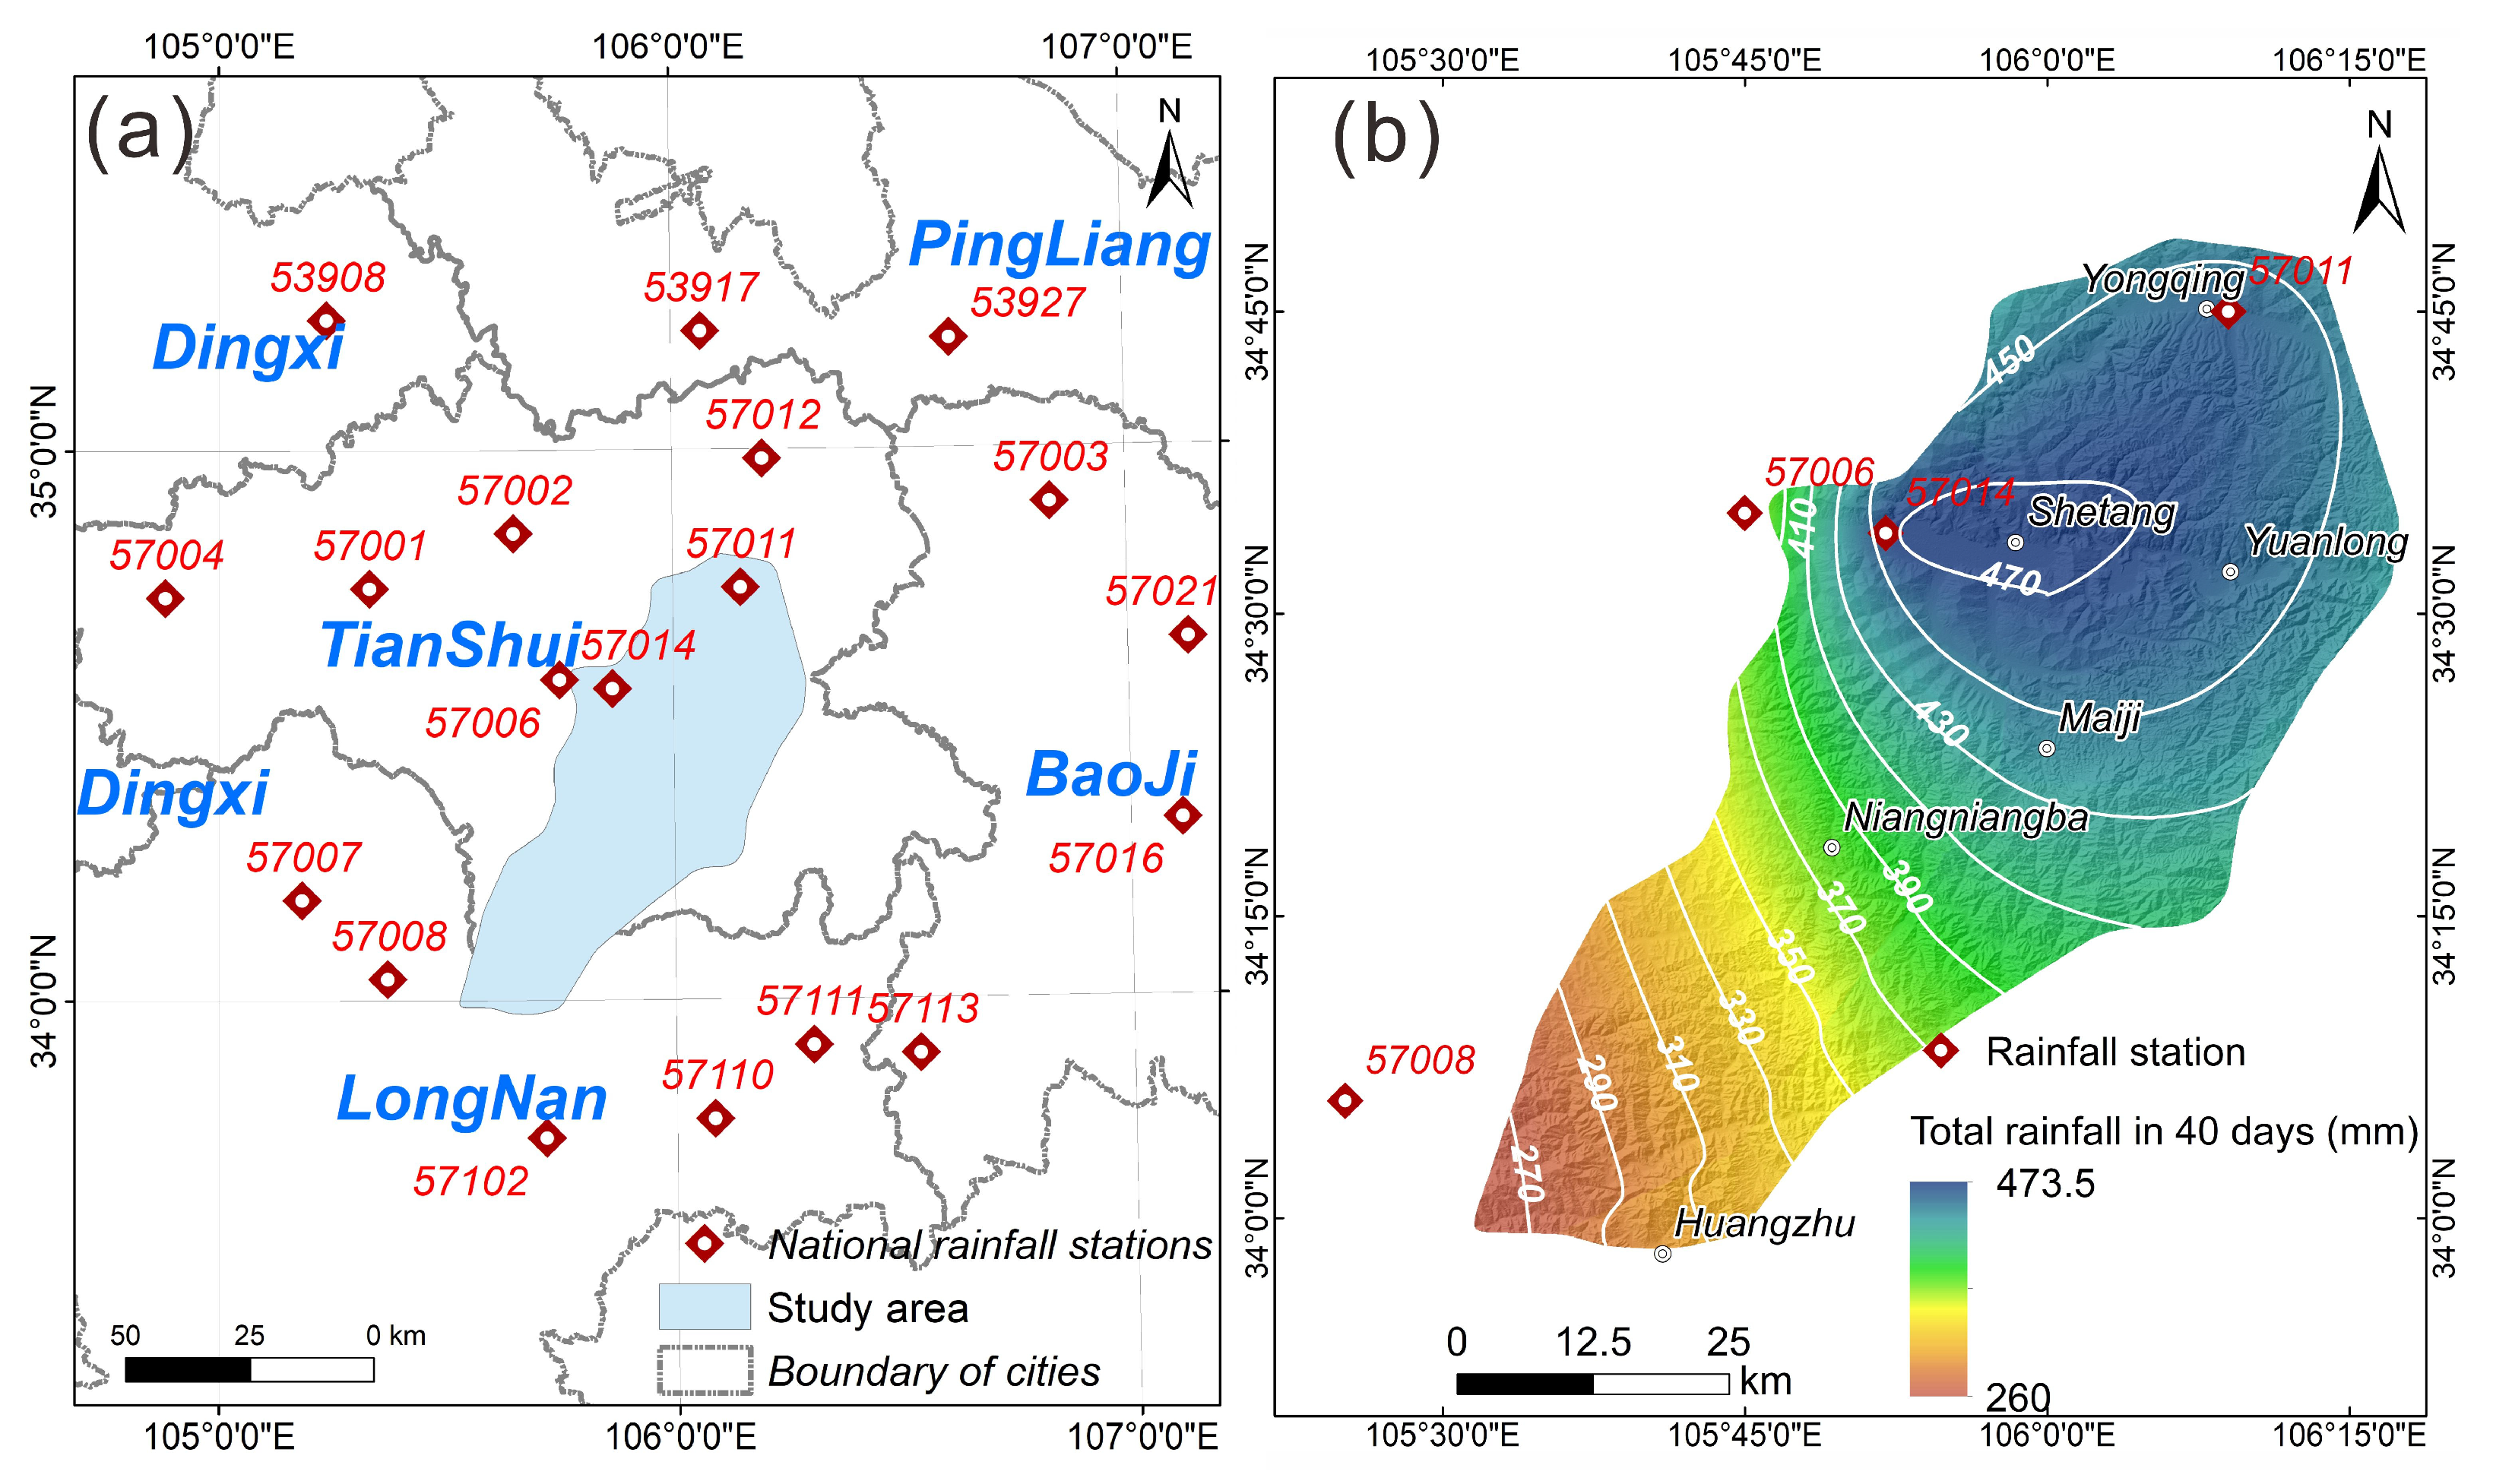
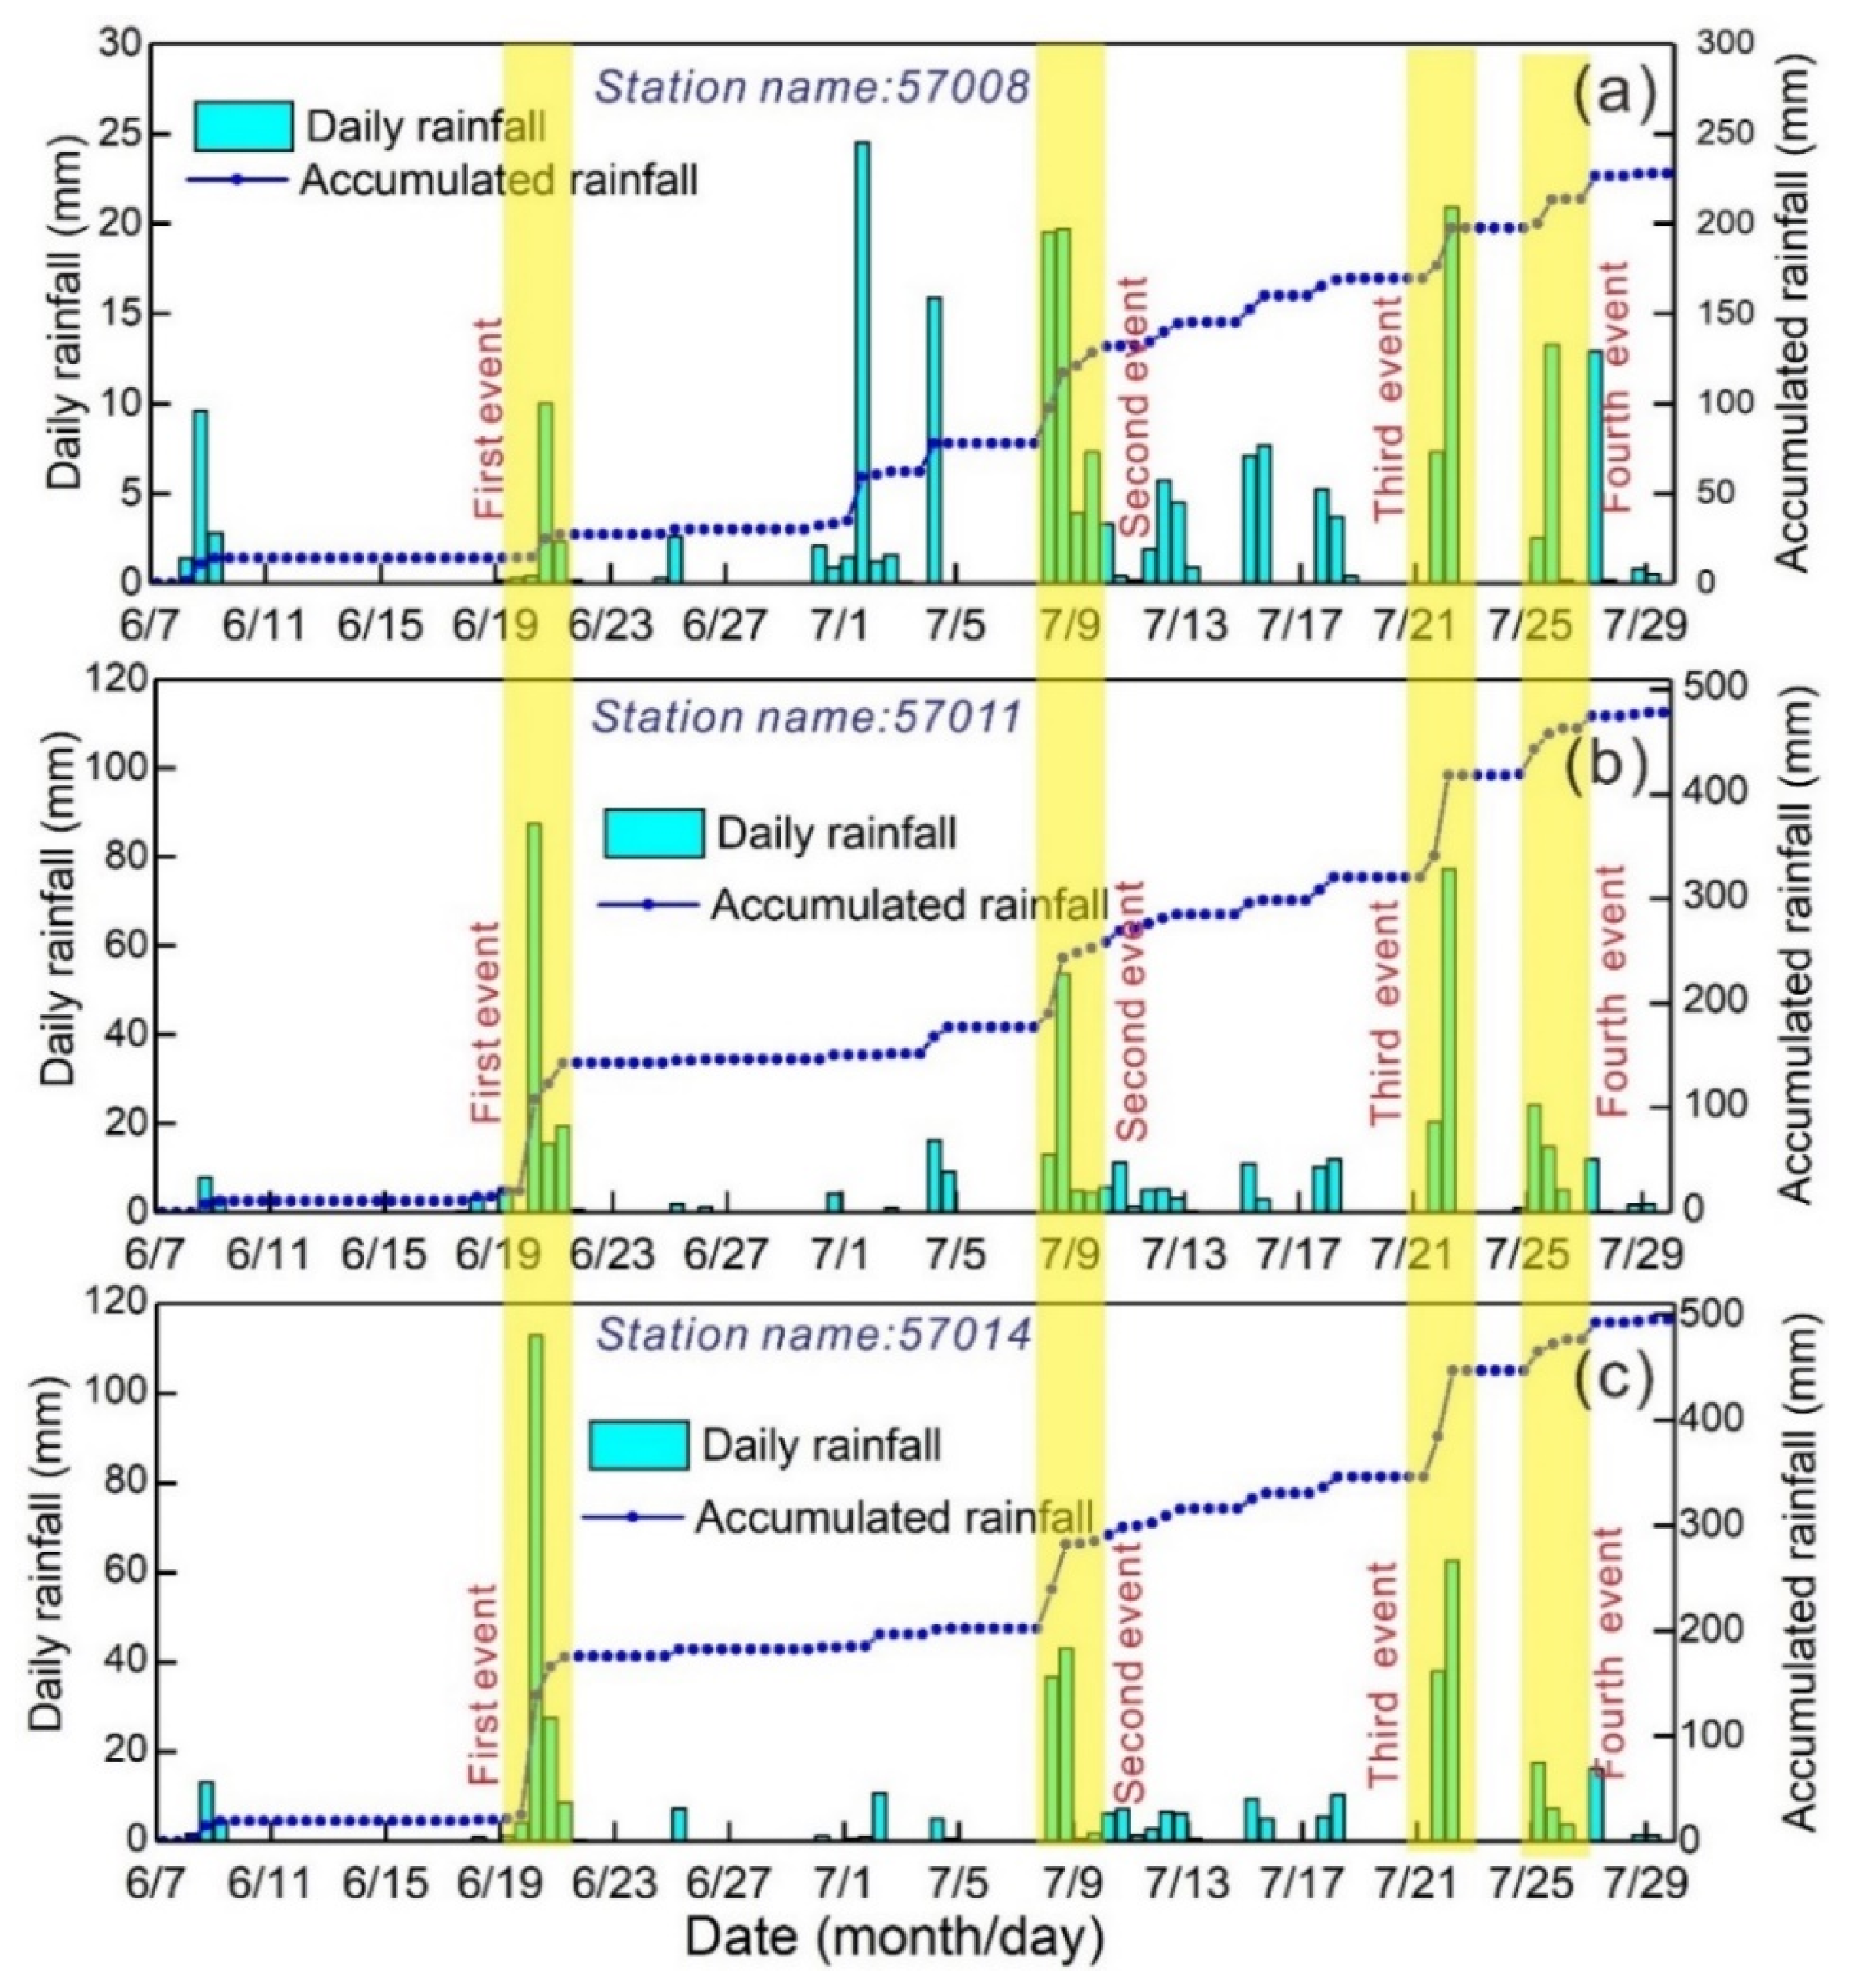
We obtained the rainfall data every 12 h in the study area from June to July using rainfall stations provided by the National Meteorological Administration. Around 14 rainfall stations within a 100 km range of the study area were utilized for interpolation. The widely-used Kriging method was selected to interpolate the rainfall data and generate the spatial distribution of rainfall in the study area. According to the data, the rainfall persisted for approximately 40 days, from 19 June to 26 July. The total cumulative rainfall in the study area ranged from 260 mm to 470 mm. Higher rainfall values were mainly in the northeast, while lower values were in the southwest (Figure 3). Notably, the Shetang area experienced the highest rainfall, reaching approximately 470 mm. Figure 4 displays the rainfall data from two stations located in the northwest and southwest for the period of June to July. The analysis of the rainfall data revealed the occurrence of four intense short-term heavy rainfall events. In addition to these events, there were also prolonged periods of intermittent rainfall. These short-term events all lasted approximately two to three days, and occurred from 19 to 21 June, 8 to 10 July, 20 to 22 July, and 24 to 25 July, respectively. Furthermore, the rainfall recorded at stations 57006 and 57014 in the northern area was significantly higher than that at rainfall station 57008 in the southern area.
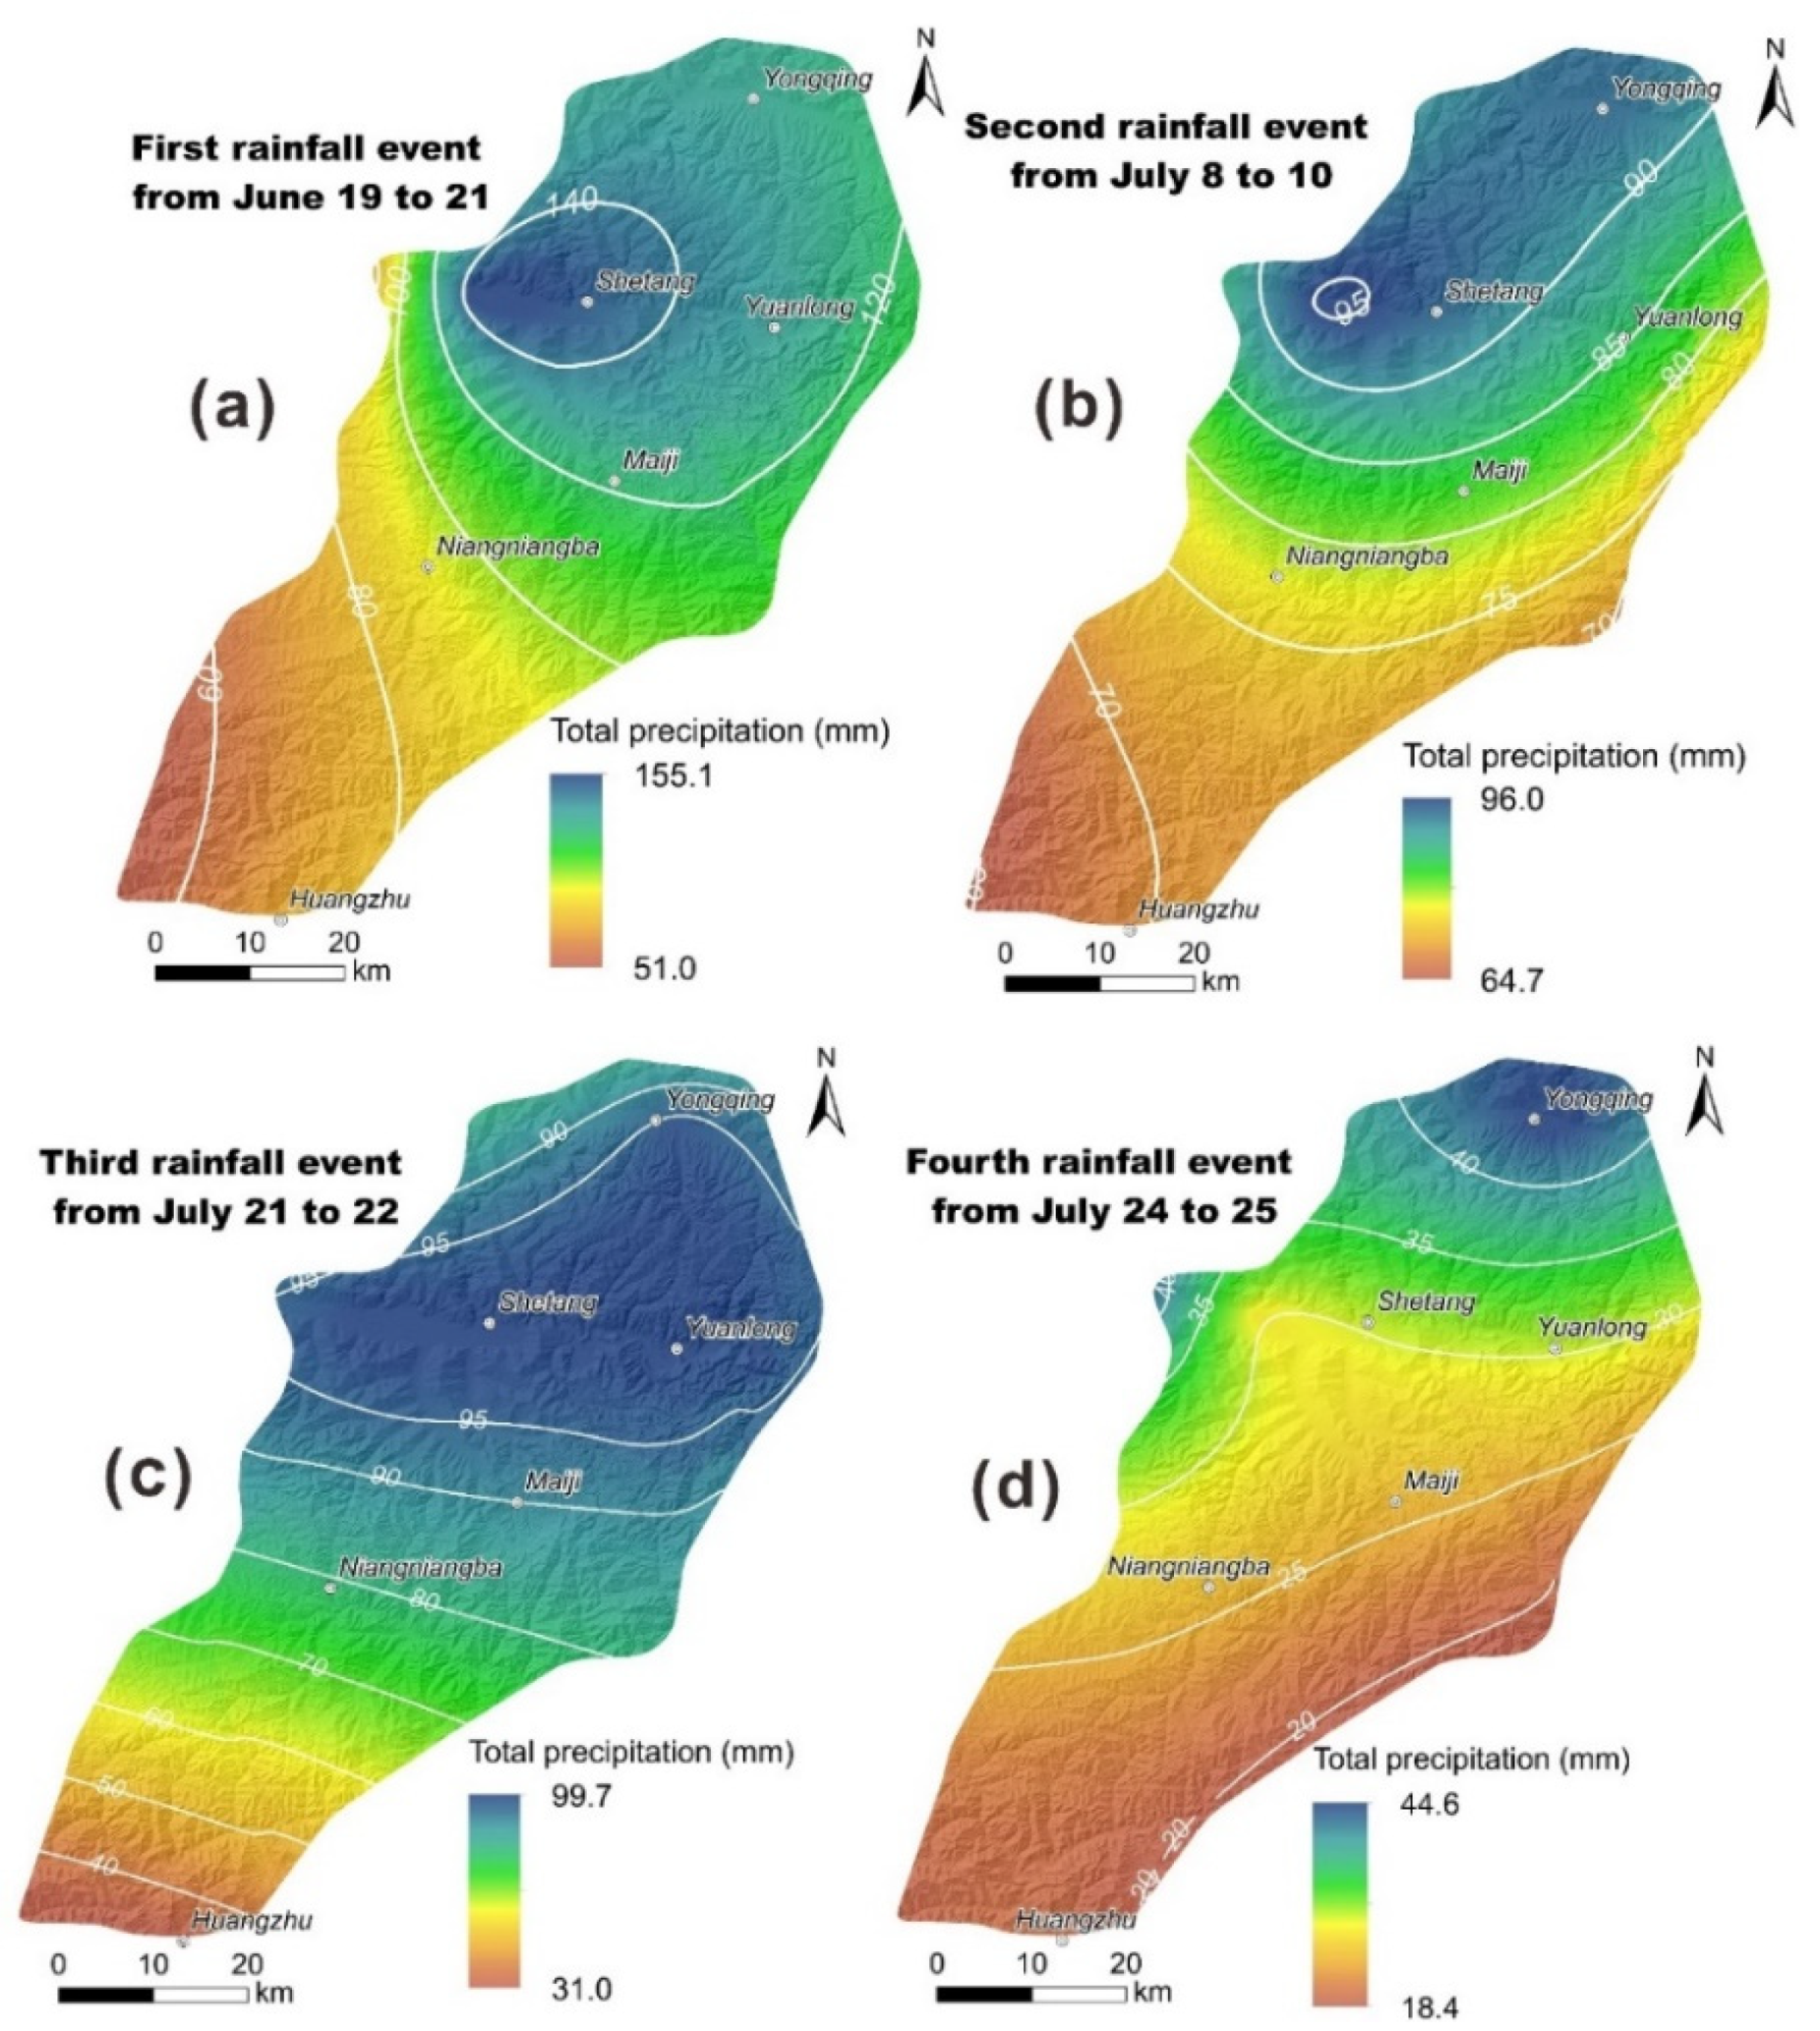
Based on the rainfall data and Kriging interpolation, we obtained the rainfall distribution for the four short-term heavy rainfall events (Figure 5). It was observed that the rainfall in the northern region was slightly higher than that in the southern region. The rainfall amount of the initial two events was larger than the subsequent two events. In addition, we observed a considerable time gap between the first and second rainfall events, whereas the time interval between the third and fourth ones was short.
3.2. Other Influencing Factors
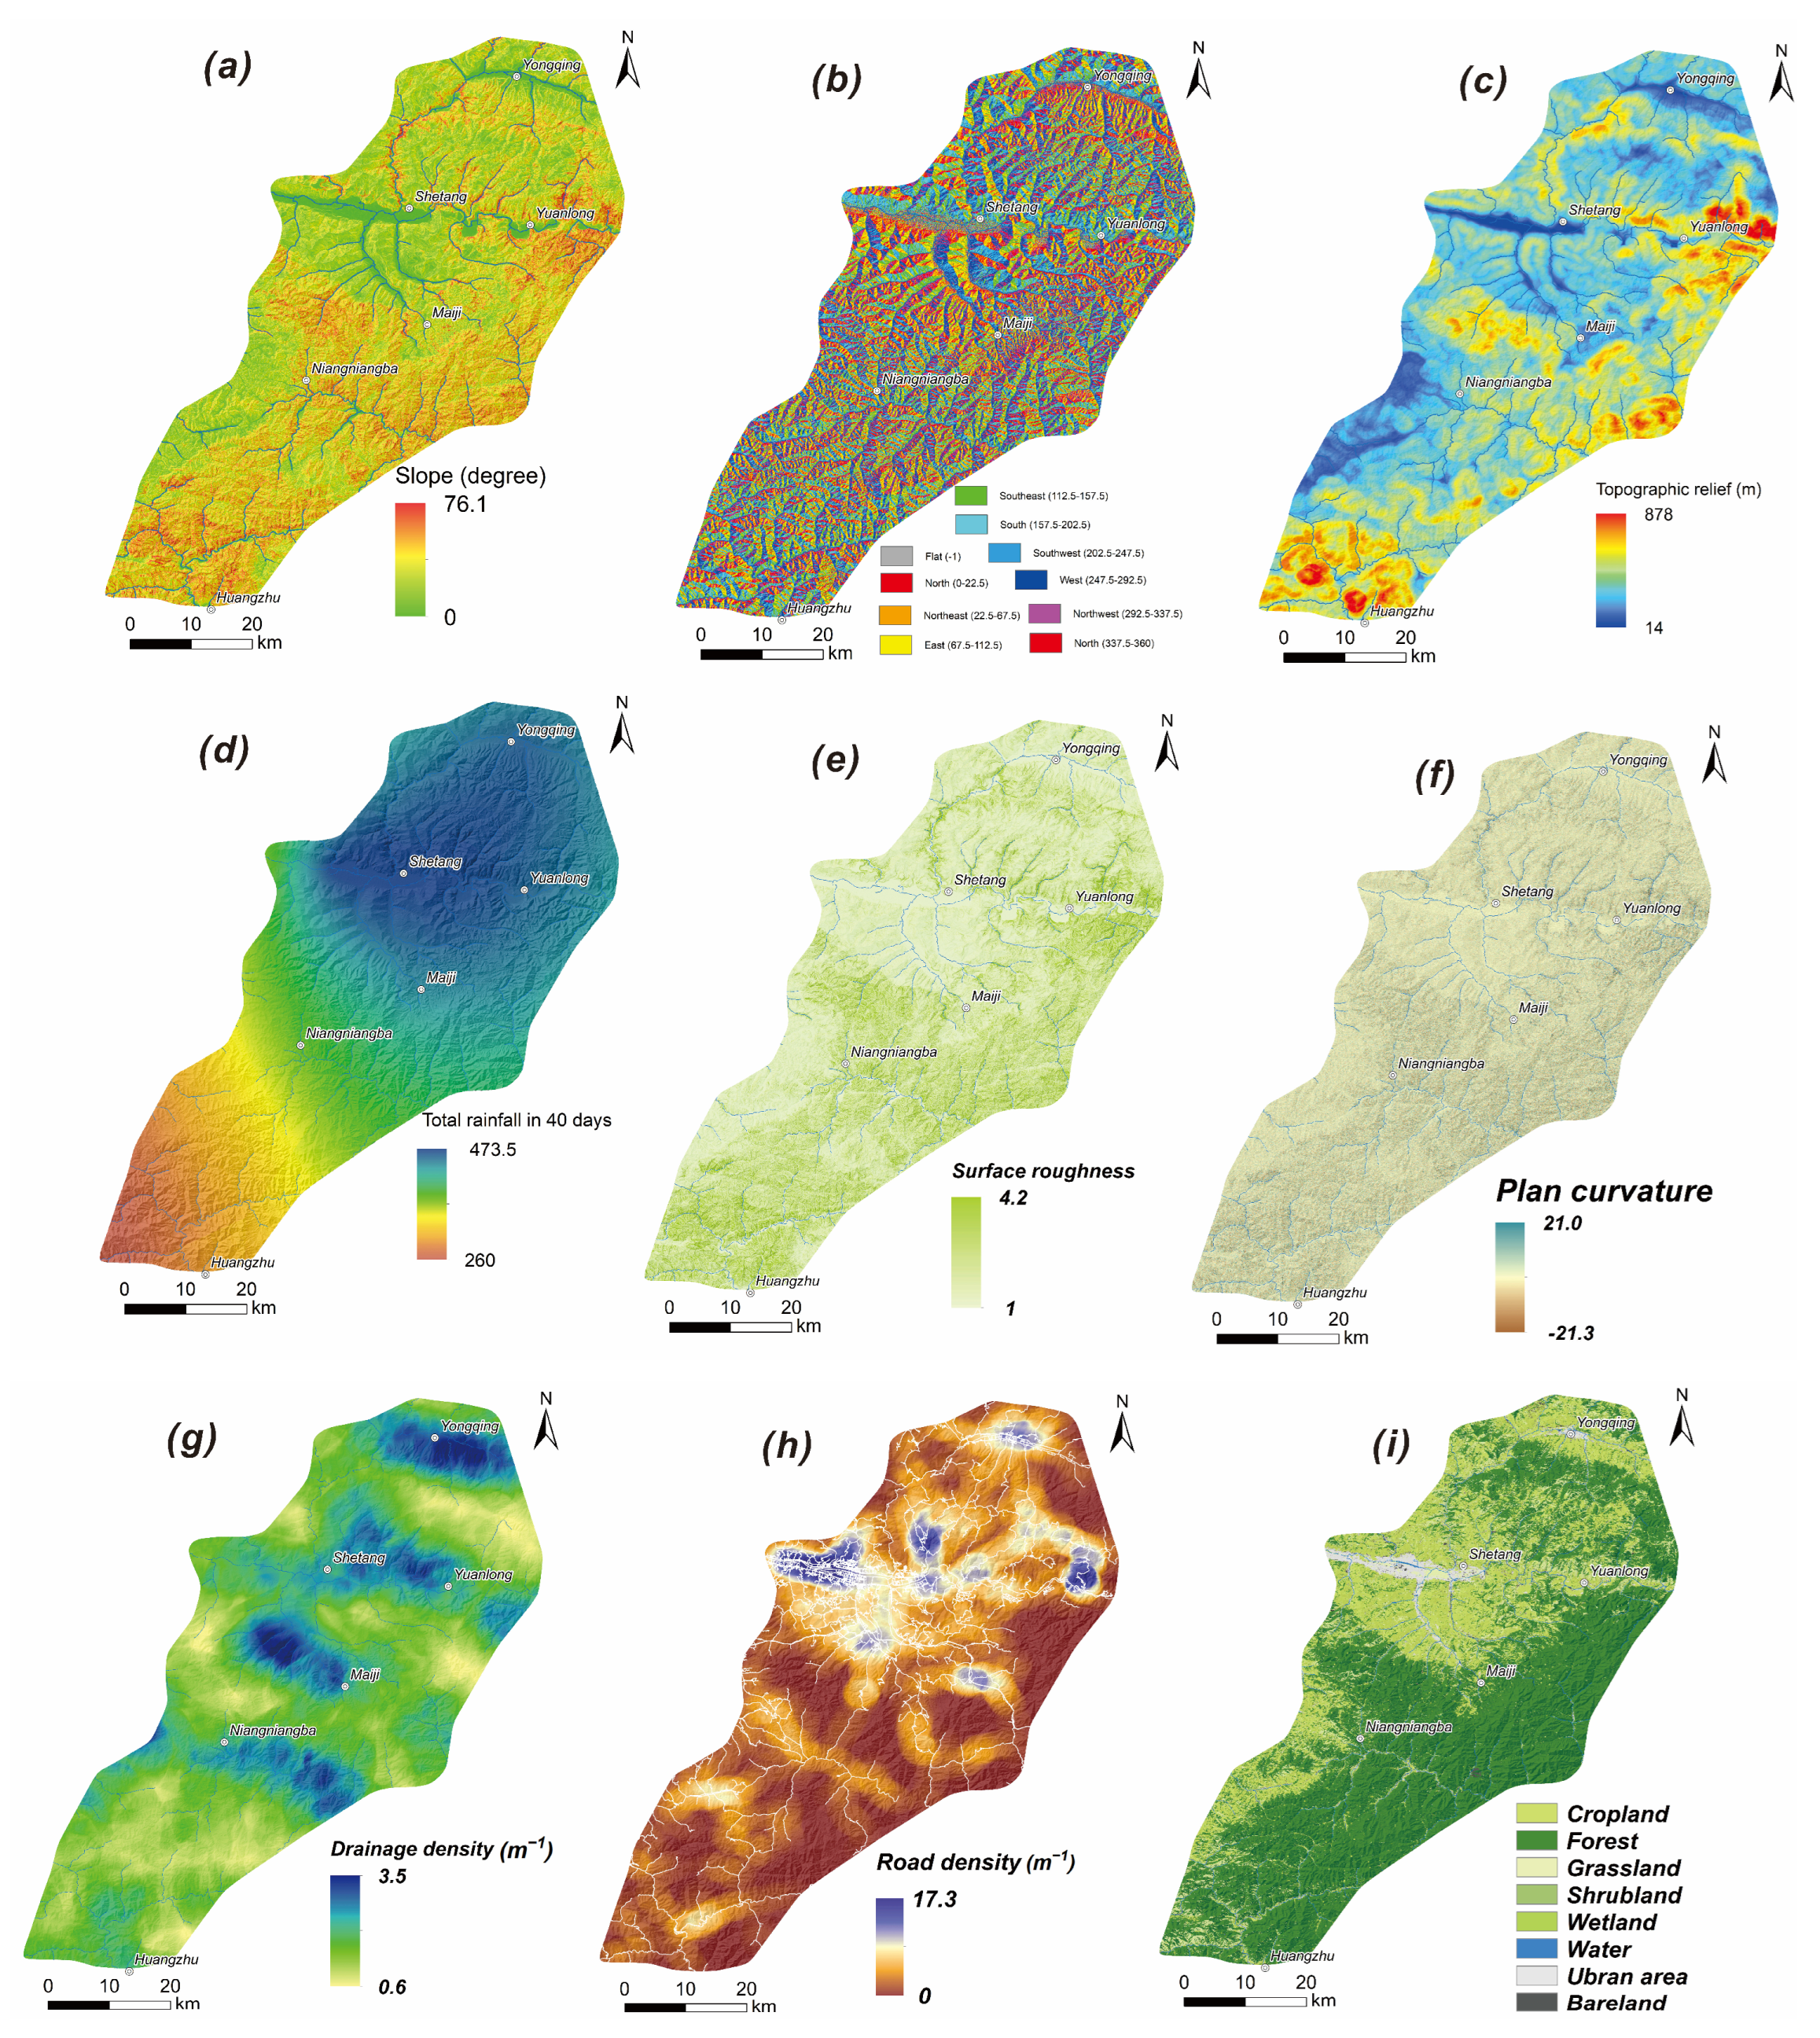
To investigate the influence of different factors on the distribution of landslides triggered by the Tianshui rainfall event, we obtained various terrain metrics, lithologic information, and hydrological data. The terrain metrics encompass elevation, hillslope gradient, surface roughness, plan curvature, and topographic relief. The elevation data utilized in this study were acquired from ALOS PALSAR DEM (Digital Elevation Model) with a resolution of 12.5 m. From this dataset, we derived the distribution of the hillslope gradient and aspect. Additionally, we computed the topographic relief by determining the elevation range within a 2.5 km radius. For surface roughness, the roughness index was calculated by a 13 × 13 matrix to obtain the standard deviation of slope gradients, the value of which was interpreted as the roughness index [43]. Drainage information was derived from the DEM using the ArcGIS software. The data of main roads in the study area were derived from OpenStreetMap Data. Lithology data were obtained from 1:200,000 geological maps published by China Geological Survey (http://dcc.cgs.gov.cn/ (accessed on 17 August 2022)). We used Land-use and land-cover (LULC) data as a proxy for vegetation cover, and the LULC map was derived from the 10 m resolution global land cover results [44]. Finally, eleven influencing factors (i.e., elevation, hillslope gradient, aspect, relief, total rainfall, surface roughness, plan curvature, drainage density, road density, LULC, and lithology) were considered for the statistical analysis (Figure 6) and were then converted into a raster format utilizing a grid cell size of 12.5 m.
3.3. Method
In this study, the frequency density (FD) was used to analyze the distribution of landslide and landscape area (i.e., non-landslide area) in each influencing factor. The FD distribution of these influencing factors was calculated separately for landslide and landscape areas by Equation (1). The landslide abundance index, often measured using landslide density, is a commonly utilized index to assess the characteristics of landslides [11,12,45].
where FD is the frequency density; I represents the cell number of landslides or landscape area in the interval, represents the i’s area of each class, represents the total i’s area, and represents the i’s Classification interval.
The impact degree of landslides varies on different sections of slopes [46]. To account for this variability, we computed the relative positions of individual landslides with respect to the ridge () and the valley of the specific slope (), as proposed by Meunier, Hovius, and Haines [46] (Equation (2)). Landslides positioned along the x-axis indicate origins near or at the crest, with smaller x-axis values indicating closer proximity to the ridge. On the other hand, landslides located along the y-axis are associated with channels, and larger y-axis values indicate greater distances from the channel. Landslides positioned away from both axes are considered to be in a mid-slope position [11,46].
The parameter ranges from 0 to 1, where 0 represents the head scarp of the landslide located at the mountain ridge, and 1 corresponds to the river channel. varies in the opposite way, that is, 0 represents the deposit area of the landslide located at the river channel, and 1 corresponds to the mountain ridge.
4. Results
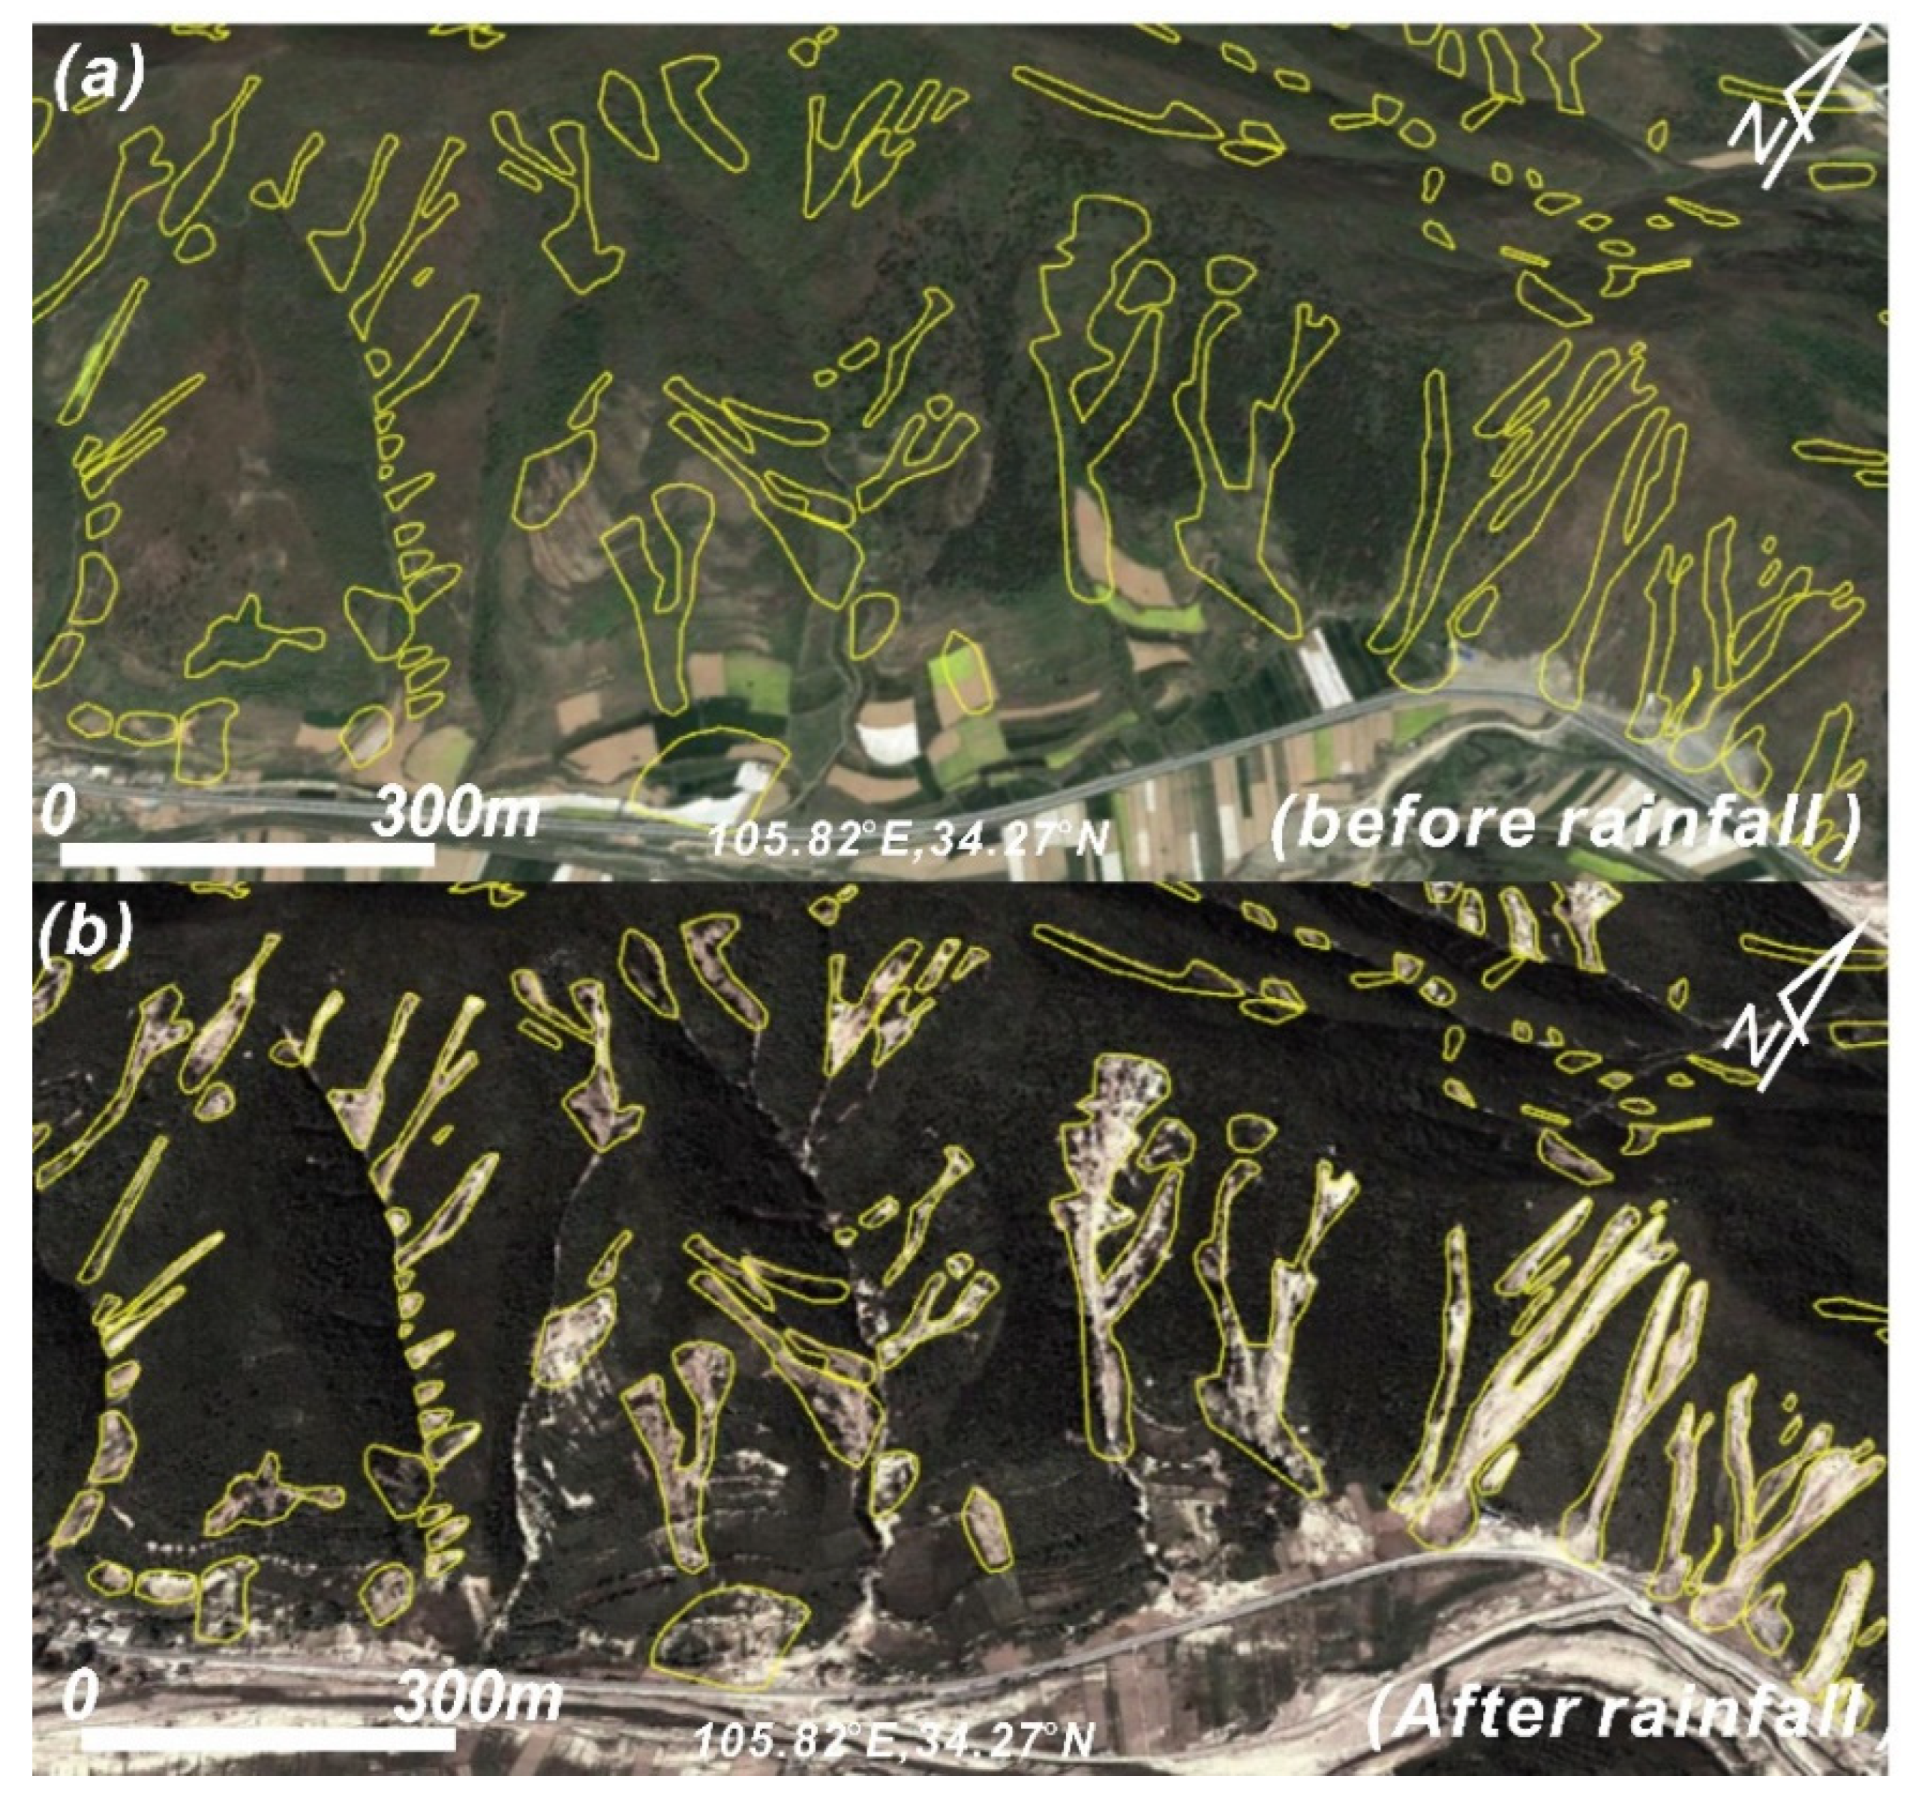
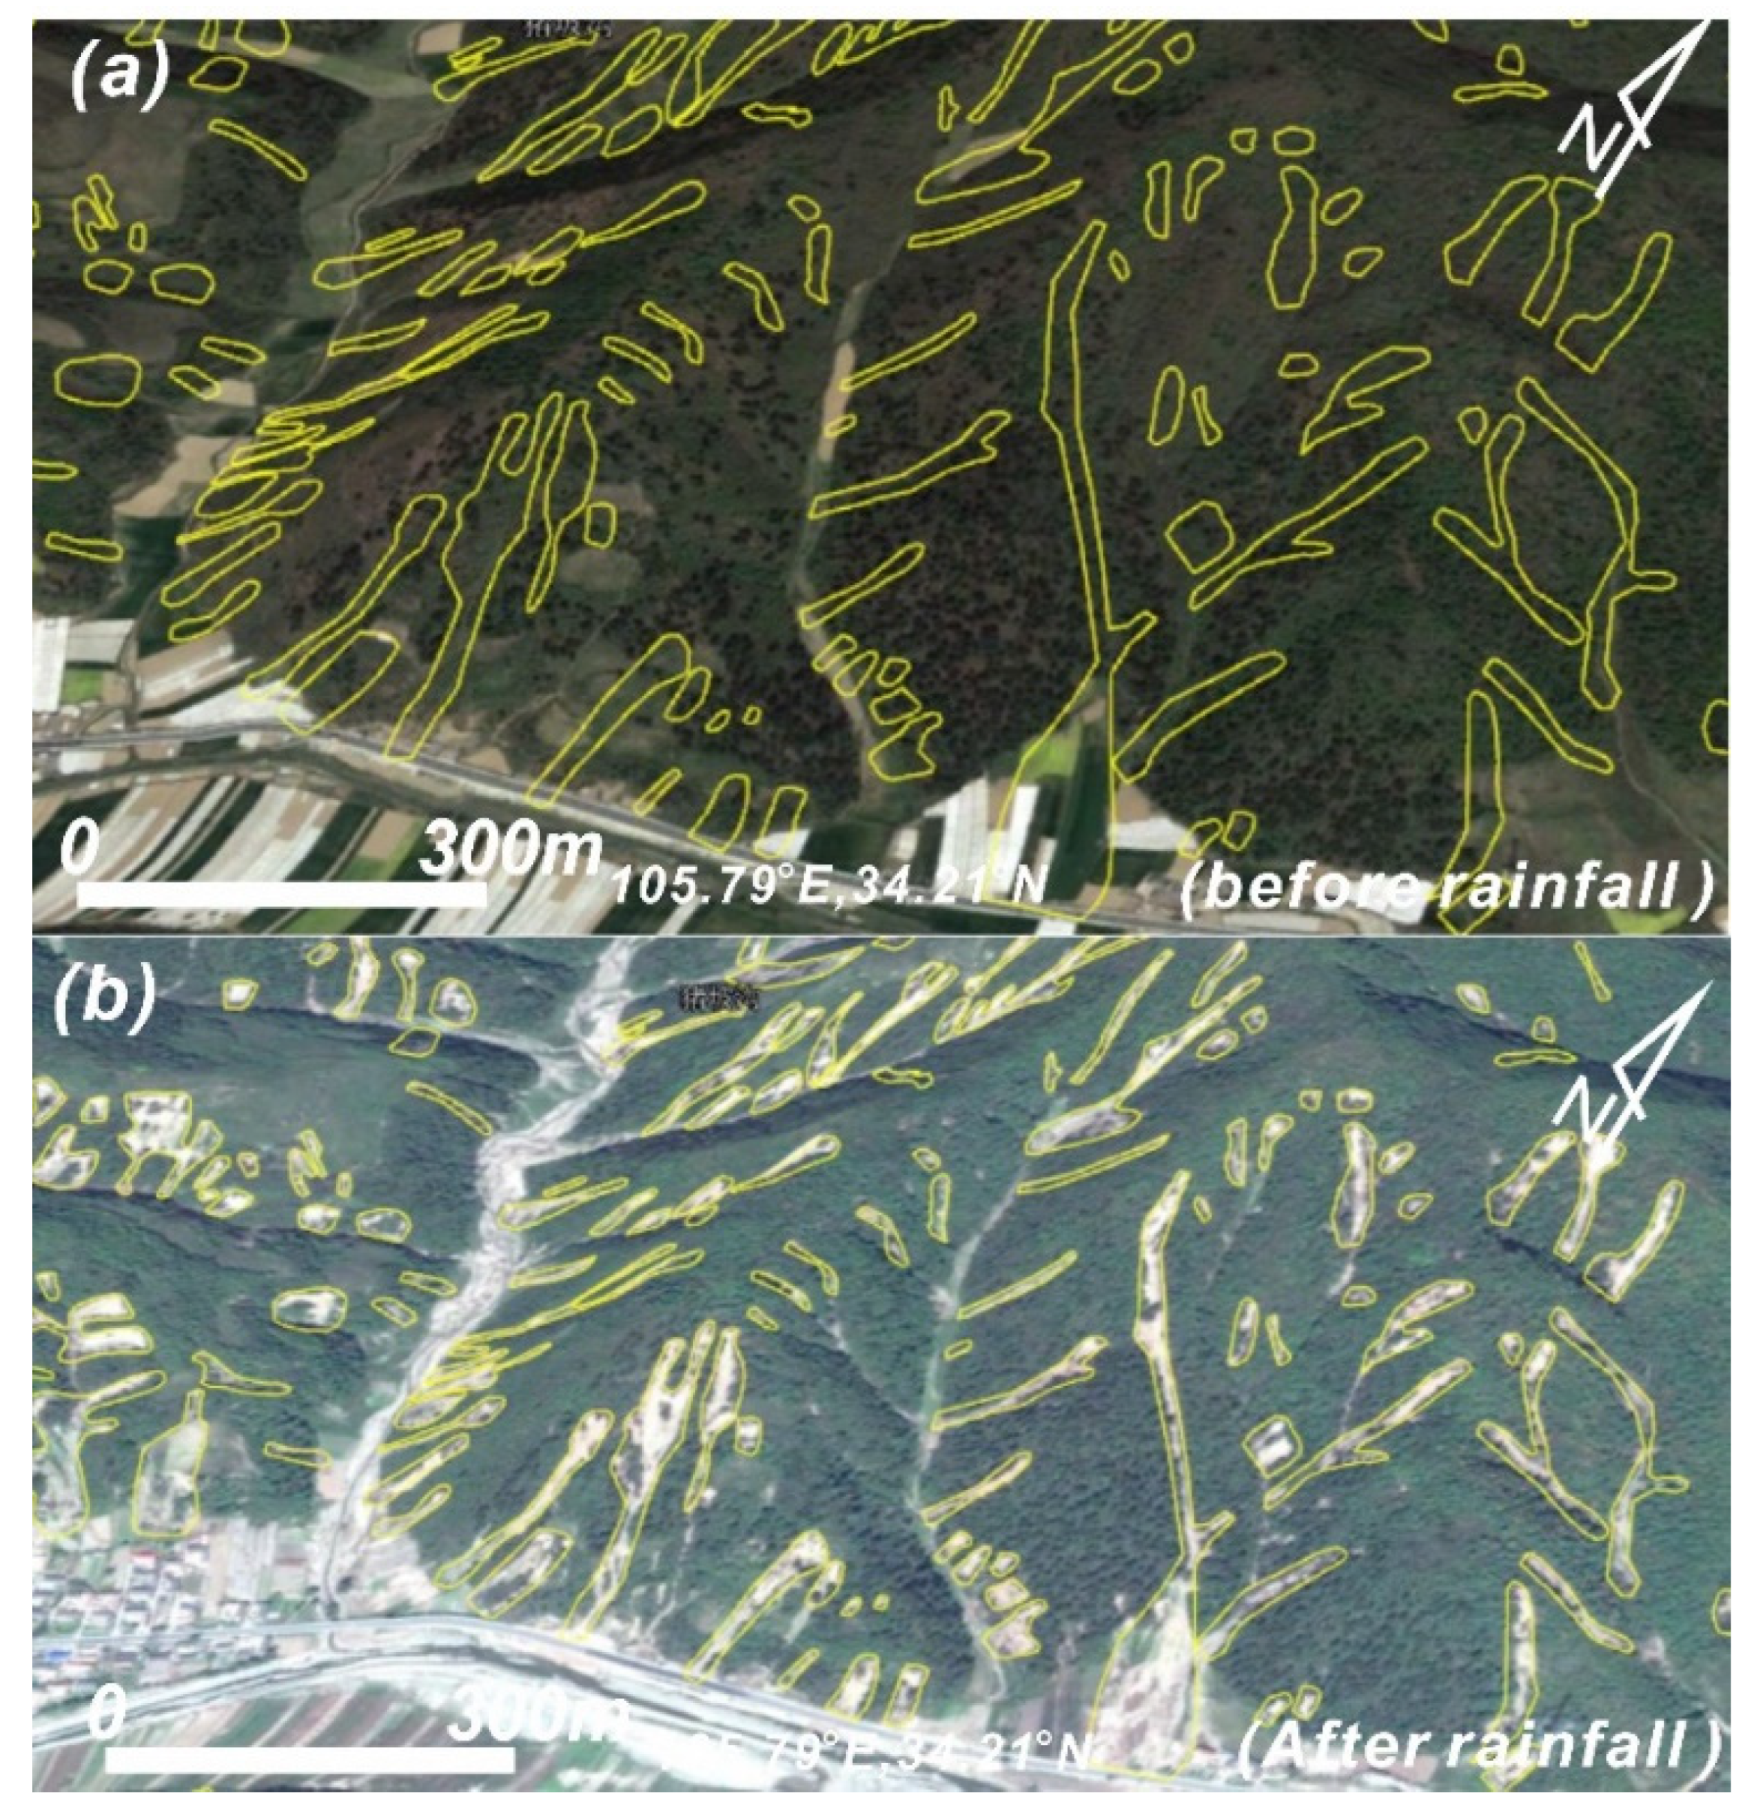
The optical images utilized for landslide interpretation in the study area originated from the GE software, and the coverage rate of high-resolution optical images in this area was 100%. Xu, Allen, Zhang, Li, and He [37] employed a visual interpretation method to identify landslides by comparing optical images before and after the rainfall event. In areas with dense vegetation coverage, landslide scars were clearly visible in the post-rainfall optical images. Figure 7 illustrates the abundance of landslides caused by this rainfall event, especially in Dongjiamo village of the Niangniangba area (105.82°E, 34.27°N). The results indicate that the majority of landslides in this area were narrow and shallow, forming a continuous distribution with a wide range. Furthermore, claw-shaped shallow debris flows were observed on the mountain slopes. Figure 8 displays the optical images before and after the rainfall event in the southwestern region of the Niangniangba area (105.79°E, 34.21°N). The images show that landslides in this area were predominantly small-scale and shallow, with most of them distributed along both sides of the valleys. Under subsequent rainfall conditions, the deposited materials of the landslides near the river channels may easily transform into debris flows.
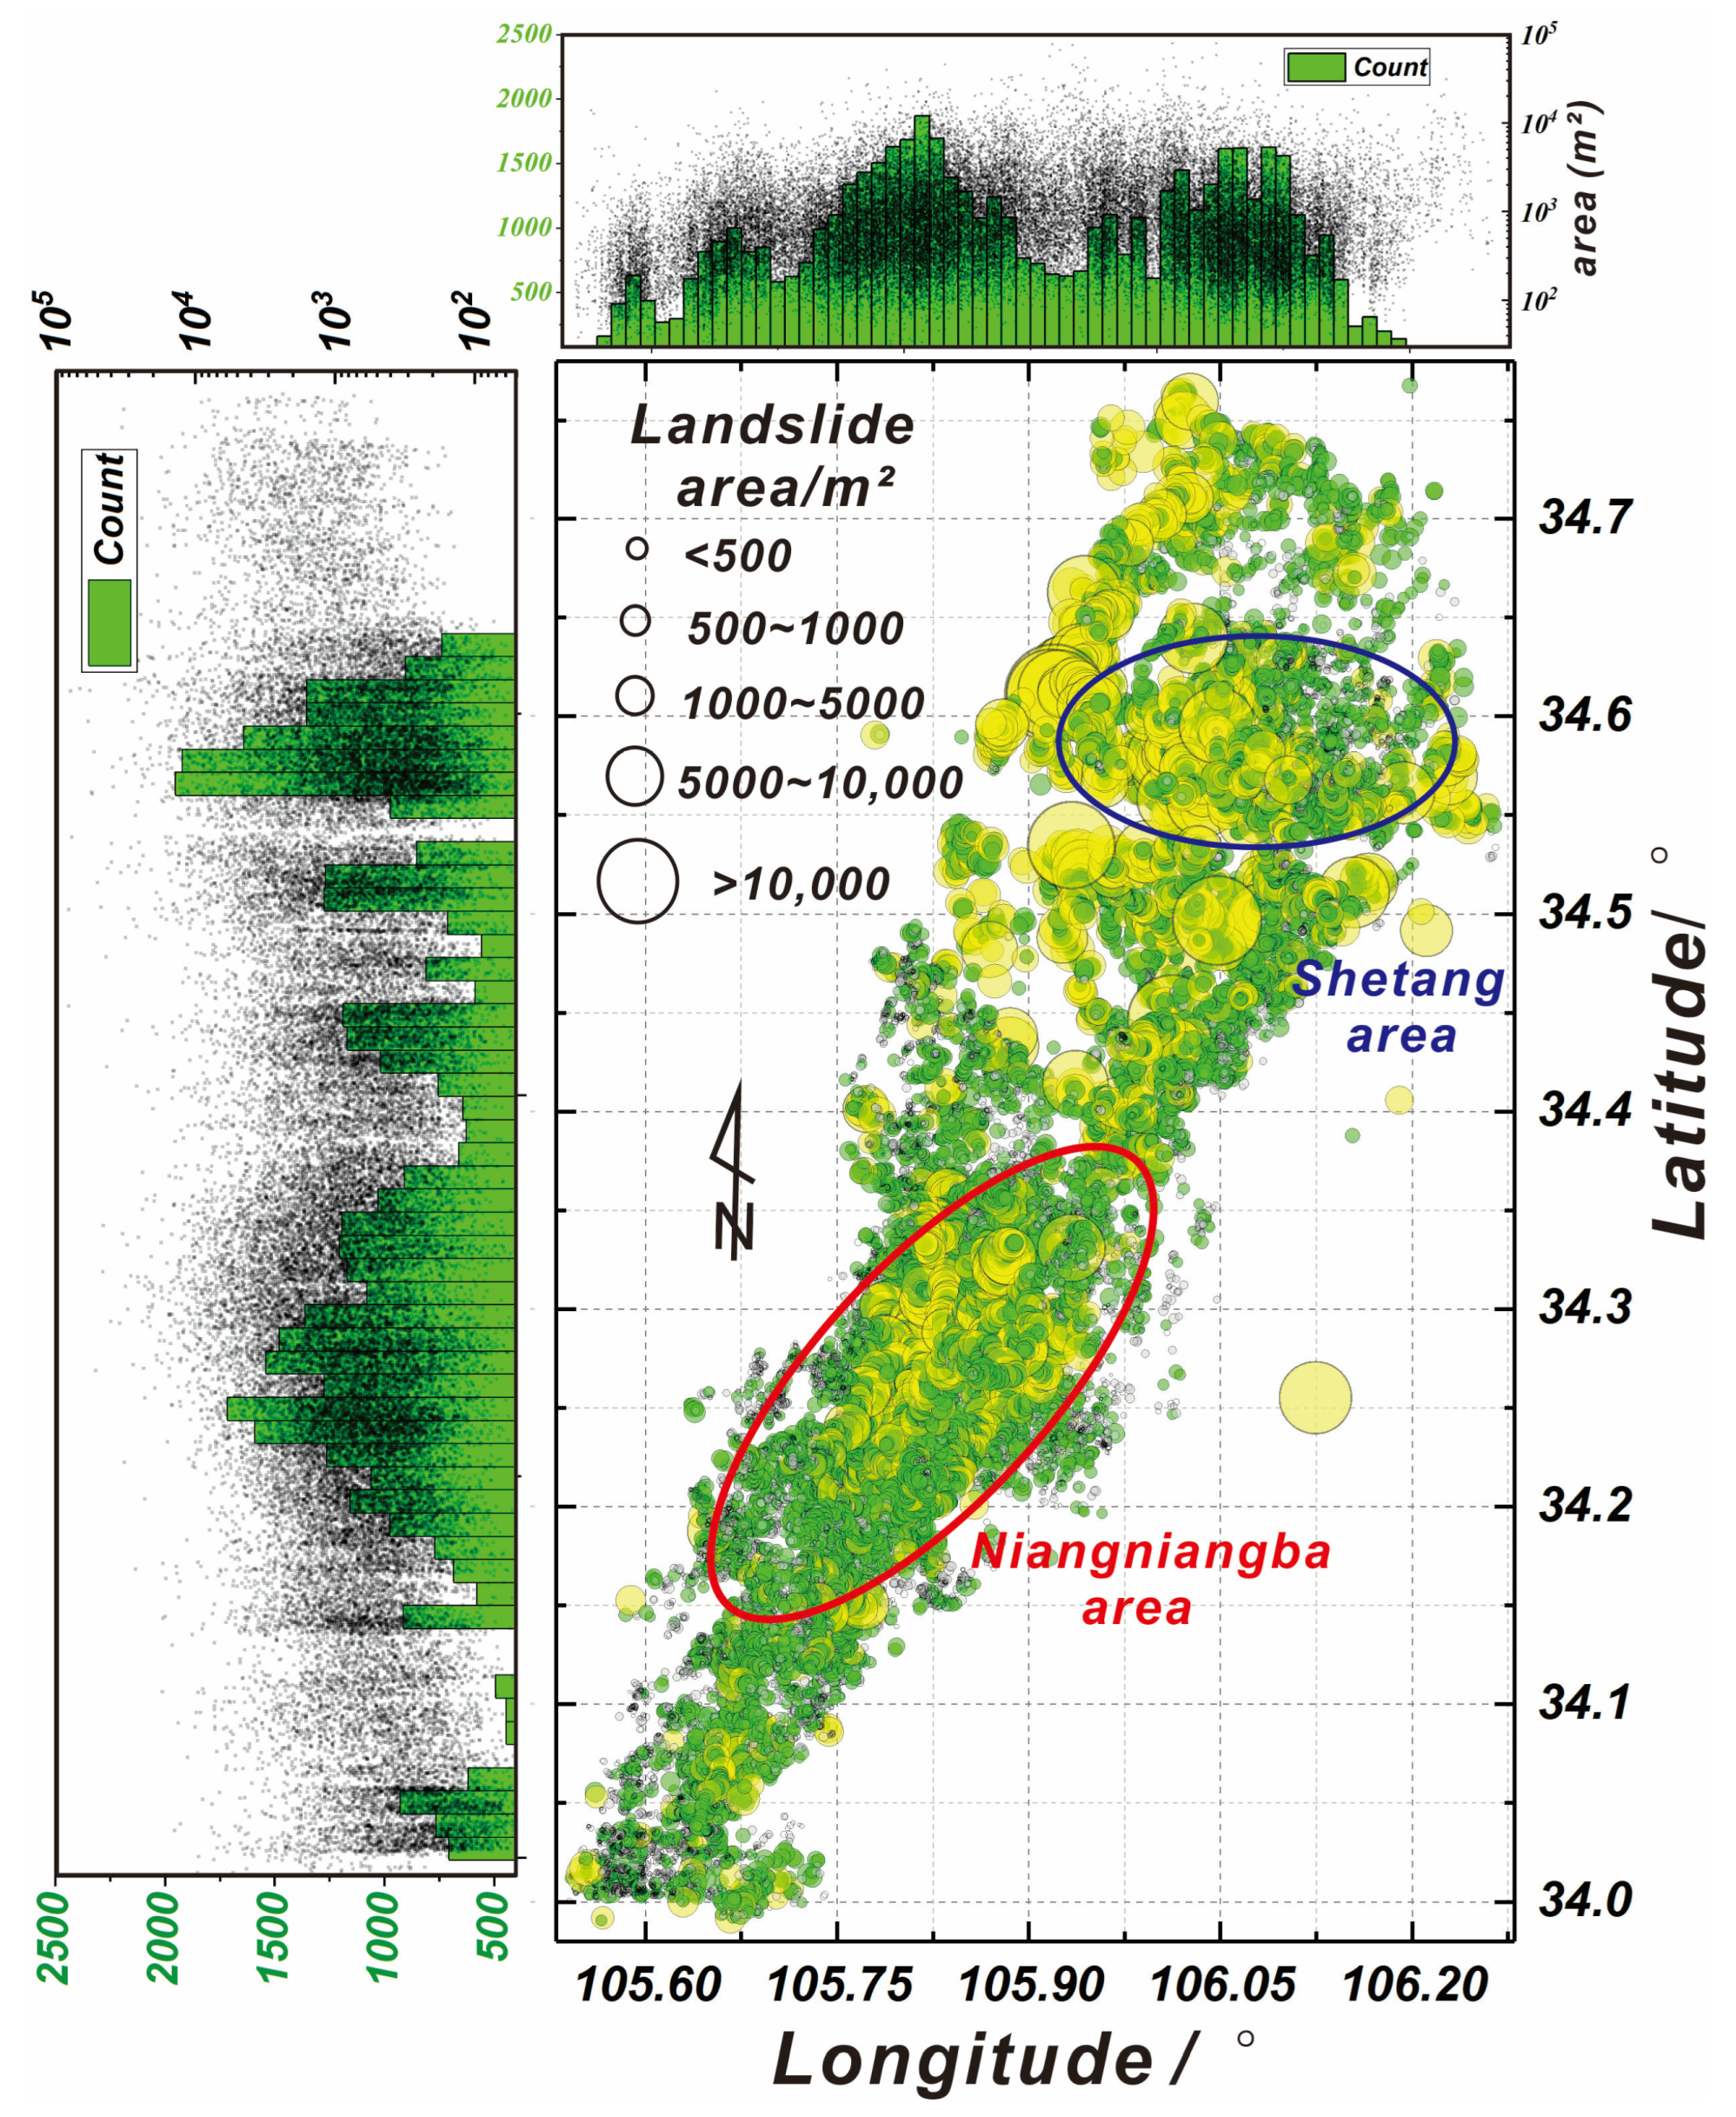
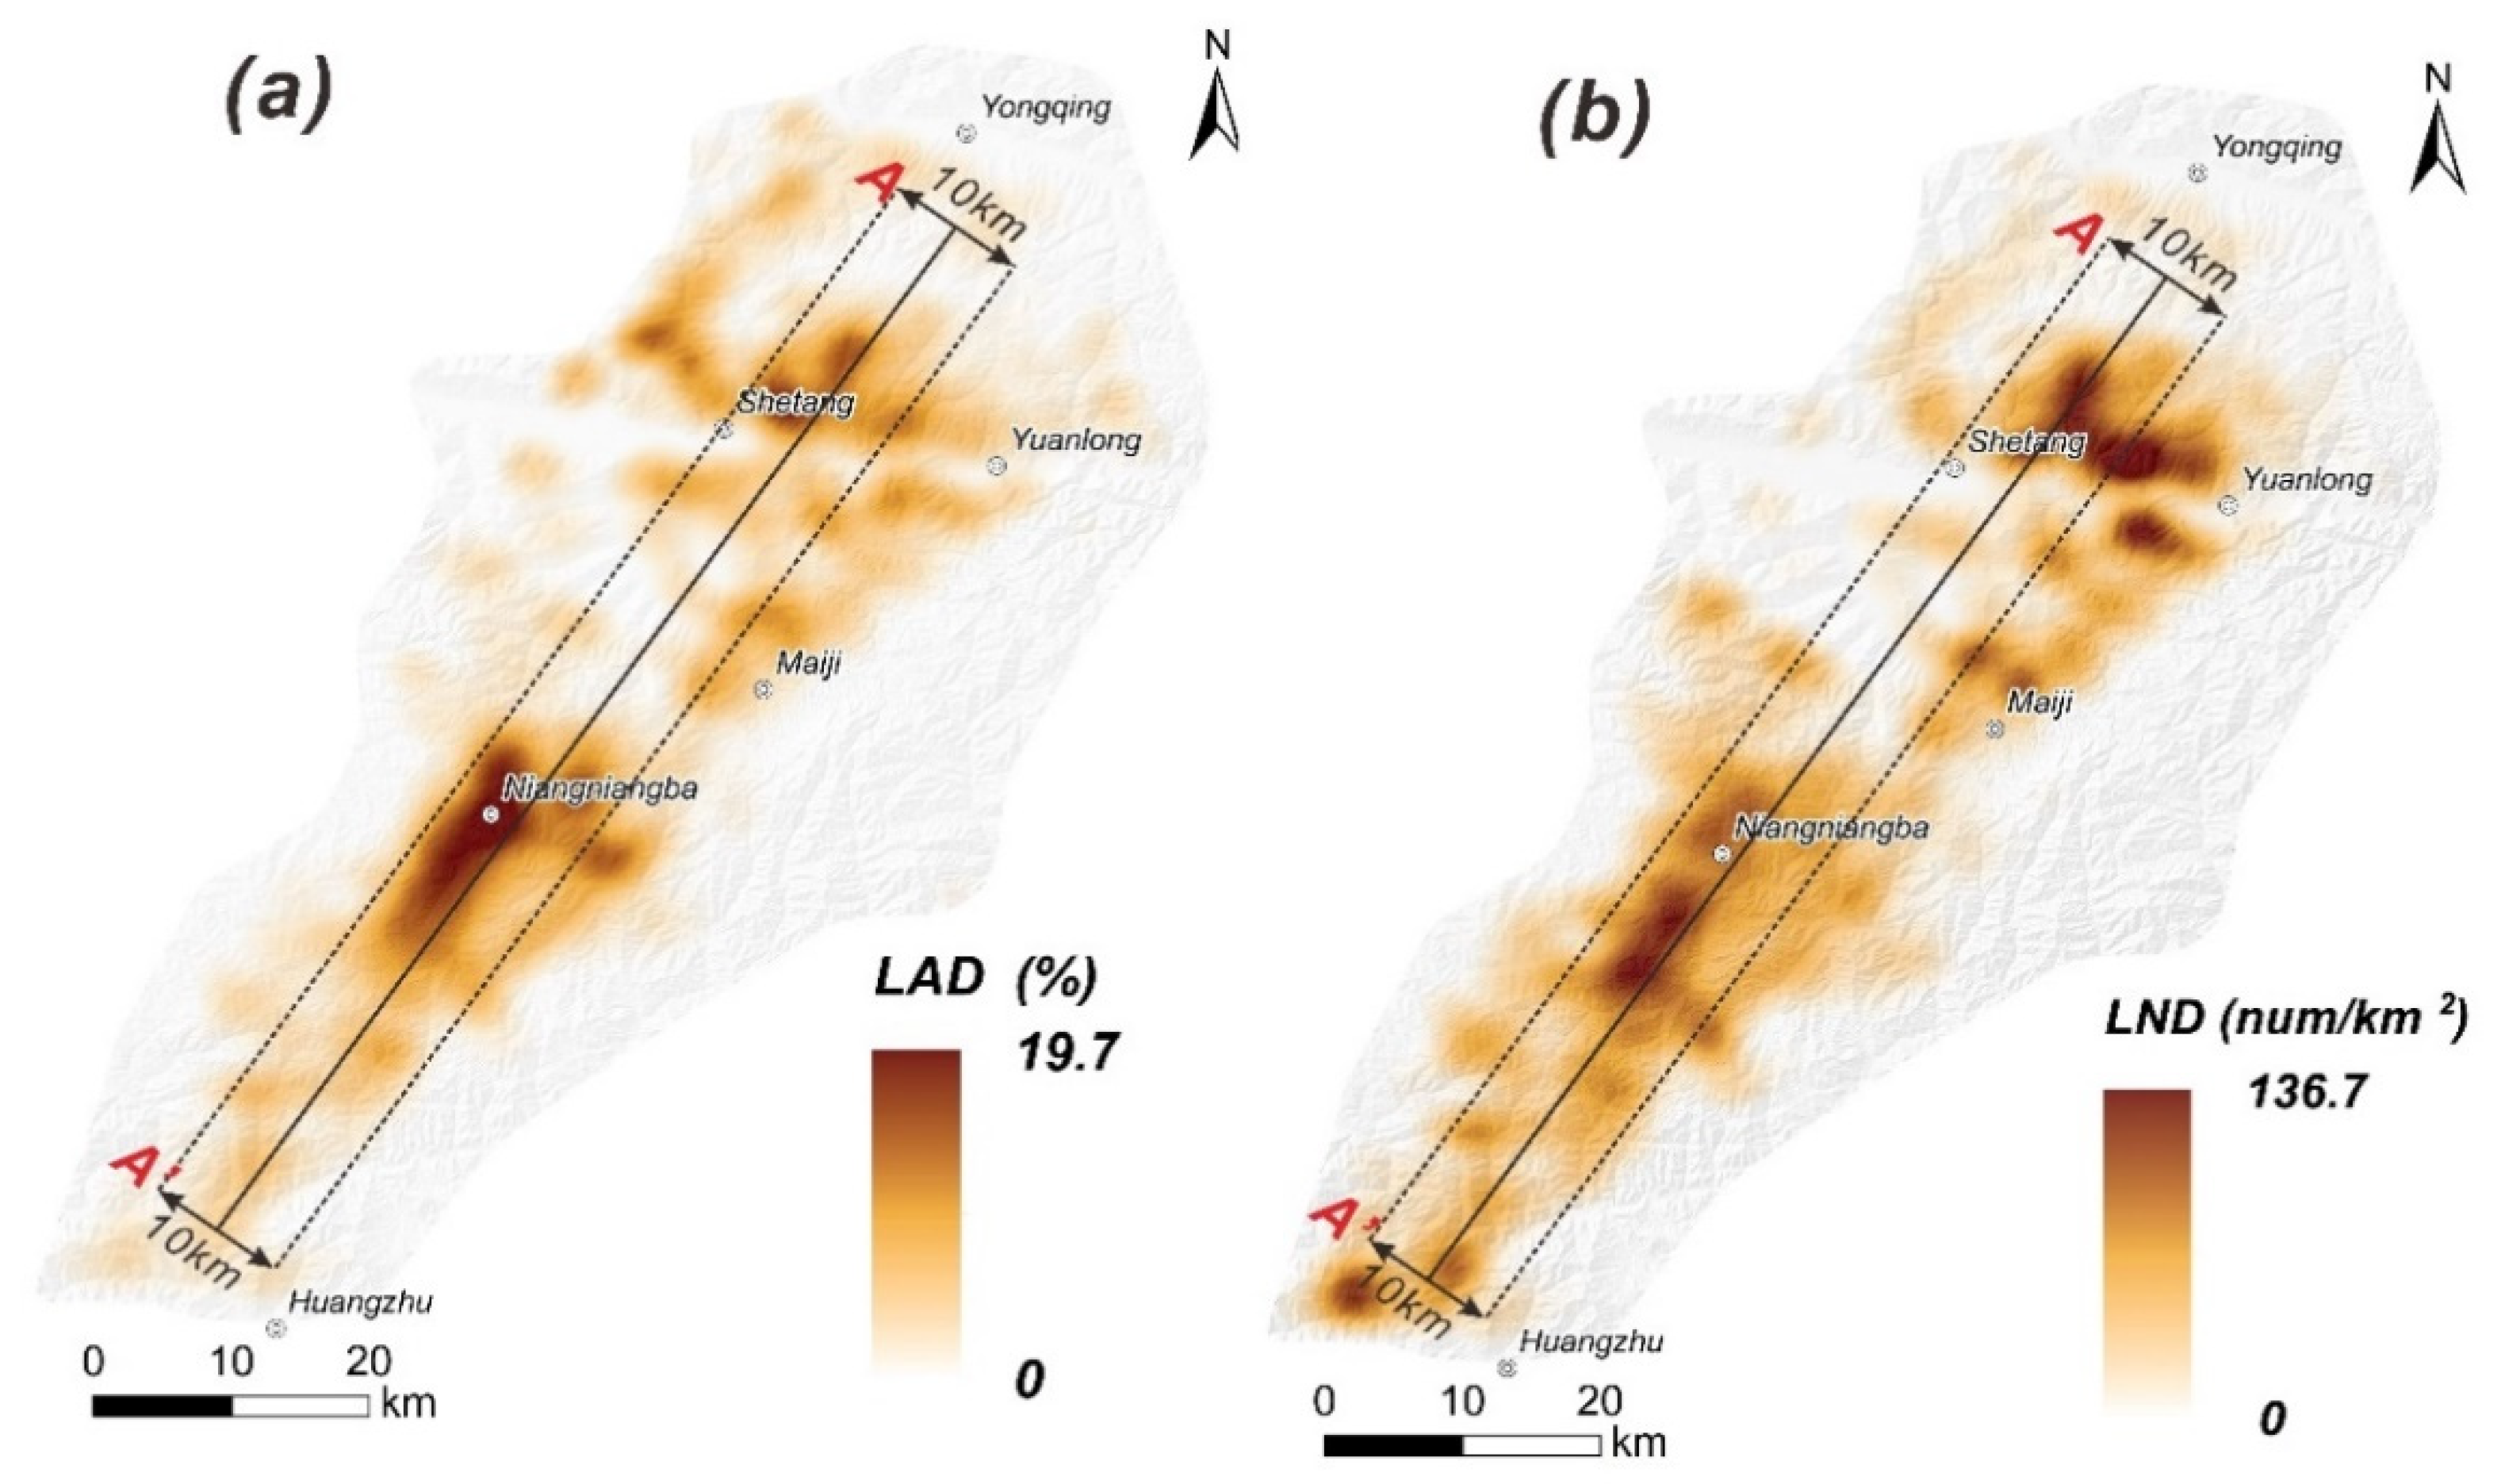
This rainfall event caused approximately 54,000 landslides with a total area of 67.9 km2, mainly consisting of elongated loess landslides, shallow rockslides, collapses, and mudflows. Among the landslides recorded, the largest one covered an area of 100,000 m2, whereas the smallest was only 30 m2. Out of the total, there were 545 landslides exceeding 10,000 m2, approximately 1600 landslides ranging between 5000 and 10,000 m2, and around 16,000 landslides with an area between 1000 and 5000 m2 resulting in an average landslide area of 2000 m2. Notably, the majority of landslides in the study area were smaller than 1000 m2, making up roughly 67% of the total landslides (Figure 9). To assess the distribution of landslides, we utilized a Gaussian density kernel function with a moving window radius of 2.5 km, which enabled the calculation of landslide point density (LND, the number of landslides per square kilometer (number/km2)) and landslide area density (LAD, represents the percentage of the affected area occupied by landslides (%)) within the study area.
The analysis revealed that the maximum LAD reached 19.7%, while the maximum LND was 136/km2 (Figure 10). The landslides overall exhibited a clustered distribution, primarily concentrated in two specific areas, i.e., the Niangniangba area in the central part and the Shetang area in the northern part (Figure 10).
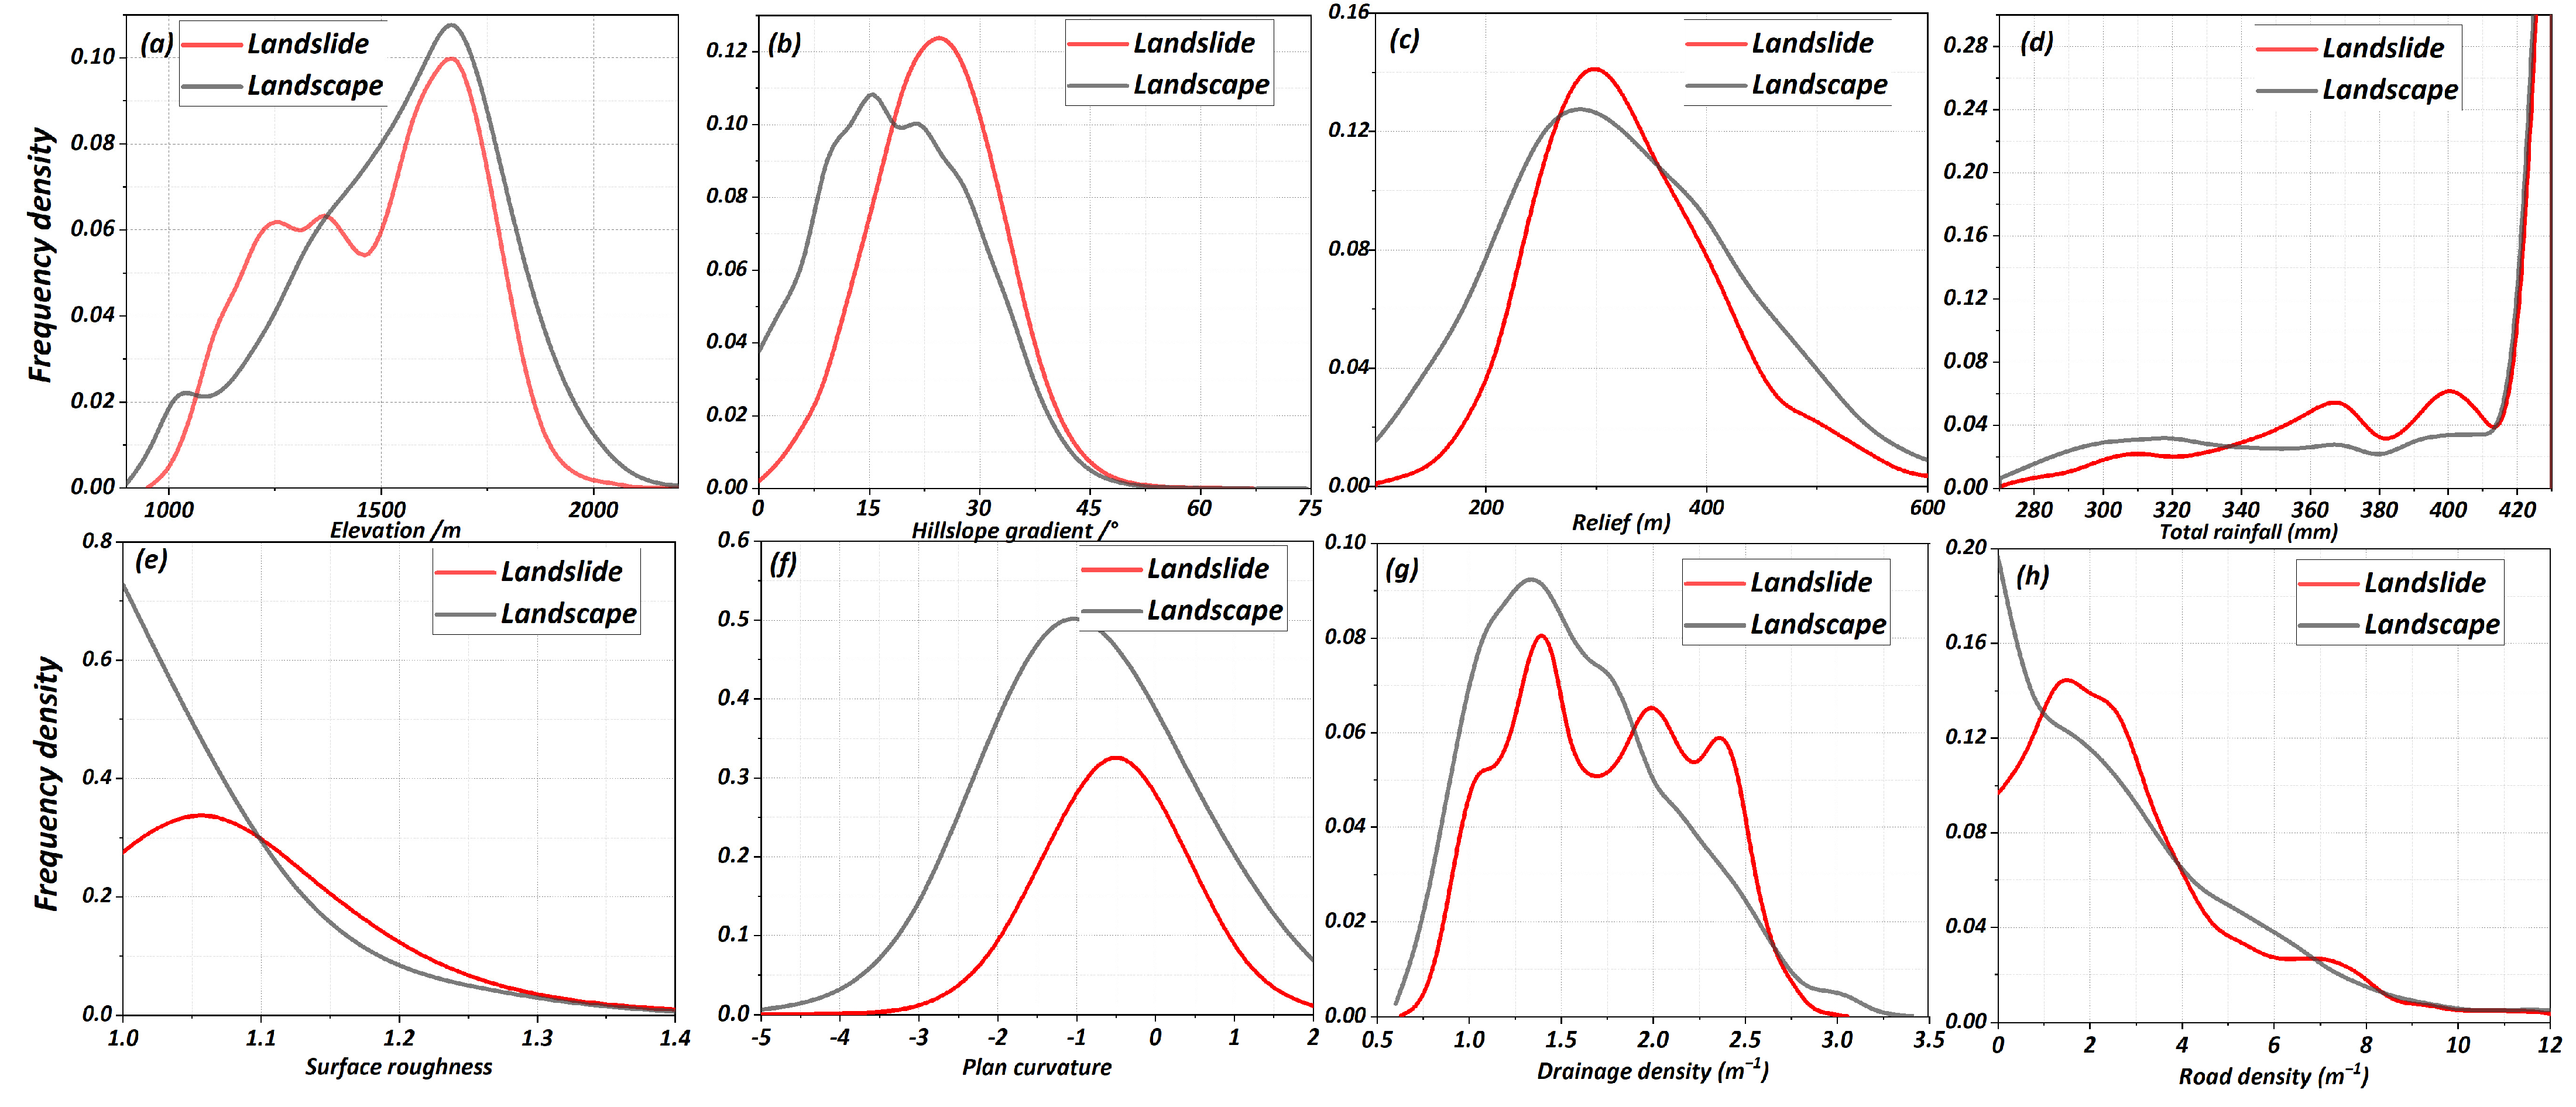
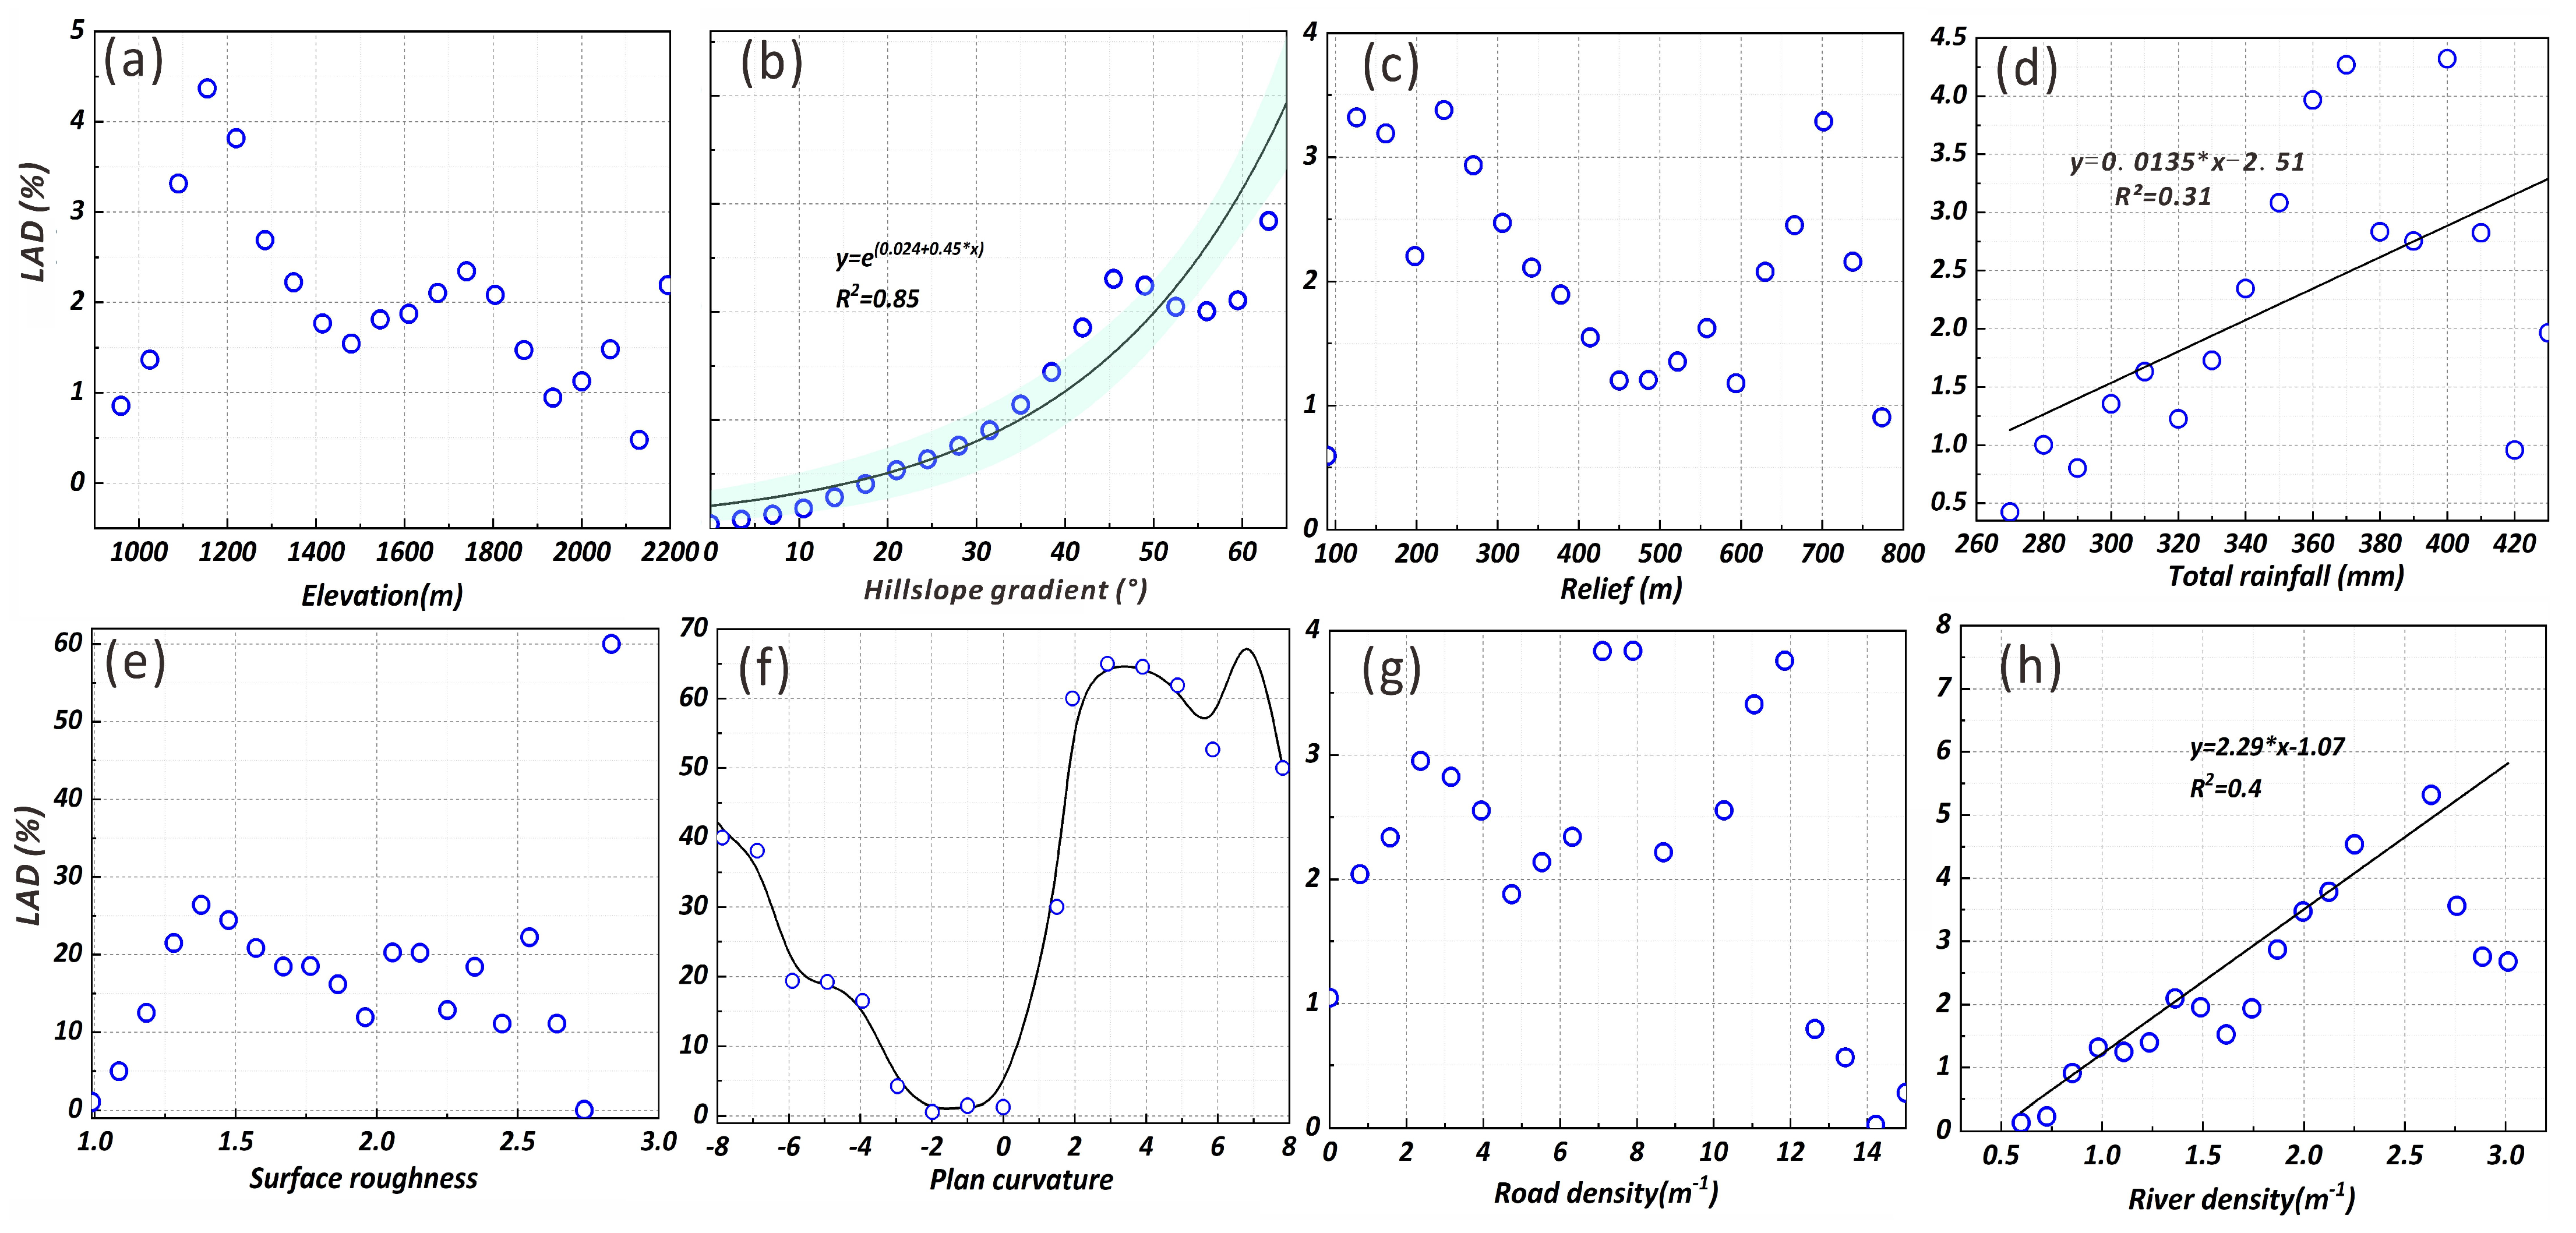
Figure 11 illustrates the frequency density (FD) distribution of landslides and landscape areas under various influencing factors, while Figure 12 depicts the relationship between LAD and factors. For the elevation, landslides were concentrated in the 1200–1400 m and 1600–1800 m sections. The average elevation of landslide area was 1518 m, and the mean value of landscape area was 1573 m. Overall, the vast majority of landslides were concentrated in areas with lower elevations. In terms of hillslope gradient, most landslides had a gradient value with in the range of 20–35°, while landscape areas were concentrated in the range of 10–25°. Otherwise, LAD increases with the rise of hillslope gradient, which can be described by an exponential relationship, namely, (where x represents the hillslope gradient and y represents LAD, as shown in Figure 12b). This equation indicates that as the hillslope gradient increases, the likelihood of landslide occurrence also increases. In terms of relief, the frequency density of landslide area was basically consistent with that of landscape areas, which were 346 m and 340 m, respectively (Table 2). Overall, it was concluded that the development of rainfall-induced landslides in the Tianshui area was less affected by relief. For the total rainfall, LAD rose with the increase in the total rainfall and can be described by a linear relationship of . On the other hand, the surface roughness of most landslides was concentrated in the range from 1.0 to 1.2, while the surface roughness of landscape areas was concentrated in the range of <1.1 (Figure 11e). The average surface roughness of landslide areas was 1.2, while that of landscape areas was 1.0 (Table 2). For plan curvature, the LAD reached its minimum within the range of −1~1, while it was high in areas with high absolute values of plane curvature, indicating that landslides in the Tianshui area were more likely to occur in areas with high absolute values of plane curvature. The road density of most landslides was in the range of 1.5 to 2.5, and that of landscape area was mainly concentrated in the range of less 2. The mean road density of landslide and landscape areas was 3.2 and 3.0, respectively (Table 2). The drainage density was mainly concentrated in the range of 1.5 to 2.5, while that of landscape area was mainly concentrated between 1.0 and 2.0. In addition, LAD and drainage density exhibited a linear relationship described as (where x represents drainage density and y represents LAD), indicating that landslides were more likely to occur in areas with high drainage density (Figure 12h).
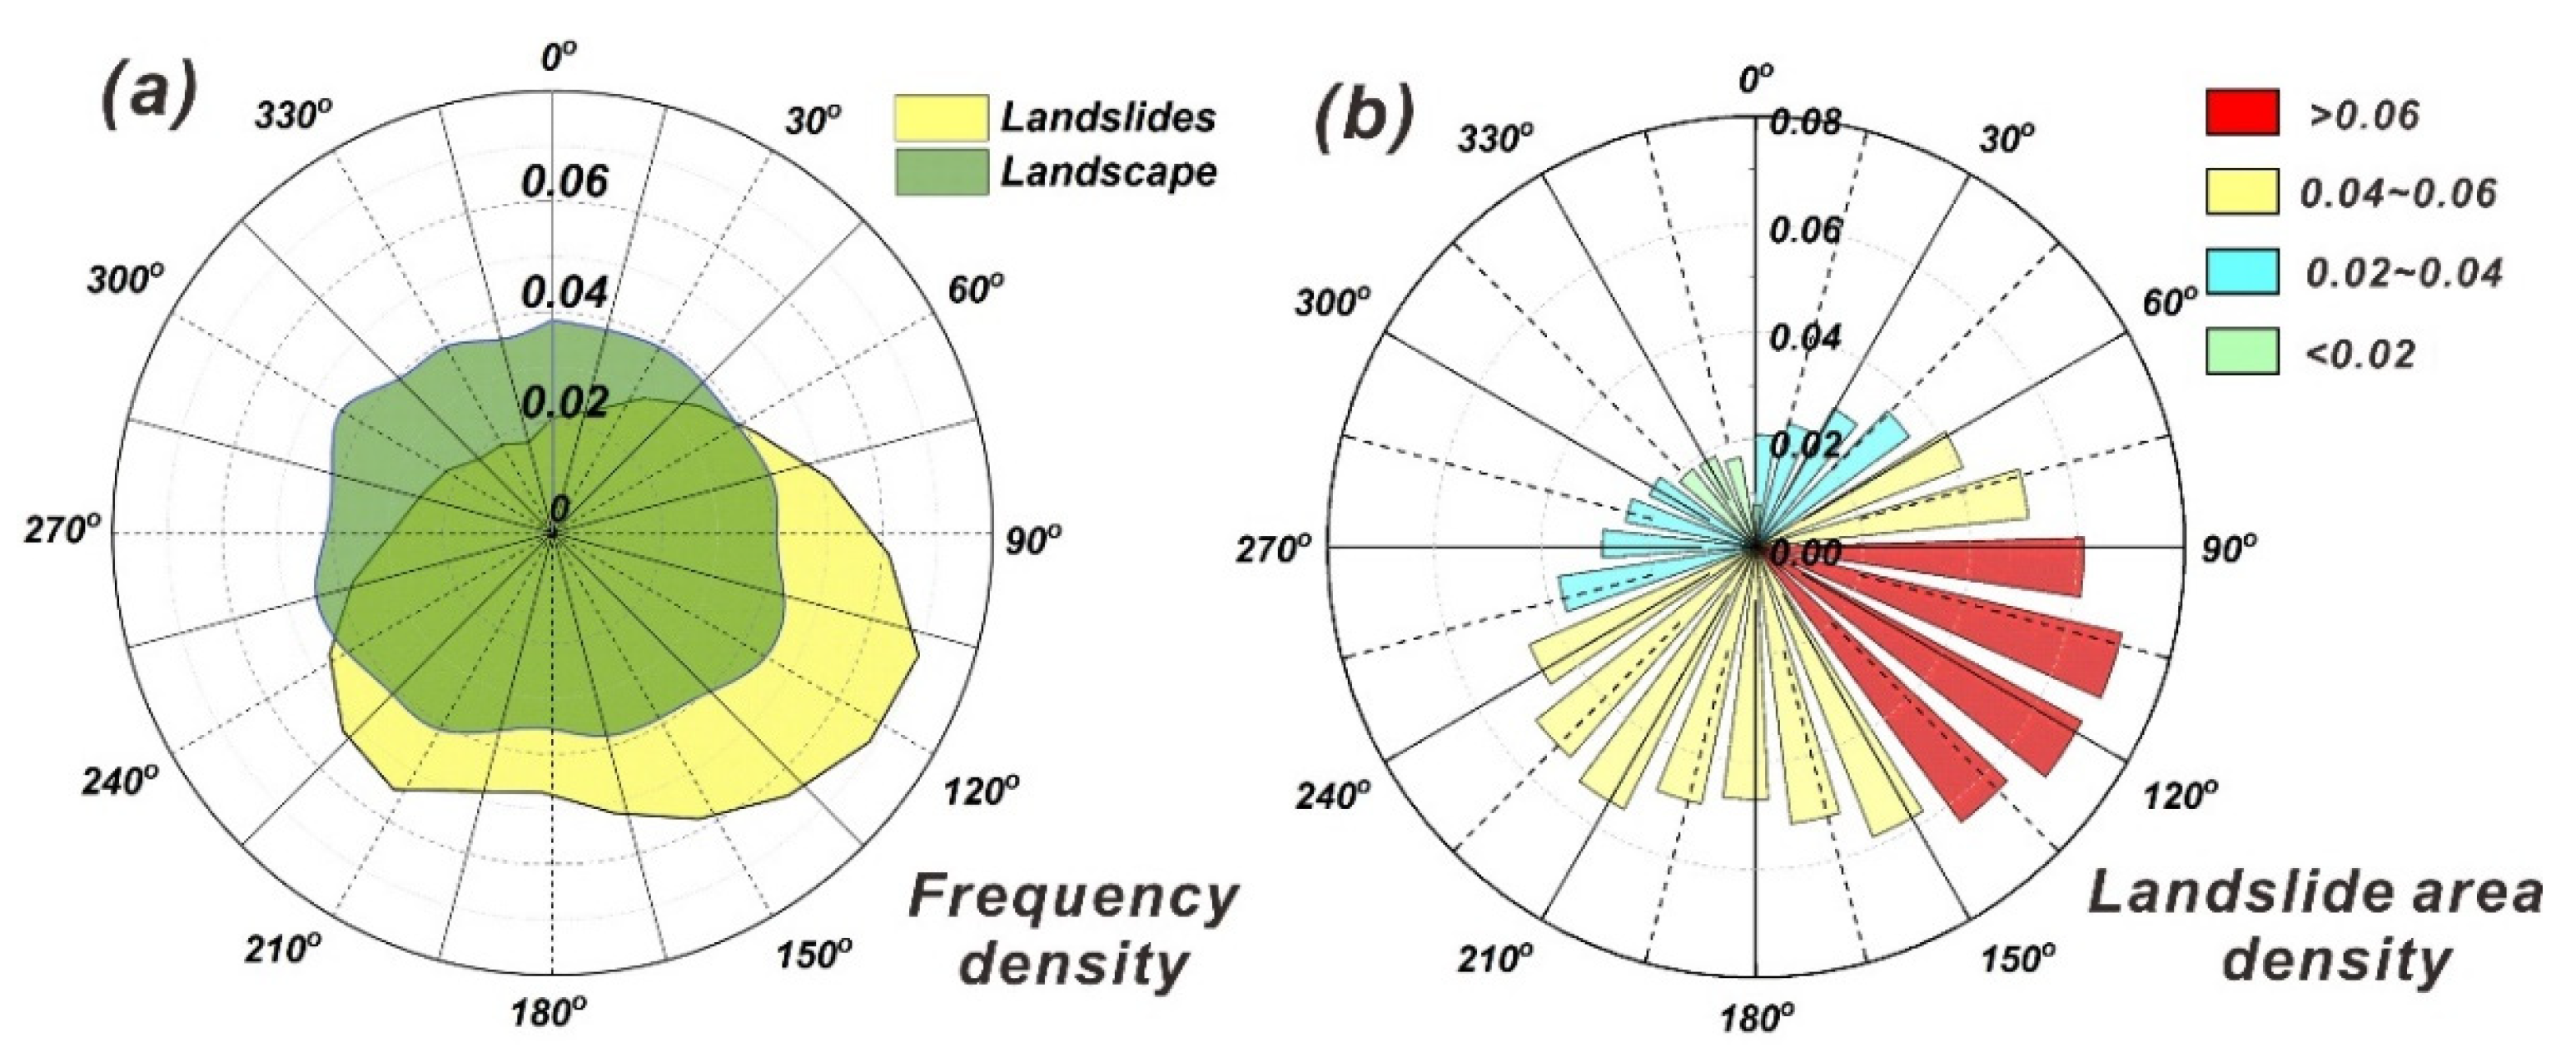
Figure 13 presents the statistical results of frequency density (FD) for both landslide and landscape areas, as well as the LAD across different slope aspects. The results indicate a general consistency in the distribution of all aspects within the landscape area. However, the landslide area demonstrated a higher concentration in the aspects of 90°–140° (E-SE) and 210°–240° (SW-SWW), with FD values reaching 0.07. Furthermore, the highest LAD occurred in the aspect range of 90°–140° (SW-SWW), accounting for 8% of the total. The aspect of 210°–240° followed closely, exhibiting the second highest LAD reaching approximately 6%. In summary, the E-SE aspect was more prone to landslides, while the W-NW aspect exhibited a low abundance of landslides.
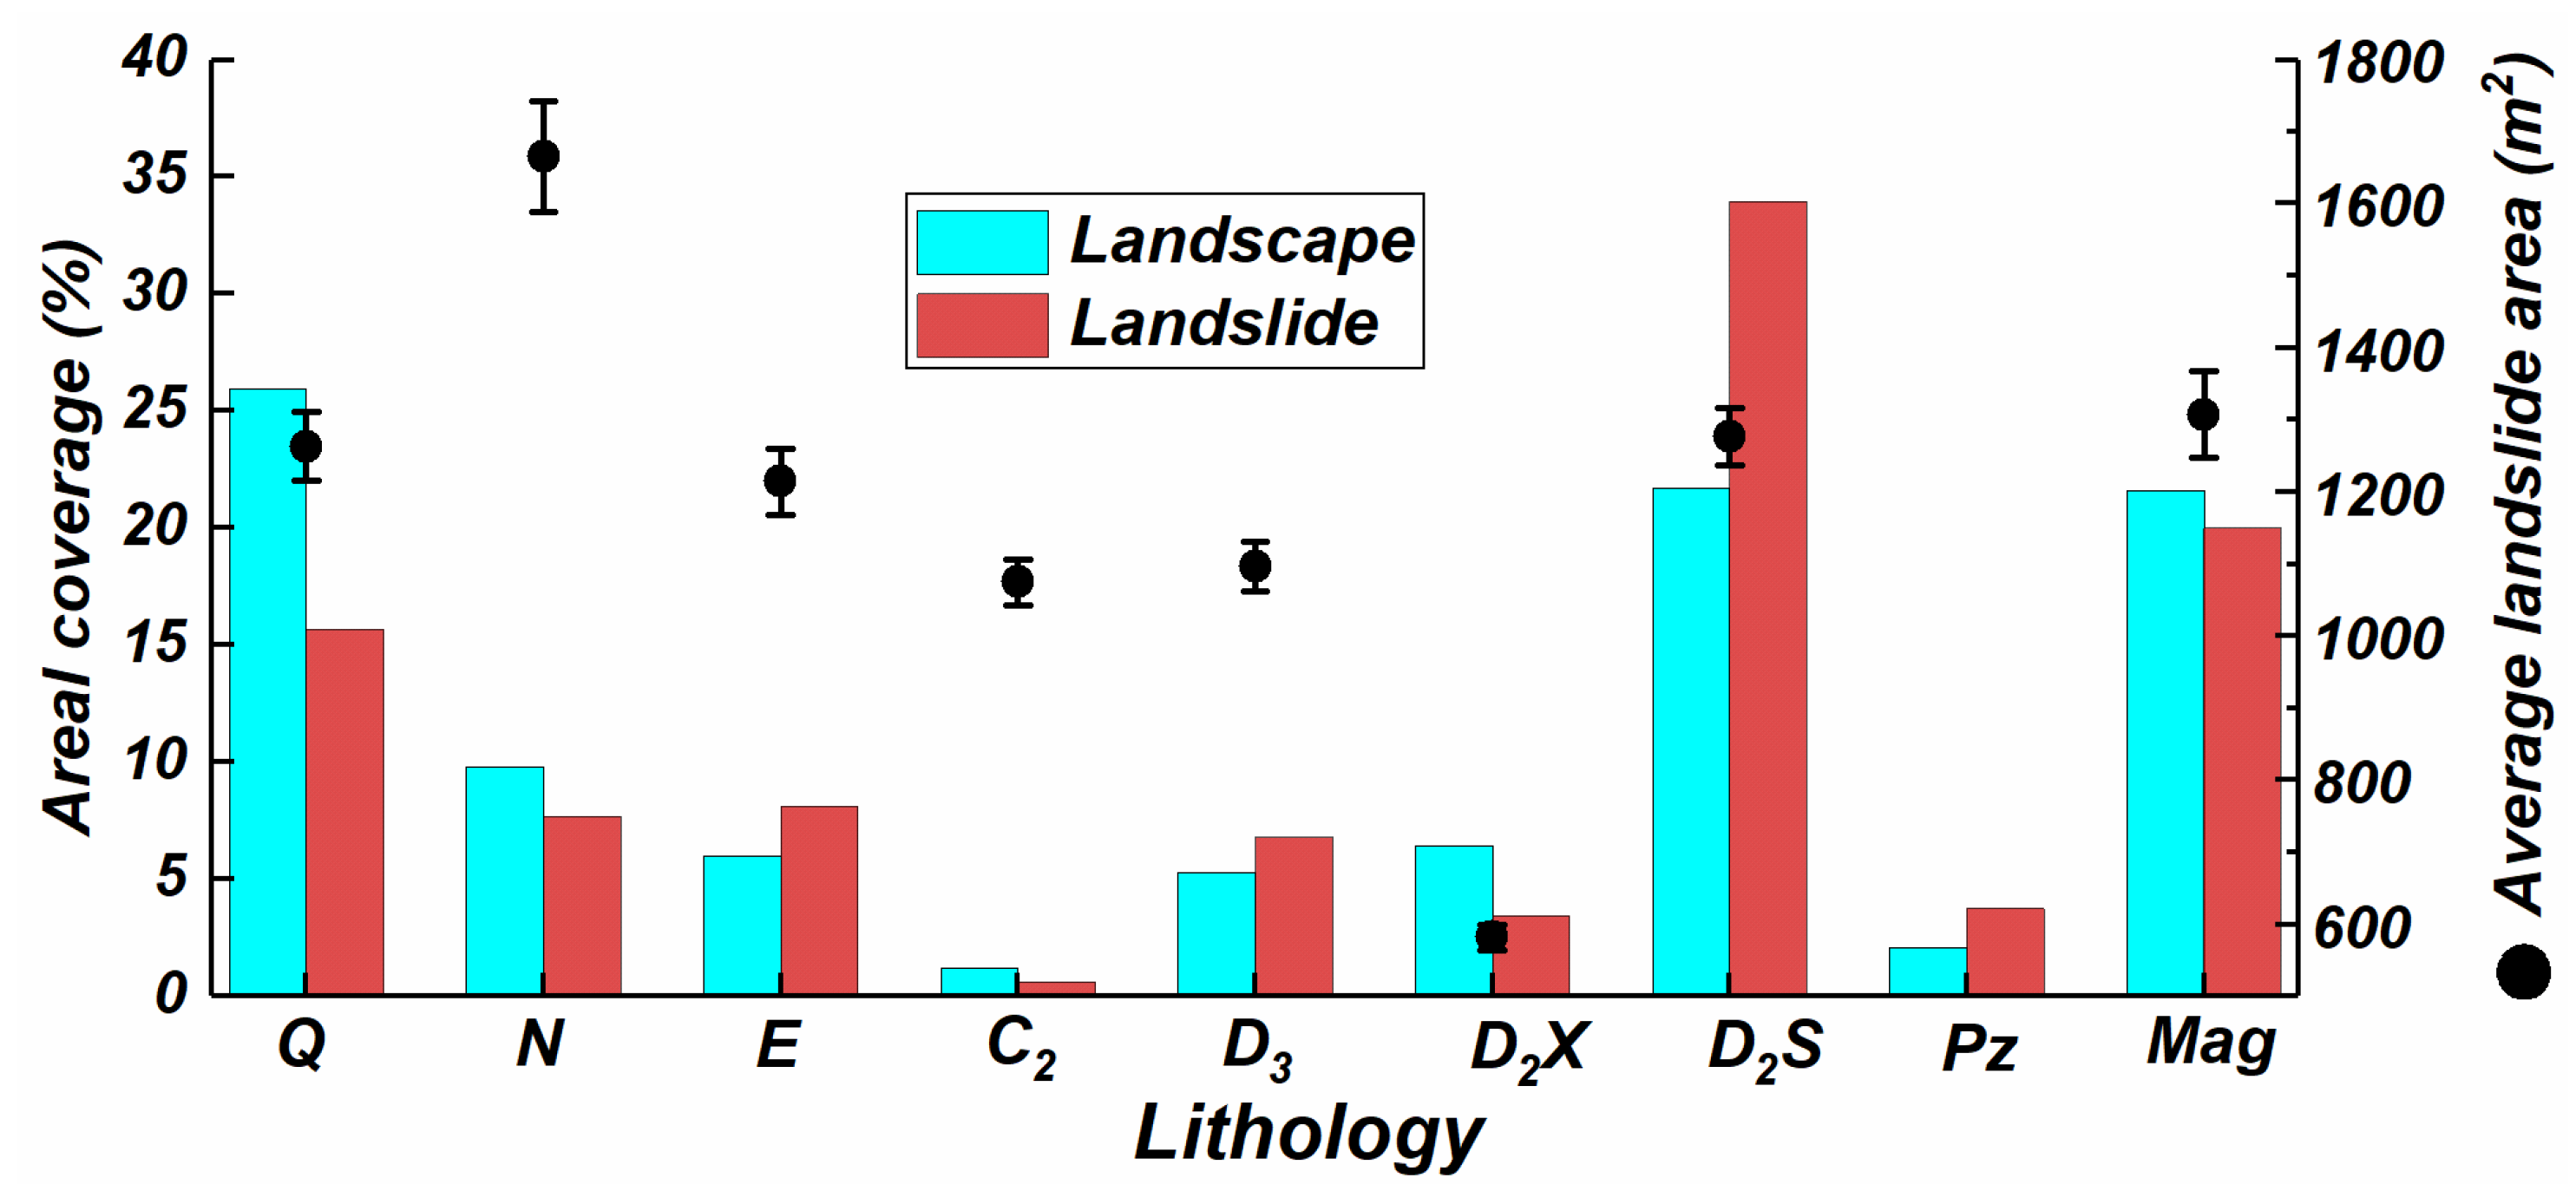
Figure 14 illustrates the distribution of areal coverage (%) for both landslides and landscape areas, as well as the average landslide area across different lithological units. The results highlight that the primary lithological units in the study area were Quaternary sediments (Q), Middle Devonian Shujiaba Formation (D2S), and magmatic rock (Mag), constituting 15%, 35%, and 18% of the total landslide area, respectively. Among these units, the Middle Devonian Shujiaba formation (D2S) was highly susceptible to landslides, accounting for 35% of the total landslide occurrences within a concentrated 22% area. Secondly, the Paleogene (E) strata accounted for 10% of landslides within 8% of the study area. Additionally, the average landslide area developed in Neogene (N) strata was the largest (1700 m2), while the C2 strata exhibited the smallest average landslide area, only about 1000 m2. Overall, landslides developed in Cenozoic strata had slightly larger scales compared to those in Paleozoic strata.
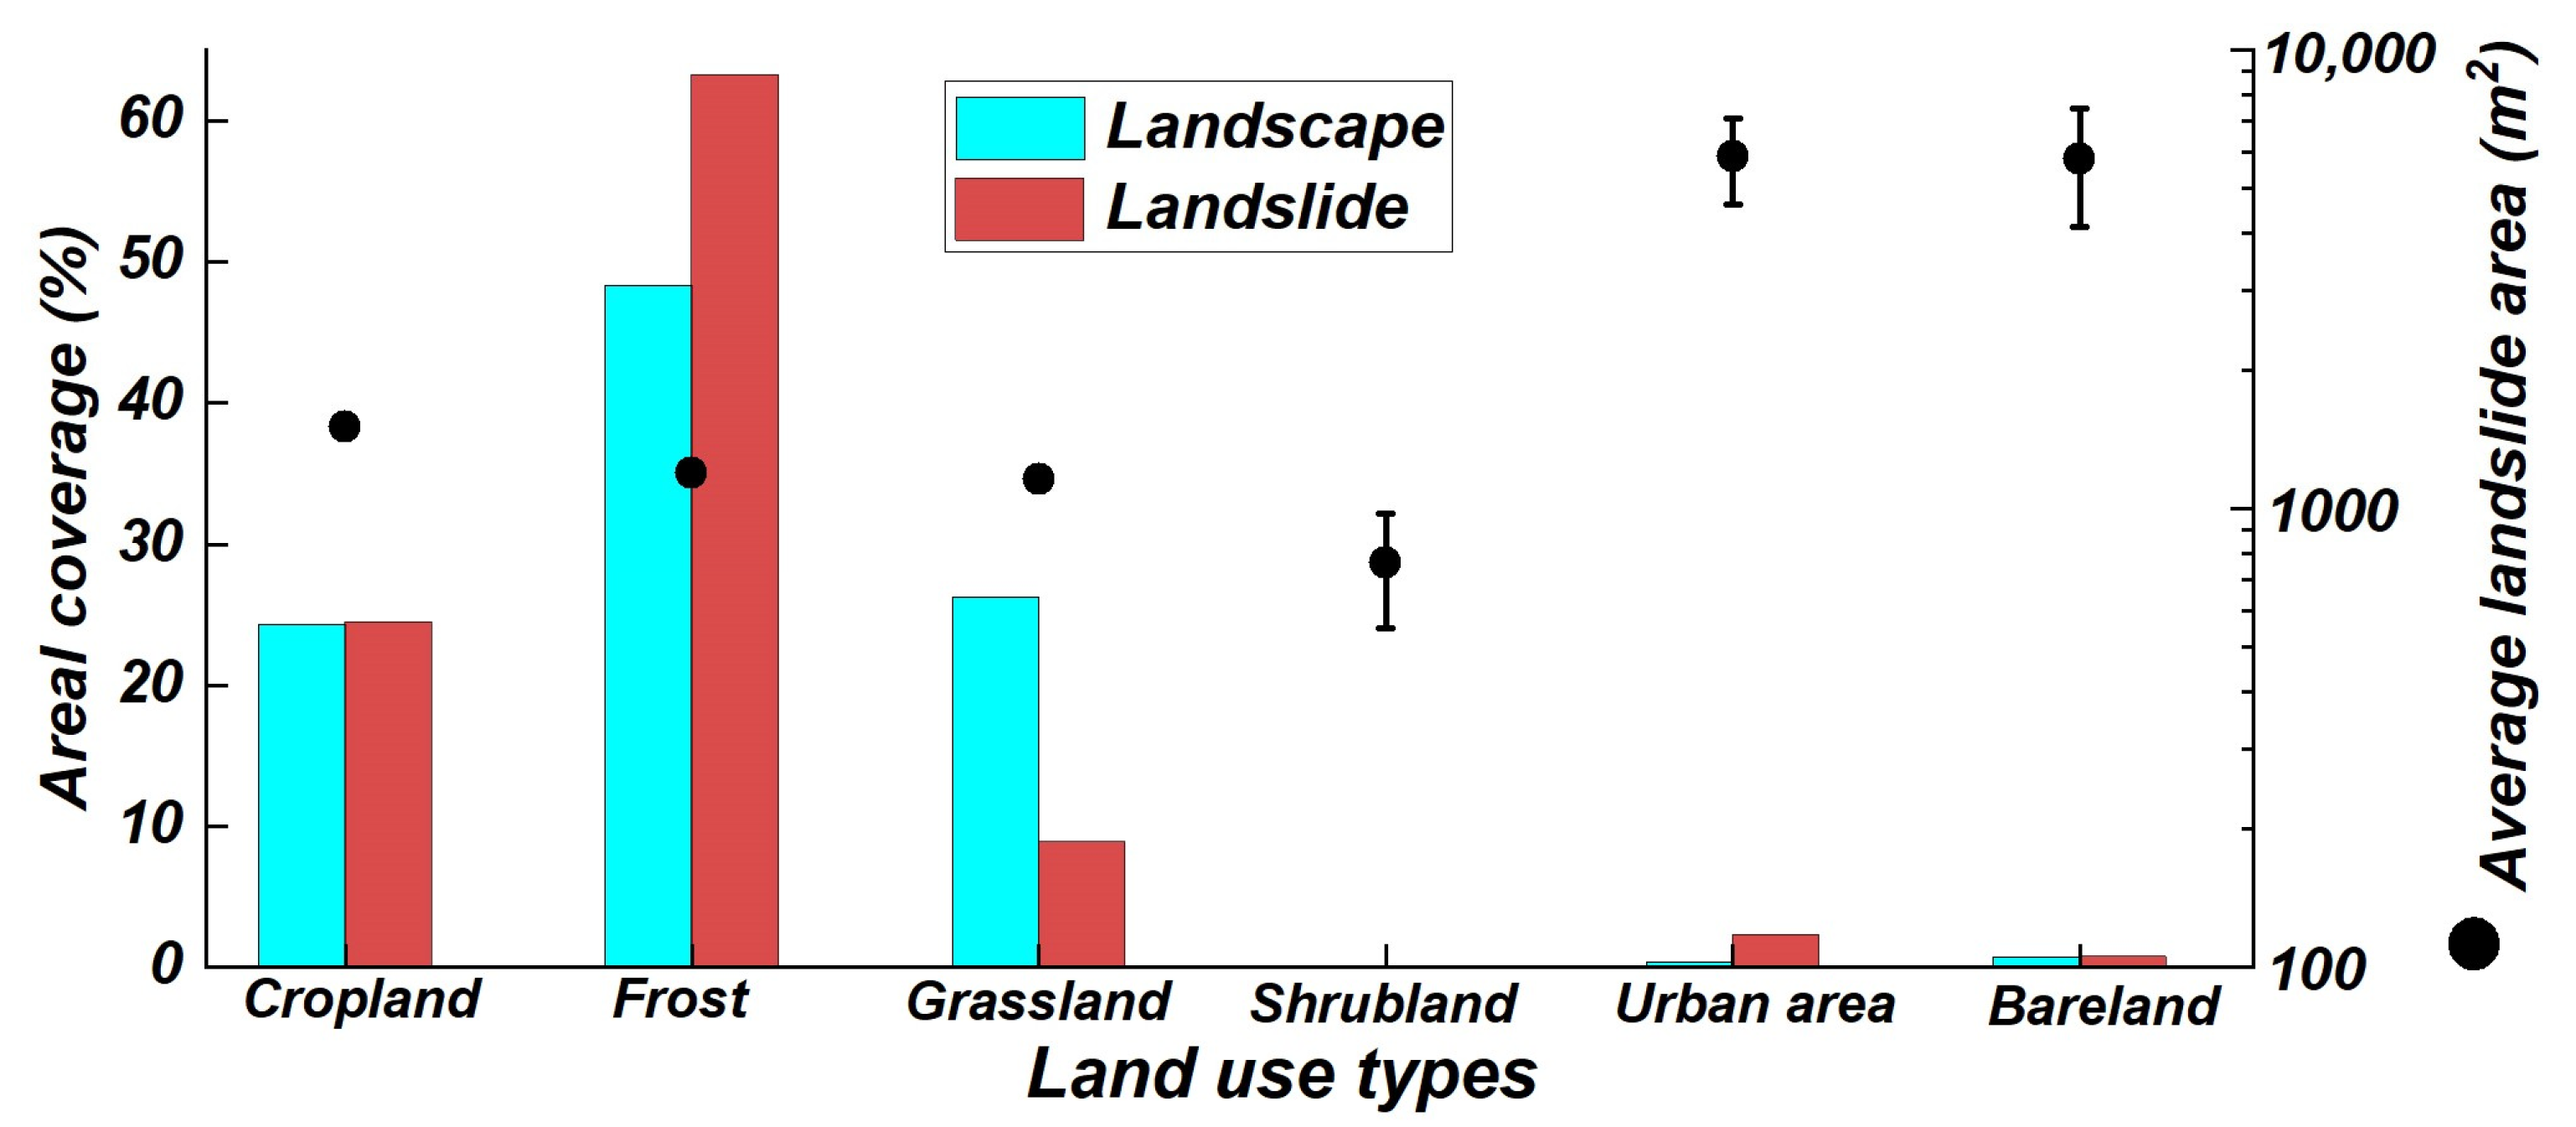
Figure 15 shows the distribution of areal coverage (%) for both landslides and landscape areas, as well as the average landslide area across different land-use types. The predominant land type in the study area was forest, covering approximately 50% of the total area, followed by cropland and grassland, each comprising more than 20%. Among all land types, forests exhibited the highest susceptibility to landslides, with approximately 65% of landslides occurring within 50% total area. The second was urban area, which has experienced nearly 3% of landslides in less than 1% of the area. On the other hand, grassland demonstrated the lowest susceptibility to landslides, with only 8% of the landslide area occurring in nearly 20% of the area. Furthermore, the average landslide area across different land-use types revealed that bareland and urban areas exhibited the largest average landslide areas, exceeding 6000 m2. Croplands exhibited an average landslide area of approximately 1500 m2. In contrast, other land-use types possessed smaller average landslide areas, ranging from 800 m2 to 1000 m2. It should be noted that the large average landslide area in bareland and urban areas was primarily due to the limited occurrence of landslides in these two land-use types, which was not statistically significant.
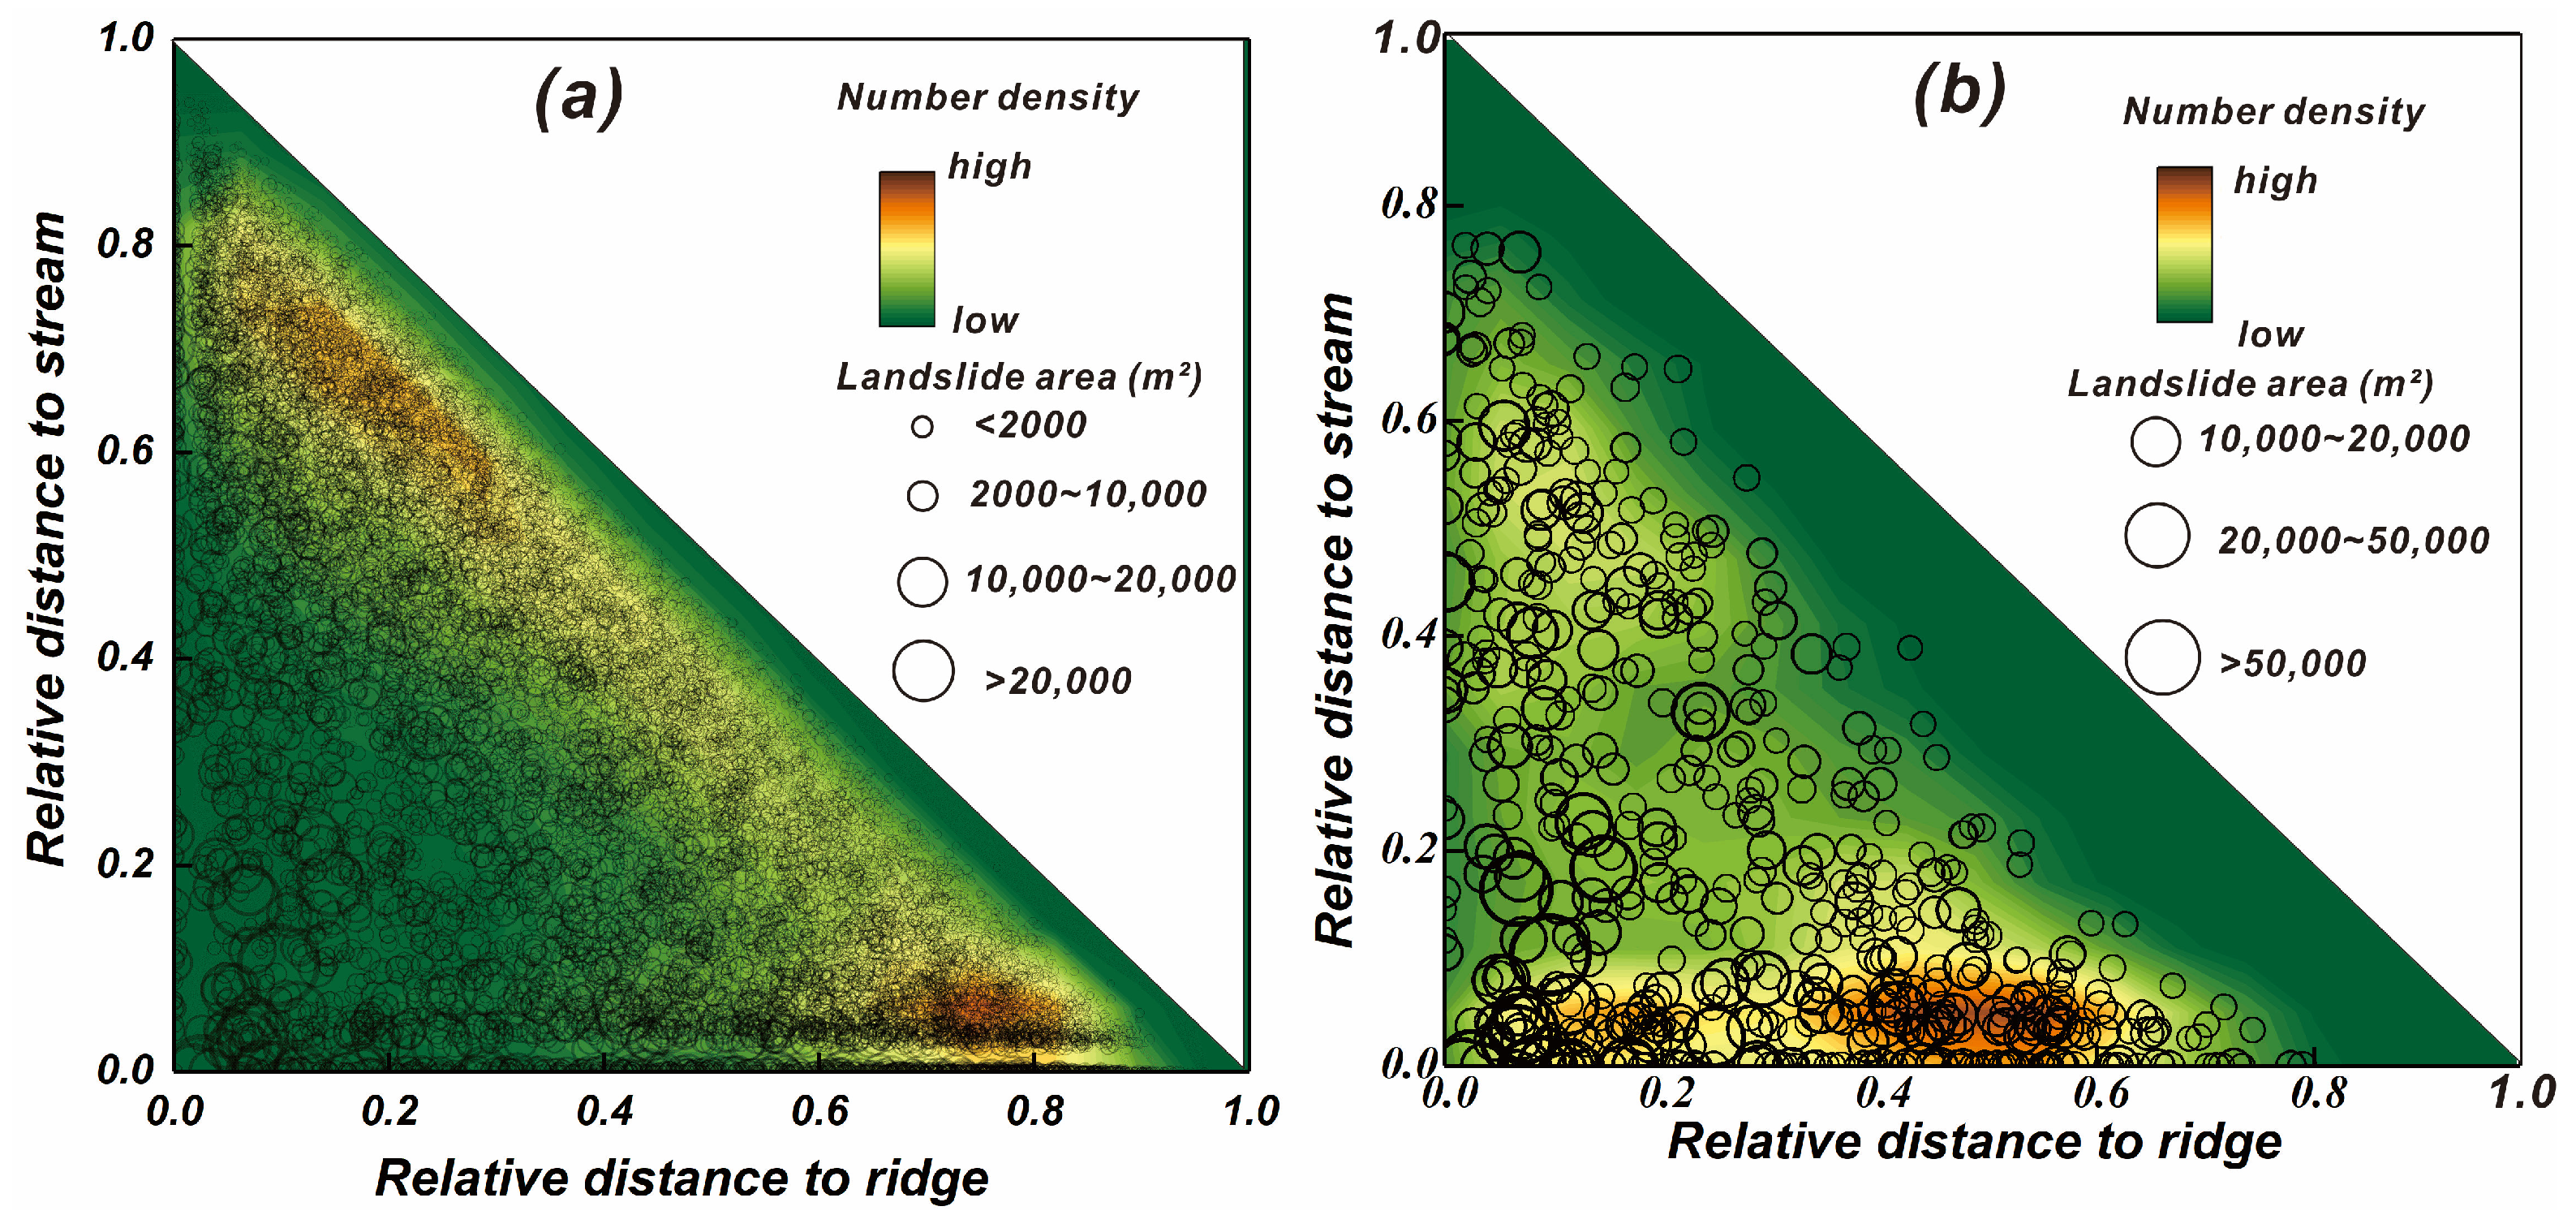
Figure 16 visually represents the topographic location of rainfall-induced landslides, displaying their number density, area, and relative distance to ridges and rivers on a hypothetical slope profile. The horizontal axis denotes the relative distance from the boundary of each landslide to the top of the mountain ridge, while the vertical axis represents the distance to the valley. The circle size corresponds to the scale of each landslide, and the background colors indicate the landslide number density. Figure 16a and 16b specifically depict the locations of landslides with areas greater than 1000 m2 and 10,000 m2, respectively. The results show that landslides in the Tianshui area were evenly distributed across different positions on the slope. However, landslides in the vicinity of river channels (with a relative distance to the river of less than 0.1) exhibited a clustered distribution. This indicates that the head scarps of these landslides were more likely to develop in the middle and lower slope positions, while the deposited areas were often found near the river channels. This phenomenon was even more pronounced for large-scale landslides (>10,000 m2), where approximately 80% of the source areas (highlighted in red as high-density areas) were situated close to the valley region, with a relative distance to the streams of less than 0.1.
5. Discussion
The landslides induced by the 2013 heavy rainfall event were found to be predominantly influenced by the interaction of topography, geological conditions, and heavy rainfall. This influence is reflected by their primary distribution within different geological formations, including the Quaternary Fluvial deposits (Q4apl) and eolian loesses (Q3eol), as well as the Devonian Quartzite and quartz schist, intertwined with sericite quartz schist from the Shujiaba formation (D2S) (Figure 17). The study area’s physical characteristics play a significant role in inducing the occurrence of landslides. The presence of steep mountains, deep valleys with substantial height differences, and other related features collectively create an environment conducive to landslide occurrence and development. The distribution map of landslides within the study area revealed distinct patterns, characterized by prominent group-occurring landslide distribution, continuous dispersion, and a wide coverage area. Remarkably, these landslides are often manifested as formations resembling a “claw” shape, especially on the slopes of mountainous regions. Another contributing factor is the continuous and heavy precipitation associated with the aforementioned rainfall event. This extended period of rainfall has resulted in the near-saturation of the shallow rock-soil layers, significantly impairing their shear strength. As a result, slopes characterized by shallow accumulation layers and pre-existing cracks become more geologically vulnerable [40]. The Potential Vulnerability in the study area is further complicated by the dense vegetation coverage and the presence of numerous “V-type” valleys. These elements play pivotal roles in the formation process of landslides. The precipitation-induced saturated residual slope soil and the trees on the slopes collectively lead to the sliding of saturated materials into ditches and then formed barrier lakes. Subsequent collapses of these dam bodies result in the initiation of debris flows. Intriguingly, in some instances, these ditches can even become repositories for driftwood [39,40].
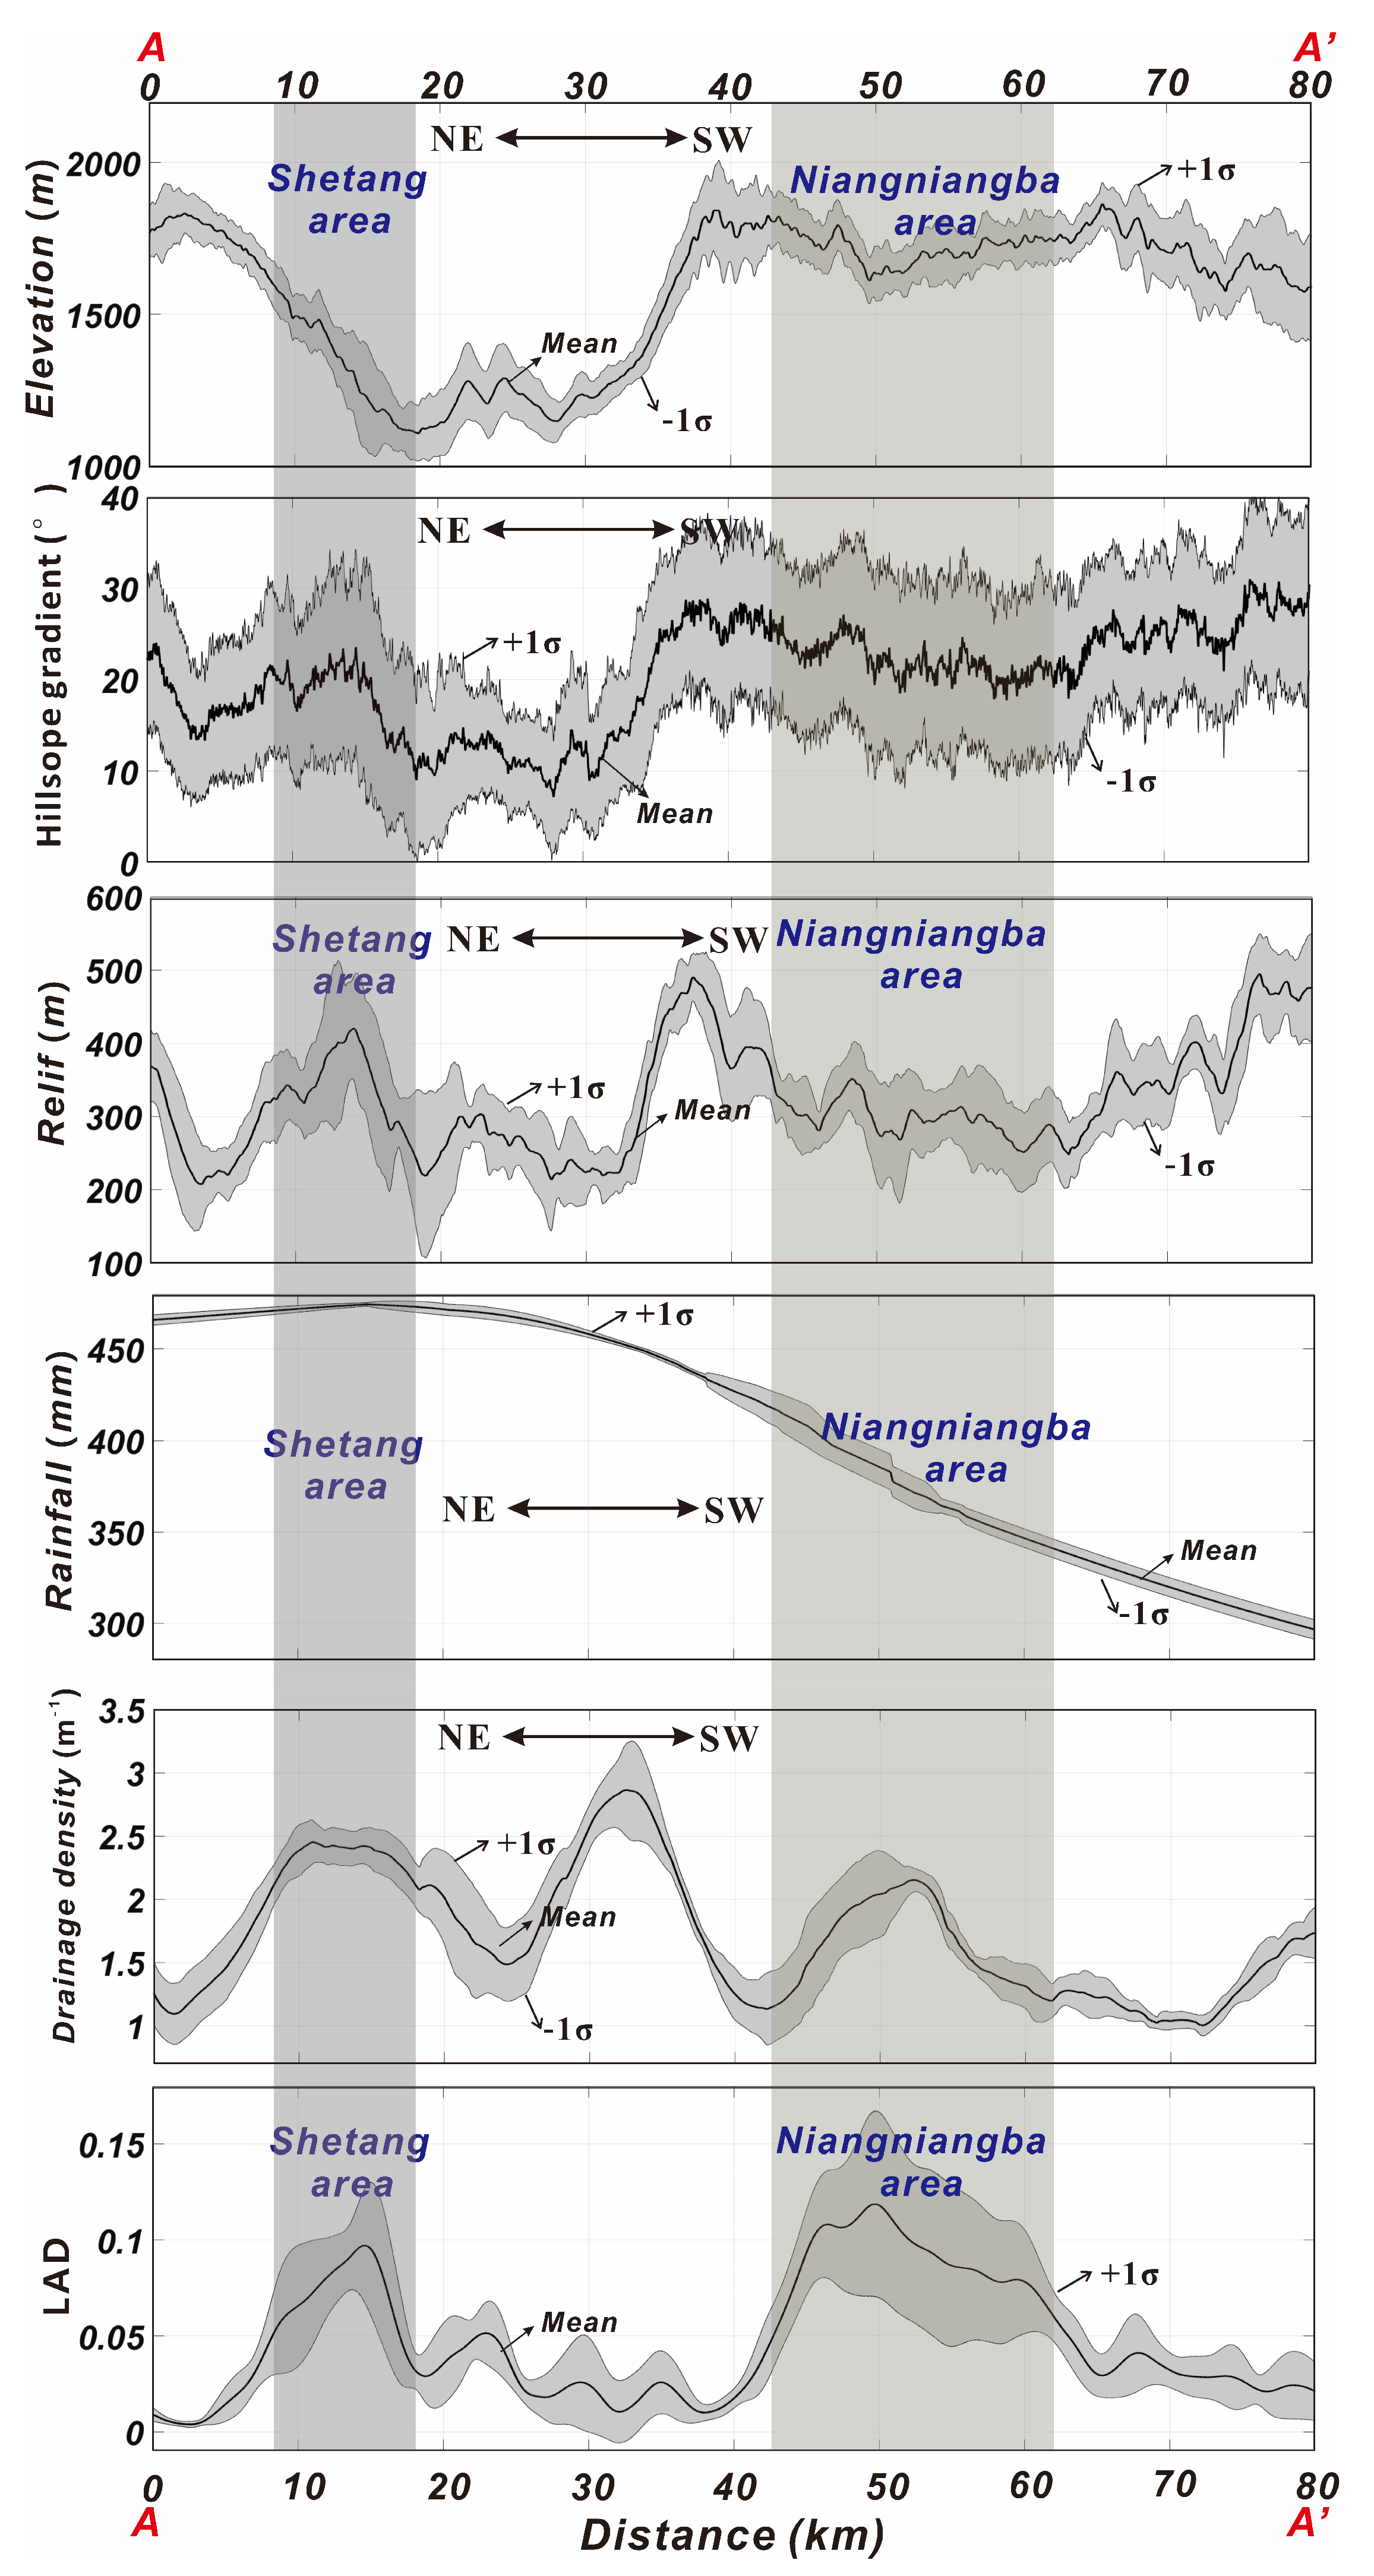
It is widely accepted that steeper terrains, weaker rock strength, and higher rainfall intensities contribute to an increased susceptibility to landslides [47,48,49]. To gain a deeper understanding of the spatial distribution relationship between landslides and various influencing factors, a swath profile (NE-SW) spanning a width of 10 km was presented. The results show that the landslides triggered by this rainfall event were mainly concentrated in two areas, i.e., Niangniangba and Shetang areas. Specifically, the Niangniangba area was the most densely developed area for landsliding with the maximum LAD of roughly 15%. This region belongs to a high altitude and low terrain area, with an average elevation of about 1700 m and average relief of about 300 m. The terrain here is steep, with an average gradient of 20°–30°. The drainage systems are densely developed and the river erosion is strong and, thus, the majority of the landslides develop along the erosion ditches and both sides of the rivers. In addition, the Niangniangba area was not the region with the highest rainfall intensity, with a total rainfall of between 350 mm and 400 mm. The local lithology is mainly metamorphic quartzite, quartz schist, and sericite quartz schist of the Shujiaba formation (D2S). Sericite schist and quartz schist exhibit well-developed cleavage and contain a high proportion of mica. Prolonged exposure to physical weathering causes the fragmentation of rock mass on the bedrock surface, resulting in extensive fissures that are locally filled with sediments. Consequently, this lithological type is prone to the formation of weak structural layers over time, serving as natural sliding surfaces for landslides [50,51]. In addition, the weathered rock and soil are characterized by numerous cracks, facilitating the infiltration of rainwater over-extended periods. Such a process leads to an increased pore water pressure within the rock mass, while the augmented self-weight of the rock mass reduces shear resistance. These combined factors contribute significantly to the occurrence of landslides. This phenomenon was also observed in landslides triggered by the 2016 heavy rainfall in the Sanming area [51]. Another landslide abundance area is the Shetang area with a low altitude and high relief. The average elevation of the Shetang area is between 1000 and 1500 m, and the relief range is from 300 m to 500 m. In addition, the hillslope gradient in this area is relatively small, with an average gradient between 10° to 20°. The lithology of this area is mainly composed of Quaternary fluvial deposits (Q4apl) and eolian loesses (Q3eol), which is responsible for the substantial shallow loess landslides therein. In addition, the area suffers the maximum rainfall, with a total rainfall of over 450 mm. As a special type of soil with large pores and high collapsibility, loesses have unique physical properties. For example, due to the strong water sensitivity, rainfall has become the most active influencing factor for loess landslides. On the other hand, the increase in moisture content of unsaturated loess leads to a decrease in the effective stress of the soil, and the rise in groundwater level leads to a decrease in shear strength of saturated loess. Therefore, under heavy rainfall conditions, shallow loess landslides in the area are often densely developed.
Orographic precipitation is produced when moist air is lifted as it moves over a mountain range [52]. As the air rises and cools, orographic clouds form and serve as the source of precipitation, most of which falls upwind on the mountain ridge. The orographic precipitation, along with the projection of rainfall vectors onto hillslopes, can lead to the increase in precipitation on the windward hillslopes. This phenomenon ultimately contributes to a higher frequency of landslide occurrence on a hillslope scale [53]. The Tianshui area is geographically adjacent to Baoji city of Shaanxi Province to the east and Longnan city of Gansu Province to the south. The terrain structure of the Tianshui area is an east–west canyon, and the prevailing wind directions are east (E) and southeast (SE). The relationship of the rainfall-induced landslides and aspect shows that landslides in the Tianshui area mostly occur along S, SE, and E directions. This phenomenon can be primarily attributed to the south-oriented slopes being predominantly windward, resulting in more intense rainfall and splash erosion [12,51].
The Tianshui region is located in a semi-arid area with active geological structures and frequent earthquakes. The Mw 5.9 Minxian earthquake on 22 July 2013 occurred between the eastern Kunlun fault and the northern edge of the western Qinling fault zone. Its epicenter is located at 34.512°N and 104.262°E, which is about 130 km west of the study area. According to the published seismic data from the United States Geological Survey (USGS), the seismic intensity of the Niangniangba area affected by the earthquake was about 3.5 degrees. Although the seismic factor itself is not sufficient to cause the occurrence of massive landslides, earthquakes may lead to the disturbance to the rock–soil mass, which indirectly promotes the occurrence of landslides [39,54]. The results show that the landslides triggered by this rainfall event were mostly small-scale shallow landslides with an area of less than 1000 m2. Due to the fact that the study area was in the semi-arid Loess Plateau region with high evaporation, the surface and shallow groundwater cannot maintain high water levels for a long time. Therefore, the impact of the first two extreme rainfall events on landslide occurrence has significantly decreased [54]. However, the 22 July Minxian earthquake may cause the development of fissures and cracks in the rock-soil mass, which can provide favorable conditions for rainfall infiltration, thereby significantly reducing the strength of the rock mass on the slope and inducing landslides under rainfall conditions. Therefore, we suggest that the third rainfall event on the day of the earthquake occurrence and the fourth rainfall event three days later ultimately contribute to the occurrence of a large number of rainfall-induced landslides in the Tianshui area. While visual interpretation is pervasively considered as a viable methodology for detecting landslides and constructing landslide inventories, it is important to acknowledge its inherent limitations. These constraints encompass factors such as the accessibility and quality of Earth Observation images with very high resolution, as well as challenges posed by cloud cover and other environmental variables. Additionally, the accuracy of visual interpretation is closely associated with the expertise of available professionals [55,56]. Despite its undeniable value, this approach is time-intensive and best suited for local-scale applications. Considering the scope of regional-scale analyses, the incorporation of more advanced machine-learning techniques becomes imperative. Nevertheless, it is worth emphasizing the ongoing necessity of visual interpretation for landslide detection. This need arises due to the unique characteristics of landslides, encompassing factors such as size and type, which can be better discerned through the nuanced perception of human experts. By skillfully combining the strengths of both visual interpretation and automated methods, a comprehensive and accurate landslide-detection framework can be established. Numerous studies have underscored the continued relevance of visual interpretation in landslide detection. For instance, Xu et al. [57] emphasized that visual interpretation based on high-resolution images can identify subtle morphological indicators of landslides, especially in complex terrains. Similarly, Xu et al. [58] highlighted the superiority of interpreting ancient landslides based on visual interpretation.
6. Conclusions
In this study, we investigated the characteristics and triggering factors of landslides induced by the 2013 continuous rainfall event in the Tianshui region. We also probed the relationship between the landslide occurrence and different influencing factors (e.g., terrain, geomorphology, geology, and rainfall condition). After compiling a detailed landslide inventory, it was found that this rainfall event triggereda approximately 54,000 landslides, mainly consisting of loess landslides with elongated type, shallow rockslides, collapses, and mudflows. Most landslides were small-scale shallow landslides with an area of less than 1000 m2. The landslides exhibited a clustered distribution, and most of them were concentrated in two specific areas, that is, the Niangniangba area in the central part and the Shetang area in the northern part. In addition, most of the landslides were observed in areas with lower elevations, steep hillslope gradients, and high rainfall intensities. The LAD showed a positive trend as these influencing factors increased, which can be described by either an exponential or a linear relationship. Among all lithological units, the Middle Devonian Shujiaba Formation (D2S) was most prone to landslides, with 35% of landslides occurring in 22% of the study area. Overall, landslides developed in Cenozoic strata were found to have slightly larger scales compared to those occurred in Paleozoic strata. Additionally, the E–SE aspect was more prone to landslides, while less landslides were developed along the W–NW aspect. The highest landslide density was observed in the Niangniangba area with a steep hillslope gradient and moderate rainfall intensity, indicating that the lithological and topographic conditions play major roles in this region, followed by the rainfall factor. By contrast, the landslides in the Shetang area were more significantly affected by the rainfall factor. The 22 July Minxian earthquake may cause the development of fissures and cracks in the rock–soil mass, providing favorable conditions for rainfall infiltration. Therefore, we suggest that the Minxian earthquake has promoted the occurrence of landslides in the region.
Author Contributions
The research concept was proposed by C.X. who also contributed to the data curation and analysis; Y.X. contributed to the data curation; X.S. designed the research framework, processed the relevant data, and drafted the manuscript; S.M. participated in the data analysis and contributed to the manuscript revisions. All authors have read and agreed to the published version of the manuscript.
Funding
This study was supported by the National Key Research and Development Program of China (2021YFB3901205) and Young Elite Scientists Sponsorship Program by BAST (No. BYESS2023122).
Data Availability Statement
The coseismic landslide inventory of this earthquake event are available from the corresponding author upon request.
Acknowledgments
We thank Google Earth for the free access satellite images used in this study.
Conflicts of Interest
The authors declare that they have no known competing financial interests or personal relationships that could have appeared to influence the work reported in this paper.
References
- Liu, T.S. Loess and Environment; China Ocean Press: Beijing, China, 1985. [Google Scholar]
- Derbyshire, E.; Meng, X.; Dijkstra, T.A. Landslides in the Thick Loess Terrain of North-West China; Wiley: London, UK, 2000; pp. 231–260. [Google Scholar]
- Li, Y.; He, S.; Deng, X.; Xu, Y. Characterization of macropore structure of Malan loess in NW China based on 3D pipe models constructed by using computed tomography technology. J. Asian Earth Sci. 2018, 154, 271–279. [Google Scholar] [CrossRef]
- Xu, L.; Dai, F.; Tu, X.; Tham, L.G.; Zhou, Y.; Iqbal, J. Landslides in a loess platform, North-West China. Landslides 2013, 11, 993–1005. [Google Scholar] [CrossRef]
- Peng, J.; Wang, S.; Wang, Q.; Zhuang, J.; Huang, W.; Zhu, X.; Leng, Y.; Ma, P. Distribution and genetic types of loess landslides in China. J. Asian Earth Sci. 2019, 170, 329–350. [Google Scholar] [CrossRef]
- Xu, C.; Xu, X.; Shyu, J.B.H. Database and spatial distribution of landslides triggered by the Lushan, China Mw 6.6 earthquake of 20 April 2013. Geomorphology 2015, 248, 77–92. [Google Scholar] [CrossRef]
- Jibson, R.W.; Tanyaş, H. The influence of frequency and duration of seismic ground motion on the size of triggered landslides—A regional view. Eng. Geol. 2020, 273, 105671. [Google Scholar] [CrossRef]
- Broeckx, J.; Vanmaercke, M.; Duchateau, R.; Poesen, J. A data-based landslide susceptibility map of Africa. Earth-Sci. Rev. 2018, 185, 102–121. [Google Scholar] [CrossRef]
- Bălteanu, D.; Micu, M.; Jurchescu, M.; Malet, J.-P.; Sima, M.; Kucsicsa, G.; Dumitrică, C.; Petrea, D.; Mărgărint, M.C.; Bilaşco, I.; et al. National-scale landslide susceptibility map of Romania in a European methodological framework. Geomorphology 2020, 371, 107432. [Google Scholar] [CrossRef]
- Kirschbaum, D.; Stanley, T. Satellite-based assessment of rainfall-triggered landslide hazard for situational awareness. Earth’s Future 2018, 6, 505–523. [Google Scholar] [CrossRef]
- Shao, X.; Ma, S.; Xu, C. Distribution and characteristics of shallow landslides triggered by the 2018 Mw 7.5 Palu earthquake, Indonesia. Landslides 2023, 20, 157–175. [Google Scholar] [CrossRef]
- Ma, S.; Shao, X.; Xu, C. Characterizing the Distribution Pattern and a Physically Based Susceptibility Assessment of Shallow Landslides Triggered by the 2019 Heavy Rainfall Event in Longchuan County, Guangdong Province, China. Remote Sens. 2022, 14, 4257. [Google Scholar] [CrossRef]
- Dai, L.; Scaringi, G.; Fan, X.; Yunus, A.P.; Liu-Zeng, J.; Xu, Q.; Huang, R. Coseismic Debris Remains in the Orogen Despite a Decade of Enhanced Landsliding. Geophys. Res. Lett. 2021, 48, e2021GL095850. [Google Scholar] [CrossRef]
- Xiong, J.; Chen, M.; Tang, C. Long-term changes in the landslide sediment supply capacity for debris flow occurrence in Wenchuan County, China. Catena 2021, 203, 105340. [Google Scholar] [CrossRef]
- Tanyaş, H.; van Westen, C.J.; Allstadt, K.E.; Jessee, M.A.N.; Görüm, T.; Jibson, R.W.; Godt, J.W.; Sato, H.P.; Schmitt, R.G.; Marc, O.; et al. Presentation and Analysis of a Worldwide Database of Earthquake-Induced Landslide Inventories. J. Geophys. Res. Earth Surf. 2017, 122, 1991–2015. [Google Scholar] [CrossRef]
- Tian, Y.; Xu, C.; Yuan, R.-M. Earthquake-Triggered Landslides. In Reference Module in Earth Systems and Environmental Sciences; Academic Press: Cambridge, MA, USA, 2021. [Google Scholar]
- Guzzetti, F.; Mondini, A.C.; Cardinali, M.; Fiorucci, F.; Santangelo, M.; Chang, K.-T. Landslide inventory maps: New tools for an old problem. Earth-Sci. Rev. 2012, 112, 42–66. [Google Scholar] [CrossRef]
- Martha, T.R.; Roy, P.; Khanna, K.; Mrinalni, K.; Kumar, K.V. Landslides mapped using satellite data in the Western Ghats of India after excess rainfall during August 2018. Curr. Sci. 2019, 117, 804–812. [Google Scholar] [CrossRef]
- Meena, S.R.; Ghorbanzadeh, O.; van Westen, C.J.; Nachappa, T.G.; Blaschke, T.; Singh, R.P.; Sarkar, R. Rapid mapping of landslides in the Western Ghats (India) triggered by 2018 extreme monsoon rainfall using a deep learning approach. Landslides 2021, 18, 1937–1950. [Google Scholar] [CrossRef]
- Sato, H.; Harp, E. Interpretation of earthquake-induced landslides triggered by the 12 May 2008, M7.9 Wenchuan earthquake in the Beichuan area, Sichuan Province, China using satellite imagery and Google Earth. Landslides 2009, 6, 153–159. [Google Scholar] [CrossRef]
- Tian, Y.; Owen, L.A.; Xu, C.; Ma, S.; Li, K.; Xu, X.; Figueiredo, P.M.; Kang, W.; Guo, P.; Wang, S.; et al. Landslide development within 3 years after the 2015 Mw 7.8 Gorkha earthquake, Nepal. Landslides 2020, 17, 1251–1267. [Google Scholar] [CrossRef]
- Schmitt, R.; Tanyas, H.; Jessee, A.; Zhu, J.; Biegel, K.; Allstadt, K.; Jibson, R.; Thompson, E.; Westen, C.J.; Sato, H.; et al. An Open Repository of Earthquake-Triggered Ground-Failure Inventories; U.S. Geological Survey: Reston, VA, USA, 2017.
- Xu, C. Landslide seismology geology: A sub-discipline of environmental earth science. J. Eng. Geol. 2018, 26, 207–222. [Google Scholar]
- Roback, K.; Clark, M.K.; West, A.J.; Zekkos, D.; Li, G.; Gallen, S.F.; Chamlagain, D.; Godt, J.W. The size, distribution, and mobility of landslides caused by the 2015 Mw7.8 Gorkha earthquake, Nepal. Geomorphology 2018, 301, 121–138. [Google Scholar] [CrossRef]
- Pokharel, B.; Alvioli, M.; Lim, S. Assessment of earthquake-induced landslide inventories and susceptibility maps using slope unit-based logistic regression and geospatial statistics. Sci. Rep. 2021, 11, 21333. [Google Scholar] [CrossRef] [PubMed]
- Massey, C.; Townsend, D.; Rathje, E.; Allstadt, K.E.; Lukovic, B.; Kaneko, Y.; Bradley, B.; Wartman, J.; Jibson, R.W.; Petley, D.N.; et al. Landslides Triggered by the 14 November 2016 Mw 7.8 Kaikōura Earthquake, New Zealand. Bull. Seismol. Soc. Am. 2018, 108, 1630–1648. [Google Scholar] [CrossRef]
- Tanyas, H.; Gorum, T.; Fadel, I.; Yıldırım, C.; Lombardo, L. An open dataset for landslides triggered by the 2016 Mw 7.8 Kaikōura earthquake, New Zealand. Landslides 2022, 19, 1405–1420. [Google Scholar] [CrossRef]
- Zhao, B. Landslides triggered by the 2018 Mw 7.5 Palu supershear earthquake in Indonesia. Eng. Geol. 2021, 294, 106406. [Google Scholar] [CrossRef]
- Zhao, B.; Hu, K.; Yang, Z.; Liu, Q.; Zou, Q.; Chen, H.; Zhang, W.; Zhu, L.; Su, L.-J. Geomorphic and tectonic controls of landslides induced by the 2022 Luding earthquake. J. Mt. Sci. 2022, 19, 3323–3345. [Google Scholar] [CrossRef]
- Xiao, Z.; Xu, C.; Huang, Y.; He, X.; Shao, X.; Chen, Z.; Xie, C.; Li, T.; Xu, X. Analysis of spatial distribution of landslides triggered by the Ms 6.8 Luding earthquake in China on September 5, 2022. Geoenvironmental Disasters 2023, 10, 3. [Google Scholar] [CrossRef]
- Emberson, R.; Kirschbaum, D.; Amatya, P.M.; Tanyas, H.; Marc, O. Insights from the topographic characteristics of a large global catalog of rainfall-induced landslide event inventories. Nat. Hazards Earth Syst. Sci. 2022, 22, 1129–1149. [Google Scholar] [CrossRef]
- Marc, O.; Stumpf, A.; Malet, J.P.; Gosset, M.; Uchida, T.; Chiang, S.-H. Initial insights from a global database of rainfall-induced landslide inventories: The weak influence of slope and strong influence of total storm rainfall. Earth Surf. Dyn. 2018, 6, 903–922. [Google Scholar] [CrossRef]
- Chang, K.-T.; Chiang, S.-H.; Chen, Y.-C.; Mondini, A. Modeling the spatial occurrence of shallow landslides triggered by typhoons. Geomorphology 2014, 208, 137–148. [Google Scholar] [CrossRef]
- Hirota, K.; Konagai, K.; Sassa, K.; Dang, K.; Yoshinaga, Y.; Wakita, E.K. Landslides triggered by the West Japan Heavy Rain of July 2018, and geological and geomorphological features of soaked mountain slopes. Landslides 2019, 16, 189–194. [Google Scholar] [CrossRef]
- Bessette-Kirton, E.; Cerovski-Darriau, C.; Schulz, W.; Coe, J.; Kean, J.; Godt, J.; Thomas, M.; Hughes, K. Landslides triggered by Hurricane Maria: Assessment of an extreme event in Puerto Rico. GSA Today 2019, 29, 4–10. [Google Scholar] [CrossRef]
- Van Westen, C.J.; Zhang, J. Landslides and Floods Triggered by Hurricane Maria (18 September, 2017) in Dominica, Digital or Visual Products, UNITAR-UNOSAT; Wiley: London, UK, 2018; Available online: https://www.unitar.org/unosat/node/44/2762 (accessed on 3 August 2021).
- Xu, Y.; Allen, M.B.; Zhang, W.; Li, W.; He, H. Landslide characteristics in the Loess Plateau, northern China. Geomorphology 2020, 359, 107150. [Google Scholar] [CrossRef]
- Li, M.; Ma, C.; Du, C.; Yang, W.; Lyu, L.; Wang, X. Landslide response to vegetation by example of July 25–26, 2013, extreme rainstorm, Tianshui, Gansu Province, China. Bull. Eng. Geol. Environ. 2021, 80, 751–764. [Google Scholar] [CrossRef]
- Yu, G.; Zhang, M.; Hu, W. Analysis on the development characteristics and hydrodynamic conditions for the massive debris flow in Tianshui. Northwestern Geol. 2014, 47, 7. [Google Scholar]
- Guo, F.; Meng, X.; Li, Z.; Xie, Z.; Chen, G.; He, Y. Characteristics and causes of assembled geo-hazards induced by the rainstorm on 25th July 2013 in Tianshui city, Gansu, China. Moutain Res. 2015, 33, 100–107. [Google Scholar]
- Peng, J.; Fan, Z.; Wu, D.; Zhuang, J.; Dai, F.; Chen, W.; Zhao, C. Heavy rainfall triggered loess–mudstone landslide and subsequent debris flow in Tianshui, China. Eng. Geol. 2015, 186, 79–90. [Google Scholar] [CrossRef]
- Qi, T.; Zhao, Y.; Meng, X.; Chen, G.; Dijkstra, T. AI-Based Susceptibility Analysis of Shallow Landslides Induced by Heavy Rainfall in Tianshui, China. Remote Sens. 2021, 13, 1819. [Google Scholar] [CrossRef]
- Wilson, J.; Gallant, J. Digital Terrain Analysis; John Wiley and Sons: New Yor, NY, USA, 2000; pp. 1–27. [Google Scholar]
- Gong, P.; Liu, H.; Zhang, M.; Li, C.; Wang, J.; Huang, H.; Clinton, N.; Ji, L.; Li, W.; Bai, Y.; et al. Stable classification with limited sample: Transferring a 30-m resolution sample set collected in 2015 to mapping 10-m resolution global land cover in 2017. Sci. Bull. 2019, 64, 370–373. [Google Scholar] [CrossRef]
- Görüm, T. Tectonic, topographic and rock-type influences on large landslides at the northern margin of the Anatolian Plateau. Landslides 2018, 16, 333–346. [Google Scholar] [CrossRef]
- Meunier, P.; Hovius, N.; Haines, J.A. Topographic site effects and the location of earthquake induced landslides. Earth Planet. Sci. Lett. 2008, 275, 221–232. [Google Scholar] [CrossRef]
- Ma, S.; Shao, X.; Xu, C.; He, X.; Zhang, P. MAT.TRIGRS (V1.0): A new open-source tool for predicting spatiotemporal distribution of rainfall-induced landslides. Nat. Hazards Res. 2021, 1, 161–170. [Google Scholar] [CrossRef]
- Abancó, C.; Bennett, G.L.; Matthews, A.J.; Matera, M.A.M.; Tan, F.J. The role of geomorphology, rainfall and soil moisture in the occurrence of landslides triggered by 2018 Typhoon Mangkhut in the Philippines. Nat. Hazards Earth Syst. Sci. 2021, 21, 1531–1550. [Google Scholar] [CrossRef]
- Saito, H.; Korup, O.; Uchida, T.; Hayashi, S.; Oguchi, T. Rainfall conditions, typhoon frequency, and contemporary landslide erosion in Japan. Geology 2014, 42, 999–1002. [Google Scholar] [CrossRef]
- Hong, Y.; Hiura, H.; Shino, K.; Sassa, K.; Fukuoka, H. Quantitative assessment on the influence of heavy rainfall on the crystalline schist landslide by monitoring system-case study on Zentoku landslide, Japan. Landslides 2005, 2, 31–41. [Google Scholar] [CrossRef]
- Ma, S.; Shao, X.; Xu, C. Landslides Triggered by the 2016 Heavy Rainfall Event in Sanming, Fujian Province: Distribution Pattern Analysis and Spatio-Temporal Susceptibility Assessment. Remote Sens. 2023, 15, 2738. [Google Scholar] [CrossRef]
- Roe, G.H. Orographic Precipitation. Annu. Rev. Earth Planet. Sci. 2005, 33, 645–671. [Google Scholar] [CrossRef]
- Chen, Y.; Chang, K.; Wang, S.; Huang, J.; Yu, C.; Tu, J.; Chu, H.; Liu, C. Controls of preferential orientation of earthquake- and rainfall-triggered landslides in Taiwan’s orogenic mountain belt. Earth Surf. Process. Landf. 2019, 44, 1661–1674. [Google Scholar] [CrossRef]
- Shi, P.; Yang, W. Compound effects of earthquakes and extreme weathers on geo-hazards in mountains. Clim. Change Res. 2020, 16, 405–414. [Google Scholar]
- Sameen, M.I.; Pradhan, B. Landslide detection using residual networks and the fusion of spectral and topographic information. IEEE Access 2019, 7, 114363–114373. [Google Scholar] [CrossRef]
- Ghorbanzadeh, O.; Blaschke, T.; Gholamnia, K.; Meena, S.R.; Tiede, D.; Aryal, J. Evaluation of different machine learning methods and deep-learning convolutional neural networks for landslide detection. Remote Sens. 2019, 11, 196. [Google Scholar] [CrossRef]
- Xu, C.; Shyu, J.; Xu, X. Landslides triggered by the 12 January 2010 Port-au-Prince, Haiti, MW = 7.0 earthquake: Visual interpretation, inventory compiling, and spatial distribution statistical analysis. Nat. Hazards Earth Syst. Sci. 2014, 14, 1789–1818. [Google Scholar] [CrossRef]
- Xu, Y.; Liu-Zeng, J.; Allen, M.; Du, P.; Zhang, W.; Li, W.; Tian, Q. Understanding historical earthquakes by mapping coseismic landslides in the Loess Plateau, Northwest China. Earth Surf. Process. Landf. 2022, 47, 2266–2282. [Google Scholar] [CrossRef]
Figure 1.
Map showing the topography, water systems, tectonic settings and landslide distribution caused by this rainfall event of the study area; MHYF: Maheyan fault, LYF: Lixian–Luojiabao fault, and NWQLF is the northern edge fault of the West–Qinling fault. Small black dots represent landslide surface vectors.

Figure 2.
The statistical results of monthly precipitation data in the Tianshui region for the past 20 years (from 2000 to 2020); (a) distribution of monthly precipitation over the past two decades; (b) a comparison between the average monthly precipitation over the past 20 years and the precipitation for each month in 2013.

Figure 3.
The total rainfall distribution and locations of the 14 rainfall stations in the Tianshui area; (a) the distribution of national rainfall stations near the study area and their corresponding station names; (b) map showing the spatial distribution of the total rainfall in the 40 days (from 19 June to 26 July).

Figure 4.
The 12 h rainfall data from June to July for three different rainfall stations; (a) the rainfall station 57008 located in the western area; (b) the rainfall station 57011 in the northern area; (c) the rainfall station 57014 in the upper-middle north-central of the study area. (Yellow highlights represents four heavy rainfall events).

Figure 5.
Map showing the rainfall distribution of the four events from June to July; (a) spatial distribution of rainfall during the first event (from 19 to 21 June); (b) spatial distribution of rainfall during the second event (from 8 to 10 July); (c) spatial distribution of rainfall during the third event (from 21 to 22 July); (d) spatial distribution of rainfall during the fourth event (from 24 to 25 July).

Figure 6.
Map showing the topographic and other factors used for the study; (a) hillslope gradient; (b) slope aspect; (c) topographic relief; (d) total rainfall; (e) surface roughness; (f) plan curvature; (g) drainage density; (h) road density; (i) land-use and land-cover (LULC) map; The blue lines represent the distribution of the drainages, while the white lines represent main roads.

Figure 7.
Map showing the optical images before and after rainfall; the pre- and post-rainfall image acquisition dates are April 2012 and October 2013, respectively. The location is in the northeast part of the Niangniangba area, with geographical coordinates of 105.82°E and 34.27°N. The yellow polygons are the boundary of rainfall-induced landslides. (a) pre- rainfall image. (b) post-rainfall image.

Figure 8.
Map showing the pre- and post-rainfall optical images located in the southwest part of the Niangniangba area (with geographical coordinates of 105.79°E, 34.21°N). (a) pre-rainfall image. (b) post-rainfall image.
Figure 8.
Map showing the pre- and post-rainfall optical images located in the southwest part of the Niangniangba area (with geographical coordinates of 105.79°E, 34.21°N). (a) pre-rainfall image. (b) post-rainfall image.

Figure 9.
Spatial distribution and scales of landslides along with their corresponding longitudinal and latitudinal profiles (the black dots represent landslide points that refer to the distribution of each landslide area in each classification interval).
Figure 9.
Spatial distribution and scales of landslides along with their corresponding longitudinal and latitudinal profiles (the black dots represent landslide points that refer to the distribution of each landslide area in each classification interval).

Figure 10.
Spatial distribution of the landslide abundance index of landslides triggered by this rainfall event. (a) Landslide area density (LAD) (b) Landslide number density (LND).
Figure 10.
Spatial distribution of the landslide abundance index of landslides triggered by this rainfall event. (a) Landslide area density (LAD) (b) Landslide number density (LND).

Figure 11.
Map showing the frequency density (FD) estimates of landslide and landscape areas for different factors; (a) elevation; (b) hillslope gradient; (c) relief; (d) total rainfall; (e) surface roughness; (f) plan curvature; (g) drainage density; (h) road density.
Figure 11.
Map showing the frequency density (FD) estimates of landslide and landscape areas for different factors; (a) elevation; (b) hillslope gradient; (c) relief; (d) total rainfall; (e) surface roughness; (f) plan curvature; (g) drainage density; (h) road density.

Figure 12.
Map showing the relationship between the LAD and different factors; (a) elevation; (b) hillslope gradient; (c) relief; (d) total rainfall; (e) surface roughness; (f) plan curvature; (g) drainage density; (h) road density.
Figure 12.
Map showing the relationship between the LAD and different factors; (a) elevation; (b) hillslope gradient; (c) relief; (d) total rainfall; (e) surface roughness; (f) plan curvature; (g) drainage density; (h) road density.

Figure 13.
Map showing the aspect distribution of the frequency density for landslide and landscape areas and LAD; (a) the FD of the landslide and landscape areas; (b) the distribution of the LAD in different aspects.
Figure 13.
Map showing the aspect distribution of the frequency density for landslide and landscape areas and LAD; (a) the FD of the landslide and landscape areas; (b) the distribution of the LAD in different aspects.

Figure 14.
Distribution of the areal coverage (%) of the landslides and landscape areas and average landslide area for different lithological units.
Figure 14.
Distribution of the areal coverage (%) of the landslides and landscape areas and average landslide area for different lithological units.

Figure 15.
The distribution of the areal coverage of the landslides and landscape areas and average landslide area for different land-use types.
Figure 15.
The distribution of the areal coverage of the landslides and landscape areas and average landslide area for different land-use types.

Figure 16.
Topographic location of the rainfall-induced landslides in relation to the ridge crest and streams of the Tianshui area. (a) The topographic location of the landslides with an area greater than 1000 m2; (b) the topographic location of the landslides with an area greater than 10,000 m2.
Figure 16.
Topographic location of the rainfall-induced landslides in relation to the ridge crest and streams of the Tianshui area. (a) The topographic location of the landslides with an area greater than 1000 m2; (b) the topographic location of the landslides with an area greater than 10,000 m2.

Figure 17.
Comparison of longitudinal (NE-SW) swath profiles of elevation, hillslope gradient, relief, rainfall, drainage density and LAD; the location of the swath profile is shown in Figure 7.
Figure 17.
Comparison of longitudinal (NE-SW) swath profiles of elevation, hillslope gradient, relief, rainfall, drainage density and LAD; the location of the swath profile is shown in Figure 7.


Table 1.
Lithology description of the study area.
| Stratigraphic Age | Lithology Description |
|---|---|
| Quaternary (Q) | Fluvial deposits (Q4a pl), landslide deposits (Q4del), and eolian loess (Q3eol) |
| Neogene (N) | Grey clay rock, red mudstone |
| Eogene (E) | Conglomerates, purple red sandstone conglomerates |
| Middle Carboniferous (C2) | Gray sandstone, Siltstone and argillaceous Siltstone |
| Late Devonian (D3) | Slate interbedded with conglomerate and purple red sandstone |
| Middle Devonian (D2x) | Slate or phyllite, sandstone, siltstone |
| Middle Devonian (D2s) | Quartzite and quartz schist, mixed with sericite quartz schist |
| Precambrian (Pz) | Biotite schist, Biotite Gneiss and Biotite plagioclase gneiss interbedded with Quartzite and marble |
| Magmatic rocks (mag) | Biotite granite, medium coarse grained granite, etc. |
Table 2.
Statistical indicators of influence factors for the landslides and landscape area.
| Variable | Landslide | Landscape | |
|---|---|---|---|
| Hillslope gradient [°] | Mean | 25.5 | 20.5 |
| Max | 69 | 71 | |
| Min | 0 | 0 | |
| Elevation [m] | Mean | 1518 | 1573 |
| Max | 2243 | 2353 | |
| Min | 990 | 921 | |
| Surface roughness | Mean | 1.2 | 1.0 |
| Max | 2.9 | 4.17 | |
| Min | 1.0 | 1 | |
| Relief (m) | Mean | 346 | 340 |
| Max | 797 | 878 | |
| Min | 104 | 14 | |
| TWI | Mean | 5.9 | 5.9 |
| Max | 14.8 | 15.3 | |
| Min | 2.0 | 1.2 | |
| Plan curvature | Mean | −0.1 | 0.02 |
| Max | 8.7 | 21 | |
| Min | −10.1 | −21.3 | |
| River density (m−1) | Mean | 1.8 | 1.6 |
| Max | 3.13 | 3.5 | |
| Min | 0.68 | 0.6 | |
| Road density (m−1) | Mean | 3.2 | 3.0 |
| Max | 16.3 | 17.7 | |
| Min | 0 | 0 |
Disclaimer/Publisher’s Note: The statements, opinions and data contained in all publications are solely those of the individual author(s) and contributor(s) and not of MDPI and/or the editor(s). MDPI and/or the editor(s) disclaim responsibility for any injury to people or property resulting from any ideas, methods, instructions or products referred to in the content. |
© 2023 by the authors. Licensee MDPI, Basel, Switzerland. This article is an open access article distributed under the terms and conditions of the Creative Commons Attribution (CC BY) license (https://creativecommons.org/licenses/by/4.0/).
Share and Cite
MDPI and ACS Style
Shao, X.; Ma, S.; Xu, C.; Xu, Y. Insight into the Characteristics and Triggers of Loess Landslides during the 2013 Heavy Rainfall Event in the Tianshui Area, China. Remote Sens. 2023, 15, 4304. https://doi.org/10.3390/rs15174304
AMA Style
Shao X, Ma S, Xu C, Xu Y. Insight into the Characteristics and Triggers of Loess Landslides during the 2013 Heavy Rainfall Event in the Tianshui Area, China. Remote Sensing. 2023; 15(17):4304. https://doi.org/10.3390/rs15174304
Chicago/Turabian StyleShao, Xiaoyi, Siyuan Ma, Chong Xu, and Yueren Xu. 2023. "Insight into the Characteristics and Triggers of Loess Landslides during the 2013 Heavy Rainfall Event in the Tianshui Area, China" Remote Sensing 15, no. 17: 4304. https://doi.org/10.3390/rs15174304
Note that from the first issue of 2016, this journal uses article numbers instead of page numbers. See further details here.