Article

Evaluation of the RF-MEP Method for Merging Multiple Gridded Precipitation Products in the Chongqing City, China

1
School of Public Administration, Chongqing Technology and Business University, Chongqing 400067, China
2
Center for Eco-Environmental Research, Nanjing Hydraulic Research Institute, Nanjing 210029, China
3
School of Environment and Energy Engineering, Anhui Jianzhu University, Hefei 203601, China
4
Department of Physical Geography and Ecosystem Science, Lund University, Sölvegatan 12, SE-223 62 Lund, Sweden
5
Department of Irrigation and Reclamation Engineering, University of Tehran, Karaj 31587-77871, Iran
6
College of Hydrology and Water Resources, Hohai University, Nanjing 210024, China
7
The Hydraulics Research Station, Wad Medani P.O. Box 318, Sudan
8
Department of Civil Engineering, Erzincan Binali Yıldırım University, 24002 Erzincan, Turkey
*
Author to whom correspondence should be addressed.
Remote Sens. 2023, 15(17), 4230; https://doi.org/10.3390/rs15174230
Submission received: 18 July 2023 / Revised: 15 August 2023 / Accepted: 27 August 2023 / Published: 28 August 2023
(This article belongs to the Special Issue Remote Sensing of Clouds and Precipitation at Multiple Scales II)

Abstract

:
Precipitation is a major component of the water cycle. Accurate and reliable estimation of precipitation is essential for various applications. Generally, there are three main types of precipitation products: satellite based, reanalysis, and ground measurements from rain gauge stations. Each type has its advantages and disadvantages. Recent efforts have been made to develop various merging methods to improve precipitation estimates by combining multiple precipitation products. This study evaluated for the first time the performance of the random forest-based merging procedure (RF-MEP) method in enhancing the accuracy of daily precipitation estimates in Chongqing city, China with a complex terrain and sparse observational data. The RF-MEP method was used to merge three widely used gridded precipitation products (CHIRPS, ERA5-Land, and GPM IMERG) with ground measurements from a limited number of rain gauge stations to produce the merged precipitation dataset. Eight stations (approximately 70% of the available stations) were used to train the RF-MEP approach, while four stations (30%) were used for independent testing. Various statistical metrics were employed to assess the performance of the merged precipitation dataset and the three existing precipitation products against the ground measurements. Our results demonstrated that the RF-MEP approach significantly enhances the accuracy of daily precipitation estimates, surpassing the performance of the individual precipitation products and two other merging methods (the simple linear regression model and the simple averaging). Among the three existing products, ERA5-Land exhibited the best performance in capturing daily precipitation, followed by GPM IMERG, while CHIRPS performed the worst. Regarding precipitation intensity, all three existing products and the RF-MEP merged dataset performed well in capturing light precipitation events with an intensity of less than 1 mm/day, which accounts for the majority (more than 70%) of occurrences. However, all datasets showed rather poor capability in capturing precipitation events beyond 1 mm/day, with the worst performance observed for extreme heavy precipitation events exceeding 50 mm/day. The RF-MEP approach significantly improves the detection ability for all precipitation intensities, except for the most extreme intensity (>50 mm/day), where only marginal improvement is observed. Analysis of the spatial pattern of precipitation estimates and the temporal bias of daily precipitation estimates further confirms the superior performance of the RF-MEP merged precipitation dataset over the three existing products.

1. Introduction

Precipitation, a crucial component of the water cycle, is essential for the survival of living organisms, ecosystem development, agricultural production, and fresh water supply. Precipitation is characterized by large spatial and temporal variability, and accurate precipitation data at high spatial and temporal resolution are essential for many applications such as hydrological modeling and water resources management [1,2]. However, the representation of precipitation’s spatiotemporal variation remains limited [3]. Traditionally, rain gauge stations are the most direct and widely used ways to obtain precipitation data. These rain gauge stations are often sparse, and spatial interpolation methods are often employed to estimate the spatial distribution of precipitation, and large uncertainty could be introduced [4]. Satellite remote sensing has emerged as an effective and complementary method for obtaining precipitation at various spatial and temporal resolutions [5]. Satellite-based precipitation estimates rely on either primarily infrared (IR) data, often obtained from geostationary satellites, or less frequently collected microwave (MV) data from low earth orbiting satellites. Some methods utilize a combination of both IR and MV information. A comprehensive description of the principles and diverse techniques employed in satellite-based precipitation estimation can be found in the review by Sun et al. (2018) [6]. In recent decades, significant endeavors have been undertaken to produce gridded precipitation datasets, resulting in the growing availability of precipitation at various spatial and temporal resolutions on a global or quasi-global scale [1,6]. To mention a few, the widely used precipitation products include, for example, the Integrated Multi-SatellitE Retrievals for Global Precipitation Measurement (IMERG), Remotely Sensed Information using Artificial Neural Networks (PERSIANN), the Tropical Rainfall Measuring Mission (TRMM), the Climate Prediction Center Morphing technique product (CMORPH), and the Climate Hazards group Infrared Precipitation with Stations dataset (CHIRPSv2) [7,8,9,10,11]. Evaluation of these available gridded precipitation products showed that their accuracy could vary from region to region and overall, they still contain large uncertainties compared to the most accurate measurements from rain gauge stations [6,12].
Considering the fact that an individual precipitation product can have unique advantages and disadvantages, many efforts have been made to merge multiple precipitation products to obtain the improved precipitation estimates. Different merging methods have been developed. For example, Chen et al. (2022) used the triple collocation method to quantify the errors of three satellite precipitation products including the IMERG Final, PERSIANN-CDR, and SM2RAIN-ASCAT and the reanalysis precipitation product ERA5 and further developed the triple collocation-based method for merging these products to generate the precipitation dataset with improved accuracy [13]. Wei et al. (2023) applied the Bayesian model averaging method to fuse gauge-based, reanalysis, and satellite precipitation products to generate improved precipitation estimates in China [14]. Baez-Villanueva et al. (2020) developed the random forest-based merging procedure (RF-MEP) to combine information from ground measurements from rain gauge stations, gridded precipitation products, and topography-related features [15]. The RF-MEP method was used to merge several satellite precipitation products to generate a new daily precipitation dataset, and the evaluation process was performed at multiple temporal scales including 3-day, monthly, seasonal, and annual scales. The RF-MEP method was also compared with one well-known global merged precipitation product (MSWEP) and three other merging methods, namely, the simple average, one-outlier-remove average, and inverse error variance. Overall, the merged precipitation dataset using the RF-MEP method showed better performance in improving the accuracy of the precipitation estimates. However, very few studies have explored the applicability of the RF-MEP method in different regions. Nguyen et al. (2021) validated the RF-MEP approach in merging multiple satellite precipitation products and ground measurements from rain gauge stations in South Korea [16]. They also found that the RF-based merging method performed better than the merged precipitation product MSWEP and three other merging methods including the simple average, one-outlier-remove average, and inverse error variance. Besides various satellite precipitation products, recent efforts have been made to the realm of reanalysis products, resulting in the increased availability of the reanalysis products with improved accuracy. A prominent example of this progress is the state-of-the-art reanalysis product ERA5-Land [17]. Notably, many studies such as [18] have found that the ERA5-Land product has very good accuracy for precipitation. Nevertheless, it is noteworthy that previous studies, e.g., [15,16], primarily focused on using RF-MEP to merge multiple satellite precipitation products. However, these studies missed out on including the ERA5-Land product in the merging procedure.
To the best of our knowledge, the application of the RF-MEP approach for merging multiple satellite and reanalysis precipitation products remains limited. Therefore, this study aimed to evaluate the RF-MEP method for the first time in Chongqing city, China with complex terrain and sparse observational data to combine ground-based measurements with two widely used satellite precipitation products (CHIRPS and GPM) and the reanalysis product ERA5-Land. The evaluation at spatial and temporal scale was performed and multiple error metrics were used.

2. Materials and Methods

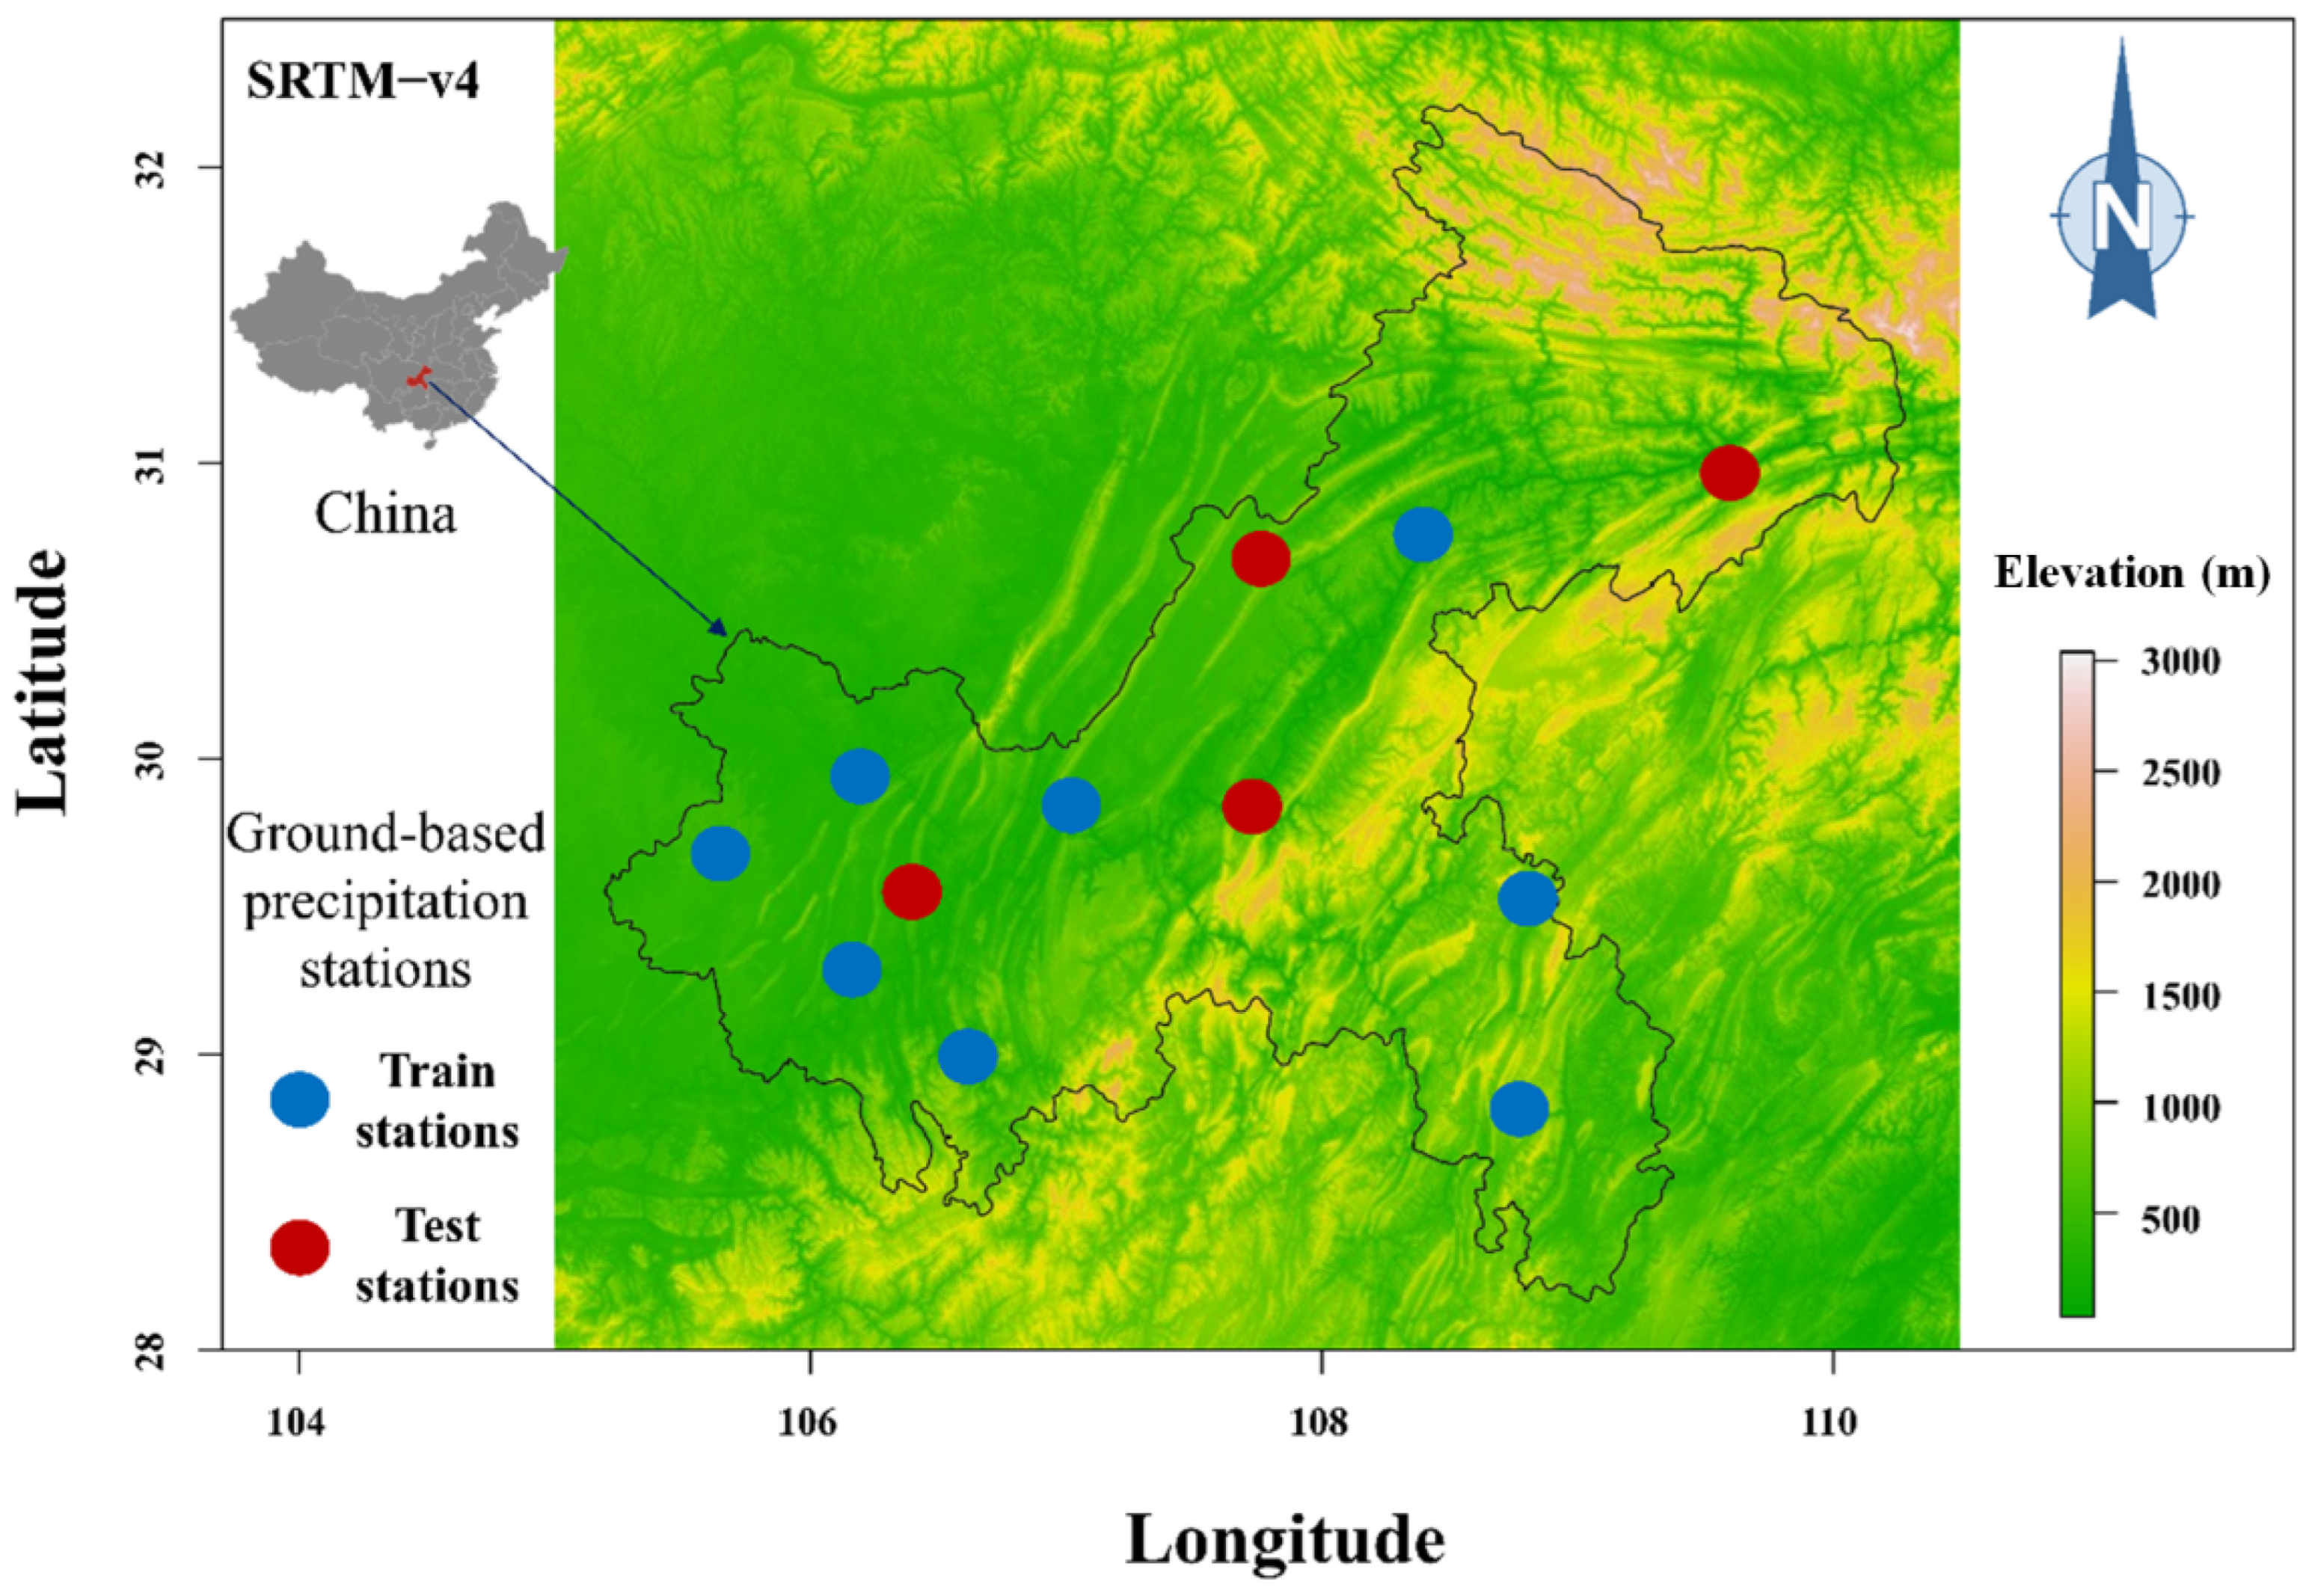
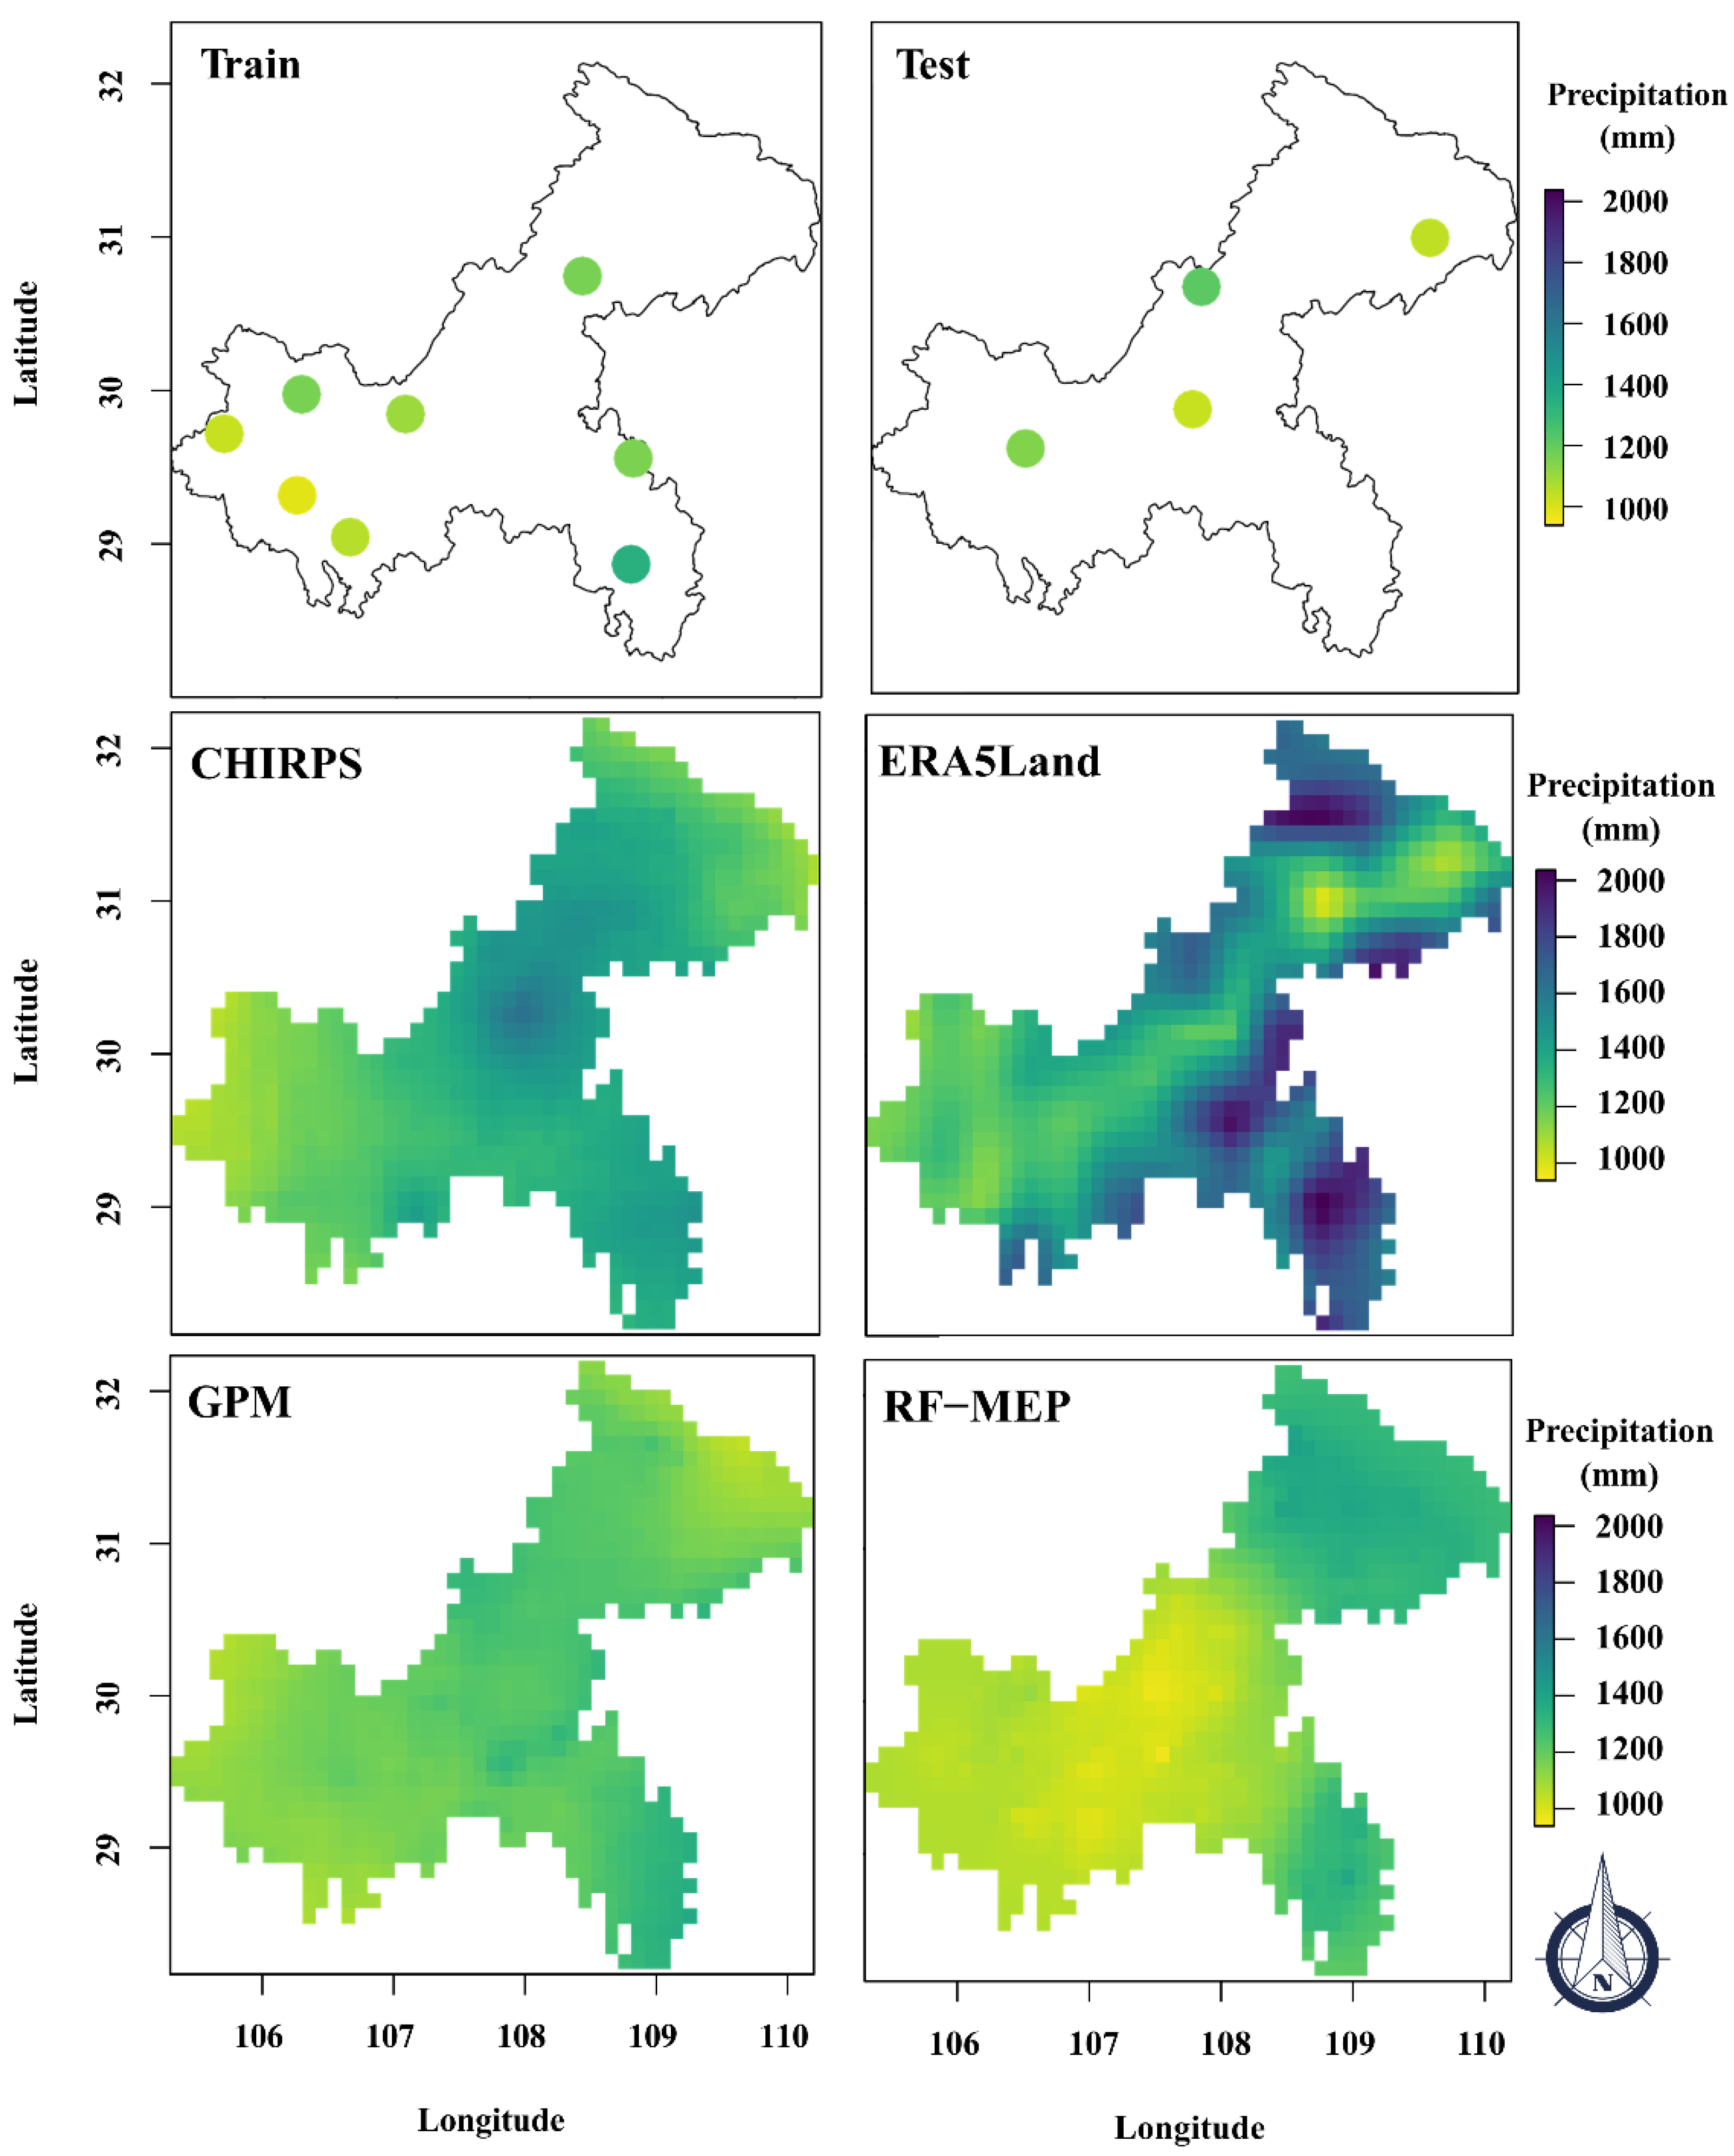
2.1. Study Area and Ground Precipitation Measurements

Figure 1 shows the location of Chongqing city in Southwest China and the used 12 ground precipitation station measurements. These meteorological stations are operated by the China Meteorological Administration (CMA, https://data.cma.cn (accessed on 20 July 2022)) and the quality of all precipitation measurements is strictly controlled by a series of criteria [14]. In this study, the ground precipitation measurements are used for merging precipitation data using the RF-MEP approach. The topography of the study area is displayed using the Shuttle Radar Topography Mission (SRTM) version 4.1. Chongqing covers an area of 312,812 km2, and its elevation ranges from 16 m to 2912 m. The annual rainfall varies between 755 mm to 1531 mm. The majority of rainfall occurs during the southwest monsoon season, which spans from June to September. Table 1 provides the geographical coordinates and elevation information for each of the 12 precipitation stations. With consideration of the spatial distribution of the available rain gauge stations, we strategically chose a subset of stations that represented a diverse range of elevations, land cover types, and topographic features within the study area. In order to provide sufficient input sample data to enable the machine learning algorithms to learn, all 17-year-long (2001–2017) time series of daily rainfall measurements from the eight stations (the training stations specified in Table 1) were used for training the RF-MEP model. Then the same 17-year-long (2001–2017) time series of daily rainfall measurements from the remaining independent four stations (the testing stations specified in Table 1) were used as the testing set to validate the performance of the RF-MEP model. The available data were partitioned into two sets: (i) the training set includes precipitation data from eight stations, namely, Wanzhou, Dazu, Hechuan, Jiangjin, Changshou, Qianjiang, Qijiang, and Youyang stations, and (ii) the testing set consists of precipitation data from the remaining four stations, Fengjie, Liangping, Shapingba, and Fengdu stations.

2.2. Satellite and Reanalysis Precipitation Products

(1)
CHIRPS
CHIRPS (Climate Hazards group InfraRed Precipitation with Station data) is a high-resolution global precipitation dataset that combines satellite data with ground-based observations to provide a comprehensive picture of precipitation patterns around the world. The dataset is produced by the Climate Hazards Group at the University of California, Santa Barbara. The CHIRPS employs a novel approach to integrate satellite-based precipitation estimates with in situ station data [11]. This results in a high-resolution global daily precipitation product with a spatial resolution of 0.05 degrees (approximately 5 km) for the quasi-global coverage of 50°N–50°S from 1981 to present. The CHIRPS product can be freely accessed from the Climate Hazards Group website (https://www.chc.ucsb.edu/data/chirps (accessed on 1 August 2022)).
(2)
ERA5-Land
ERA5-Land (Enhanced Global Dataset for the Land Component of the Fifth Generation of European ReAnalysis) is a global reanalysis dataset that provides a comprehensive view of the Earth’s atmosphere, land surface, and oceans. ERA5-Land includes a suite of variables, including precipitation, that can be used to study climate variability, weather patterns, and other environmental processes [17]. The precipitation data in ERA5-Land are based on a combination of satellite data, ground-based observations, and atmospheric models. The precipitation data in ERA5-Land are derived from a combination of satellite data, ground-based observations, and atmospheric models, providing hourly estimates of precipitation on a global 0.1° (approximately 10 km) grid from 1981 to the present. The dataset can be freely accessed from the ECMWF website (https://www.ecmwf.int/en/forecasts/datasets/reanalysis-datasets/era5-land (accessed on 1 August 2022)).
(3)
GPM IMERG
GPM (Global Precipitation Measurement) is a joint mission between NASA and the Japan Aerospace Exploration Agency (JAXA) to provide global measurements of precipitation from space. The GPM mission utilizes a constellation of satellites to provide high-resolution precipitation data. The Integrated Multi-SatellitE Retrievals for GPM (IMERG) precipitation product is a global precipitation estimation product. It combines data from multiple satellite sources and also ground precipitation measurements, to generate high-resolution precipitation estimates on a global scale [19,20]. The IMERG precipitation product provides global precipitation estimates on a 0.1° grid every 30 min from 2000 to the present. The IMERG product consists of three different versions: IMERG-Early, IMERG-Late, and IMERG-Final. The Final IMERG version represents the most refined and validated precipitation product within the IMERG framework. It incorporates the latest algorithms, calibration techniques, and data inputs, including ground-based precipitation observations, and thus this final version is recommended for research purposes. The final version was used in this study. The IMERGE precipitation product can be freely accessed from the NASA Goddard Earth Sciences Data and Information Services Center (https://disc.gsfc.nasa.gov/datasets/GPM_3IMERGM (accessed on 1 August 2022)). The product is simply referred to as GPM hereafter for conciseness.

2.3. The STRM DEM Data

The Digital Elevation Model (DEM) data from Shuttle Radar Topography Mission (SRTM) v4.1 at the spatial resolution of 90 m was used in this study. It is downloaded from https://cgiarcsi.community/data/srtm-90m-digital-elevation-database-v4-1/ (accessed on 1 August 2022). A more detailed description of the SRTM DEM data can be found in [21].

2.4. The RF-MEP Method

The RF-MEP is a random forest-based merging procedure that merges information from ground precipitation measurements, gridded precipitation products, and topography-related features to improve the representation of the spatiotemporal distribution of precipitation, especially in data-scarce regions [15]. The RF-MEP method relies on three fundamental assumptions. Firstly, it assumes that ground precipitation measurements from gauging stations are accurate at the point scale. Secondly, it acknowledges that all gridded precipitation products (e.g., satellite or reanalysis product), although prone to bias, still contain valuable information regarding the spatiotemporal patterns of precipitation. Lastly, it is assumed that combining multiple gridded precipitation products and ground measurements would yield a better representation of the spatiotemporal variability of precipitation than any individual product. To predict the spatial distribution of precipitation, the RF-MEP employs the random forest technique. This involves merging data from various gridded products (known as covariates) and ground measurements at the selected temporal scale (such as daily, monthly, or annual). By utilizing these covariates as predictors, individual predictions are generated through a user-defined number of decision trees, each based on bootstrap samples. The final prediction is derived by averaging the individual predictions [15,22,23]. This study used the latest version R package RFmerge to implement the RF-MEP method. This R package was developed by Baez-Villanueva et al. [15] and it is available at https://cran.r-project.org/src/contrib/Archive/RFmerge/ (accessed on 1 August 2022) [15]. The implementation of the RF-MEP method involves four main steps which are described in the following subsections.

2.4.1. Input Data to the RF-MEP Method

Firstly, the required input data to the RF-MEP method include: the ground precipitation measurements from stations (12 stations in this study; Section 2.1), the selected gridded precipitation products (three products, namely, CHIRPS, ERA5-Land, and IMERG in this study), the topography-related data, and the Euclidean distances from each precipitation gauging station to every grid cell in the study area. The used topography-related data are the SRTM DEM version 4 data that were used to account for the precipitation gradient related to elevation. The Euclidean distances from each rain gauge station to the centroid of all grid cells within the study area were also automatically calculated from the RFmerge package and they are used as input.

2.4.2. Data Processing

The used 12 precipitation stations were divided into 2 groups: a training set with 8 stations (approximately 70% of all stations) and a testing set with 4 stations (30%), which is detailed in Section 2.1. The training and testing set was used to train the RF-MEP method and independently assess the performance of the merged product, respectively. The study focuses on the 2001–2017 and daily scale for which ground measurements and selected gridded precipitation products are all available. All selected gridded precipitation products were harmonized to the same spatial (0.10°) and temporal (daily) scales. Specifically, ERA5-Land hourly data are summed up to obtain the daily precipitation. The CHIRPS daily precipitation at 0.05° resolution is aggregated to 0.10° by pixel averaging. The DEM data at 90 m resolution are also aggregated to 0.10° by pixel averaging.

2.4.3. Merging Procedure

One merged daily precipitation product was generated by merging all three gridded precipitation products, namely CHIRPS, ERA5-Land, and IMERG with other input data as detailed earlier in Section 2.4.1. First, the covariate values (e.g., three precipitation products and elevation) at the grid cell locations of the training set were obtained. Subsequently, the RF-MEP method was trained for each day, employing the ground precipitation measurements as the dependent variable and the corresponding covariate values as predictors. The trained RF model was then utilized, along with the gridded covariates, to predict the daily precipitation values for each grid cell within the study area. This procedure was repeated for each day spanning the period from 2001 to 2017. We used the default settings for the random forest model included in this R package RFmerge.

2.5. Two Other Merging Methods

In order to show good properties of the RF-MEP method and its superiority over other methods, we also applied two other merging methods to the same data and compared them with the RF-MEP method. The two other merging methods which were considered are the simple averaging (it is referred to as AVG method hereafter for conciseness) and the simple linear regression model (referred to as LR method hereafter). The AVG method is simple and does not need ground measurements from rain gauge stations. It works by simply calculating the mean value of precipitation estimates from the three input precipitation products for each day during the studied period. The calculated mean value was the final merged precipitation estimate. The LR method is also straightforward. It works by establishing a functional relationship (linear regression model in this study) between the rain gauge measurements (as the dependent variable) and the three input precipitation products (independent variable), and then applying the established regression model to three input precipitation products to generate the merged precipitation estimates. To enable the fair comparison with the RF-MEP, we used the same training and testing dataset to implement the LR method; that means all 17-year-long (2001–2017) time series of daily rainfall measurements from the eight stations were used for establishing the linear regression model. Then the same 17-year-long (2001–2017) time series of daily rainfall measurements from the remaining independent four stations were used as the testing set to validate the performance of the LR method.

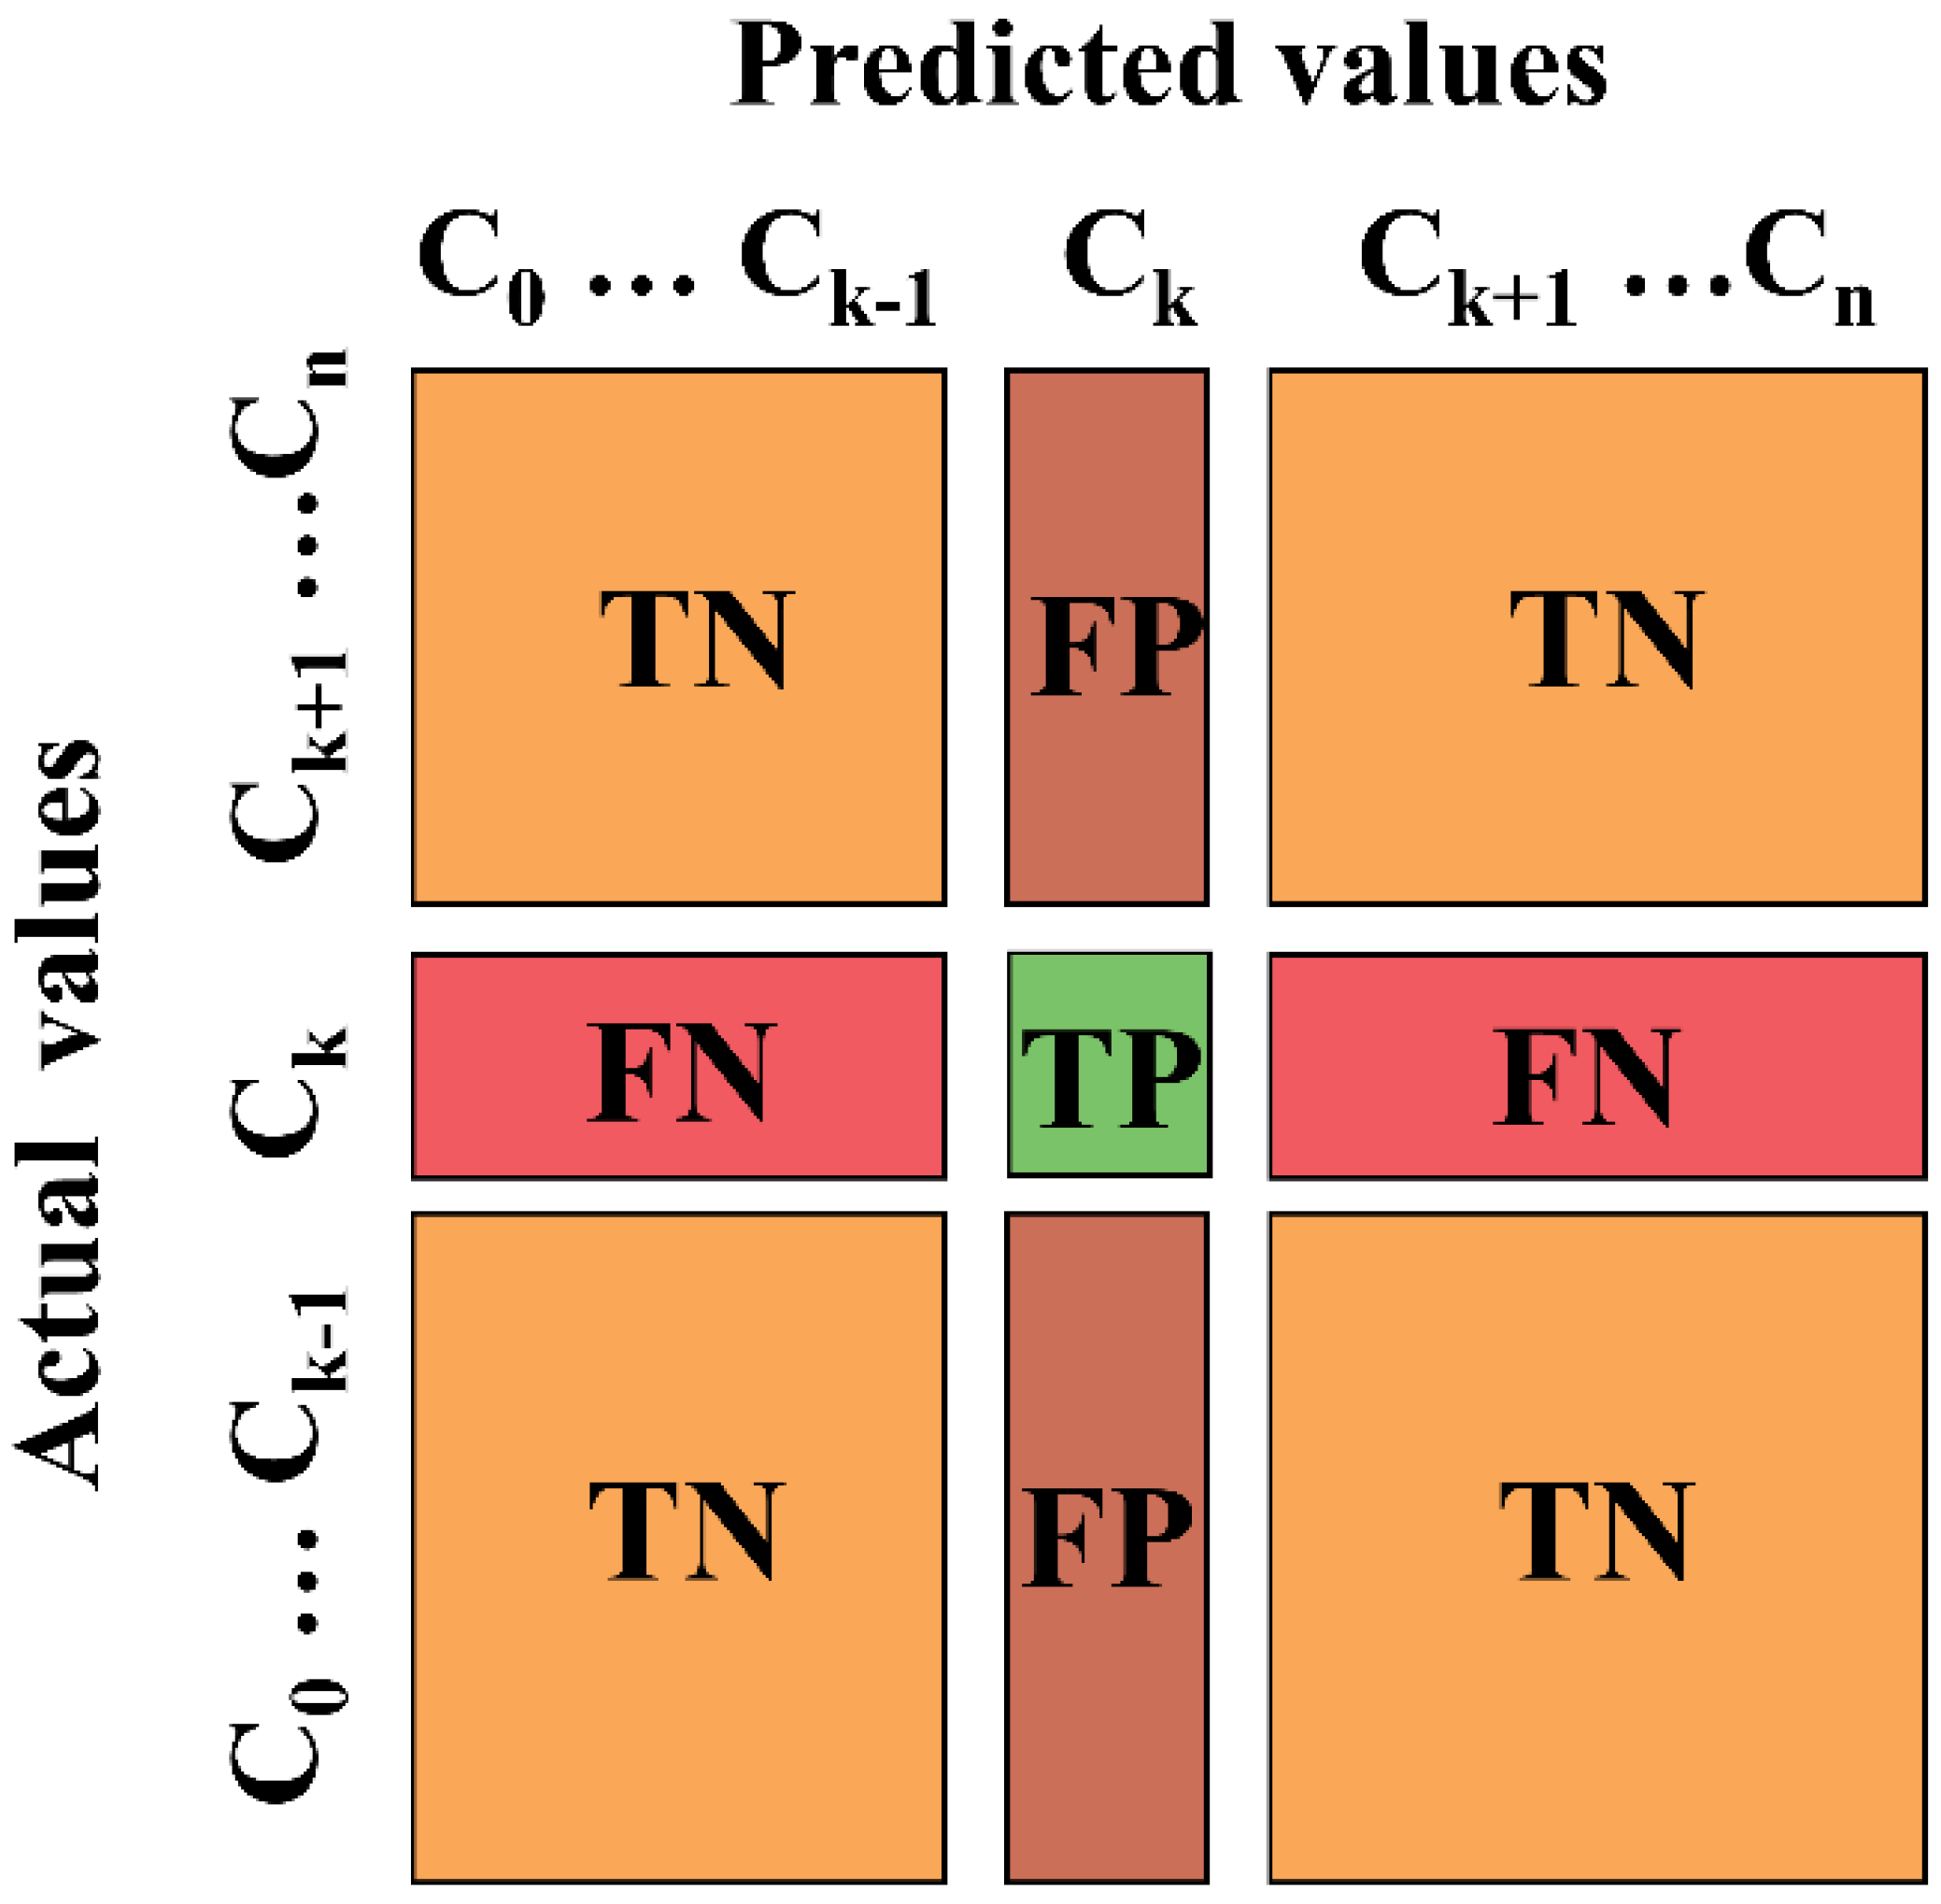
2.6. Evaluation of the Gridded Precipitation Product and the Merged Dataset

We evaluated the merged precipitation dataset from the three merging methods (RF-MEP, AVG, and LR) and the three input gridded precipitation products against the ground measurements. This evaluation was carried out using the four stations from the test set to ensure the strict independent assessment. The point-to-pixel analysis was used to compare the ground precipitation measurements from point-based stations and the pixel value from gridded precipitation products. This point-to-pixel analysis suffers from a typical scale mismatch issue (point vs. grid cell), which will introduce bias in evaluation. Despite that, this point-to-pixel analysis is still the most feasible and widely used method for the evaluation of gridded precipitation products [15,24]. Therefore, the study followed the common practice to use this point-to-pixel analysis. We performed the evaluation at the daily scale and considered different precipitation amount.
Five commonly used metrics were used for overall evaluation of daily precipitation estimates. They include Root Mean Square Error (RMSE), Kling–Gupta Efficiency (KGE), Coefficient of Determination (R2), Mean Absolute Error (MAE), and the ratio of RMSE to the standard deviation of the observations (RSR). Each of these metrics provides specific information regarding goodness-of-fit between observed and estimates from the precipitation products. For instance, RMSE provides an overall measure of the estimation accuracy, with lower values indicating better agreement between observed and estimates from precipitation products (Equation (1)). It is particularly useful for quantifying the magnitude of errors and assessing the general fit of the model. KGE is a comprehensive metric that evaluates three components of model performance: correlation, bias, and variability (Equation (2)). R2 represents the proportion of the total variance in the observed data that is explained by the model (Equation (3)). Higher R2 values indicate a better fitness between the observed and modeled precipitation datasets. MAE quantifies the absolute error between observed and simulated values (Equation (4)); and it is useful for assessing the general accuracy of the model predictions. RSR can be used for the comparison of model performance across different datasets and scales by considering the magnitude of the observed precipitation values (Equation (5)), and lower RSR values indicate better model performance.
Additionally, four categorical indices were used for evaluating the ability of different precipitation products to capture precipitation intensities, namely the probability of detection (POD), frequency bias (FBI), false alarm ratio (FAR), and critical success index (CSI) [1,25]. Daily precipitation is categorized into seven classes of intensities based on the World Meteorological Organization (WMO) standard: 0–1, 1–2, 2–5, 5–10, 10–20, 20–50, ≥50 (mm/day) [1]. The POD quantifies the ratio of the number of events correctly detected by the precipitation product to the total number of events identified by the rain gauge, and thus the optimal value would be 1. The FBI compares the number of events detected by the precipitation product to the number of events identified by the rain gauge. An FBI value greater than 1 indicates overestimation by the precipitation product, while a value less than 1 indicates underestimation.
The FAR calculates the percentage of occurrences that are not accurately detected by the precipitation product. It measures the ratio of false alarms (precipitation events detected by the product but not observed at the rain gauge) to the total number of events observed at the rain gauge, and thus 0 would be the optimal FAR value. The CSI combines the POD and FAR metrics to provide an overall assessment of the precipitation product’s capability to identify different precipitation intensities. The value of 1 would be the optimal value for CSI.
RMSE   = Σ OP     EP 2 / n
KGE = 1 ( r 1 2 + α 1 2 + β 1 2 )
R 2 = 1 Σ O P E P 2 / Σ O P m e a n   O P 2
MAE = Σ O P E P / n
RSR   = R M S E / S T D E V m
POD = T P T P + F N
FBI = T P + F P T P + F N
FAR = F P T P + F P
CSI =   T P T P + F P + F N
where OP, EP, and STDEVm indicate observed precipitation, estimated precipitation from the evaluated products or generated merged dataset, and standard deviation of observed precipitation, respectively. r refers to the Pearson correlation coefficient, α is the ratio of the standard deviation of reproduced precipitation values to the standard deviation of observed precipitation values, and β is the ratio of the mean reproduced value to the mean observed precipitation value. TP refers to an event which is recorded by both measured precipitation and precipitation product, FN indicates to an event which is recorded only by measured precipitation data, FP is an event which is recorded only by precipitation product. Figure 2 illustrates a confusion matrix regarding the calculation of POD, FBI, FAR, and CSI. In Figure 2, we examine the accuracy of estimation based on the following criteria. (i) True Positives (TP): when the ground measurements of precipitation occur in class X, and the estimated precipitation (from precipitation products or merged dataset) correctly classifies it as such; (ii) True Negatives (TN): when measured precipitation is absent in class X, and the estimated precipitation correctly identifies the absence; (iii) False Negatives (FN): when measured precipitation occurs in class X, but the estimated precipitation fails to categorize it correctly; (iv) False Positives (FP): when measured precipitation is not present in class X, but the estimated precipitation incorrectly assigns it to this class.

3. Results

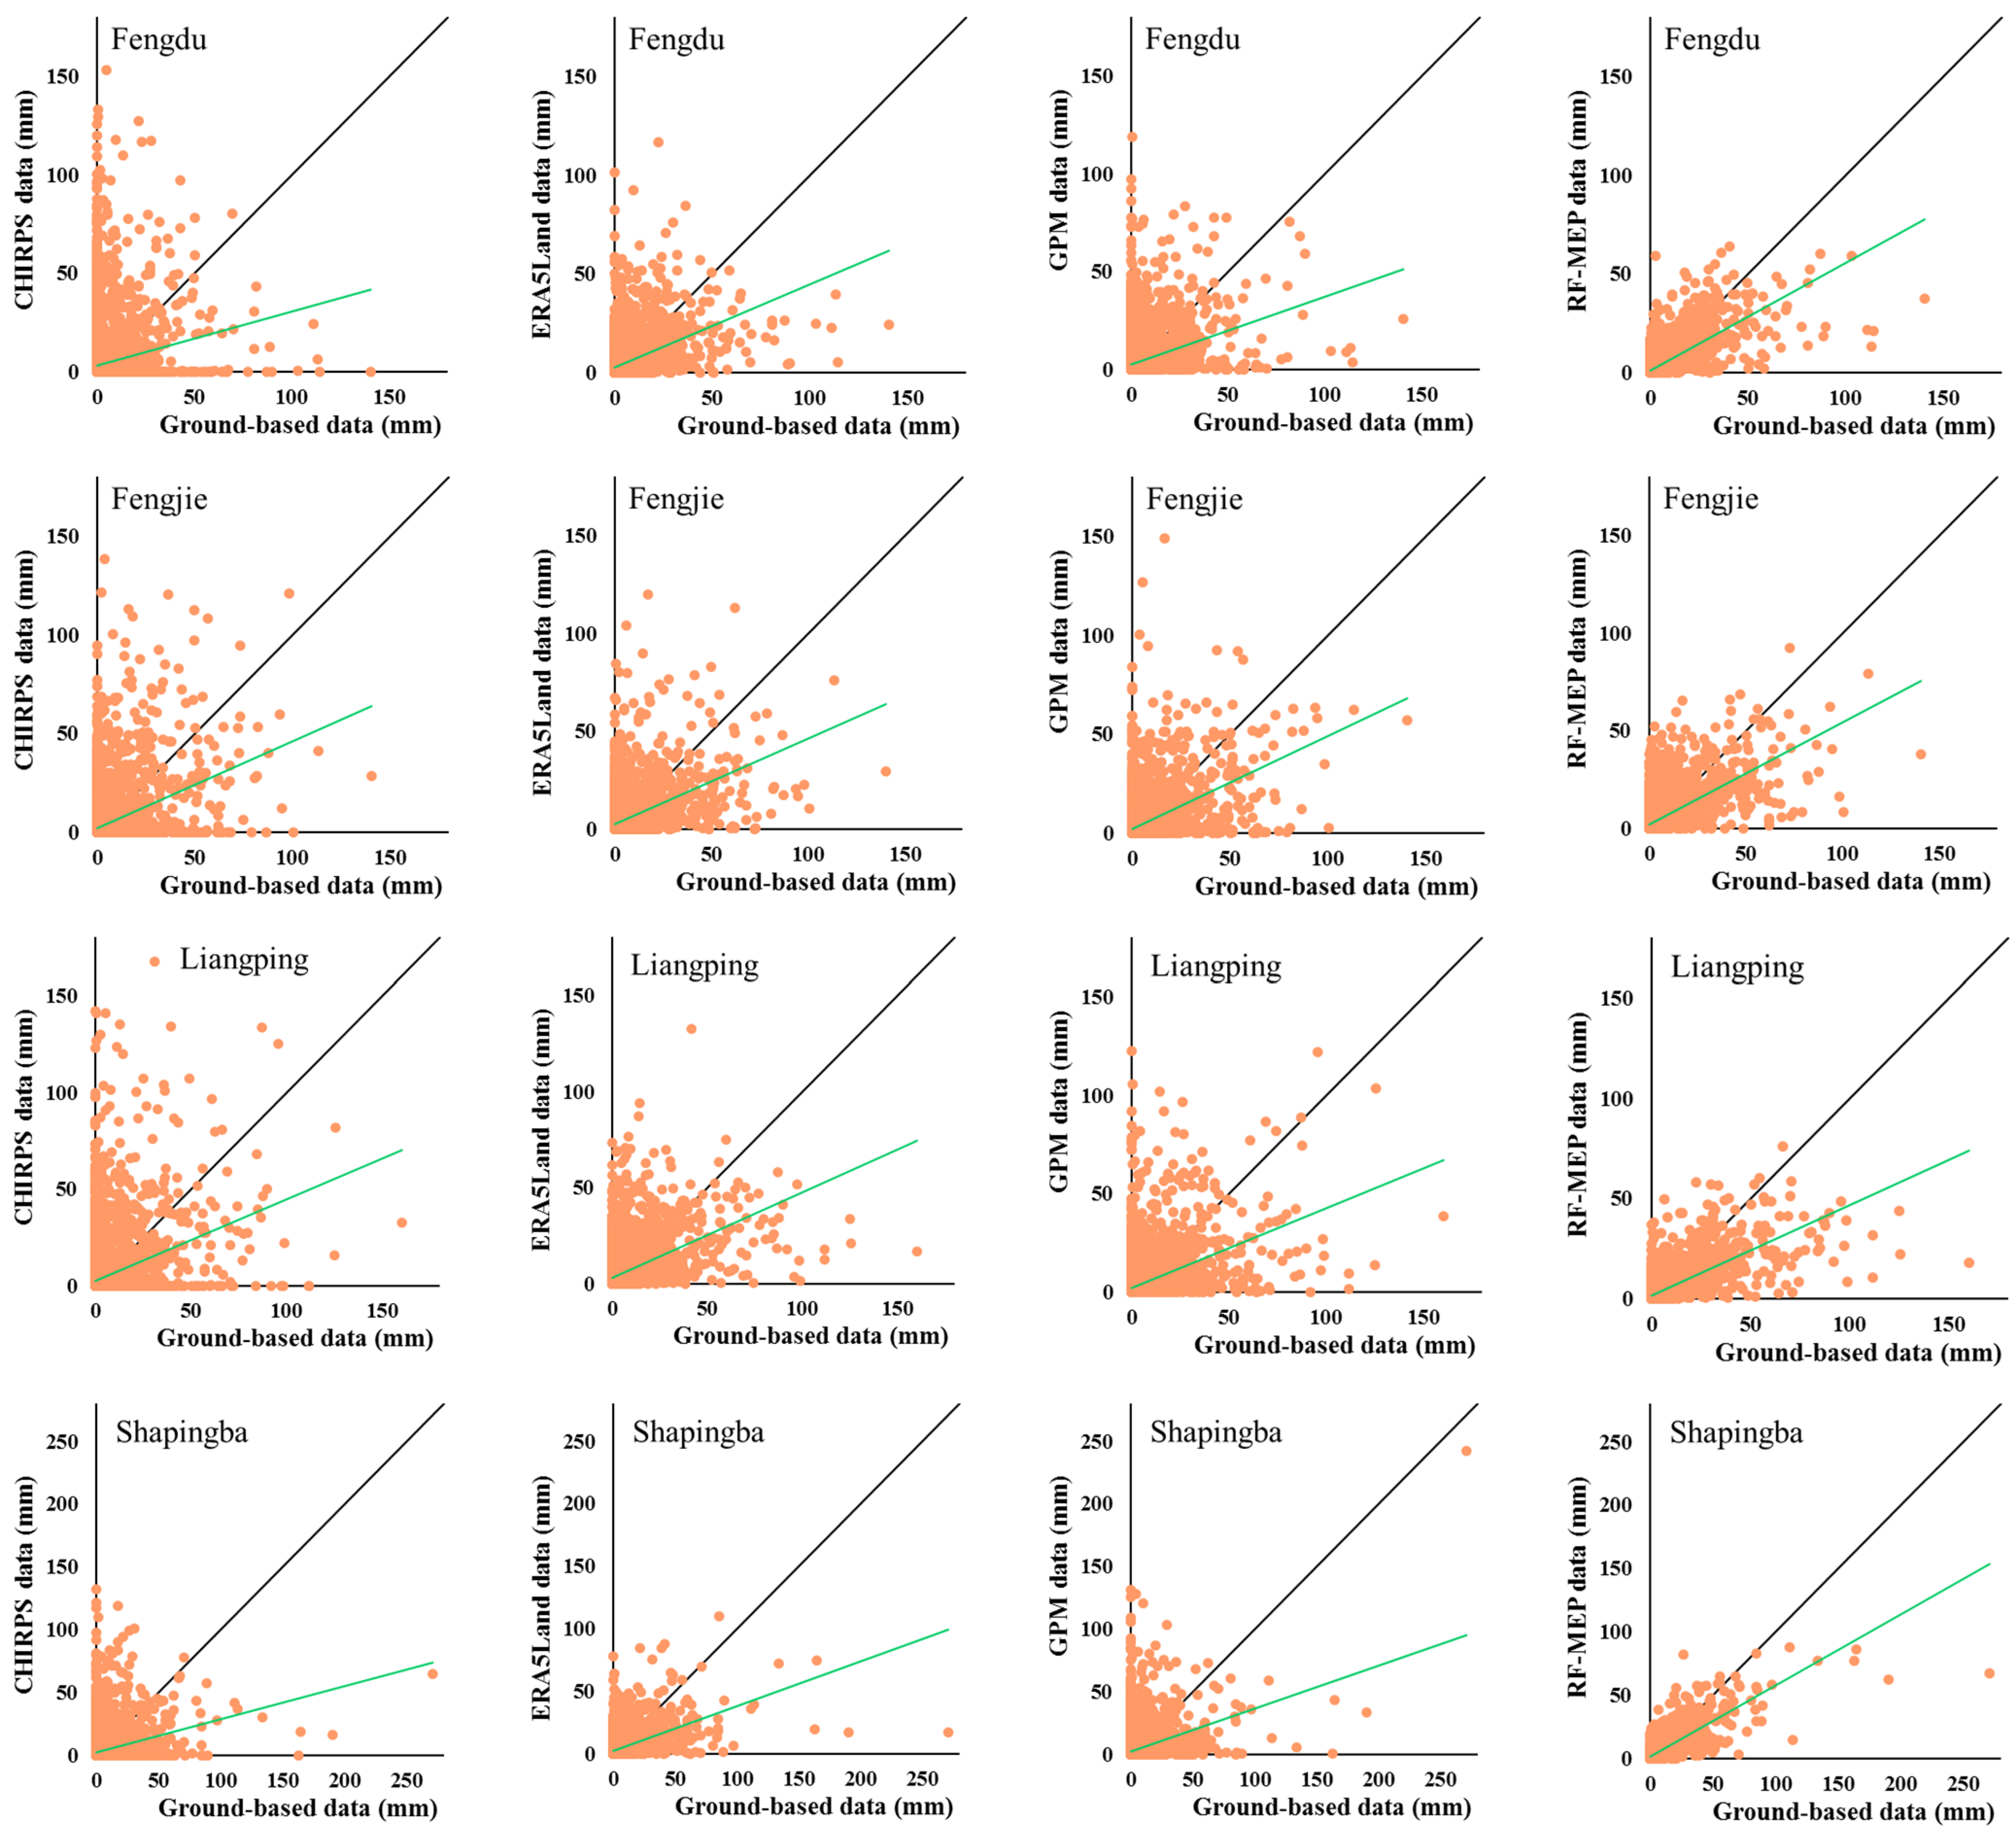
3.1. Overall Evaluation at the Daily Scale

Figure 3 shows the comparison of measured daily precipitation and the estimated precipitation from the existing satellite/reanalysis products (CHIRPS, ERA5-Land, and GPM) and the RF-MEP merged dataset for the four stations that are from the test set during the entire 2001–2017 period. Large scatters and differences from the 1:1 line in Figure 3 show the relatively poor agreements between the measured precipitation and estimated precipitation from all sources for the daily precipitation. The scatterplots clearly illustrate that the main inaccuracies observed in the study were characterized by underestimations for events characterized by high precipitation, and overestimations for events with low or no precipitation. The estimated precipitation from the RF-MEP merged dataset show consistently better agreement with the measured precipitation than the three existing gridded products for all four independent test stations, indicating the effectiveness of the RF-MEP method in this study area.
Table 2 summarizes the evaluation metrics of the estimated daily precipitation from existing products and the RF-MEP merged precipitation dataset against the measured precipitation and compared these with the merged precipitation estimates by the linear regression (LR) and the simple averaging method (AVG) of the three input gridded precipitation products for each of the four independent test stations. It is clear to see that the RF-MEP merged precipitation dataset is considerably better than all three input gridded precipitation products (CHIRPS, ERA5-Land, and GPM) and also the two other merging methods (LR and AVG) in terms of small values of error metrics (RMSE, MAE, and RSR) and higher values of R2 and KGE. Among the three existing products, the CHIRPS product shows the worst performance for all the test stations with the highest error metrics and lowest values of R2 (0.03 to 0.14) and KGE (−0.02 to 0.32). The ERA5-Land shows the best performance with RMSE ranging from 8.57 to 9.74 mm/day and MAE 3.29–4.15 mm/day, R2 0.20–0.25, and KGE 0.32–0.42. The RF-MEP merged precipitation dataset shows much better evaluation metrics with RMSE 5.56–7.11 mm/day, MAE 1.67–2.85 mm/day, R2 0.41–0.66, and KGE 0.51–0.62. The remarkable improvements in the evaluation metrics confirm the effectiveness of the RF-MEP method in improving daily precipitation estimates, and even using measurements from a very limited number of stations (eight stations in this study).

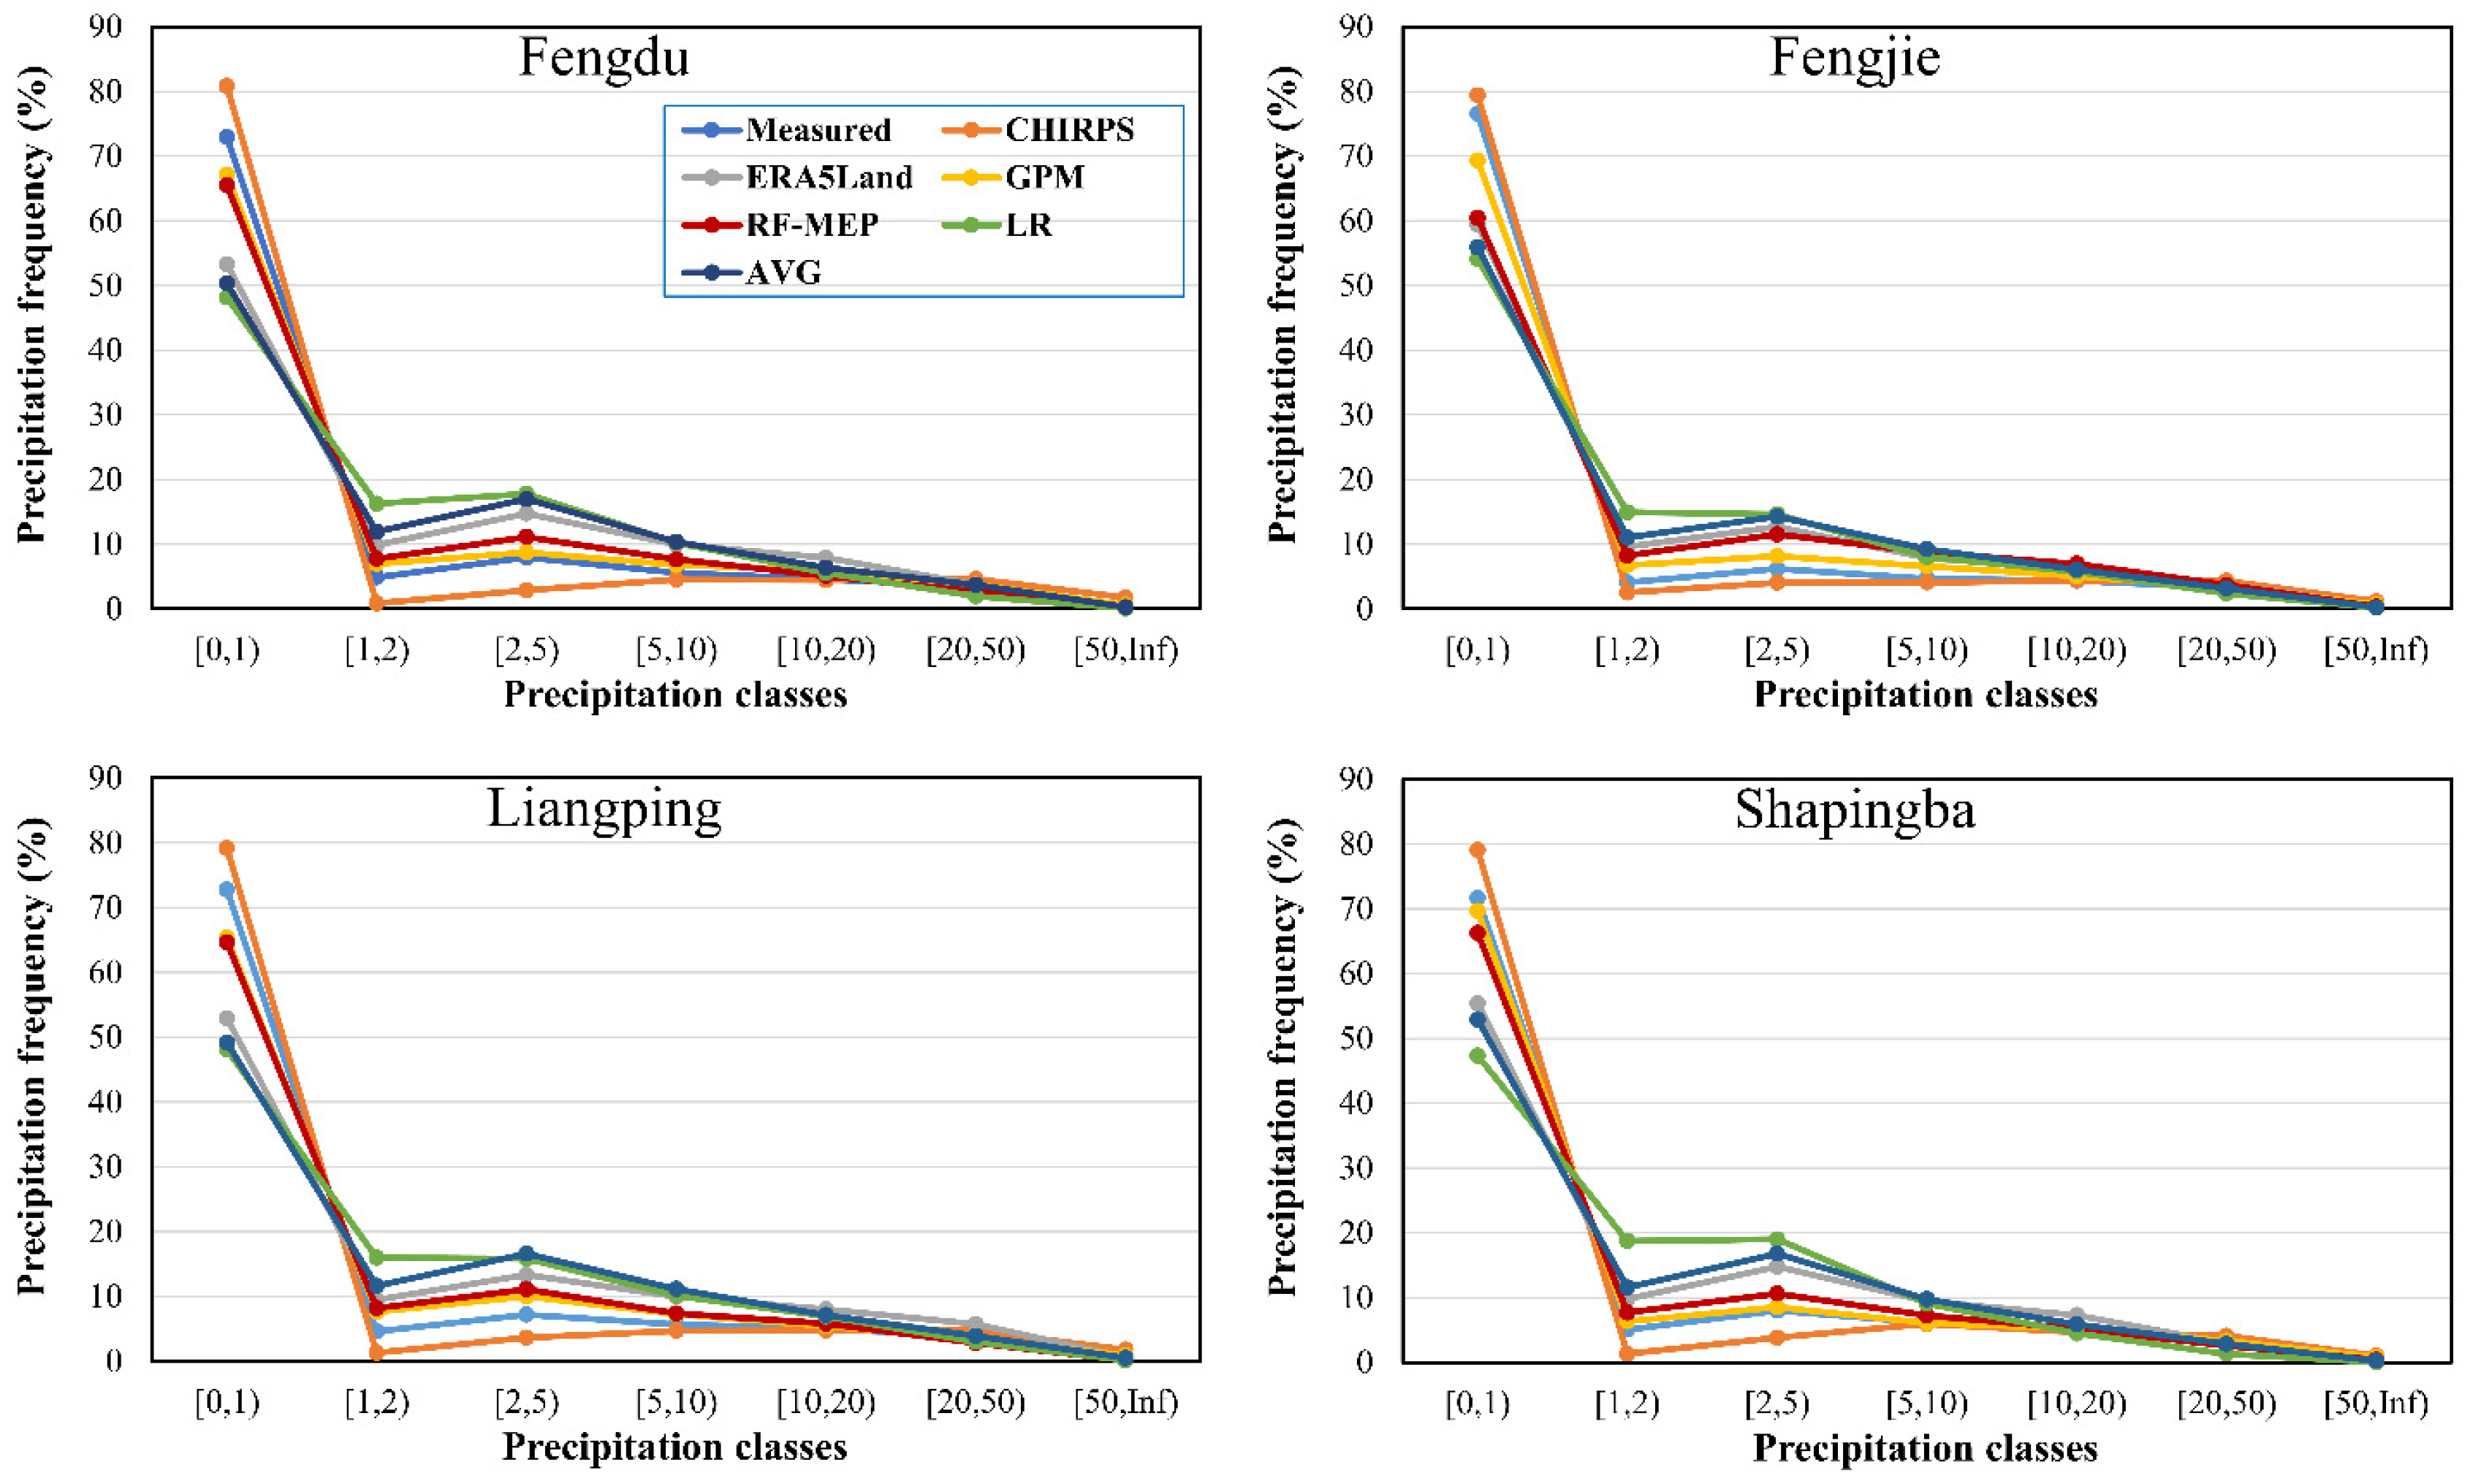
3.2. Evaluation of Different Precipitation Intensities

Figure 4 shows the occurrence frequency of daily precipitation with seven different intensity ranges for the three existing gridded precipitation products (CHIRPS, ERA5-Land, and GPM), the merged precipitation estimates from the three methods (RF-MEP, LR, and AVG), and ground measurements at each of the four test stations (Fengdu, Fengjie, Liangping, and Shapingba). All four test stations show that more than 70% of daily precipitation from the ground measurements fall in the intensity of 0–1 mm/day. For this intensity range, CHIRPS shows consistent overestimation (close to 80%), while all other products and the merged precipitation datasets from three methods (RF-MEP, LR, and AVG) show consistent underestimation (all lower than 70%). CHIRPS shows large underestimation for the intensity ranges (1–5 mm/day), while the opposite is found for the ERA5-Land.
Table 3 presents the evaluation metrics for all the evaluated precipitation products/datasets in terms of the seven classes of daily precipitation intensity at the Fengdu station. The evaluation metrics are similar for the other three of the four test stations; thus, they are not shown and only Table 3 is discussed here for conciseness. All three existing products obtain a very high POD value for the precipitation with intensity <1 mm/day; CHIRPS obtains the highest POD of 0.85, followed by GPM with a POD of 0.77 and ERA5-Land with POD of 0.68. The RF-MEP merged dataset has an even higher POD of 0.86. This means that all existing products and the merged dataset can capture the light precipitation events very well with <1 mm/day. However, the ability in capturing the precipitation events beyond 1 mm/day is considerably lower, particularly the worst performance for the extreme heavy precipitation event with an intensity >50 mm/day. The POD values range from 0.03 to 0.20 for CHIRPS, 0.03–0.30 for ERA5-Land, 0.09–0.22 for GPM, and 0.09–0.44 for the RF-MEP merged dataset. Except for the precipitation intensity of >50 mm/day, the RF-MEP merged dataset displays a considerably higher POD than all three original gridded products. Overall, similar patterns can be observed for the FBI, FAR, and CSI values, showing the best performance of the RF-MEP merged dataset. When comparing the three merging methods, the RF-MEP clearly showed better performance than the LR and AVG method, with better evaluation metrics for all precipitation classes (Table 3). Therefore, only the RF-MEP merged precipitation estimates were used for further analysis hereafter.

3.3. Spatial Distribution of Annual Precipitation

Figure 5 presents the average annual precipitation of ground measurements from the 12 stations (8 for training and 4 for testing), the three existing gridded precipitation products (CHIRPS, ERA5-Land, and GPM) and the RF-MEP merged dataset in Chongqing during 2001–2017. The annual precipitation from the stations exhibits the highest values in the southern region and the northern part of the western region of the basin. The precipitation gradually increases from north to south, ranging from 755 to 1531 mm. The minimum annual precipitation values are 1056.1, 988.4, 1024.9, and 965.4 mm for the CHIRPS, ERA5-Land, GPM, and RF-MEP approach, respectively. On the other hand, the maximum annual precipitation values are 1629.5, 2036.5, 1372.1, and 1414.6 mm for the CHIRPS, ERA5-Land, GPM, and RF-MEP approach, respectively. Large differences can be found in the spatial pattern of precipitation obtained from the three existing precipitation products and the RF-MEP merged dataset. This discrepancy suggests large uncertainties of these products/dataset in representing the large-scale characteristics of the annual precipitation distribution. All three existing precipitation products seem to overestimate the annual precipitation. The GPM product exhibits a slight overestimation, while CHIRPS and ERA5-Land products demonstrate a larger overestimation compared to the measurements at the rain gauge stations. In contrast, the RF-MEP precipitation dataset is performing much better in capturing both the magnitude and spatial distribution of annual precipitation. The large overestimation associated with the three existing products is effectively reduced by the RF-MEP method, leading to better performance of the merged precipitation dataset.

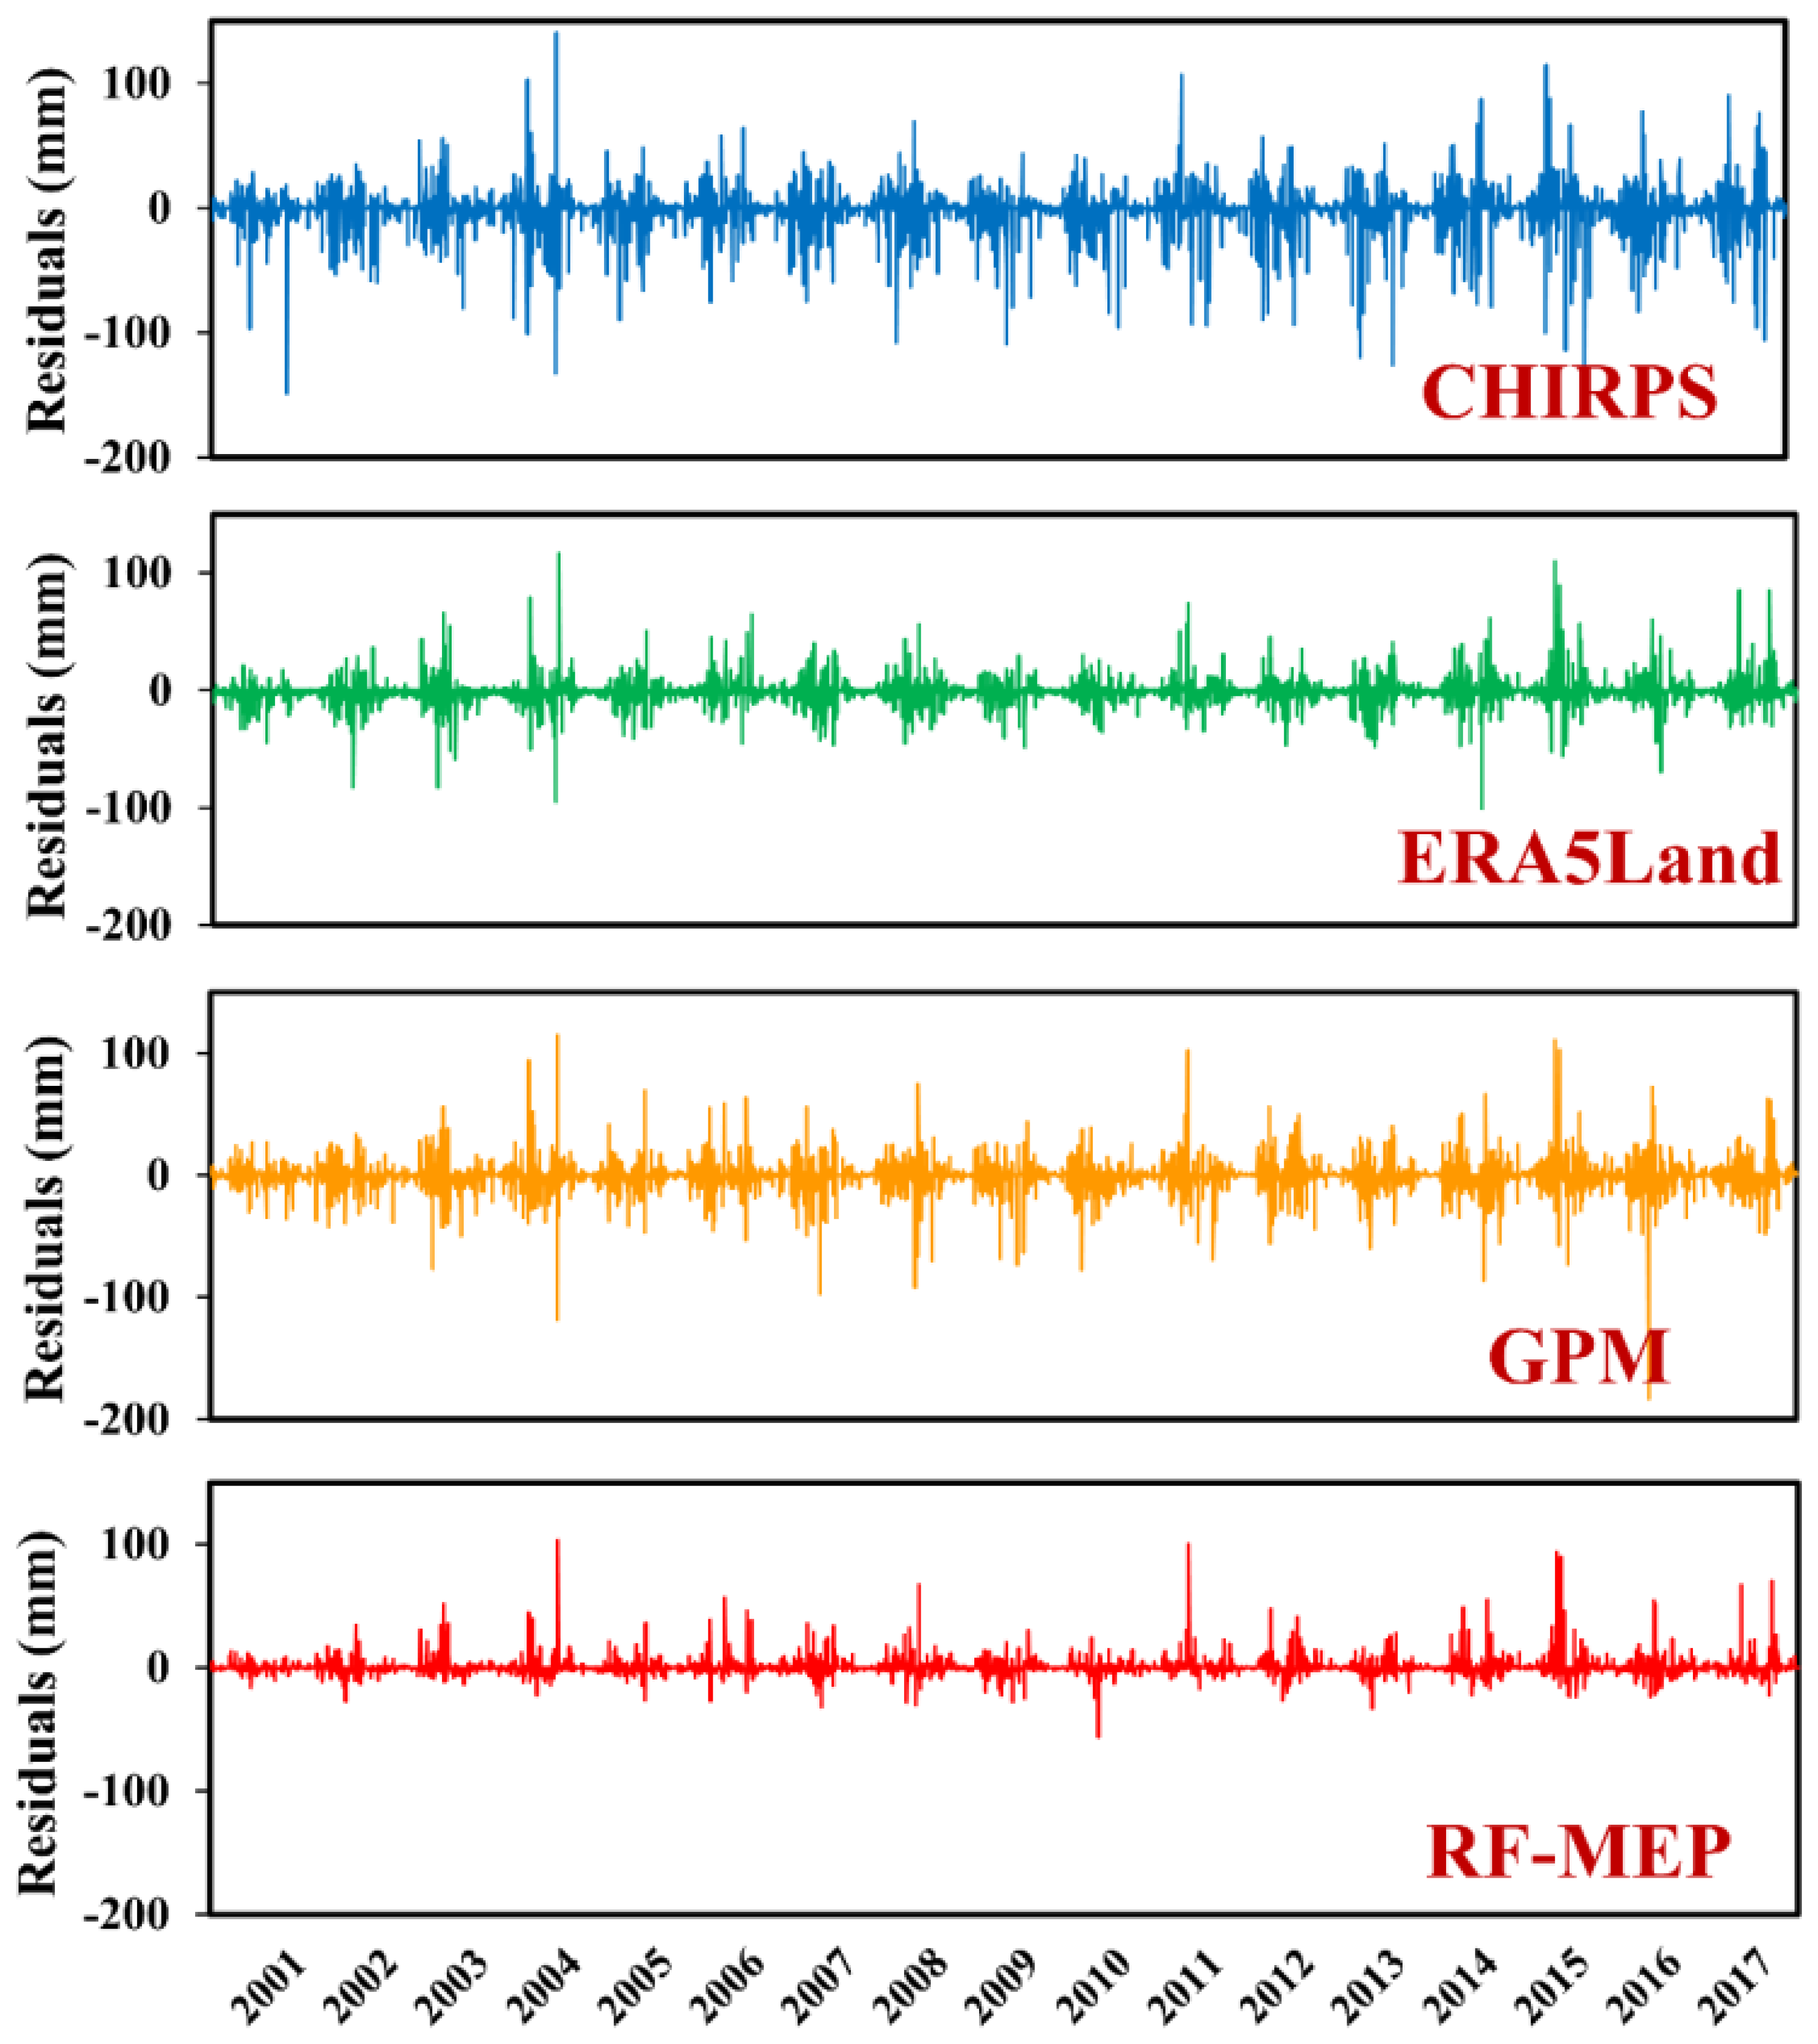
3.4. Comparison of the Bias in the Daily Precipitation Time Series

To assess the bias and variation in the merged precipitation data, time series residual plots for the independent four test stations during the period of 2001–2017 were generated (Figure 6). The residual errors here means the bias, which is the difference between the estimated precipitation of the evaluated product/dataset and the measurements at the rain gauge stations. Four stations show very similar patterns, and to keep concise, only the results at the Fengdu station are shown in this paper. The range of residuals slightly varies for each station, with the Fengdu station ranging from −200 to 150 mm/day, the Fengjie station ranging from −220 to 100 mm/day, the Liangping station ranging from −220 to 100 mm/day, and the Shapingba station ranging from −150 to 250 mm/day. Figure 6 provides a visual representation of the residual errors at the Fengdu station. It is evident that the existing precipitation products exhibit higher variance compared to the RF-MEP merged precipitation dataset. Specifically, the CHIRPS product displays larger errors (ranging from −150 to 150 mm/day) while the ERA5-Land and GPM show relatively lower errors. Notably, the RF-MEP merged precipitation consistently exhibits the lowest error ranging from −50 to 100 mm/day (most within 50 mm/day). These results further prove that the RF-MEP approach performs very well in improving daily precipitation estimates compared to each of the input precipitation products.

4. Discussion

The analysis revealed that existing gridded precipitation products, such as CHIRPS, ERA5-Land, and GPM, exhibited relatively poor agreement with measured precipitation for daily events. These findings align with previous studies that have highlighted the general low accuracy of gridded precipitation products at the daily scale [1,26]. The discrepancies observed in this study, characterized by underestimations for high precipitation events and overestimations for events with low or no precipitation, further underscore the limitations of these products. The scatterplots clearly illustrate the main inaccuracies observed in the study, characterized by underestimations for high precipitation events and overestimations for events with low or no precipitation. However, the RF-MEP merged dataset consistently showed better agreement with the measured precipitation compared to the three existing gridded products for all four independent test stations, indicating the effectiveness of the RF-MEP method in the study area. The evaluation metrics further supported this conclusion, with the RF-MEP merged precipitation dataset outperforming the individual gridded products in terms of statistical metrics (RMSE, MAE, RSR, R2, and KGE). When comparing the three merging methods, the RF-MEP clearly showed better performance than the LR and AVG method, with better evaluation metrics for overall assessment (Table 2) and all precipitation classes (Table 3).
The analysis of precipitation occurrence frequency revealed that all products and the RF-MEP merged dataset performed well in capturing light precipitation events with intensity less than 1 mm/day, which accounted for the majority of occurrences. However, there were limitations in capturing precipitation events beyond 1 mm/day, particularly for extreme heavy precipitation events exceeding 50 mm/day. This finding is consistent with previous studies that have reported challenges in accurately estimating precipitation at higher intensities [1,27]. CHIRPS shows large underestimation for the intensity ranges (1–5 mm/day), while the opposite is found for the ERA5-Land. The performance of the CHIRPS product in different precipitation intensities ranges is consistent with other studies, e.g., Duan et al. (2016) who found similar pattern in Adige Basin in Italy [1]. As previous studies state, the differences in precipitation occurrence frequency observed among the evaluated products would result in substantial differences in hydrological modeling as well as sediment and pollutant transport modeling due to the nonlinear nature of the processes involved [1,27]. While the RF-MEP approach significantly improved the detection ability for all precipitation intensities except the most extreme intensity (>50 mm/day), further research is needed to address this limitation and improve the accuracy of precipitation estimates, especially for extreme events. It is interesting to apply the RF-MEP approach to individual precipitation intensities in future studies to investigate if the merged precipitation products could achieve better accuracy.
The spatial pattern analysis of precipitation estimates and the temporal analysis of bias further supported the superior performance of the RF-MEP merged precipitation dataset compared to the three existing products. The RF-MEP method effectively reduced the large overestimation associated with the existing products, resulting in a better representation of the magnitude and spatial distribution of annual precipitation. These findings are consistent with the studies [1,27], which also reported discrepancies in precipitation occurrence frequency and highlighted the implications for hydrological and transport modeling. In addition, the findings highlight the applicability and effectiveness of the RF-MEP method in merging multiple gridded precipitation products and limited rain gauge station measurements to enhance the accuracy of daily precipitation estimates. The study contributes to the understanding of precipitation estimation in complex terrain and data-sparse regions. However, it also underscores the need for further research to improve the accuracy of precipitation estimates, particularly for higher-intensity events, such as extreme precipitation events. Future studies could focus on enhancing the RF-MEP method and exploring additional approaches to address the challenges in accurately capturing extreme precipitation events. Furthermore, expanding the evaluation to other regions with different climatic and topographic conditions would provide a broader perspective on the performance of the RF-MEP method and its applicability in various settings.
The assessment of residuals, reflecting the differences between the merged precipitation estimates and the ground measurements from rain gauge stations, provides insights into the accuracy and potential limitations of the RF-MEP method. These substantial errors in the residuals can be attributed to a combination of factors, including the complex topography of the Chongqing region, the relatively sparse distribution of rain gauge stations, and the inherent challenges in accurately capturing extreme precipitation events. While the RF-MEP method demonstrated effectiveness in improving the overall accuracy of the precipitation estimates, it might encounter difficulties in accurately estimating precipitation during severe events (with high precipitation amounts) or in regions with steep terrain gradients. The variations in residuals underscore the importance of cautious interpretation of the merged precipitation estimates, particularly in areas where errors are larger. These findings highlight potential areas for further methodological improvements, such as exploring the incorporation of additional covariates or the development of localized correction techniques to address the challenges posed by extreme conditions.

5. Conclusions

This study aimed to evaluate the performance of the recently developed random forest-based merging procedure (RF-MEP) method in improving the accuracy of daily precipitation estimates, particularly in data-sparse regions, by merging three existing gridded precipitation products with ground measurements from limited available rain gauge stations. Chongqing city in China, with complex terrain, served as the case study. Daily precipitation estimates from three widely used gridded precipitation products, namely CHIRPS, ERA5-Land, and GPM, were merged to obtain the RF-MEP merged precipitation dataset. Eight stations (approximately 70%) were utilized for training the RF-MEP approach, while four stations (30%) were used for independent testing purposes. Multiple statistical metrics were employed to assess the performance of the merged precipitation dataset and the three existing precipitation products against ground measurements. Our evaluation results showed that the RF-MEP approach significantly improved the accuracy of daily precipitation estimates, with better performance than each of the three original gridded precipitation products and also the two other merging methods (the simple linear regression and simple averaging). Among the three existing precipitation products, overall, the ERA5-Land showed the best performance in capturing daily precipitation followed by GPM, while the CHIRPS showed the worst performance. When the performance of the precipitation products in capturing precipitation at different intensities is concerned, all three existing products and the RF-MEP merged dataset can capture the light precipitation events very well with <1 mm/day (this precipitation intensity occurred the most frequent, accounting for more than 70%). However, all datasets showed poor ability in capturing the precipitation events beyond 1 mm/day, and particularly, the worst performance was observed for the extreme heavy precipitation event with intensity >50 mm/day. The RF-MEP approach considerably improved the detection ability in capturing all precipitation intensities except only a small improvement was observed for the most extreme intensity (>50 mm/day). Analysis of the spatial pattern of precipitation estimates also showed the better performance of the merged precipitation dataset than the three existing precipitation products. The same is true for the temporal analysis of the bias of daily precipitation estimates. In sum, this study demonstrated the applicability and effectiveness of the RF-MEP method in generating the merged precipitation dataset with improved accuracy by combining existing gridded precipitation products and measurements from limited available rain gauge stations. Future studies are advised to focus on improving the accuracy of precipitation estimates at higher intensities, particularly the extreme events.

Author Contributions

Conceptualization Y.S., J.C., B.M. and Z.D.; methodology: Y.S., C.C., J.C., B.M., M.C. and Z.D.; software: B.M., M.C. and M.A.; formal analysis: Y.S., C.C., B.M. and Z.D.; data curation, H.L.; writing—original draft: Y.S., J.C., B.M., M.A., O.M.K. and Z.D., writing—review and editing: all authors. All authors have read and agreed to the published version of the manuscript.

Funding

This work is supported by the National Natural Science Foundation of China (41901129).

Data Availability Statement

Not applicable.

Conflicts of Interest

The authors declare no conflict of interest.

References

  1. Duan, Z.; Liu, J.; Tuo, Y.; Chiogna, G.; Disse, M. Evaluation of eight high spatial resolution gridded precipitation products in Adige Basin (Italy) at multiple temporal and spatial scales. Sci. Total Environ. 2016, 573, 1536–1553. [Google Scholar] [CrossRef]
  2. Moges, D.M.; Kmoch, A.; Uuemaa, E. Application of satellite and reanalysis precipitation products for hydrological modeling in the data-scarce Porijogi catchment, Estonia. J. Hydrol. Reg. Stud. 2022, 41, 101070. [Google Scholar] [CrossRef]
  3. Zambrano-Bigiarini, M.; Nauditt, A.; Birkel, C.; Verbist, K.; Ribbe, L. Temporal and spatial evaluation of satellite-based rainfall estimates across the complex topographical and climatic gradients of Chile. Hydrol. Earth Syst. Sci. 2017, 21, 1295–1320. [Google Scholar] [CrossRef]
  4. Woldemeskel, F.M.; Sivakumar, B.; Sharma, A. Merging gauge and satellite rainfall with specification of associated uncertainty across Australia. J. Hydrol. 2013, 499, 167–176. [Google Scholar] [CrossRef]
  5. Baez-Villanueva, O.M.; Zambrano-Bigiarini, M.; Ribbe, L.; Nauditt, A.; Giraldo-Osorio, J.D.; Thinh, N.X. Temporal and spatial evaluation of satellite rainfall estimates over different regions in Latin-America. Atmos. Res. 2018, 213, 34–50. [Google Scholar] [CrossRef]
  6. Sun, Q.; Miao, C.; Duan, Q.; Ashouri, H.; Sorooshian, S.; Hsu, K.L. A review of global precipitation data sets: Data sources, estimation, and intercomparisons. Rev. Geophys. 2018, 56, 79–107. [Google Scholar] [CrossRef]
  7. Pradhan, R.K.; Markonis, Y.; Godoy, M.R.V.; Villalba-Pradas, A.; Andreadis, K.M.; Nikolopoulos, E.I.; Papalexiou, S.M.; Rahim, A.; Tapiador, F.J.; Hanel, M. Review of GPM IMERG performance: A global perspective. Remote Sens. Environ. 2022, 268, 112754. [Google Scholar] [CrossRef]
  8. Sorooshian, S.; Hsu, K.L.; Gao, X.; Gupta, H.V.; Imam, B.; Braithwaite, D. Evaluation of PERSIANN system satellite-based estimates of tropical rainfall. Bull. Am. Meteorol. Soc. 2000, 81, 2035–2046. [Google Scholar] [CrossRef]
  9. Huffman, G.J.; Bolvin, D.T.; Nelkin, E.J.; Wolff, D.B.; Adler, R.F.; Gu, G.; Hong, Y.; Bowman, K.P.; Stocker, E.F. The TRMM multisatellite precipitation analysis (TMPA): Quasi-global, multiyear, combined-sensor precipitation estimates at fine scales. J. Hydrometeorol. 2007, 8, 38–55. [Google Scholar] [CrossRef]
  10. Joyce, R.J.; Janowiak, J.E.; Arkin, P.A.; Xie, P. CMORPH: A method that produces global precipitation estimates from passive microwave and infrared data at high spatial and temporal resolution. J. Hydrometeorol. 2004, 5, 487–503. [Google Scholar] [CrossRef]
  11. Funk, C.; Peterson, P.; Landsfeld, M.; Pedreros, D.; Verdin, J.; Shukla, S.; Husak, G.; Rowland, J.; Harrison, L.; Hoell, A.; et al. The climate hazards infrared precipitation with stations—A new environmental record for monitoring extremes. Sci. Data 2015, 2, 150066. [Google Scholar] [CrossRef] [PubMed]
  12. Dinku, T.; Ruiz, F.; Connor, S.J.; Ceccato, P. Validation and intercomparison of satellite rainfall estimates over Colombia. J. Appl. Meteorol. Clim. 2010, 49, 1004–1014. [Google Scholar] [CrossRef]
  13. Chen, C.; He, M.; Chen, Q.; Zhang, J.; Li, Z.; Wang, Z.; Duan, Z. Triple collocation-based error estimation and data fusion of global gridded precipitation products over the Yangtze River basin. J. Hydrol. 2022, 605, 127307. [Google Scholar] [CrossRef]
  14. Wei, L.; Jiang, S.; Dong, J.; Ren, L.; Liu, Y.; Zhang, L.; Wang, M.; Duan, Z. Fusion of gauge-based, reanalysis, and satellite precipitation products using Bayesian model averaging approach: Determination of the influence of different input sources. J. Hydrol. 2023, 618, 129234. [Google Scholar] [CrossRef]
  15. Baez-Villanueva, O.M.; Zambrano-Bigiarini, M.; Beck, H.E.; McNamara, I.; Ribbe, L.; Nauditt, A.; Birkel, C.; Verbist, K.; Giraldo-Osorio, J.D.; Thinh, N.X. RF-MEP: A novel Random Forest method for merging gridded precipitation products and ground-based measurements. Remote Sens. Environ. 2020, 239, 111606. [Google Scholar] [CrossRef]
  16. Nguyen, G.V.; Le, X.H.; Van, L.N.; Jung, S.; Yeon, M.; Lee, G. Application of random forest algorithm for merging multiple satellite precipitation products across South Korea. Remote Sens. 2021, 13, 4033. [Google Scholar] [CrossRef]
  17. Muñoz-Sabater, J.; Dutra, E.; Agustí-Panareda, A.; Albergel, C.; Arduini, G.; Balsamo, G.; Boussetta, S.; Choulga, M.; Harrigan, S.; Hersbach, H.; et al. ERA5-Land: A state-of-the-art global reanalysis dataset for land applications. Earth Syst. Sci. Data 2021, 13, 4349–4383. [Google Scholar] [CrossRef]
  18. Gomis-Cebolla, J.; Rattayova, V.; Salazar-Galan, S.; Frances, F. Evaluation of ERA5 and ERA5-Land reanalysis precipitation datasets over Spain (1951–2020). Atmos. Res. 2023, 284, 106606. [Google Scholar] [CrossRef]
  19. Hou, A.Y.; Kakar, R.K.; Neeck, S.; Azarbarzin, A.A.; Kummerow, C.D.; Kojima, M.; Oki, R.; Nakamura, K.; Iguchi, T. The global precipitation measurement mission. Bull. Am. Meteorol. Soc. 2014, 95, 701–722. [Google Scholar] [CrossRef]
  20. Huffman, G.J.; Bolvin, D.T.; Braithwaite, D.; Hsu, K.-L.; Joyce, R.J.; Kidd, C.; Nelkin, E.J.; Sorooshian, S.; Stocker, E.F.; Tan, J. Integrated multi-satellite retrievals for the global precipitation measurement (GPM) mission (IMERG). In Satellite Precipitation Measurement: Volume 1; Springer: Berlin/Heidelberg, Germany, 2020; pp. 343–353. [Google Scholar]
  21. Smith, B.; Sandwell, D. Accuracy and resolution of shuttle radar topography mission data. Geophys. Res. Lett. 2003, 30, 1467. [Google Scholar] [CrossRef]
  22. Breiman, L. Random forests. Mach. Learn. 2001, 45, 5–32. [Google Scholar] [CrossRef]
  23. Hengl, T.; Nussbaum, M.; Wright, M.N.; Heuvelink, G.B.; Gräler, B. Random forest as a generic framework for predictive modeling of spatial and spatio-temporal variables. PeerJ 2018, 6, e5518. [Google Scholar] [CrossRef] [PubMed]
  24. Chen, C.; Chen, Q.; Duan, Z.; Zhang, J.; Mo, K.; Li, Z.; Tang, G. Multiscale comparative evaluation of the GPM IMERG v5 and TRMM 3B42 v7 precipitation products from 2015 to 2017 over a climate transition area of China. Remote Sens. 2018, 10, 944. [Google Scholar] [CrossRef]
  25. Meyer, H.; Drönner, J.; Nauss, T. Satellite-based high-resolution mapping of rainfall over southern Africa. Atmos. Meas. Tech. 2017, 10, 2009–2019. [Google Scholar] [CrossRef]
  26. Yan, X.; Chen, H.; Tian, B.; Sheng, S.; Wang, J.; Kim, J.S. A downscaling–merging scheme for improving daily spatial precipitation estimates based on random forest and cokriging. Remote Sens. 2021, 13, 2040. [Google Scholar] [CrossRef]
  27. Tuo, Y.; Duan, Z.; Disse, M.; Chiogna, G. Evaluation of precipitation input for SWAT modeling in Alpine catchment: A case study in the Adige river basin (Italy). Sci. Total Environ. 2016, 573, 66–82. [Google Scholar] [CrossRef]
Figure 1. The location map of Chongqing city along with the 12 ground-based precipitation stations (8 stations as the train stations, and the remaining 4 stations as the test stations; see more details in Table 1) in China.
Remotesensing 15 04230 g001
Figure 2. Schematic diagram of the confusion matrix used for evaluating precipitation values by the categorical measures POD, FBI, FAR, and CSI. C refers to each precipitation dataset and k means the precipitation class.
Remotesensing 15 04230 g002
Figure 3. Scatterplots illustrating daily precipitation comparisons between the three original gridded precipitation products (CHIRPS, ERA5Land, and GPM) and merged precipitation products using the RF-MEP approach against the ground measurements for the four testing stations from 2001 to 2017.
Remotesensing 15 04230 g003
Figure 4. Occurrence frequency of daily precipitation with different intensities for the three existing gridded precipitation products (CHIRPS, ERA5-Land, and GPM), the merged precipitation estimates from the three methods (RF-MEP, LR, and AVG), and ground measurements at four testing stations.
Remotesensing 15 04230 g004
Figure 5. The spatial pattern distribution of average annual precipitation of ground measurements from the 12 stations (8 for train and 4 for test), the three existing gridded precipitation products (CHIRPS, ERA5-Land, and GPM), and the RF-MEP merged dataset in Chongqing during 2001–2017.
Remotesensing 15 04230 g005
Figure 6. The residual error in daily precipitation time series for the three existing gridded precipitation products (CHIRPS, ERA5-Land, and GPM) and the RF-MEP merged precipitation dataset at the Fengdu station.
Remotesensing 15 04230 g006
Table 1. Information of each of the 12 rain gauge station with their geographical location and elevation.
Training/TestingStation CodeStation NameLongitudeLatitudeElevation (m)
TestingS57348Fengjie109.5331.01299.8
TestingS57426Liangping107.8030.68454.5
TestingS57516Shapingba106.4629.58259.1
TestingS57523Fengdu107.7329.85290.5
TrainingS57432Wanzhou108.4030.76186.7
TrainingS57502Dazu105.7029.70394.7
TrainingS57512Hechuan106.2829.96230.6
TrainingS57517Jiangjin106.2529.28261.4
TrainingS57520Changshou107.0629.83377.6
TrainingS57536Qianjiang108.7829.53607.3
TrainingS57612Qijiang106.6529.00474.7
TrainingS57633Youyang108.7628.81826.5
Table 2. Compression of statistical indices for daily precipitation data of the three original gridded precipitation products (CHIRPS, ERA5Land, and GPM) and merged precipitation estimates by the three merging methods (RF-MEP, the linear regression (LR), and the simple averaging method (AVG)) against the ground measurements in the four testing stations.
StationMetricsCHIRPSERA5-LandGPMRF-MEPLRAVG
FengduMAE5.113.613.941.863.173.61
RMSE13.548.579.985.567.218.51
RSR1.641.041.210.670.871.03
R20.030.200.100.550.250.16
KGE−0.020.320.290.620.360.31
FengjiMAE4.213.533.342.853.003.10
RMSE11.138.858.927.117.157.49
RSR1.240.980.990.790.790.83
R20.140.230.240.410.370.34
KGE0.320.420.480.540.470.49
LiangpingMAE5.104.153.962.323.403.68
RMSE13.679.7410.277.018.068.81
RSR1.380.981.040.710.820.89
R20.100.240.180.510.340.28
KGE0.220.350.420.510.430.44
ShapingbaMAE4.643.294.211.673.373.55
RMSE12.28.9311.155.988.518.99
RSR1.220.891.110.600.850.90
R20.070.250.130.660.280.23
KGE0.260.410.350.620.280.38
Table 3. The statistical metrics for evaluation of three existing gridded precipitation products (CHIRPS, ERA5Land, and GPM) and the merged precipitation dataset from the three methods (RF-MEP, LR, and AVG) for different precipitation intensities at the Fengdu station.
Precipitation Class (mm/day)PODFBIFARCSI
CHIRPS [0, 1)0.851.110.230.68
CHIRPS [1, 2)0.030.180.850.02
CHIRPS [2, 5)0.030.360.910.02
CHIRPS [5, 10)0.090.810.890.05
CHIRPS [10, 20)0.120.970.880.06
CHIRPS [20, 50)0.21.330.850.09
CHIRPS [50, Inf)0.093.110.970.02
ERA5-Land [0, 1)0.680.730.070.65
ERA5-Land [1, 2)0.172.020.920.06
ERA5-Land [2, 5)0.271.860.850.11
ERA5-Land [5, 10)0.241.780.870.09
ERA5-Land [10, 20)0.31.720.830.12
ERA5-Land [20, 50)0.271.080.750.15
ERA5-Land [50, Inf)0.030.830.970.02
GPM [0, 1)0.770.920.160.67
GPM [1, 2)0.121.420.920.05
GPM [2, 5)0.141.100.870.07
GPM [5, 10)0.131.210.890.06
GPM [10, 20)0.161.310.870.08
GPM [20, 50)0.221.080.800.12
GPM [50, Inf)0.091.060.920.04
RF_MEP [0, 1)0.860.900.040.83
RF-MEP [1, 2)0.271.590.830.12
RF-MEP [2, 5)0.391.400.720.19
RF-MEP [5, 10)0.391.370.710.20
RF-MEP [10, 20)0.381.110.660.22
RF-MEP [20, 50)0.440.780.440.33
RF-MEP [50, Inf)0.090.260.670.07
LR [0, 1)0.610.660.070.58
LR [1, 2)0.213.320.940.05
LR [2, 5)0.322.240.860.11
LR [5, 10)0.231.830.880.09
LR [10, 20)0.251.20.790.13
LR [20, 50)0.210.570.630.15
LR [50, Inf)0.010.140.990.01
AVG [0, 1)0.650.690.050.63
AVG [1, 2)0.192.440.920.06
AVG [2, 5)0.372.140.830.13
AVG [5, 10)0.261.850.860.10
AVG [10, 20)0.251.390.820.12
AVG [20, 50)0.231.070.780.13
AVG [50, Inf)0.010.510.990.01
Disclaimer/Publisher’s Note: The statements, opinions and data contained in all publications are solely those of the individual author(s) and contributor(s) and not of MDPI and/or the editor(s). MDPI and/or the editor(s) disclaim responsibility for any injury to people or property resulting from any ideas, methods, instructions or products referred to in the content.

